Embed Size (px)
Citation preview
85SECOND AUSTRALASIAN GROUND CONTROL IN MINING CONFERENCE / SYDNEY, NSW, 23 - 24 NOVEMBER 2010
INTRODUCTION
Large volumes of geotechnical data are often collected during the life of a mining project but this data is rarely ever effectively and comprehensively collected to represent the rock mass conditions across the project. The purpose of geotechnical core logging is to get an appreciation of the rock conditions and apply these understandings to mine design.
There are many different forms of geotechnical core logging data collection that range from established methods through to project/outcome specifi c templates developed ‘in-house’. The format and legend for logging that is presented in this paper has evolved with development of the mining rock mass model (Seymour, Dempers and Jenkins, 2007; Jenkins, Dempers and Seymour, 2009). It differs from other logging schemes in that it is designed to help highlight rock mass variability and in particular those regions or conditions in the rock mass that are likely to be problematic for design purposes.
The core logging method developed requires the core to be grouped into logging intervals that are unique geotechnical domains or designs regions within a particular rock type. Most of the logged parameters and defi nitions have been used in other logging and rating schemes. However, it is the dedicated use of the logging technique and it’s refi nement
through creating mining rock mass models for a wide variety of different projects that make this a rigorous, robust and unique method. It has been used with equal success in many different environments and for both open pit and underground projects. The geotechnical domains are determined by grouping together rock which displays similar geotechnical characteristics and which will behave uniformly in an excavation. This domain logging allows the variability of rock mass conditions within and across individual lithological/geological/structural units to be identifi ed more readily than fi xed interval methods with logging per metre or per drill run.
As such, a domain can be many metres in length or less than one metre and is determined from signifi cant lithological boundaries which are then further subdivided according to geological structure, weathering, hydrogeology, veining and alteration within those major lithological boundaries.
After the rock has been grouped into geotechnical domains, each relevant parameter required for geotechnical evaluation is then logged within a particular geotechnical domain. Selected parameters include rock strength, discontinuity condition, rock quality designation (RQD), discontinuity count per fracture angle and discontinuity orientation. The
1. MAusIMM, Principal, Dempers and Seymour Pty Ltd, Geotechnical and Mining Consultants, PO Box 2323, Warwick WA 6024. Email: [email protected]
2. MAusIMM, Principal, Dempers and Seymour Pty Ltd, Geotechnical and Mining Consultants, PO Box 2323, Warwick WA 6024. Email: [email protected]
3. Geotechnical Engineer, Dempers and Seymour Pty Ltd, Geotechnical and Mining Consultants, PO Box 2323, Warwick WA 6024. Email: [email protected]
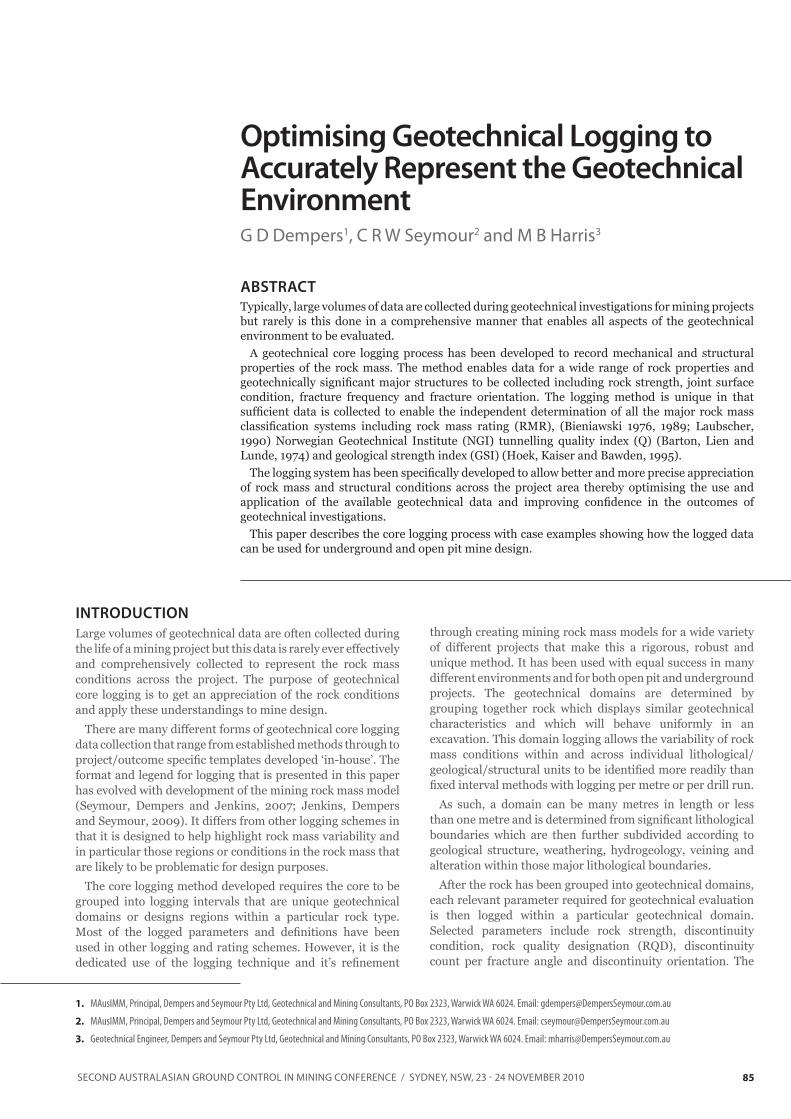
Optimising Geotechnical Logging to Accurately Represent the Geotechnical EnvironmentG D Dempers1, C R W Seymour2 and M B Harris3
ABSTRACT
Typically, large volumes of data are collected during geotechnical investigations for mining projects but rarely is this done in a comprehensive manner that enables all aspects of the geotechnical environment to be evaluated.
A geotechnical core logging process has been developed to record mechanical and structural properties of the rock mass. The method enables data for a wide range of rock properties and geotechnically signifi cant major structures to be collected including rock strength, joint surface condition, fracture frequency and fracture orientation. The logging method is unique in that suffi cient data is collected to enable the independent determination of all the major rock mass classifi cation systems including rock mass rating (RMR), (Bieniawski 1976, 1989; Laubscher, 1990) Norwegian Geotechnical Institute (NGI) tunnelling quality index (Q) (Barton, Lien and Lunde, 1974) and geological strength index (GSI) (Hoek, Kaiser and Bawden, 1995).
The logging system has been specifi cally developed to allow better and more precise appreciation of rock mass and structural conditions across the project area thereby optimising the use and application of the available geotechnical data and improving confi dence in the outcomes of geotechnical investigations.
This paper describes the core logging process with case examples showing how the logged data can be used for underground and open pit mine design.
OP
TIM
ISIN
G G
EO
TE
CH
NIC
AL
LO
GG
ING
TO
AC
CU
RA
TE
LY R
EP
RE
SE
NT
TH
E G
EO
TE
CH
NIC
AL
EN
VIR
ON
ME
NT
87
SECON
D A
USTRA
LASIA
N G
ROU
ND
CON
TROL IN
MIN
ING
CON
FERENCE / SYD
NEY, N
SW, 23 - 24 N
OVEM
BER 2010
Hole-id From To Rock Type Weath (1-5)
QSI (1-5) RQD (m)
MatrixStruct Type
No.Sets Fract 0-30
Micro(1-9)0-30
Macro(1-5)0-30
Infill(1-9)0-30
Infill type
Infill Thick
JWA(1-3)
Fract 0-90
Micro(1-9)0-90
Macro(1-5)0-90
Infill(1-9)0-90
Infill type
Infill Thick
JWA(1-3) Comments
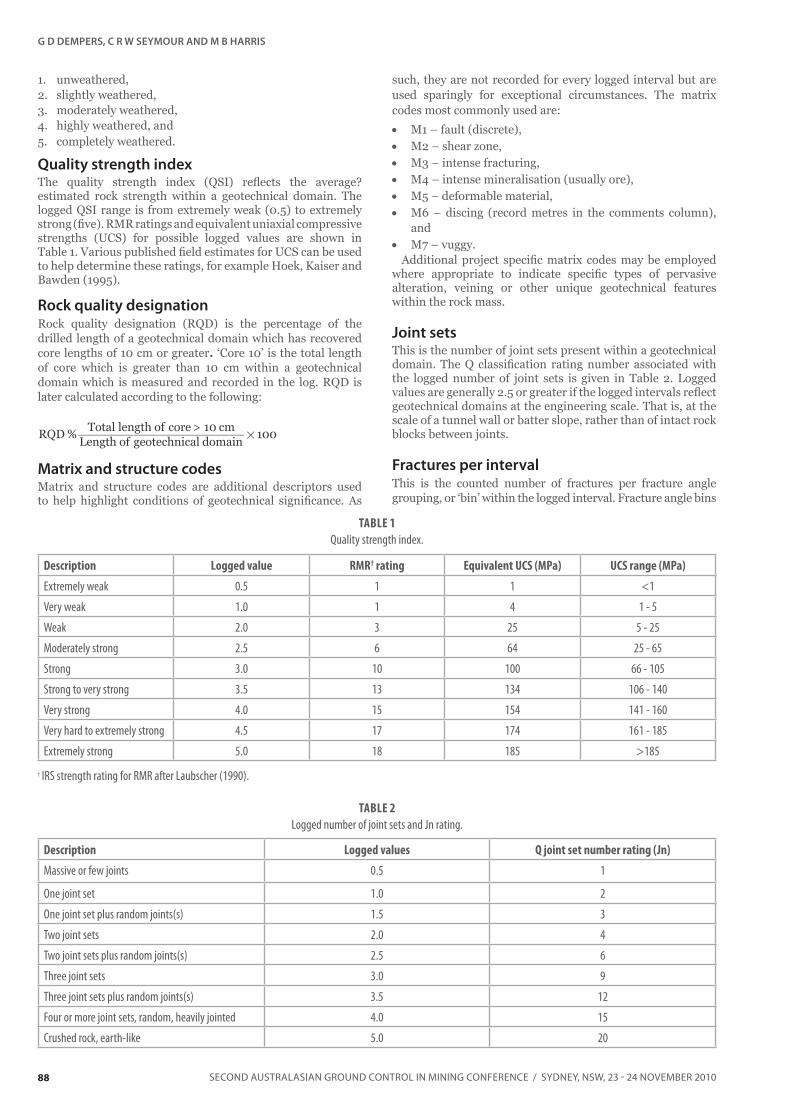
MWRD142 50.0 65.0 tuff 3.5 2.5 2.10 3.5 250 3 2 5 iox/cly 1 NQ core ~3.0m loss mech broken/crushed i/p fol/lay i/pMWRD142 65.0 65.7 tuff 3 3 0.50 2.5 7 7 2 5 iox/cly 1 fol/layMWRD142 65.7 66.5 tuff 2.5 3 0.60 2.5 6 5 2 5 iox/cly 1 fol/layMWRD142 66.5 69.6 tuff 2.5 2.5 1.30 3 45 3 2 5 iox/cly 1MWRD142 69.6 71.8 tuff 3.5 1.5 0.01 m3 4.5 100 5 2 5 iox/cly 1 fol/lay ~ 0.4m loss mech broken/crushed i/pMWRD142 71.8 73.2 tuff 2.5 2.5 1.00 2.5 18 5 2 5 iox/cly 1 fol/layMWRD142 73.2 81.5 tuff 2 3 4.90 2.5 80 2 2 4 iox/cly 1 fol/layMWRD142 81.5 83.2 tuff 2.5 2 0.40 3.5 50 4 2 5 iox/cly 1 fol/lay mech broken i/pMWRD142 83.2 86.2 tuff 2.5 2.5 1.60 2.5 28 2 2 6 1 fol/layMWRD142 86.2 86.5 tuff 3 1 0.01 m2 4.5 250 4 2 5 iox/cly 1 shearedMWRD142 86.5 88.0 tuff 2.5 2.5 0.90 2.5 14 7 2 6 1 fol/layMWRD142 88.0 88.1 tuff 3.5 1 0.01 m3 4.5 100 5 2 5 iox/cly 1MWRD142 88.1 90.5 tuff 2.5 2.5 1.00 2.5 38 4 2 5 iox/cly 1 fol/lay i/pMWRD142 90.5 91.2 tuff 2.5 1.5 0.01 m3 4.5 100 5 2 5 iox/cly 1 1 ~0.1m lossMWRD142 91.2 92.7 tuff 2 3 1.30 2.5 13 5 2 5 iox 1 fol/layMWRD142 92.7 93.5 tuff 2 2.5 0.20 2.5 13 8 2 5 iox 1 highly fol/layMWRD142 93.5 95.5 tuff 2 3 2.00 2.5 6 5 2 5 iox 1 highly fol/layMWRD142 95.5 95.6 tuff 2 1 0.01 m2 4.5 50 4 2 4 cly 2 1 shearedMWRD142 95.6 97.3 tuff 2 3 1.40 2.5 11 4 2 5 iox 1 fol/layMWRD142 97.3 98.4 tuff 2 0.5 0.01 m2 5 250 1 2 3 cly 5 1 fol/lay/sheared ~0 2m lossMWRD142 98.4 98.8 tuff 2 1.5 0.01 2.5 12 1 2 4 iox/cly 1 fol/layMWRD142 98.8 99.7 tuff 2 3 0.80 2.5 8 4 2 6 1 fol/layMWRD142 99.7 101.2 ?mafic tuff 2 2 0.30 m2 3.5 75 4 2 5 iox/cly 1 fol/lay/sheared core split from 101 0 mMWRD142 101.2 101.8 ?mafic tuff/?dol 2 1 0.01 m2 4.5 100 1 2 5 iox/cly 1 sheared ~0.3m loss ? Dol contact zone Jw zone split MWRD142 101.8 102.6 ?dol 1.5 2 0.30 2.5 10 6 2 7 iox 1 splitMWRD142 102.6 104.8 chlor hem 1 3 2.10 2.5 5 8 2 5 iox/cly 1 splitMWRD142 104.8 106.6 chlor tuff 1 1 0.10 m2 4.5 100 1 2 5 chlor 1 split micro-fractured sheared ~0.4m lossMWRD142 106.6 112.6 hem/chlor hem 1 3 5.70 2.5 18 8 2 5 cly 1 splitMWRD142 112.6 113.7 chlor/hem tuff 1 1 0.01 m2 4.5 100 7 2 5 cly/chlor 1 split micro-fractured ~0.2m lossMWRD142 113.7 115.6 hem/chlor hem 1 3 1.80 2.5 5 8 2 8 1 split micro-fractured i/pMWRD142 115.6 117.8 chlor tuff 1 1 0.01 m2 4.5 100 1 2 6 chlor 1 split micro-fractured ~1.0m lossMWRD142 117.8 121.4 tuff 1 3 3.50 2.5 8 2 2 5 iox 1 split to 119 0m ~massive Jw zoneMWRD142 121.4 121.7 tuff 2 2.5 0.10 2.5 6 5 2 5 iox 1 1 ~massive Jw zoneMWRD142 121.7 122.0 tuff 2.5 1.5 0.01 m3 4.5 50 2 2 5 iox 2 1 Jw zoneMWRD142 122.0 123.1 tuff 2 2.5 0.20 2.5 12 5 2 5 iox 1 ~massive Jw zoneMWRD142 123.1 129.5 tuff 1 3 6.10 2.5 26 2 2 5 iox 1 1 127.1m: 1X 10mm cly/fault gouge infilled
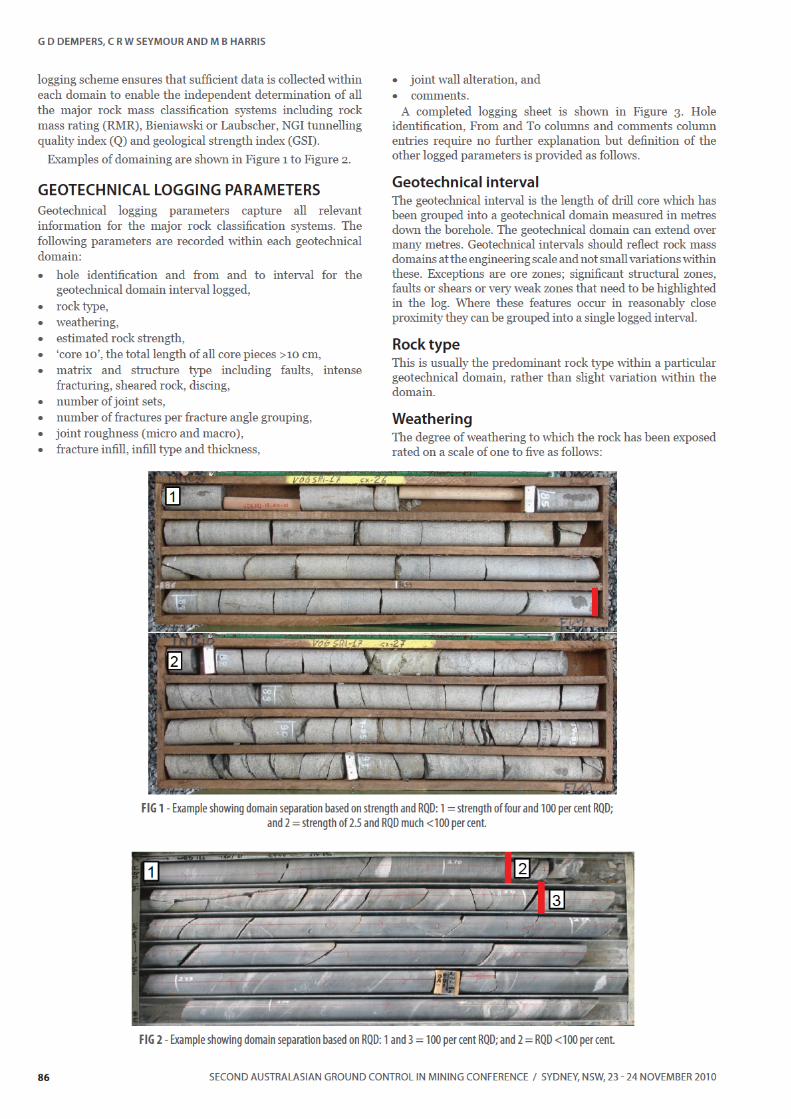
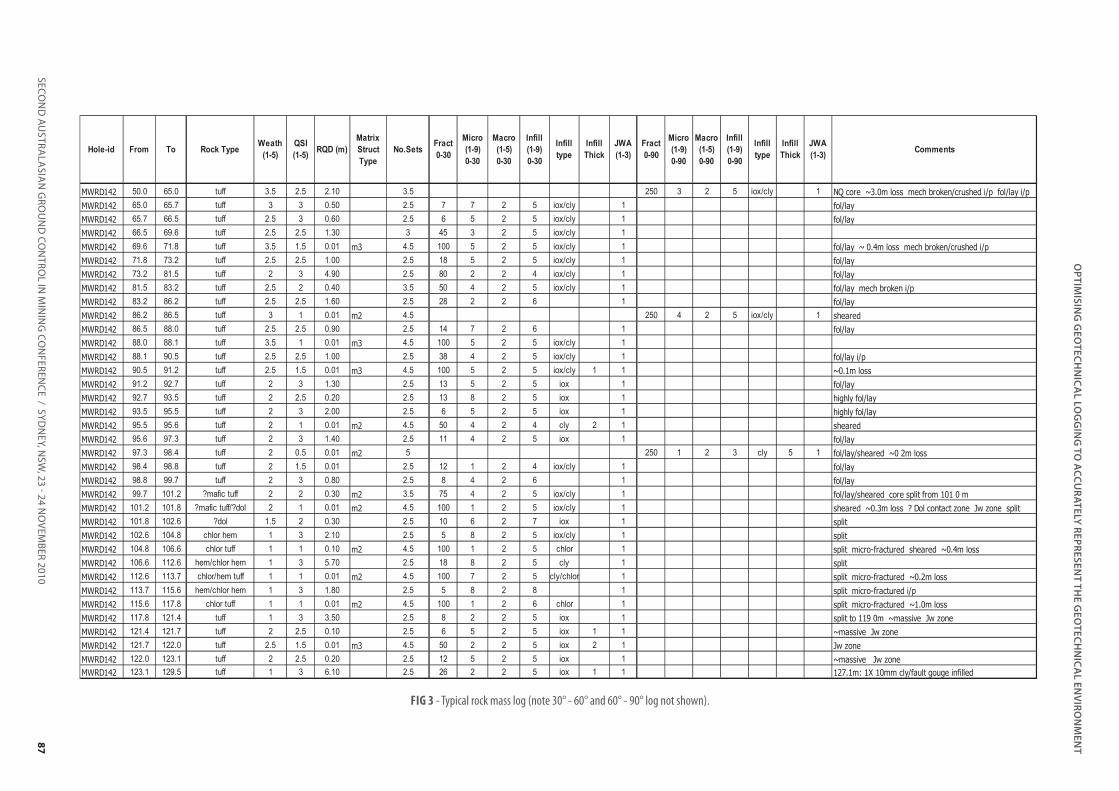
FIG 3 - Typical rock mass log (note 30° - 60° and 60° - 90° log not shown).
SECOND AUSTRALASIAN GROUND CONTROL IN MINING CONFERENCE / SYDNEY, NSW, 23 - 24 NOVEMBER 2010
G D DEMPERS, C R W SEYMOUR AND M B HARRIS
88
1. unweathered,2. slightly weathered,3. moderately weathered,4. highly weathered, and5. completely weathered.
Quality strength indexThe quality strength index (QSI) refl ects the average? estimated rock strength within a geotechnical domain. The logged QSI range is from extremely weak (0.5) to extremely strong (fi ve). RMR ratings and equivalent uniaxial compressive strengths (UCS) for possible logged values are shown in Table 1. Various published fi eld estimates for UCS can be used to help determine these ratings, for example Hoek, Kaiser and Bawden (1995).
Rock quality designationRock quality designation (RQD) is the percentage of the drilled length of a geotechnical domain which has recovered core lengths of 10 cm or greater. ‘Core 10’ is the total length of core which is greater than 10 cm within a geotechnical domain which is measured and recorded in the log. RQD is later calculated according to the following:
Matrix and structure codesMatrix and structure codes are additional descriptors used to help highlight conditions of geotechnical signifi cance. As
such, they are not recorded for every logged interval but are used sparingly for exceptional circumstances. The matrix codes most commonly used are:
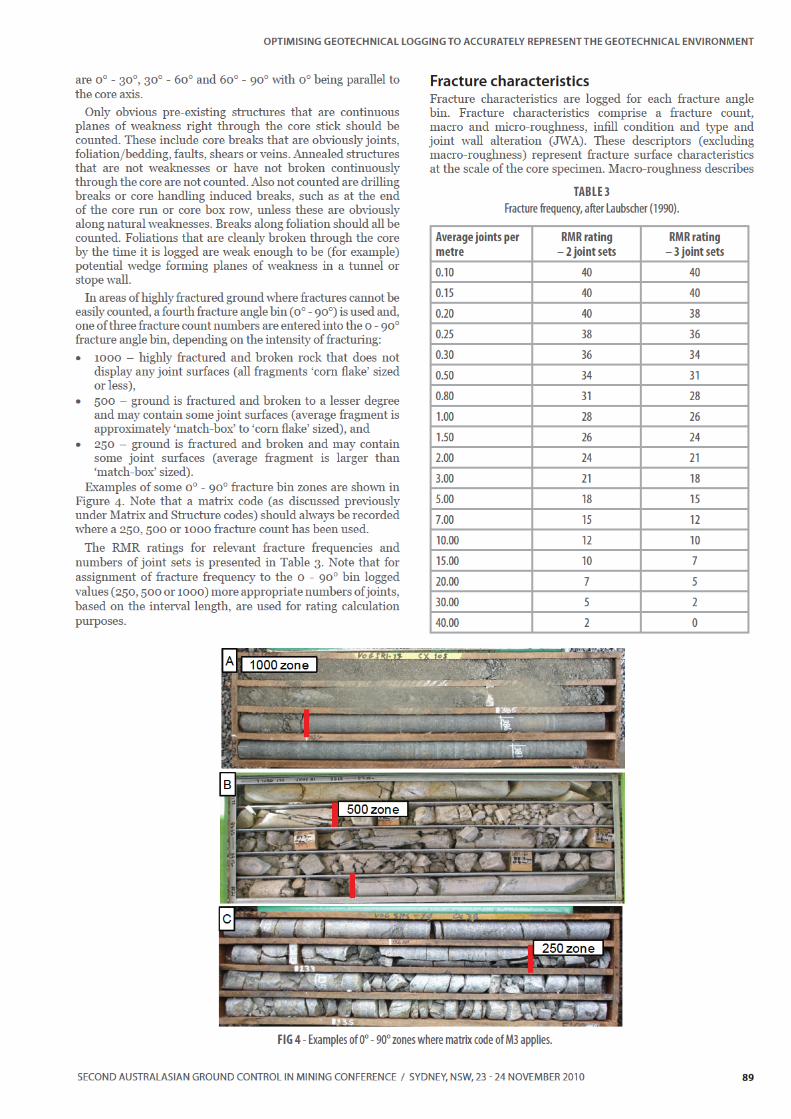
M1 – fault (discrete), M2 – shear zone, M3 – intense fracturing, M4 – intense mineralisation (usually ore), M5 – deformable material, M6 – discing (record metres in the comments column),
and M7 – vuggy.Additional project specifi c matrix codes may be employed
where appropriate to indicate specifi c types of pervasive alteration, veining or other unique geotechnical features within the rock mass.
Joint setsThis is the number of joint sets present within a geotechnical domain. The Q classifi cation rating number associated with the logged number of joint sets is given in Table 2. Logged values are generally 2.5 or greater if the logged intervals refl ect geotechnical domains at the engineering scale. That is, at the scale of a tunnel wall or batter slope, rather than of intact rock blocks between joints.
Fractures per interval This is the counted number of fractures per fracture angle grouping, or ‘bin’ within the logged interval. Fracture angle bins
Description Logged value RMR† rating Equivalent UCS (MPa) UCS range (MPa)
Extremely weak 0.5 1 1 <1
Very weak 1.0 1 4 1 - 5
Weak 2.0 3 25 5 - 25
Moderately strong 2.5 6 64 25 - 65
Strong 3.0 10 100 66 - 105
Strong to very strong 3.5 13 134 106 - 140
Very strong 4.0 15 154 141 - 160
Very hard to extremely strong 4.5 17 174 161 - 185
Extremely strong 5.0 18 185 >185
† IRS strength rating for RMR after Laubscher (1990).
TABLE 1
Quality strength index.
Description Logged values Q joint set number rating (Jn)
Massive or few joints 0.5 1
One joint set 1.0 2
One joint set plus random joints(s) 1.5 3
Two joint sets 2.0 4
Two joint sets plus random joints(s) 2.5 6
Three joint sets 3.0 9
Three joint sets plus random joints(s) 3.5 12
Four or more joint sets, random, heavily jointed 4.0 15
Crushed rock, earth-like 5.0 20
TABLE 2
Logged number of joint sets and Jn rating.
% 100RQDLength of geotechnical domain
Total length of core cm10>#
SECOND AUSTRALASIAN GROUND CONTROL IN MINING CONFERENCE / SYDNEY, NSW, 23 - 24 NOVEMBER 2010
G D DEMPERS, C R W SEYMOUR AND M B HARRIS
90
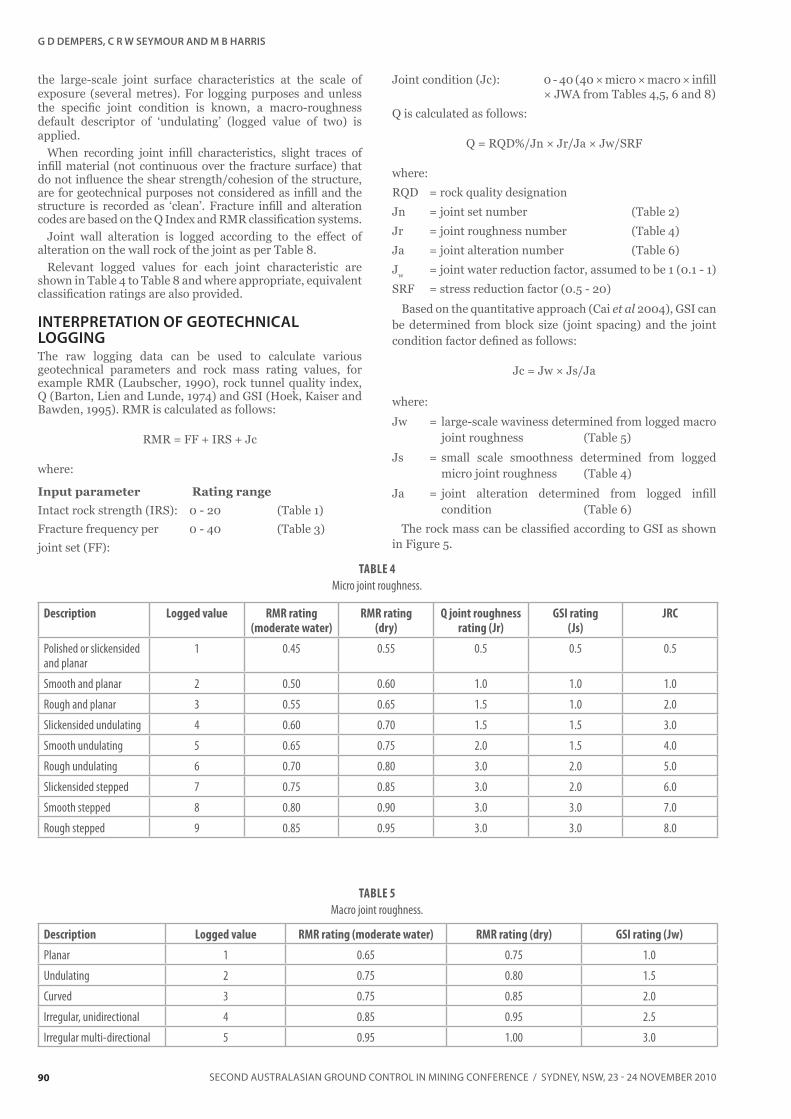
the large-scale joint surface characteristics at the scale of exposure (several metres). For logging purposes and unless the specifi c joint condition is known, a macro-roughness default descriptor of ‘undulating’ (logged value of two) is applied.
When recording joint infi ll characteristics, slight traces of infi ll material (not continuous over the fracture surface) that do not infl uence the shear strength/cohesion of the structure, are for geotechnical purposes not considered as infi ll and the structure is recorded as ‘clean’. Fracture infi ll and alteration codes are based on the Q Index and RMR classifi cation systems.
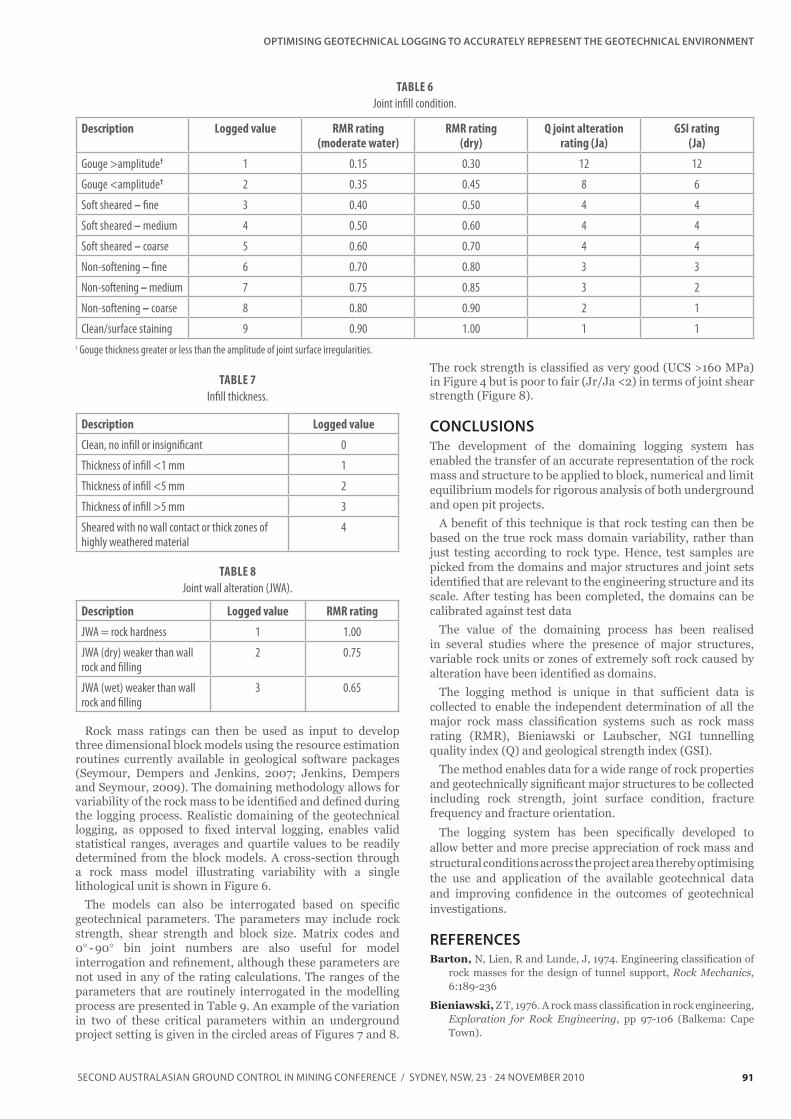
Joint wall alteration is logged according to the effect of alteration on the wall rock of the joint as per Table 8.
Relevant logged values for each joint characteristic are shown in Table 4 to Table 8 and where appropriate, equivalent classifi cation ratings are also provided.
INTERPRETATION OF GEOTECHNICAL LOGGINGThe raw logging data can be used to calculate various geotechnical parameters and rock mass rating values, for example RMR (Laubscher, 1990), rock tunnel quality index, Q (Barton, Lien and Lunde, 1974) and GSI (Hoek, Kaiser and Bawden, 1995). RMR is calculated as follows:
RMR = FF + IRS + Jc
where:
Input parameter Rating range
Intact rock strength (IRS): 0 - 20 (Table 1)
Fracture frequency per 0 - 40 (Table 3)
joint set (FF):
Joint condition (Jc): 0 - 40 (40 × micro × macro × infi ll × JWA from Tables 4,5, 6 and 8)
Q is calculated as follows:
Q = RQD%/Jn × Jr/Ja × Jw/SRF
where:
RQD = rock quality designation
Jn = joint set number (Table 2)
Jr = joint roughness number (Table 4)
Ja = joint alteration number (Table 6)
Jw = joint water reduction factor, assumed to be 1 (0.1 - 1)
SRF = stress reduction factor (0.5 - 20)
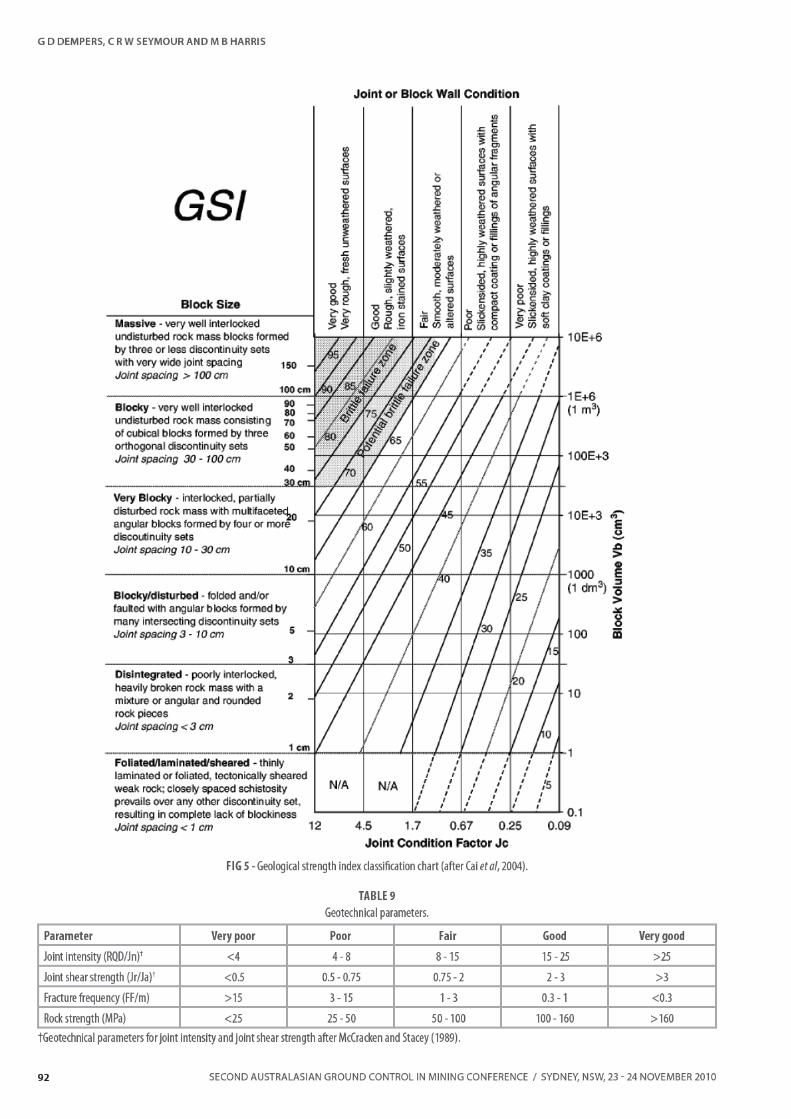
Based on the quantitative approach (Cai et al 2004), GSI can be determined from block size (joint spacing) and the joint condition factor defi ned as follows:
Jc = Jw × Js/Ja
where:
Jw = large-scale waviness determined from logged macro joint roughness (Table 5)
Js = small scale smoothness determined from logged micro joint roughness (Table 4)
Ja = joint alteration determined from logged infi ll condition (Table 6)
The rock mass can be classifi ed according to GSI as shown in Figure 5.
Description Logged value RMR rating (moderate water)
RMR rating (dry)
Q joint roughness rating (Jr)
GSI rating (Js)
JRC
Polished or slickensided and planar
1 0.45 0.55 0.5 0.5 0.5
Smooth and planar 2 0.50 0.60 1.0 1.0 1.0
Rough and planar 3 0.55 0.65 1.5 1.0 2.0
Slickensided undulating 4 0.60 0.70 1.5 1.5 3.0
Smooth undulating 5 0.65 0.75 2.0 1.5 4.0
Rough undulating 6 0.70 0.80 3.0 2.0 5.0
Slickensided stepped 7 0.75 0.85 3.0 2.0 6.0
Smooth stepped 8 0.80 0.90 3.0 3.0 7.0
Rough stepped 9 0.85 0.95 3.0 3.0 8.0
TABLE 4
Micro joint rou ghness.
Description Logged value RMR rating (moderate water) RMR rating (dry) GSI rating (Jw)
Planar 1 0.65 0.75 1.0
Undulating 2 0.75 0.80 1.5
Curved 3 0.75 0.85 2.0
Irregular, unidirectional 4 0.85 0.95 2.5
Irregular multi-directional 5 0.95 1.00 3.0
TABLE 5
Macro joint roughness.
OPTIMISING GEOTECHNICAL LOGGING TO ACCURATELY REPRESENT THE GEOTECHNICAL ENVIRONMENT
91SECOND AUSTRALASIAN GROUND CONTROL IN MINING CONFERENCE / SYDNEY, NSW, 23 - 24 NOVEMBER 2010
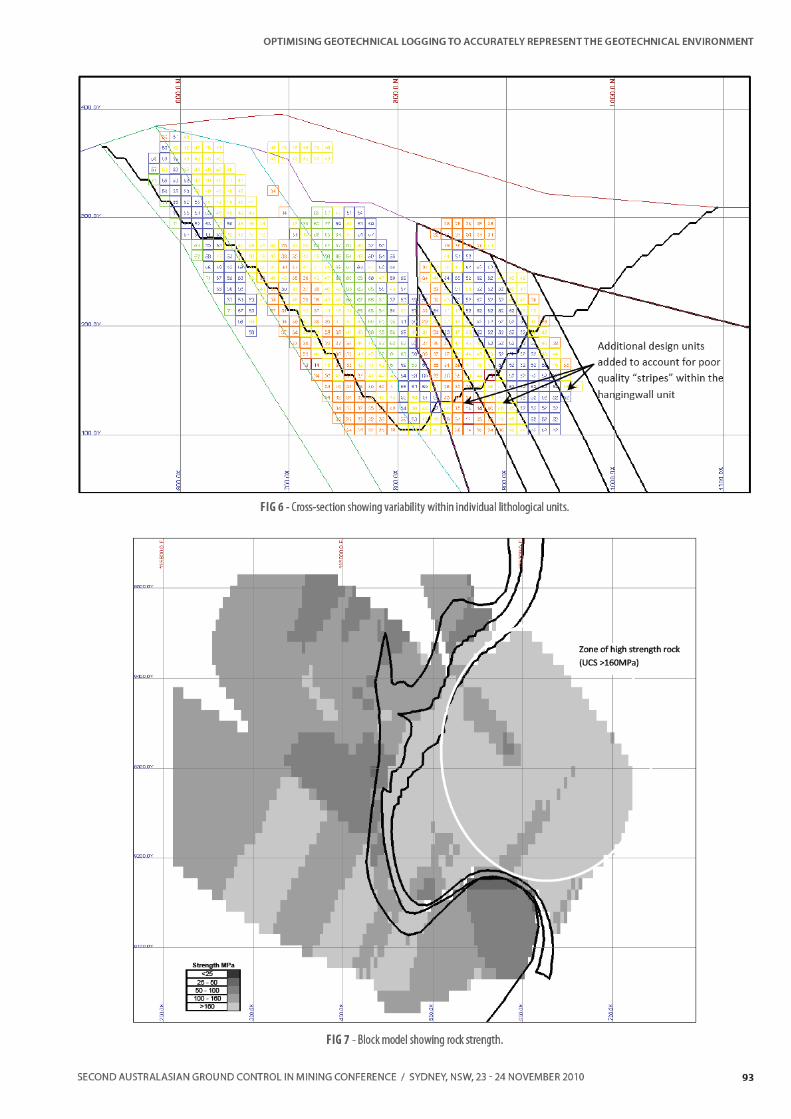
Rock mass ratings can then be used as input to develop three dimensional block models using the resource estimation routines currently available in geological software packages (Seymour, Dempers and Jenkins, 2007; Jenkins, Dempers and Seymour, 2009). The domaining methodology allows for variability of the rock mass to be identifi ed and defi ned during the logging process. Realistic domaining of the geotechnical logging, as opposed to fi xed interval logging, enables valid statistical ranges, averages and quartile values to be readily determined from the block models. A cross-section through a rock mass model illustrating variability with a single lithological unit is shown in Figure 6.
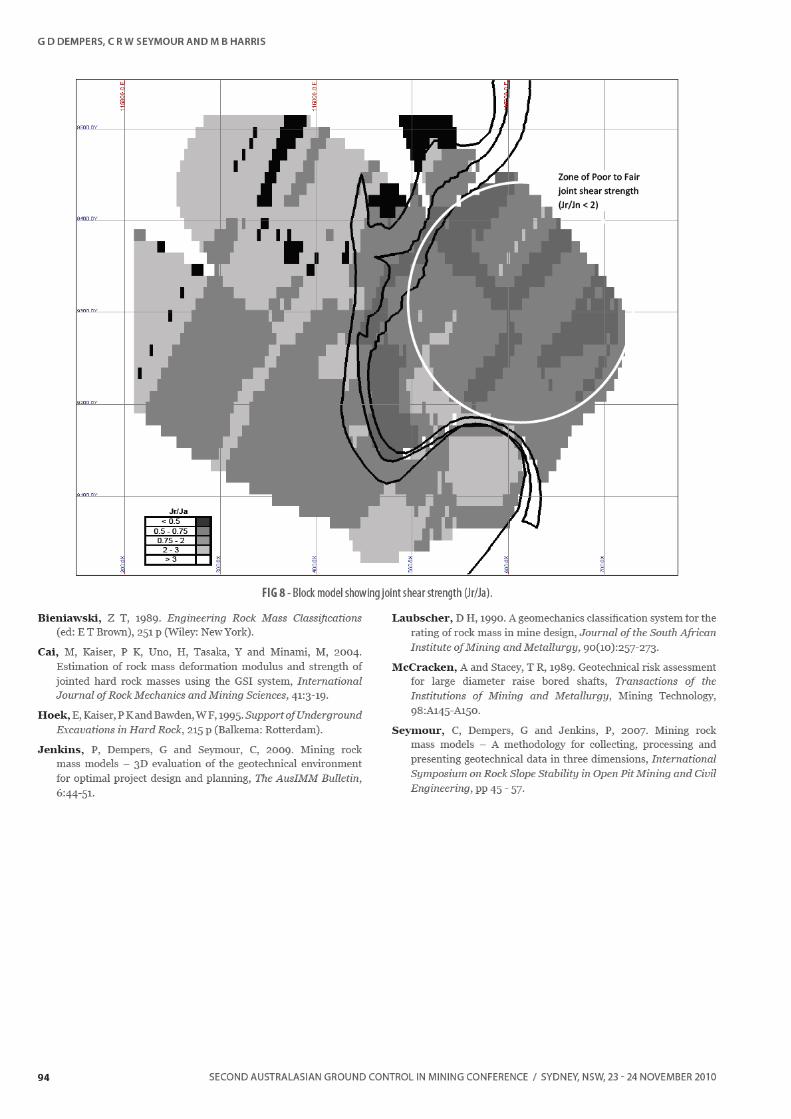
The models can also be interrogated based on specifi c geotechnical parameters. The parameters may include rock strength, shear strength and block size. Matrix codes and 0° - 90° bin joint numbers are also useful for model interrogation and refi nement, although these parameters are not used in any of the rating calculations. The ranges of the parameters that are routinely interrogated in the modelling process are presented in Table 9. An example of the variation in two of these critical parameters within an underground project setting is given in the circled areas of Figures 7 and 8.
The rock strength is classifi ed as very good (UCS >160 MPa) in Figure 4 but is poor to fair (Jr/Ja <2) in terms of joint shear strength (Figure 8).
CONCLUSIONS
The development of the domaining logging system has enabled the transfer of an accurate representation of the rock mass and structure to be applied to block, numerical and limit equilibrium models for rigorous analysis of both underground and open pit projects.
A benefi t of this technique is that rock testing can then be based on the true rock mass domain variability, rather than just testing according to rock type. Hence, test samples are picked from the domains and major structures and joint sets identifi ed that are relevant to the engineering structure and its scale. After testing has been completed, the domains can be calibrated against test data
The value of the domaining process has been realised in several studies where the presence of major structures, variable rock units or zones of extremely soft rock caused by alteration have been identifi ed as domains.
The logging method is unique in that suffi cient data is collected to enable the independent determination of all the major rock mass classifi cation systems such as rock mass rating (RMR), Bieniawski or Laubscher, NGI tunnelling quality index (Q) and geological strength index (GSI).
The method enables data for a wide range of rock properties and geotechnically signifi cant major structures to be collected including rock strength, joint surface condition, fracture frequency and fracture orientation.
The logging system has been specifi cally developed to allow better and more precise appreciation of rock mass and structural conditions across the project area thereby optimising the use and application of the available geotechnical data and improving confi dence in the outcomes of geotechnical investigations.
REFERENCESBarton, N, Lien, R and Lunde, J, 1974. Engineering classifi cation of
rock masses for the design of tunnel support, Rock Mechanics, 6:189-236
Bieniawski, Z T, 1976. A rock mass classifi cation in rock engineering, Exploration for Rock Engineering, pp 97-106 (Balkema: Cape Town).
Description Logged value RMR rating (moderate water)
RMR rating (dry)
Q joint alteration rating (Ja)
GSI rating (Ja)
Gouge >amplitude† 1 0.15 0.30 12 12
Gouge <amplitude† 2 0.35 0.45 8 6
Soft sheared – fi ne 3 0.40 0.50 4 4
Soft sheared – medium 4 0.50 0.60 4 4
Soft sheared – coarse 5 0.60 0.70 4 4
Non-softening – fi ne 6 0.70 0.80 3 3
Non-softening – medium 7 0.75 0.85 3 2
Non-softening – coarse 8 0.80 0.90 2 1
Clean/surface staining 9 0.90 1.00 1 1
† Gouge thickness greater or less than the amplitude of joint surface irregularities.
TABLE 6
Joint infi ll con dition.
Description Logged value
Clean, no infi ll or insignifi cant 0
Thickness of infi ll <1 mm 1
Thickness of infi ll <5 mm 2
Thickness of infi ll >5 mm 3
Sheared with no wall contact or thick zones of highly weathered material
4
TABLE 7
Infi ll thickness.
Description Logged value RMR rating
JWA = rock hardness 1 1.00
JWA (dry) weaker than wall rock and fi lling
2 0.75
JWA (wet) weaker than wall rock and fi lling
3 0.65
TABLE 8
Joint wall alteration (JWA).