Embed Size (px)
Citation preview
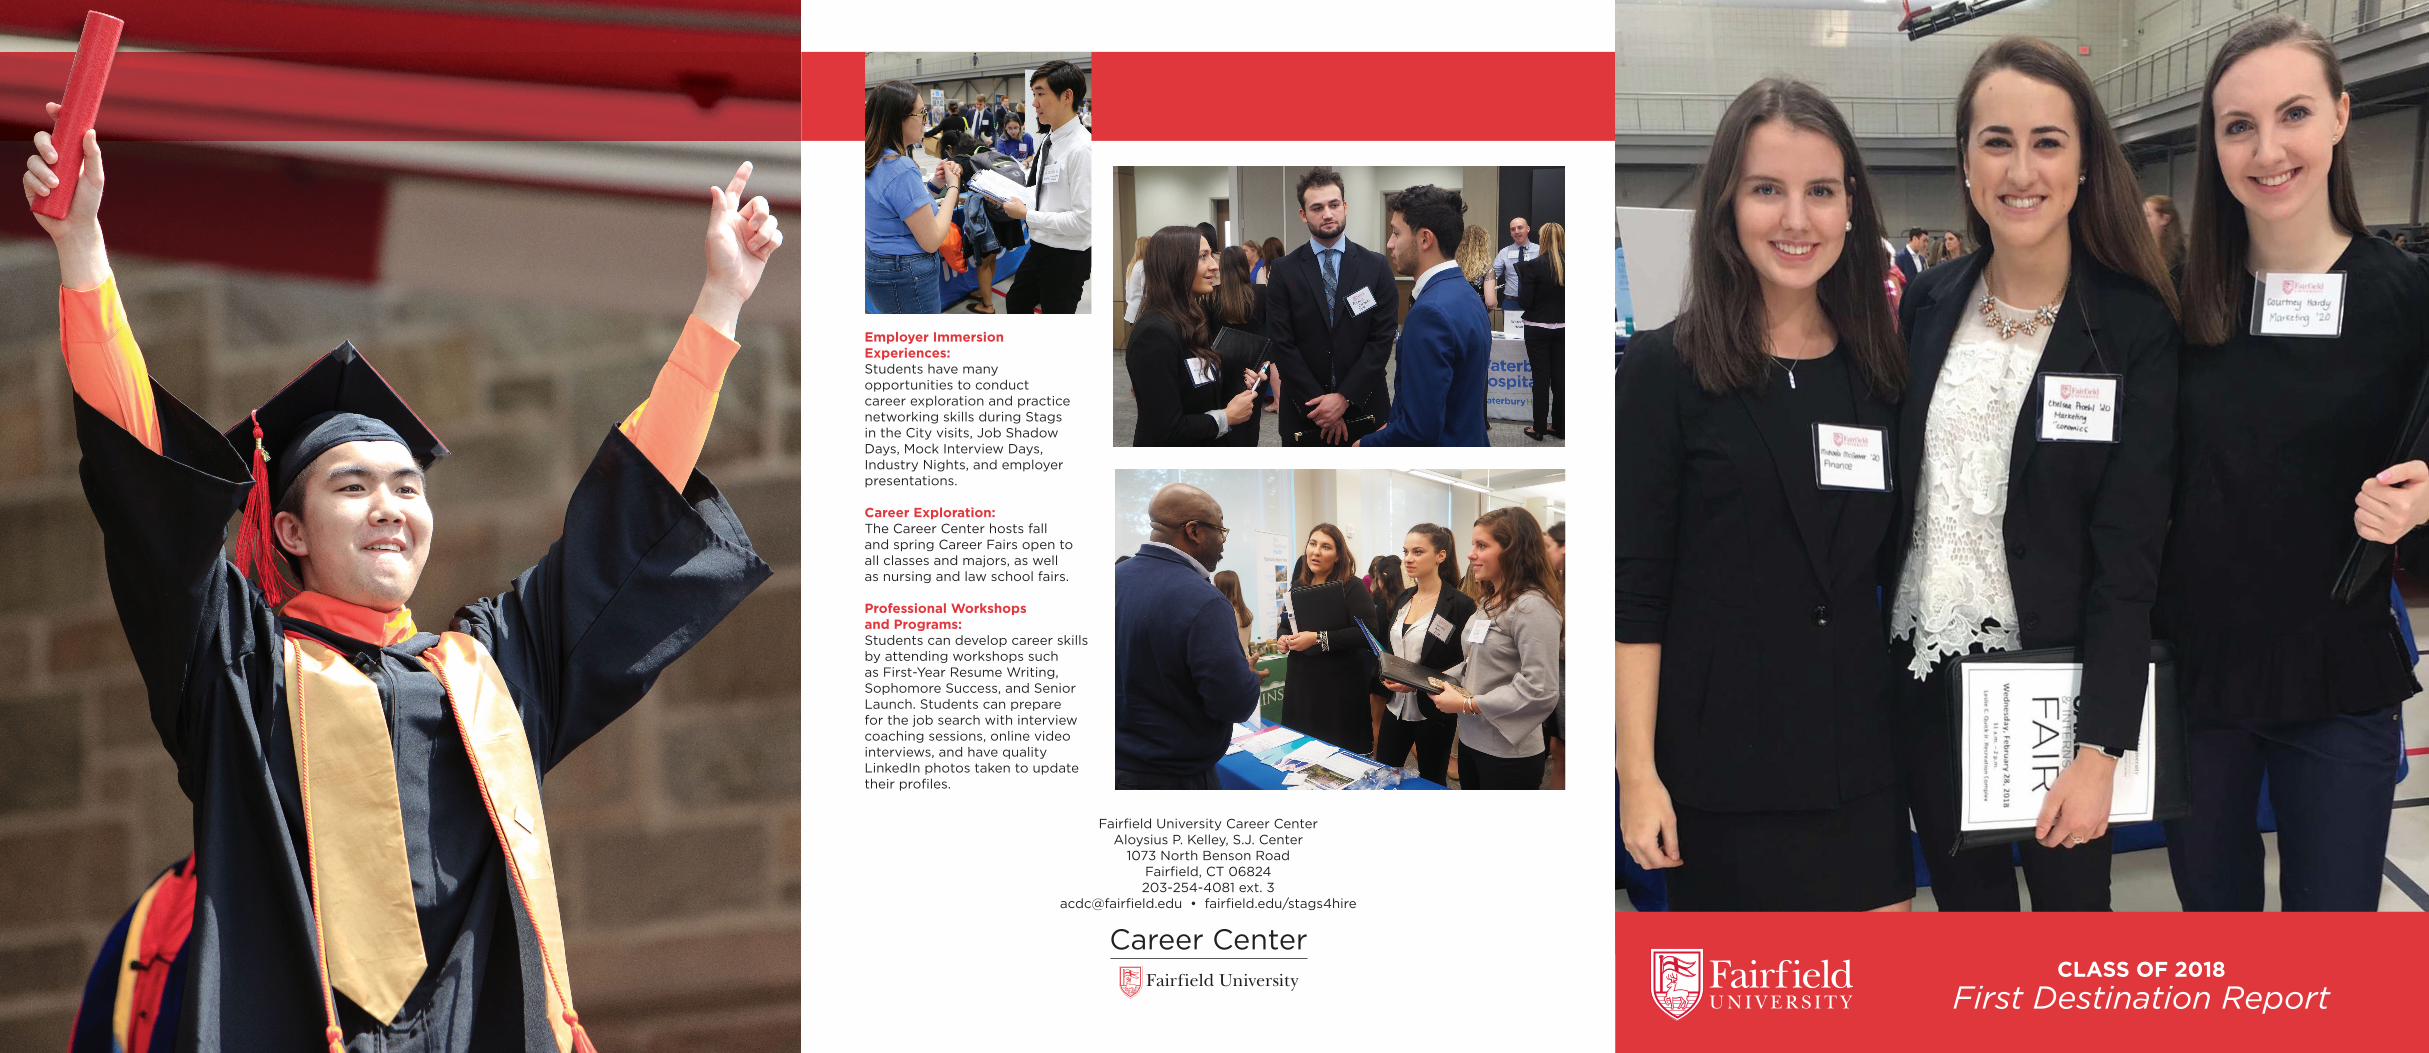
Career Center
Employer Immersion Experiences: Students have many opportunities to conduct career exploration and practice networking skills during Stags in the City visits, Job Shadow Days, Mock Interview Days, Industry Nights, and employer presentations.
Career Exploration: The Career Center hosts falland spring Career Fairs open toall classes and majors, as wellas nursing and law school fairs.
Professional Workshops and Programs: Students can develop career skills by attending workshops such as First-Year Resume Writing, Sophomore Success, and Senior Launch. Students can prepare for the job search with interview coaching sessions, online video interviews, and have quality LinkedIn photos taken to update their profi les.
CLASS OF 2018First Destination Report
Fairfi eld University Career CenterAloysius P. Kelley, S.J. Center
1073 North Benson RoadFairfi eld, CT 06824203-254-4081 ext. 3
acdc@fairfi eld.edu • fairfi eld.edu/stags4hire
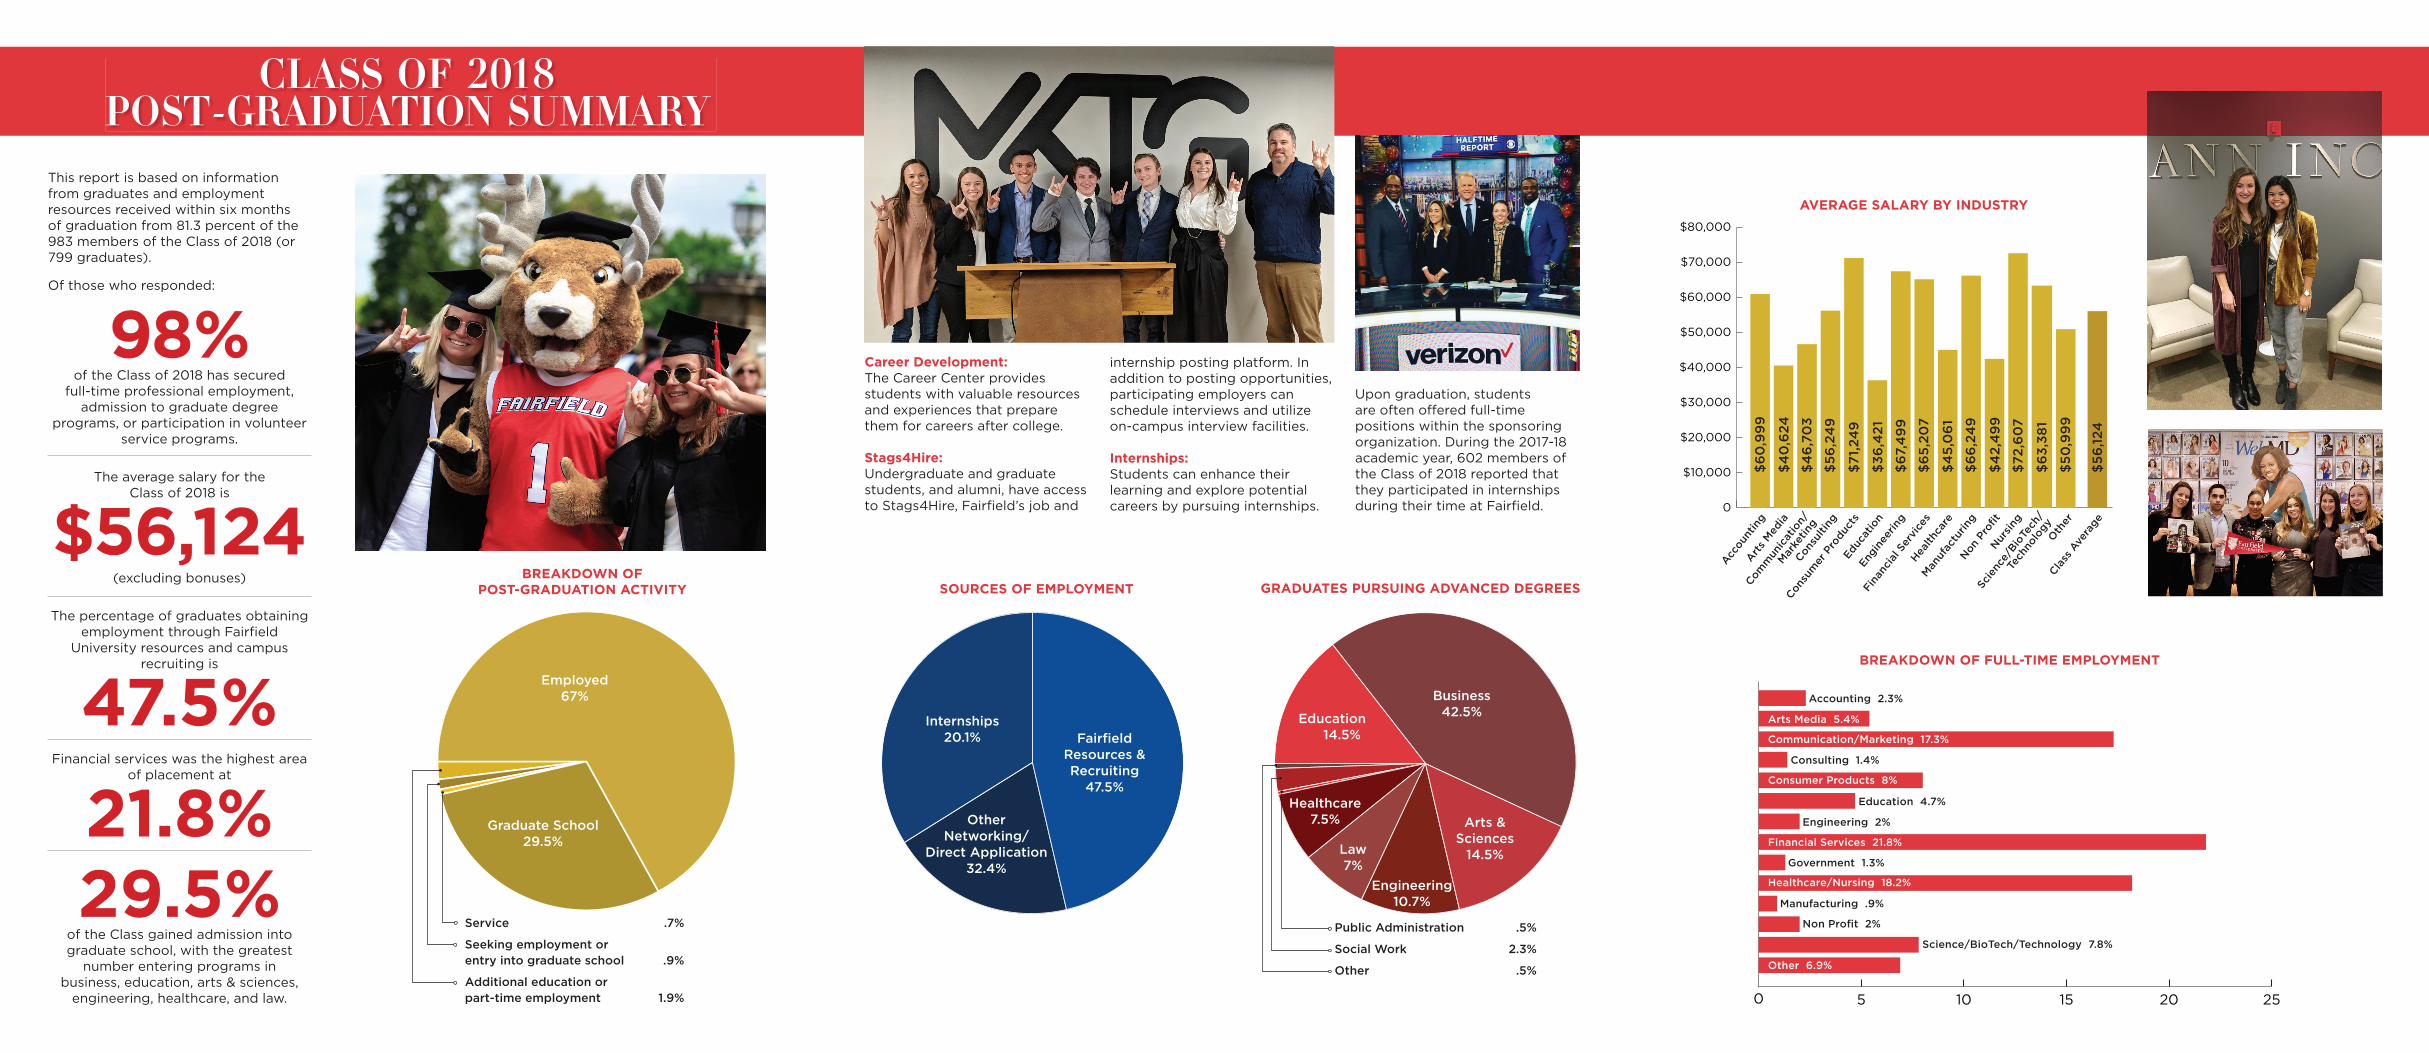
This report is based on information from graduates and employment resources received within six months of graduation from 81.3 percent of the 983 members of the Class of 2018 (or 799 graduates).
Of those who responded:
98%
of the Class of 2018 has secured full-time professional employment,
admission to graduate degree programs, or participation in volunteer
service programs.
The average salary for the Class of 2018 is
$56,124(excluding bonuses)
The percentage of graduates obtaining employment through Fairfi eld
University resources and campus recruiting is
47.5%Financial services was the highest area
of placement at
21.8%29.5%
of the Class gained admission into graduate school, with the greatest
number entering programs in business, education, arts & sciences,
engineering, healthcare, and law.
GRADUATES PURSUING ADVANCED DEGREES
Public Administration .5%
Social Work 2.3%
Other .5%
Arts & Sciences
14.5%
Business42.5%Education
14.5%
Law7%
Healthcare7.5%
Engineering10.7%
SOURCES OF EMPLOYMENT
OtherNetworking/
Direct Application32.4%
Fairfi eld Resources & Recruiting
47.5%
Internships20.1%
Career Development: The Career Center provides students with valuable resources and experiences that prepare them for careers after college.
Stags4Hire:Undergraduate and graduate students, and alumni, have access to Stags4Hire, Fairfi eld’s job and
internship posting platform. In addition to posting opportunities, participating employers can schedule interviews and utilize on-campus interview facilities.
Internships:Students can enhance their learning and explore potential careers by pursuing internships.
Upon graduation, students are often o� ered full-time positions within the sponsoring organization. During the 2017-18 academic year, 602 members of the Class of 2018 reported that they participated in internships during their time at Fairfi eld.
BREAKDOWN OF POST-GRADUATION ACTIVITY
Employed67%
Service .7%
Seeking employment or entry into graduate school .9%
Additional education or part-time employment 1.9%
Graduate School29.5%
CLASS OF 2018POST -GRADUATION SUMMARY
0
$10,000
$20,000
$30,000
$40,000
$50,000
$60,000
$70,000
$80,000
Accou
ntin
gArt
s Med
ia
Comm
unic
atio
n/
Mar
ketin
gCon
sulti
ng
Consu
mer
Pro
duct
sEd
ucat
ion
Engi
neer
ing
Fina
ncia
l Ser
vice
sHea
lthca
re
Man
ufac
turin
gNon
Pro
fi tNur
sing
Scie
nce/
BioTe
ch/
Tech
nolo
gyO
ther
Class
Ave
rage
AVERAGE SALARY BY INDUSTRY
$6
0,9
99
$4
0,6
24
$4
6,7
03
$56
,24
9
$71,
249
$36
,421
$67
,49
9
$6
5,20
7
$4
5,0
61
$6
6,2
49
$4
2,4
99
$72,
60
7
$6
3,38
1
$50
,99
9
$56
,124
0 5 10 15 20 25
Accounting 2.3%
Arts Media 5.4%
Communication/Marketing 17.3%
Consumer Products 8%
Consulting 1.4%
Education 4.7%
Engineering 2%
Financial Services 21.8%
Government 1.3%
Manufacturing .9%
Non Profi t 2%
Healthcare/Nursing 18.2%
Science/BioTech/Technology 7.8%
Other 6.9%
BREAKDOWN OF FULL-TIME EMPLOYMENT