Embed Size (px)
Citation preview
Vietnam National Transport Strategy Study (VITRANSS) Final Report
Main Text, Volume 1
4-1
4 TRANSPORT SUBSECTOR STRUCTURE AND PERFORMANCE 4.1 Institutional Framework and Overview
Main Organizational Features The overall administrative responsibility of the transport sector is shared between the MOT, Government Office, MPI, other ministries, and the provinces/districts. The structure of government in relation to transport activities is shown in Figure 4.1.1. The National Assembly meets twice a year and has a Standing Committee that presides between these two sessions. The Assembly approves the national plan and the state budget as well as major economic directions after all these have been reviewed by the Government Office. The Prime Minister (PM) is the real manager of the nation's economic and administrative system. The PM issues decisions or directives and decrees on behalf of the government. The power of the PM over ministries, policies, plans, and budgets makes him/her the key person in terms of depth and rate of change. The MPI reports to the PM and submits to him major policy decisions, transport plans and large projects for approval (once these have been proposed by the other ministries). The MPI has three small transport-related units: 1) An Infrastructure Department which reviews MOT proposals, 2) A group in the Department of Synthesis, which reviews the transport sector in
terms of broad intersectoral priorities, and 3) An Infrastructure and Urban Division in the Development Strategy Institute
(DSI) , which provides advice for a 10 to 20-year planning period. Other ministries with significant interests in transport are the: 1) Ministry of Police with the Traffic Police Bureau for road safety and issuance
of vehicle registration numbers and number plates, 2) Ministry of Finance and the General Department for Management of the State
Capital and Assets in State Enterprises, the specialized organization established in January 1995 within the MOF, tasked with supervising and managing SOEs,
3) Ministry of Construction which issues construction standards, and 4) Ministries of Industry, Agriculture and Rural Development, and Defense which
own and operate dedicated ports, and own-account trucking and coastal/river fleets.
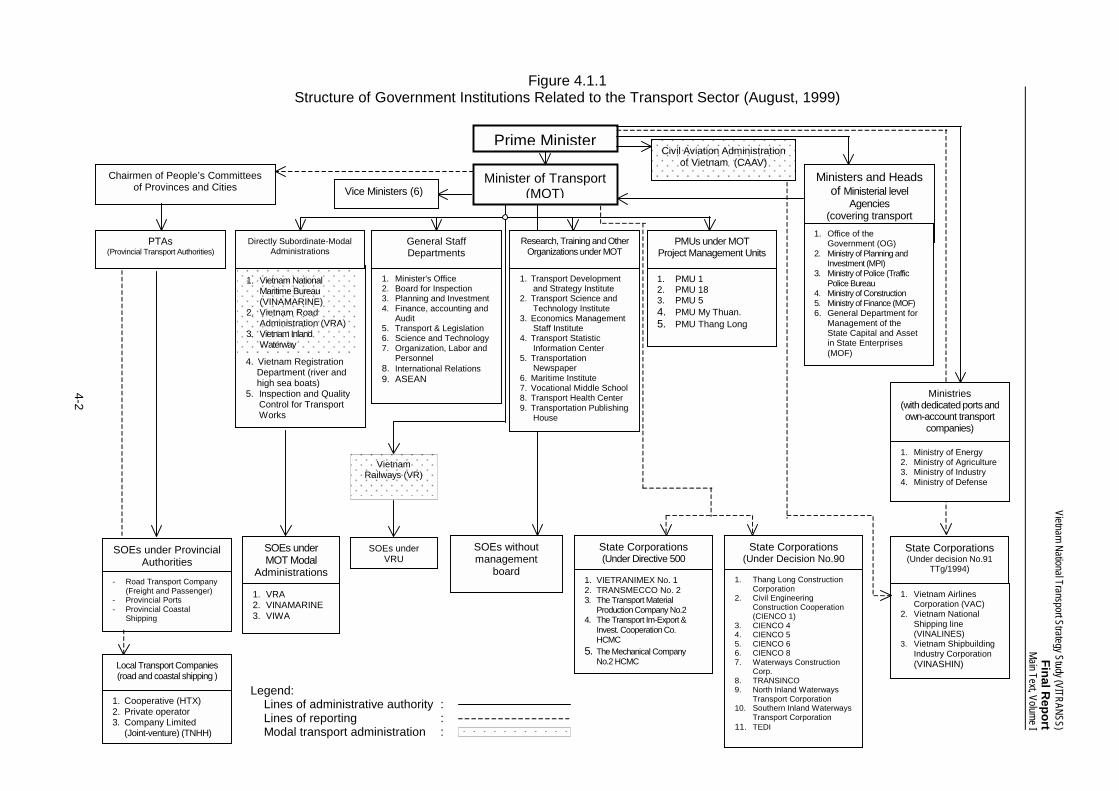
Figure 4.1.1 Structure of Government Institutions Related to the Transport Sector (August, 1999)
Legend: Lines of administrative authority : Lines of reporting : Modal transport administration :
4. Vietnam Registration
Department (river and high sea boats)
5. Inspection and Quality Control for Transport Works
Prime Minister
Chairmen of People’s Committees of Provinces and Cities
PTAs (Provincial Transport Authorities)
Directly Subordinate-Modal Administrations
General Staff Departments
Research, Training and Other Organizations under MOT
PMUs under MOT Project Management Units
1. Vietnam National Maritime Bureau (VINAMARINE)
2. Vietnam Road Administration (VRA)
3. Vietnam Inland Waterway
1. Transport Development and Strategy Institute 2. Transport Science and Technology Institute 3. Economics Management Staff Institute 4. Transport Statistic Information Center 5. Transportation
Newspaper 6. Maritime Institute 7. Vocational Middle School 8. Transport Health Center 9. Transportation Publishing House
1. Minister's Office 2. Board for Inspection 3. Planning and Investment 4. Finance, accounting and
Audit 5. Transport & Legislation 6. Science and Technology 7. Organization, Labor and
Personnel 8. International Relations 9. ASEAN
1. PMU 1 2. PMU 18 3. PMU 5 4. PMU My Thuan. 5. PMU Thang Long
Local Transport Companies (road and coastal shipping )
SOEs under MOT Modal
Administrations
State Corporations (Under Decision No.90
State Corporations (Under Directive 500
State Corporations (Under decision No.91
TTg/1994)
SOEs under Provincial Authorities
Minister of Transport (MOT)
Ministers and Heads of Ministerial level
Agencies (covering transport
issues)
Vietnam Railways (VR)
1. Thang Long Construction Corporation
2. Civil Engineering Construction Cooperation (CIENCO 1)
3. CIENCO 4 4. CIENCO 5 5. CIENCO 6 6. CIENCO 8 7. Waterways Construction
Corp. 8. TRANSINCO 9. North Inland Waterways
Transport Corporation 10. Southern Inland Waterways
Transport Corporation 11. TEDI
1. VIETRANIMEX No. 1 2. TRANSMECCO No. 2 3. The Transport Material
Production Company No.2 4. The Transport Im-Export &
Invest. Cooperation Co. HCMC
5. The Mechanical Company No.2 HCMC
1. Vietnam Airlines Corporation (VAC)
2. Vietnam National Shipping line (VINALINES)
3. Vietnam Shipbuilding Industry Corporation (VINASHIN)
Civil Aviation Administration of Vietnam (CAAV)
1. Office of the Government (OG)
2. Ministry of Planning and Investment (MPI)
3. Ministry of Police (Traffic Police Bureau
4. Ministry of Construction 5. Ministry of Finance (MOF) 6. General Department for
Management of the State Capital and Asset in State Enterprises (MOF)
1. VRA 2. VINAMARINE 3. VIWA
Vice Ministers (6)
SOEs under VRU
1. Cooperative (HTX) 2. Private operator 3. Company Limited
(Joint-venture) (TNHH)
- Road Transport Company (Freight and Passenger)
- Provincial Ports - Provincial Coastal
Shipping
Ministries (with dedicated ports andown-account transport
companies)
1. Ministry of Energy 2. Ministry of Agriculture 3. Ministry of Industry 4. Ministry of Defense
SOEs without management
board
4-2
Vietnam National Transport Strategy Study (VITRANSS) Final R
eport Main Text, Volume I
Vietnam National Transport Strategy Study (VITRANSS) Final Report
Main Text, Volume I
4-3
Provincial Transport Authorities (PTAs) are established in each province under the responsibility of Provincial People’s Committees (PPCs). The PPCs, assisted by the Provincial Planning and Investment Committees, have substantial powers regarding all transport issues within the province and in particular the development and management of provincial and district roads. PTAs have a dual reporting function: (a) to MOT for technical specifications, legal transport standards and transport planning matters, and (b) to PPCs for the management and rehabilitation of provincial roads funded by provinces. They receive funding for construction and maintenance of provincial and district transport infrastructure, directly from the government rather than from the MOT, making it difficult for the latter to exercise its authority over transport infrastructure planning. PTAs have both regulatory/oversight and commercial functions. Their oversight functions include: • implementing/coordinating central government plans, • driver testing and licensing, transport licensing and mandatory road vehicle
inspections and registration on behalf of the MOT. Commercial activities vary between provinces but may include: • constructing and administering provincial and district roads and provincial ports
(both general cargo and specialized ports for petroleum, salt, cement, etc.), • maintaining designated national roads under VRA responsibility, • operating provincial coastal shipping, inland water transport and road transport
companies (freight and passengers). There is no consistent organizational setup for PTAs that applies to all provinces (or districts) and this sometimes causes confusion about responsibilities. Table 4.1.1 summarizes the distribution of government responsibilities in the transport sector among the MOT, specialized management departments (or subsector agencies) under it or the government, and the provinces. Major organizational issues include: 1) the involvement of the MOT in infrastructure management through the five project
management units (PMUs) rather than through specialized management departments
2) too many reporting lines to the MOT Minister 3) lack of oversight function by the MOT on aviation matters 4) lack of a clear role for research institutes (distinguishing between acting as MOT
representatives and acting as independent consulting firms) 5) duplicated functions within the MOT 6) lack of a proper legal status for VR 7) weak central direction of provincial transport infrastructure management 8) bureaucratic procedures that slow down decision-making on project planning and
implementation among others 9) continuing lack of clear separation between commercial and oversight functions Furthermore, in the MOT and its subordinate agencies there is a lack of suitably
Vietnam National Transport Strategy Study (VITRANSS) Final Report
Main Text, Volume I
4-4
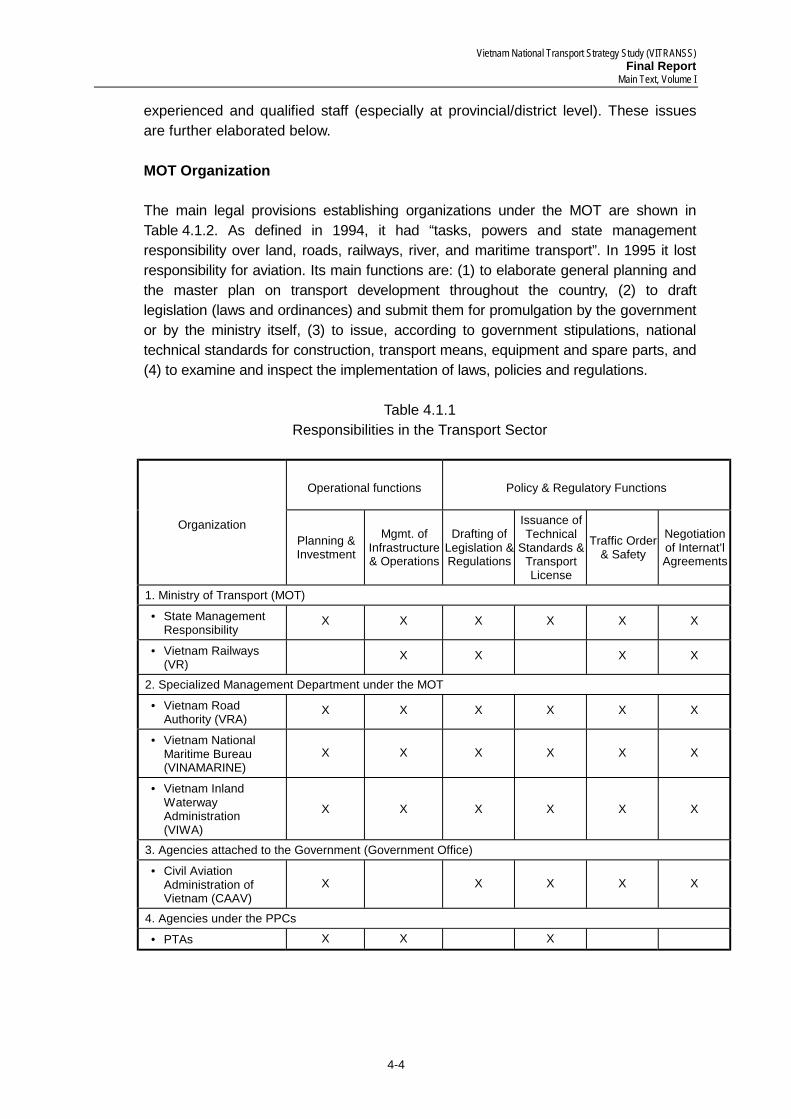
experienced and qualified staff (especially at provincial/district level). These issues are further elaborated below. MOT Organization The main legal provisions establishing organizations under the MOT are shown in Table 4.1.2. As defined in 1994, it had “tasks, powers and state management responsibility over land, roads, railways, river, and maritime transport”. In 1995 it lost responsibility for aviation. Its main functions are: (1) to elaborate general planning and the master plan on transport development throughout the country, (2) to draft legislation (laws and ordinances) and submit them for promulgation by the government or by the ministry itself, (3) to issue, according to government stipulations, national technical standards for construction, transport means, equipment and spare parts, and (4) to examine and inspect the implementation of laws, policies and regulations.
Table 4.1.1 Responsibilities in the Transport Sector
Operational functions Policy & Regulatory Functions
Organization Planning & Investment
Mgmt. of Infrastructure & Operations
Drafting of Legislation & Regulations
Issuance of Technical
Standards & Transport License
Traffic Order & Safety
Negotiation of Internat’l Agreements
1. Ministry of Transport (MOT)
• State Management Responsibility
X X X X X X
• Vietnam Railways (VR)
X X X X
2. Specialized Management Department under the MOT
• Vietnam Road Authority (VRA)
X X X X X X
• Vietnam National Maritime Bureau (VINAMARINE)
X X X X X X
• Vietnam Inland Waterway Administration (VIWA)
X X X X X X
3. Agencies attached to the Government (Government Office)
• Civil Aviation Administration of Vietnam (CAAV)
X X X X X
4. Agencies under the PPCs
• PTAs X X X
Vietnam National Transport Strategy Study (VITRANSS) Final Report
Main Text, Volume I
4-5
Table 4.1.2 Legal Basis for Organization, Function, Powers, and Responsibilities in the Transport Sector
Regulations Legal Features
No. 07-CP/1993 – January 30, 1993 Vietnam Roads Administration (VRA): government authority to manage the road subsector.
No. 08-CP/1993 – January 30, 1993 Inland Waterway Bureau (VIWB): government authority to manage transport on rivers and lakes, and through river ports.
No. 31-TTg/1993 - February 2, 1993 Vietnam National Maritime Bureau (VINAMARINE): the regulatory body in the maritime sector, maritime ports and coastal shipping.
No. 22-CP/1994 – March 22, 1994 Ministry of Transport (MOT): state management of land, roads, railways, river, maritime and civil air communication and transport.
Not available Vietnam Railways (VR) No. 32-CP/1995 – May 22, 1995(1) No. 68-CP/1995 – October 25, 1995(2)
Vietnam Civil Aviation Administration (CAAV): state management of the aviation subsector - transferred from the MOT to the direct control of the Government;
No. 79-CP/1995 – November 22, 1995 Vietnam National Shipping Lines (VINALINES): responsible for building and developing the maritime industry (sea transport, maritime brokerage, etc.)
No. 4-CP/1996 – January 27, 1996 Vietnam Airlines Corporation (VAC) with the Vietnam National Air Services (Vietnam Airlines) as the core.
No. 33-CP/1996 – May 27, 1996 Vietnam Shipbuilding Industry Corporation (VINASHIN): responsible for building new ships, repairing ships, other floating equipment and facilities, oil drilling rigs.
Notes: 1/ Government Decrees (CP), Government Decisions (TTg), Ministerial Decisions (MOT – QD/TCCB) 2/ Provisional Regulations have been issued on the reorganization of VRA and VIWA, as follows
VRA : Government Decision No 3525/QD-BGTVT/1998 dated December 23,1998 to issue provisional regulation on the organization and operations of the Vietnam Road Administration.
VIWA: Government Decision No 3619/QD-BGTVT/1998 dated December 31,1998 to issue provisional regulation on the organization and operations of the VIWA.
Until recently the MOT has been headed by six vice ministers responsible for (1) transportation and traffic safety, (2) international relations and internationally funded projects (ODA), (3) science, technology and mechanics, (4) construction (domestically funded projects), (5) transport and institutional issues, and (6) southern region of Vietnam. However, the number has been reduced during the VITRANSS study (the Vice Minister for Transport and Safety Issues was appointed as General Director of VR and his ministerial duties distributed among the remaining ministers).
Vietnam National Transport Strategy Study (VITRANSS) Final Report
Main Text, Volume I
4-6
The MOT has nine general staff departments and nine research and training departments and other organizations under it. Within the MOT there are 209 staff, including 180 specialists. The largest general staff departments are the Minister's office (77) and Planning and Investment (32). Since the 1980s the role of the MOT has been fundamentally transformed, from directly managing the transport sector to being responsible for oversight and infrastructure provision. Many responsibilities have been delegated to subsector agencies and new functions for each of its general staff departments have been defined. Sector Management Capacity In terms of functional definition, MOT’s institutional reforms have not yet been translated into specific means by which it should manage the transport sector under market conditions. Despite considerable progress in implementing modern technical standards in the transport sector, guidance documents and procedures have to be further developed to enable the MOT to monitor implementation of these standards. The information required by the MOT for policy-making and planning has not yet been defined, for example, for assessing: • different development options for infrastructure (trade-offs between developing
different modes along particular corridors), • scope for coordinating developments of different modes and improving linkages, • capacity utilization and condition of infrastructure, • competitive conditions within and between modes of transport, • effectiveness of laws and regulations, • levels of enforcement, and • degree of achievement of policy objectives and reform programs. In many cases such information cannot be obtained until key guidance documents have been implemented. For example, collecting traffic, operational and financial data is difficult because of the lack of a legal basis for collecting information from operators and from other agencies such as the Ministry of Police (who keep vehicle registration records). Even the most basic of transport statistics is lacking, infrastructure inventory for one, because management information systems have not yet been established at subsector and provincial levels. Project implementation encounters bureaucratic obstacles at various stages from project preparation to completion because of: • over-centralized decision-making processes, often involving several ministries,
with their frequent involvement in micro management activities of PMUs, • the sheer volume of administrative work involved, • lack of experience and training of some administrators, • in the case of internationally funded projects, insufficient English proficiency of
administrators, which causes misunderstandings, • lack of adequate guidance documents, • the difficulty in getting data from public agencies, which lack service orientation.
Vietnam National Transport Strategy Study (VITRANSS) Final Report
Main Text, Volume I
4-7
From the MOT’s perspective, project implementation can be streamlined through better coordination among subsector agencies – clearer guidance for implementing agencies on how they should relate to agencies under other ministries. The lack of staff with the required experience and qualifications in modern planning and regulatory techniques is a major obstacle to institutional strengthening. The need for retraining of the transport sector personnel was found to be substantial. Within the MOT itself, the changing role of the ministry requires retraining of existing staff based on a comprehensive analysis of future staffing needs. The need for sector management training extends far beyond the MOT itself and covers senior staff in subsector agencies, the Provincial/District Transport Administrations and in transport institutes. The MOT Labor and Personnel Department has no computerized personnel register and no plan for human resource development. Organization of Transport Subsectors The main management functions are performed by means of three specialized management departments or subsector agencies which control particular modes of transport: • VRA for road and road transport, • VINAMARINE for maritime port and maritime transport, including coastal
shipping, and • VIWA for river ports and river transport. The management department responsible for aviation, the CAAV, now reports to the Office of the Prime Minister. The VR is the former Railway General Office (then Vietnam Railway Union) under the MOT, and is responsible for railway infrastructure and services. It has never been given a proper legal status as a commercial enterprise. The management of large construction projects is entrusted not to subsector agencies but to five PMUs under the MOT. The MOT is currently embarking on a review of the transport sector organization and has issued MOT Directive No. 356/CT-BGTVT/1998 dated 3 November 1998 on strengthening administrative reform in the transport sector. One aim of the review is to reduce staff numbers by 15% whilst simultaneously increasing the productivity and salaries of the remaining staff. It is anticipated that one result will be a revision of Decree No. 22 which defines the organization of the MOT. Vietnam Road Administration: In theory the VRA manages the national road network while provinces and districts are in charge of provincial and district roads. Its main functions are: (a) to draft bills, policies, rules, standards, codes, and regulations for the state management of the road transport system, (b) to elaborate national road strategy, long-term, five-year, and yearly plans on the development of the road
Vietnam National Transport Strategy Study (VITRANSS) Final Report
Main Text, Volume I
4-8
network, (c) to directly manage ongoing repair, construction and maintenance work and to set up road signals to ensure safety, (d) to establish and operate the road traffic management system with oversight function over policy and technical standards on road safety, (e) to introduce regulations for classification, loading capacity, as well as the regulation of import and export of vehicles; and to issue all types of interprovincial road transport licenses for passenger and goods transportation as well as cross-border road permits; to organize the examination of, and to issue driver’s, licenses in the whole country, (f) to work out the regimes of collecting bridge and road tolls, charges on ferries and fees for the issuance of certificate and documents on road transport; to organize and direct the collection of fees on road and other revenues; to work out the bracket of transport rates, charges of loading and unloading and road transport services, (g) to negotiate and work out documents on cooperation with other countries in road communications and transport services; to manage internationally funded projects for road communications and transport services. Under VRA there are four Regional Road Management Units (RRMUs), controlling 48 road management and repair SOEs, which have responsibility for medium repair (generally the periodic maintenance) and routine maintenance works. There are also four Material and Equipment Supply Enterprises and four ferry enterprises under VRA, and Transport Consulting Engineering Companies (TCECs) which can be called upon to provide design and supervision services. VRA still retains several SOEs engaged in transport businesses – nine in road passenger and freight services and four in transport construction consultancy. In practice VRA has almost no planning role and, since it does not implement major projects, it is far from being the state administrator of road transport. Vietnam National Maritime Bureau: The VINAMARINE’s responsibilities include (a) developing plans for the maritime industry, (b) acting as owner of state maritime infrastructure, (c) administering seagoing and coastal shipping vessels and operations, ports and navigational aids, (d) issuing licenses, managing infrastructure in accordance with government instructions and providing search and rescue services, (e) monitoring and enforcing maritime safety, environmental standards, and maritime sanitation. The regulatory functions of VINAMARINE are carried out through its head office and three branch offices (Hai Phong, Danang, HCMC), 17 port authorities which monitor enforcement of maritime rules and regulations, including those covering maritime safety, environmental pollution and maritime sanitation. Other agencies under the control of VINAMARINE include the Vietnam Maritime Safety Agency (VMSA). VINAMARINE still controls operations management in three ports (Nghe Tinh, Qui Nhon and Nha Trang).
Vietnam National Transport Strategy Study (VITRANSS) Final Report
Main Text, Volume I
4-9
Vietnam Inland Waterway Administration: The VIWA is the agency responsible for the provision of infrastructure along rivers, lakes and river ports and in particular aids to navigation (ATN) and dredging along the rivers (6,787 km of which are classified as navigable). It must be noted, however, that the VMSA, under the control of VINAMARINE, manages the ATNs and dredging along the main rivers serving inland ports. VIWA still manages four inland waterway transport and river ports SOEs. It is expected that these functions will be divested eventually to allow the VIWA to concentrate on its regulatory functions. Civil Aviation Administration of Vietnam: The CAAV is an agency attached to the government, having the function of state management over the civil aviation in the whole country. Its main function are: (a) drafting laws, ordinances, strategies, programs, plans, and policies on the development of civil aviation services, (b) proposing the establishment and operations of air routes, (c) the accession to and signing of international treaties on aviation, (d) issuing procedures and rules on technical and professional processes and civil aviation safety, (e) organizing and managing the operation of civil aviation routes, flight information and flight control regions, (f) ensuring security and safety of aviation services, special flights and exclusive flights, (g) managing air transport services provided by domestic air transport business as well as the activities of foreign airlines operating on Vietnamese territory, (h) managing the registration of civil aircraft, the import and export of aircraft, equipment and materials in service of civil aviation; managing the repairs and maintenance of aircraft, aircraft engines, (i) issuing, suspending, extending, revising and withdrawing certificates, licenses and permits relating to the civil aviation activity in accordance with government stipulations. The Regional Airport Authority (RAA) under the CAAV is a non-business unit which is responsible for specialized state management of civil aviation at airports and civil airfields. It also performs the commercial function of organizing the management of airport and airfield exploitation to ensure the supply of aviation services and public services. The RAA is organized into three regions – northern, central and southern. Vietnam Railways: The VR comprises a Headquarter Block together with four specialized blocks, namely Industrial (including workshop and manufacturing facilities), Construction (covering civil engineering and track maintenance activities), Transport (covering traffic and operations) and Hotel-Tourism-Materials. The Transport Block comprises three regional unions (covering the north, central and south of Vietnam) which operate services as planned by the HQ. Organization of State-owned Transport Enterprises In 1994 many commercial functions were removed from the MOT and placed in three state corporations under the Prime Ministers' Office. These are:
Vietnam National Transport Strategy Study (VITRANSS) Final Report
Main Text, Volume I
4-10
• Vietnam National Shipping Lines (VINALINES), • Vietnam Shipbuilding Industry Corporation (VINASHIN), and • Vietnam Airlines Corporation (VAC). This restructuring was carried out under two decisions of government:
• On restructuring state-owned enterprises to increase their operational efficiency as well as to strengthen state management (Government Decision No. 90-TTg/1994 dated 7 March 1994); and
• On establishing a business corporation on an experimental basis to eliminate the governing function at the ministerial and administrative level (Government Decision No. 91-TTg/1994 on "Pilot Work to Establish Enterprise Groupings", also dated 7 March 1994).
Corporations such as the three listed above, formed under Decision 91, had to have at least seven subsidiaries and a total legal capital of at least VND 1,000 billion (US$ 77 million). Their boards of management and general directors are "appointed, dismissed, commended, or disciplined" by the Prime Minister. The scope of these corporations is as follows:
• VINALINES: to carry out business in sea transport, port exploitation, sea ship repair, and maritime brokerage, and to develop the maritime industry in line with the economic development of the state,
• VINASHIN: to conduct business in building new ships, repairing ships and other floating equipment and facilities, oil drilling rigs, and
• VAC: to conduct the following tasks: (i) carrying out business and services in air transport for passengers and cargo at home and abroad in accordance with the state overall planning, plans and policies on the development of civil aviation, (ii) investing directly or indirectly in domestic and foreign projects; buying part or the whole of another business as stipulated by law.
These large corporations act as conglomerates which guide state policy in their respective part of the transport industry. Their statutes proceed from the Law on State Enterprises which was passed by the National Assembly on 20 April 1995 “with a view to promoting the leading role of the State-owned economy in the market mechanism”. They are guided by the Minister of Transport and subsector agencies that appoint the managing board and directors, and give instructions on policy. Major state investments are also made through these corporations. Corporations formed under Decision 90 had to have at least five subsidiaries and a total legal capital of at least VND 500 billion (around US$ 38 million at an exchange rate of VND 13,000 for US$ 1). Their boards of management and the general directors are appointed and dismissed by the MOT. A total of 11 transport corporations were established under this Decision, as shown in Figure 4.1.1. They include most of the SOEs involved in the transport construction business. These corporations tend to be regionally located, compete with each other for construction contracts (often through joint ventures with other construction organizations) and award work to their member SOEs. Following the creation of these corporations, a
Vietnam National Transport Strategy Study (VITRANSS) Final Report
Main Text, Volume I
4-11
further group of five corporations was established in the next year. Following the establishment of these corporations, several transport SOEs remained attached to the MOT, subsector agencies or provincial governments, as indicated in Figure 4.1.1. The government has been pursuing the reform of SOEs - it has plans for further reform of 5,700 SOEs in Vietnam and is currently embarking on a classification of SOEs into three groups (a) very profitable SOEs that are to be more efficiently restructured in accordance with new standards, and possibly equitized, (b) less profitable SOEs that need restructuring to reduce debt to asset ratios, especially by merging them to cut costs, and liquidating unprofitable ones, and (c) losing SOEs that will be sold or liquidated. Debt payment ability would thus become a major criterion determining the restructuring of SOEs. As part of these reforms, Decree No. 103/1999/ND-CP dated 10 September 1999 was introduced to enable small SOEs with less than VND 1 billion (and, in some cases, up to VND 5 billion) asset value to be handed over, sold, contracted, or leased. Provision is made under this decree to value the assets based on agreed prices between seller and buyer and even to auction the SOE where there are two potential buyers. Provision is also made for dealing with labor rights and debt (including giving discounts on asset prices for undertaking to invest and provide employment). This program could mean faster equitizing of non-strategic transport SOEs, especially those providing road and inland water transport services and those providing construction and other support services. However according to government policy, rail, aviation, and ocean-going shipping SOEs are regarded as strategic and therefore not to be equitized. Furthermore there would be insufficient interest to invest private capital in large entities, such as ports and the railway, partly because of labor obligations and the presence of large numbers of surplus staff. Therefore there may be little reform of enterprises in three out of the five major modes of domestic transport for many years to come, unless intermediate reforms such as corporatization or commercialization are pursued. Regulatory Framework Apart from the laws, decisions and decrees that define the organizations of the transport sector, there are legal provisions defining important functions within the transport sector which can be grouped as follows: • modal transport acts (where they exist, giving the basis for transport activity using
each mode), • specific implementing regulations, usually for each mode, giving the precise rules
for general transport activities (traffic regulations, inspection and registration of equipment),
• business regulations (transport licensing, tariff setting etc.) which define the legal basis for commercial transport services, and
• other aspects (safety, planning and provision of infrastructure, insurance).
Vietnam National Transport Strategy Study (VITRANSS) Final Report
Main Text, Volume I
4-12
The main features are summarized below based on the list of key provisions given in Appendix B of Technical Report No. 4 (along with provisions which define the organizations). 1) Modal Transport Acts: It is common practice in many countries to enact basic
transport laws for each mode, or for several modes, covering the main provisions and incorporating enabling powers for the designated governmental department in charge of establishing standards and regulations pursuant to the basic law. So far, the National Assembly has only adopted the Maritime Code, in June 30, 1990, and the law on Civil Aviation, in December 26, 1991 (followed by the Law on Amendments and Addition of the Law on Civil Aviation adopted in April 20,1995). A Road Act has been under preparation for the past five years with the assistance of the ADB. The seventh draft version was released (June 1999) but the document is not yet ready for submission before the National Assembly. One of the reasons for the delay could be that it covers too many areas at the same time and tries to include details that are best left to implementing regulations (a common concern of re-forming governments is to avoid dilution of reforms at lower levels, and this can lead to excessive detail in primary legislation). Drafting legislation is made more problematic by the implementation of separate transport legislation in overlapping areas such as transport safety (for example, the Government Decree No. 36/CP/1995 dated 29 May 1995, which concerns the basis for regulating road safety) and Decree No. 80-CP/1996 dated 5 December 1996 which defines the organization and operation of transport inspection activities). There are no immediate plans for the submission of bills on rail and inland waterway traffic, nor for a second bill amending and supplementing a number of articles of the Vietnam Civil Aviation Law. The latter was supposed to be presented to the National Assembly under the Preparatory Program of the 1999 legislature but was postponed. The other bills have not yet reached advanced draft stage. These bills each cover just a single mode of transport. The legal basis for multimodal and intermodal transport is not easily addressed through such an approach. However no umbrella Transport Act is currently under consideration.
2) Implementing Regulations: Some of these implement new enabling legislation, such as the Maritime Code, Law on Civil Aviation, and Decree on Road Safety. Others define the conditions for transport activity without the support of such high-level legislation. Some of the latter are merely updates of old legislation which try to meet current pressing needs, but inevitably do not form a consistent set of provisions that meet modern needs and overall policy objectives. For example, road vehicle size and weight regulations have been a major issue
Vietnam National Transport Strategy Study (VITRANSS) Final Report
Main Text, Volume I
4-13
for many years and, until recently, have prevented efficient modern forms of road transport (such as container deliveries to/from ports). Even now they are complicated and difficult for road users to understand and involve complicated bureaucratic procedures for law-abiding transport operators. Not surprisingly one truck operator described the regulatory system as something that people use (rather than something that people obey).
3) Business Regulations: A similar situation is found in business regulations. In the maritime subsector there are relatively clear licensing requirements for operators wishing to provide shipping services. However for other modes there are still serious defects. For example, transport licensing regulations for roads and inland water transport often define precise routes for particular vehicles or vessels rather than specifying categories of routes built to appropriate minimum technical specifications for particular types of vehicles or vessels. This inhibits efficient use of vehicles/vessels. Many business regulations are excessively vague and allow considerable discretion in their interpretation. The actual interval of licenses is often too short, less than the maximum given in regulation. Not surprisingly, operators complain about excessive time taken to get and renew licenses. During the VITRANSS study all these transport business licenses were scrapped under Decree No. 19 dated 3 February 2000. Any future licenses will be approved by government in accordance with Article 6 of the Law on Enterprises (Law No. 13/1999/QH10). Many detailed regulations on transport prices are applied which would normally not be enforced in a market economy. These are likely to cause distortions such as cross-subsidies and inadequate supply of transport for some services.
4) International Conventions on Maritime, Land and Air Transport: Vietnam has
signed most of the international maritime conventions, including: • LL (Load Level) Convention (1966), • SOLAS (Safety of life at sea) Convention (1974) and SOLAS PROT (1978), • MARPOL (Maritime pollution) Convention (1978), • STCW (Standard of Training Certification and Watch-keeping for Seafarers)
Convention (1978), • COLREG (1972), • TONNAGE (maximum dead weight) Convention (1969), • ILO Convention No. 147 (on the welfare of the crew), and • Memorandum of Understanding on Port State Control (PSC) for the Asia-
Pacific region (Tokyo MOU) signed in Tokyo in December 1993. The IMO insists on states ratifying IMO conventions, especially those concerned
Vietnam National Transport Strategy Study (VITRANSS) Final Report
Main Text, Volume I
4-14
with PSC, to have efficient maritime administrations staffed by well-trained, reasonably well-paid and experienced personnel. This is a major challenge for the Vietnam maritime sector. A number of United Nations agreements and conventions cover cross-border transport operations. None of them have so far been signed by Vietnam. The purpose of all these conventions is to increase efficiency by performing complex operations as rationally as possible. As regional integration continues there will be increasing pressure on Vietnam to incorporate these conventions into domestic law. Some important conventions are: • Convention concerning the International Transport of Goods by Rail (COTIF
Convention) • Customs Convention on the International Transport of Goods under Cover of
TIR Carnets (TIR Convention), 1975 • Customs Convention on the Temporary Importation of Commercial Road
Vehicles, 1956 • Customs Conventions on Containers, 1972 • International Convention on the Harmonization of Frontier Controls of Goods,
1982 • Convention on the Contract for the International Carriage of Goods by Road
(CMR), 1956 • Convention on Road Traffic, 1968 • Convention on Roads Signs and Signals, 1968 • Convention on the Registration of Inland Navigation Vessels, 1965 • Convention relating to the Limitation of the Liability of Owners of Inland
Navigation Vessels (CLN) 1973 and Protocol (1978) • Convention on the Contract for the International Carriage of Passengers and
Luggage by Inland Waterways (CVN) 1976 and Protocol (1978). Vietnam has also signed several conventions regarding international air transport.
5) Other Aspects: Insurance provisions require basic insurance cover for defined types of transport activity and allow competitive provision of that cover (with the possibility of price incentives from insurance companies for safe operation). The basis for transport infrastructure planning and finance is given in Decree No. 42/CP/1996 dated 16 July 1996. This applies to all sectors of the economy and gives responsibility for allocating resources in terms of three levels of investment. In the transport sector this means that: • Group A - transport investments over US$ 15 million (US$ 30 million for ports),
plus BOT types and virtually any ODA project, are to be submitted by MOT to the Prime Minister for approval
• Group B - above VND 30 billion (US$ 2.2 million) but below the levels of
Vietnam National Transport Strategy Study (VITRANSS) Final Report
Main Text, Volume I
4-15
Group A, are to be decided by MOT after approval by MPI • Group C - below VND 30 billion (US$ 2.2 million), can be decided by MOT (or
even delegated to its subsector agencies provided they follow Decree No. 42 and obtain approval from the MPI).
There is no carriage of goods act in which the limits of liability of carriers for loss or damage are given. Furthermore there is no provision in law for a forwarder to act as a principal or multimodal transport operator (MTO) who is contractually responsible for door-to-door transport. There is a need to incorporate into Vietnamese law the various international agreements and protocols which the government has entered into in recent years (especially the ASEAN agreements which liberalize transport between countries in the region). Various decrees have been implemented which provide the legal basis for BOT agreements. In practice each BOT project requires its own regulations to provide the legal basis for implementation.
Vietnam National Transport Strategy Study (VITRANSS) Final Report
Main Text, Volume 1
4-16
4.2 Road and Road Transport 4.2.1 Road Administration
The Vietnam Road Administration was established in 1993 to administer the road transportation system in Vietnam as a subordinate modal administration under the MOT. The duties of the VRA include the development of strategic, legal and technical directions for road management. Departments in VRA report directly either to the Chairman or to the two Vice Chairmen of VRA (Figure 4.2.1). VRA manages and plans the maintenance of the 7,969-km national road network through its four regional road management units (RRMUs). The organizational structure of these RRMUs differs from each other. Each RRMU is divided into nine to 14 sub-RRMUs, which in turn allocate maintenance works to depots under their jurisdiction. Each sub-RRMU has between three to seven depots. Project management units (PMUs) were formed to handle the management of large-scale projects such as the National Road No. 1 (NR1) rehabilitation project and My Thuan Bridge construction project. The number of PMUs has been increased based on attractive international financing projects.
4.2.2 Road System
Classification and Administration of Road System Pursuant to the Council of Ministers Organizational Law dated 4 July 1981, Decree No. 35/CP dated 9 February 1981 and Decision 158/CP dated 4 July 1974, the MOT established a classification and administration of road system in Vietnam, aiming to control the construction and repair of roads for the purpose of developing and strengthening the road system, to meet the demands of economic development and to safeguard national security. The entire road system (including roads for motor and nonmotorized vehicles) in Vietnam is owned by the Vietnamese people, while the MOT is administrator. People's Committees at all levels are responsible for managing the road system within their respective administrative boundary according to the decentralized state administration. State organizations, economic bodies, army units, and all citizens have a responsibility to protect and maintain the road system and to strictly observe regulations on road transportation management.
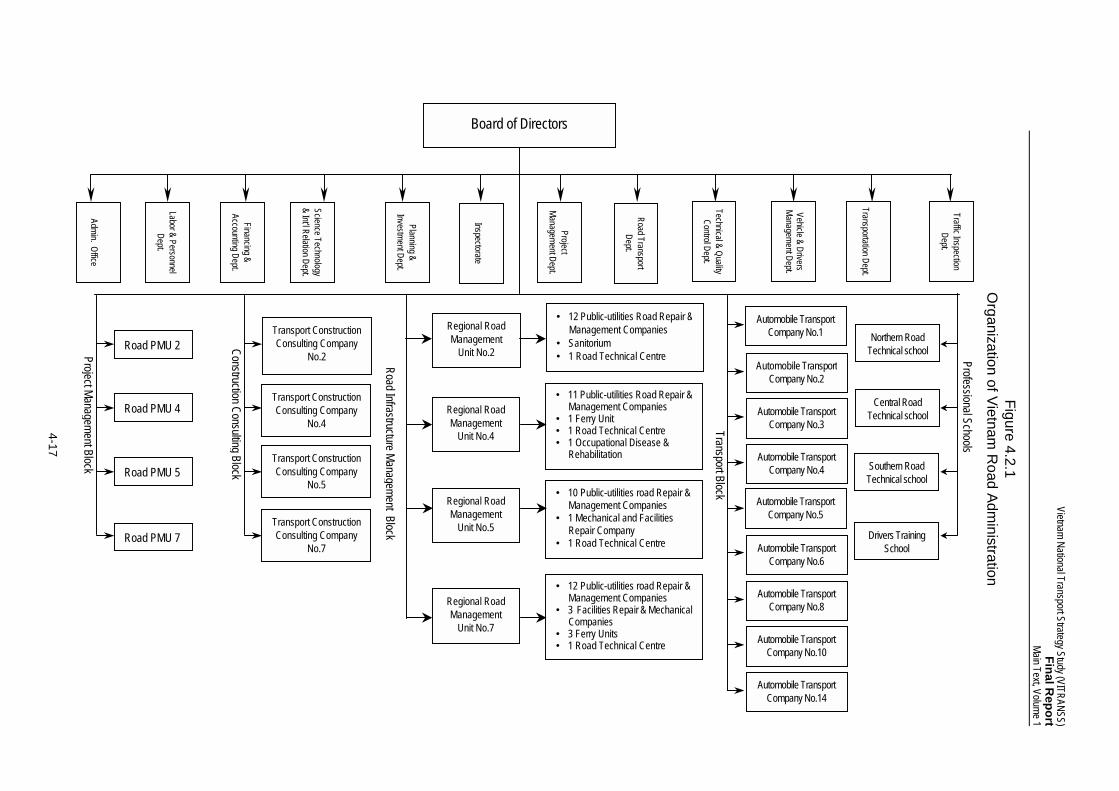
Board of Directors
Admin. Office
Labor & Personnel Dept.
Financing & Accounting Dept.
Science Technology & Int’l Relation Dept.
Planning & Investment Dept.
Project Management Dept.
Technical & Quality Control Dept.
Vehicle & Drivers Management Dept.
Transportation Dept.
Traffic Inspection Dept.
Road Transport Dept.
Inspectorate
Road PMU 2
Road PMU 4
Road PMU 5
Road PMU 7
Transport ConstructionConsulting Company
No.2
Transport ConstructionConsulting Company
No.4
Transport ConstructionConsulting Company
No.5
Transport ConstructionConsulting Company
No.7
Regional Road Management
Unit No.2
Regional Road Management
Unit No.4
Regional Road Management
Unit No.5
Regional Road Management
Unit No.7
• 12 Public-utilities Road Repair &Management Companies
• Sanitorium • 1 Road Technical Centre
• 11 Public-utilities Road Repair & Management Companies
• 1 Ferry Unit • 1 Road Technical Centre • 1 Occupational Disease &
Rehabilitation
• 10 Public-utilities road Repair & Management Companies
• 1 Mechanical and Facilities Repair Company
• 1 Road Technical Centre
• 12 Public-utilities road Repair & Management Companies
• 3 Facilities Repair & Mechanical Companies
• 3 Ferry Units • 1 Road Technical Centre
Transport Block
Automobile Transport Company No.1
Automobile Transport Company No.2
Automobile Transport Company No.3
Automobile Transport Company No.4
Automobile Transport Company No.5
Automobile Transport Company No.6
Automobile Transport Company No.8
Automobile Transport Company No.10
Automobile Transport Company No.14
Northern Road Technical school
Central Road Technical school
Southern Road Technical school
Drivers Training School
Professional Schools
Pro ject Management Block
Construction Consulting Block
Road Infrastructure Management Block
Figure 4.2.1 O
rganization of Vietnam R
oad Administration
Vietnam National Transport Strategy Study (VITRANSS)Final R
eportMain Text, Volume 1
4-17
Vietnam National Transport Strategy Study (VITRANSS) Final Report
Main Text, Volume 1
4-18
The road network is divided into the following six categories: 1) The National Road System (QL): This is the chief road system for the whole
country. It plays the key role in the national economy, politics, culture, and national defense. It includes roads linking Hanoi with the administrative centers of provinces, cities and special zones, as well as international boundary points with neighboring countries.
2) The Provincial Road System (DT): This is a road system within a province, linking it with another, linking important traffic generators within that province and serving its economic, cultural and security interests.
3) The District Road System (designated DH): This is a road system within a district, linking it with other districts and primarily serving the economic, cultural, political, and security requirements of the district.
4) The Village Road System (designated DX): This is a road system within a village, linking it with neighboring villages and roads to rice fields or to other road systems, serving the production requirements and the public interests of the village.
5) The Urban Road System (designated DDT): This road system includes all kinds of streets and traffic roads (except highways) within a city or town. It is composed of many kinds of road, with its own character and utility. The MOT and the Provincial People's Committee of the province jointly set the classification of these roads.
6) The Special Road System (designated CD): This refers to roads used solely by one or more state organizations and enterprises in construction sites, state farms and logging sites and as exit and entry roads of new economic zones, military bases and units, ports, railway stations, and warehouses. It can be roads within the scope of the organization, enterprise, factory, or school.
The authority to classify and regulate the road network lies in the following offices: • The Minister of the MOT shall determine the classification of the highway system; • The Chairman of the Provincial People's Committee shall determine the
classification of the provincial, urban and special road systems; • The Chairman of the District People's Committee shall determine the classification
of the district and village road systems. Existing Road Network
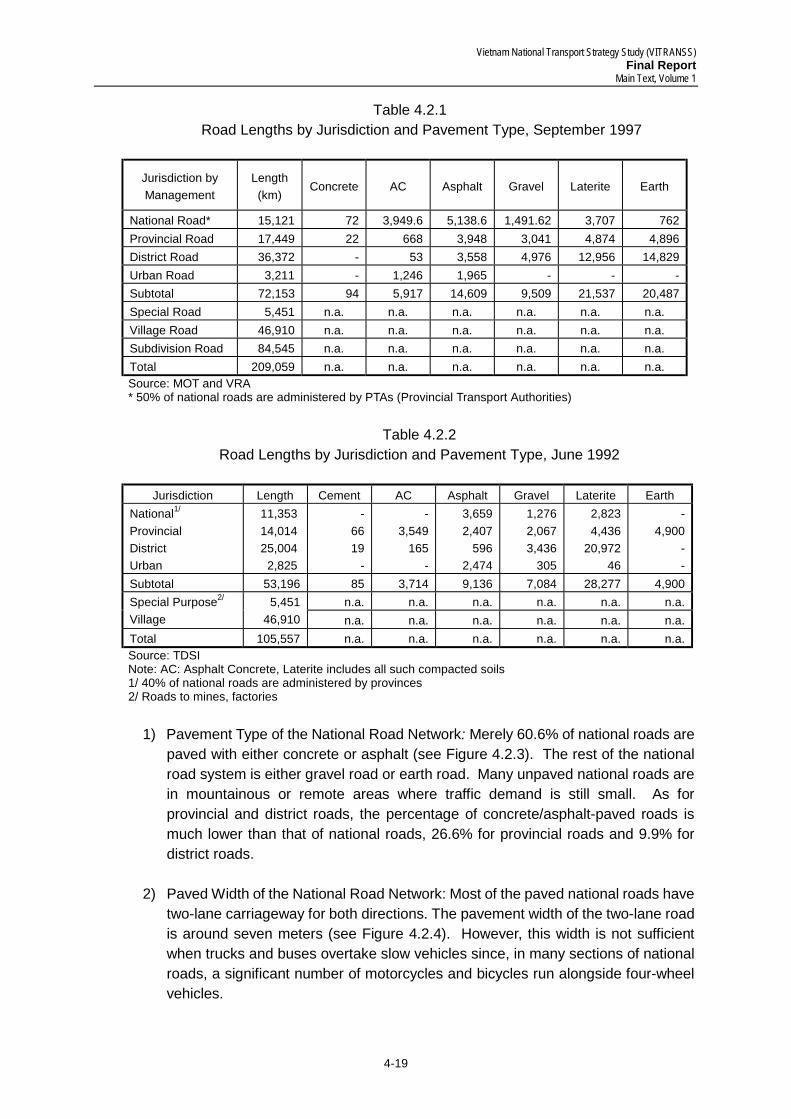
Vietnam has a substantial length of road network of over 200,000 km in 1997 (see Table 4.2.1). National roads, however, account for merely 15,121 km, and provincial and district roads account for 14,014 km and 25,004 km, respectively. The remainder is composed of village, urban and special roads. Comparing with the road length in 1992 (see Table 4.2.2), the road network now has been remarkably extended. More than one-third of bridges need structural strengthening or replacement. At present, 178 ferries connect the road network but boats and terminal facilities are deteriorated thus rehabilitation is also required.
Vietnam National Transport Strategy Study (VITRANSS) Final Report
Main Text, Volume 1
4-19
Table 4.2.1 Road Lengths by Jurisdiction and Pavement Type, September 1997
Jurisdiction by Management
Length (km)
Concrete AC Asphalt Gravel Laterite Earth
National Road* 15,121 72 3,949.6 5,138.6 1,491.62 3,707 762 Provincial Road 17,449 22 668 3,948 3,041 4,874 4,896 District Road 36,372 - 53 3,558 4,976 12,956 14,829 Urban Road 3,211 - 1,246 1,965 - - - Subtotal 72,153 94 5,917 14,609 9,509 21,537 20,487 Special Road 5,451 n.a. n.a. n.a. n.a. n.a. n.a. Village Road 46,910 n.a. n.a. n.a. n.a. n.a. n.a. Subdivision Road 84,545 n.a. n.a. n.a. n.a. n.a. n.a. Total 209,059 n.a. n.a. n.a. n.a. n.a. n.a. Source: MOT and VRA * 50% of national roads are administered by PTAs (Provincial Transport Authorities)
Table 4.2.2
Road Lengths by Jurisdiction and Pavement Type, June 1992
Jurisdiction Length Cement AC Asphalt Gravel Laterite Earth National1/ Provincial District Urban
11,353 14,014 25,004
2,825
- 66 19
-
- 3,549
165 -
3,659 2,407
596 2,474
1,276 2,067 3,436
305
2,823 4,436
20,972 46
- 4,900
- -
Subtotal 53,196 85 3,714 9,136 7,084 28,277 4,900 n.a. n.a. n.a. n.a. n.a. n.a. Special Purpose2/
Village 5,451
46,910 n.a. n.a. n.a. n.a. n.a. n.a. Total 105,557 n.a. n.a. n.a. n.a. n.a. n.a. Source: TDSI Note: AC: Asphalt Concrete, Laterite includes all such compacted soils 1/ 40% of national roads are administered by provinces 2/ Roads to mines, factories
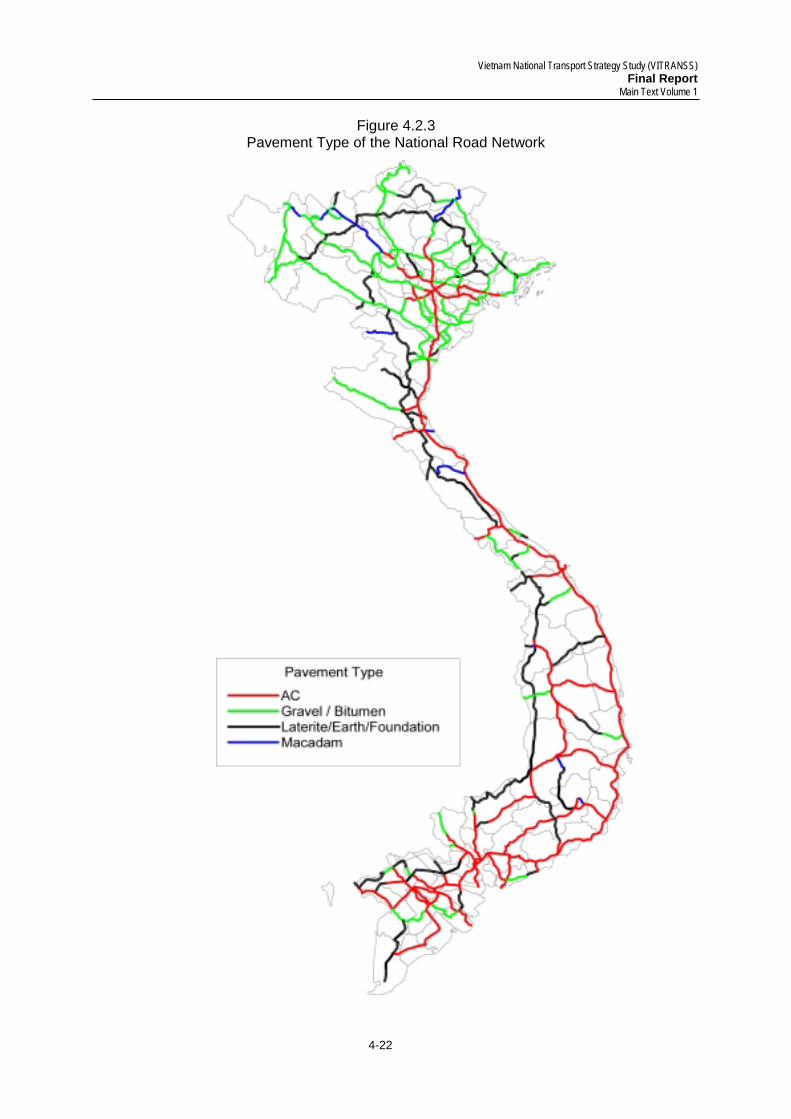
1) Pavement Type of the National Road Network: Merely 60.6% of national roads are
paved with either concrete or asphalt (see Figure 4.2.3). The rest of the national road system is either gravel road or earth road. Many unpaved national roads are in mountainous or remote areas where traffic demand is still small. As for provincial and district roads, the percentage of concrete/asphalt-paved roads is much lower than that of national roads, 26.6% for provincial roads and 9.9% for district roads.
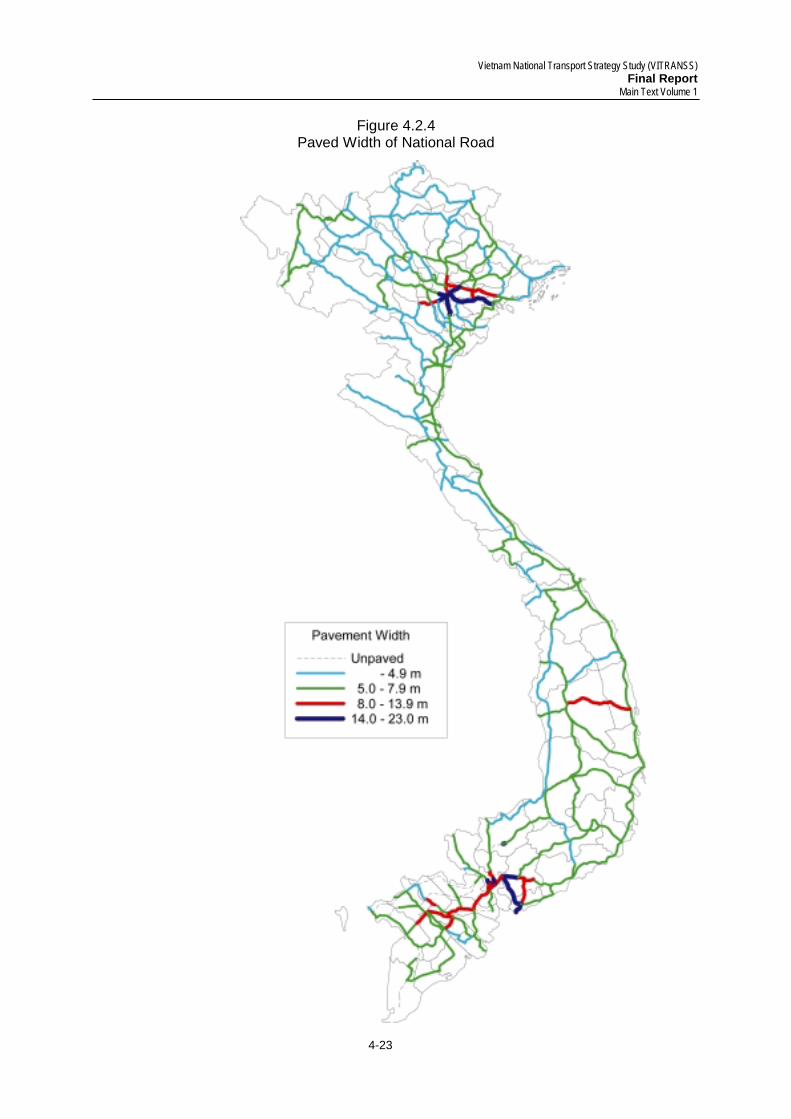
2) Paved Width of the National Road Network: Most of the paved national roads have
two-lane carriageway for both directions. The pavement width of the two-lane road is around seven meters (see Figure 4.2.4). However, this width is not sufficient when trucks and buses overtake slow vehicles since, in many sections of national roads, a significant number of motorcycles and bicycles run alongside four-wheel vehicles.
Vietnam National Transport Strategy Study (VITRANSS) Final Report
Main Text, Volume 1
4-20
Some sections of National Road No.1 now have 11 or 12-meter width, 3.5-meter lane in each direction and an additional 2-meter or 2.5-meter wide shoulder on both sides. With this upgrading, motorcycles and bicycles can run on the shoulder, thus traffic flows of four-wheel and two-wheel vehicles are now separate, resulting in improved traffic condition as well as increased operating speed of four-wheel vehicles.
Four-lane roads are mainly seen in urban areas and are classified as urban roads.
Four-lane sections on national roads are still limited. Only some important national roads with heavy traffic demand have four-lane carriageway; those include the sections on National Road No. 1, No.5 and No.51.
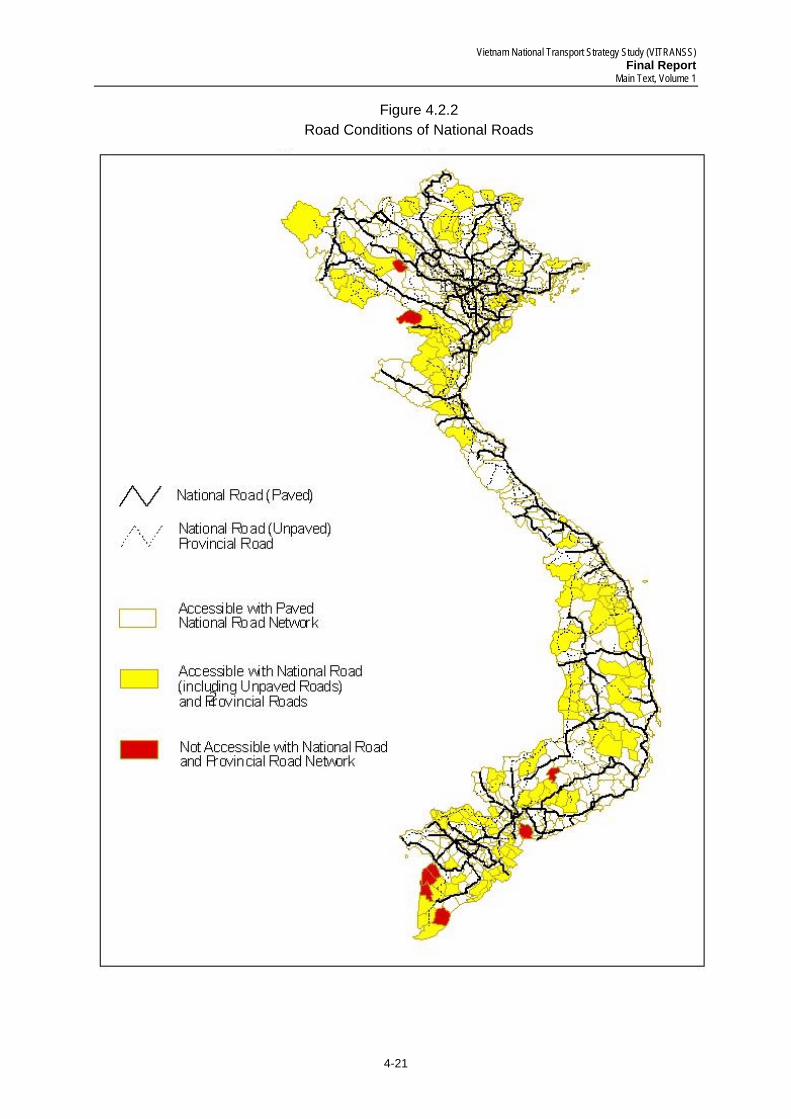
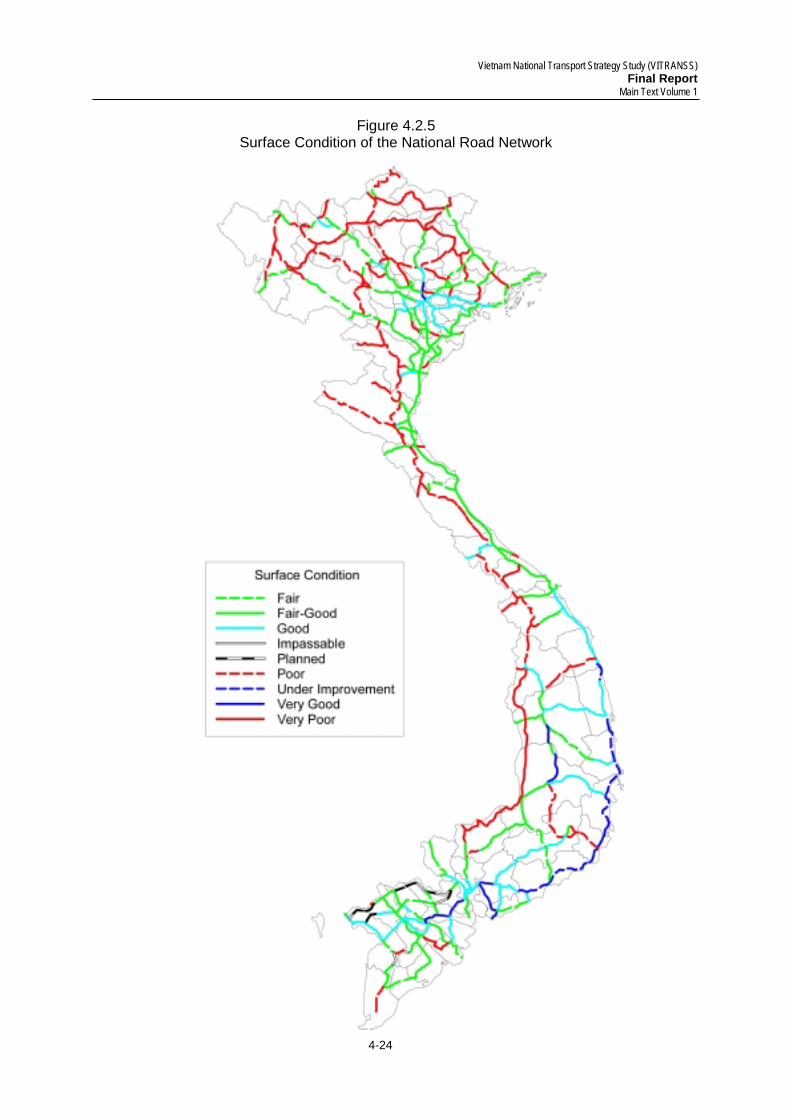
3) Road Condition of National Road Network: National roads in good condition are
mainly in the surrounding areas of Hanoi City and Ho Chi Minh City (see Figure 4.2.5). The road condition in mountainous areas is largely poor.
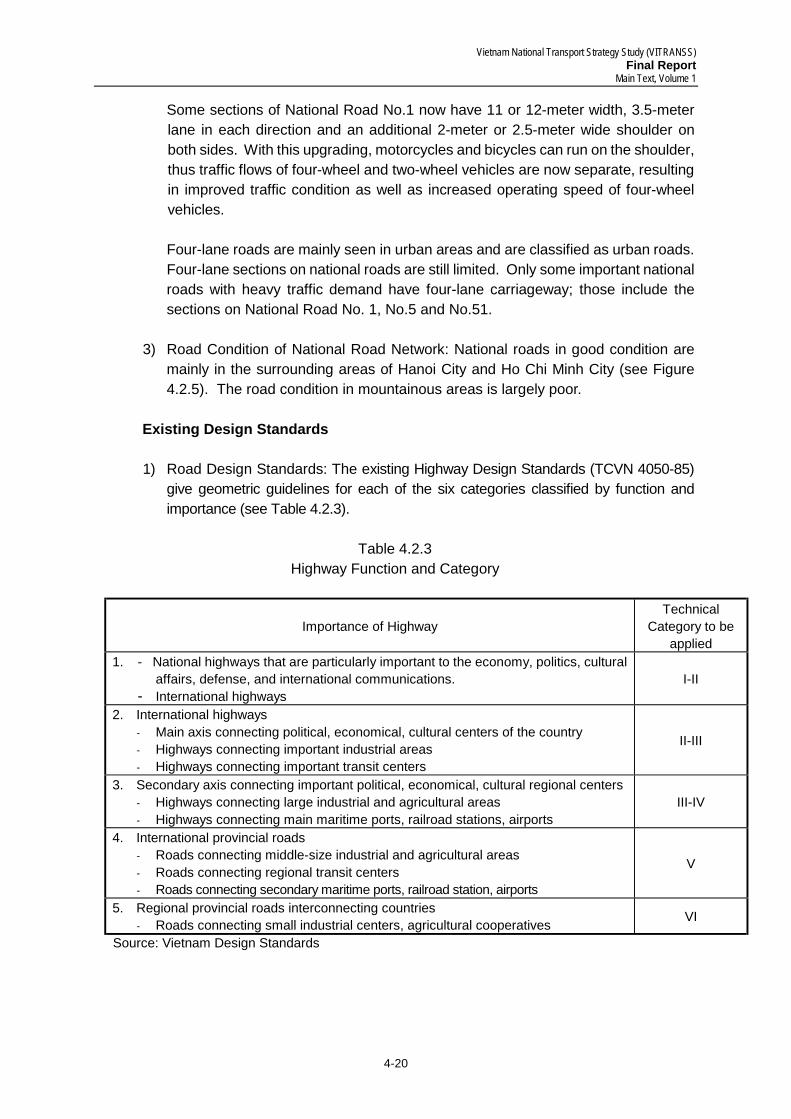
Existing Design Standards 1) Road Design Standards: The existing Highway Design Standards (TCVN 4050-85)
give geometric guidelines for each of the six categories classified by function and importance (see Table 4.2.3).
Table 4.2.3
Highway Function and Category
Importance of Highway Technical
Category to be applied
1. - National highways that are particularly important to the economy, politics, cultural affairs, defense, and international communications.
- International highways I-II
2. International highways - Main axis connecting political, economical, cultural centers of the country - Highways connecting important industrial areas - Highways connecting important transit centers
II-III
3. Secondary axis connecting important political, economical, cultural regional centers - Highways connecting large industrial and agricultural areas - Highways connecting main maritime ports, railroad stations, airports
III-IV
4. International provincial roads - Roads connecting middle-size industrial and agricultural areas - Roads connecting regional transit centers - Roads connecting secondary maritime ports, railroad station, airports
V
5. Regional provincial roads interconnecting countries - Roads connecting small industrial centers, agricultural cooperatives VI
Source: Vietnam Design Standards
Vietnam National Transport Strategy Study (VITRANSS) Final Report
Main Text, Volume 1
4-21
Figure 4.2.2 Road Conditions of National Roads
Vietnam National Transport Strategy Study (VITRANSS) Final Report
Main Text Volume 1
4-22
Figure 4.2.3 Pavement Type of the National Road Network
Vietnam National Transport Strategy Study (VITRANSS) Final Report
Main Text Volume 1
4-23
Figure 4.2.4 Paved Width of National Road
Vietnam National Transport Strategy Study (VITRANSS) Final Report
Main Text Volume 1
4-24
Figure 4.2.5 Surface Condition of the National Road Network
Vietnam National Transport Strategy Study (VITRANSS) Final Report
Main Text, Volume 1
4-25
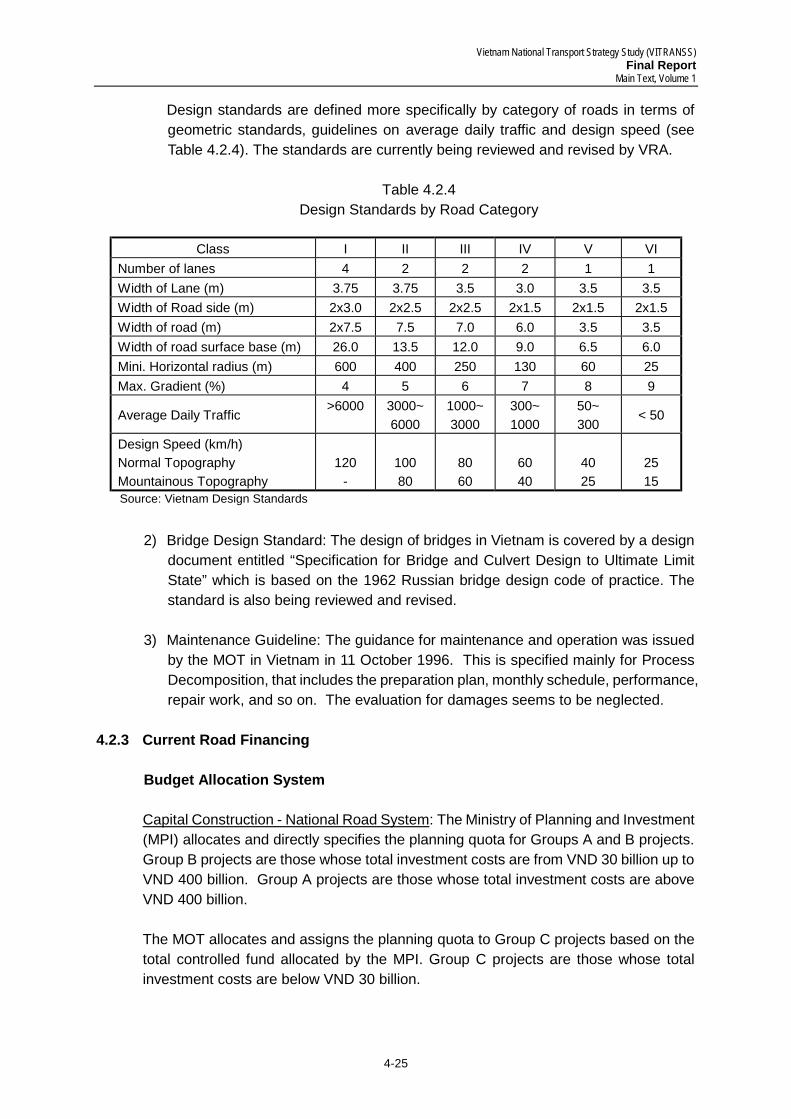
Design standards are defined more specifically by category of roads in terms of geometric standards, guidelines on average daily traffic and design speed (see Table 4.2.4). The standards are currently being reviewed and revised by VRA.
Table 4.2.4
Design Standards by Road Category
Class I II III IV V VI Number of lanes 4 2 2 2 1 1 Width of Lane (m) 3.75 3.75 3.5 3.0 3.5 3.5 Width of Road side (m) 2x3.0 2x2.5 2x2.5 2x1.5 2x1.5 2x1.5 Width of road (m) 2x7.5 7.5 7.0 6.0 3.5 3.5 Width of road surface base (m) 26.0 13.5 12.0 9.0 6.5 6.0 Mini. Horizontal radius (m) 600 400 250 130 60 25 Max. Gradient (%) 4 5 6 7 8 9
Average Daily Traffic >6000
3000~ 6000
1000~ 3000
300~ 1000
50~ 300
< 50
Design Speed (km/h) Normal Topography Mountainous Topography
120
-
100 80
80 60
60 40
40 25
25 15
Source: Vietnam Design Standards 2) Bridge Design Standard: The design of bridges in Vietnam is covered by a design
document entitled “Specification for Bridge and Culvert Design to Ultimate Limit State” which is based on the 1962 Russian bridge design code of practice. The standard is also being reviewed and revised.
3) Maintenance Guideline: The guidance for maintenance and operation was issued
by the MOT in Vietnam in 11 October 1996. This is specified mainly for Process Decomposition, that includes the preparation plan, monthly schedule, performance, repair work, and so on. The evaluation for damages seems to be neglected.
4.2.3 Current Road Financing
Budget Allocation System Capital Construction - National Road System: The Ministry of Planning and Investment (MPI) allocates and directly specifies the planning quota for Groups A and B projects. Group B projects are those whose total investment costs are from VND 30 billion up to VND 400 billion. Group A projects are those whose total investment costs are above VND 400 billion. The MOT allocates and assigns the planning quota to Group C projects based on the total controlled fund allocated by the MPI. Group C projects are those whose total investment costs are below VND 30 billion.
Vietnam National Transport Strategy Study (VITRANSS) Final Report
Main Text, Volume 1
4-26
The Ministry of Finance’s General Department for Investment and Development, through its Provincial Department for Investment and Development, disburses the allocated fund in accordance with the basic work quantity completed by the contractors for the projects. Capital Construction - Provincial Road System: The MPI allocates and directly specifies the planning quota to provinces and cities according to the list of identified projects. The method of disbursement is similar to that of the National Roads System. Capital Construction - District Road System and Other Road Systems: The provinces and cities balance the fund for these systems. Fund disbursement is done through their respective financial units. Roads and Bridges Maintenance - National Road System: The Ministry of Finance allocates and directly specifies the planning quota to the MOT in which the allocation for the road subsector is concretely identified. Based on the allocated fund, the VRA allocates and assigns the planning quota to the RRMUs and Provincial Transport Divisions authorized to manage the national road system. The method of disbursement is done through the system of budget departments and the Provincial Division for Finance and Pricing of provinces and cities. Roads and Bridges Maintenance - Provincial Road System and Other Road Systems: The Ministry of Finance allocates and directly specifies the planning quota to the provincial transport sector. The province in turn balances and allocates the planning quota to local transport projects through their provincial transport divisions. The method of disbursement is similar to that of the National Road System. Investment in the Road Network in 1995-1997: Between 1995 and 1997, the State already poured substantial investments in the maintenance and development of the road network (see Table 4.2.5). Capital resources were diverse: Besides domestic capital, there were foreign sources such as in the form of soft loans from foreign countries and international finance organizations. Mobilized resources from the people were also large: there were contributions of materials, labor days or money. On average, more than VND 600 billion and several million working days/year were mobilized. As a result, the situation of roads was considerably improved; many important national roads were rehabilitated, upgraded or newly constructed. Urban transport was also improved. However, investment capital for road network maintenance and development is still limited. Current sources reportedly meet only 60% and 40% of the total requirement of basic construction and road repair capital, respectively. New Government Initiatives: In order to provide additional financial sources for construction and maintenance of roads, the government has recently allowed some measures to create fund, as follows:
Vietnam National Transport Strategy Study (VITRANSS) Final Report
Main Text, Volume 1
4-27
Table 4.2.5 Sources of Funds for the Road Network, 1995-1997
VND billion
No. Resources 1995 1996 1997
1. For Construction - for National Roads - for Local Roads
3,215 2,015 1,200
3,666 2,446 1,220
4,158 2,558 1,600
2. For Repair and Maintenance - for National Roads - for Local Roads
819 419 400
909 459 450
929 479 450
3. People’s Contribution 650 600 600
Total 4,684 5,175 5,687 Source: TDSI
• Loan for road maintenance and toll collection for paying back the loan (Decision No.
3170/KTN dated 25 June 1997 and Decision No 1038/KTN dated 3 September 1998). • Toll collection on some national road sections, newly built or upgraded bridges where
state budget was granted (Decision No. 3328 KTN dated 3 July 1997). • Toll collection on three projects, namely, NR11, NR51 and Lang Hoa Lac expressway
(Decision No. 111/TTg dated 2 July 1996). 4.2.4 Road Transport Existing Road Traffic Demand
1) Traffic Demand on the Road Network: Traffic demands are concentrated in the two
major cities, Hanoi and HCMC and their surrounding areas. The northern mountainous region, Central Highlands and central coastal regions do not currently show significant volume of traffic demand. At present, traffic volume of four-wheel vehicles is still moderate on many sections of the road network, except the road sections in urbanized areas. Among 39 VITRANSS traffic count survey stations, 14 stations have traffic volumes of less than 1,000 vehicles per day (see Table 4.2.6)
Table 4.2.6
Traffic Volume on Selected Stations
Traffic Volume (vehicle/day) Number of stations 0-1000 14 1001-3000 12 3001 – 5000 9 5001-1000 2 1001- 2
Source: VITRANSS Traffic Count Survey, 1999
Vietnam National Transport Strategy Study (VITRANSS) Final Report
Main Text, Volume 1
4-28
However, it should be noted that a considerable number of two-wheel vehicles, such as motorcycles and bicycles, run on national roads (see Table 4.2.7). This mixed mode of transport reduces actual road capacity significantly and causes traffic accidents.
Table 4.2.7
Road Traffic Volume by Section 24 hours, both directions
Stn.
No.
Road
No. Location Province Car Bus Truck Total
Motor-
cycle Bicycle
1 6 North of Thuan Chau Son La 52 54 89 194 641 326
2 70 South Bao Yen Lao Cai 77 69 130 276 772 713
3 2 North of Ham Yen (Tan Yen) Tuyen Quang 72 178 237 487 2,142 3,050
4 2 South of Viet Tri Bridge Vinh Phuc 812 862 1,985 3,660 3,405 2,731
5 3 Dong Phu (South of Cho Moi) Thai Nguyen 146 172 245 563 860 1,363
6 3 South of Pho Yen (Ba Hang) Thai Nguyen 488 559 1,137 2,184 2,762 2,628
7 1 South of Dap Cau Bac Ninh 1,224 1,255 1,827 4,306 4,843 2,820
8 1 North of Kep Bac Giang 504 669 1,020 2,193 1,888 2,878
9 18 East of Sao Do (Chi Linh) Hai Duong 517 735 1,398 2,650 3,126 3,915
10 4B East of Dinh Lap Lang Son 10 15 41 66 673 1,185
11 6 North East of Tong Dau Hoa Binh 87 164 335 587 324 99
12 6 East of Xuan Mai Ha Tay 487 471 994 1,951 2,993 3,064
13 37 Thuong Bang La Yen Bai 11 6 32 50 464 486
14 1 South of Dong Van Ha Nam 1,340 1,773 3,245 6,357 4,343 2,578
15 21 North of Lac Thuy (Chi Ne) Hoa Binh 34 12 120 166 1,339 3,408
16 1 North of Ninh Binh town Ninh Binh 904 1,010 2,177 4,091 3,225 2,994
17 1 North of Bim Son Thanh Hoa 851 993 2,581 4,425 3,552 4,463
18 10 South of Nghin bridge Thai Binh 95 160 291 545 1,963 1,792
19 5 East of Du Nghia Hai Phong 1,099 854 2,087 4,041 3,895 2,743
20 10 West of Yen Hung (Quang Yen) Quang Ninh 141 185 143 469 912 511
21 9 West of Dong Ha Quang Tri 114 262 427 804 1,090 674
22 1 Lang Co Thua Thien Hue 238 562 1,439 2,239 989 953
23 14B East of Dai Loc (Ai Nghia) Quang Nam 15 98 149 263 2,080 3,369
24 1 North of Tam Ky Quang Nam 405 791 1,926 3,121 3,195 1,717
25 19 East of An Khe pass (Phu Phong) Binh Dinh 167 537 938 1,642 746 339
26 26 East of Phuong Hoang pass Khanh Hoa 59 139 745 943 1,458 1,640
27 14 North of Dong Xoai Binh Phuoc 148 285 736 1,170 2,774 1,203
28 20 South of Ma Da Gui Dong Nai 149 802 1,181 2,132 2,333 1,971
29 1 South of Ham Thuan Nam Binh Thuan 310 987 1,972 3,270 2,020 995
30 51 North of Phu My (Tan Thanh) Ba Ria Vung Tau 957 1,373 1,935 4,265 5,473 2,228
31 1 North of Dong Nai bridge Dong Nai 3,906 6,341 10,937 21,183 31,131 2,819
32 13 South of Thu Dau Mot Binh Duong 1,507 2,126 3,187 6,820 15,467 2,523
33 1 Noth of Tan An Long An 1,976 4,062 5,645 11,683 14,005 1,902
34 22 East of Trang Bang Tay Ninh 758 857 1,669 3,284 6,336 2,317
35 60 South of Rach Mieu ferry Ben Tre 187 346 399 932 11,806 9,995
36 30 East of Cao Lanh Dong Thap 276 628 482 1,387 8,062 3,249
37 1 North of Can Tho Ferry Vinh Long 440 1123 1,069 2,632 2,945 1,438
38 80 South of Thach Hung(Lap Vo) Dong Thap 238 645 1,244 2,128 4,925 6,253
39 91 West of Long Xuyen An Giang 354 1,177 734 2,265 14,763 11,906 Source: VITRANSS Road Traffic Survey, March-April 1999
Vietnam National Transport Strategy Study (VITRANSS) Final Report
Main Text, Volume 1
4-29
Vehicle composition varies from station to station. However, at most survey stations, trucks are more than 50% of the total number of four-wheel vehicles. The shares of passenger cars and buses are approximately 20% and 30%, respectively.
2) OD Pattern by Vehicle Type: According to VITRANSS survey, OD patterns of road
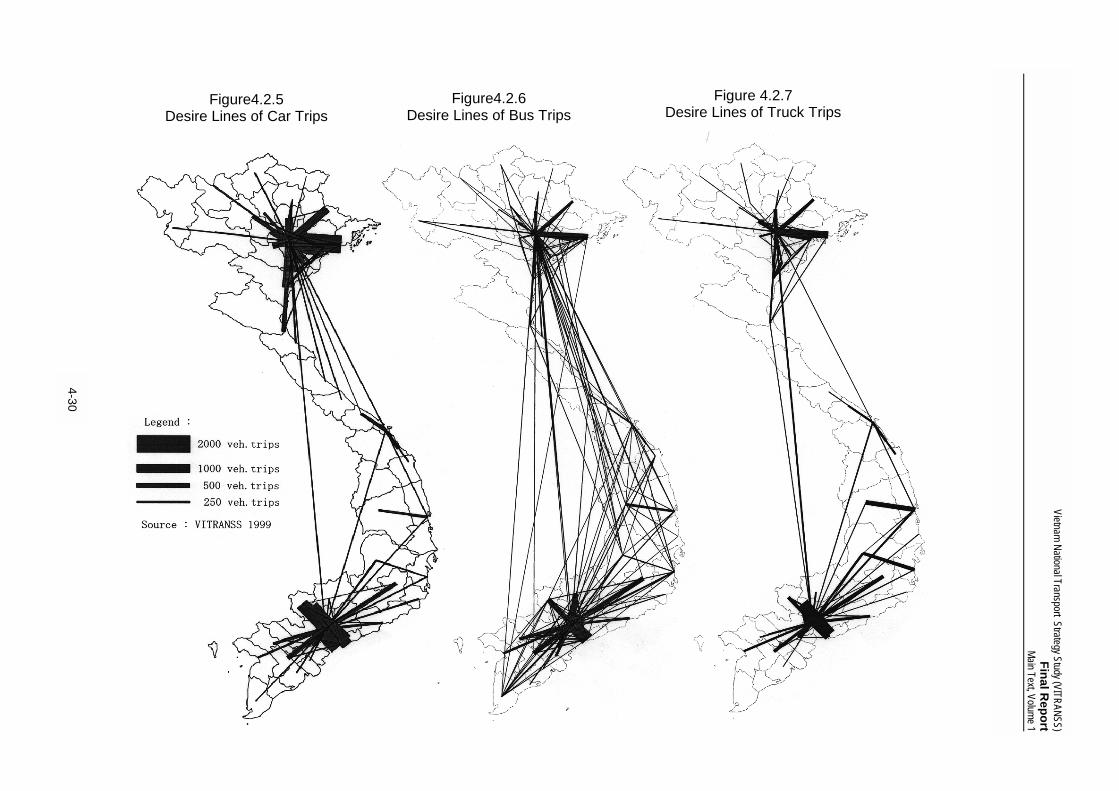
vehicles are as follows: Passenger Car OD Pattern: Passenger car trips are concentrated in areas surrounding Hanoi and Ho Chi Minh City as shown in Figure 4.2.5. For long distance trips between Hanoi and Danang and between Hanoi and Ho Chi Minh City, the share of private passenger cars is relatively small. Bus OD Pattern: Compared with the OD pattern of passenger cars, that of the bus is dispersed all over the country as illustrated in Figure 4.2.6, although Hanoi and Ho Chi Minh City serve as hubs for inter-city bus services. This is attributable to the current direct bus operation between these two cities. Truck OD Pattern: Truck trips are also concentrated in the surrounding areas of Hanoi and Ho Chi Minh City, as depicted in Figure 4.2.7. The number of truck trips in the central region is relatively small. With regard to Hanoi, strong linkages are observed between Hanoi and Quang Ninh (1,100 trips) and between Hanoi and Hai Phong (900 trips). As for Ho Chi Minh City, many trucks are operated between Ho Chi Minh and Don Nai (more than 6,000 trips) and between Ho Chi Minh and Binh Duong (2,200 trips).
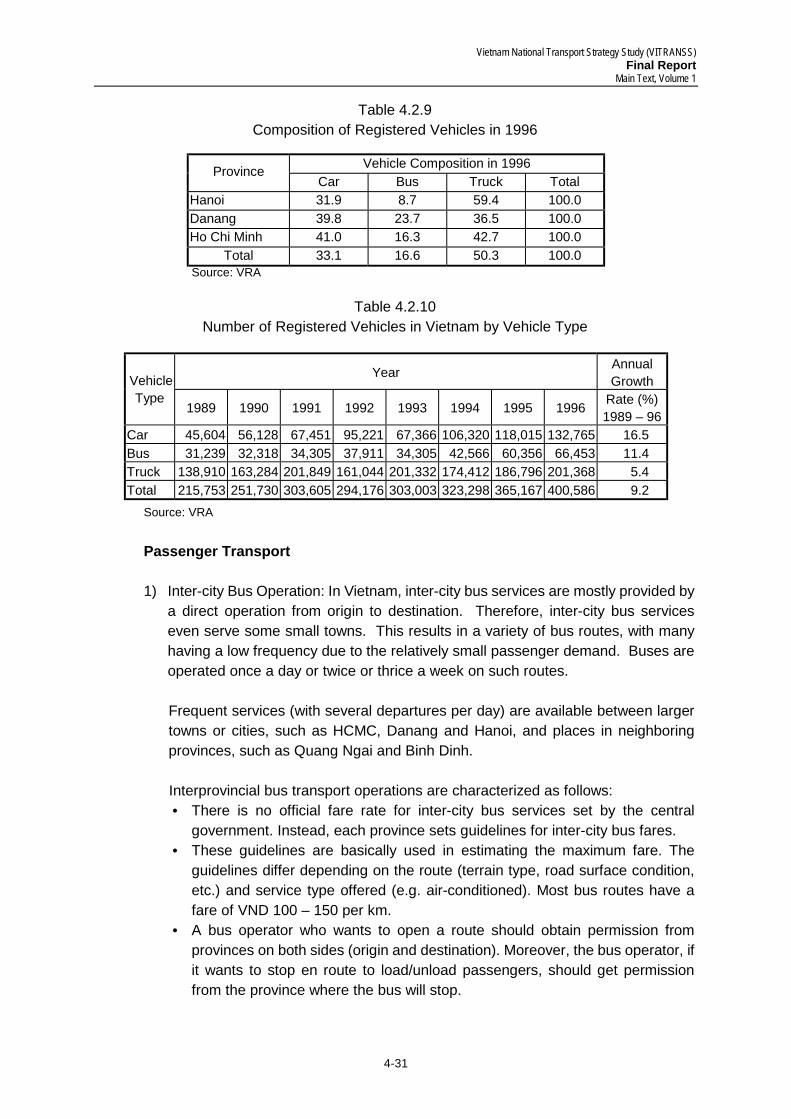
Vehicle Registration In Vietnam, vehicle registration is concentrated in two large cities, Hanoi City and Ho Chi Minh City. Around 40% of vehicles are registered in these two cities (see Table 4.2.8). The truck is a dominant type of vehicle, accounting for more than 50% of all the vehicles registered in the country (see Table 4.2.9). However, the registered number of cars has been increasing rapidly at the annual average growth rate of 16.5% (see Table 4.2.10).
Table 4.2.8
Distribution of Registered Vehicles in 1996
Vehicle Composition in 1996 Province Car Bus Truck Total
Hanoi 13.0 7.1 15.9 13.5 Danang 3.0 3.5 1.8 2.5 Ho Chi Minh 33.0 26.2 22.7 26.7 Total Vietnam 100.0 100.0 100.0 100.0 Source: VRA
Vietnam National Transport Strategy Study (VITRANSS) Final R
eport Main Text, Volume 1
Figure4.2.5
Desire Lines of Car Trips Figure4.2.6
Desire Lines of Bus Trips Figure 4.2.7
Desire Lines of Truck Trips
4-30
Vietnam National Transport Strategy Study (VITRANSS) Final Report
Main Text, Volume 1
4-31
Table 4.2.9 Composition of Registered Vehicles in 1996
Vehicle Composition in 1996 Province
Car Bus Truck Total Hanoi 31.9 8.7 59.4 100.0 Danang 39.8 23.7 36.5 100.0 Ho Chi Minh 41.0 16.3 42.7 100.0
Total 33.1 16.6 50.3 100.0 Source: VRA
Table 4.2.10
Number of Registered Vehicles in Vietnam by Vehicle Type
Year Annual Growth Vehicle
Type 1989 1990 1991 1992 1993 1994 1995 1996 Rate (%)
1989 – 96 Car 45,604 56,128 67,451 95,221 67,366 106,320 118,015 132,765 16.5 Bus 31,239 32,318 34,305 37,911 34,305 42,566 60,356 66,453 11.4 Truck 138,910 163,284 201,849 161,044 201,332 174,412 186,796 201,368 5.4 Total 215,753 251,730 303,605 294,176 303,003 323,298 365,167 400,586 9.2
Source: VRA Passenger Transport 1) Inter-city Bus Operation: In Vietnam, inter-city bus services are mostly provided by
a direct operation from origin to destination. Therefore, inter-city bus services even serve some small towns. This results in a variety of bus routes, with many having a low frequency due to the relatively small passenger demand. Buses are operated once a day or twice or thrice a week on such routes. Frequent services (with several departures per day) are available between larger towns or cities, such as HCMC, Danang and Hanoi, and places in neighboring provinces, such as Quang Ngai and Binh Dinh.
Interprovincial bus transport operations are characterized as follows:
• There is no official fare rate for inter-city bus services set by the central government. Instead, each province sets guidelines for inter-city bus fares.
• These guidelines are basically used in estimating the maximum fare. The guidelines differ depending on the route (terrain type, road surface condition, etc.) and service type offered (e.g. air-conditioned). Most bus routes have a fare of VND 100 – 150 per km.
• A bus operator who wants to open a route should obtain permission from provinces on both sides (origin and destination). Moreover, the bus operator, if it wants to stop en route to load/unload passengers, should get permission from the province where the bus will stop.
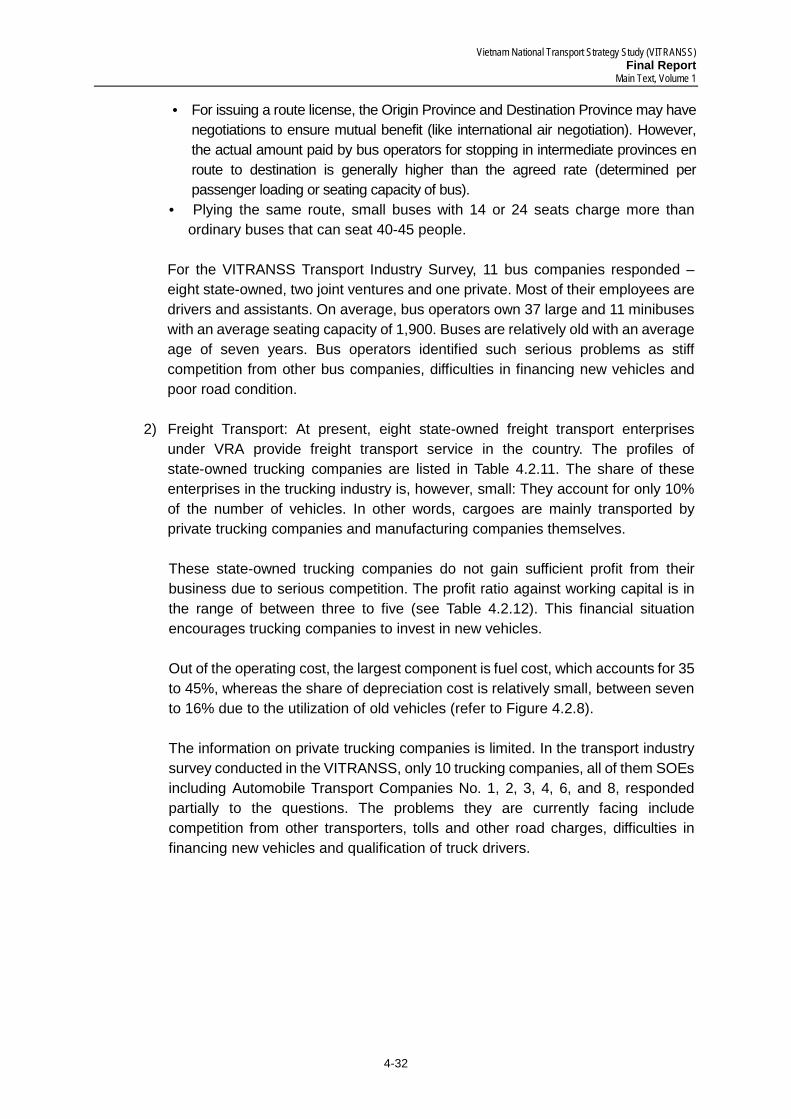
Vietnam National Transport Strategy Study (VITRANSS) Final Report
Main Text, Volume 1
4-32
• For issuing a route license, the Origin Province and Destination Province may have negotiations to ensure mutual benefit (like international air negotiation). However, the actual amount paid by bus operators for stopping in intermediate provinces en route to destination is generally higher than the agreed rate (determined per passenger loading or seating capacity of bus).
• Plying the same route, small buses with 14 or 24 seats charge more than ordinary buses that can seat 40-45 people.
For the VITRANSS Transport Industry Survey, 11 bus companies responded – eight state-owned, two joint ventures and one private. Most of their employees are drivers and assistants. On average, bus operators own 37 large and 11 minibuses with an average seating capacity of 1,900. Buses are relatively old with an average age of seven years. Bus operators identified such serious problems as stiff competition from other bus companies, difficulties in financing new vehicles and poor road condition.
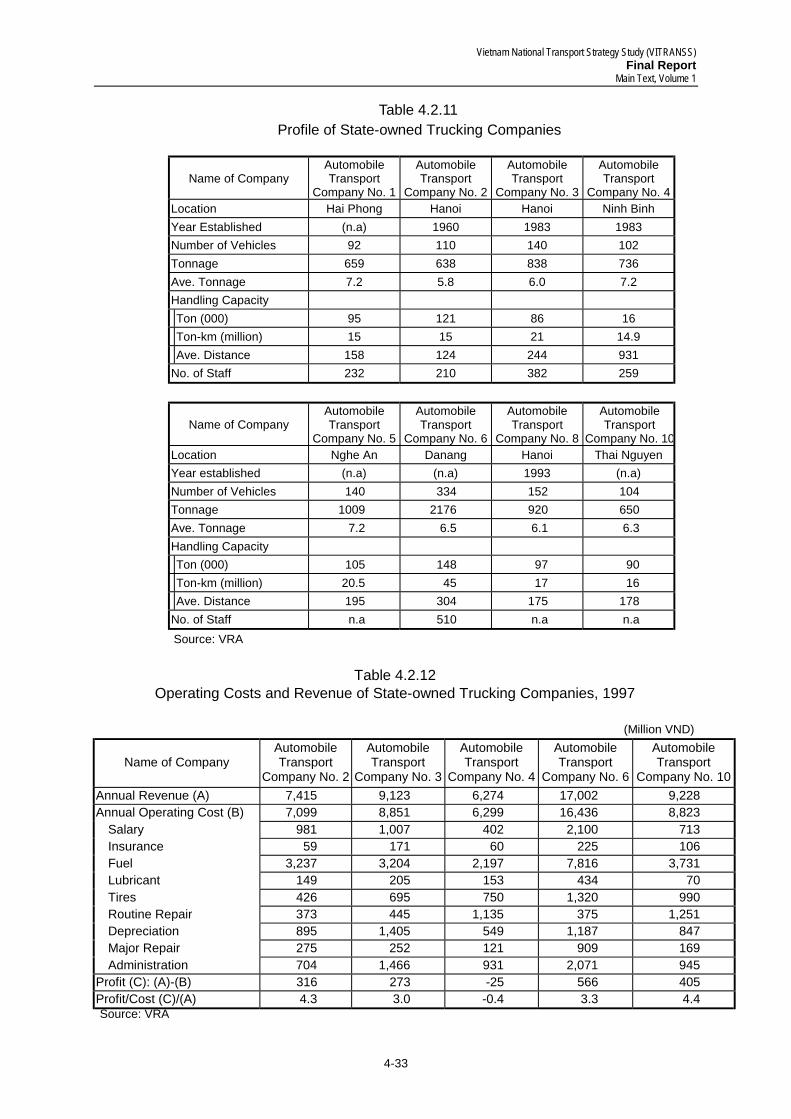
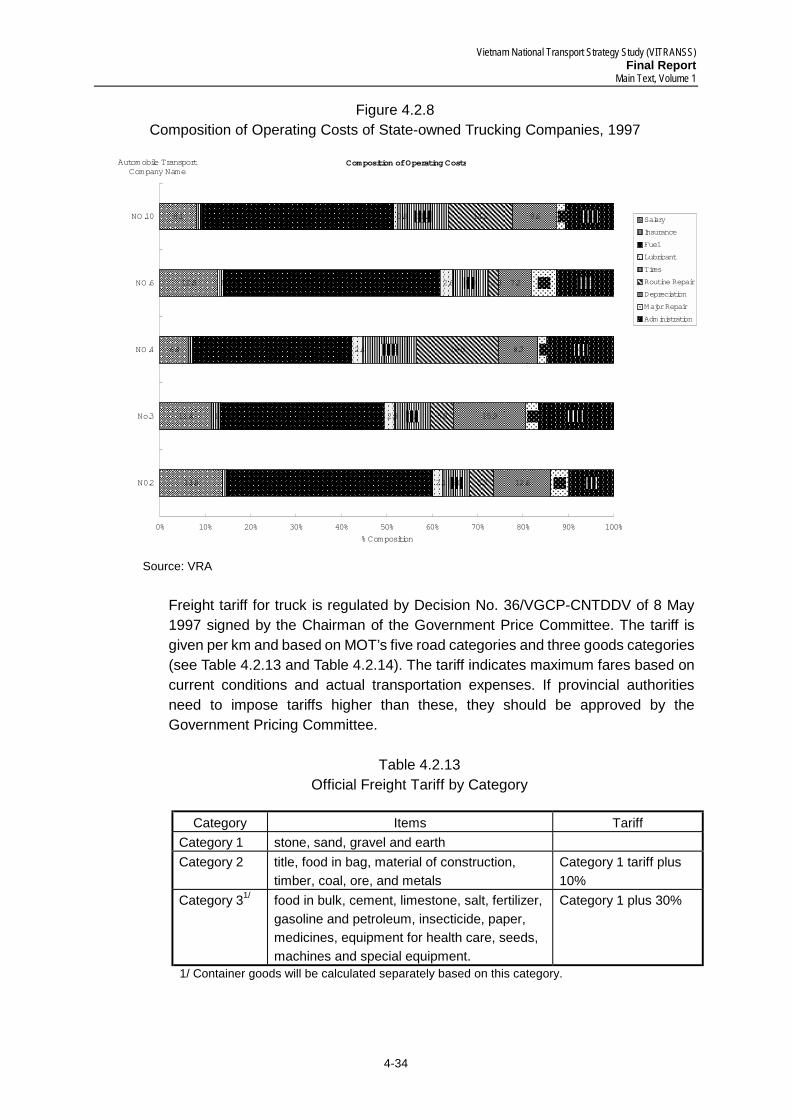
2) Freight Transport: At present, eight state-owned freight transport enterprises under VRA provide freight transport service in the country. The profiles of state-owned trucking companies are listed in Table 4.2.11. The share of these enterprises in the trucking industry is, however, small: They account for only 10% of the number of vehicles. In other words, cargoes are mainly transported by private trucking companies and manufacturing companies themselves. These state-owned trucking companies do not gain sufficient profit from their business due to serious competition. The profit ratio against working capital is in the range of between three to five (see Table 4.2.12). This financial situation encourages trucking companies to invest in new vehicles. Out of the operating cost, the largest component is fuel cost, which accounts for 35 to 45%, whereas the share of depreciation cost is relatively small, between seven to 16% due to the utilization of old vehicles (refer to Figure 4.2.8). The information on private trucking companies is limited. In the transport industry survey conducted in the VITRANSS, only 10 trucking companies, all of them SOEs including Automobile Transport Companies No. 1, 2, 3, 4, 6, and 8, responded partially to the questions. The problems they are currently facing include competition from other transporters, tolls and other road charges, difficulties in financing new vehicles and qualification of truck drivers.
Vietnam National Transport Strategy Study (VITRANSS) Final Report
Main Text, Volume 1
4-33
Source: VRA
Table 4.2.11 Profile of State-owned Trucking Companies
Name of Company Automobile Transport
Company No. 1
Automobile Transport
Company No. 2
Automobile Transport
Company No. 3
Automobile Transport
Company No. 4 Location Hai Phong Hanoi Hanoi Ninh Binh Year Established (n.a) 1960 1983 1983 Number of Vehicles 92 110 140 102 Tonnage 659 638 838 736 Ave. Tonnage 7.2 5.8 6.0 7.2 Handling Capacity Ton (000) 95 121 86 16 Ton-km (million) 15 15 21 14.9 Ave. Distance 158 124 244 931 No. of Staff 232 210 382 259
Name of Company Automobile Transport
Company No. 5
Automobile Transport
Company No. 6
Automobile Transport
Company No. 8
Automobile Transport
Company No. 10Location Nghe An Danang Hanoi Thai Nguyen Year established (n.a) (n.a) 1993 (n.a) Number of Vehicles 140 334 152 104 Tonnage 1009 2176 920 650 Ave. Tonnage 7.2 6.5 6.1 6.3 Handling Capacity Ton (000) 105 148 97 90 Ton-km (million) 20.5 45 17 16 Ave. Distance 195 304 175 178 No. of Staff n.a 510 n.a n.a Source: VRA
Table 4.2.12
Operating Costs and Revenue of State-owned Trucking Companies, 1997
(Million VND)
Name of Company Automobile Transport
Company No. 2
Automobile Transport
Company No. 3
Automobile Transport
Company No. 4
Automobile Transport
Company No. 6
Automobile Transport
Company No. 10 Annual Revenue (A) 7,415 9,123 6,274 17,002 9,228 Annual Operating Cost (B) 7,099 8,851 6,299 16,436 8,823
Salary 981 1,007 402 2,100 713 Insurance 59 171 60 225 106 Fuel 3,237 3,204 2,197 7,816 3,731 Lubricant 149 205 153 434 70 Tires 426 695 750 1,320 990 Routine Repair 373 445 1,135 375 1,251 Depreciation 895 1,405 549 1,187 847 Major Repair 275 252 121 909 169 Administration 704 1,466 931 2,071 945
Profit (C): (A)-(B) 316 273 -25 566 405 Profit/Cost (C)/(A) 4.3 3.0 -0.4 3.3 4.4
Vietnam National Transport Strategy Study (VITRANSS) Final Report
Main Text, Volume 1
4-34
Figure 4.2.8 Composition of Operating Costs of State-owned Trucking Companies, 1997
Source: VRA
Freight tariff for truck is regulated by Decision No. 36/VGCP-CNTDDV of 8 May 1997 signed by the Chairman of the Government Price Committee. The tariff is given per km and based on MOT’s five road categories and three goods categories (see Table 4.2.13 and Table 4.2.14). The tariff indicates maximum fares based on current conditions and actual transportation expenses. If provincial authorities need to impose tariffs higher than these, they should be approved by the Government Pricing Committee.
Table 4.2.13
Official Freight Tariff by Category
Category Items Tariff Category 1 stone, sand, gravel and earth Category 2 title, food in bag, material of construction,
timber, coal, ore, and metals Category 1 tariff plus 10%
Category 31/ food in bulk, cement, limestone, salt, fertilizer, gasoline and petroleum, insecticide, paper, medicines, equipment for health care, seeds, machines and special equipment.
Category 1 plus 30%
1/ Container goods will be calculated separately based on this category.
������������������������������������������������������������������������������������
������������������������������������������������������������������������
������������������������������
������������������������������������������������������������������������������
������������������������������������������������������
���������������
���������������������
����������
���������������
������������
������������������������������������������������������������������������������������������������������������������������������������������������������������������������������������������������������������������������������������������������������
���������������������������������������������������������������������������������������������������������������������������������������������������������������������������������������������������������
������������������������������������������������������������������������������������������������������������������������������
���������������������������������������������������������������������������������������������������������������������������������������������������������������������������������������������������������������������������������������������������������������
���������������������������������������������������������������������������������������������������������������������������������������������������������������������������������������������������������������������������������������������
������������������
������������������������
��������������
������������������
���������������
���������������������������������������
������������������������������������������������������
������������������������������������������������
������������������������������������������������
���������������������������������������������������������������
������������������������������
���������������������������������
������������������������������������������������������������������������
������������������������
������������������������������������������������������������������������������
���������������������������������������������������������������������������
���������������������������������������������������������������������������������������������
����������������������������������������
���������������������������������������������������
���������������������������������������������������������
������������������������
������������������������
��������������
���������������������������������
������������������
���������������������������������������������������������������
���������������������������������������������������������������������������������������������������
����������������������������������������������������������
���������������������������������������������������������������������������
���������������������������������������������������������������
Composition of Operating Costs
13.8
11.4
6.4
12.8
8.1
0.8
1.9
1.0
1.4
1.2
45.6
36.2
34.9
47.6
42.3
2.1
2.3
2.4
2.6
0.8
������������6.0
������������������7.9
������������������11.9
��������8.0
��������������������11.2
5.3
5.0
18.0
2.3
14.2
12.6
15.9
8.7
7.2
9.6
��������������3.9
����������������2.8
������������������1.9
��������5.5
����������������1.9
��������������9.9
��������������������16.6
��������������14.8
������������������12.6
����������������������
10.7
0% 10% 20% 30% 40% 50% 60% 70% 80% 90% 100%
N0.2
No.3
NO.4
NO.6
NO.10
Automobile TransportCompany Name
% Composition
�����Salary�����Insurance
����������Fuel����������Lubricant�����
Tires�����Routine Repair�����Depreciation
�����Major Repair
����������Administration
Vietnam National Transport Strategy Study (VITRANSS) Final Report
Main Text, Volume 1
4-35
Table 4.2.14 Official Road Tariff
(VND/ton – km) Categories of Roads Hauling
Distance 1 2 3 4 5 15 794 865 1,150 1,438 1,869 56 – 60 460 518 725 979 1,371 61- 70 453 510 714 967 1,354 91 – 100 438 493 692 938 1,314 101 and above 435 489 686 930 1,304
Source: Decision 36/VGCP – CNTDDV of May 8, 1997.
Actual fares and charges commercially imposed on transport users have been obtained from field surveys, interviews and cost quotations conducted in the VITRANSS. About 20 freight forwarders in selected routes (by different transport modes and commodity types) were selected, of which 10 forwarders (six from Hanoi and four from HCMC offered their quotations. Some forwarders seem to have little experience in goods transport in some routes or by some modes. Most of them did not show an accurate basis for cost quotation. As a result, the quoted rates greatly differ, though forwarders well equipped with modern facilities (truck fleet, warehouse, branch office, etc.) tend to offer higher prices. Although the actual cargo transport charge may not clear, it can be pointed out that the truck is the most expensive but most widely used means of freight transport. For cross-border routes, such as to Kunming and Phnom Penh, the charge jumps up considerably. Some forwarders even claim that they cannot offer a price because the cross-border procedure is unclear.
4.2.5 Road Safety
Present Situation
In 1999, more than 20,000 accidents claimed 6,670 lives and caused a further 23,911 injuries (see Table 4.2.15). Injuries are not classified by severity, i.e. minor or serious, nor is information provided on the number of fatal road accidents. One recent study reports that underreporting by the Traffic Police is acknowledged to be frequent. This can be seen from the data of Viet Duc hospital in Hanoi, which alone recorded treating a number of patients equal to 70% of the reported road casualties for the whole country. The high ratio of casualties also indicates that only the more serious accidents are reported.
The number of accidents has not grown as rapidly as the vehicle fleet and so there has been a dramatic improvement in Vietnam's official fatality rate. However, the rapid increase in motorization will inevitably make the roads less safe as higher vehicle speeds and increased congestion will increase both the frequency and severity of accidents. According to the 1994 Police Accident Report, 50% of all accidents
Vietnam National Transport Strategy Study (VITRANSS) Final Report
Main Text, Volume 1
4-36
occurred on national highways and 30% on urban roads. Seven percent was reported as occurring on rural roads although the road classification categories on the current accident report form do not include rural roads.
It has been found out that about 80% of road traffic accidents are caused by mistakes of vehicle drivers. Of these, 62% of accidents are caused by motorbike drivers. It has been noted that many motorbikes carrying three to four people caused accidents. In one instance, two automobiles crashed into each other, causing the death of one and injury to seven (the automobile was carrying four people). In another instance, an accident caused by a motorbike carrying three people resulted in the death of all its riders.
Table 4.2.15 National Traffic Accident Statistics
Year No. of
Accidents No. of
Fatalities No. of
Injuries Total
Casualties Percentage of
Fatalities 1990 5,565 2,087 4,668 6,755 30.9 1991 6,865 2,395 6,846 9,241 25.9 1992 8,910 2,755 9,040 11,795 23.4 1993 11,016 3,440 11,519 14,959 23.0 1994 13,118 4,533 13,056 17,589 25.8 1995 15,376 5,430 16,920 22,350 24.3 1996 19,075 5,581 21,556 27,137 20.6 1997 19,159 5,680 21,905 27,585 20.6 1998 19,975 6,067 22,723 28,790 21.1
Source: Traffic Police
Table 4.2.16 Number of Accidents by Road Category (Analysis of 13,284 accidents in 1999)
Accidents Type of Road
Number % National Road 6,694 48.6 Provincial Road 2,784 20.2 Urban Road 2,676 19.4 Others 1,630 11.8 Total 13,784 100.0 Source: Traffic Police
Vietnam National Transport Strategy Study (VITRANSS) Final Report
Main Text, Volume 1
4-37
Table 4.2.17 Road Traffic Accidents by Cause
Accidents Causes
Number % Causes by the vehicle users 10,359 74.4 1) Exceeding the speed limit 2) Carelessness and/or wrong turning
and overtaking 3) Drunkenness 4) Inadequate observation
4,761 3,722
945 612 319
34.2 26.7 6.8 4.4 2.3
Vehicle could not ensure traffic safety 185 1.3 Others 3,378 24.3
Source: Analysis of 13,922 accidents
Table 4.2.18 Road Traffic Accidents by Mode1/
Accidents Mode Number %
Car 3,425 26.2 Motorcycle 8,130 62.3 Others 1,493 11.4 Source: Analysis of 13,048 accidents
Institutional Arrangement
At national level, there are two lead government organizations which share responsibility for road safety in Vietnam. These are the MOT and MOI. Cognizant of the need to coordinate the work of different agencies in the field of transport safety, the MOT and MOI jointly issued in 1991 Decree No. 104/QD-2B establishing the National Traffic Safety Committee (NTSC). In 1994, the VRA established a Traffic Safety Department and the MOT declared 1995 as the National Road Safety Year. The NTSC is responsible for planning projects on safety in all transport subsectors, i.e., road, rail, air, sea, and inland waterways. Its main functions (translated from Articles 2 in the Decree) are as follows:
• Drawing up plans and guiding all organizations within the MOT and MOI as well as
the other branches in the country to implement traffic safety measures including safety education and development of countermeasures.
• Ensuring the implementation of traffic safety measures in Provincial Traffic Safety Committees.
There are no specific pressure groups that lobby for improved traffic safety but the public do write to road authorities to complain about traffic matters, and the media publish news items about serious traffic accidents. However, road users tend to be relatively undisciplined compared to those in industrialized countries, implying that public concern and awareness of road safety issues is comparatively low.
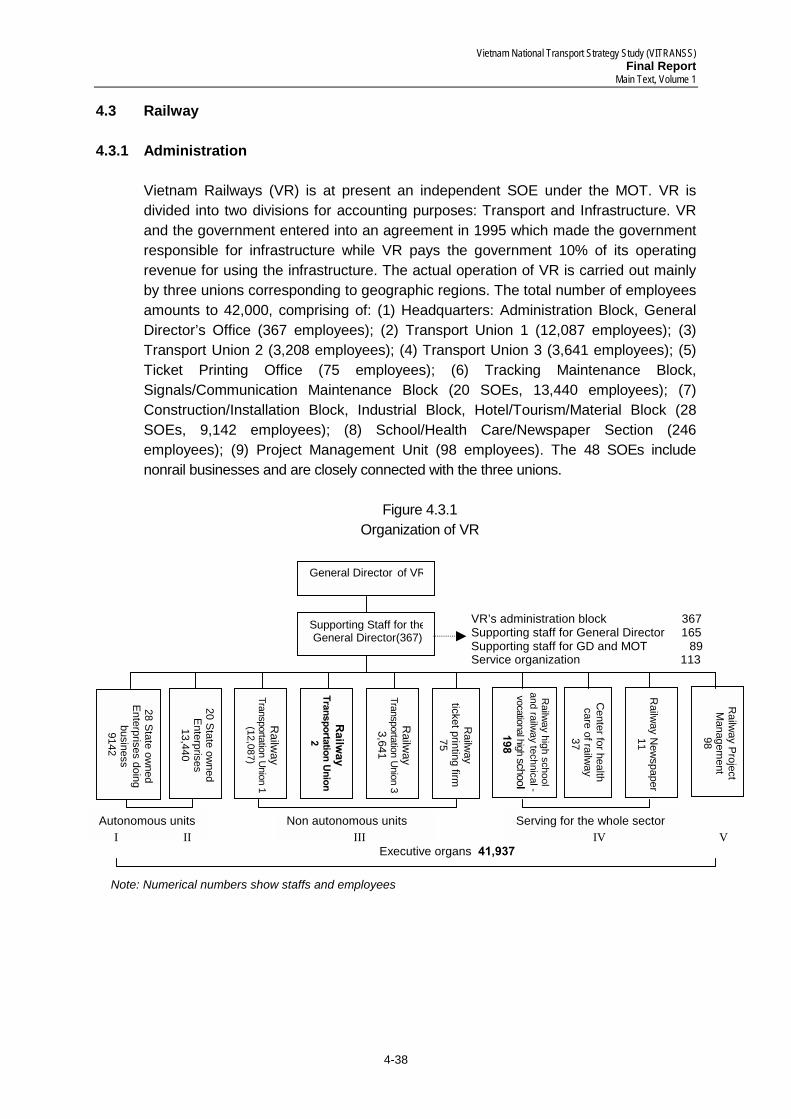
Vietnam National Transport Strategy Study (VITRANSS) Final Report
Main Text, Volume 1
4-38
4.3 Railway 4.3.1 Administration
Vietnam Railways (VR) is at present an independent SOE under the MOT. VR is divided into two divisions for accounting purposes: Transport and Infrastructure. VR and the government entered into an agreement in 1995 which made the government responsible for infrastructure while VR pays the government 10% of its operating revenue for using the infrastructure. The actual operation of VR is carried out mainly by three unions corresponding to geographic regions. The total number of employees amounts to 42,000, comprising of: (1) Headquarters: Administration Block, General Director’s Office (367 employees); (2) Transport Union 1 (12,087 employees); (3) Transport Union 2 (3,208 employees); (4) Transport Union 3 (3,641 employees); (5) Ticket Printing Office (75 employees); (6) Tracking Maintenance Block, Signals/Communication Maintenance Block (20 SOEs, 13,440 employees); (7) Construction/Installation Block, Industrial Block, Hotel/Tourism/Material Block (28 SOEs, 9,142 employees); (8) School/Health Care/Newspaper Section (246 employees); (9) Project Management Unit (98 employees). The 48 SOEs include nonrail businesses and are closely connected with the three unions.
Figure 4.3.1 Organization of VR
General Director of VR
Supporting Staff for theGeneral Director(367)
28 State owned
Enterprises doing business
9142
20 State owned
Enterprises 13,440
Railw
ay Transportation U
nion 1 (12,087)
!"#$%
"&''()"*+,-).".#-* '/
*#-*'0
1034
Railw
ay Transportation U
nion 3 3,641
Railw
ay ticket printing firm
75
Railw
ay high school and railw
ay technical -vocational high schoo$'
564'
Center for health care of railw
ay 37
Railw
ay Project M
anagement
98' R
ailway N
ewspaper
11
Autonomous units Non autonomous units Serving for the whole sector I II III IV � � � V
Executive organs '758619'
VR’s administration block 367 Supporting staff for General Director 165 Supporting staff for GD and MOT 89 Service organization 113
Note: Numerical numbers show staffs and employees
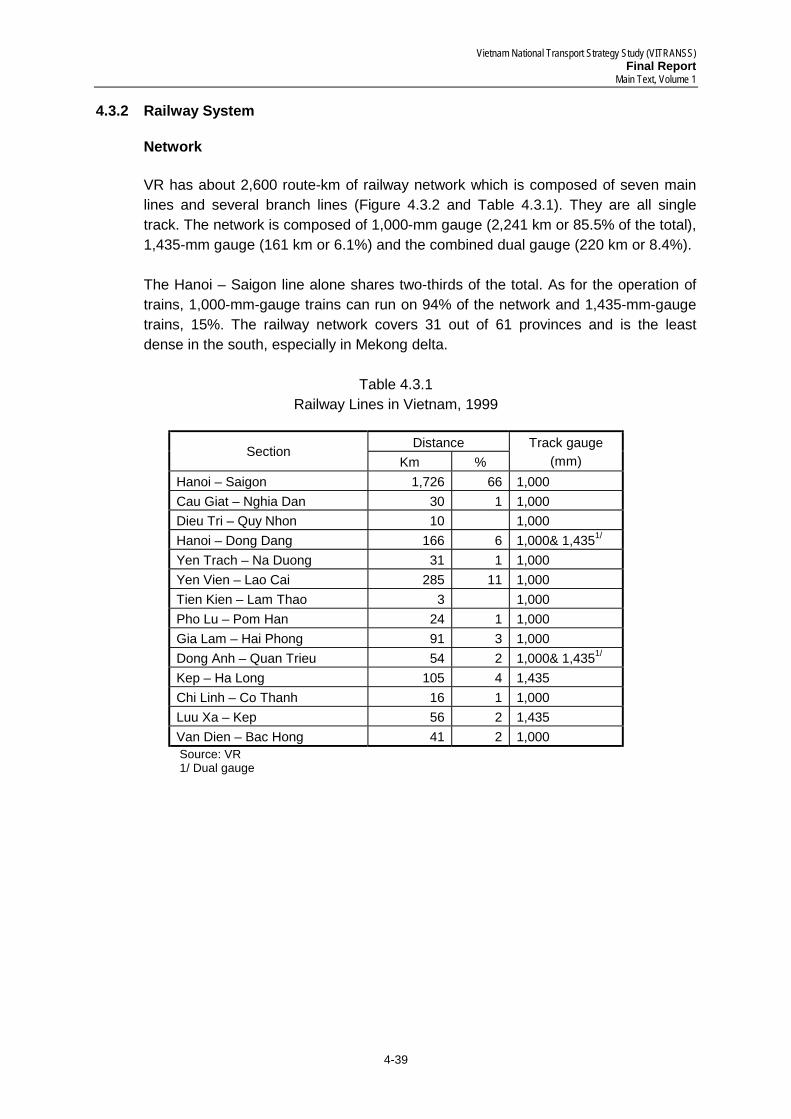
Vietnam National Transport Strategy Study (VITRANSS) Final Report
Main Text, Volume 1
4-39
4.3.2 Railway System
Network
VR has about 2,600 route-km of railway network which is composed of seven main lines and several branch lines (Figure 4.3.2 and Table 4.3.1). They are all single track. The network is composed of 1,000-mm gauge (2,241 km or 85.5% of the total), 1,435-mm gauge (161 km or 6.1%) and the combined dual gauge (220 km or 8.4%). The Hanoi – Saigon line alone shares two-thirds of the total. As for the operation of trains, 1,000-mm-gauge trains can run on 94% of the network and 1,435-mm-gauge trains, 15%. The railway network covers 31 out of 61 provinces and is the least dense in the south, especially in Mekong delta.
Table 4.3.1
Railway Lines in Vietnam, 1999
Distance Section Km %
Track gauge (mm)
Hanoi – Saigon 1,726 66 1,000 Cau Giat – Nghia Dan 30 1 1,000 Dieu Tri – Quy Nhon 10 1,000 Hanoi – Dong Dang 166 6 1,000& 1,4351/
Yen Trach – Na Duong 31 1 1,000 Yen Vien – Lao Cai 285 11 1,000 Tien Kien – Lam Thao 3 1,000 Pho Lu – Pom Han 24 1 1,000 Gia Lam – Hai Phong 91 3 1,000 Dong Anh – Quan Trieu 54 2 1,000& 1,4351/ Kep – Ha Long 105 4 1,435 Chi Linh – Co Thanh 16 1 1,000 Luu Xa – Kep 56 2 1,435 Van Dien – Bac Hong 41 2 1,000 Source: VR 1/ Dual gauge
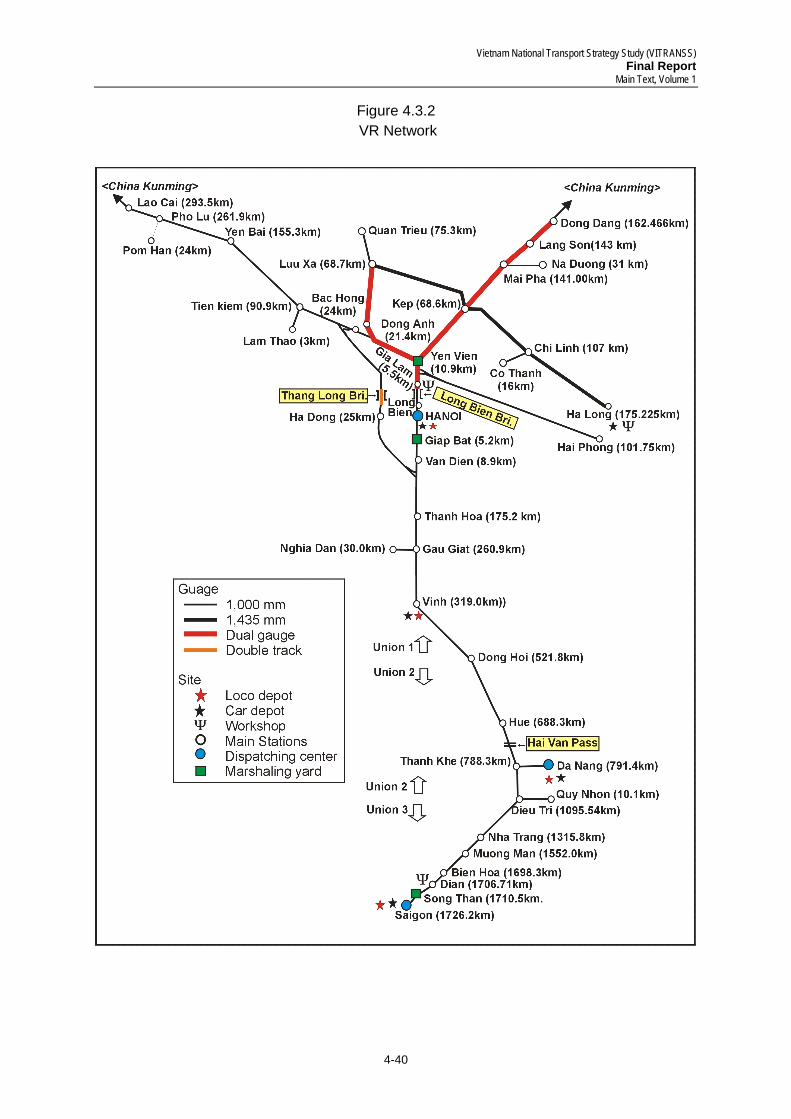
Vietnam National Transport Strategy Study (VITRANSS) Final Report
Main Text, Volume 1
4-40
Figure 4.3.2 VR Network
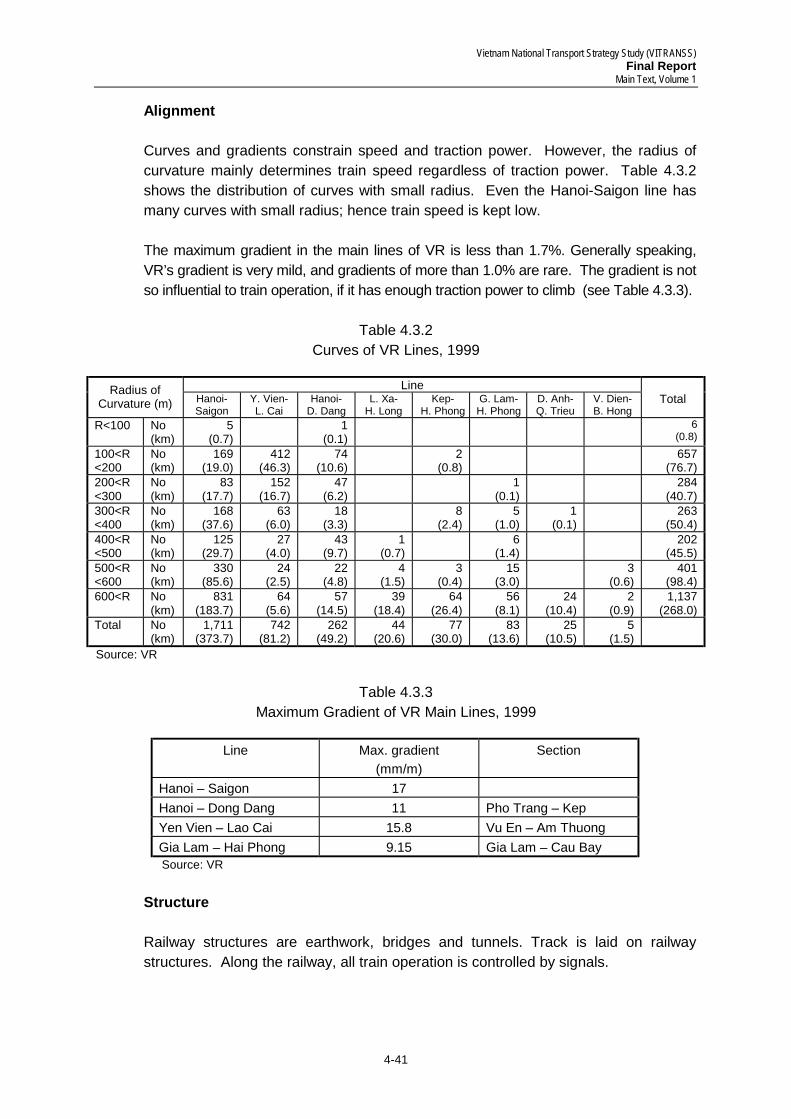
Vietnam National Transport Strategy Study (VITRANSS) Final Report
Main Text, Volume 1
4-41
Alignment
Curves and gradients constrain speed and traction power. However, the radius of curvature mainly determines train speed regardless of traction power. Table 4.3.2 shows the distribution of curves with small radius. Even the Hanoi-Saigon line has many curves with small radius; hence train speed is kept low. The maximum gradient in the main lines of VR is less than 1.7%. Generally speaking, VR’s gradient is very mild, and gradients of more than 1.0% are rare. The gradient is not so influential to train operation, if it has enough traction power to climb (see Table 4.3.3).
Table 4.3.2 Curves of VR Lines, 1999
Line Radius of
Curvature (m) Hanoi-Saigon
Y. Vien-L. Cai
Hanoi- D. Dang
L. Xa- H. Long
Kep- H. Phong
G. Lam- H. Phong
D. Anh-Q. Trieu
V. Dien-B. Hong
Total
R<100 No (km)
5 (0.7)
1 (0.1)
6 (0.8)
100<R<200
No (km)
169 (19.0)
412 (46.3)
74 (10.6)
2 (0.8)
657 (76.7)
200<R<300
No (km)
83 (17.7)
152 (16.7)
47 (6.2)
1 (0.1)
284 (40.7)
300<R<400
No (km)
168 (37.6)
63 (6.0)
18 (3.3)
8 (2.4)
5 (1.0)
1 (0.1)
263 (50.4)
400<R<500
No (km)
125 (29.7)
27 (4.0)
43 (9.7)
1 (0.7)
6 (1.4)
202 (45.5)
500<R<600
No (km)
330 (85.6)
24 (2.5)
22 (4.8)
4 (1.5)
3 (0.4)
15 (3.0)
3 (0.6)
401 (98.4)
600<R No (km)
831 (183.7)
64 (5.6)
57 (14.5)
39 (18.4)
64 (26.4)
56 (8.1)
24 (10.4)
2 (0.9)
1,137 (268.0)
Total No (km)
1,711 (373.7)
742 (81.2)
262 (49.2)
44 (20.6)
77 (30.0)
83 (13.6)
25 (10.5)
5 (1.5)
Source: VR
Table 4.3.3 Maximum Gradient of VR Main Lines, 1999
Line Max. gradient
(mm/m) Section
Hanoi – Saigon 17 Hanoi – Dong Dang 11 Pho Trang – Kep Yen Vien – Lao Cai 15.8 Vu En – Am Thuong Gia Lam – Hai Phong 9.15 Gia Lam – Cau Bay Source: VR
Structure
Railway structures are earthwork, bridges and tunnels. Track is laid on railway structures. Along the railway, all train operation is controlled by signals.
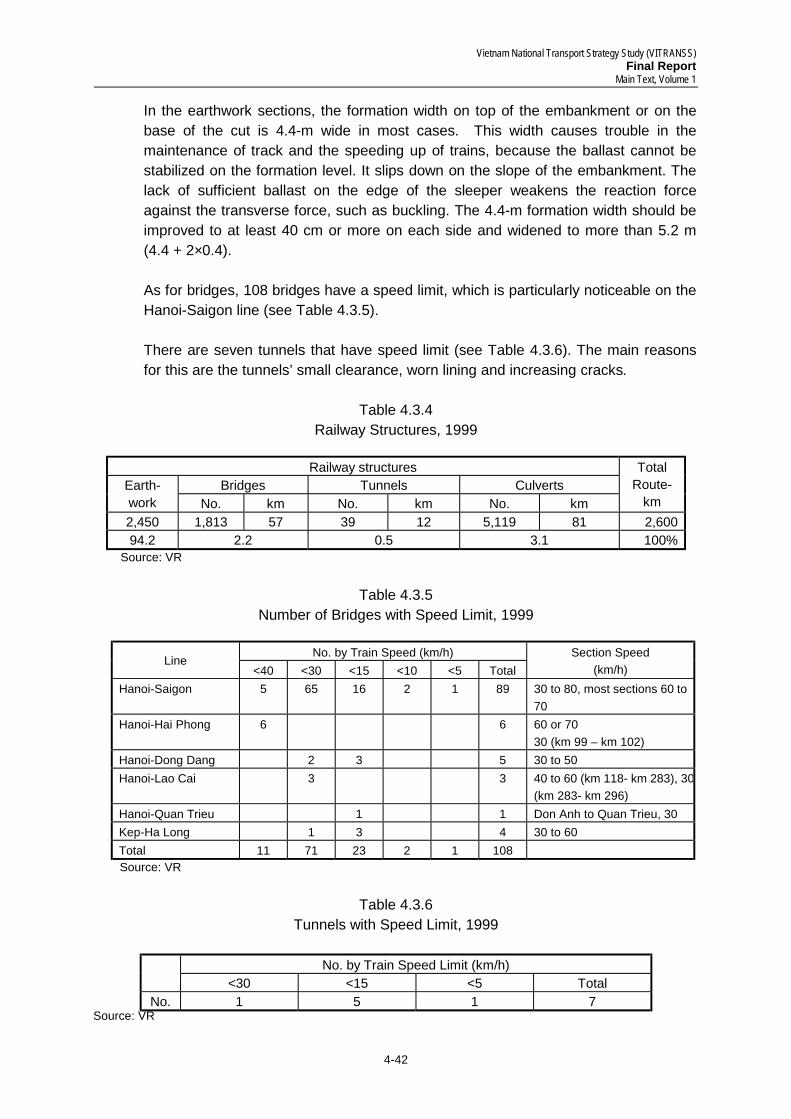
Vietnam National Transport Strategy Study (VITRANSS) Final Report
Main Text, Volume 1
4-42
Source: VR
In the earthwork sections, the formation width on top of the embankment or on the base of the cut is 4.4-m wide in most cases. This width causes trouble in the maintenance of track and the speeding up of trains, because the ballast cannot be stabilized on the formation level. It slips down on the slope of the embankment. The lack of sufficient ballast on the edge of the sleeper weakens the reaction force against the transverse force, such as buckling. The 4.4-m formation width should be improved to at least 40 cm or more on each side and widened to more than 5.2 m (4.4 + 2×0.4).
As for bridges, 108 bridges have a speed limit, which is particularly noticeable on the Hanoi-Saigon line (see Table 4.3.5). There are seven tunnels that have speed limit (see Table 4.3.6). The main reasons for this are the tunnels’ small clearance, worn lining and increasing cracks.
Table 4.3.4 Railway Structures, 1999
Railway structures
Bridges Tunnels Culverts Earth-work No. km No. km No. km
Total Route-
km 2,450 1,813 57 39 12 5,119 81 2,600 94.2 2.2 0.5 3.1 100%
Source: VR
Table 4.3.5 Number of Bridges with Speed Limit, 1999
No. by Train Speed (km/h) Line
<40 <30 <15 <10 <5 Total Section Speed
(km/h) Hanoi-Saigon 5 65 16 2 1 89 30 to 80, most sections 60 to
70 Hanoi-Hai Phong 6 6 60 or 70
30 (km 99 – km 102) Hanoi-Dong Dang 2 3 5 30 to 50 Hanoi-Lao Cai 3 3 40 to 60 (km 118- km 283), 30
(km 283- km 296) Hanoi-Quan Trieu 1 1 Don Anh to Quan Trieu, 30 Kep-Ha Long 1 3 4 30 to 60 Total 11 71 23 2 1 108 Source: VR
Table 4.3.6
Tunnels with Speed Limit, 1999
No. by Train Speed Limit (km/h) <30 <15 <5 Total
No. 1 5 1 7
Vietnam National Transport Strategy Study (VITRANSS) Final Report
Main Text, Volume 1
4-43
Track Track consists of rail, fastening, sleeper, and ballast. VR uses 27 kg/m, 30 kg/m, 38kg/m, and 43 kg/m rails. The heavy 38 and 43 kg/m rail is used only in the Hanoi-Saigon line. VR uses four types of sleepers: wood, steel, two-block concrete, and pre-stressed concrete. Its length is 1.8 m. Fastening type depends on the type of sleeper. Ballast thickness under the sleeper is determined at 30 cm in the maintenance manual. But in some city sections, the thickness is far less than this standard. The reason for the shortage of edge ballast is the inadequate width of the formation level (4.4 m) and insufficient supply of ballast.
Signal and Communications VR has installed automatic blocking system only between Hanoi and Yen Vien. In other sections or lines, VR adopts a token or semi-automatic blocking system. VR is replacing the system to token-less blocking and has a plan to finish it by 2000. VR also uses color signaling and semaphore signaling which basically indicates two directions: “Go” (Green) and “Stop” (Red). Distant signals are installed in some stations. Almost all lines are equipped with automatic (electric) interlocking system, others are of the mechanical system. Most of the switchboards at stations are mechanical. At present, only 10 digital electronic switchboards have been installed on the Hanoi-Saigon line. Only Vinh station has an electric control center. A railway telephone system is used all over the railway network, while a dispatcher telephone system connects dispatching centers with each station. Aerial bare wire is used for the telephone system.
Rolling Stock Nearly 100% of VR’s train operation is on the 1000-mm gauge section. 1) Locomotive: VR owns 339 diesel locomotives, 332 of which are for the 1000-mm
gauge and seven for the 1435-mm gauge. The type and number of diesel locomotives are shown in Table 4.3.7. Diesel locomotives are used for all trains. These were imported from the former USSR, Australia, USA, Romania, Czech Republic, India, and Belgium. The year they were manufactured ranged from 1963 to 1990. These locomotives are in poor operating condition. Some are deteriorated: Ten percent (10%) of D4H units are not operable. Their design speed is low (50 km/h) and their power is only 400 HP.
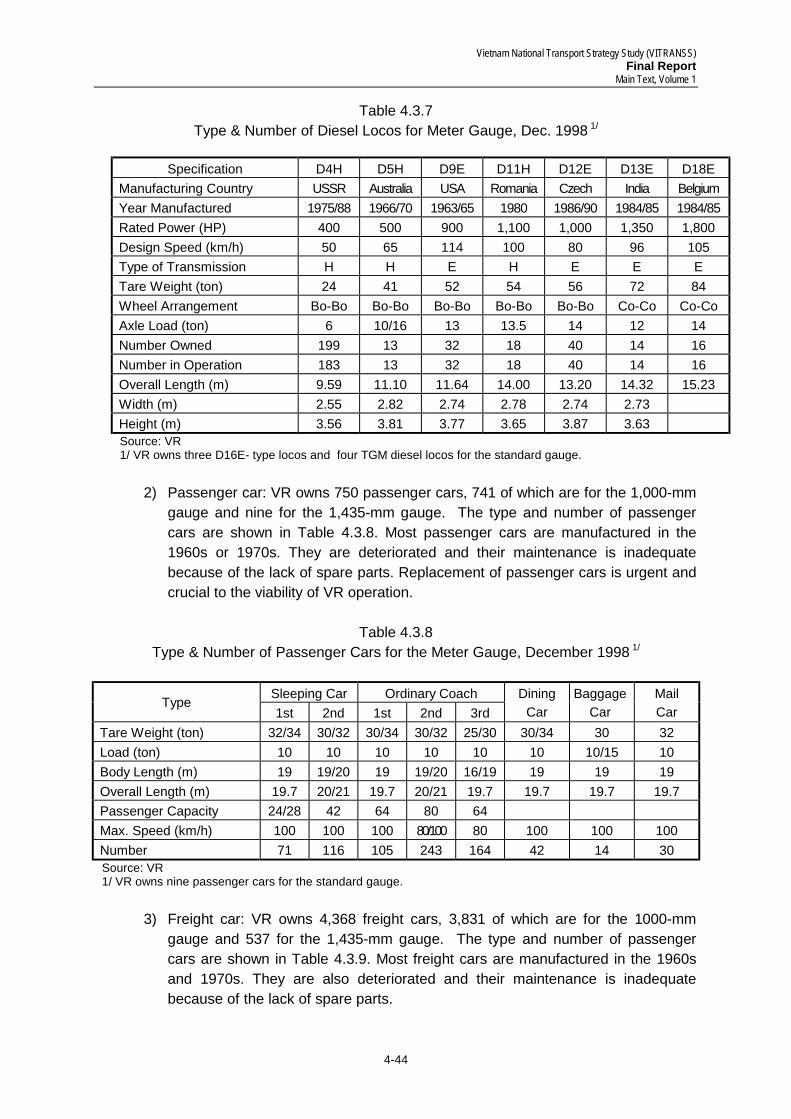
Vietnam National Transport Strategy Study (VITRANSS) Final Report
Main Text, Volume 1
4-44
Table 4.3.7 Type & Number of Diesel Locos for Meter Gauge, Dec. 1998 1/
Specification D4H D5H D9E D11H D12E D13E D18E Manufacturing Country USSR Australia USA Romania Czech India Belgium Year Manufactured 1975/88 1966/70 1963/65 1980 1986/90 1984/85 1984/85 Rated Power (HP) 400 500 900 1,100 1,000 1,350 1,800 Design Speed (km/h) 50 65 114 100 80 96 105 Type of Transmission H H E H E E E Tare Weight (ton) 24 41 52 54 56 72 84 Wheel Arrangement Bo-Bo Bo-Bo Bo-Bo Bo-Bo Bo-Bo Co-Co Co-Co Axle Load (ton) 6 10/16 13 13.5 14 12 14 Number Owned 199 13 32 18 40 14 16 Number in Operation 183 13 32 18 40 14 16 Overall Length (m) 9.59 11.10 11.64 14.00 13.20 14.32 15.23 Width (m) 2.55 2.82 2.74 2.78 2.74 2.73 Height (m) 3.56 3.81 3.77 3.65 3.87 3.63 Source: VR
1/ VR owns three D16E- type locos and four TGM diesel locos for the standard gauge. 2) Passenger car: VR owns 750 passenger cars, 741 of which are for the 1,000-mm
gauge and nine for the 1,435-mm gauge. The type and number of passenger cars are shown in Table 4.3.8. Most passenger cars are manufactured in the 1960s or 1970s. They are deteriorated and their maintenance is inadequate because of the lack of spare parts. Replacement of passenger cars is urgent and crucial to the viability of VR operation.
Table 4.3.8 Type & Number of Passenger Cars for the Meter Gauge, December 1998 1/
Sleeping Car Ordinary Coach Type 1st 2nd 1st 2nd 3rd
Dining Car
Baggage Car
Mail Car
Tare Weight (ton) 32/34 30/32 30/34 30/32 25/30 30/34 30 32 Load (ton) 10 10 10 10 10 10 10/15 10 Body Length (m) 19 19/20 19 19/20 16/19 19 19 19 Overall Length (m) 19.7 20/21 19.7 20/21 19.7 19.7 19.7 19.7 Passenger Capacity 24/28 42 64 80 64 Max. Speed (km/h) 100 100 100 80/100 80 100 100 100 Number 71 116 105 243 164 42 14 30 Source: VR 1/ VR owns nine passenger cars for the standard gauge.
3) Freight car: VR owns 4,368 freight cars, 3,831 of which are for the 1000-mm
gauge and 537 for the 1,435-mm gauge. The type and number of passenger cars are shown in Table 4.3.9. Most freight cars are manufactured in the 1960s and 1970s. They are also deteriorated and their maintenance is inadequate because of the lack of spare parts.
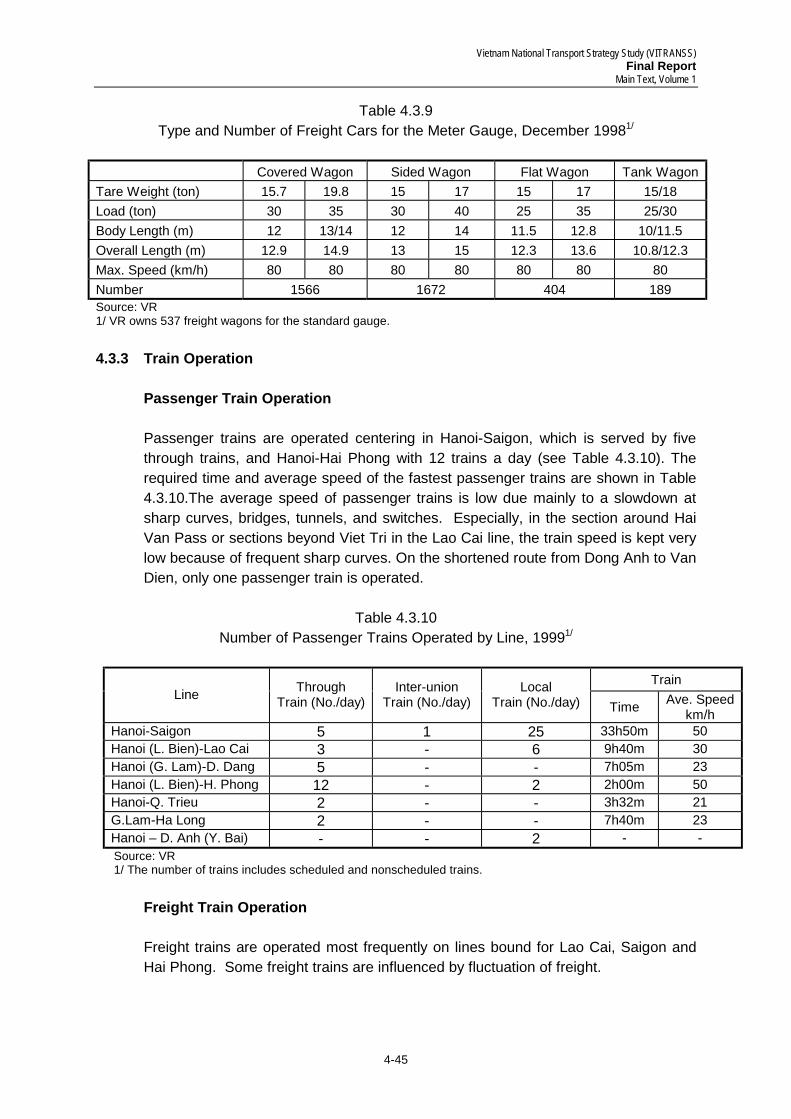
Vietnam National Transport Strategy Study (VITRANSS) Final Report
Main Text, Volume 1
4-45
Table 4.3.9 Type and Number of Freight Cars for the Meter Gauge, December 19981/
Covered Wagon Sided Wagon Flat Wagon Tank Wagon
Tare Weight (ton) 15.7 19.8 15 17 15 17 15/18 Load (ton) 30 35 30 40 25 35 25/30 Body Length (m) 12 13/14 12 14 11.5 12.8 10/11.5 Overall Length (m) 12.9 14.9 13 15 12.3 13.6 10.8/12.3 Max. Speed (km/h) 80 80 80 80 80 80 80 Number 1566 1672 404 189 Source: VR 1/ VR owns 537 freight wagons for the standard gauge. 4.3.3 Train Operation
Passenger Train Operation Passenger trains are operated centering in Hanoi-Saigon, which is served by five through trains, and Hanoi-Hai Phong with 12 trains a day (see Table 4.3.10). The required time and average speed of the fastest passenger trains are shown in Table 4.3.10.The average speed of passenger trains is low due mainly to a slowdown at sharp curves, bridges, tunnels, and switches. Especially, in the section around Hai Van Pass or sections beyond Viet Tri in the Lao Cai line, the train speed is kept very low because of frequent sharp curves. On the shortened route from Dong Anh to Van Dien, only one passenger train is operated.
Table 4.3.10
Number of Passenger Trains Operated by Line, 19991/
Train Line Through
Train (No./day) Inter-union
Train (No./day) Local
Train (No./day) Time Ave. Speed km/h
Hanoi-Saigon 5 1 25 33h50m 50 Hanoi (L. Bien)-Lao Cai 3 - 6 9h40m 30 Hanoi (G. Lam)-D. Dang 5 - - 7h05m 23 Hanoi (L. Bien)-H. Phong 12 - 2 2h00m 50 Hanoi-Q. Trieu 2 - - 3h32m 21 G.Lam-Ha Long 2 - - 7h40m 23 Hanoi – D. Anh (Y. Bai) - - 2 - - Source: VR 1/ The number of trains includes scheduled and nonscheduled trains.
Freight Train Operation
Freight trains are operated most frequently on lines bound for Lao Cai, Saigon and Hai Phong. Some freight trains are influenced by fluctuation of freight.
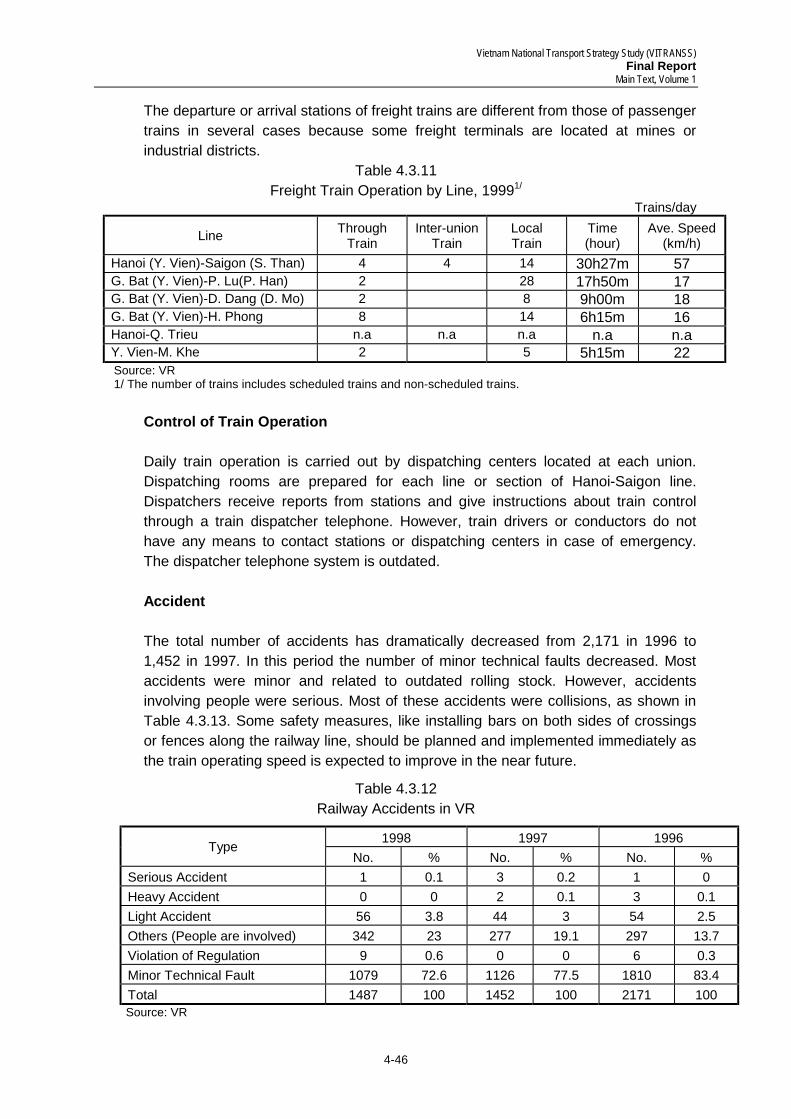
Vietnam National Transport Strategy Study (VITRANSS) Final Report
Main Text, Volume 1
4-46
The departure or arrival stations of freight trains are different from those of passenger trains in several cases because some freight terminals are located at mines or industrial districts.
Table 4.3.11 Freight Train Operation by Line, 19991/
Trains/day
Line Through Train
Inter-union Train
Local Train
Time (hour)
Ave. Speed (km/h)
Hanoi (Y. Vien)-Saigon (S. Than) 4 4 14 30h27m 57 G. Bat (Y. Vien)-P. Lu(P. Han) 2 28 17h50m 17 G. Bat (Y. Vien)-D. Dang (D. Mo) 2 8 9h00m 18 G. Bat (Y. Vien)-H. Phong 8 14 6h15m 16 Hanoi-Q. Trieu n.a n.a n.a n.a n.a Y. Vien-M. Khe 2 5 5h15m 22 Source: VR 1/ The number of trains includes scheduled trains and non-scheduled trains.
Control of Train Operation Daily train operation is carried out by dispatching centers located at each union. Dispatching rooms are prepared for each line or section of Hanoi-Saigon line. Dispatchers receive reports from stations and give instructions about train control through a train dispatcher telephone. However, train drivers or conductors do not have any means to contact stations or dispatching centers in case of emergency. The dispatcher telephone system is outdated. Accident The total number of accidents has dramatically decreased from 2,171 in 1996 to 1,452 in 1997. In this period the number of minor technical faults decreased. Most accidents were minor and related to outdated rolling stock. However, accidents involving people were serious. Most of these accidents were collisions, as shown in Table 4.3.13. Some safety measures, like installing bars on both sides of crossings or fences along the railway line, should be planned and implemented immediately as the train operating speed is expected to improve in the near future.
Table 4.3.12 Railway Accidents in VR
1998 1997 1996 Type No. % No. % No. %
Serious Accident 1 0.1 3 0.2 1 0 Heavy Accident 0 0 2 0.1 3 0.1 Light Accident 56 3.8 44 3 54 2.5 Others (People are involved) 342 23 277 19.1 297 13.7 Violation of Regulation 9 0.6 0 0 6 0.3 Minor Technical Fault 1079 72.6 1126 77.5 1810 83.4 Total 1487 100 1452 100 2171 100 Source: VR
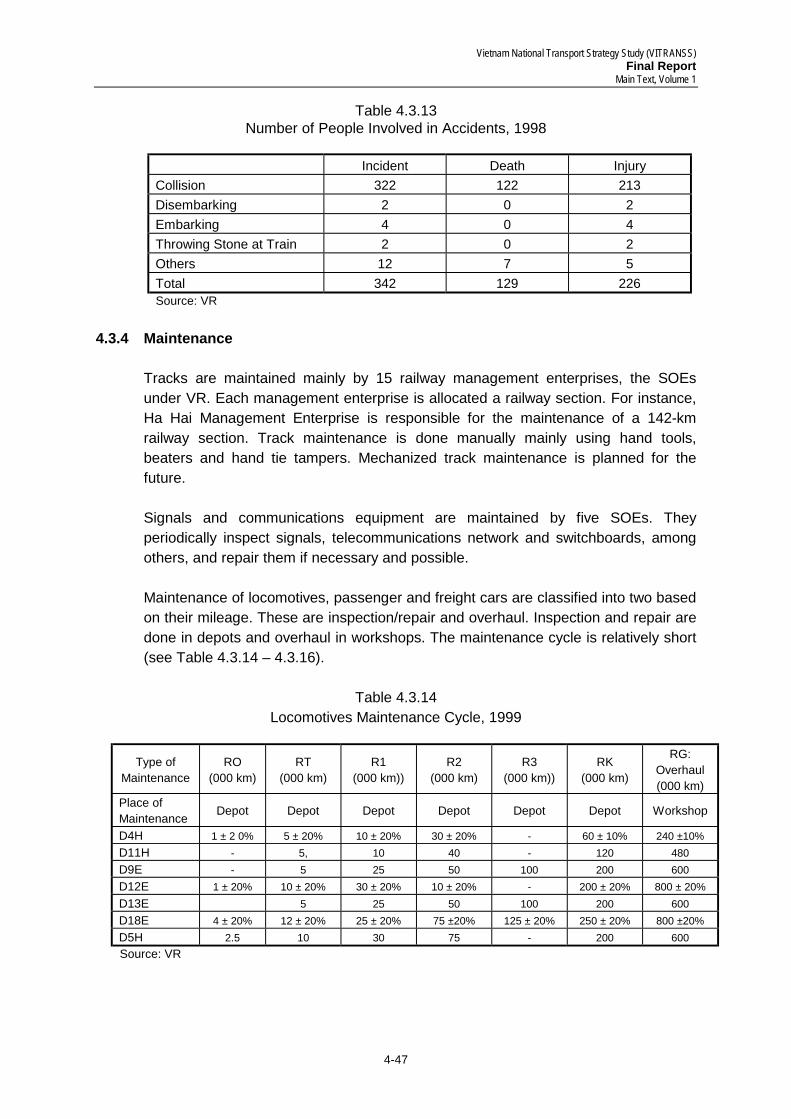
Vietnam National Transport Strategy Study (VITRANSS) Final Report
Main Text, Volume 1
4-47
Table 4.3.13 Number of People Involved in Accidents, 1998
Incident Death Injury Collision 322 122 213 Disembarking 2 0 2 Embarking 4 0 4 Throwing Stone at Train 2 0 2 Others 12 7 5 Total 342 129 226 Source: VR
4.3.4 Maintenance
Tracks are maintained mainly by 15 railway management enterprises, the SOEs under VR. Each management enterprise is allocated a railway section. For instance, Ha Hai Management Enterprise is responsible for the maintenance of a 142-km railway section. Track maintenance is done manually mainly using hand tools, beaters and hand tie tampers. Mechanized track maintenance is planned for the future. Signals and communications equipment are maintained by five SOEs. They periodically inspect signals, telecommunications network and switchboards, among others, and repair them if necessary and possible. Maintenance of locomotives, passenger and freight cars are classified into two based on their mileage. These are inspection/repair and overhaul. Inspection and repair are done in depots and overhaul in workshops. The maintenance cycle is relatively short (see Table 4.3.14 – 4.3.16).
Table 4.3.14
Locomotives Maintenance Cycle, 1999
Type of Maintenance
RO (000 km)
RT (000 km)
R1 (000 km))
R2 (000 km)
R3 (000 km))
RK (000 km)
RG: Overhaul (000 km)
Place of Maintenance Depot Depot Depot Depot Depot Depot Workshop
D4H 1 ± 2 0% 5 ± 20% 10 ± 20% 30 ± 20% - 60 ± 10% 240 ±10% D11H - 5, 10 40 - 120 480 D9E - 5 25 50 100 200 600 D12E 1 ± 20% 10 ± 20% 30 ± 20% 10 ± 20% - 200 ± 20% 800 ± 20% D13E 5 25 50 100 200 600 D18E 4 ± 20% 12 ± 20% 25 ± 20% 75 ±20% 125 ± 20% 250 ± 20% 800 ±20% D5H 2.5 10 30 75 - 200 600 Source: VR
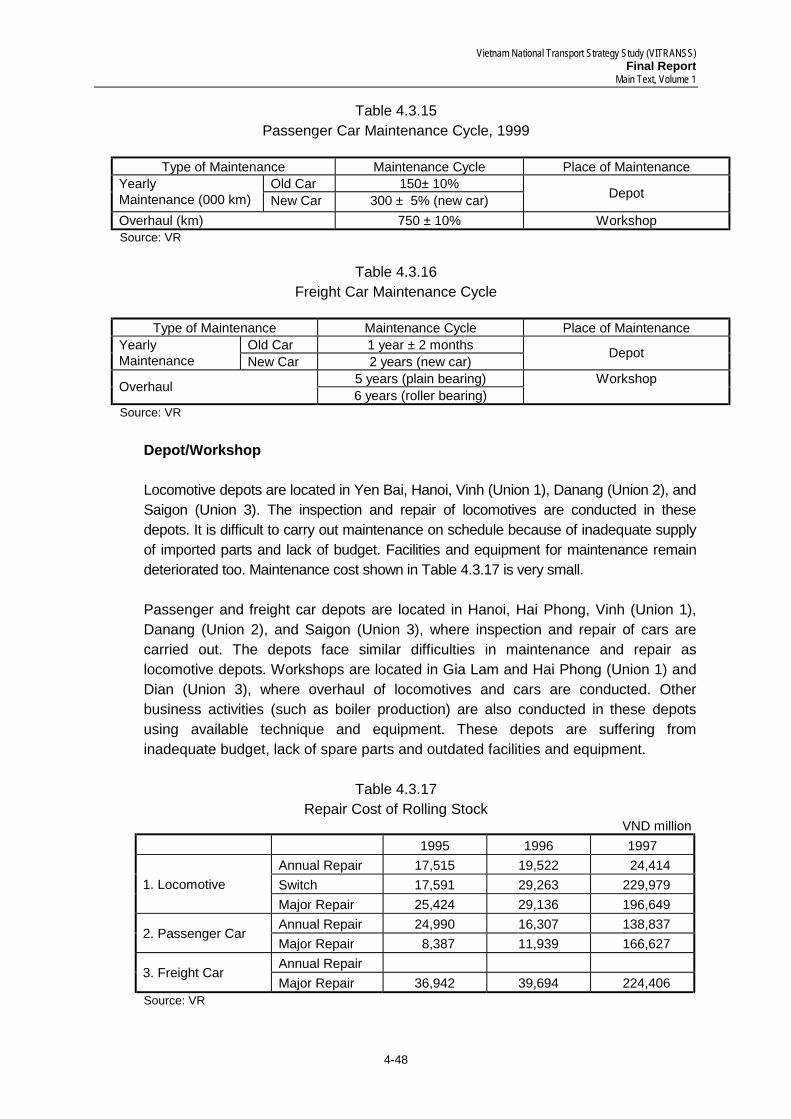
Vietnam National Transport Strategy Study (VITRANSS) Final Report
Main Text, Volume 1
4-48
Table 4.3.15 Passenger Car Maintenance Cycle, 1999
Type of Maintenance Maintenance Cycle Place of Maintenance
Old Car 150± 10% Yearly Maintenance (000 km) New Car 300 ± 5% (new car) Depot
Overhaul (km) 750 ± 10% Workshop Source: VR
Table 4.3.16
Freight Car Maintenance Cycle
Type of Maintenance Maintenance Cycle Place of Maintenance Old Car 1 year ± 2 months Yearly
Maintenance New Car 2 years (new car) Depot
5 years (plain bearing) Overhaul 6 years (roller bearing) Workshop
Source: VR Depot/Workshop Locomotive depots are located in Yen Bai, Hanoi, Vinh (Union 1), Danang (Union 2), and Saigon (Union 3). The inspection and repair of locomotives are conducted in these depots. It is difficult to carry out maintenance on schedule because of inadequate supply of imported parts and lack of budget. Facilities and equipment for maintenance remain deteriorated too. Maintenance cost shown in Table 4.3.17 is very small. Passenger and freight car depots are located in Hanoi, Hai Phong, Vinh (Union 1), Danang (Union 2), and Saigon (Union 3), where inspection and repair of cars are carried out. The depots face similar difficulties in maintenance and repair as locomotive depots. Workshops are located in Gia Lam and Hai Phong (Union 1) and Dian (Union 3), where overhaul of locomotives and cars are conducted. Other business activities (such as boiler production) are also conducted in these depots using available technique and equipment. These depots are suffering from inadequate budget, lack of spare parts and outdated facilities and equipment.
Table 4.3.17 Repair Cost of Rolling Stock
VND million 1995 1996 1997
Annual Repair 17,515 19,522 24,414 Switch 17,591 29,263 229,979 1. Locomotive Major Repair 25,424 29,136 196,649 Annual Repair 24,990 16,307 138,837
2. Passenger Car Major Repair 8,387 11,939 166,627 Annual Repair
3. Freight Car Major Repair 36,942 39,694 224,406
Source: VR
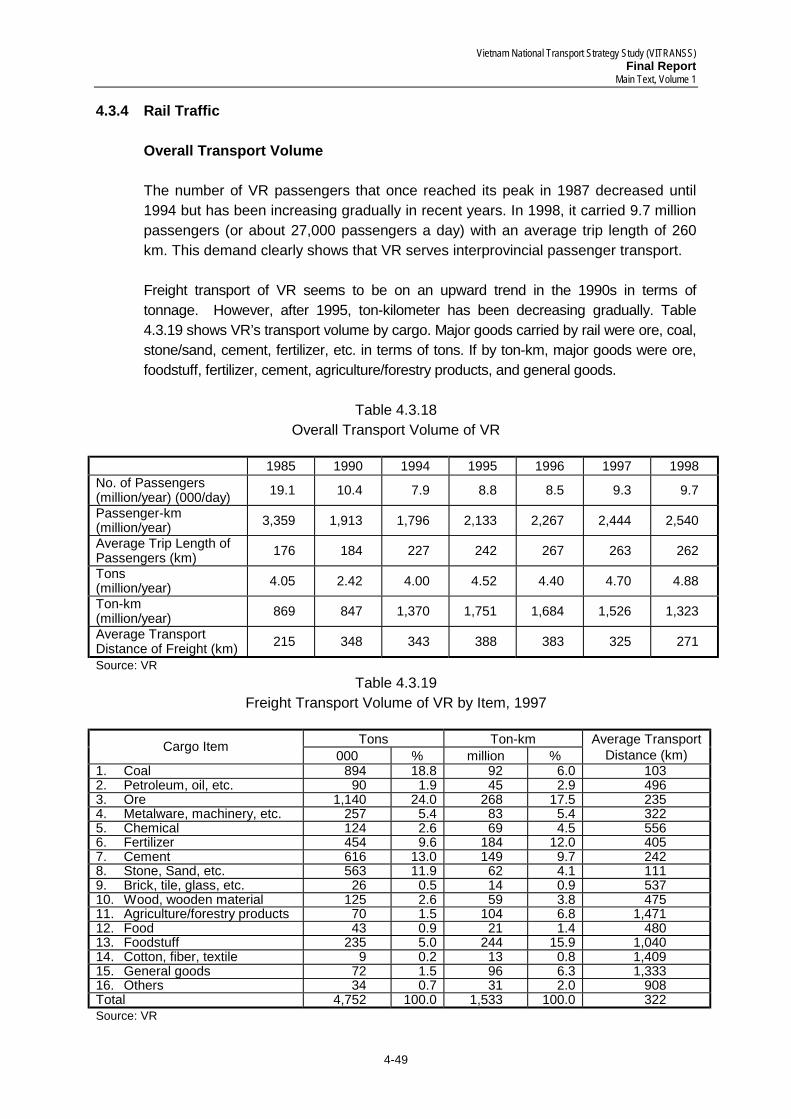
Vietnam National Transport Strategy Study (VITRANSS) Final Report
Main Text, Volume 1
4-49
4.3.4 Rail Traffic Overall Transport Volume The number of VR passengers that once reached its peak in 1987 decreased until 1994 but has been increasing gradually in recent years. In 1998, it carried 9.7 million passengers (or about 27,000 passengers a day) with an average trip length of 260 km. This demand clearly shows that VR serves interprovincial passenger transport. Freight transport of VR seems to be on an upward trend in the 1990s in terms of tonnage. However, after 1995, ton-kilometer has been decreasing gradually. Table 4.3.19 shows VR’s transport volume by cargo. Major goods carried by rail were ore, coal, stone/sand, cement, fertilizer, etc. in terms of tons. If by ton-km, major goods were ore, foodstuff, fertilizer, cement, agriculture/forestry products, and general goods.
Table 4.3.18
Overall Transport Volume of VR
1985 1990 1994 1995 1996 1997 1998 No. of Passengers (million/year) (000/day) 19.1 10.4 7.9 8.8 8.5 9.3 9.7
Passenger-km (million/year) 3,359 1,913 1,796 2,133 2,267 2,444 2,540
Average Trip Length of Passengers (km) 176 184 227 242 267 263 262
Tons (million/year) 4.05 2.42 4.00 4.52 4.40 4.70 4.88
Ton-km (million/year) 869 847 1,370 1,751 1,684 1,526 1,323
Average Transport Distance of Freight (km) 215 348 343 388 383 325 271
Source: VR Table 4.3.19
Freight Transport Volume of VR by Item, 1997
Tons Ton-km Cargo Item 000 % million %
Average Transport Distance (km)
1. Coal 894 18.8 92 6.0 103 2. Petroleum, oil, etc. 90 1.9 45 2.9 496 3. Ore 1,140 24.0 268 17.5 235 4. Metalware, machinery, etc. 257 5.4 83 5.4 322 5. Chemical 124 2.6 69 4.5 556 6. Fertilizer 454 9.6 184 12.0 405 7. Cement 616 13.0 149 9.7 242 8. Stone, Sand, etc. 563 11.9 62 4.1 111 9. Brick, tile, glass, etc. 26 0.5 14 0.9 537 10. Wood, wooden material 125 2.6 59 3.8 475 11. Agriculture/forestry products 70 1.5 104 6.8 1,471 12. Food 43 0.9 21 1.4 480 13. Foodstuff 235 5.0 244 15.9 1,040 14. Cotton, fiber, textile 9 0.2 13 0.8 1,409 15. General goods 72 1.5 96 6.3 1,333 16. Others 34 0.7 31 2.0 908 Total 4,752 100.0 1,533 100.0 322 Source: VR
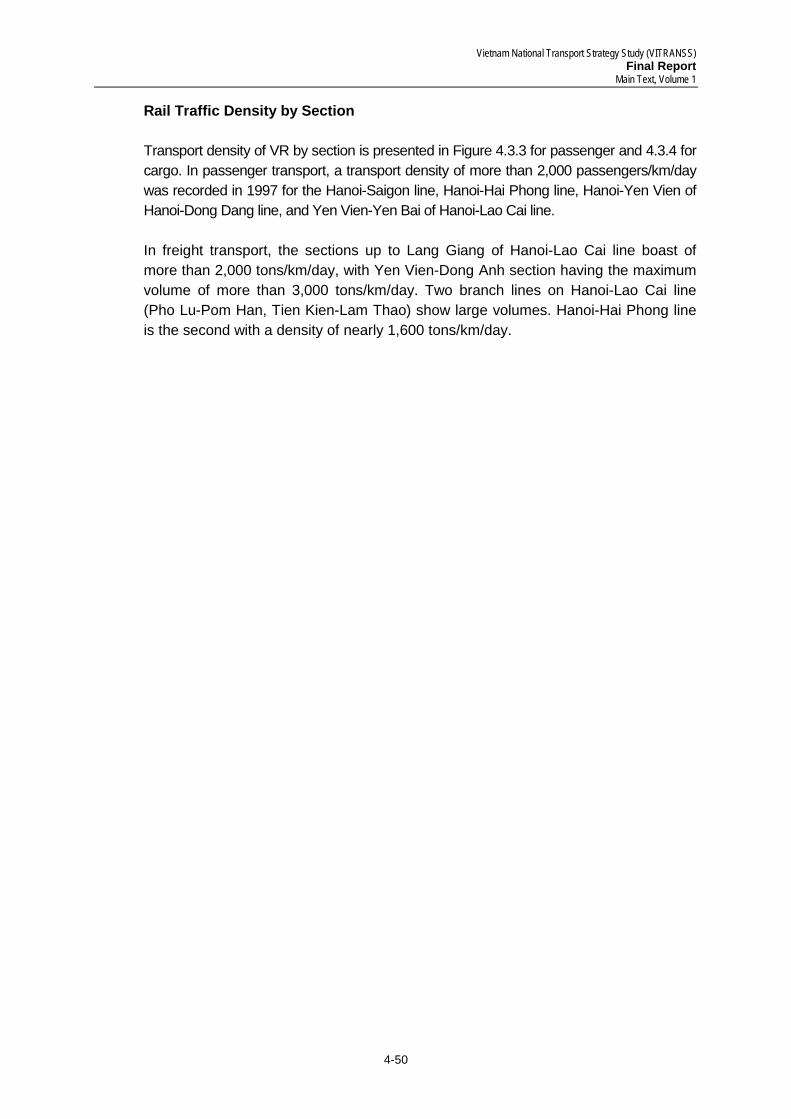
Vietnam National Transport Strategy Study (VITRANSS) Final Report
Main Text, Volume 1
4-50
Rail Traffic Density by Section Transport density of VR by section is presented in Figure 4.3.3 for passenger and 4.3.4 for cargo. In passenger transport, a transport density of more than 2,000 passengers/km/day was recorded in 1997 for the Hanoi-Saigon line, Hanoi-Hai Phong line, Hanoi-Yen Vien of Hanoi-Dong Dang line, and Yen Vien-Yen Bai of Hanoi-Lao Cai line. In freight transport, the sections up to Lang Giang of Hanoi-Lao Cai line boast of more than 2,000 tons/km/day, with Yen Vien-Dong Anh section having the maximum volume of more than 3,000 tons/km/day. Two branch lines on Hanoi-Lao Cai line (Pho Lu-Pom Han, Tien Kien-Lam Thao) show large volumes. Hanoi-Hai Phong line is the second with a density of nearly 1,600 tons/km/day.
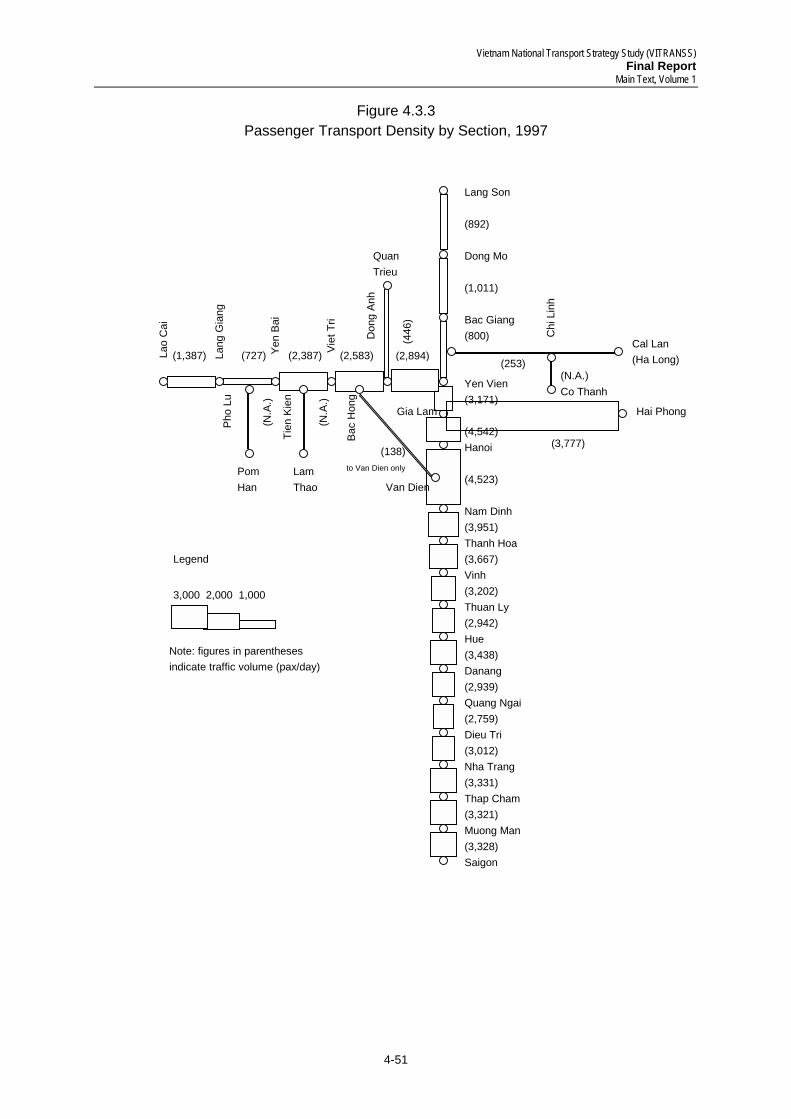
Vietnam National Transport Strategy Study (VITRANSS) Final Report
Main Text, Volume 1
4-51
Figure 4.3.3 Passenger Transport Density by Section, 1997
(2,387) (2,583) (727)(1,387)
Lang Son (892) Dong Mo (1,011) Bac Giang (800) Yen Vien (3,171) (4,542) Hanoi (4,523) Nam Dinh (3,951) Thanh Hoa (3,667) Vinh (3,202) Thuan Ly (2,942) Hue (3,438) Danang (2,939) Quang Ngai (2,759) Dieu Tri (3,012) Nha Trang (3,331) Thap Cham (3,321) Muong Man (3,328) Saigon
Don
g An
h
Viet
Tri
Yen
Bai
Lang
Gia
ng
Lao
Cai
Gia Lam
Quan Trieu
Bac
Hon
g
Tien
Kie
n
Pho
Lu
Lam Thao
Pom Han
Hai Phong
Cal Lan (Ha Long)
Chi
Lin
h
(N.A.) Co Thanh
Van Dien
(138) to Van Dien only
(3,777)
(446
)
(2,894)
(N.A
.)
(N.A
.)
(253)
Legend
Note: figures in parentheses indicate traffic volume (pax/day)
3,000 2,000 1,000
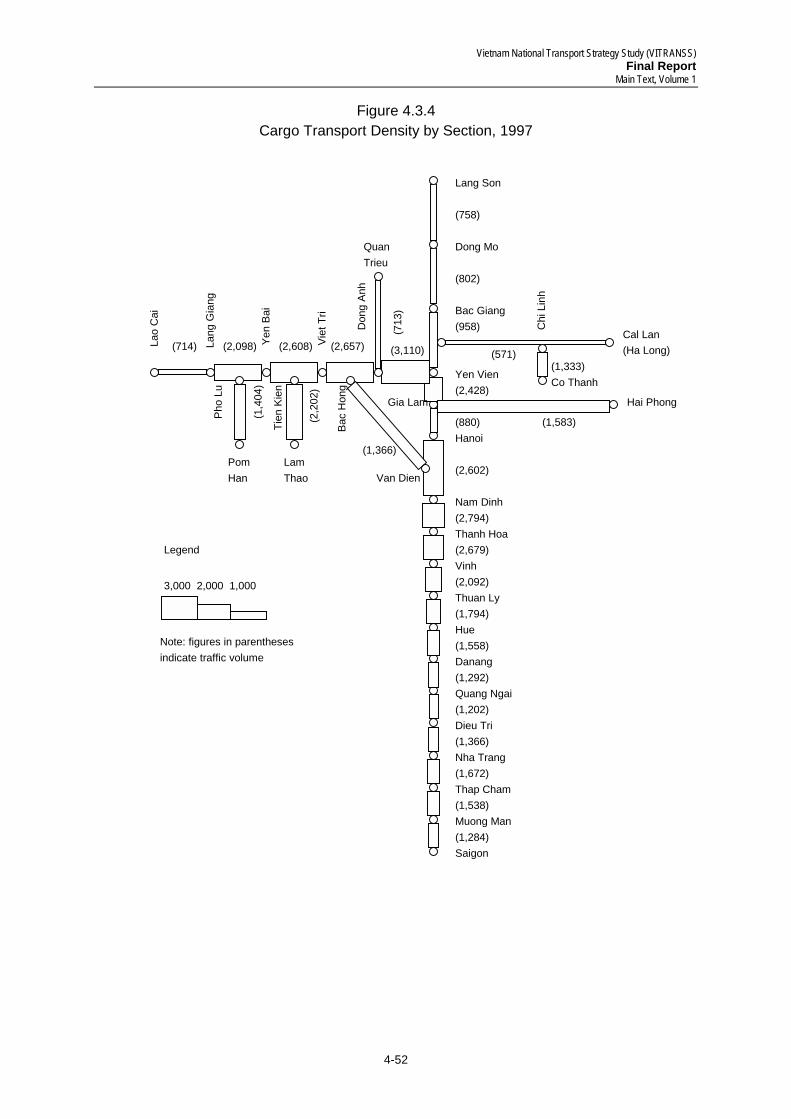
Vietnam National Transport Strategy Study (VITRANSS) Final Report
Main Text, Volume 1
4-52
Figure 4.3.4 Cargo Transport Density by Section, 1997
(2,608) (2,657) (2,098) (714)
Lang Son (758) Dong Mo (802) Bac Giang (958) Yen Vien (2,428) (880) Hanoi (2,602) Nam Dinh (2,794) Thanh Hoa (2,679) Vinh (2,092) Thuan Ly (1,794) Hue (1,558) Danang (1,292) Quang Ngai (1,202) Dieu Tri (1,366) Nha Trang (1,672) Thap Cham (1,538) Muong Man (1,284) Saigon
Don
g An
h
Viet
Tri
Yen
Bai
Lang
Gia
ng
Lao
Cai
Gia Lam
Quan Trieu
Bac
Hon
g
Tien
Kie
n
Pho
Lu
Lam Thao
Pom Han
Hai Phong
Cal Lan (Ha Long)
Chi
Lin
h
(1,333) Co Thanh
Van Dien
(1,366)
(1,583)
(713
)
(3,110)
(1,4
04)
(2,2
02)
(571)
Legend
Note: figures in parentheses indicate traffic volume
3,000 2,000 1,000
Vietnam National Transport Strategy Study (VITRANSS) Final Report
Main Text, Volume 1
4-53
4.3.5 Financial Aspect
Revenue and Expenditure of VR As mentioned earlier, VR is divided into two divisions for accounting purposes. The Transport Division is the responsibility of VR. VR pays the government 10% of the operating revenue as charge for using the infrastructure. In 1998, VR generated a revenue of VND 934 billion (US$ 67 million), 60% of which came from passenger and 40% from freight/baggage. The general trend is the gradual increase in passenger revenue and fluctuating pattern in goods revenue (see Table 4.3.20). The total operating cost in 1998 was VND 924 billion (US$ 66 million) excluding infrastructure tax. Of the total expenditure, salary shared 21.8% followed by materials (15.3%), depreciation (13.0%), fuel (12.3%), major repair (6.4%), and others.
Table 4.3.20
Income and Expenditure of VR VND billion
1998 1990 1994 1995 1996 1997 Amount (%)
Passenger 74.0 271.8 427.2 466.1 424.9 537.9 60.3 Freight 59.1 301.3 343.8 407.1 496.4 369.0 41.4 Baggage 6.1 26.9 30.0 26.0 26.7 26.8 0.3 Others 3.9 5.9 7.8 - In
com
e
Total 143.1 606.0 808.7 899.3 948.0 933.8 100 Salary 33.7 245.7 171.4 193.4 200.9 201.2 21.8 Social Insurance 19.0 9.2 13.5 17.6 17.7 1.9
Materials 26.4 156.2 129.6 139.9 143.1 141.3 15.3 Fuel 23.3 71.2 94.7 105.2 121.6 114.2 12.3 Electricity 6.3 6.3 9.6 25.9 35.9 3.9 Basic Depreciation 12.0 20.0 81.5 99.1 139.0 119.8 13.0
Large Repair 26.3 97.7 72.0 82.1 65.7 59.4 6.4
Ope
ratio
n
(A)
Others 37.2 77.8 99.6 100.1 101.6 118.3 12.8 Collection on Capital n.a 19.0 35.3 36.4 - - -
Infra
(B
)
Infrastructure Tax - - 80.9 89.9 94.8 116.0 12.6
Expenditure (A + B) 158.9 712.9 780.5 869.2 910.2 924.0 100.0 Revenue Tax 6.3 17.9 23.5 26.6 29.4 30.0 -
Expe
nditu
re
Total Expenditure 165.2 730.8 804.0 895.8 939.6 954.0 Source: VR
Tariff Passenger tariffs are set by VR subject to government approval. Passenger fare differs by type of train, type of seat and nationality (Vietnamese or not). It is calculated as the sum of unit fare per km multiplied by travel distance plus insurance premium. The unit fare decreases gradually as travel distance lengthens. Fare tables are displayed at each station.
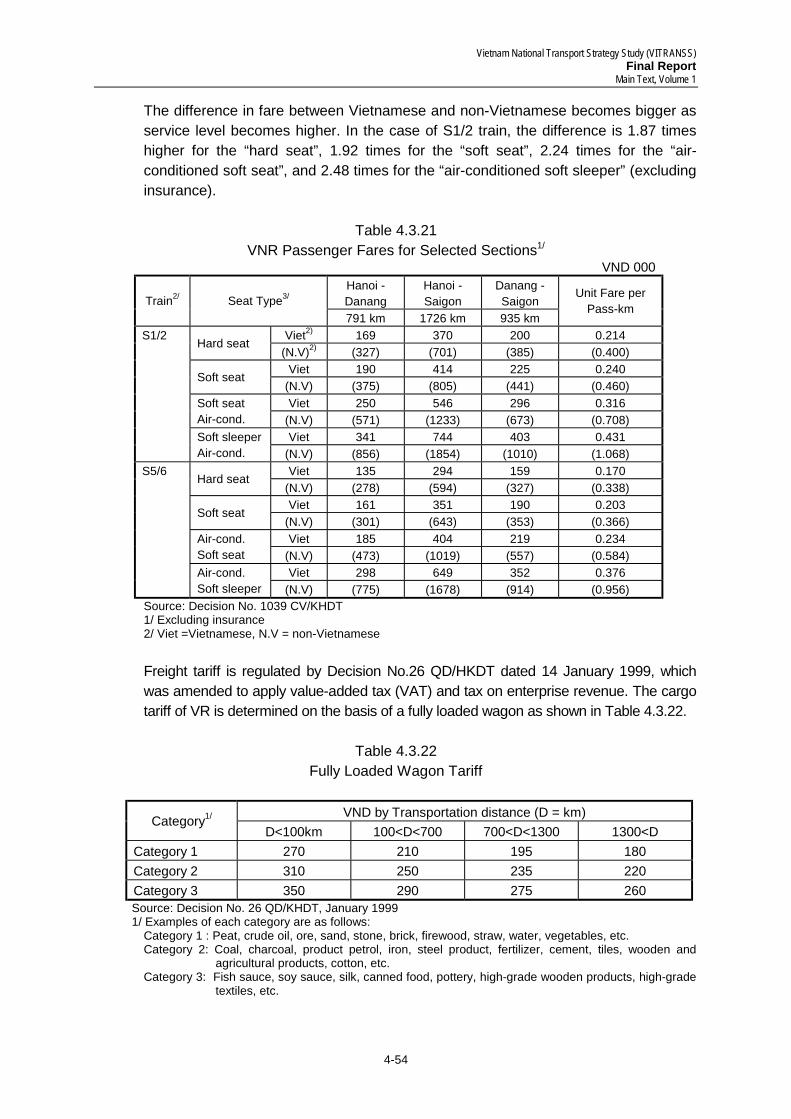
Vietnam National Transport Strategy Study (VITRANSS) Final Report
Main Text, Volume 1
4-54
The difference in fare between Vietnamese and non-Vietnamese becomes bigger as service level becomes higher. In the case of S1/2 train, the difference is 1.87 times higher for the “hard seat”, 1.92 times for the “soft seat”, 2.24 times for the “air-conditioned soft seat”, and 2.48 times for the “air-conditioned soft sleeper” (excluding insurance).
Table 4.3.21
VNR Passenger Fares for Selected Sections1/
VND 000 Hanoi - Danang
Hanoi - Saigon
Danang - Saigon Train2/ Seat Type3/
791 km 1726 km 935 km
Unit Fare per Pass-km
Viet2) 169 370 200 0.214 Hard seat (N.V)2) (327) (701) (385) (0.400)
Viet 190 414 225 0.240 Soft seat (N.V) (375) (805) (441) (0.460) Viet 250 546 296 0.316 Soft seat
Air-cond. (N.V) (571) (1233) (673) (0.708) Viet 341 744 403 0.431
S1/2
Soft sleeper Air-cond. (N.V) (856) (1854) (1010) (1.068)
Viet 135 294 159 0.170 Hard seat (N.V) (278) (594) (327) (0.338) Viet 161 351 190 0.203 Soft seat
(N.V) (301) (643) (353) (0.366) Viet 185 404 219 0.234 Air-cond.
Soft seat (N.V) (473) (1019) (557) (0.584) Viet 298 649 352 0.376
S5/6
Air-cond. Soft sleeper (N.V) (775) (1678) (914) (0.956)
Source: Decision No. 1039 CV/KHDT 1/ Excluding insurance
2/ Viet =Vietnamese, N.V = non-Vietnamese Freight tariff is regulated by Decision No.26 QD/HKDT dated 14 January 1999, which was amended to apply value-added tax (VAT) and tax on enterprise revenue. The cargo tariff of VR is determined on the basis of a fully loaded wagon as shown in Table 4.3.22.
Table 4.3.22
Fully Loaded Wagon Tariff
VND by Transportation distance (D = km) Category1/
D<100km 100<D<700 700<D<1300 1300<D Category 1 270 210 195 180 Category 2 310 250 235 220 Category 3 350 290 275 260 Source: Decision No. 26 QD/KHDT, January 1999 1/ Examples of each category are as follows:
Category 1 : Peat, crude oil, ore, sand, stone, brick, firewood, straw, water, vegetables, etc. Category 2: Coal, charcoal, product petrol, iron, steel product, fertilizer, cement, tiles, wooden and
agricultural products, cotton, etc. Category 3: Fish sauce, soy sauce, silk, canned food, pottery, high-grade wooden products, high-grade
textiles, etc.
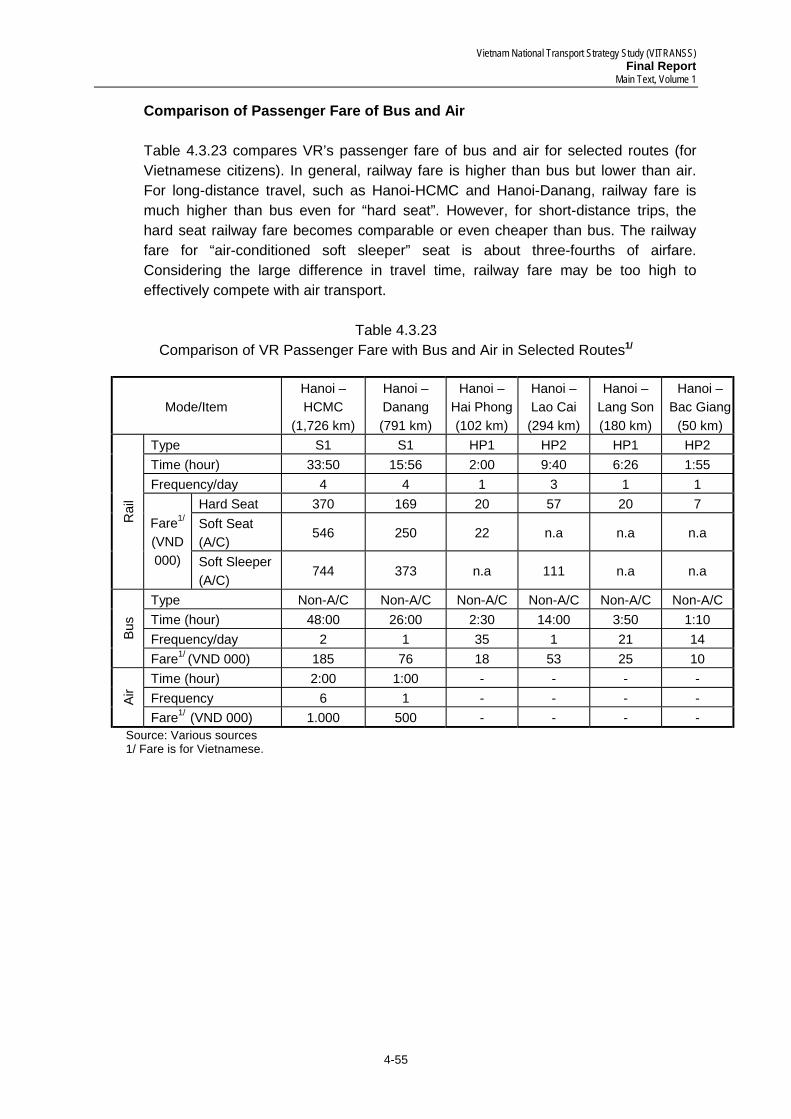
Vietnam National Transport Strategy Study (VITRANSS) Final Report
Main Text, Volume 1
4-55
Comparison of Passenger Fare of Bus and Air Table 4.3.23 compares VR’s passenger fare of bus and air for selected routes (for Vietnamese citizens). In general, railway fare is higher than bus but lower than air. For long-distance travel, such as Hanoi-HCMC and Hanoi-Danang, railway fare is much higher than bus even for “hard seat”. However, for short-distance trips, the hard seat railway fare becomes comparable or even cheaper than bus. The railway fare for “air-conditioned soft sleeper” seat is about three-fourths of airfare. Considering the large difference in travel time, railway fare may be too high to effectively compete with air transport.
Table 4.3.23
Comparison of VR Passenger Fare with Bus and Air in Selected Routes1/
Mode/Item Hanoi – HCMC
(1,726 km)
Hanoi – Danang (791 km)
Hanoi – Hai Phong (102 km)
Hanoi – Lao Cai (294 km)
Hanoi – Lang Son (180 km)
Hanoi – Bac Giang
(50 km) Type S1 S1 HP1 HP2 HP1 HP2 Time (hour) 33:50 15:56 2:00 9:40 6:26 1:55 Frequency/day 4 4 1 3 1 1
Hard Seat 370 169 20 57 20 7 Soft Seat (A/C)
546 250 22 n.a n.a n.a
Rai
l
Fare1/
(VND 000) Soft Sleeper
(A/C) 744 373 n.a 111 n.a n.a
Type Non-A/C Non-A/C Non-A/C Non-A/C Non-A/C Non-A/C Time (hour) 48:00 26:00 2:30 14:00 3:50 1:10 Frequency/day 2 1 35 1 21 14 Bu
s
Fare1/ (VND 000) 185 76 18 53 25 10 Time (hour) 2:00 1:00 - - - - Frequency 6 1 - - - - Ai
r
Fare1/ (VND 000) 1.000 500 - - - - Source: Various sources 1/ Fare is for Vietnamese.
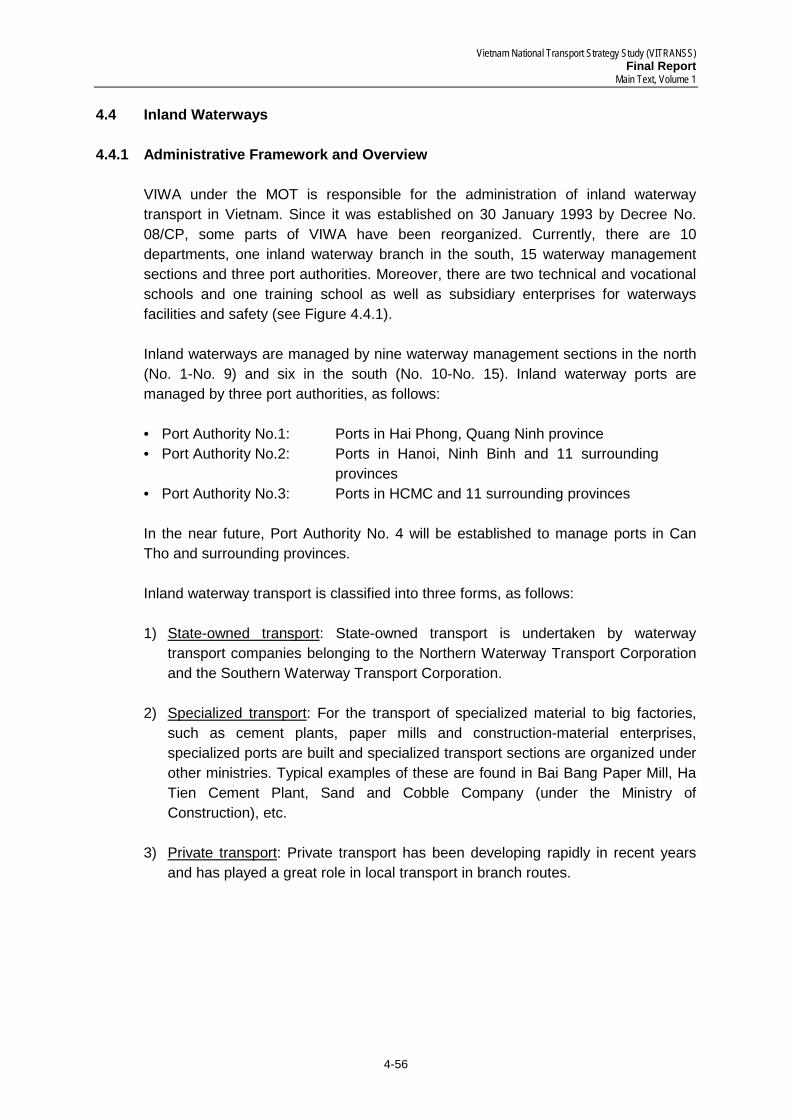
Vietnam National Transport Strategy Study (VITRANSS) Final Report
Main Text, Volume 1
4-56
4.4 Inland Waterways 4.4.1 Administrative Framework and Overview
VIWA under the MOT is responsible for the administration of inland waterway transport in Vietnam. Since it was established on 30 January 1993 by Decree No. 08/CP, some parts of VIWA have been reorganized. Currently, there are 10 departments, one inland waterway branch in the south, 15 waterway management sections and three port authorities. Moreover, there are two technical and vocational schools and one training school as well as subsidiary enterprises for waterways facilities and safety (see Figure 4.4.1).
Inland waterways are managed by nine waterway management sections in the north (No. 1-No. 9) and six in the south (No. 10-No. 15). Inland waterway ports are managed by three port authorities, as follows: • Port Authority No.1: Ports in Hai Phong, Quang Ninh province • Port Authority No.2: Ports in Hanoi, Ninh Binh and 11 surrounding
provinces • Port Authority No.3: Ports in HCMC and 11 surrounding provinces
In the near future, Port Authority No. 4 will be established to manage ports in Can Tho and surrounding provinces.
Inland waterway transport is classified into three forms, as follows: 1) State-owned transport: State-owned transport is undertaken by waterway
transport companies belonging to the Northern Waterway Transport Corporation and the Southern Waterway Transport Corporation.
2) Specialized transport: For the transport of specialized material to big factories,
such as cement plants, paper mills and construction-material enterprises, specialized ports are built and specialized transport sections are organized under other ministries. Typical examples of these are found in Bai Bang Paper Mill, Ha Tien Cement Plant, Sand and Cobble Company (under the Ministry of Construction), etc.
3) Private transport: Private transport has been developing rapidly in recent years
and has played a great role in local transport in branch routes.
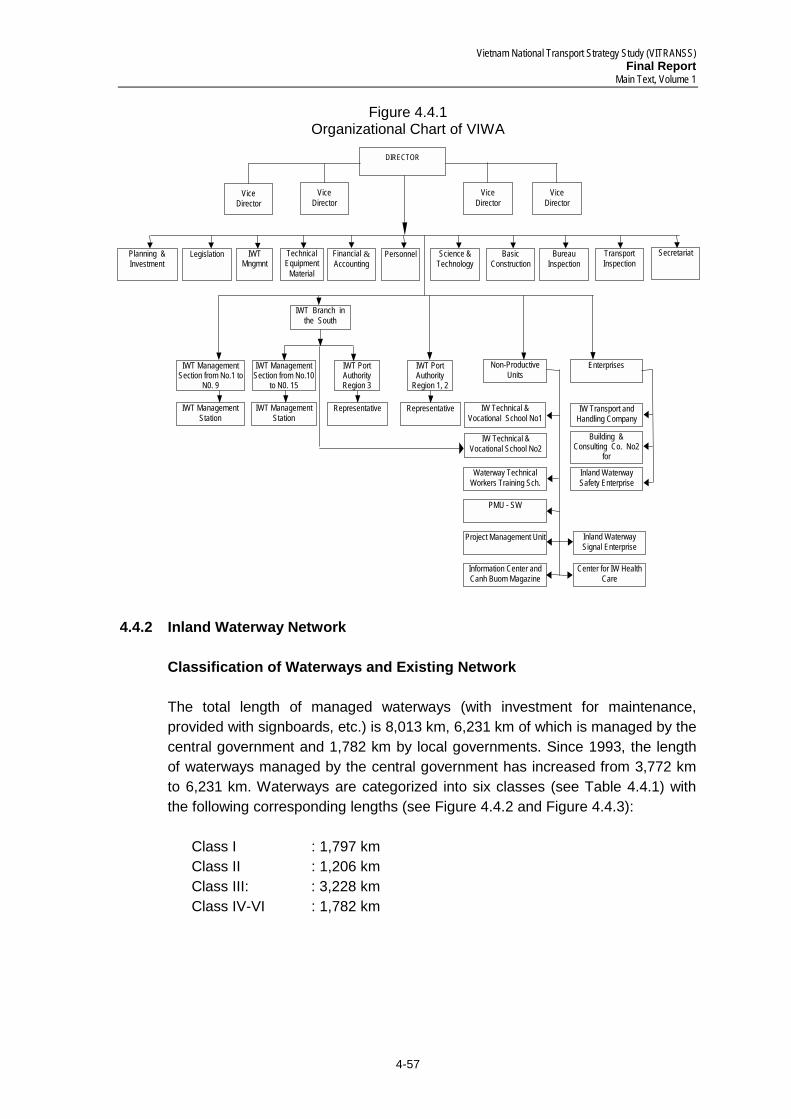
Vietnam National Transport Strategy Study (VITRANSS) Final Report
Main Text, Volume 1
4-57
Figure 4.4.1 Organizational Chart of VIWA
4.4.2 Inland Waterway Network
Classification of Waterways and Existing Network
The total length of managed waterways (with investment for maintenance, provided with signboards, etc.) is 8,013 km, 6,231 km of which is managed by the central government and 1,782 km by local governments. Since 1993, the length of waterways managed by the central government has increased from 3,772 km to 6,231 km. Waterways are categorized into six classes (see Table 4.4.1) with the following corresponding lengths (see Figure 4.4.2 and Figure 4.4.3):
Class I : 1,797 km Class II : 1,206 km Class III: : 3,228 km Class IV-VI : 1,782 km
Planning & Investment Legislation IWT
Mngmnt
Technical Equipment
Material
Financial & Accounting
Personnel Science & Technology
Basic Construction
Bureau Inspection
Transport Inspection
Secretariat
IWT Branch in the South
IWT Management Section from No.1 to
N0. 9
IWT Management Section from No.10
to N0. 15
IWT Port Authority Region 3
IWT Port Authority
Region 1, 2
IWT Management Station
IWT Management Station
Representative
Enterprises
IW Transport and Handling Company
Building & Consulting Co. No2
for Inland Waterway Safety Enterprise
Inland Waterway Signal Enterprise
Center for IW Health Care
Non-Productive Units
IW Technical & Vocational School No1
Waterway Technical Workers Training Sch.
PMU - SW
Project Management Unit
Information Center and Canh Buom Magazine
DIRECTOR
Vice Director
Vice Director
Vice Director
Vice Director
Representative
IW Technical & Vocational School No2
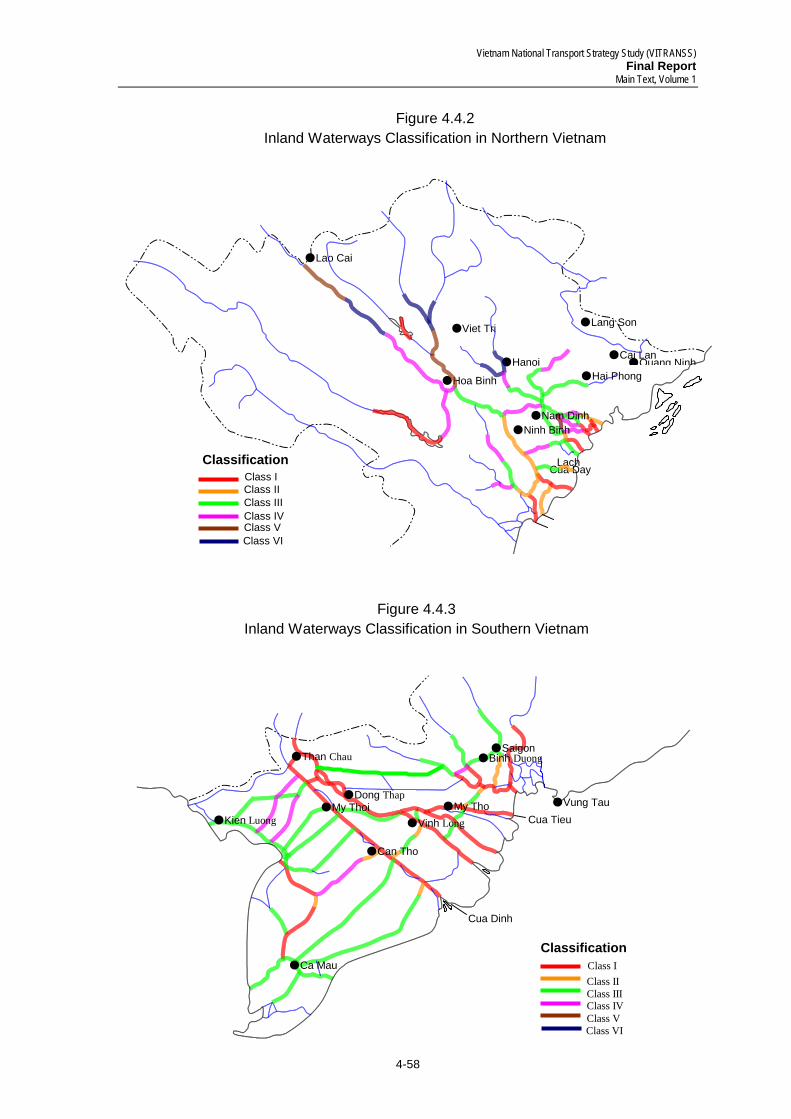
Vietnam National Transport Strategy Study (VITRANSS) Final Report
Main Text, Volume 1
4-58
Figure 4.4.3 Inland Waterways Classification in Southern Vietnam
Classification Class I
Class III Class II
Class IV
Class VI Class V
��Dong Thap ��Vung Tau
Cua Dinh
Cua Tieu ��Kien Luong ��My Thoi
��Can Tho
��Vinh Long ��My Tho
��Ca Mau
��Binh Duong ��Saigon
��Than Chau
Figure 4.4.2 Inland Waterways Classification in Northern Vietnam
Lach Cua Day
�Viet Tri
��Hanoi �Quang Ninh��Cai Lan
��Hai Phong ��Hoa Binh
��Lao Cai
��Lang Son
Classification Class I
Class III Class II
Class IV
Class VI Class V
��Nam Dinh ��Ninh Binh
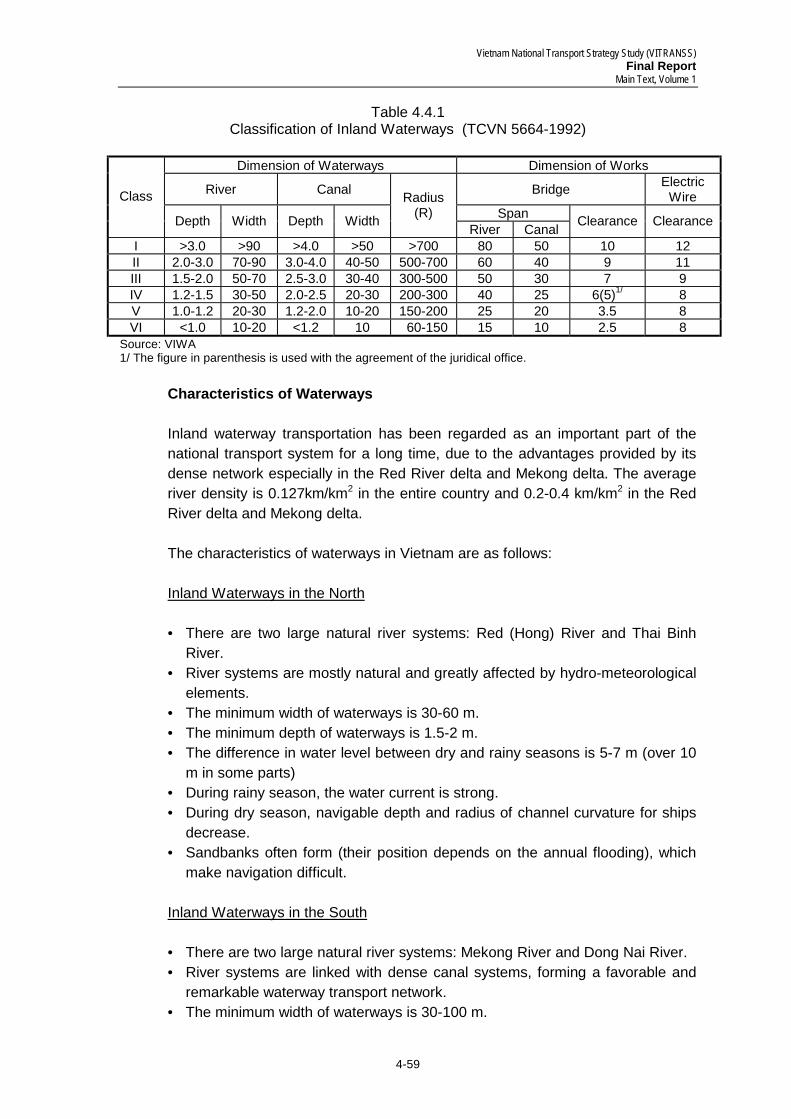
Vietnam National Transport Strategy Study (VITRANSS) Final Report
Main Text, Volume 1
4-59
Table 4.4.1 Classification of Inland Waterways (TCVN 5664-1992)
Dimension of Waterways Dimension of Works
River Canal Bridge Electric Wire
Span
Class
Depth Width Depth Width
Radius (R)
River Canal Clearance Clearance
I >3.0 >90 >4.0 >50 >700 80 50 10 12 II 2.0-3.0 70-90 3.0-4.0 40-50 500-700 60 40 9 11 III 1.5-2.0 50-70 2.5-3.0 30-40 300-500 50 30 7 9 IV 1.2-1.5 30-50 2.0-2.5 20-30 200-300 40 25 6(5)1/ 8 V 1.0-1.2 20-30 1.2-2.0 10-20 150-200 25 20 3.5 8 VI <1.0 10-20 <1.2 10 60-150 15 10 2.5 8
Source: VIWA 1/ The figure in parenthesis is used with the agreement of the juridical office.
Characteristics of Waterways
Inland waterway transportation has been regarded as an important part of the national transport system for a long time, due to the advantages provided by its dense network especially in the Red River delta and Mekong delta. The average river density is 0.127km/km2 in the entire country and 0.2-0.4 km/km2 in the Red River delta and Mekong delta.
The characteristics of waterways in Vietnam are as follows: Inland Waterways in the North
• There are two large natural river systems: Red (Hong) River and Thai Binh
River. • River systems are mostly natural and greatly affected by hydro-meteorological
elements. • The minimum width of waterways is 30-60 m. • The minimum depth of waterways is 1.5-2 m. • The difference in water level between dry and rainy seasons is 5-7 m (over 10
m in some parts) • During rainy season, the water current is strong. • During dry season, navigable depth and radius of channel curvature for ships
decrease. • Sandbanks often form (their position depends on the annual flooding), which
make navigation difficult. Inland Waterways in the South
• There are two large natural river systems: Mekong River and Dong Nai River. • River systems are linked with dense canal systems, forming a favorable and
remarkable waterway transport network. • The minimum width of waterways is 30-100 m.
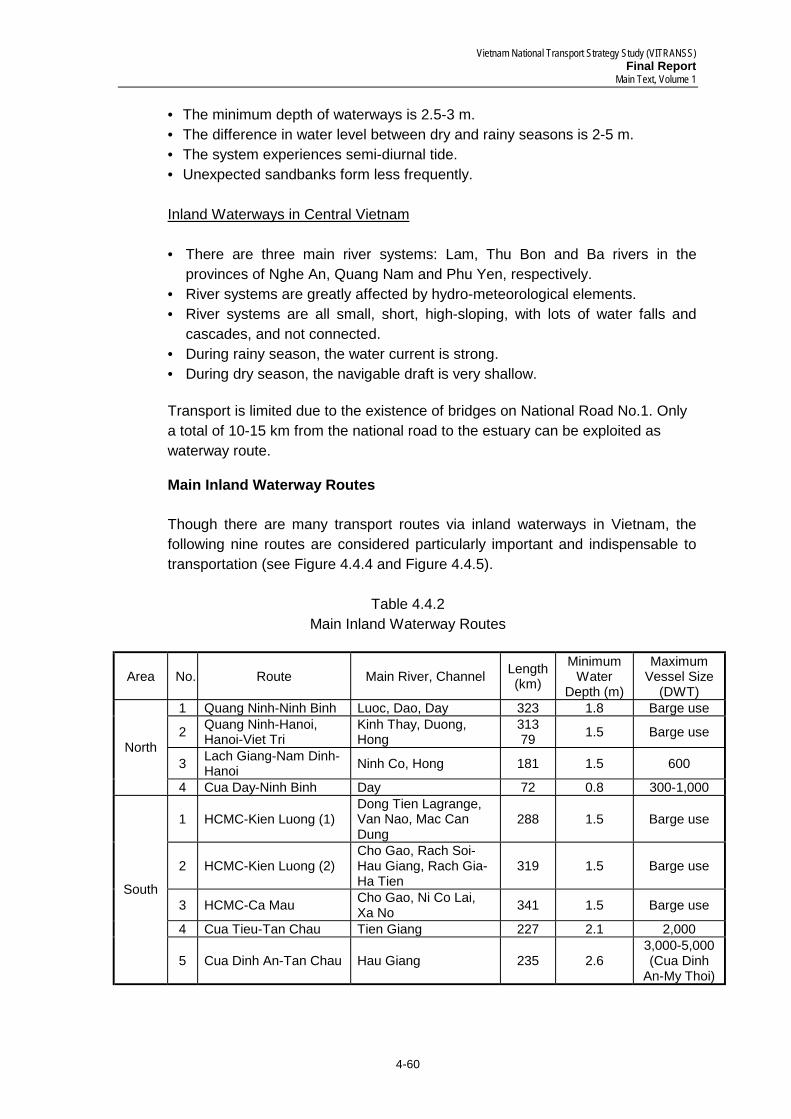
Vietnam National Transport Strategy Study (VITRANSS) Final Report
Main Text, Volume 1
4-60
• The minimum depth of waterways is 2.5-3 m. • The difference in water level between dry and rainy seasons is 2-5 m. • The system experiences semi-diurnal tide. • Unexpected sandbanks form less frequently.
Inland Waterways in Central Vietnam
• There are three main river systems: Lam, Thu Bon and Ba rivers in the
provinces of Nghe An, Quang Nam and Phu Yen, respectively. • River systems are greatly affected by hydro-meteorological elements. • River systems are all small, short, high-sloping, with lots of water falls and
cascades, and not connected. • During rainy season, the water current is strong. • During dry season, the navigable draft is very shallow. Transport is limited due to the existence of bridges on National Road No.1. Only a total of 10-15 km from the national road to the estuary can be exploited as waterway route. Main Inland Waterway Routes Though there are many transport routes via inland waterways in Vietnam, the following nine routes are considered particularly important and indispensable to transportation (see Figure 4.4.4 and Figure 4.4.5).
Table 4.4.2 Main Inland Waterway Routes
Area No. Route Main River, Channel Length (km)
Minimum Water
Depth (m)
Maximum Vessel Size
(DWT) 1 Quang Ninh-Ninh Binh Luoc, Dao, Day 323 1.8 Barge use
2 Quang Ninh-Hanoi, Hanoi-Viet Tri
Kinh Thay, Duong, Hong
313 79 1.5 Barge use
3 Lach Giang-Nam Dinh-Hanoi Ninh Co, Hong 181 1.5 600
North
4 Cua Day-Ninh Binh Day 72 0.8 300-1,000
1 HCMC-Kien Luong (1) Dong Tien Lagrange, Van Nao, Mac Can Dung
288 1.5 Barge use
2 HCMC-Kien Luong (2) Cho Gao, Rach Soi-Hau Giang, Rach Gia-Ha Tien
319 1.5 Barge use
3 HCMC-Ca Mau Cho Gao, Ni Co Lai, Xa No 341 1.5 Barge use
4 Cua Tieu-Tan Chau Tien Giang 227 2.1 2,000
South
5 Cua Dinh An-Tan Chau Hau Giang 235 2.6 3,000-5,000 (Cua Dinh
An-My Thoi)
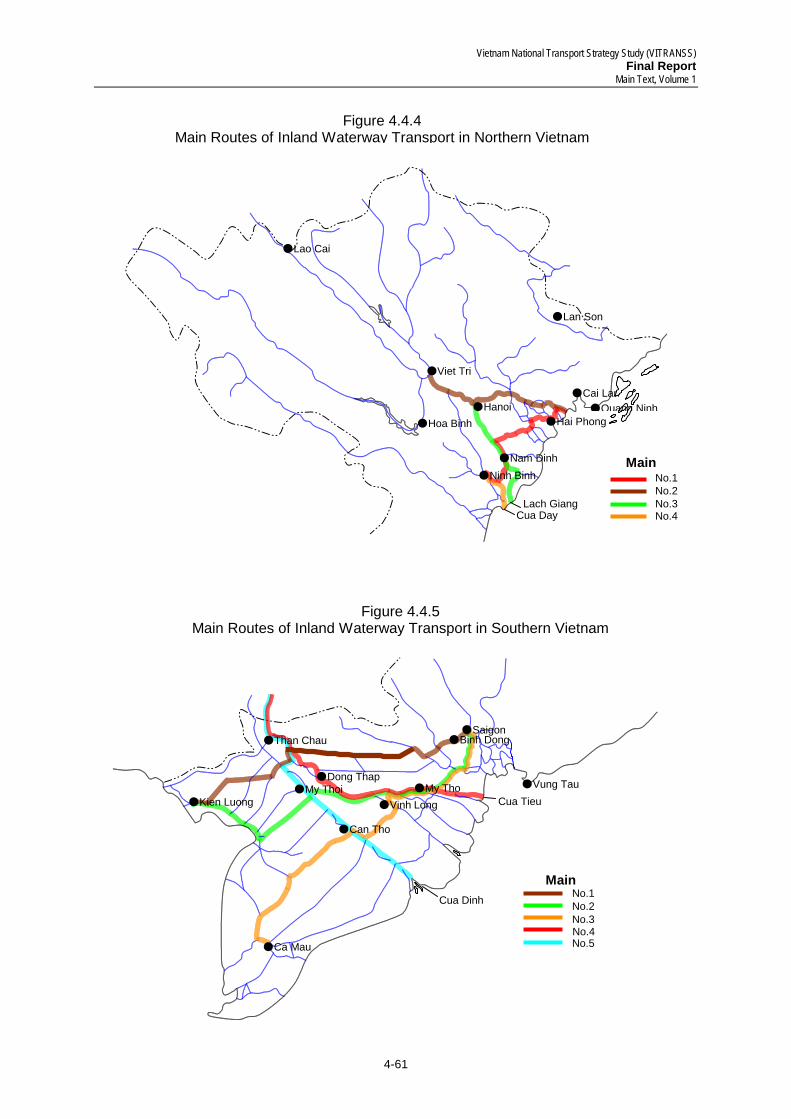
Vietnam National Transport Strategy Study (VITRANSS) Final Report
Main Text, Volume 1
4-61
Figure 4.4.4 Main Routes of Inland Waterway Transport in Northern Vietnam
�Viet Tri
��Hanoi ��Cai Lan
Lach Giang Cua Day
��Hoa Binh
��Lao Cai
��Lan Son
��Hai Phong
��Nam Dinh ��Ninh Binh
Main No.1 No.2 No.3 No.4
�Quang Ninh
Figure 4.4.5 Main Routes of Inland Waterway Transport in Southern Vietnam
��Dong Thap ��Vung Tau
Cua Dinh
Cua Tieu ��Kien Luong ��My Thoi
��Can Tho
��Vinh Long ��My Tho
��Ca Mau
��Binh Dong ��Saigon
Main No.1 No.2 No.3
No.5 No.4
��Than Chau
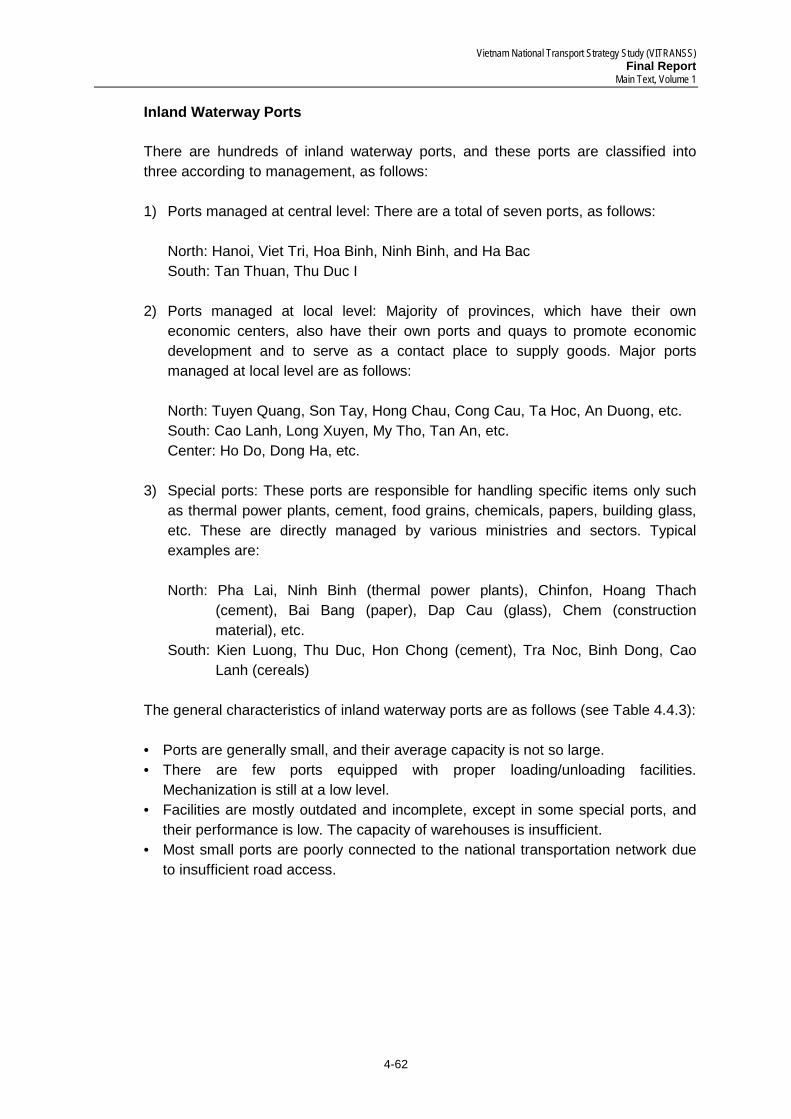
Vietnam National Transport Strategy Study (VITRANSS) Final Report
Main Text, Volume 1
4-62
Inland Waterway Ports There are hundreds of inland waterway ports, and these ports are classified into three according to management, as follows: 1) Ports managed at central level: There are a total of seven ports, as follows:
North: Hanoi, Viet Tri, Hoa Binh, Ninh Binh, and Ha Bac South: Tan Thuan, Thu Duc I
2) Ports managed at local level: Majority of provinces, which have their own
economic centers, also have their own ports and quays to promote economic development and to serve as a contact place to supply goods. Major ports managed at local level are as follows:
North: Tuyen Quang, Son Tay, Hong Chau, Cong Cau, Ta Hoc, An Duong, etc. South: Cao Lanh, Long Xuyen, My Tho, Tan An, etc. Center: Ho Do, Dong Ha, etc.
3) Special ports: These ports are responsible for handling specific items only such
as thermal power plants, cement, food grains, chemicals, papers, building glass, etc. These are directly managed by various ministries and sectors. Typical examples are:
North: Pha Lai, Ninh Binh (thermal power plants), Chinfon, Hoang Thach
(cement), Bai Bang (paper), Dap Cau (glass), Chem (construction material), etc.
South: Kien Luong, Thu Duc, Hon Chong (cement), Tra Noc, Binh Dong, Cao Lanh (cereals)
The general characteristics of inland waterway ports are as follows (see Table 4.4.3): • Ports are generally small, and their average capacity is not so large. • There are few ports equipped with proper loading/unloading facilities.
Mechanization is still at a low level. • Facilities are mostly outdated and incomplete, except in some special ports, and
their performance is low. The capacity of warehouses is insufficient. • Most small ports are poorly connected to the national transportation network due
to insufficient road access.
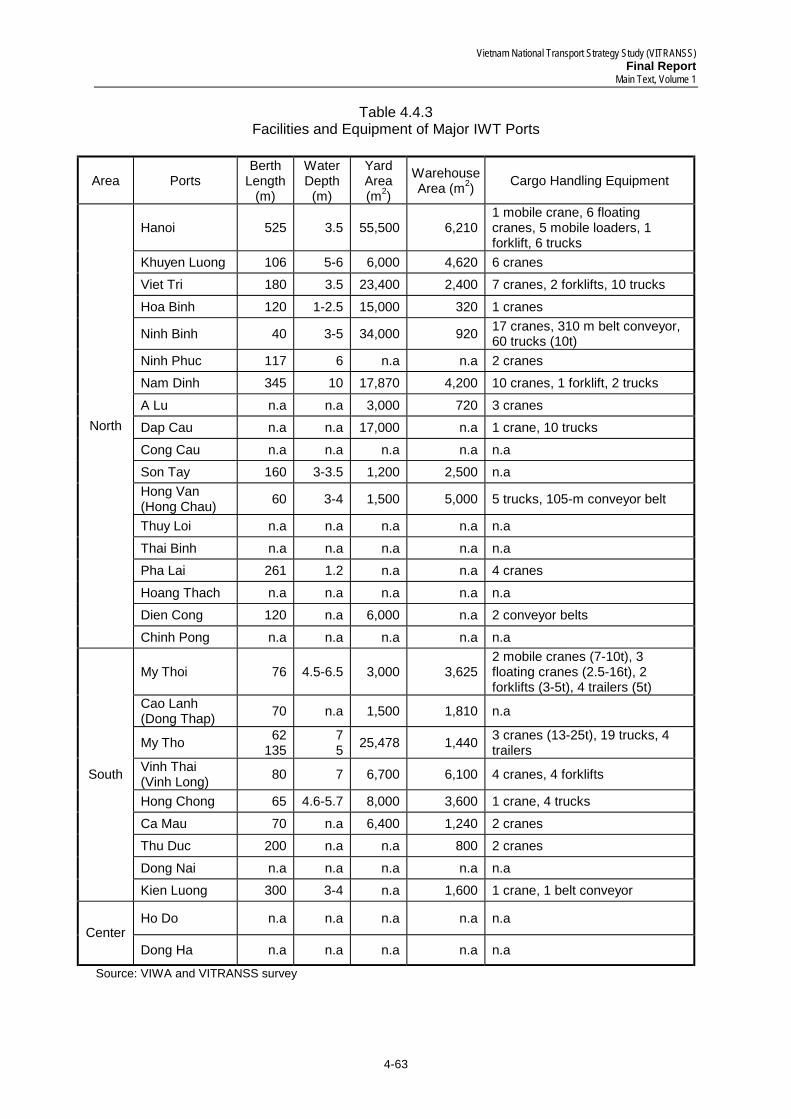
Vietnam National Transport Strategy Study (VITRANSS) Final Report
Main Text, Volume 1
4-63
Table 4.4.3 Facilities and Equipment of Major IWT Ports
Area Ports Berth
Length (m)
Water Depth
(m)
Yard Area (m2)
Warehouse Area (m2) Cargo Handling Equipment
Hanoi 525 3.5 55,500 6,210 1 mobile crane, 6 floating cranes, 5 mobile loaders, 1 forklift, 6 trucks
Khuyen Luong 106 5-6 6,000 4,620 6 cranes Viet Tri 180 3.5 23,400 2,400 7 cranes, 2 forklifts, 10 trucks Hoa Binh 120 1-2.5 15,000 320 1 cranes
Ninh Binh 40 3-5 34,000 920 17 cranes, 310 m belt conveyor, 60 trucks (10t)
Ninh Phuc 117 6 n.a n.a 2 cranes Nam Dinh 345 10 17,870 4,200 10 cranes, 1 forklift, 2 trucks A Lu n.a n.a 3,000 720 3 cranes Dap Cau n.a n.a 17,000 n.a 1 crane, 10 trucks Cong Cau n.a n.a n.a n.a n.a Son Tay 160 3-3.5 1,200 2,500 n.a Hong Van (Hong Chau) 60 3-4 1,500 5,000 5 trucks, 105-m conveyor belt
Thuy Loi n.a n.a n.a n.a n.a Thai Binh n.a n.a n.a n.a n.a Pha Lai 261 1.2 n.a n.a 4 cranes Hoang Thach n.a n.a n.a n.a n.a Dien Cong 120 n.a 6,000 n.a 2 conveyor belts
North
Chinh Pong n.a n.a n.a n.a n.a
My Thoi 76 4.5-6.5 3,000 3,625 2 mobile cranes (7-10t), 3 floating cranes (2.5-16t), 2 forklifts (3-5t), 4 trailers (5t)
Cao Lanh (Dong Thap) 70 n.a 1,500 1,810 n.a
My Tho 62 135
7 5 25,478 1,440 3 cranes (13-25t), 19 trucks, 4
trailers Vinh Thai (Vinh Long) 80 7 6,700 6,100 4 cranes, 4 forklifts
Hong Chong 65 4.6-5.7 8,000 3,600 1 crane, 4 trucks Ca Mau 70 n.a 6,400 1,240 2 cranes Thu Duc 200 n.a n.a 800 2 cranes Dong Nai n.a n.a n.a n.a n.a
South
Kien Luong 300 3-4 n.a 1,600 1 crane, 1 belt conveyor
Ho Do n.a n.a n.a n.a n.a Center
Dong Ha n.a n.a n.a n.a n.a
Source: VIWA and VITRANSS survey
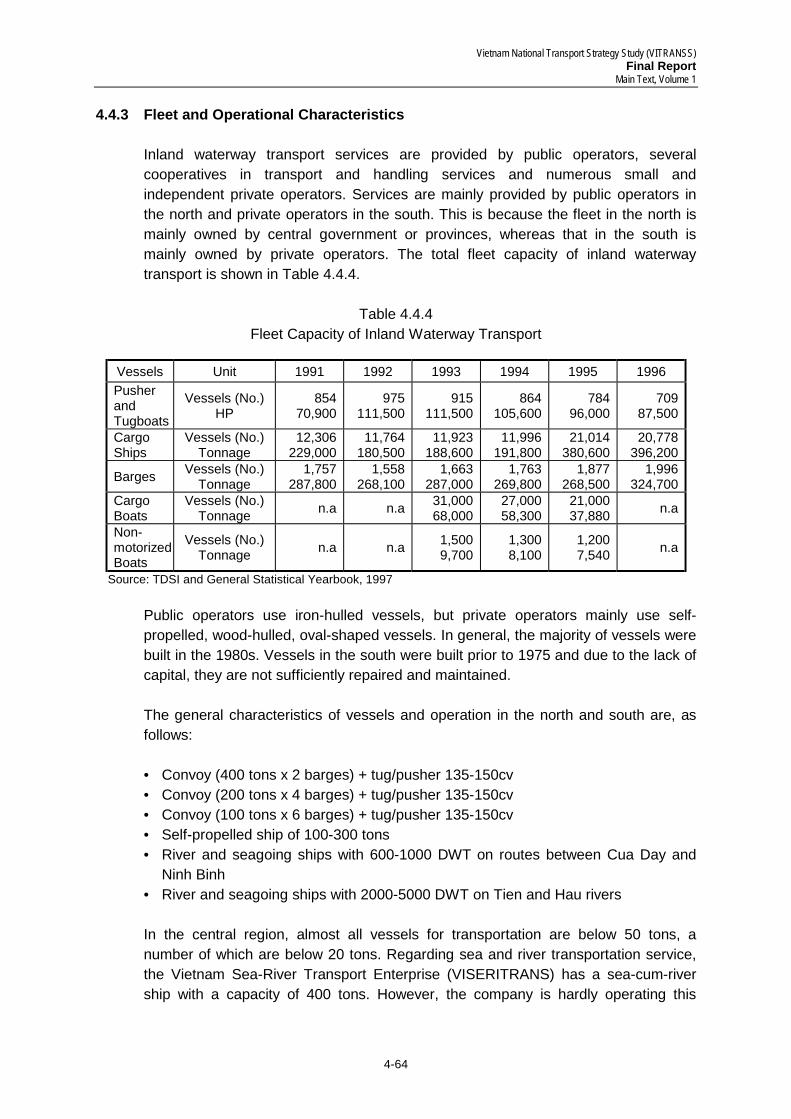
Vietnam National Transport Strategy Study (VITRANSS) Final Report
Main Text, Volume 1
4-64
4.4.3 Fleet and Operational Characteristics Inland waterway transport services are provided by public operators, several cooperatives in transport and handling services and numerous small and independent private operators. Services are mainly provided by public operators in the north and private operators in the south. This is because the fleet in the north is mainly owned by central government or provinces, whereas that in the south is mainly owned by private operators. The total fleet capacity of inland waterway transport is shown in Table 4.4.4.
Table 4.4.4 Fleet Capacity of Inland Waterway Transport
Vessels Unit 1991 1992 1993 1994 1995 1996 Pusher and Tugboats
Vessels (No.) HP
854 70,900
975 111,500
915 111,500
864 105,600
784 96,000
709 87,500
Cargo Ships
Vessels (No.) Tonnage
12,306 229,000
11,764 180,500
11,923 188,600
11,996 191,800
21,014 380,600
20,778 396,200
Barges Vessels (No.) Tonnage
1,757 287,800
1,558 268,100
1,663 287,000
1,763 269,800
1,877 268,500
1,996 324,700
Cargo Boats
Vessels (No.) Tonnage n.a n.a 31,000
68,000 27,000 58,300
21,000 37,880 n.a
Non- motorized Boats
Vessels (No.) Tonnage n.a n.a 1,500
9,700 1,300 8,100
1,200 7,540 n.a
Source: TDSI and General Statistical Yearbook, 1997
Public operators use iron-hulled vessels, but private operators mainly use self-propelled, wood-hulled, oval-shaped vessels. In general, the majority of vessels were built in the 1980s. Vessels in the south were built prior to 1975 and due to the lack of capital, they are not sufficiently repaired and maintained. The general characteristics of vessels and operation in the north and south are, as follows: • Convoy (400 tons x 2 barges) + tug/pusher 135-150cv • Convoy (200 tons x 4 barges) + tug/pusher 135-150cv • Convoy (100 tons x 6 barges) + tug/pusher 135-150cv • Self-propelled ship of 100-300 tons • River and seagoing ships with 600-1000 DWT on routes between Cua Day and
Ninh Binh • River and seagoing ships with 2000-5000 DWT on Tien and Hau rivers In the central region, almost all vessels for transportation are below 50 tons, a number of which are below 20 tons. Regarding sea and river transportation service, the Vietnam Sea-River Transport Enterprise (VISERITRANS) has a sea-cum-river ship with a capacity of 400 tons. However, the company is hardly operating this
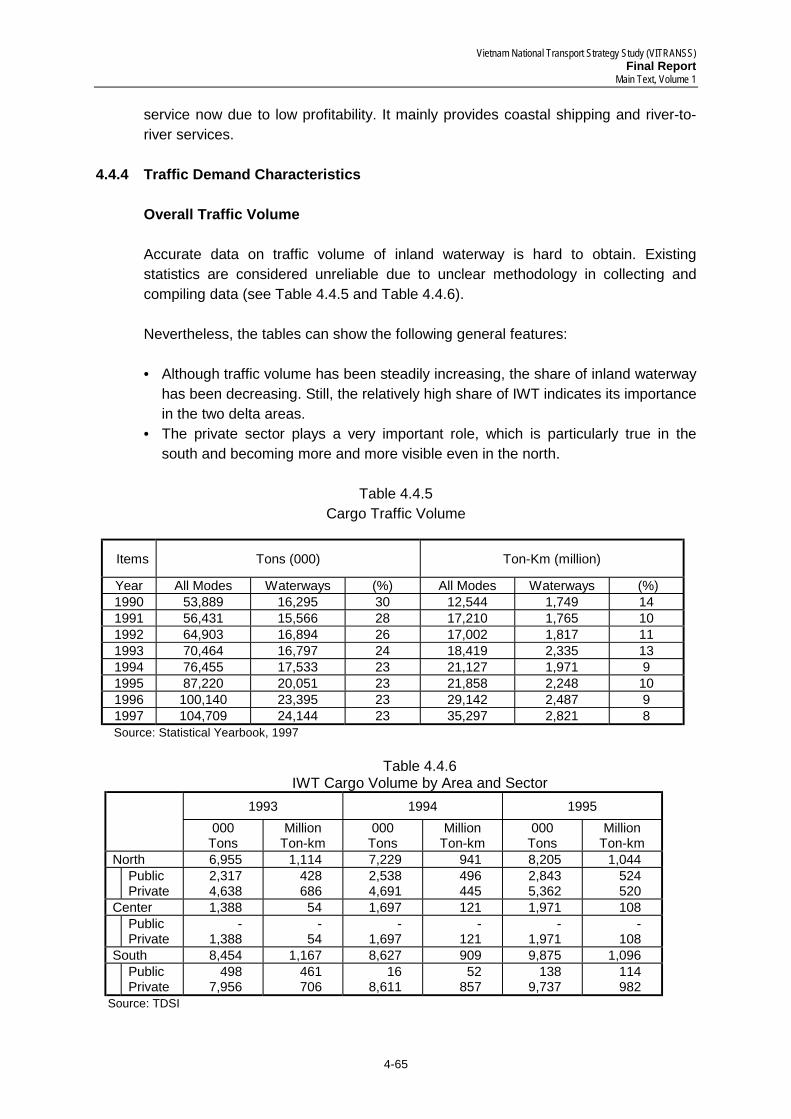
Vietnam National Transport Strategy Study (VITRANSS) Final Report
Main Text, Volume 1
4-65
service now due to low profitability. It mainly provides coastal shipping and river-to-river services.
4.4.4 Traffic Demand Characteristics
Overall Traffic Volume Accurate data on traffic volume of inland waterway is hard to obtain. Existing statistics are considered unreliable due to unclear methodology in collecting and compiling data (see Table 4.4.5 and Table 4.4.6). Nevertheless, the tables can show the following general features: • Although traffic volume has been steadily increasing, the share of inland waterway
has been decreasing. Still, the relatively high share of IWT indicates its importance in the two delta areas.
• The private sector plays a very important role, which is particularly true in the south and becoming more and more visible even in the north.
Table 4.4.5
Cargo Traffic Volume
Items Tons (000) Ton-Km (million)
Year All Modes Waterways (%) All Modes Waterways (%) 1990 53,889 16,295 30 12,544 1,749 14 1991 56,431 15,566 28 17,210 1,765 10 1992 64,903 16,894 26 17,002 1,817 11 1993 70,464 16,797 24 18,419 2,335 13 1994 76,455 17,533 23 21,127 1,971 9 1995 87,220 20,051 23 21,858 2,248 10 1996 100,140 23,395 23 29,142 2,487 9 1997 104,709 24,144 23 35,297 2,821 8 Source: Statistical Yearbook, 1997
Table 4.4.6
IWT Cargo Volume by Area and Sector 1993 1994 1995
000 Tons
Million Ton-km
000 Tons
Million Ton-km
000 Tons
Million Ton-km
North 6,955 1,114 7,229 941 8,205 1,044
Public Private
2,317 4,638
428 686
2,538 4,691
496 445
2,843 5,362
524 520
Center 1,388 54 1,697 121 1,971 108
Public Private
- 1,388
- 54
- 1,697
- 121
- 1,971
- 108
South 8,454 1,167 8,627 909 9,875 1,096
Public Private
498 7,956
461 706
16 8,611
52 857
138 9,737
114 982
Source: TDSI
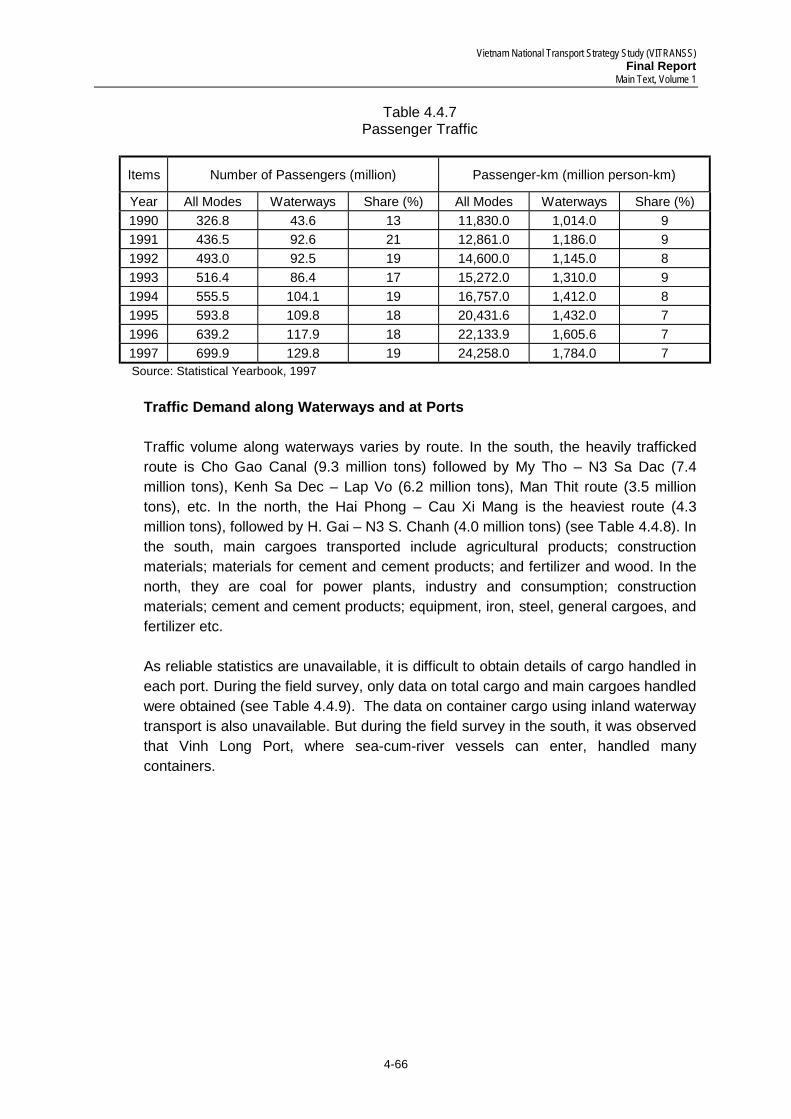
Vietnam National Transport Strategy Study (VITRANSS) Final Report
Main Text, Volume 1
4-66
Table 4.4.7 Passenger Traffic
Items Number of Passengers (million) Passenger-km (million person-km)
Year All Modes Waterways Share (%) All Modes Waterways Share (%) 1990 326.8 43.6 13 11,830.0 1,014.0 9 1991 436.5 92.6 21 12,861.0 1,186.0 9 1992 493.0 92.5 19 14,600.0 1,145.0 8 1993 516.4 86.4 17 15,272.0 1,310.0 9 1994 555.5 104.1 19 16,757.0 1,412.0 8 1995 593.8 109.8 18 20,431.6 1,432.0 7 1996 639.2 117.9 18 22,133.9 1,605.6 7 1997 699.9 129.8 19 24,258.0 1,784.0 7 Source: Statistical Yearbook, 1997
Traffic Demand along Waterways and at Ports Traffic volume along waterways varies by route. In the south, the heavily trafficked route is Cho Gao Canal (9.3 million tons) followed by My Tho – N3 Sa Dac (7.4 million tons), Kenh Sa Dec – Lap Vo (6.2 million tons), Man Thit route (3.5 million tons), etc. In the north, the Hai Phong – Cau Xi Mang is the heaviest route (4.3 million tons), followed by H. Gai – N3 S. Chanh (4.0 million tons) (see Table 4.4.8). In the south, main cargoes transported include agricultural products; construction materials; materials for cement and cement products; and fertilizer and wood. In the north, they are coal for power plants, industry and consumption; construction materials; cement and cement products; equipment, iron, steel, general cargoes, and fertilizer etc. As reliable statistics are unavailable, it is difficult to obtain details of cargo handled in each port. During the field survey, only data on total cargo and main cargoes handled were obtained (see Table 4.4.9). The data on container cargo using inland waterway transport is also unavailable. But during the field survey in the south, it was observed that Vinh Long Port, where sea-cum-river vessels can enter, handled many containers.
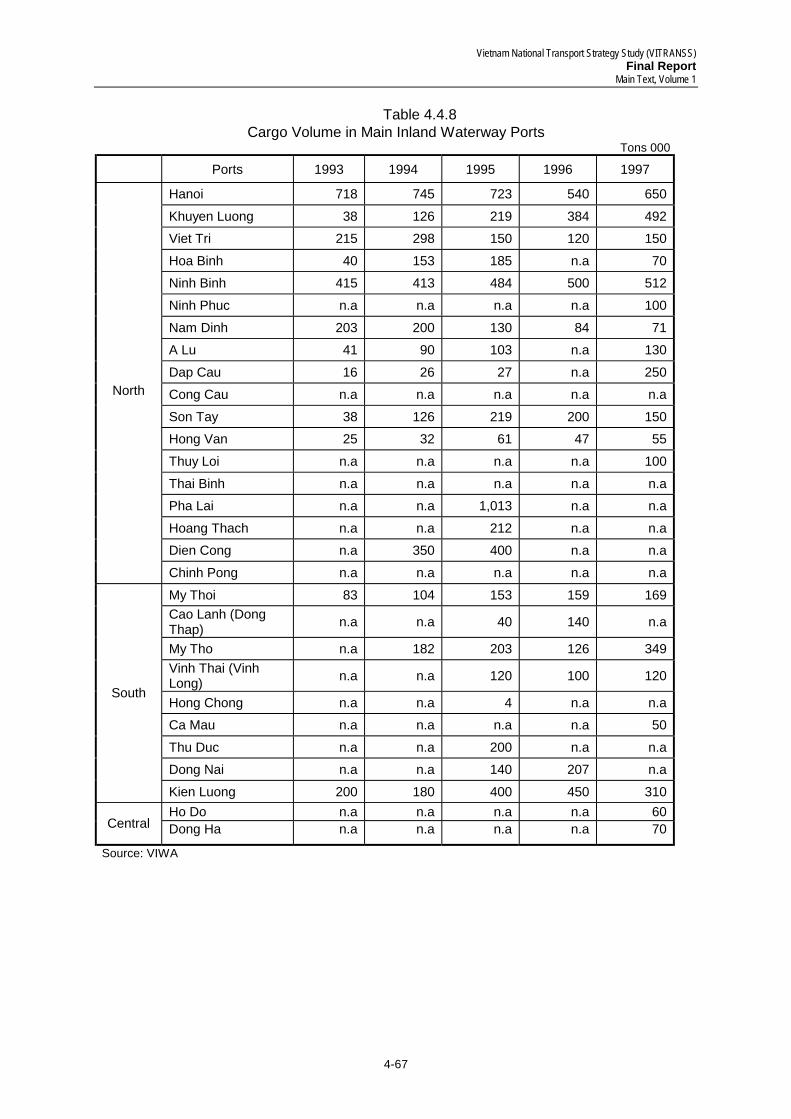
Vietnam National Transport Strategy Study (VITRANSS) Final Report
Main Text, Volume 1
4-67
Table 4.4.8 Cargo Volume in Main Inland Waterway Ports
Tons 000
Ports 1993 1994 1995 1996 1997
Hanoi 718 745 723 540 650 Khuyen Luong 38 126 219 384 492 Viet Tri 215 298 150 120 150 Hoa Binh 40 153 185 n.a 70 Ninh Binh 415 413 484 500 512 Ninh Phuc n.a n.a n.a n.a 100 Nam Dinh 203 200 130 84 71 A Lu 41 90 103 n.a 130 Dap Cau 16 26 27 n.a 250 Cong Cau n.a n.a n.a n.a n.a Son Tay 38 126 219 200 150 Hong Van 25 32 61 47 55 Thuy Loi n.a n.a n.a n.a 100 Thai Binh n.a n.a n.a n.a n.a Pha Lai n.a n.a 1,013 n.a n.a Hoang Thach n.a n.a 212 n.a n.a Dien Cong n.a 350 400 n.a n.a
North
Chinh Pong n.a n.a n.a n.a n.a My Thoi 83 104 153 159 169 Cao Lanh (Dong Thap) n.a n.a 40 140 n.a
My Tho n.a 182 203 126 349 Vinh Thai (Vinh Long) n.a n.a 120 100 120
Hong Chong n.a n.a 4 n.a n.a Ca Mau n.a n.a n.a n.a 50 Thu Duc n.a n.a 200 n.a n.a Dong Nai n.a n.a 140 207 n.a
South
Kien Luong 200 180 400 450 310 Ho Do n.a n.a n.a n.a 60
Central Dong Ha n.a n.a n.a n.a 70
Source: VIWA
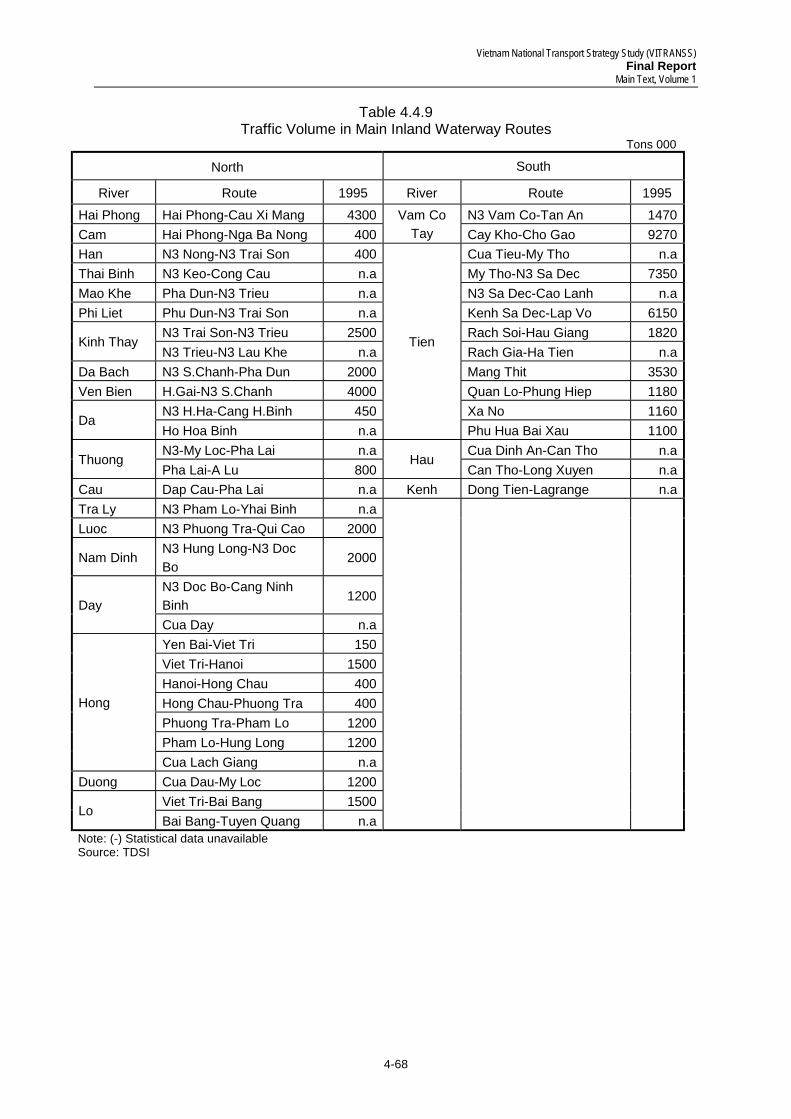
Vietnam National Transport Strategy Study (VITRANSS) Final Report
Main Text, Volume 1
4-68
Table 4.4.9 Traffic Volume in Main Inland Waterway Routes
Tons 000
North South
River Route 1995 River Route 1995 Hai Phong Hai Phong-Cau Xi Mang 4300 N3 Vam Co-Tan An 1470 Cam Hai Phong-Nga Ba Nong 400
Vam Co Tay Cay Kho-Cho Gao 9270
Han N3 Nong-N3 Trai Son 400 Cua Tieu-My Tho n.a Thai Binh N3 Keo-Cong Cau n.a My Tho-N3 Sa Dec 7350 Mao Khe Pha Dun-N3 Trieu n.a N3 Sa Dec-Cao Lanh n.a Phi Liet Phu Dun-N3 Trai Son n.a Kenh Sa Dec-Lap Vo 6150
N3 Trai Son-N3 Trieu 2500 Rach Soi-Hau Giang 1820 Kinh Thay
N3 Trieu-N3 Lau Khe n.a Rach Gia-Ha Tien n.a Da Bach N3 S.Chanh-Pha Dun 2000 Mang Thit 3530 Ven Bien H.Gai-N3 S.Chanh 4000 Quan Lo-Phung Hiep 1180
N3 H.Ha-Cang H.Binh 450 Xa No 1160 Da
Ho Hoa Binh n.a
Tien
Phu Hua Bai Xau 1100 N3-My Loc-Pha Lai n.a Cua Dinh An-Can Tho n.a
Thuong Pha Lai-A Lu 800
Hau Can Tho-Long Xuyen n.a
Cau Dap Cau-Pha Lai n.a Kenh Dong Tien-Lagrange n.a Tra Ly N3 Pham Lo-Yhai Binh n.a Luoc N3 Phuong Tra-Qui Cao 2000
Nam Dinh N3 Hung Long-N3 Doc Bo
2000
N3 Doc Bo-Cang Ninh Binh
1200 Day
Cua Day n.a Yen Bai-Viet Tri 150 Viet Tri-Hanoi 1500 Hanoi-Hong Chau 400 Hong Chau-Phuong Tra 400 Phuong Tra-Pham Lo 1200 Pham Lo-Hung Long 1200
Hong
Cua Lach Giang n.a Duong Cua Dau-My Loc 1200
Viet Tri-Bai Bang 1500 Lo
Bai Bang-Tuyen Quang n.a
Note: (-) Statistical data unavailable Source: TDSI