Embed Size (px)
Citation preview
66
67
International Journal of Business and Economic Sciences Applied Research
IJBESAR ijbesar.teiemt.gr
Aviation Fuel Hedging and Firm Value Analysis using Dynamic Panel Data Methodology: Evidence from the U.S. Major Passenger Airlines Ahmet Duran1 and Mahmut Sami Gungor2 *
1 Istanbul Technical University, Department of Mathematical Engineering 2 Istanbul Technical University, Department of Economics
ARTICLE INFO ABSTRACT Article History Received 18 May 2017 Accepted 16 July 2017
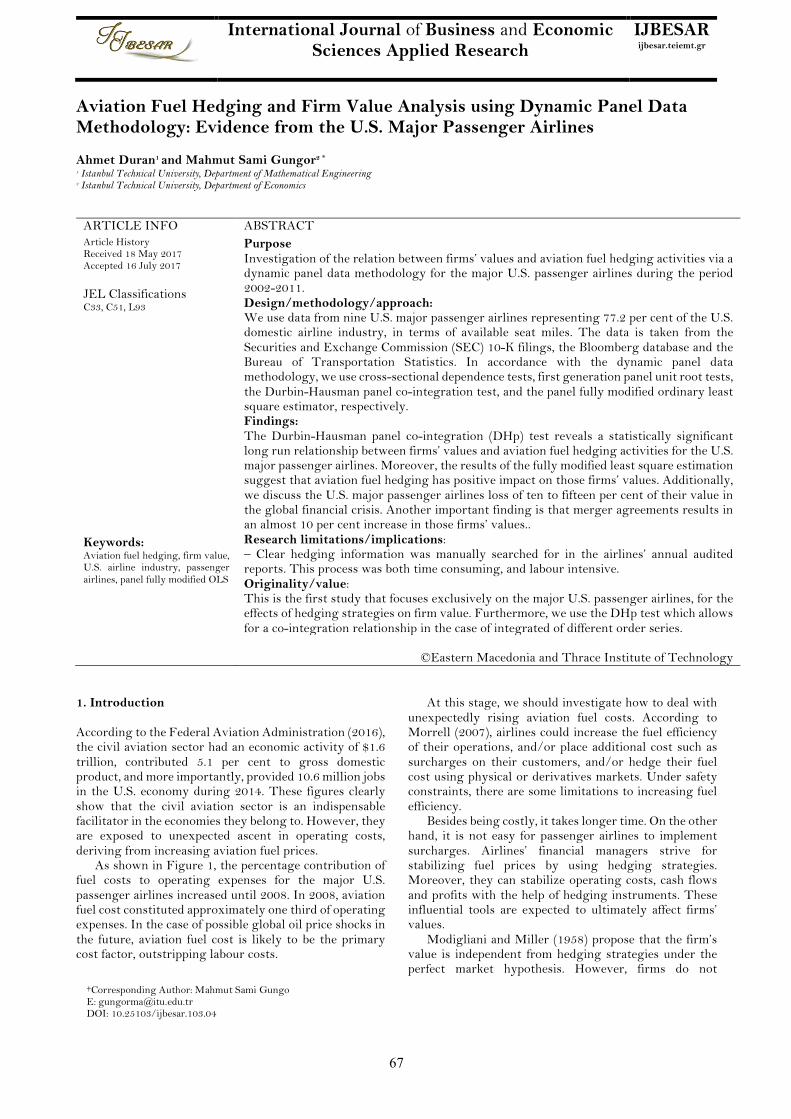
Purpose Investigation of the relation between firms’ values and aviation fuel hedging activities via a dynamic panel data methodology for the major U.S. passenger airlines during the period 2002-2011. Design/methodology/approach: We use data from nine U.S. major passenger airlines representing 77.2 per cent of the U.S. domestic airline industry, in terms of available seat miles. The data is taken from the Securities and Exchange Commission (SEC) 10-K filings, the Bloomberg database and the Bureau of Transportation Statistics. In accordance with the dynamic panel data methodology, we use cross-sectional dependence tests, first generation panel unit root tests, the Durbin-Hausman panel co-integration test, and the panel fully modified ordinary least square estimator, respectively. Findings: The Durbin-Hausman panel co-integration (DHp) test reveals a statistically significant long run relationship between firms’ values and aviation fuel hedging activities for the U.S. major passenger airlines. Moreover, the results of the fully modified least square estimation suggest that aviation fuel hedging has positive impact on those firms’ values. Additionally, we discuss the U.S. major passenger airlines loss of ten to fifteen per cent of their value in the global financial crisis. Another important finding is that merger agreements results in an almost 10 per cent increase in those firms’ values.. Research limitations/implications: – Clear hedging information was manually searched for in the airlines’ annual audited reports. This process was both time consuming, and labour intensive. Originality/value: This is the first study that focuses exclusively on the major U.S. passenger airlines, for the effects of hedging strategies on firm value. Furthermore, we use the DHp test which allows for a co-integration relationship in the case of integrated of different order series.
JEL Classifications C33, C51, L93 Keywords: Aviation fuel hedging, firm value, U.S. airline industry, passenger airlines, panel fully modified OLS
©Eastern Macedonia and Thrace Institute of Technology
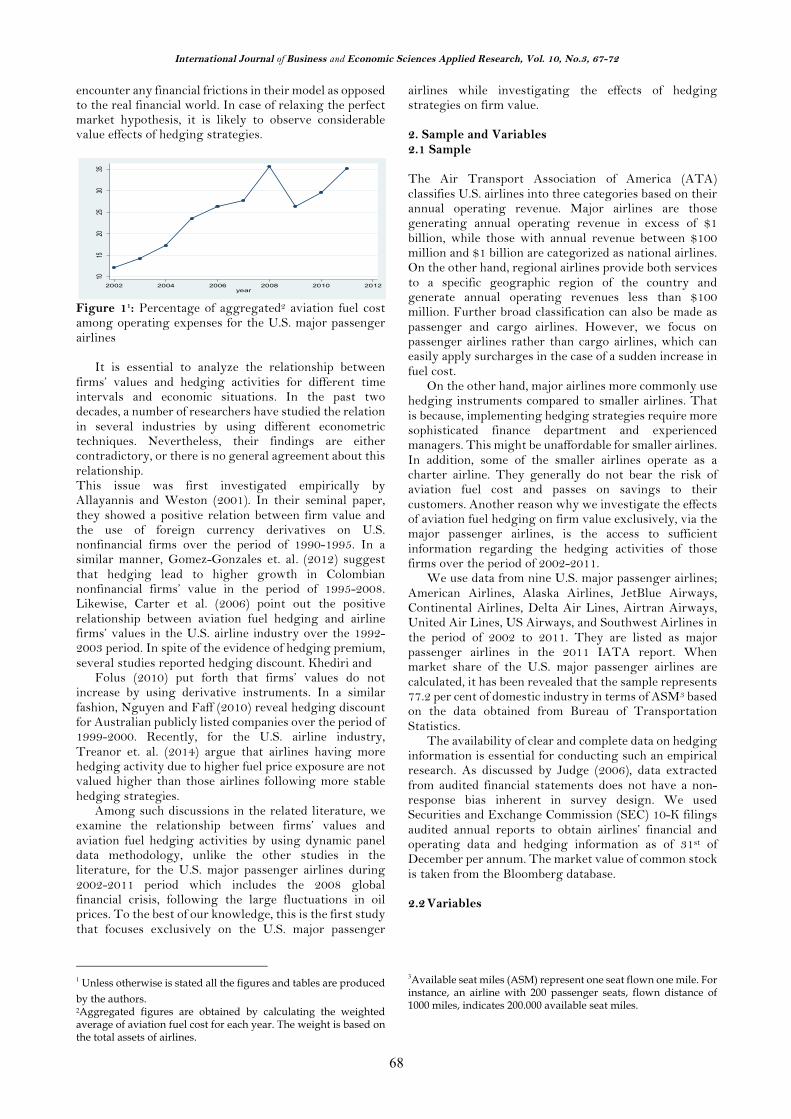
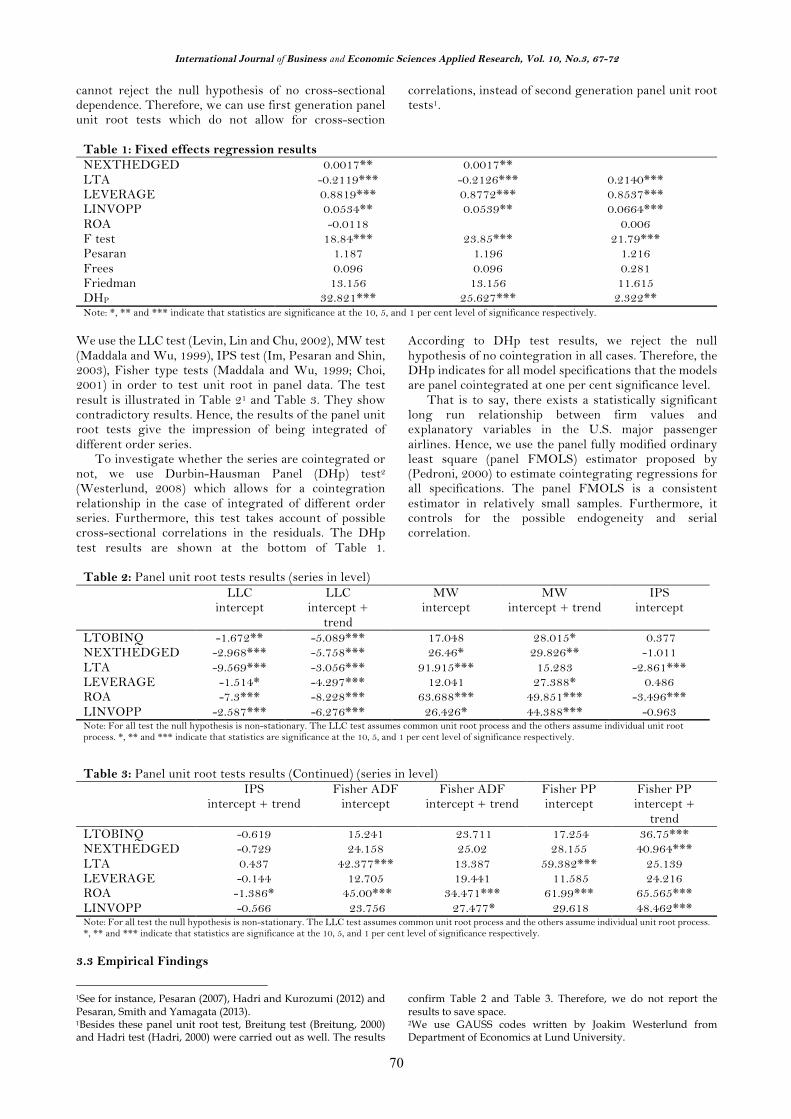
1. Introduction According to the Federal Aviation Administration (2016), the civil aviation sector had an economic activity of $1.6 trillion, contributed 5.1 per cent to gross domestic product, and more importantly, provided 10.6 million jobs in the U.S. economy during 2014. These figures clearly show that the civil aviation sector is an indispensable facilitator in the economies they belong to. However, they are exposed to unexpected ascent in operating costs, deriving from increasing aviation fuel prices. As shown in Figure 1, the percentage contribution of fuel costs to operating expenses for the major U.S. passenger airlines increased until 2008. In 2008, aviation fuel cost constituted approximately one third of operating expenses. In the case of possible global oil price shocks in the future, aviation fuel cost is likely to be the primary cost factor, outstripping labour costs.
At this stage, we should investigate how to deal with unexpectedly rising aviation fuel costs. According to Morrell (2007), airlines could increase the fuel efficiency of their operations, and/or place additional cost such as surcharges on their customers, and/or hedge their fuel cost using physical or derivatives markets. Under safety constraints, there are some limitations to increasing fuel efficiency. Besides being costly, it takes longer time. On the other hand, it is not easy for passenger airlines to implement surcharges. Airlines’ financial managers strive for stabilizing fuel prices by using hedging strategies. Moreover, they can stabilize operating costs, cash flows and profits with the help of hedging instruments. These influential tools are expected to ultimately affect firms’ values. Modigliani and Miller (1958) propose that the firm’s value is independent from hedging strategies under the perfect market hypothesis. However, firms do not
†Corresponding Author: Mahmut Sami Gungo
E: [email protected] DOI: 10.25103/ijbesar.103.04
International Journal of Business and Economic Sciences Applied Research, Vol. 10, No.3, 67-72
68
encounter any financial frictions in their model as opposed to the real financial world. In case of relaxing the perfect market hypothesis, it is likely to observe considerable value effects of hedging strategies.
Figure 11: Percentage of aggregated2 aviation fuel cost among operating expenses for the U.S. major passenger airlines It is essential to analyze the relationship between firms’ values and hedging activities for different time intervals and economic situations. In the past two decades, a number of researchers have studied the relation in several industries by using different econometric techniques. Nevertheless, their findings are either contradictory, or there is no general agreement about this relationship. This issue was first investigated empirically by Allayannis and Weston (2001). In their seminal paper, they showed a positive relation between firm value and the use of foreign currency derivatives on U.S. nonfinancial firms over the period of 1990-1995. In a similar manner, Gomez-Gonzales et. al. (2012) suggest that hedging lead to higher growth in Colombian nonfinancial firms’ value in the period of 1995-2008. Likewise, Carter et al. (2006) point out the positive relationship between aviation fuel hedging and airline firms’ values in the U.S. airline industry over the 1992-2003 period. In spite of the evidence of hedging premium, several studies reported hedging discount. Khediri and Folus (2010) put forth that firms’ values do not increase by using derivative instruments. In a similar fashion, Nguyen and Faff (2010) reveal hedging discount for Australian publicly listed companies over the period of 1999-2000. Recently, for the U.S. airline industry, Treanor et. al. (2014) argue that airlines having more hedging activity due to higher fuel price exposure are not valued higher than those airlines following more stable hedging strategies. Among such discussions in the related literature, we examine the relationship between firms’ values and aviation fuel hedging activities by using dynamic panel data methodology, unlike the other studies in the literature, for the U.S. major passenger airlines during 2002-2011 period which includes the 2008 global financial crisis, following the large fluctuations in oil prices. To the best of our knowledge, this is the first study that focuses exclusively on the U.S. major passenger
1 Unless otherwise is stated all the figures and tables are produced by the authors. 2Aggregated figures are obtained by calculating the weighted average of aviation fuel cost for each year. The weight is based on the total assets of airlines.
airlines while investigating the effects of hedging strategies on firm value. 2. Sample and Variables 2.1 Sample The Air Transport Association of America (ATA) classifies U.S. airlines into three categories based on their annual operating revenue. Major airlines are those generating annual operating revenue in excess of $1 billion, while those with annual revenue between $100 million and $1 billion are categorized as national airlines. On the other hand, regional airlines provide both services to a specific geographic region of the country and generate annual operating revenues less than $100 million. Further broad classification can also be made as passenger and cargo airlines. However, we focus on passenger airlines rather than cargo airlines, which can easily apply surcharges in the case of a sudden increase in fuel cost. On the other hand, major airlines more commonly use hedging instruments compared to smaller airlines. That is because, implementing hedging strategies require more sophisticated finance department and experienced managers. This might be unaffordable for smaller airlines. In addition, some of the smaller airlines operate as a charter airline. They generally do not bear the risk of aviation fuel cost and passes on savings to their customers. Another reason why we investigate the effects of aviation fuel hedging on firm value exclusively, via the major passenger airlines, is the access to sufficient information regarding the hedging activities of those firms over the period of 2002-2011. We use data from nine U.S. major passenger airlines; American Airlines, Alaska Airlines, JetBlue Airways, Continental Airlines, Delta Air Lines, Airtran Airways, United Air Lines, US Airways, and Southwest Airlines in the period of 2002 to 2011. They are listed as major passenger airlines in the 2011 IATA report. When market share of the U.S. major passenger airlines are calculated, it has been revealed that the sample represents 77.2 per cent of domestic industry in terms of ASM3 based on the data obtained from Bureau of Transportation Statistics. The availability of clear and complete data on hedging information is essential for conducting such an empirical research. As discussed by Judge (2006), data extracted from audited financial statements does not have a non-response bias inherent in survey design. We used Securities and Exchange Commission (SEC) 10-K filings audited annual reports to obtain airlines’ financial and operating data and hedging information as of 31st of December per annum. The market value of common stock is taken from the Bloomberg database. 2.2 Variables
3Available seat miles (ASM) represent one seat flown one mile. For instance, an airline with 200 passenger seats, flown distance of 1000 miles, indicates 200.000 available seat miles.
1015
2025
3035
Perce
ntage
of av
iation
fuel c
osts
2002 2004 2006 2008 2010 2012year
International Journal of Business and Economic Sciences Applied Research, Vol. 10, No.3, 67-72
69
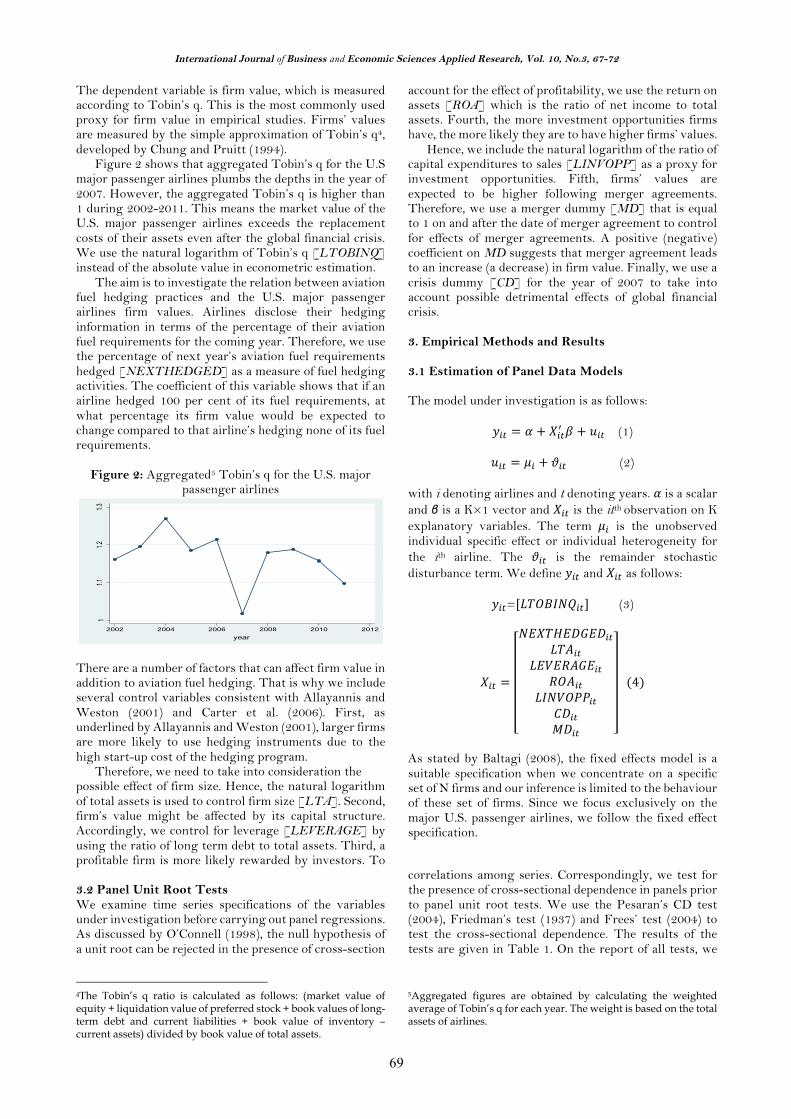
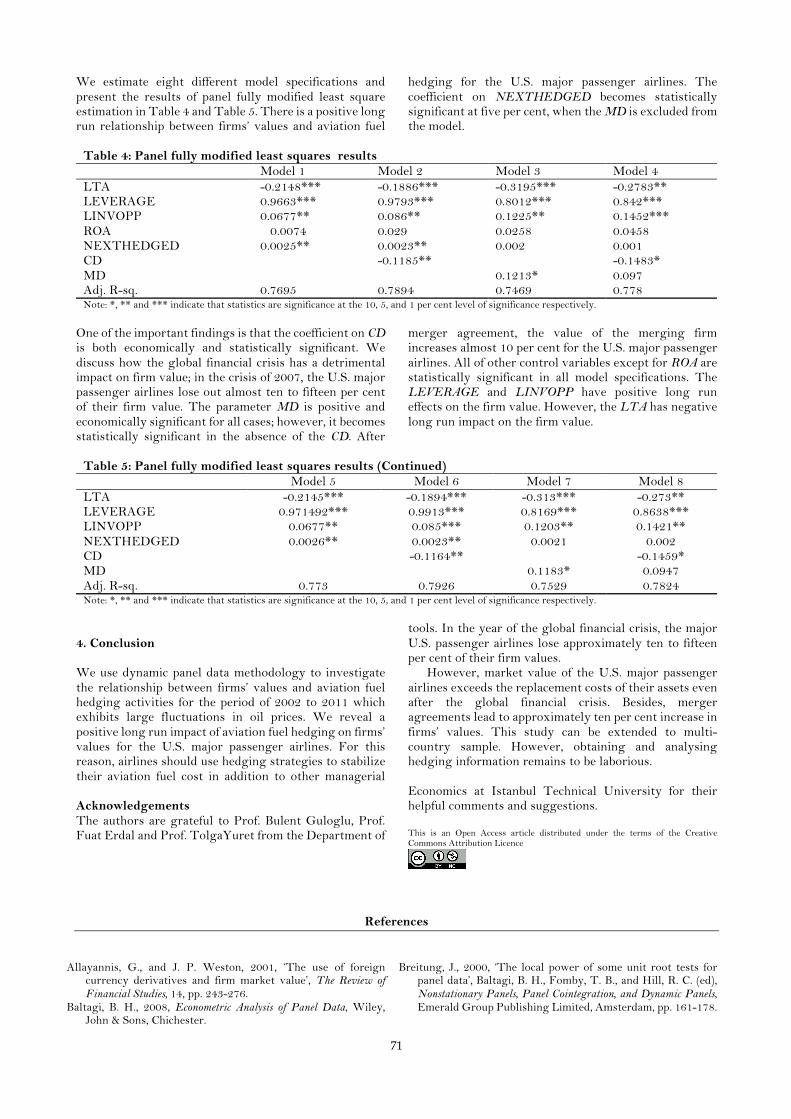
The dependent variable is firm value, which is measured according to Tobin’s q. This is the most commonly used proxy for firm value in empirical studies. Firms’ values are measured by the simple approximation of Tobin’s q4, developed by Chung and Pruitt (1994). Figure 2 shows that aggregated Tobin’s q for the U.S major passenger airlines plumbs the depths in the year of 2007. However, the aggregated Tobin’s q is higher than 1 during 2002-2011. This means the market value of the U.S. major passenger airlines exceeds the replacement costs of their assets even after the global financial crisis. We use the natural logarithm of Tobin’s q [LTOBINQ] instead of the absolute value in econometric estimation. The aim is to investigate the relation between aviation fuel hedging practices and the U.S. major passenger airlines firm values. Airlines disclose their hedging information in terms of the percentage of their aviation fuel requirements for the coming year. Therefore, we use the percentage of next year’s aviation fuel requirements hedged [NEXTHEDGED] as a measure of fuel hedging activities. The coefficient of this variable shows that if an airline hedged 100 per cent of its fuel requirements, at what percentage its firm value would be expected to change compared to that airline’s hedging none of its fuel requirements.
Figure 2: Aggregated5 Tobin’s q for the U.S. major passenger airlines
There are a number of factors that can affect firm value in addition to aviation fuel hedging. That is why we include several control variables consistent with Allayannis and Weston (2001) and Carter et al. (2006). First, as underlined by Allayannis and Weston (2001), larger firms are more likely to use hedging instruments due to the high start-up cost of the hedging program. Therefore, we need to take into consideration the possible effect of firm size. Hence, the natural logarithm of total assets is used to control firm size [LTA]. Second, firm’s value might be affected by its capital structure. Accordingly, we control for leverage [LEVERAGE] by using the ratio of long term debt to total assets. Third, a profitable firm is more likely rewarded by investors. To
account for the effect of profitability, we use the return on assets [ROA] which is the ratio of net income to total assets. Fourth, the more investment opportunities firms have, the more likely they are to have higher firms’ values. Hence, we include the natural logarithm of the ratio of capital expenditures to sales [LINVOPP] as a proxy for investment opportunities. Fifth, firms’ values are expected to be higher following merger agreements. Therefore, we use a merger dummy [MD] that is equal to 1 on and after the date of merger agreement to control for effects of merger agreements. A positive (negative) coefficient on MD suggests that merger agreement leads to an increase (a decrease) in firm value. Finally, we use a crisis dummy [CD] for the year of 2007 to take into account possible detrimental effects of global financial crisis. 3. Empirical Methods and Results 3.1 Estimation of Panel Data Models The model under investigation is as follows:
𝑦"# = 𝛼 + 𝑋"#( 𝛽 + 𝑢"# (1)
𝑢"# = 𝜇" + 𝜗"#(2)
with i denoting airlines and t denoting years. 𝛼is a scalar and β is a K×1 vector and 𝑋"# is the itth observation on K explanatory variables. The term 𝜇" is the unobserved individual specific effect or individual heterogeneity for the ith airline. The 𝜗"# is the remainder stochastic disturbance term. We define 𝑦"# and 𝑋"# as follows:
𝑦"#=[𝐿𝑇𝑂𝐵𝐼𝑁𝑄"#] (3)
𝑋"# =
𝑁𝐸𝑋𝑇𝐻𝐸𝐷𝐺𝐸𝐷"#𝐿𝑇𝐴"#
𝐿𝐸𝑉𝐸𝑅𝐴𝐺𝐸"#𝑅𝑂𝐴"#
𝐿𝐼𝑁𝑉𝑂𝑃𝑃"#𝐶𝐷"#𝑀𝐷"#
(4)
As stated by Baltagi (2008), the fixed effects model is a suitable specification when we concentrate on a specific set of N firms and our inference is limited to the behaviour of these set of firms. Since we focus exclusively on the major U.S. passenger airlines, we follow the fixed effect specification.
3.2 Panel Unit Root Tests We examine time series specifications of the variables under investigation before carrying out panel regressions. As discussed by O’Connell (1998), the null hypothesis of a unit root can be rejected in the presence of cross-section
4The Tobin’s q ratio is calculated as follows: (market value of equity + liquidation value of preferred stock + book values of long-term debt and current liabilities + book value of inventory – current assets) divided by book value of total assets.
correlations among series. Correspondingly, we test for the presence of cross-sectional dependence in panels prior to panel unit root tests. We use the Pesaran’s CD test (2004), Friedman’s test (1937) and Frees’ test (2004) to test the cross-sectional dependence. The results of the tests are given in Table 1. On the report of all tests, we
5Aggregated figures are obtained by calculating the weighted average of Tobin’s q for each year. The weight is based on the total assets of airlines.
11.1
1.21.3
Aggre
gated
Tobin
's Q
2002 2004 2006 2008 2010 2012year
International Journal of Business and Economic Sciences Applied Research, Vol. 10, No.3, 67-72
70
cannot reject the null hypothesis of no cross-sectional dependence. Therefore, we can use first generation panel unit root tests which do not allow for cross-section
correlations, instead of second generation panel unit root tests1.
We use the LLC test (Levin, Lin and Chu, 2002), MW test (Maddala and Wu, 1999), IPS test (Im, Pesaran and Shin, 2003), Fisher type tests (Maddala and Wu, 1999; Choi, 2001) in order to test unit root in panel data. The test result is illustrated in Table 21 and Table 3. They show contradictory results. Hence, the results of the panel unit root tests give the impression of being integrated of different order series. To investigate whether the series are cointegrated or not, we use Durbin-Hausman Panel (DHp) test2 (Westerlund, 2008) which allows for a cointegration relationship in the case of integrated of different order series. Furthermore, this test takes account of possible cross-sectional correlations in the residuals. The DHp test results are shown at the bottom of Table 1.
According to DHp test results, we reject the null hypothesis of no cointegration in all cases. Therefore, the DHp indicates for all model specifications that the models are panel cointegrated at one per cent significance level. That is to say, there exists a statistically significant long run relationship between firm values and explanatory variables in the U.S. major passenger airlines. Hence, we use the panel fully modified ordinary least square (panel FMOLS) estimator proposed by (Pedroni, 2000) to estimate cointegrating regressions for all specifications. The panel FMOLS is a consistent estimator in relatively small samples. Furthermore, it controls for the possible endogeneity and serial correlation.
Table 2: Panel unit root tests results (series in level) LLC
intercept LLC
intercept + trend
MW intercept
MW intercept + trend
IPS intercept
LTOBINQ -1.672** -5.089*** 17.048 28.015* 0.377 NEXTHEDGED -2.968*** -5.758*** 26.46* 29.826** -1.011 LTA -9.569*** -3.056*** 91.915*** 15.283 -2.861*** LEVERAGE -1.514* -4.297*** 12.041 27.388* 0.486 ROA -7.3*** -8.228*** 63.688*** 49.851*** -3.496*** LINVOPP -2.587*** -6.276*** 26.426* 44.388*** -0.963 Note: For all test the null hypothesis is non-stationary. The LLC test assumes common unit root process and the others assume individual unit root process. *, ** and *** indicate that statistics are significance at the 10, 5, and 1 per cent level of significance respectively.
Table 3: Panel unit root tests results (Continued) (series in level) IPS
intercept + trend Fisher ADF
intercept Fisher ADF
intercept + trend Fisher PP intercept
Fisher PP intercept +
trend LTOBINQ -0.619 15.241 23.711 17.254 36.75*** NEXTHEDGED -0.729 24.158 25.02 28.155 40.964*** LTA 0.437 42.377*** 13.387 59.382*** 25.139 LEVERAGE -0.144 12.705 19.441 11.585 24.216 ROA -1.386* 45.00*** 34.471*** 61.99*** 65.565*** LINVOPP -0.566 23.756 27.477* 29.618 48.462*** Note: For all test the null hypothesis is non-stationary. The LLC test assumes common unit root process and the others assume individual unit root process. *, ** and *** indicate that statistics are significance at the 10, 5, and 1 per cent level of significance respectively.
3.3 Empirical Findings
1See for instance, Pesaran (2007), Hadri and Kurozumi (2012) and Pesaran, Smith and Yamagata (2013). 1Besides these panel unit root test, Breitung test (Breitung, 2000) and Hadri test (Hadri, 2000) were carried out as well. The results
confirm Table 2 and Table 3. Therefore, we do not report the results to save space. 2We use GAUSS codes written by Joakim Westerlund from Department of Economics at Lund University.
Table 1: Fixed effects regression results NEXTHEDGED 0.0017** 0.0017** LTA -0.2119*** -0.2126*** 0.2140*** LEVERAGE 0.8819*** 0.8772*** 0.8537*** LINVOPP 0.0534** 0.0539** 0.0664*** ROA -0.0118 0.006 F test 18.84*** 23.85*** 21.79*** Pesaran 1.187 1.196 1.216 Frees 0.096 0.096 0.281 Friedman 13.156 13.156 11.615 DHP 32.821*** 25.627*** 2.322** Note: *, ** and *** indicate that statistics are significance at the 10, 5, and 1 per cent level of significance respectively.
71
We estimate eight different model specifications and present the results of panel fully modified least square estimation in Table 4 and Table 5. There is a positive long run relationship between firms’ values and aviation fuel
hedging for the U.S. major passenger airlines. The coefficient on NEXTHEDGED becomes statistically significant at five per cent, when the MD is excluded from the model.
Table 4: Panel fully modified least squares results Model 1 Model 2 Model 3 Model 4 LTA -0.2148*** -0.1886*** -0.3195*** -0.2783** LEVERAGE 0.9663*** 0.9793*** 0.8012*** 0.842*** LINVOPP 0.0677** 0.086** 0.1225** 0.1452*** ROA 0.0074 0.029 0.0258 0.0458 NEXTHEDGED 0.0025** 0.0023** 0.002 0.001 CD -0.1185** -0.1483* MD 0.1213* 0.097 Adj. R-sq. 0.7695 0.7894 0.7469 0.778 Note: *, ** and *** indicate that statistics are significance at the 10, 5, and 1 per cent level of significance respectively.
One of the important findings is that the coefficient on CD is both economically and statistically significant. We discuss how the global financial crisis has a detrimental impact on firm value; in the crisis of 2007, the U.S. major passenger airlines lose out almost ten to fifteen per cent of their firm value. The parameter MD is positive and economically significant for all cases; however, it becomes statistically significant in the absence of the CD. After
merger agreement, the value of the merging firm increases almost 10 per cent for the U.S. major passenger airlines. All of other control variables except for ROA are statistically significant in all model specifications. The LEVERAGE and LINVOPP have positive long run effects on the firm value. However, the LTA has negative long run impact on the firm value.
Table 5: Panel fully modified least squares results (Continued) Model 5 Model 6 Model 7 Model 8 LTA -0.2145*** -0.1894*** -0.313*** -0.273** LEVERAGE 0.971492*** 0.9913*** 0.8169*** 0.8638*** LINVOPP 0.0677** 0.085*** 0.1203** 0.1421** NEXTHEDGED 0.0026** 0.0023** 0.0021 0.002 CD -0.1164** -0.1459* MD 0.1183* 0.0947 Adj. R-sq. 0.773 0.7926 0.7529 0.7824 Note: *, ** and *** indicate that statistics are significance at the 10, 5, and 1 per cent level of significance respectively.
4. Conclusion We use dynamic panel data methodology to investigate the relationship between firms’ values and aviation fuel hedging activities for the period of 2002 to 2011 which exhibits large fluctuations in oil prices. We reveal a positive long run impact of aviation fuel hedging on firms’ values for the U.S. major passenger airlines. For this reason, airlines should use hedging strategies to stabilize their aviation fuel cost in addition to other managerial
tools. In the year of the global financial crisis, the major U.S. passenger airlines lose approximately ten to fifteen per cent of their firm values. However, market value of the U.S. major passenger airlines exceeds the replacement costs of their assets even after the global financial crisis. Besides, merger agreements lead to approximately ten per cent increase in firms’ values. This study can be extended to multi-country sample. However, obtaining and analysing hedging information remains to be laborious.
Acknowledgements The authors are grateful to Prof. Bulent Guloglu, Prof. Fuat Erdal and Prof. TolgaYuret from the Department of
Economics at Istanbul Technical University for their helpful comments and suggestions. This is an Open Access article distributed under the terms of the Creative Commons Attribution Licence
References
Allayannis, G., and J. P. Weston, 2001, ‘The use of foreign currency derivatives and firm market value’, The Review of Financial Studies, 14, pp. 243-276.
Baltagi, B. H., 2008, Econometric Analysis of Panel Data, Wiley, John & Sons, Chichester.
Breitung, J., 2000, ‘The local power of some unit root tests for panel data’, Baltagi, B. H., Fomby, T. B., and Hill, R. C. (ed), Nonstationary Panels, Panel Cointegration, and Dynamic Panels, Emerald Group Publishing Limited, Amsterdam, pp. 161-178.
International Journal of Business and Economic Sciences Applied Research, Vol. 10, No.3, 67-72
72
Carter, D.A., D.A. Rogers, and B.J. Simkins, 2006, ‘Does hedging affect firm value? Evidence from the US airline industry’, Financial Management, 35, pp. 53-86.
Choi, I., 2001, ‘Unit root tests for panel data’, Journal of International Money and Finance, 20, pp. 249–72.
Chung, K.H., and S.W. Pruitt, 1994, ‘A simple approximation of Tobin’s q’, Financial Management, 23, pp. 70-74.
Federal Aviation Administration, 2016, ‘The Economic Impact of Civil Aviation on the U.S. Economy’, https://www.faa.gov/air_traffic/publications/media/2016-economic-impact-report_FINAL.pdf
Frees, E.W., 2004, Longitudinal and Panel Data: Analysis and Applications in the Social Sciences, Cambridge University Press, Cambridge.
Friedman, M., 1937, ‘The use of ranks to avoid the assumption of normality implicit in the analysis of variance’, Journal of the American Statistical Association, 32, pp. 675–701.
Gomez-Gonzalez, J.E., C.E.L. Rincon, and K.J.L. Rodriguez, 2012, ‘Does the use of foreign currency derivatives affect firms’ market value? Evidence from Colombia’, Emerging Markets Finance & Trade, 48, pp. 50-66.
Hadri, K., and E. Kurozumi, 2012, ‘A simple panel stationarity test in the presence of serial correlation and a common factor’, Economics Letters, 115, pp. 31–34.
Hadri, K., 2000, ‘Testing for stationarity in heterogenous panel data’, Econometrics Journal, 3, pp. 148-161.
Im, K.S., M.H. Pesaran, and Y. Shin, 2003, ‘Testing for unit roots in heterogeneous panels’, Journal of Econometrics, 115, pp. 53–74.
International Air Transport Association, 2011, ‘US DOT form 41 airline operational cost analysis report’, http://www.iata.org/workgroups/Documents/aoctf-FY0809-form41-report.pdf
Khediri, K. B., and D. Folus, 2010, ‘Does hedging increase firm value? Evidence from French firms’, Applied Economics Letters, 17, pp. 995-998.
Levin, A., C. Lin, and C. Chu, 2002, ‘Unit root tests in panel data: asymptotic and finite sample properties’, Journal of Econometrics, 108, pp. 1-24.
Maddala, G. S., and S. Wu, 1999, ‘A comparative study of unit root tests with panel data and a new simple test’, Oxford Bulletin of Economics and Statistics, special issue, pp. 631–52.
Modigliani, F., and M. Miller, 1958, ‘The Cost of Capital, Corporation Finance and the Theory of Investment’, American Economic Review, 48(3), pp. 261-297.
Morrell, P., 2007, Airline Finance, Ashgate Publishing Limited, Hampshire.
Nguyen, H., and R. Faff, 2010, ‘Does the type of derivative instrument used by companies impact firm value?, Applied Economics Letters, 17, pp. 681-683.
O’Connell, P., 1998, ‘The overvaluation of purchasing power parity’, Journal of International Economics, 44, pp. 1–19.
Pedroni, P., 2000, ‘Fully modified OLS for heterogeneous cointegrated panels’, Baltagi, B. H., Fomby, T. B., and Hill, R. C. (ed), Nonstationary Panels, Panel Cointegration, and Dynamic Panels, Emerald Group Publishing Limited, Amsterdam, pp. 93–130.
Pesaran, M.H., 2007, ‘A simple unit root test in the presence of cross-section dependence’, Journal of Applied Econometrics, 22, pp. 265-312.
Pesaran, M.H., 2004, General diagnostic tests for cross section dependence in panels, University of Cambridge, Cambridge Working Papers in Economics No. 0435.
Pesaran, M.H., L.V. Smith, and T. Yamagata, 2013, ‘Panel unit root tests in the presence of a multifactor error structure’, Journal of Econometrics, 175, pp. 94–115.
Treanor, S.D., D.A. Rogers, D.A. Carter, and B.J. Simkins, 2014, Exposure, hedging, and value: New evidence from the U.S. airline industry’, International Review of Financial Analysis, 34, pp. 200–211.
Westerlund, J., 2008, ‘Panel cointegratıon tests of the Fisher effect’, Journal of Applied Econometrics, 23, pp. 193–233.