Embed Size (px)
Citation preview
3rd IEA International Research Conference (IRC-2008)Taipei, 18 - 20 September 2008
Measuring progress and performance of education systems in the European Union
Present and future role of IEA surveys and studies
Dr. Anders Joest Hingel
European CommissionDirectorate General Education and Culture
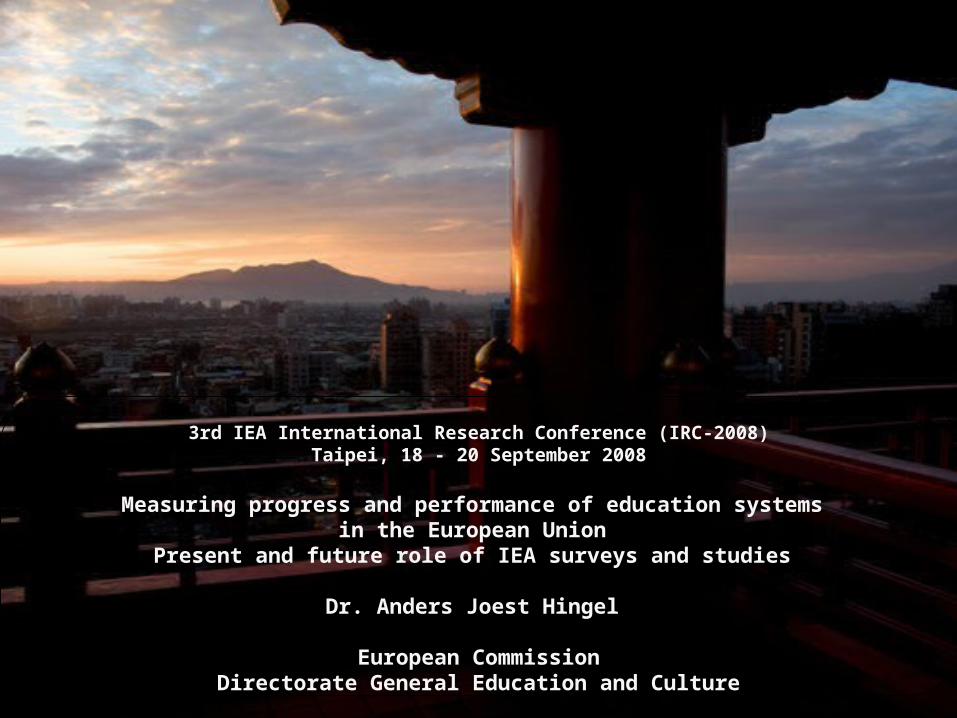
Plan of the speechMonitoring progress of education systems in European policiesThe coherent framework of indicators and benchmarksThe 2008 Progress Report on education and trainingDevelopment of new indicators and international surveys The need for secondary analysis
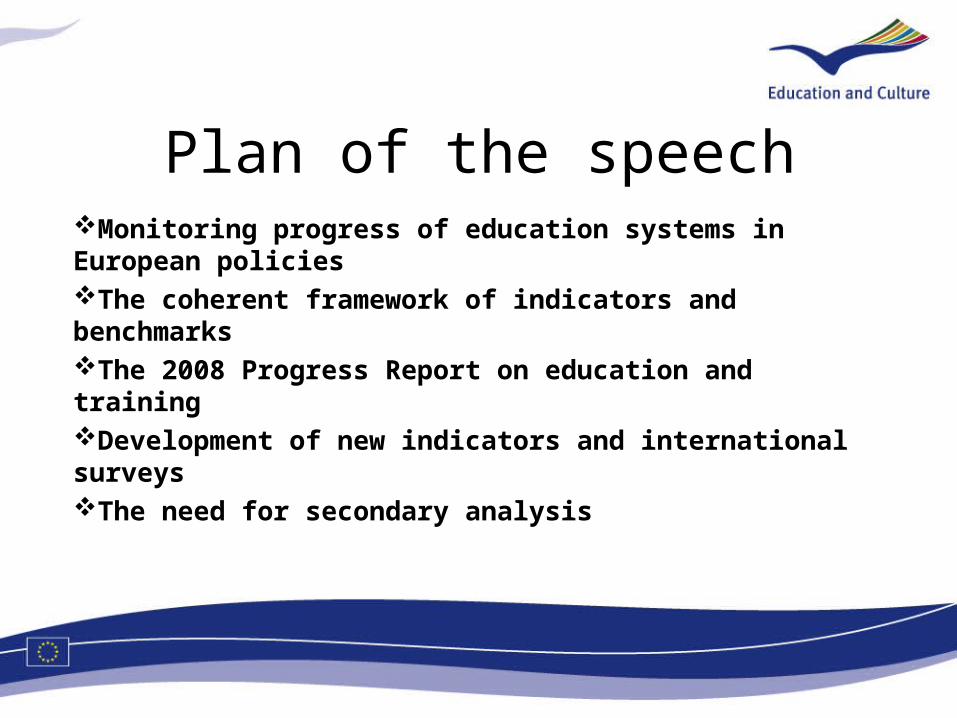
The Lisbon strategy (2000 - 2010)
• A co-ordinated strategy (by European Council Spring summits)
• A comprehensive strategy with common objectives
• Implementation through the Open Method of Co-ordination• Guidelines for the Union• Indicators and benchmarks• Exchange of good practice• Peer reviews and mutual learning processes
“By 2010 ‘Europe should become the most competitive and dynamic knowledge based economy in the world, capable of sustainable economic growth, with more and better jobs and greater social cohesion.”
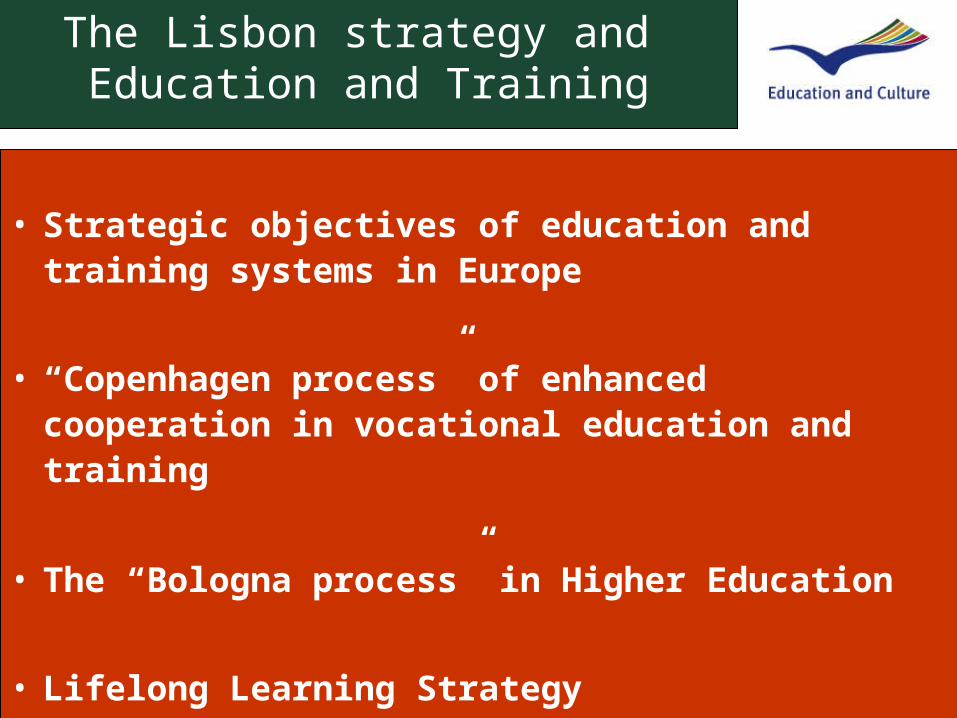
The Lisbon strategy and Education and Training
• Strategic objectives of education and training systems in Europe
• “Copenhagen process” of enhanced cooperation in vocational education and training
• The “Bologna process” in Higher Education
• Lifelong Learning Strategy
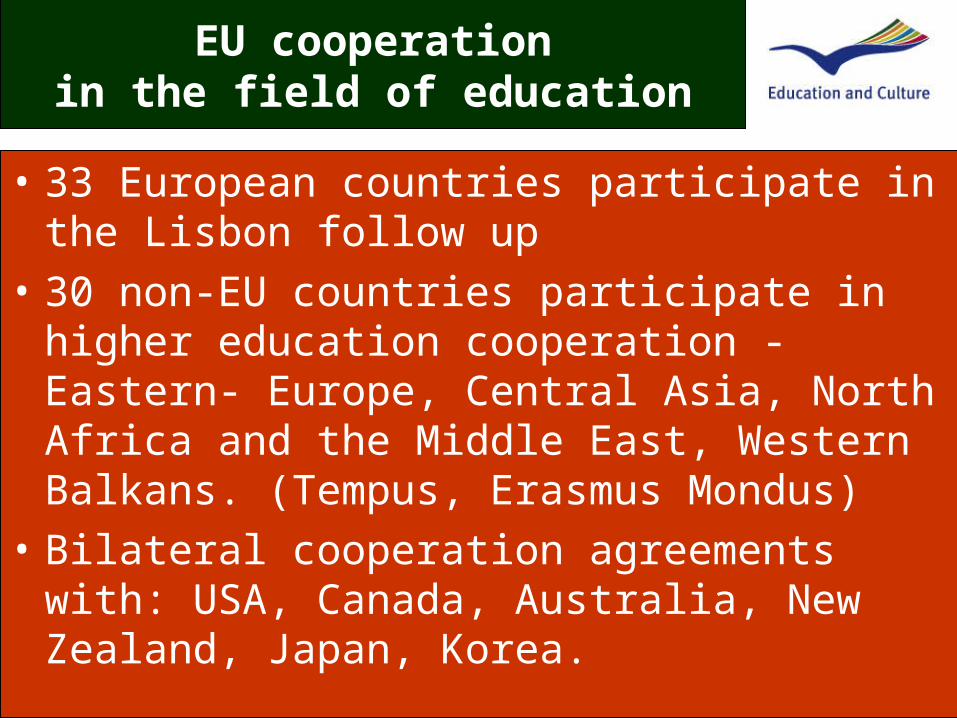
• 33 European countries participate in the Lisbon follow up
• 30 non-EU countries participate in higher education cooperation - Eastern- Europe, Central Asia, North Africa and the Middle East, Western Balkans. (Tempus, Erasmus Mondus)
• Bilateral cooperation agreements with: USA, Canada, Australia, New Zealand, Japan, Korea.
EU cooperationin the field of education
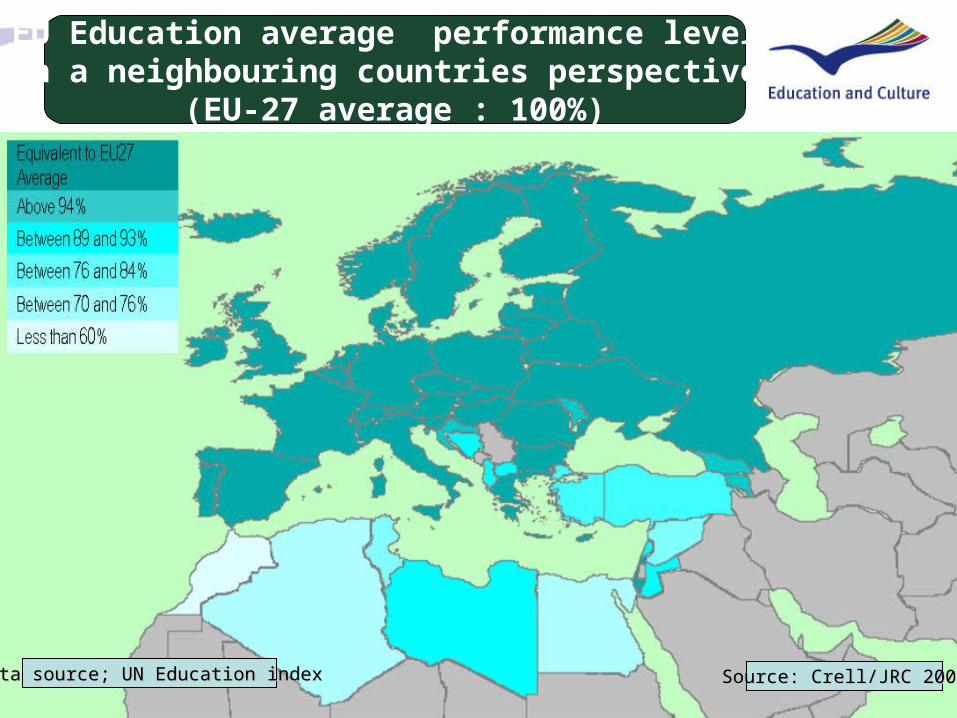
EU Education average performance level in a neighbouring countries perspective
(EU-27 average : 100%)
Source: Crell/JRC 2008Source: Crell/JRC 2008Data source; UN Education indexData source; UN Education index
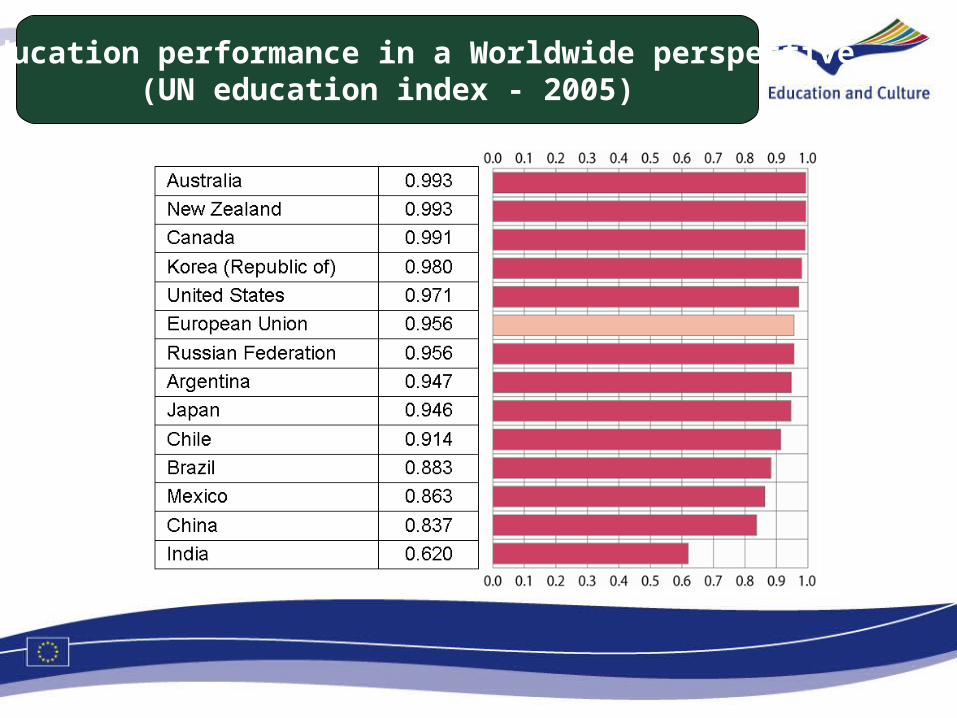
EU Education performance in a Worldwide perspective(UN education index - 2005)
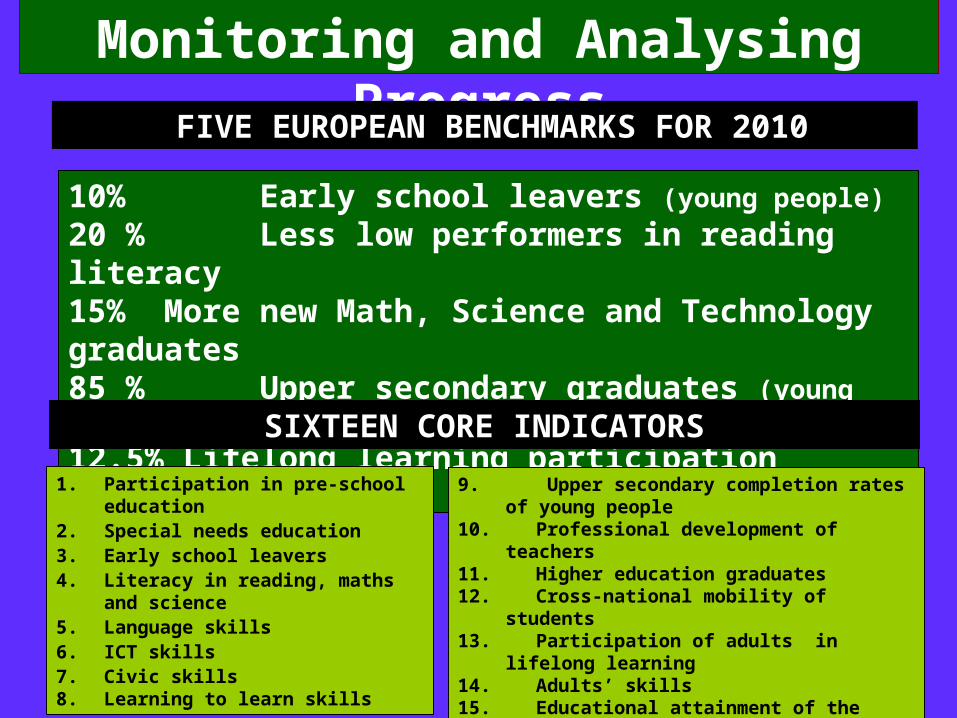
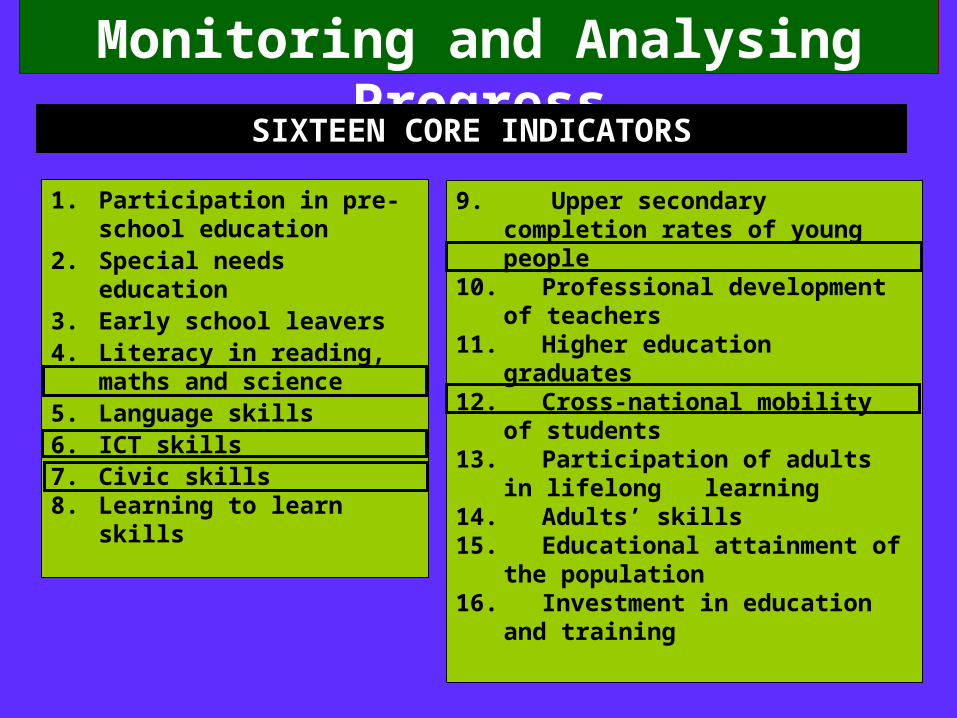
Monitoring and Analysing Progress
10% Early school leavers (young people)
20 % Less low performers in reading literacy 15% More new Math, Science and Technology graduates 85 % Upper secondary graduates (young people)
12.5% Lifelong learning participation (adults)
SIXTEEN CORE INDICATORS
1. Participation in pre-school education 2. Special needs education3. Early school leavers4. Literacy in reading, maths and science5. Language skills6. ICT skills7. Civic skills8. Learning to learn skills
9. Upper secondary completion rates of young people 10. Professional development of teachers 11. Higher education graduates12. Cross-national mobility of students13. Participation of adults in lifelong learning14. Adults’ skills15. Educational attainment of the population 16. Investment in education and training
kglglgFIVE EUROPEAN BENCHMARKS FOR 2010
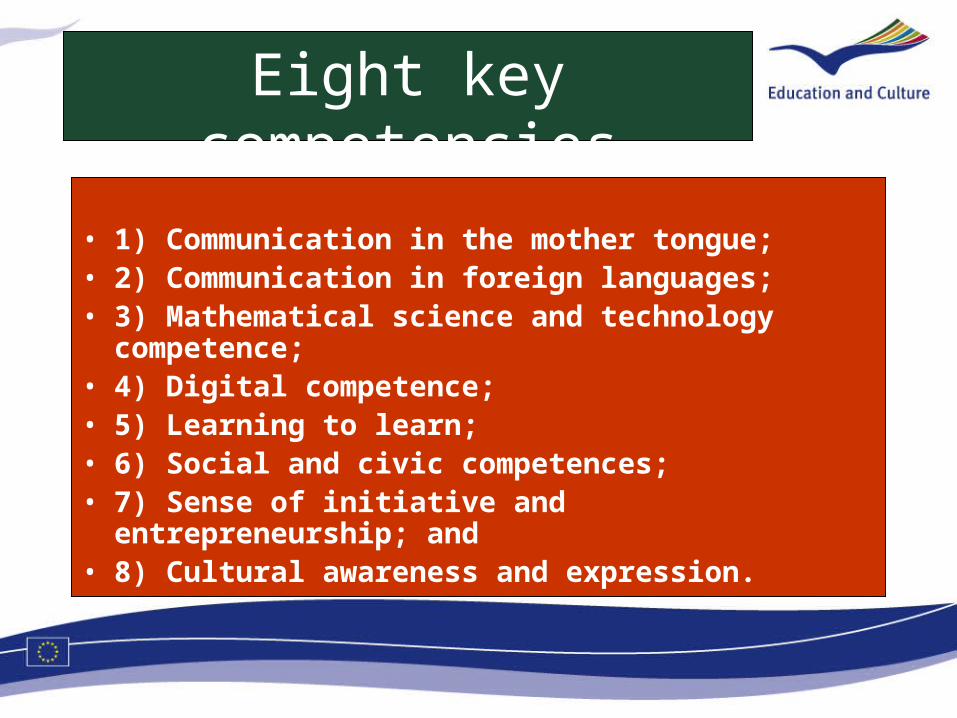
Eight key competencies
• 1) Communication in the mother tongue;• 2) Communication in foreign languages;• 3) Mathematical science and technology competence;• 4) Digital competence;• 5) Learning to learn; • 6) Social and civic competences;• 7) Sense of initiative and entrepreneurship; and• 8) Cultural awareness and expression.
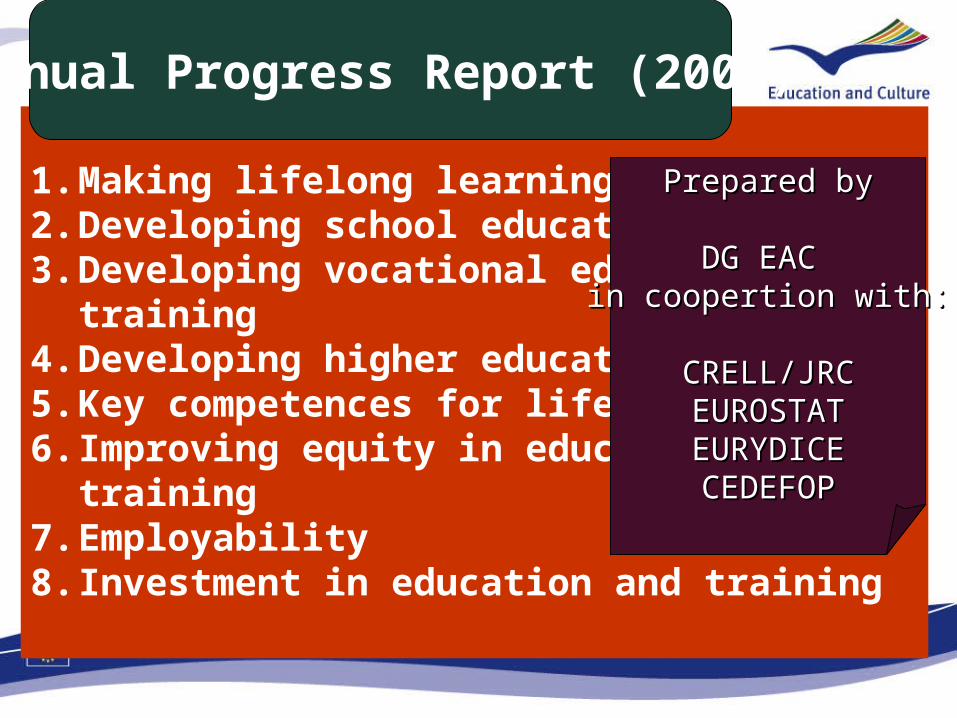
1. Making lifelong learning a reality 2. Developing school education3. Developing vocational education and training4. Developing higher education5. Key competences for lifelong learning6. Improving equity in education and training7. Employability8. Investment in education and training
Annual Progress Report (2008)
Prepared byPrepared by
DG EAC DG EAC in coopertion with:in coopertion with:
CRELL/JRCCRELL/JRCEUROSTATEUROSTATEURYDICEEURYDICECEDEFOPCEDEFOP
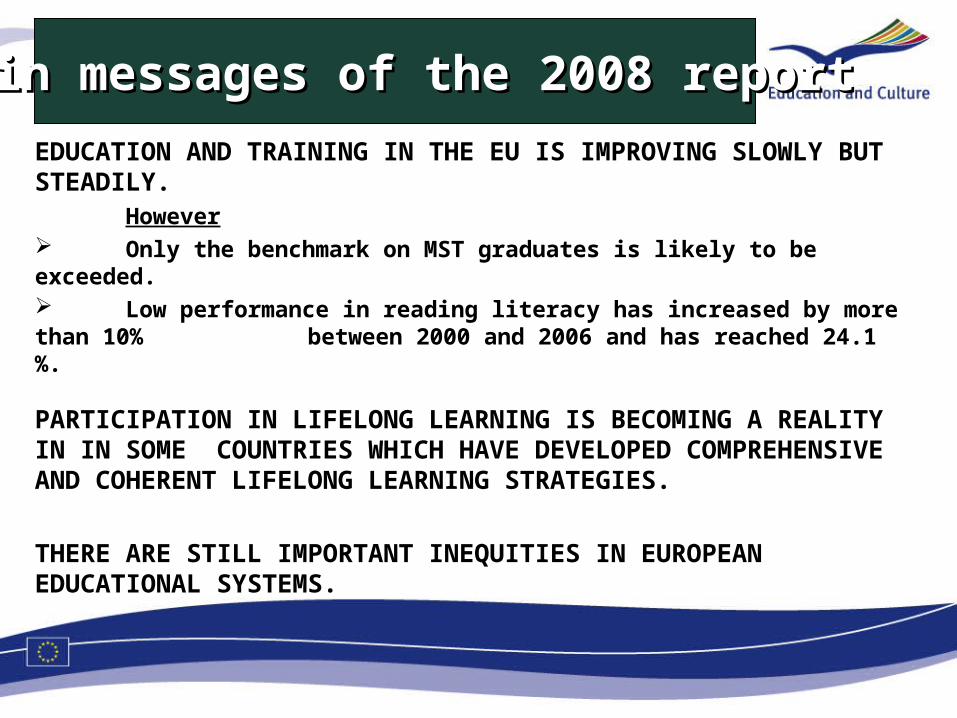
EDUCATION AND TRAINING IN THE EU IS IMPROVING SLOWLY BUT STEADILY.
However Only the benchmark on MST graduates is likely to be exceeded. Low performance in reading literacy has increased by more than 10%
between 2000 and 2006 and has reached 24.1 %.
PARTICIPATION IN LIFELONG LEARNING IS BECOMING A REALITY IN IN SOME COUNTRIES WHICH HAVE DEVELOPED COMPREHENSIVE AND COHERENT LIFELONG LEARNING STRATEGIES.
THERE ARE STILL IMPORTANT INEQUITIES IN EUROPEAN EDUCATIONAL SYSTEMS.
Main messages of the 2008 reportMain messages of the 2008 report
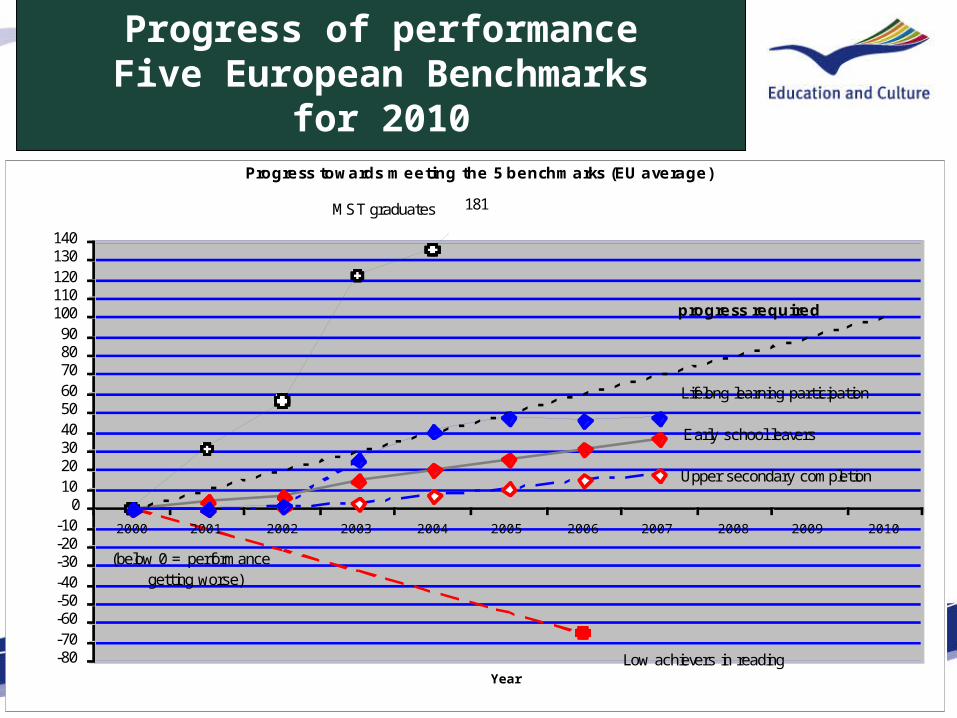
Progress of performanceFive European Benchmarks
for 2010Progress towards meeting the 5 benchmarks (EU average)
-80-70-60-50-40-30-20-10
0102030405060708090
100110120130140
2000 2001 2002 2003 2004 2005 2006 2007 2008 2009 2010
Year
2010 benchmarks = 100
MST graduates
Lifelong learning participation
Early school leavers
Upper secondary completion
Low achievers in reading
progress required
181
(below 0 = performance getting worse)
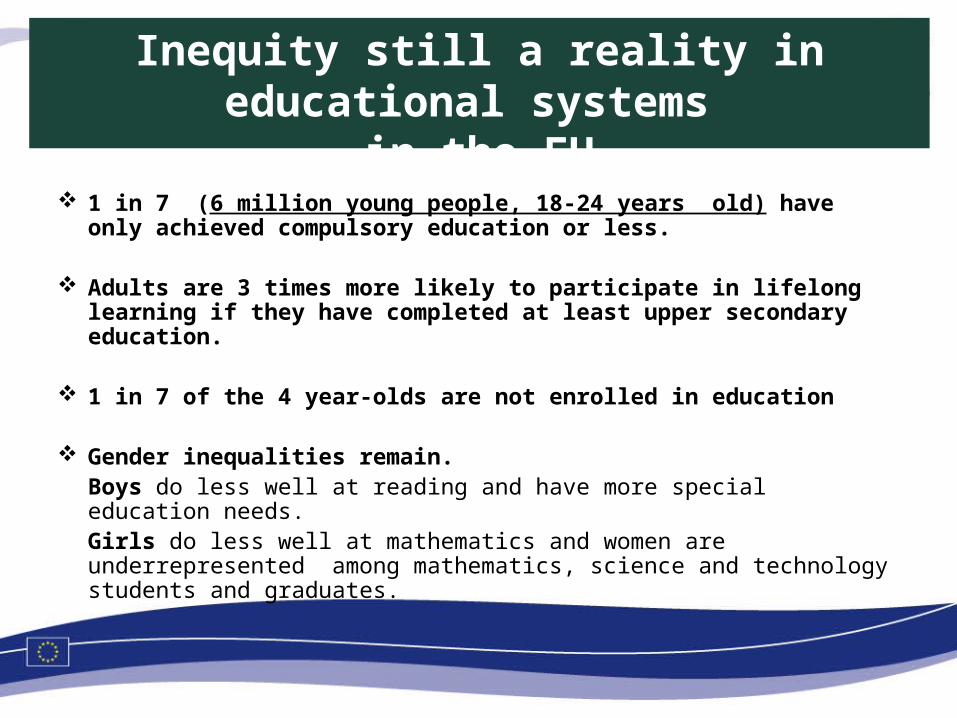
Inequity still a reality in educational systems in the EU
1 in 7 (6 million young people, 18-24 years old) have only achieved compulsory education or less.
Adults are 3 times more likely to participate in lifelong learning if they have completed at least upper secondary education.
1 in 7 of the 4 year-olds are not enrolled in education
Gender inequalities remain. Boys do less well at reading and have more special education needs. Girls do less well at mathematics and women are underrepresented among mathematics, science and technology students and graduates.
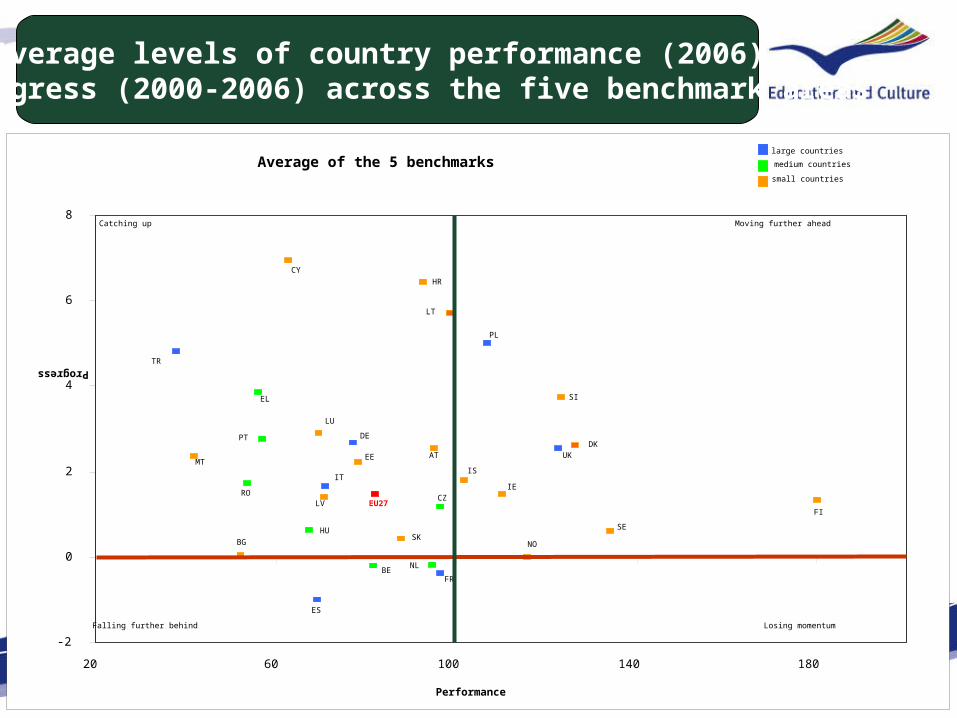
Average levels of country performance (2006) and progress (2000-2006) across the five benchmark areas
Average of the 5 benchmarks
DK
BE
BG
CZ
DE
EE
IE
EL
ES
FR
IT
CY
LV
LT
LU
HU
MT
NL
AT
PL
PT
RO
SI
SK
FI
SE
UK
HR
TR
IS
NO
EU27
-2
0
2
4
6
8
20 60 100 140 180
Performance
Progress
Catching up Moving further ahead
Falling further behind Losing momentum
large countries
medium countries
small countries
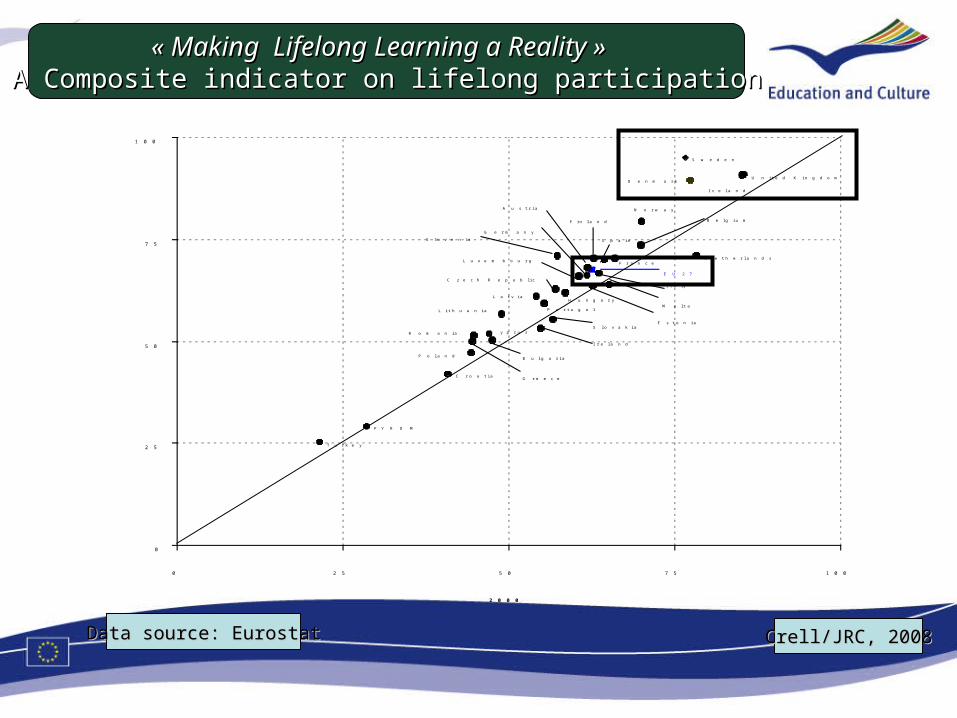
S w e d e n
U n i t e d K i n g d o m
T u r k e y
F r a n c e
E U 2 7
I t a l y
C y p r u s
L a t v i a
L i t h u a n i a
L u x e m b o u r g
H u n g a r y
M a l t a
N e t h e r l a n d s
A u s t r i a
P o l a n d
P o r t u g a l
R o m a n i a
S l o v e n i a
S l o v a k i a
F i n l a n d
C r o a t i a
F Y R O M
I c e l a n d
N o r w a y
B u l g a r i a
B e l g i u m
C z e c h R e p u b l i c
D e n m a r k
G e r m a n y
E s t o n i a
I r e l a n d
G r e e c e
S p a i n
0
2 5
5 0
7 5
1 0 0
0 2 5 5 0 7 5 1 0 0
2 0 0 0
2005
« Making Lifelong Learning a Reality »« Making Lifelong Learning a Reality » A Composite indicator on lifelong participationA Composite indicator on lifelong participation
Crell/JRC, 2008Crell/JRC, 2008Data source: EurostatData source: Eurostat
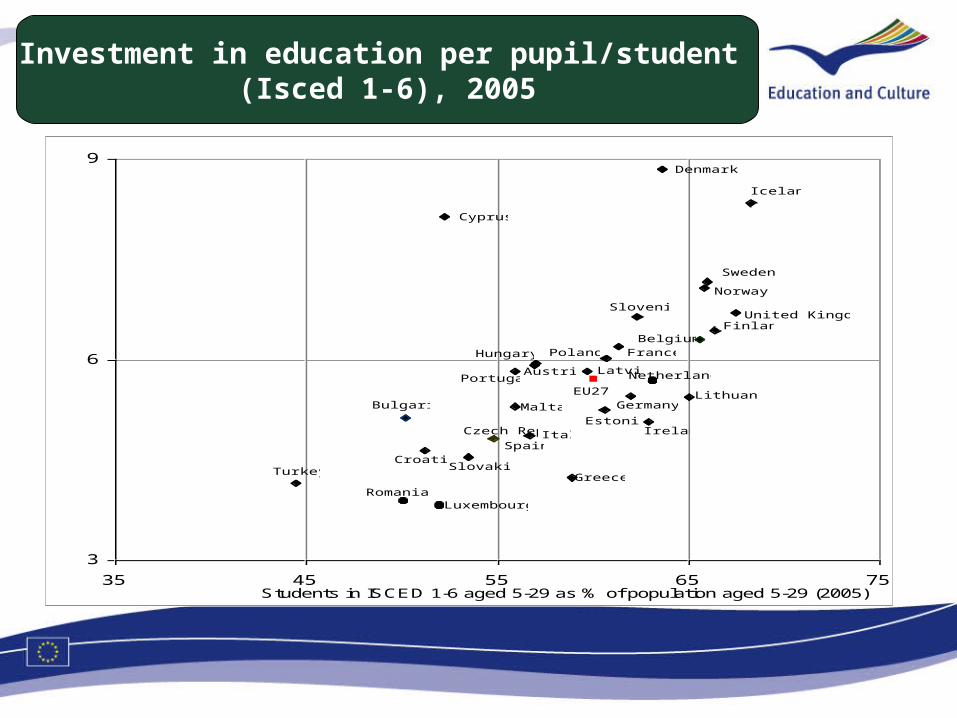
Investment in education per pupil/student (Isced 1-6), 2005
Cyprus
Denmark
France
EU27
Italy
Latvia
Lithuania
Luxembourg
Hungary
Malta
NetherlandsAustria
Poland
Portugal
Romania
Slovenia
Slovakia
Finland
Sweden
United Kingdom
CroatiaTurkey
Iceland
Norway
Bulgaria
Belgium
Czech Rep
Germany
Estonia
Greece
Spain
Ireland
3
6
9
35 45 55 65 75Students in ISCED 1-6 aged 5-29 as % of population aged 5-29 (2005)
Public and private spending on education as % GDP (2005)
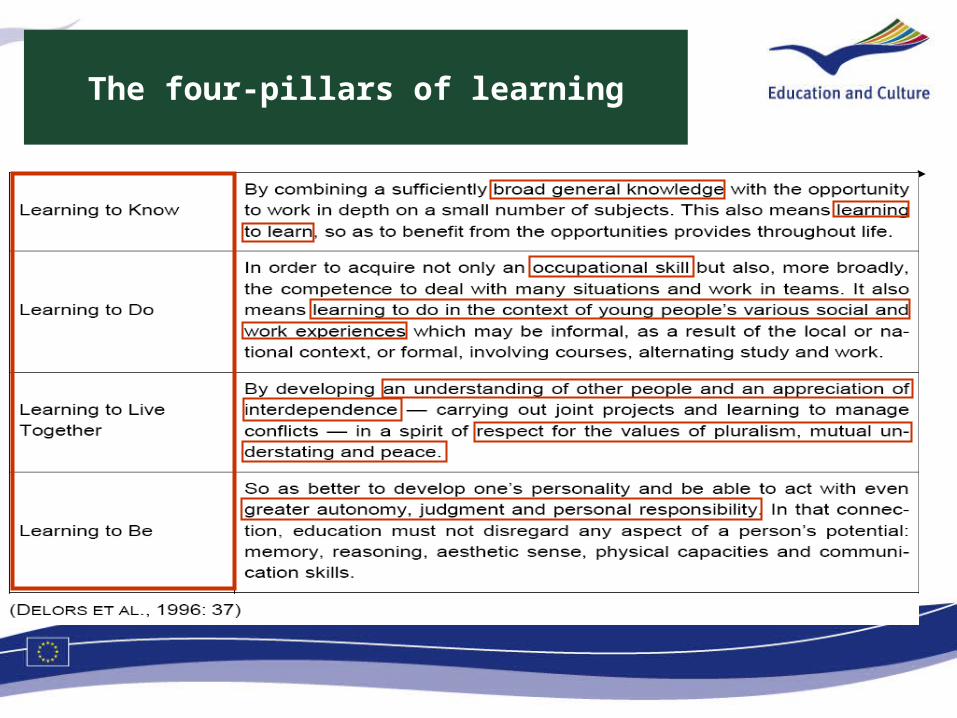
The four-pillars of learning
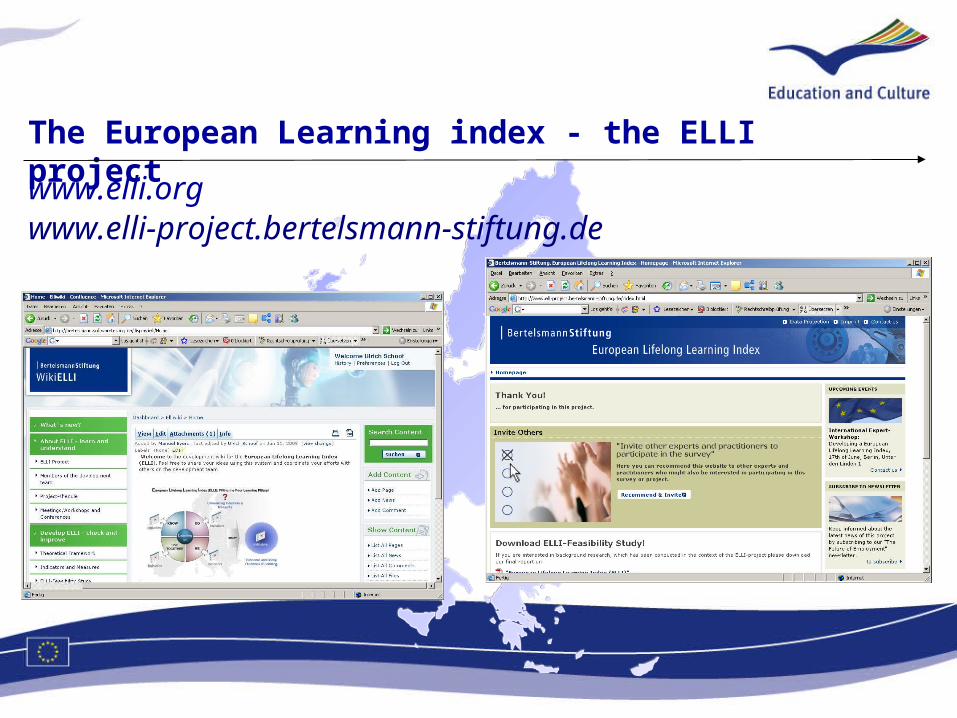
The European Learning index - the ELLI project
www.elli.orgwww.elli-project.bertelsmann-stiftung.de
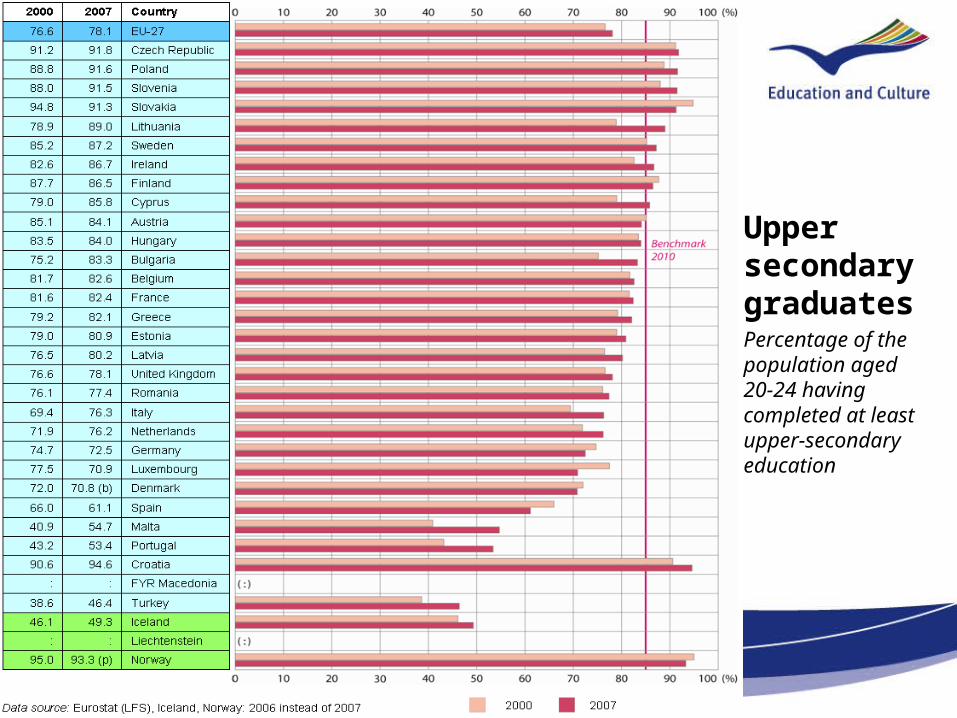
Upper secondary graduatesPercentage of the population aged 20-24 having completed at least upper-secondary education
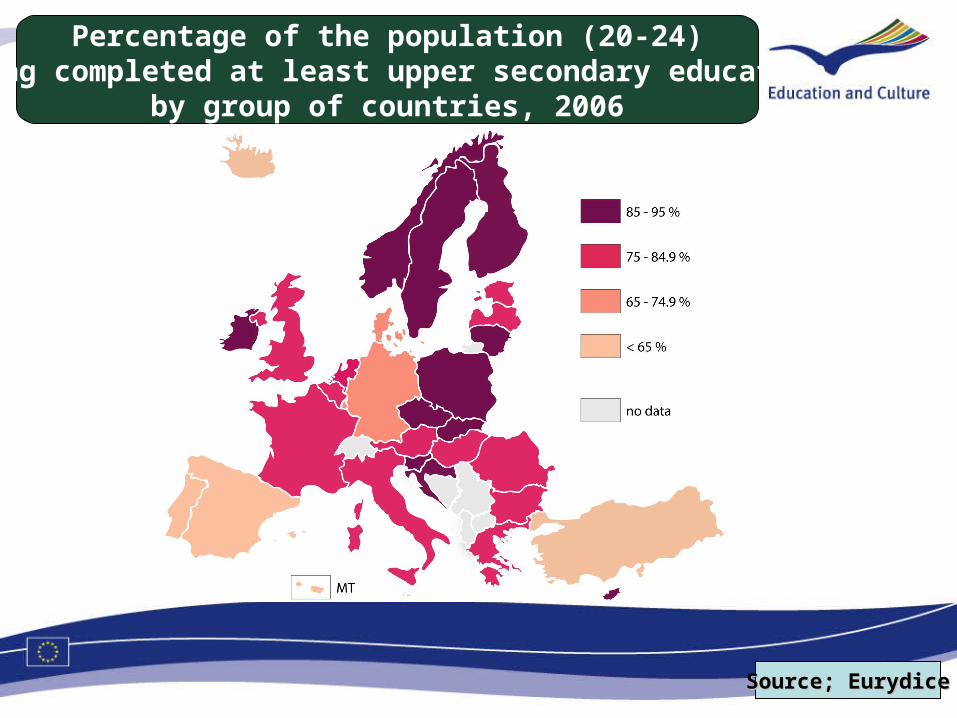
Percentage of the population (20-24)having completed at least upper secondary education
by group of countries, 2006
Source; EurydiceSource; Eurydice
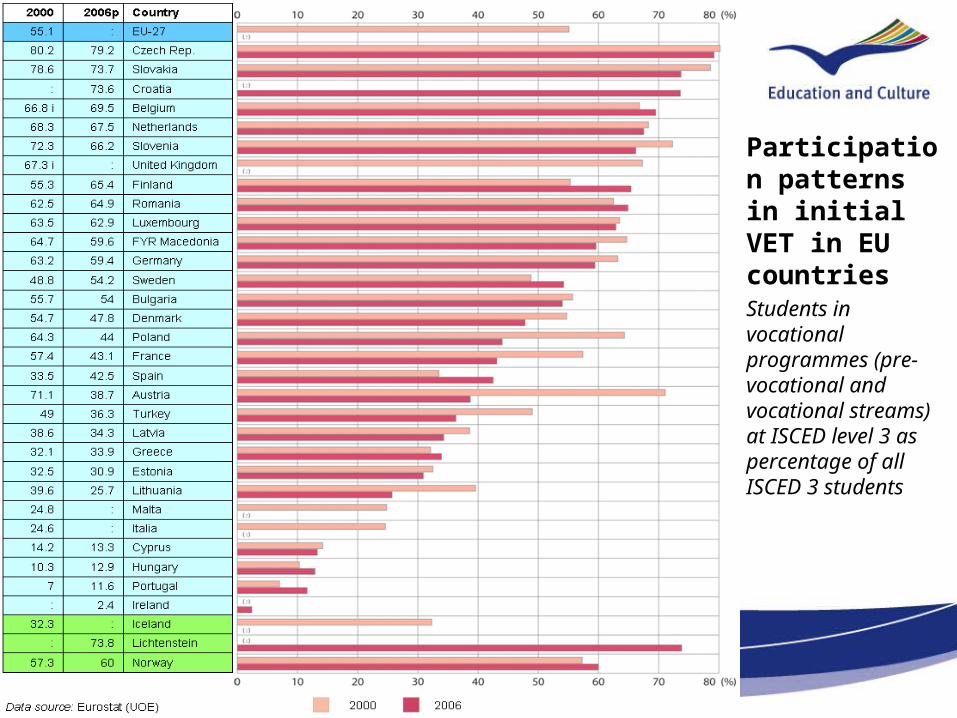
Participation patterns in initial VET in EU countriesStudents in vocational programmes (pre-vocational and vocational streams) at ISCED level 3 as percentage of all ISCED 3 students
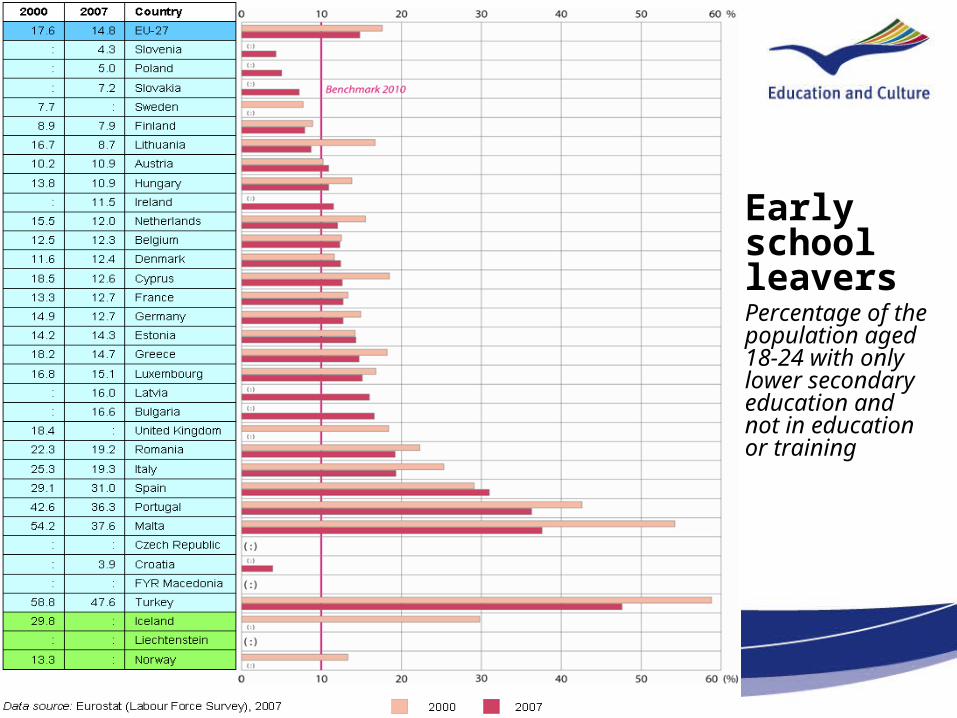
Early school leaversPercentage of the population aged 18-24 with only lower secondary education and not in education or training
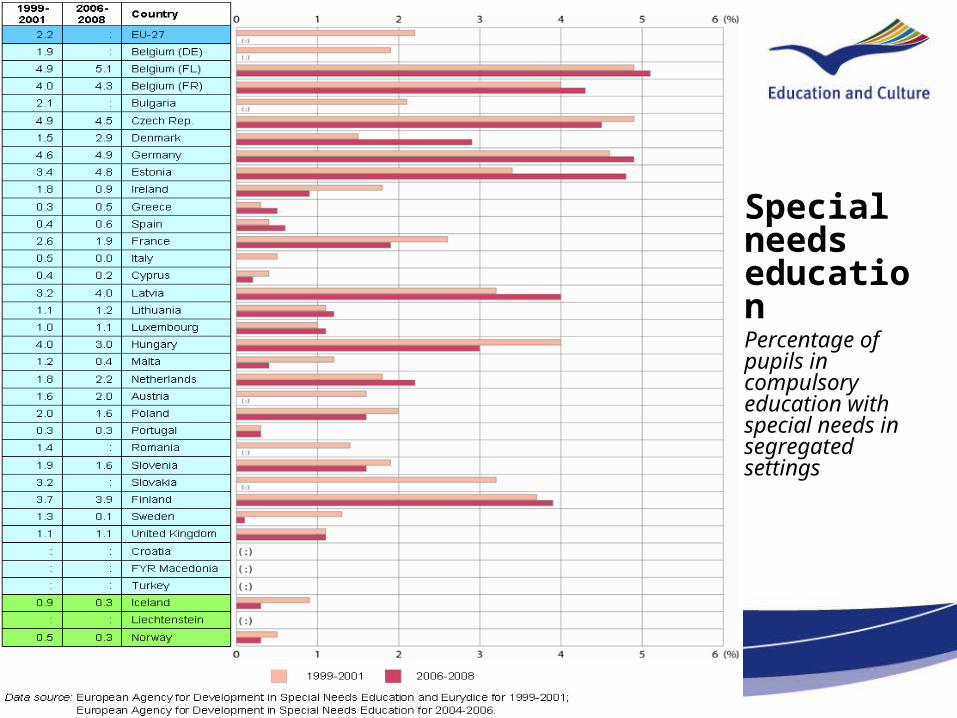
Special needs educationPercentage of pupils in compulsory education with special needs in segregated settings
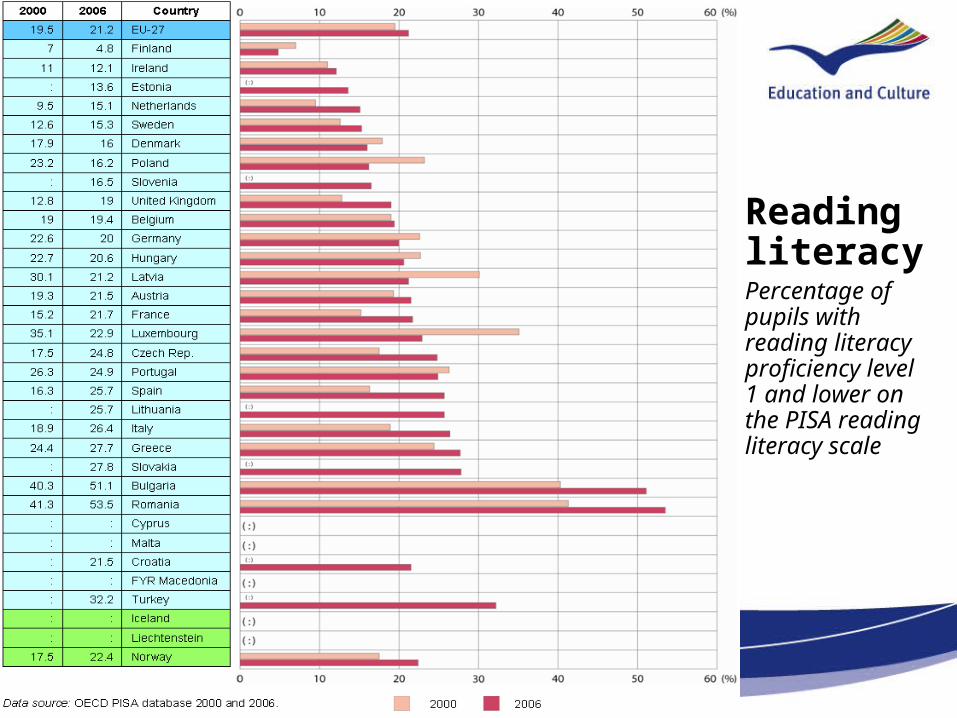
Reading literacyPercentage of pupils with reading literacy proficiency level 1 and lower on the PISA reading literacy scale
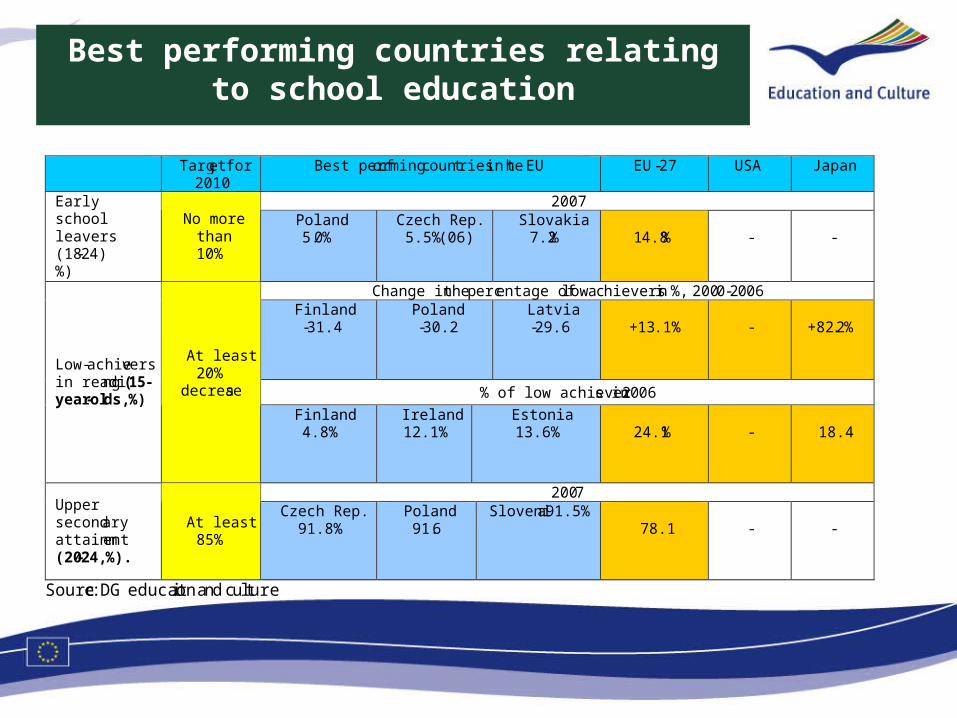
Best performing countries relating to school education
Target for
2010 Best performing countries in the EU EU-27 USA Japan
2007 Early school leavers (18-24) %)
No more than 10%
Poland 5.0%
Czech Rep. 5.5%(06)
Slovakia 7.2%
14.8%
-
-
Change in the percentage of low achievers in %, 2000-2006 Finland -31.4
Poland -30.2
Latvia -29.6
+13.1%
-
+82.2%
% of low achievers in 2006
Low-achievers in reading (15-year-olds, %)
At least 20%
decrease Finland
4.8% Ireland 12.1%
Estonia 13.6%
24.1%
-
18.4
2007 Upper secondary attainment (20-24, %).
At least 85%
Czech Rep. 91.8%
Poland 91.6
Slovenia91.5% 78.1
-
-
Source: DG education and culture
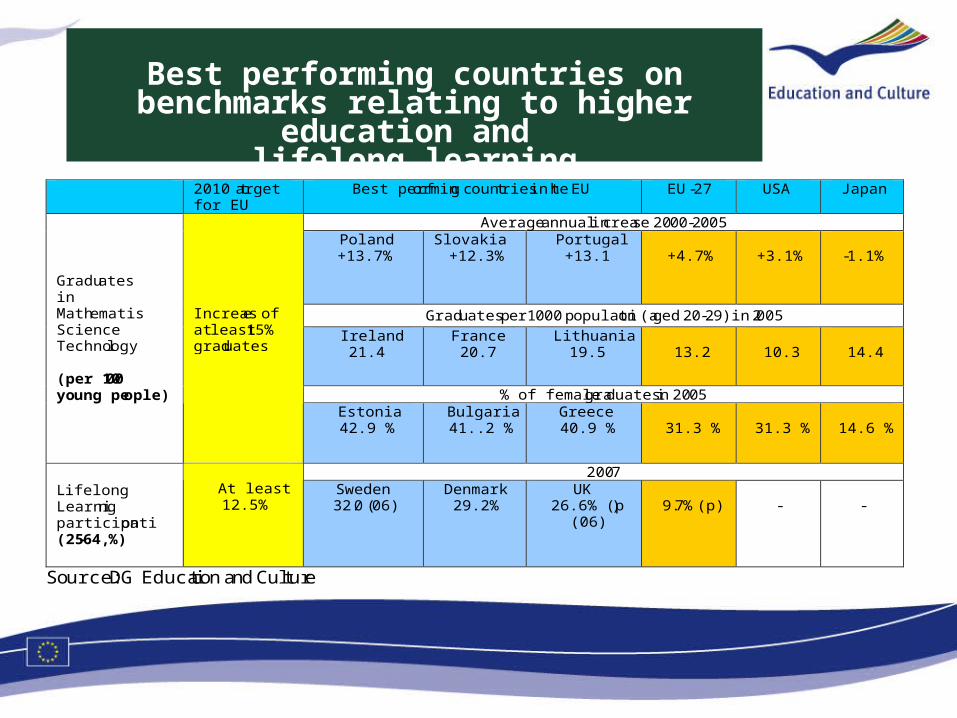
Best performing countries on benchmarks relating to higher education and
lifelong learning
2010 target for EU
Best performing countries in the EU EU-27 USA Japan
Average annual increase 2000-2005 Poland +13.7%
Slovakia +12.3%
Portugal +13.1
+4.7%
+3.1%
-1.1%
Graduates per 1000 population (aged 20-29) in 2005
Ireland 21.4
France 20.7
Lithuania 19.5
13.2
10.3
14.4
% of female graduates in 2005
Graduates in Mathematis Science Technology (per 1000 young people)
Increase of at least 15% graduates
Estonia 42.9 %
Bulgaria 41..2 %
Greece 40.9 %
31.3 %
31.3 %
14.6 %
2007 Lifelong Learning participation (25-64, %)
At least 12.5%
Sweden 32.0 (06)
Denmark 29.2%
UK 26.6% (p)
(06)
9.7%(p)
-
-
Source: DG Education and Culture
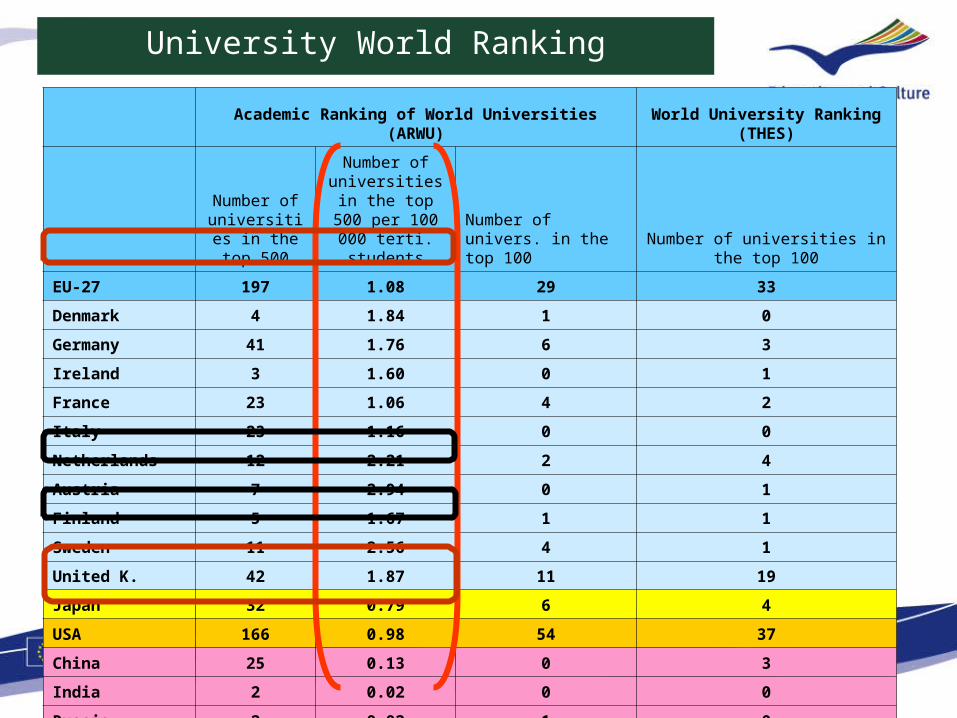
University World Ranking
Academic Ranking of World Universities (ARWU) World University Ranking (THES)
Number of universities in
the top 500
Number of universities in the top 500 per 100
000 terti. studentsNumber of univers. in the top 100 Number of universities in the top 100
EU-27 197 1.08 29 33
Denmark 4 1.84 1 0
Germany 41 1.76 6 3
Ireland 3 1.60 0 1
France 23 1.06 4 2
Italy 23 1.16 0 0
Netherlands 12 2.21 2 4
Austria 7 2.94 0 1
Finland 5 1.67 1 1
Sweden 11 2.56 4 1
United K. 42 1.87 11 19
Japan 32 0.79 6 4
USA 166 0.98 54 37
China 25 0.13 0 3
India 2 0.02 0 0
Russia 2 0.02 1 0
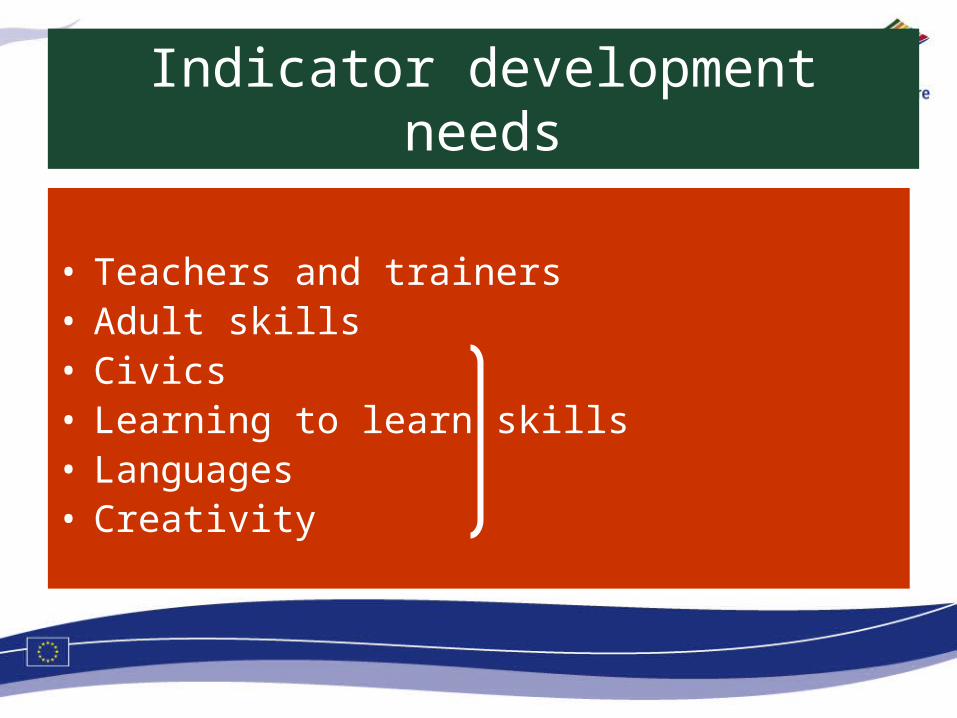
Indicator development needs
• Teachers and trainers• Adult skills• Civics• Learning to learn skills• Languages• Creativity
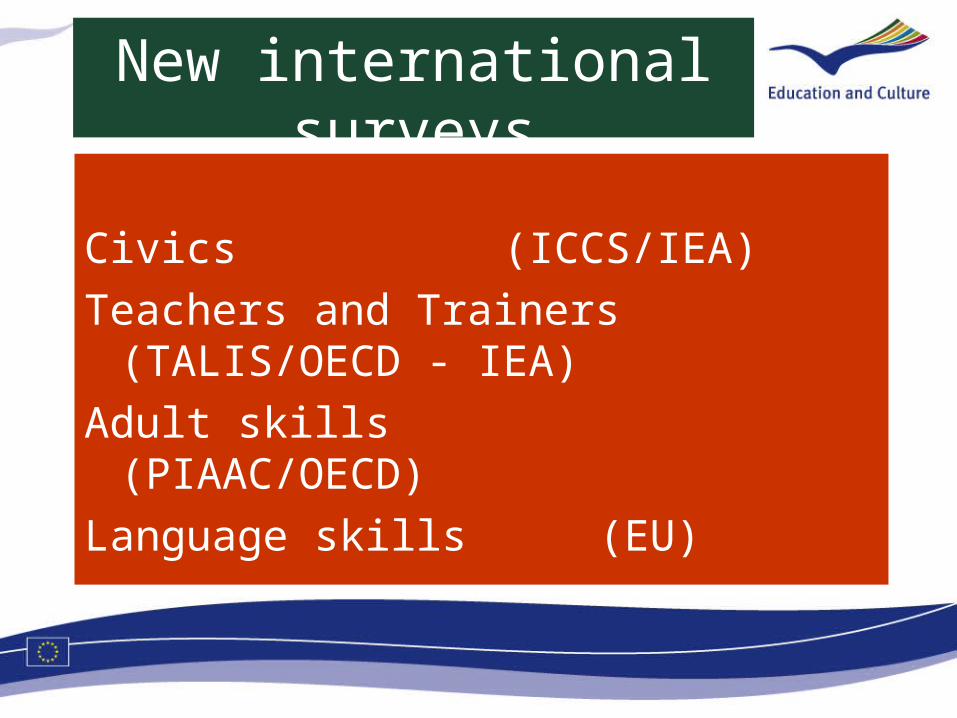
New international surveys
Civics (ICCS/IEA)
Teachers and Trainers (TALIS/OECD - IEA)
Adult skills (PIAAC/OECD)
Language skills (EU)
Civics (IEA/ICCS)
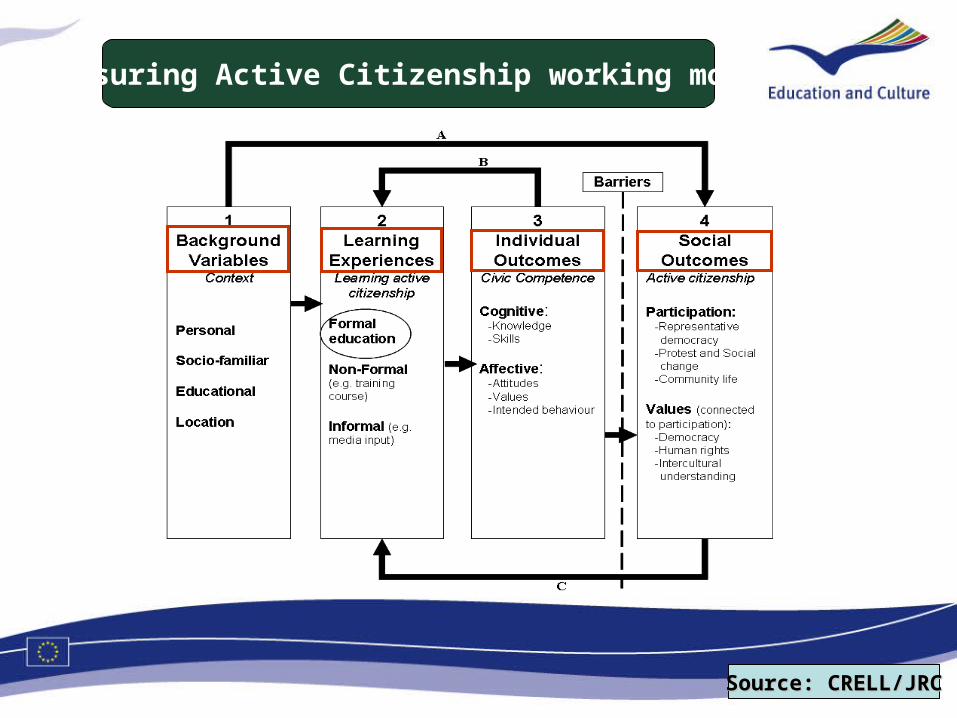
Measuring Active Citizenship working model
Source: CRELL/JRCSource: CRELL/JRC
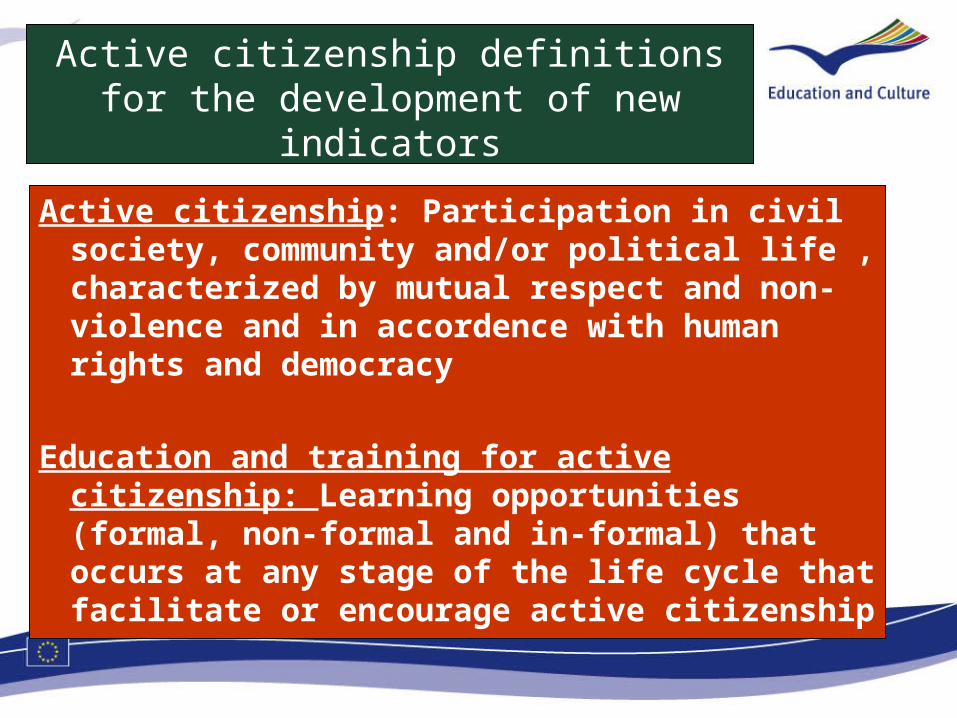
Active citizenship definitions for the development of new indicators
Active citizenship: Participation in civil society, community and/or political life , characterized by mutual respect and non-violence and in accordence with human rights and democracy
Education and training for active citizenship: Learning opportunities (formal, non-formal and in-formal) that occurs at any stage of the life cycle that facilitate or encourage active citizenship
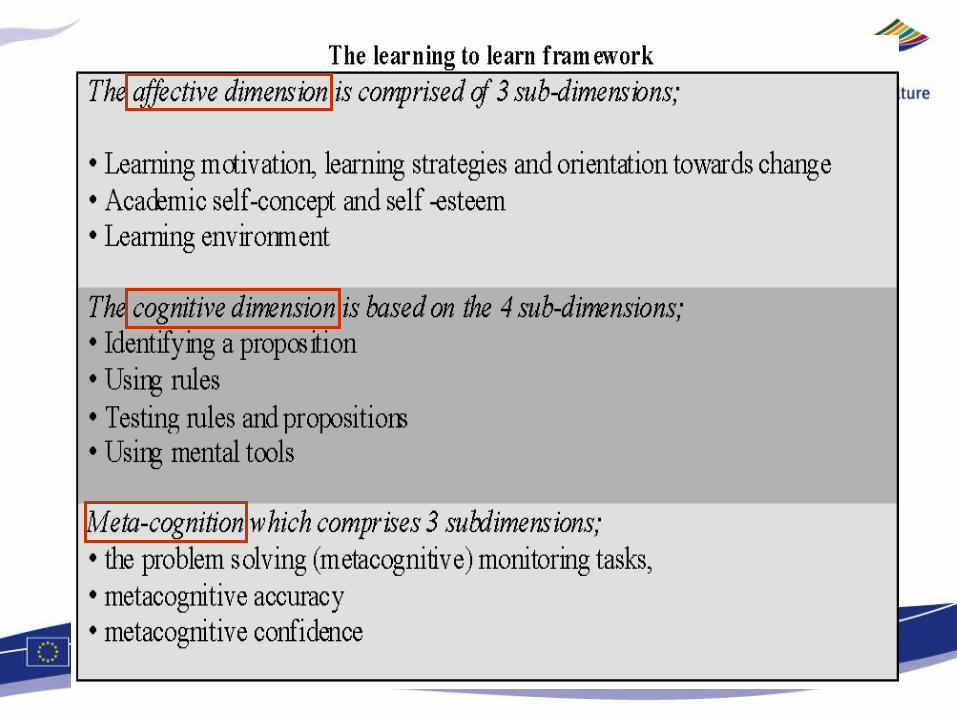
Learning to learn skills
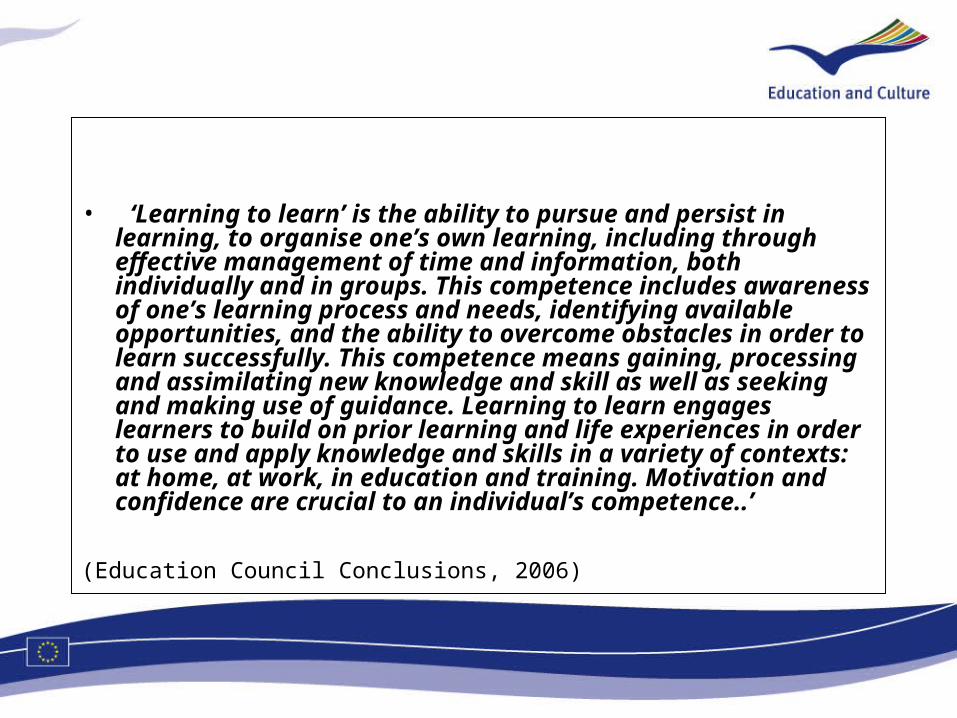
• ‘Learning to learn’ is the ability to pursue and persist in learning, to organise one’s own learning, including through effective management of time and information, both individually and in groups. This competence includes awareness of one’s learning process and needs, identifying available opportunities, and the ability to overcome obstacles in order to learn successfully. This competence means gaining, processing and assimilating new knowledge and skill as well as seeking and making use of guidance. Learning to learn engages learners to build on prior learning and life experiences in order to use and apply knowledge and skills in a variety of contexts: at home, at work, in education and training. Motivation and confidence are crucial to an individual’s competence..’
(Education Council Conclusions, 2006)
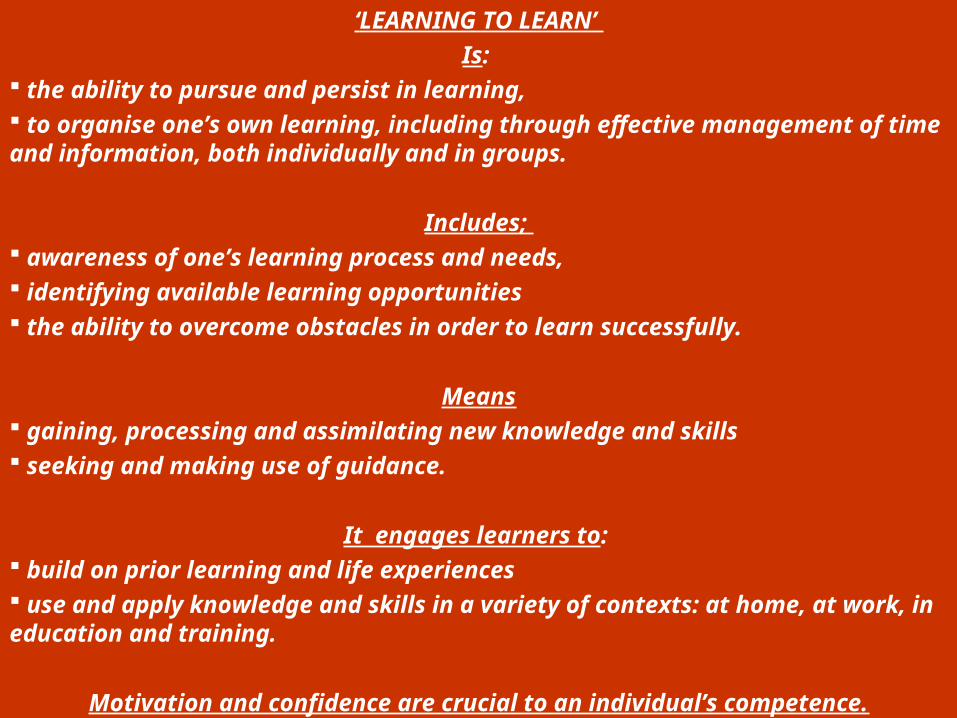
‘LEARNING TO LEARN’
Is: the ability to pursue and persist in learning, to organise one’s own learning, including through effective management of time and information, both individually and in groups.
Includes; awareness of one’s learning process and needs, identifying available learning opportunities the ability to overcome obstacles in order to learn successfully.
Means gaining, processing and assimilating new knowledge and skills seeking and making use of guidance.
It engages learners to: build on prior learning and life experiences use and apply knowledge and skills in a variety of contexts: at home, at work, in education and training.
Motivation and confidence are crucial to an individual’s competence.
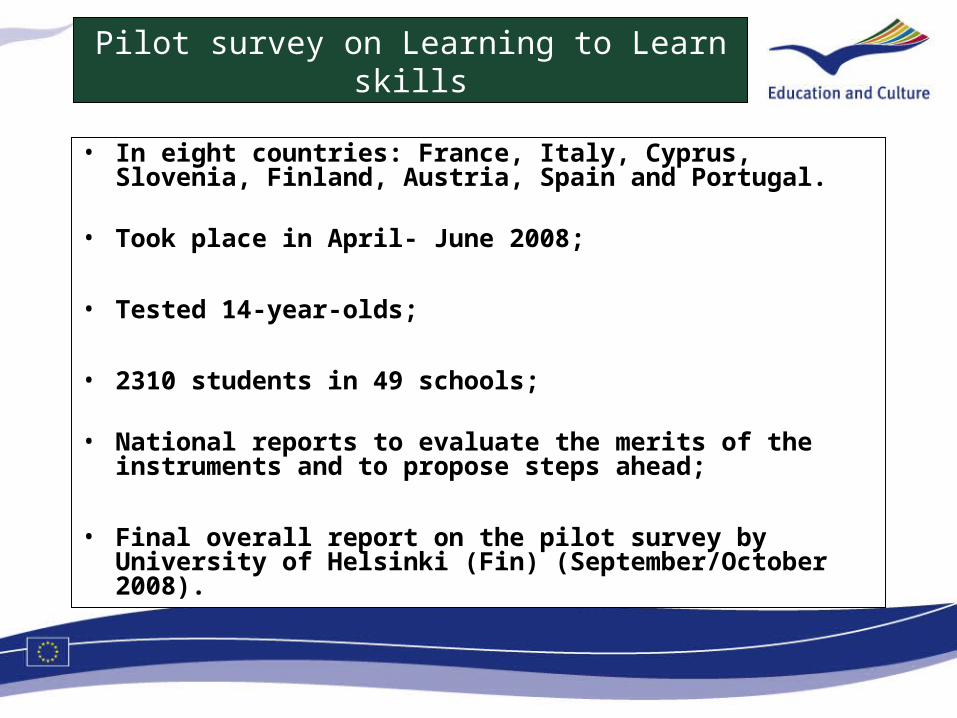
Pilot survey on Learning to Learn skillsDraft instrument
• In eight countries: France, Italy, Cyprus, Slovenia, Finland, Austria, Spain and Portugal.
• Took place in April- June 2008;
• Tested 14-year-olds;
• 2310 students in 49 schools;
• National reports to evaluate the merits of the instruments and to propose steps ahead;
• Final overall report on the pilot survey by University of Helsinki (Fin) (September/October 2008).
Languages skills
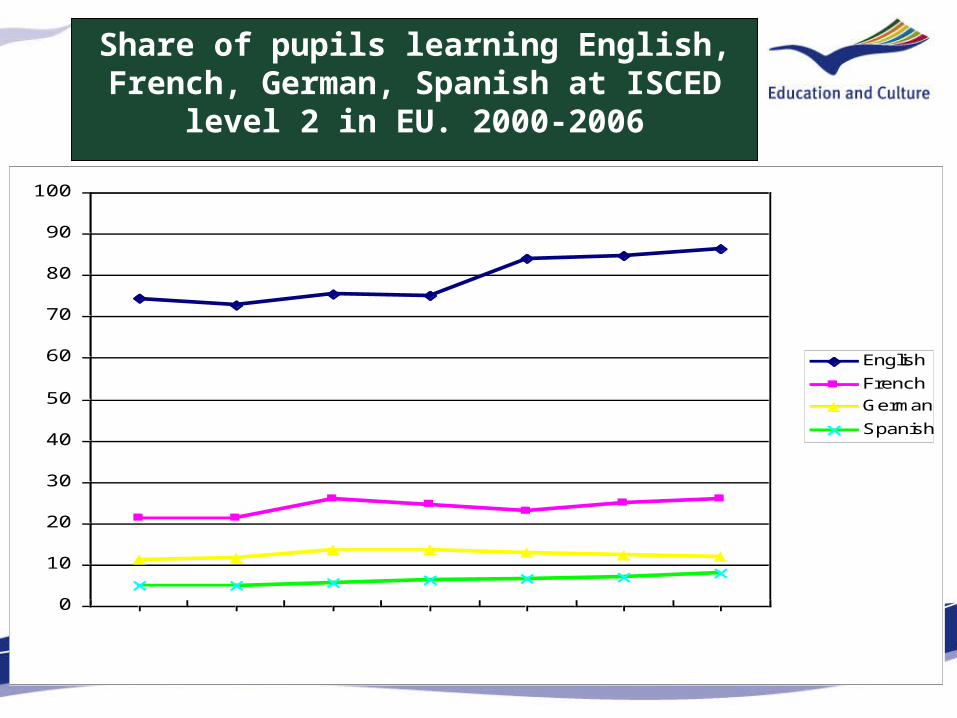
Share of pupils learning English, French, German, Spanish at ISCED level 2 in EU. 2000-
2006
0
10
20
30
40
50
60
70
80
90
100
2000 2001 2002 2003 2004 2005 2006
percentage of pulis
English
French
German
Spanish
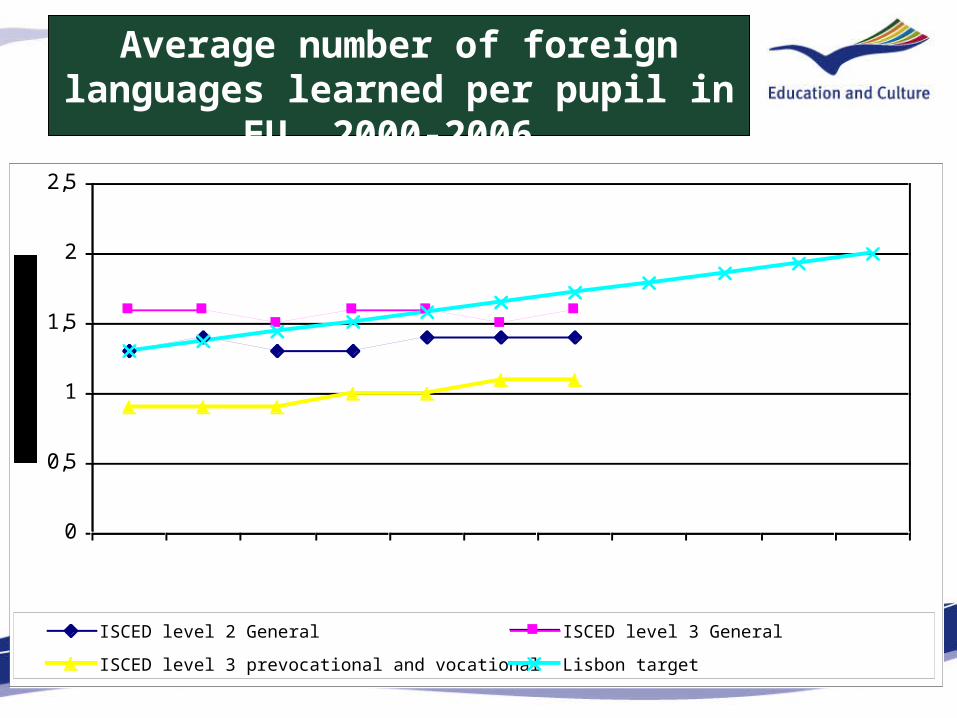
Average number of foreign languages learned per pupil in EU. 2000-2006.
0
0,5
1
1,5
2
2,5
2000 2001 2002 2003 2004 2005 2006 2007 2008 2009 2010
ISCED level 2 General ISCED level 3 General
ISCED level 3 prevocational and vocational Lisbon target
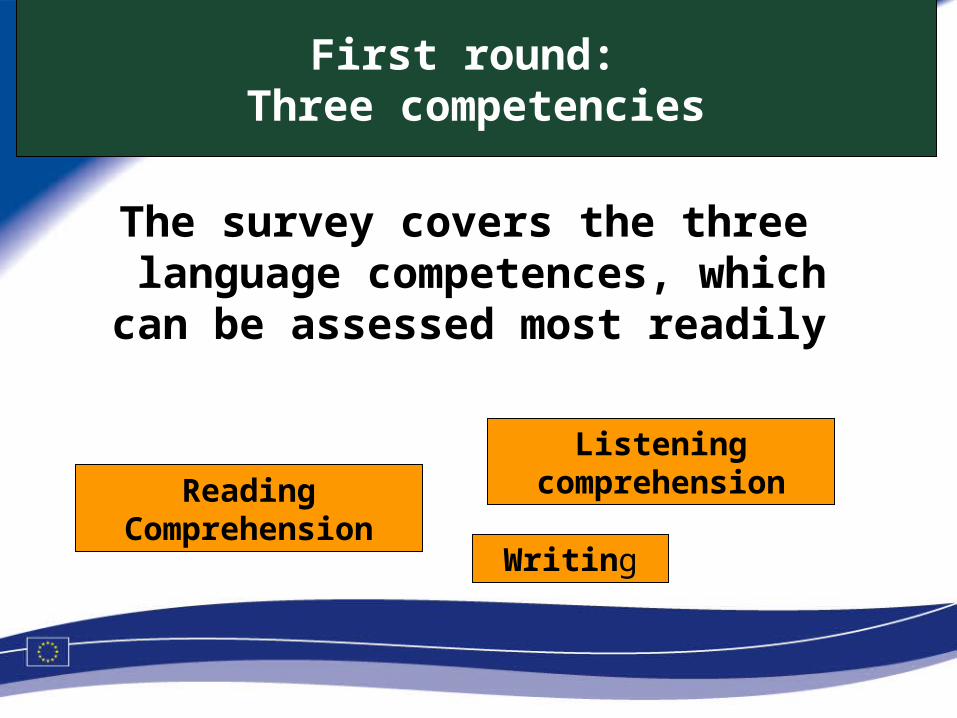
The survey covers the three language competences, which can be assessed most
readily
Listening comprehension
Writing
Reading Comprehension
First round: Three competencies
First roundFive languages will be tested
The survey covers competences in the
first and second most taught foreign official European languages
English, French, German, Italian and Spanish
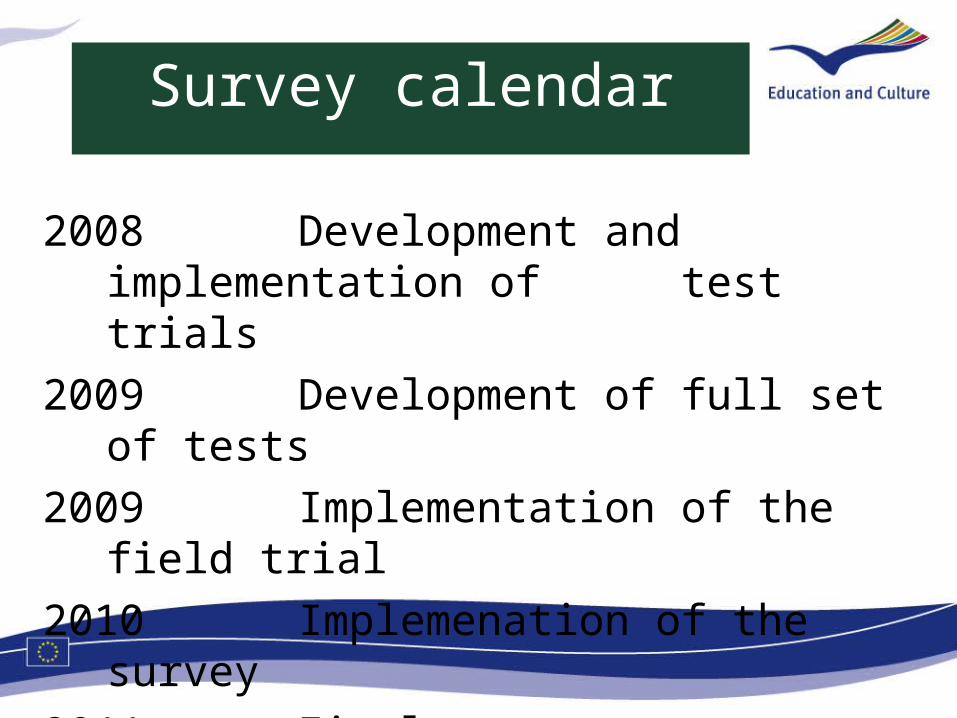
Survey calendar
2008 Development and implementation of test trials
2009 Development of full set of tests
2009 Implementation of the field trial
2010 Implemenation of the survey
2011 Final report
Creativity
2009 -European Year of creativity and innovation 2009 -European Year of creativity and innovation
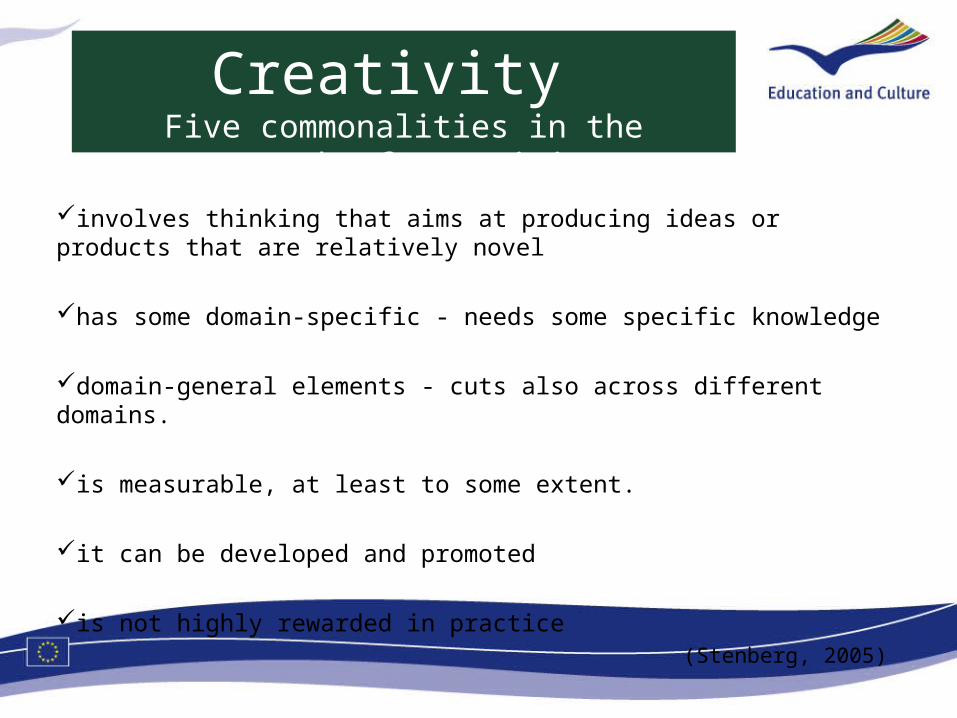
Creativity Five commonalities in the research of creativity
involves thinking that aims at producing ideas or products that are relatively novel
has some domain-specific - needs some specific knowledge
domain-general elements - cuts also across different domains.
is measurable, at least to some extent.
it can be developed and promoted
is not highly rewarded in practice(Stenberg, 2005)
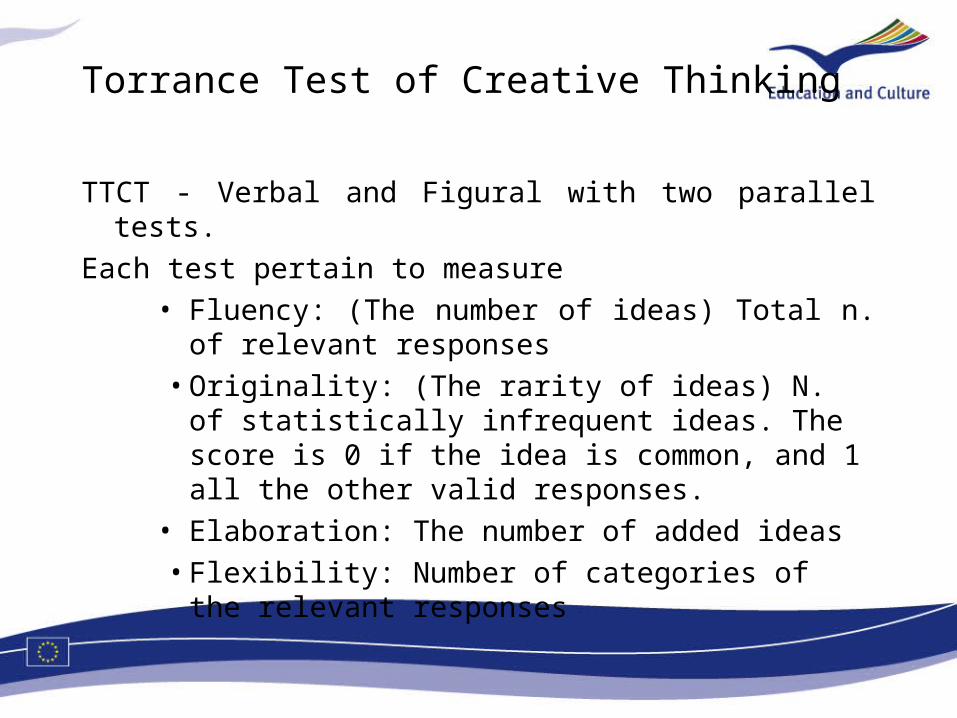
Torrance Test of Creative Thinking
TTCT - Verbal and Figural with two parallel tests.
Each test pertain to measure
• Fluency: (The number of ideas) Total n. of relevant responses
• Originality: (The rarity of ideas) N. of statistically infrequent ideas. The score is 0 if the idea is common, and 1 all the other valid responses.
• Elaboration: The number of added ideas
• Flexibility: Number of categories of the relevant responses
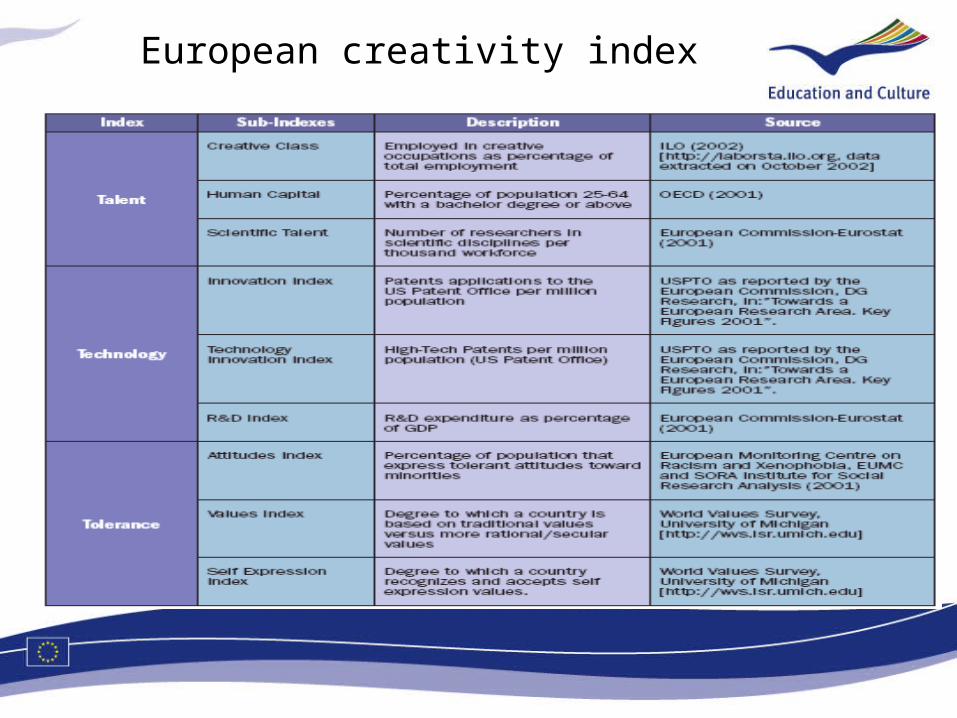
European creativity index
Florida and Tinagli (2004)
Monitoring and Analysing Progress
SIXTEEN CORE INDICATORS
1. Participation in pre-school education
2. Special needs education3. Early school leavers4. Literacy in reading, maths and
science5. Language skills6. ICT skills7. Civic skills8. Learning to learn skills
9. Upper secondary completion rates of young people
10. Professional development of teachers 11. Higher education graduates12. Cross-national mobility of students13. Participation of adults in lifelong
learning14. Adults’ skills15. Educational attainment of the
population 16. Investment in education and training
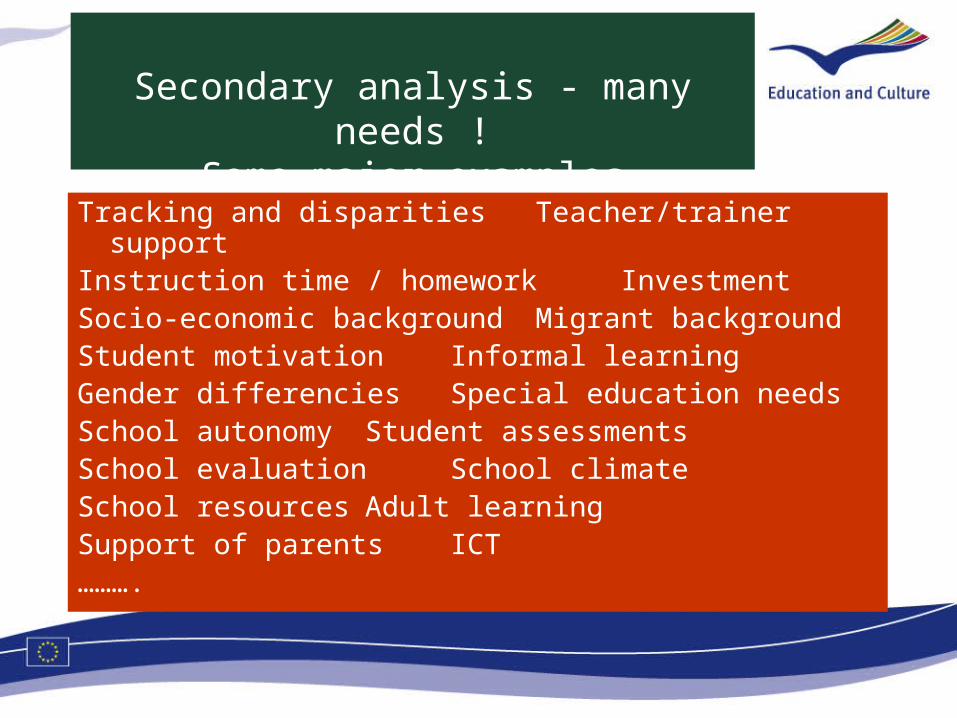
Secondary analysis - many needs !Some major examples
Tracking and disparities Teacher/trainer supportInstruction time / homework InvestmentSocio-economic background Migrant backgroundStudent motivation Informal learningGender differencies Special education needsSchool autonomy Student assessmentsSchool evaluation School climateSchool resources Adult learningSupport of parents ICT……….
IMPORTANT EVENT !
International conference :
Secondary analysis of results from international surveys on student
achievements
(May 2009)
Organised by the European Commission
(Dg EAC, CRELL/JRC)
Thank you for your attention !
The Progress report (2008) is available on the web.
http://ec.europa.eu/education/policies/2010/progressreport_en.html

3rd IEA International Research Conference (IRC-2008)Taipei, 18 - 20 September 2008