Embed Size (px)
Citation preview
7/24/2019 3D Spacial Impulse Response Rendering
http://slidepdf.com/reader/full/3d-spacial-impulse-response-rendering 1/10
Buenos Aires – 5 to 9 September, 2016 Acoustics for the 21
st Century
PROCEEDINS o! t"e 22n# Intern$tion$% Con&ress on A'ousti's
SP ( Si&n$% Pro'essin& in A'ousti's) P$per 295
De*e%opment o! $ +D impu%se response interpret$tion$%&orit"m
e#eri'o N$"ue% C$'$*e%os-$., Au&usto Bone%%i /oro-b.,A%e$n#ro Bi#on#o-'.
(a)Universidad Nacional de Tres de Febrero, Argentina, [email protected]
(b)Universidad Nacional de Tres de Febrero, Argentina, [email protected](c)
Universidad Nacional de Tres de Febrero, Argentina, [email protected]
Abstr$'t
In this paper, the development of an interpretation algorithm for ! impulse responses is
presented. This ne" tool allo"s to identif# the spatial provenance for each time "indo" of an
impulse response recorded in aA$Formatmicrophone. In this "a#, it is possible to discern
bet"een the direct sound and the different reflections temporaril# and spatiall#. To understand
the basics of this method, a brief introduction to all concepts involved is presented. Alternativel#,
different t#pes of procedures are used for data evaluation. Finall#, s#stem applications aresho"n in controlled acoustical environments toevaluate the precision and the potential of this
tool.
e3or#s) Impulse response !, %edgehog, &paciali'ation, &oundfield, Ambisonics
7/24/2019 3D Spacial Impulse Response Rendering
http://slidepdf.com/reader/full/3d-spacial-impulse-response-rendering 2/10
nd International ongress on Acoustics, ICA 2016
*uenos Aires + to - &eptember, /0
Acoustics for the 21st
Century
De*e%opment o! $ +D impu%se response interpret$tion$%&orit"m
1 Intro#u'tion
1ecording of impulse responses has been "idel# studied in various areas of acoustics. The
most notable use is given in the commercial production industr# of audio, because the
convolution of this t#pe of impulse responses "ith anechoic signals allo"s generate surround
sound environments. In this "or2, alternative use for such responses is presented, "ithapplications in the characteri'ation and design parameters of acoustics enclosures.
3ethodolog# and development of this algorithm is presented. To achieve this tas2, the 3AT4A*
platform "as used as a programming environment. This platform allo"s visuali'ation of current
vectors in three dimensions. Thus, one can distinguish spatial and temporal form bet"een the
direct sound and its reflections from an impulse response recorded "ith an A$Format
microphone. 5arious techni6ues of digital signal processing "ere addressed for data evaluation.
Finall#, the algorithm "as tested"ith a series of measurements.
141 App%i'$tions o! t"e +D impu%se response
The acoustic environments are commonl# evaluated using omnidirectional impulse response
measurement techni6ues. These techni6ues allo" to obtain the time and amplitude of thesignal, but the# can7t bring information about the direction of this signal. In this sense, the
advantage in the comprehension and characteri'ation of the acoustic parameters "ith the !
impulse response measurement is to get the direction "hich the signal comes from. 8btaining
the signal direction allo"s relating the sound to the ph#sical characteristics of the room
reflections, observing the directional distribution of earl# and late energ#, and identif# areas that
generate un"anted reflections. 3oreover, the comparison of the spatial components of impulse
responses of various rooms can contribute to identif#ing differences and similarities in acoustic
characteristics.
Although at presente9istsacoustic parameters describing spatial characteristics of the impulse
response, it is possible to develop ne" parameters to considerthe directionas an independentvariable.
142 A(orm$t $n# B(orm$t
The A$Format consists in a recording of four audio signals. This re6uires using a microphone
arra# "hich has four sub$cardioid capsules located on the faces of a tetrahedron.
From a theoretical aspect, capsules should coincide in one point in the space, but due to
ph#sical limitations this is impossible. This condition causes phase distortion, occurring in
shorter "avelengths four times smaller than the distance bet"een the capsules. To solve this
7/24/2019 3D Spacial Impulse Response Rendering
http://slidepdf.com/reader/full/3d-spacial-impulse-response-rendering 3/10
nd International ongress on Acoustics, ICA 2016
*uenos Aires + to - &eptember, /0
Acoustics for the 21st
Century
problem, filtering should be implemented in order to place the capsules virtuall# in the centreof
the tetrahedron.
The *$Format contains four signals named :, ;, < and =. The : signal represents the
capture of the omnidirectional pressure component, "hile ;, < and = represent the velocit#
vectors associated "ith the hori'ontal a9is(; and <) and the vertical a9is(=). The microphone *$
format involves three figure of eight polar patternmicrophone and one omnidirectional
microphone. Another "a# to get this format is performing a combination bet"een the A+format
signals and appl#ing an amplitude and phase compensation filter >/, ?.
14+ Intensit *e'tors !rom orm$t – B si&n$%s
As Farina and Tronchin establish in their research at the Universit# of arma (/), vectors
intensit# (corresponding to one or more sources) can be obtained b# the product of the pressure
(i.e. the : signal from the omnidirectional microphone) and velocit# vector (;, < or =).
&ubse6uentl#, the three artesian components of the intensit# values in each of its a9es can
calculate the spherical coordinates (modulus, a'imuth and elevation). Trigonometric e6uations
are used in the aforementioned "or2 >?.
14 o& Sine S3eep ir7eb A%&orit"m
The measurement techni6ue "ith 4og &ine &"eep (4&&) is based on using as e9citation signal
a sine signal "hich varies e9ponentiall# bet"een t"o fre6uencies. This techni6ue ta2es
advantage respect to a linear s"eep because it has logarithmic spacing, giving more definition
to lo" fre6uenc# tones. This "a# #ou can achieve a better &ignal to Noise ratio even at lo"
fre6uencies. In contrast to a linear to a linear s"eep, the latter maintains the same duration forall the fre6uenc# range >, ?, thus being necessar# to appl# greater s"eep duration times. The
application of the inverse filter from the source also produces an improvement in the 6ualit# of
the impulse response measurement. Using this tool helps to reduce potential alterations that
can produce the non$linearit# of the source. For practical purposes, it is possible to achieve a
good evaluation of the non$ideal acoustic conditions. The follo"ing section "ill develop some
plausible tools. omplementar#, Bir2eb# algorithm is used for appl#ing the inverse filter to the
measured signals. Appl#ing these filters improves the fre6uenc# content, eliminating the time
dispersion caused b# the non$linearit# of the source >?.
2 Pro'e#ure
241 A'8uisition o! impu%se responses
The techni6ue developed b# Farina "ith 4&& "as used to obtain the impulse responses. The
Bir2eb# algorithm in conCunction "ith the inverse filter allo"s to reduce alterations in the signal
produced b# the characteristics of the source.
*ecause of the difficult# in obtaining the impulse response of the omnidirectional source in
anechoic conditions, a number of alternative methods "ere implemented.
7/24/2019 3D Spacial Impulse Response Rendering
http://slidepdf.com/reader/full/3d-spacial-impulse-response-rendering 4/10
nd International ongress on Acoustics, ICA 2016
*uenos Aires + to - &eptember, /0
Acoustics for the 21st
Century
8mnidirectional microphone placement "as made a"a# from a reflective surface in order to
obtain the direct sound from the source "ith enough spacing respect the earl# reflections. The
criterion to choose this distance "as e9ceeding at least one "avelength of the lo"est fre6uenc#
being anal#'ed. In cases "here the minimum distance "as not achieved, another techni6ue
used "as used b# placing the reflective surface adCointing the microphone. This techni6ue
modifies the microphone polar pattern to cardioid and precludes the ac6uisition of reflections
from the surface.
It must be clarified that the application of the inverse filter response of the source does not
ma2e modification to the differences in response bet"een the capsules. That7s "h# in future
measurement this must be ta2en into account in order to ma2e a characteri'ation of the
capsules used.
242 $in 'orre'tion $%&orit"m8ne of the most important aspects to consider is related to the configuration of the interface
gain in each cannel. Ine6uit# gain relationships bet"een the different channels can cause
erroneous results. That7s the reason because a gain correction algorithm "as developed. In this
algorithm the user can start the measurement "ith an# 2ind of gain relation bet"een channels,
preferabl# achievingthe highest signal to noise ratio "ithout distortion. Then, a "hite noise
signal "ith the same length is inserted (can be generated "ith the same interface) in each of the
channels used. The relative differences bet"een energ# amounts of the ac6uired signals
represent the relationships bet"een channels gain. Thus, amplitude corrections must
beappliedto obtain the same energetic sum in each channel.
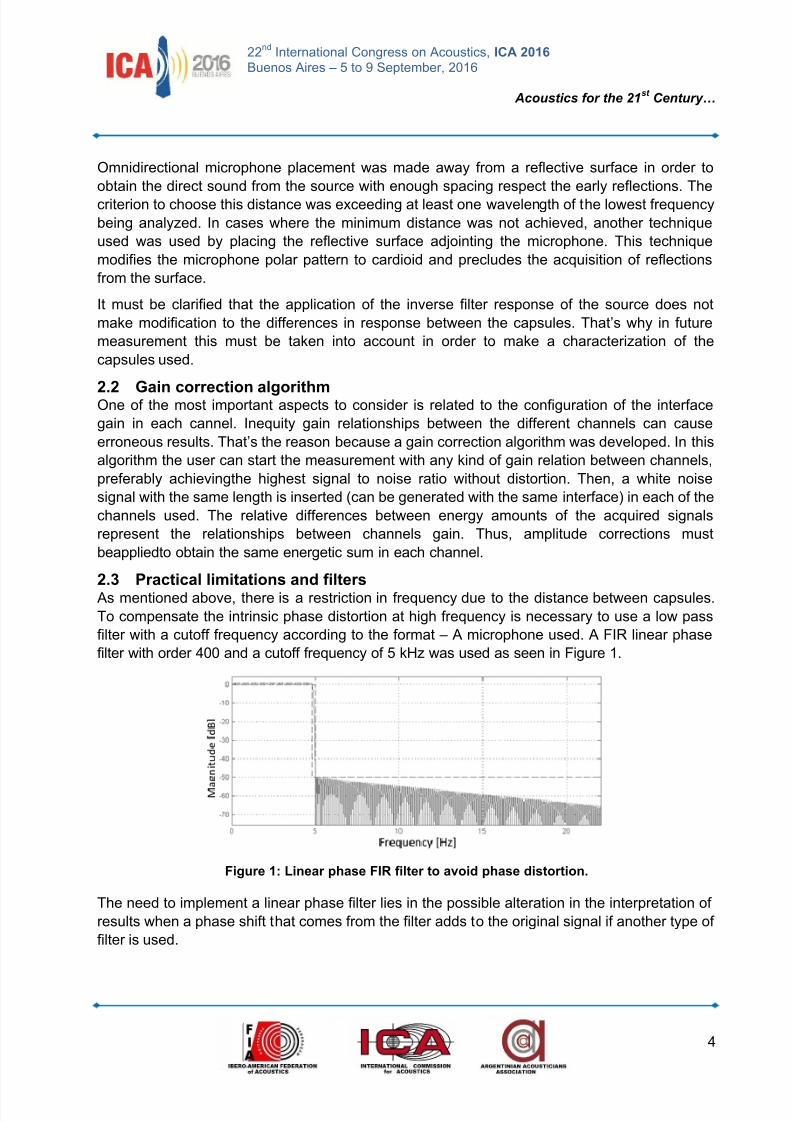
24+ Pr$'ti'$% %imit$tions $n# !i%ters As mentioned above, there is a restriction in fre6uenc# due to the distance bet"een capsules.
To compensate the intrinsic phase distortion at high fre6uenc# is necessar# to use a lo" pass
filter "ith a cutoff fre6uenc# according to the format + A microphone used. A FI1 linear phase
filter "ith order and a cutoff fre6uenc# of 2%' "as used as seen in Figure /.
i&ure 1) ine$r p"$se IR !i%ter to $*oi# p"$se #istortion4
The need to implement a linear phase filter lies in the possible alteration in the interpretation of
results "hen a phase shift that comes from the filter adds to the original signal if another t#pe of
filter is used.
7/24/2019 3D Spacial Impulse Response Rendering
http://slidepdf.com/reader/full/3d-spacial-impulse-response-rendering 5/10
nd International ongress on Acoustics, ICA 2016
*uenos Aires + to - &eptember, /0
Acoustics for the 21st
Century
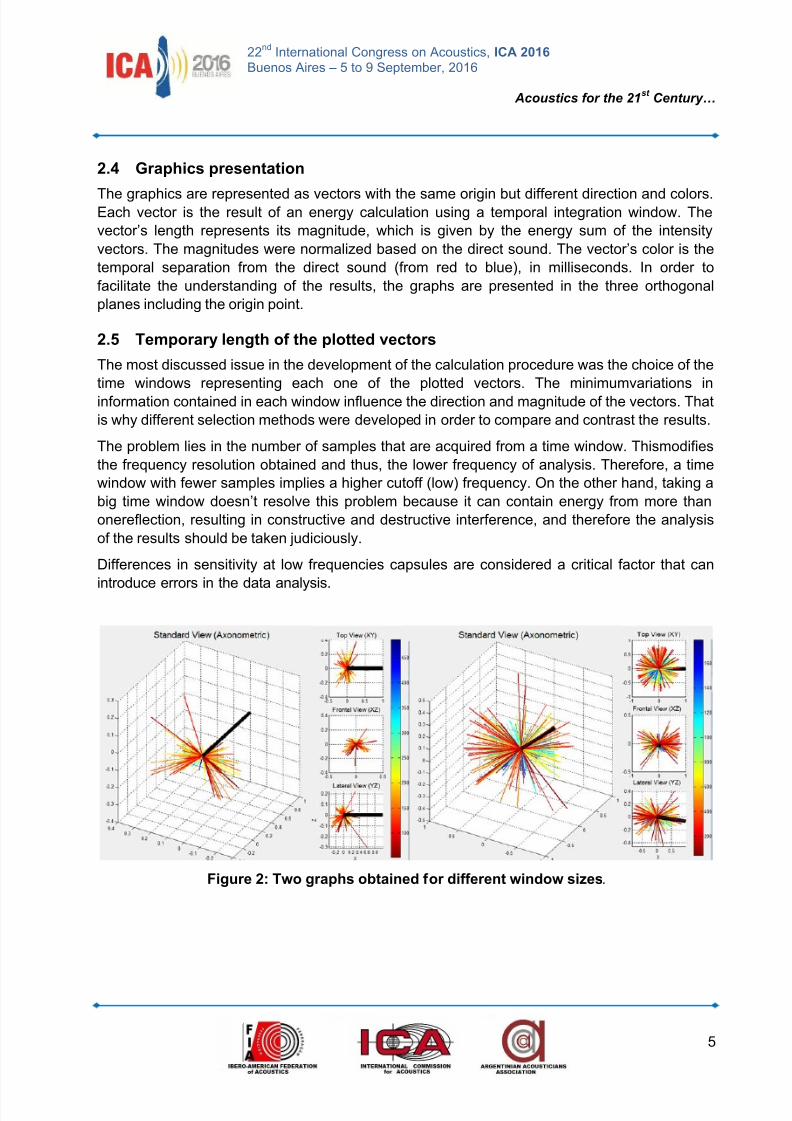
24 r$p"i's present$tion
The graphics are represented as vectors "ith the same origin but different direction and colors.Dach vector is the result of an energ# calculation using a temporal integration "indo". The
vector7s length represents its magnitude, "hich is given b# the energ# sum of the intensit#
vectors. The magnitudes "ere normali'ed based on the direct sound. The vector7s color is the
temporal separation from the direct sound (from red to blue), in milliseconds. In order to
facilitate the understanding of the results, the graphs are presented in the three orthogonal
planes including the origin point.
245 /empor$r %en&t" o! t"e p%otte# *e'tors
The most discussed issue in the development of the calculation procedure "as the choice of the
time "indo"s representing each one of the plotted vectors. The minimumvariations in
information contained in each "indo" influence the direction and magnitude of the vectors. That
is "h# different selection methods "ere developed in order to compare and contrast the results.
The problem lies in the number of samples that are ac6uired from a time "indo". Thismodifies
the fre6uenc# resolution obtained and thus, the lo"er fre6uenc# of anal#sis. Therefore, a time
"indo" "ith fe"er samples implies a higher cutoff (lo") fre6uenc#. 8n the other hand, ta2ing a
big time "indo" doesn7t resolve this problem because it can contain energ# from more than
onereflection, resulting in constructive and destructive interference, and therefore the anal#sis
of the results should be ta2en Cudiciousl#.
!ifferences in sensitivit# at lo" fre6uencies capsules are considered a critical factor that can
introduce errors in the data anal#sis.
i&ure 2) /3o &r$p"s obt$ine# !or #i!!erent 3in#o3 sies.
7/24/2019 3D Spacial Impulse Response Rendering
http://slidepdf.com/reader/full/3d-spacial-impulse-response-rendering 6/10
nd International ongress on Acoustics, ICA 2016
*uenos Aires + to - &eptember, /0
Acoustics for the 21st
Century
0
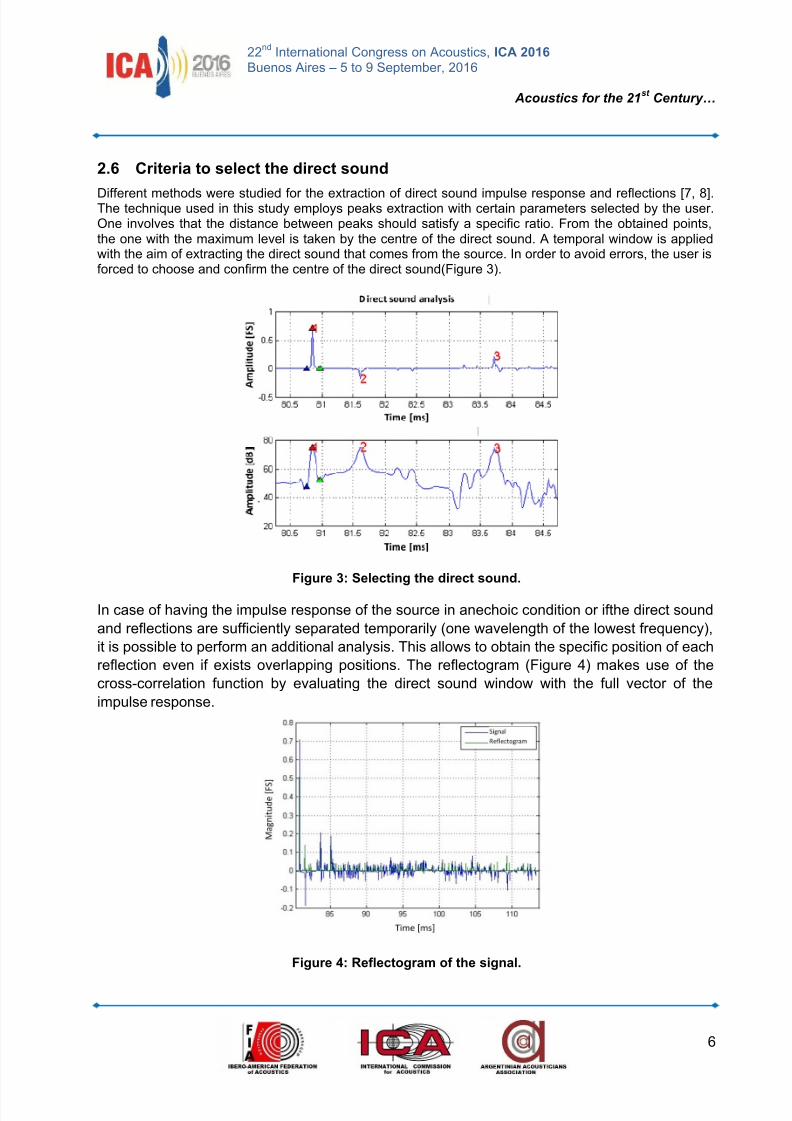
246 Criteri$ to se%e't t"e #ire't soun#
!ifferent methods "ere studied for the e9traction of direct sound impulse response and reflections >E, ?.The techni6ue used in this stud# emplo#s pea2s e9traction "ith certain parameters selected b# the user.8ne involves that the distance bet"een pea2s should satisf# a specific ratio. From the obtained points,the one "ith the ma9imum level is ta2en b# the centre of the direct sound. A temporal "indo" is applied"ith the aim of e9tracting the direct sound that comes from the source. In order to avoid errors, the user isforced to choose and confirm the centre of the direct sound(Figure ).
i&ure +) Se%e'tin& t"e #ire't soun#4
In case of having the impulse response of the source in anechoic condition or ifthe direct sound
and reflections are sufficientl# separated temporaril# (one "avelength of the lo"est fre6uenc#),
it is possible to perform an additional anal#sis. This allo"s to obtain the specific position of each
reflection even if e9ists overlapping positions. The reflectogram (Figure ) ma2es use of the
cross$correlation function b# evaluating the direct sound "indo" "ith the full vector of the
impulse response.
i&ure ) Re!%e'to&r$m o! t"e si&n$%4
7/24/2019 3D Spacial Impulse Response Rendering
http://slidepdf.com/reader/full/3d-spacial-impulse-response-rendering 7/10
nd International ongress on Acoustics, ICA 2016
*uenos Aires + to - &eptember, /0
Acoustics for the 21st
Century
E
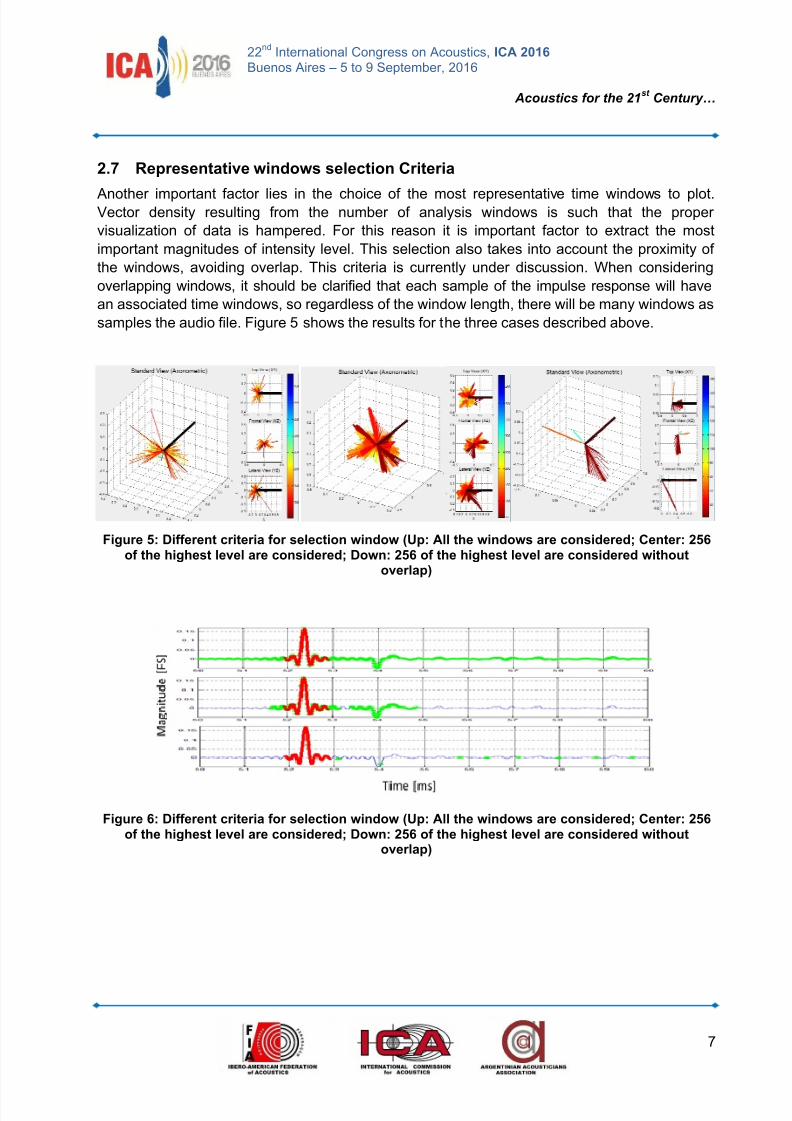
24: Represent$ti*e 3in#o3s se%e'tion Criteri$
Another important factor lies in the choice of the most representative time "indo"s to plot.5ector densit# resulting from the number of anal#sis "indo"s is such that the proper
visuali'ation of data is hampered. For this reason it is important factor to e9tract the most
important magnitudes of intensit# level. This selection also ta2es into account the pro9imit# of
the "indo"s, avoiding overlap. This criteria is currentl# under discussion. :hen considering
overlapping "indo"s, it should be clarified that each sample of the impulse response "ill have
an associated time "indo"s, so regardless of the "indo" length, there "ill be man# "indo"s as
samples the audio file. Figure sho"s the results for the three cases described above.
i&ure 5) Di!!erent 'riteri$ !or se%e'tion 3in#o3 -;p) A%% t"e 3in#o3s $re 'onsi#ere#< Center) 256o! t"e "i&"est %e*e% $re 'onsi#ere#< Do3n) 256 o! t"e "i&"est %e*e% $re 'onsi#ere# 3it"out
o*er%$p.
i&ure 6) Di!!erent 'riteri$ !or se%e'tion 3in#o3 -;p) A%% t"e 3in#o3s $re 'onsi#ere#< Center) 256o! t"e "i&"est %e*e% $re 'onsi#ere#< Do3n) 256 o! t"e "i&"est %e*e% $re 'onsi#ere# 3it"out
o*er%$p.
7/24/2019 3D Spacial Impulse Response Rendering
http://slidepdf.com/reader/full/3d-spacial-impulse-response-rendering 8/10
nd International ongress on Acoustics, ICA 2016
*uenos Aires + to - &eptember, /0
Acoustics for the 21st
Century
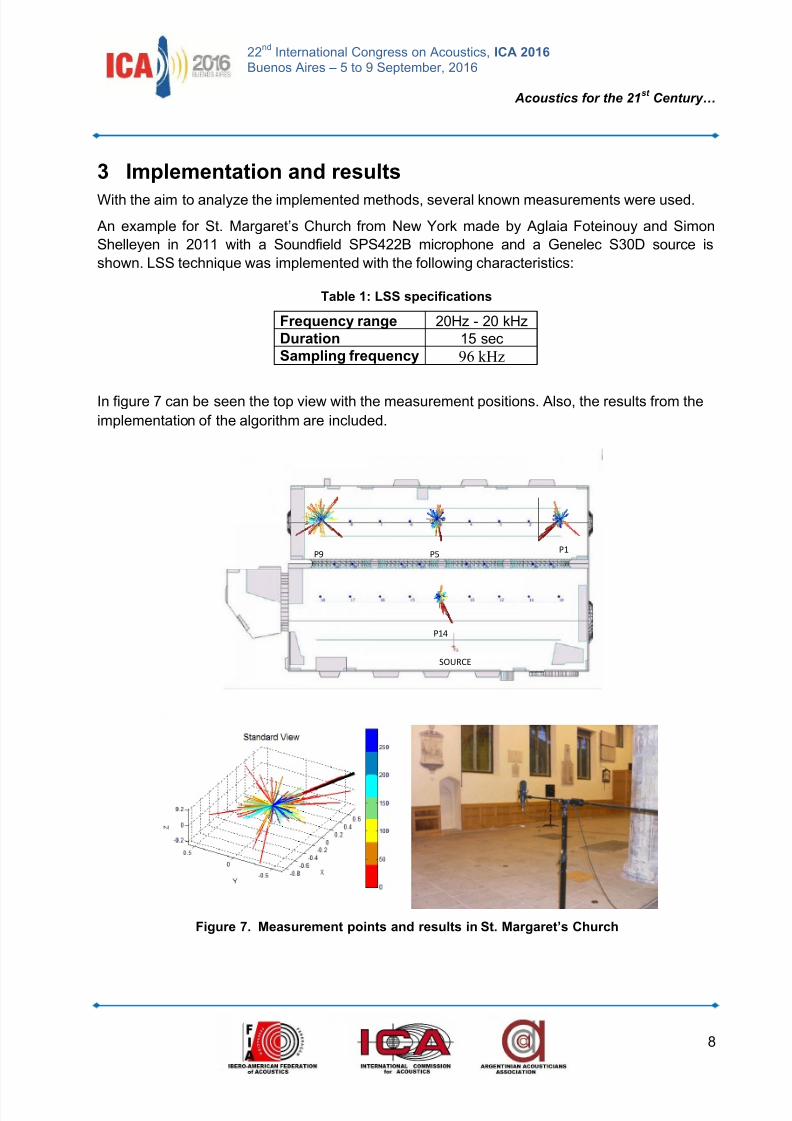
+ Imp%ement$tion $n# resu%ts
:ith the aim to anal#'e the implemented methods, several 2no"n measurements "ere used.
An e9ample for &t. 3argaret7s hurch from Ne" <or2 made b# Aglaia Foteinou# and &imon
&helle#en in // "ith a &oundfield &&* microphone and a Genelec &! source is
sho"n. 4&& techni6ue "as implemented "ith the follo"ing characteristicsH
/$b%e 1) SS spe'i!i'$tions
re8uen' r$n&e %' $ 2%'
Dur$tion / secS$mp%in& !re8uen' 96 kHz
In figure E can be seen the top vie" "ith the measurement positions. Also, the results from the
implementation of the algorithm are included.
P9 P5P1
P14
SOURCE
i&ure :4 =e$surement points $n# resu%ts in St4 =$r&$ret>s C"ur'"

7/24/2019 3D Spacial Impulse Response Rendering
http://slidepdf.com/reader/full/3d-spacial-impulse-response-rendering 9/10
nd International ongress on Acoustics, ICA 2016
*uenos Aires + to - &eptember, /0
Acoustics for the 21st
Century
-
In this measurement, different points located e6uidistantl# around the room "ere selected to
test the algorithm.
This geometric dispersion is favourable to assess the variation in the direction of the direct
sound and reflections. It is note"orth# that the results "ere not oriented to"ard the source
manuall# but is the result of the detection s#stem.
4oo2ing at the results that are in positions near the corners of the room it is possible to observe
ho" the secondar# components ac6uire a magnitude comparable "ith the direct sound. This is
because the pro9imit# to the reflective surfaces.*# contrast, for positions and / the direct
sound has much more energ# than secondar# components. This tells that the results are
consistent "ith the acoustics of the room.
omplementaril#, complete s#stem "as evaluated performing a measurement on a real and
2no"n situation. To achieve this tas2, a conditioned room "ith F8NA class / material "ith a mm thic2ness, a &oundfield && microphone, a B1B 1oc2it source "as used. As
mentioned above, it is recommended to perform a measurement of the source in anechoic
conditions (or almost). The techni6ues described previousl# "ere used "ith an ms "indo"
(given the geometr# of the room and the minimum distance to reflective surfaces), reaching a
lo"er fre6uenc# anal#sis of // %'. Using the 4&& (s duration bet"een and / 2%' "ith a
sampling fre6uenc# of /) and implementing Bir2eb# techni6ue, impulse response
measurements "ere achieved. &ubse6uentl#, Format A to * conversion "as performed using a
plugin provided b# the &oundfield ompan#.
i&4 ?4 =e$surement points $n# resu%ts $'"ie*e# in $n $'ousti'$%% tre$te# room
1esults sho" that the direction of the vector corresponding to the direct sound maintains a
correspondence "ith the location of the source. %o"ever, it is slightl# oriented to the right
("here there are energ# components of the reflection). This ma# be due to overlapping of
7/24/2019 3D Spacial Impulse Response Rendering
http://slidepdf.com/reader/full/3d-spacial-impulse-response-rendering 10/10
nd International ongress on Acoustics, ICA 2016
*uenos Aires + to - &eptember, /0
Acoustics for the 21st
Century
/
reflections in the same time "indo", since the measurement "as performed in a room "here
the time difference bet"een the sound paths is small. It can also be noticed from the reflective
and diffusing surfaces.
Con'%usions
An algorithm for obtaining impulses responses in three dimensions "as developed and
implemented. The results obtained prove the correspondence "ith the different acoustic
situations evaluated, demonstrating the validit# of the theor# used. Thus, it can be noted that
the method involves a useful and practical tool for the anal#sis of an# t#pe of acoustic
environment. Its scope and applications should be studied in the future in order to build the
basis for the description of acoustic problems. It is noted that li2e the impulse responses, other
parameters can also be anal#sed b# interpreting intensit# vectors, so different applications inacousticsma# be benefited "ith the development of this tool.
It should be noted that the stud# should be continued "ith measurementsto determine the
precision in magnitude and direction of the vectors obtained b# relating them to the acoustic
situation.
A'7no3%e#&ments
The authors "ould li2e to ac2no"ledge the Universit# of &an *uenaventura, olombia for offer
assistance and dedication in the development of the algorithm. Also a special than2s to the
Universidad Nacional de Tres de Febrero multimedia staff for providing the e6uipment for
measurement.
Re!eren'es
>/? 8rtolani, F. Introduction to Ambisonics$ A tutorials for beginners in ! audio. Audio EngineeringSociety Convention Paper , /, /$/0.
>? A$format to *$format conversion. cfarina.eng.unipr.it. 1etrieved 3a# /, fromhttpHpcfarina.eng.unipr.itublic*$formatA*$conversionA*.htm, /
>? Farina A., Tronchin 4. ! &ound haracterisation in Theatres Dmplo#ing 3icrophone Arra#s. Acta Acustica United with Acustica, /
>? Farina A.&imulataneous measurement of impulse response and distortion "ith a s"ept$sinetechni6ue. Audio Engineering Society,.
>? Farina A. Advancements in impulse response measurements b# sine s"eeps. Audio EngineeringSociety , E.
>0? Bir2eb# 8. Nelson . !igital Filter !esign for Inversion roblems in &ound 1eproduction. /---
>E? &turm *., !efrance G. !etection and estimation of arrivals in room impulse responses b# greed#sparse appro9imation. /.
>? Usher J. An improved method to determine the onset timings of reflections in an acoustic impulseresponse. /.