Embed Size (px)
Citation preview

Delft University of Technology
3D FEM approach for laterally loaded monopile design
Murphy, Gerry; Igoe, David; Doherty, Paul; Gavin, K.
DOI10.1016/j.compgeo.2018.03.013Publication date2018Document VersionFinal published versionPublished inComputers and Geotechnics
Citation (APA)Murphy, G., Igoe, D., Doherty, P., & Gavin, K. (2018). 3D FEM approach for laterally loaded monopiledesign. Computers and Geotechnics, 100, 76-83. https://doi.org/10.1016/j.compgeo.2018.03.013
Important noteTo cite this publication, please use the final published version (if applicable).Please check the document version above.
CopyrightOther than for strictly personal use, it is not permitted to download, forward or distribute the text or part of it, without the consentof the author(s) and/or copyright holder(s), unless the work is under an open content license such as Creative Commons.
Takedown policyPlease contact us and provide details if you believe this document breaches copyrights.We will remove access to the work immediately and investigate your claim.
This work is downloaded from Delft University of Technology.For technical reasons the number of authors shown on this cover page is limited to a maximum of 10.

Green Open Access added to TU Delft Institutional Repository
‘You share, we take care!’ – Taverne project
https://www.openaccess.nl/en/you-share-we-take-care
Otherwise as indicated in the copyright section: the publisher is the copyright holder of this work and the author uses the Dutch legislation to make this work public.
Contents lists available at ScienceDirect
Computers and Geotechnics
journal homepage: www.elsevier.com/locate/compgeo
Research Paper
3D FEM approach for laterally loaded monopile design
Gerry Murphya, David Igoea,b,⁎, P. Dohertya, K. Gavina,c
aGavin and Doherty Geosolutions, Dublin, Irelandb Trinity College Dublin, Irelandc TU Delft, The Netherlands
A R T I C L E I N F O
Keywords:Offshore foundationsPilingLateral loadingFinite element modellingMonopiles
A B S T R A C T
Over the past 5 years, a substantial research effort aimed at optimising the design of offshore wind turbines hasled to significant reductions in the projected cost of developing offshore wind. Optimising the geotechnicaldesign of these structures, through modern analysis techniques such as 3D Finite Element Modelling (FEM), hasplayed a key role in helping to reduce costs. This paper presents a methodology for accurately modellingmonopile behaviour using Cone Penetration Test (CPT) data to calibrate the non-linear stress dependentHardening Soil (HS) model. The methodology is validated by comparing the modelled behaviour to field tests ona range of pile geometries. The paper also demonstrates how the soil-pile reaction response curves can beextracted from the FE model by isolating the stresses on each element of the pile. The contribution of eachcomponent to the overall lateral resistance is shown to vary with the pile geometry and is examined using theextracted soil reaction curves.
1. Introduction
Monopiles are the most commonly used foundation system forsupporting offshore wind turbines, accounting for ∼80% of all sub-structures installed to date [1]. Monopile foundations are single largediameter open-ended tubular steel piles, typically driven into the seabed, which rely on the stiffness and strength of the surrounding soil toprovide resistance against large environmental loads from wind andwaves. Typical monopile diameters range from 4 to 6m, however dueto increasing turbine sizes and applicable water depths, XXL monopilesof up to 10m in diameter are being considered [2]. The slendernessratio of embedded pile length to diameter (L/D) of a monopile typicallyvaries between 4 and 8, depending on the applied loading and groundconditions, but L/D ratios of 3 or less are anticipated for future XXLmonopiles.
1.1. Monopile design practice
The traditional industry standard approach for the geotechnicaldesign of monopiles are those recommended by Det Norske Veritas –Germanischer Lloyd (DNV-GL), which are based on AmericanPetroleum Institute (API) design guidelines, and were originally in-tended for oil & gas jacket piles. Both guidance documents adopt aWinkler beam approach where the lateral soil reaction at a given depthis described by decoupled non-linear ‘p-y’ curves, where p is the lateral
soil reaction and y is the lateral displacement response [3,4]. Themethods were calibrated using a limited number of pile tests performedon slender jacket piles with diameters less than 1m, and are generallynot valid for large diameter monopiles. Recent editions of the DNV-GLguidelines have been updated to recommend that the p-y curves usedfor monopile design should be validated by FE analysis, however cur-rently there is no consensus on how this is best achieved in practice.
For the geotechnical design of an individual monopile, a number oflimit states must be considered. This paper focuses on the UltimateLimit State (ULS) and Serviceability Limit State (SLS) pile behaviour asthe design pile length is typically governed by these cases. For eachindividual turbine, a significant number of load cases must be analysed,including time domain analyses for the dynamic response during op-eration [5]. In addition, the calculated loading is dependent on thestructures geometry and the foundation stiffness and therefore requiresa number of load-geometry iterations for optimisation. The use of nu-merical approaches, such as 3D FEM, are now widely adopted in bothresearch and industry for modelling complex 3D soil-structure inter-action problems. However, when considering the optimisation of anentire offshore wind farm, it becomes clear that relying solely on 3DFEM is too computationally expensive for running all the necessarydesign iterations and therefore simpler Winkler beam type models arestill required [6].
https://doi.org/10.1016/j.compgeo.2018.03.013Received 17 August 2017; Received in revised form 21 February 2018; Accepted 27 March 2018
⁎ Corresponding author at: Trinity College Dublin, Ireland.E-mail address: [email protected] (D. Igoe).
Computers and Geotechnics 100 (2018) 76–83
Available online 13 April 20180266-352X/ © 2018 Elsevier Ltd. All rights reserved.
T
1.2. Current state of the art in monopile geotechnical design
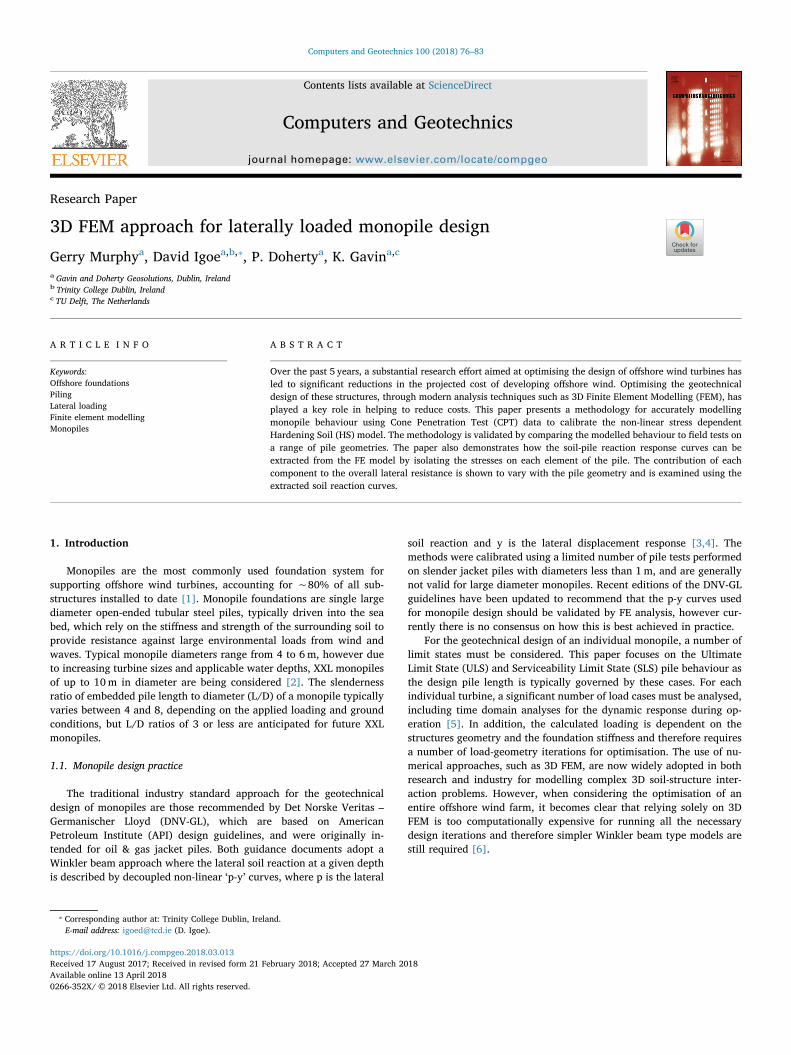
In order to reduce calculation times and improve design efficiencyByrne et al. [2] proposed that the soil reaction curves can be extractedfrom 3D FE analyses and implemented in a 1D spring model [5]. Thismethod benefits from both the accurate model complexity provided bythe 3D FEM and also the reduced computation time of the conventionalp-y framework. In order to achieve an accurate representation of the 3DFEM using a 1D Winkler beam model, Byrne et al. [2] extended thetraditional ‘p-y’ approach to include additional soil reaction compo-nents as follows: (i) the distributed moments, m, due to vertical shaftshear stresses during pile rotation at given depth θ; (ii) the base shear,S, during horizontal translation at the pile toe and (iii) the base mo-ment, M, during rotation of the pile toe, see Fig. 1 [2]. These additionalcomponents of soil reaction have been shown to have a significant in-fluence on Monopiles with a slenderness ratio (L/D) of less than 5. Themethodology outlined in this paper shows how each soil reactioncomponent can be extracted from a 3D FE Plaxis model, and used asinputs to a 1D FE model to quickly optimise the monopile design andimprove design efficiency.
It should be noted that the potential of this approach is entirelydependent on developing 3D FE models which can reliably and accu-rately capture the monopile response under a range of loading condi-tions covering small to large strains. To date several studies have beenpublished in which large diameter monopiles have been successfullyanalysed using commercially available 3D FE packages [7–15], how-ever few have been validated against actual monopile load test resultsand therefore the accuracy of these models is uncertain.
The calibration of the constitutive soil model to accurately capturethe non-linear behaviour over a large strain range is the key challengewhen modelling the monopile response. In this paper, the HardeningSoil (HS) soil model was chosen because of its ability to model non-linear soil behaviour, but also for the simplicity of deriving the modelinput parameters. Several more advanced constitutive soil models,which have the ability to better capture the fundamental critical statemechanics of sands and clays, have been utilised for predicting thebehaviour of laterally loaded piles in recent studies [16–19]. However,
there is often an inherent difficulty in using these models in practicedue to difficulties in calibrating the input parameters which, in somecases, require significant specialised laboratory element testing.
For most offshore wind farms, only a limited amount of geotechnicalinformation will be available at an early stage of a project, typicallyCPT tests and a limited amount of standard laboratory tests (shear box,triaxial, oedometer, DSS). In addition, the difficulty in acquiring un-disturbed sand samples offshore means that these lab tests are oftencarried out on reconstituted samples and may not be representative ofthe particle interlocking, cementation and dilatational behaviour ofaged dense sand deposits in-situ. Therefore, using a relatively simpleconstitutive model which can capture the non-linear soil response (suchas the HS model) and which can be calibrated using in-situ test datasuch as CPT tests offers a useful way for designers to estimate themonotonic pile loading response.
2. 3D FE modelling
2.1. General modelling approach
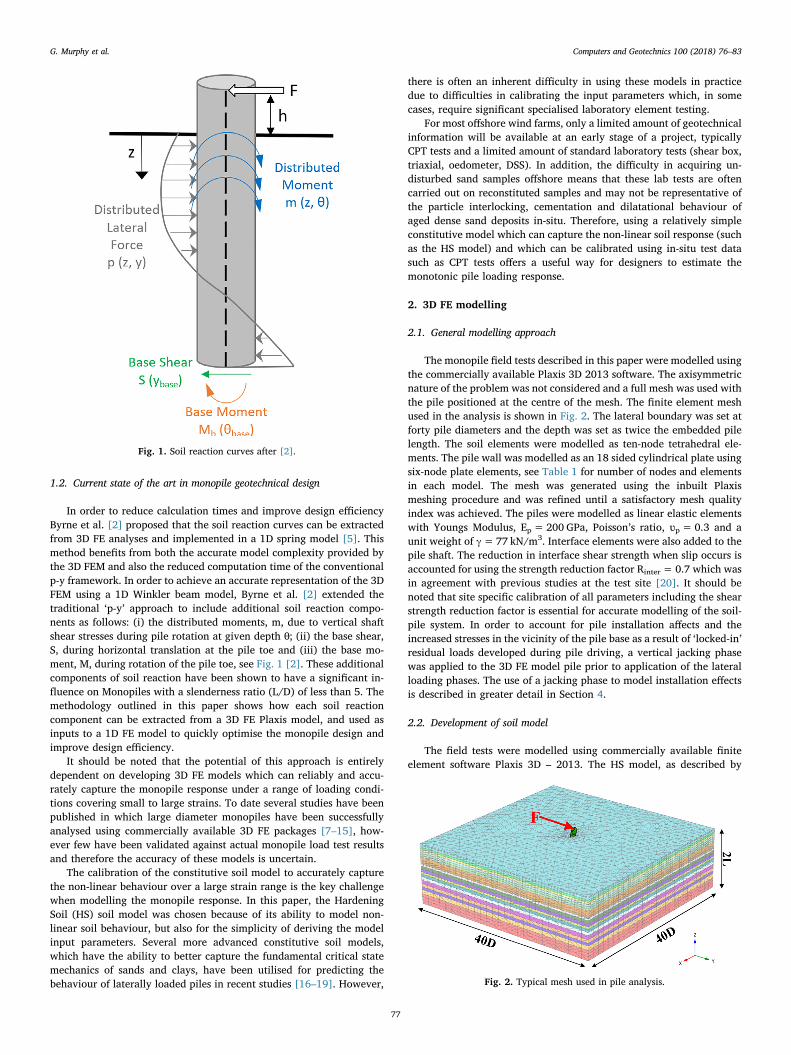
The monopile field tests described in this paper were modelled usingthe commercially available Plaxis 3D 2013 software. The axisymmetricnature of the problem was not considered and a full mesh was used withthe pile positioned at the centre of the mesh. The finite element meshused in the analysis is shown in Fig. 2. The lateral boundary was set atforty pile diameters and the depth was set as twice the embedded pilelength. The soil elements were modelled as ten-node tetrahedral ele-ments. The pile wall was modelled as an 18 sided cylindrical plate usingsix-node plate elements, see Table 1 for number of nodes and elementsin each model. The mesh was generated using the inbuilt Plaxismeshing procedure and was refined until a satisfactory mesh qualityindex was achieved. The piles were modelled as linear elastic elementswith Youngs Modulus, Ep= 200 GPa, Poisson’s ratio, ʋp= 0.3 and aunit weight of γ=77 kN/m3. Interface elements were also added to thepile shaft. The reduction in interface shear strength when slip occurs isaccounted for using the strength reduction factor Rinter= 0.7 which wasin agreement with previous studies at the test site [20]. It should benoted that site specific calibration of all parameters including the shearstrength reduction factor is essential for accurate modelling of the soil-pile system. In order to account for pile installation affects and theincreased stresses in the vicinity of the pile base as a result of ‘locked-in’residual loads developed during pile driving, a vertical jacking phasewas applied to the 3D FE model pile prior to application of the lateralloading phases. The use of a jacking phase to model installation effectsis described in greater detail in Section 4.
2.2. Development of soil model
The field tests were modelled using commercially available finiteelement software Plaxis 3D – 2013. The HS model, as described by
Fig. 1. Soil reaction curves after [2].
Fig. 2. Typical mesh used in pile analysis.
G. Murphy et al. Computers and Geotechnics 100 (2018) 76–83
77
Schanz [21], was adopted to define the soil stiffness behaviour. The HSparameters were derived using correlations with the CPT cone re-sistance (qc) at both sites. The first step in the design process was thediscretisation of the CPT profiles for the upper and lower level test sites,as shown in Fig. 3a. The peak friction angle, φ, was estimated ac-counting for density and stress level effects using Eqs. (1)–(3) [22–24].
⎜ ⎟ ⎜ ⎟= + ⎡⎣⎢
⎛⎝
⎞⎠
⎛⎝
′ ⎞⎠
⎤⎦⎥
φqP
σP
17.6 11log /t
a
vo
a
0.5
(1)
= − ′ψ φ φ( )/0.8cv (2)
=′( )
D350
r
qP
σP
20.5
ca
voa (3)
where qt is the cone tip stress corrected for pore water effects, σ′vo is theeffective vertical stress (σ′vo= σ′1) calculated using an effective unitweight of 20 kN/m3, Pa is the reference atmospheric pressure(=100 kPa), ψ is the dilation angle, φ′cv is the constant volume frictionangle calculated from simple laboratory tests and Dr is the relativedensity (%). The in-situ soil stress state calculated using Eqs. (4)–(6)[25,26].
= ⎡
⎣⎢
∗∗ ′
⎤
⎦⎥
−OCR
qK σ1.33 t
NC vo
ϕ0.22
00.31
1sin 0.27
(4)
= −K φ1 sinNC0 (5)
= ∗K K OCRNCφ
0 0sin (6)
where OCR is the overconsolidation ratio of the soil, K0NC is the lateral
stress coefficient for normally consolidated soils and K0 describes theeffect of OCR on the lateral stress coefficient [27].
The stiffness characteristics of the HS model were defined for eachlayer based on the empirical correlations for the constrained tangentstiffness modulus Eoed from Kulhawy & Mayne (1990), the secantstiffness modulus E50 was calculated using Hooke’s law as described byBrinkgreve et al. (2012) [27,28].
= −E q 10oed NC cD
,1.09 0.0075 r (7)
= −E q 10oed OC cD
,1.78 0.0122 r (8)
= − +−
E v vv
E(1 2 )(1 )1 oed50 (9)
= ×E E3ur 50 (10)
where Eoed,NC and Eoed,OC are the constrained tangent oedometermodulus for normally and over consolidated sands, E50 is the secantstiffness modulus calculated following Hooke’s law and Eur is the un-load-reload stiffness calculated as recommended in the Plaxis materialsmanual. As the sand at the Blessington site is overconsolidated, Eq. (8)was adopted to derive the Eoed value. These moduli are dependent onthe in-situ stress following the shape of the power function, m, given inBrinkgreve et al. (2012) and are inputted into Plaxis 3D as referencevalues (Pa= 100 kPa). The reference moduli are calculated as follows:
=⎛
⎝⎜⎜
−
+
⎞
⎠⎟⎟
′
E Ec φ φ
c φ P φ/
cos sin
cos ·sinoedref
oed
σK
a
m
NC3
0
(11)
⎜ ⎟= ⎛⎝
− ′+
⎞⎠
E Ec φ σ φ
c φ P φ/
cos sincos ·sin
ref
a
m
50 503
(12)
⎜ ⎟= ⎛⎝
− ′+
⎞⎠
E Ec φ σ φ
c φ P φ/
cos sincos ·sinur
refur
a
m3
(13)
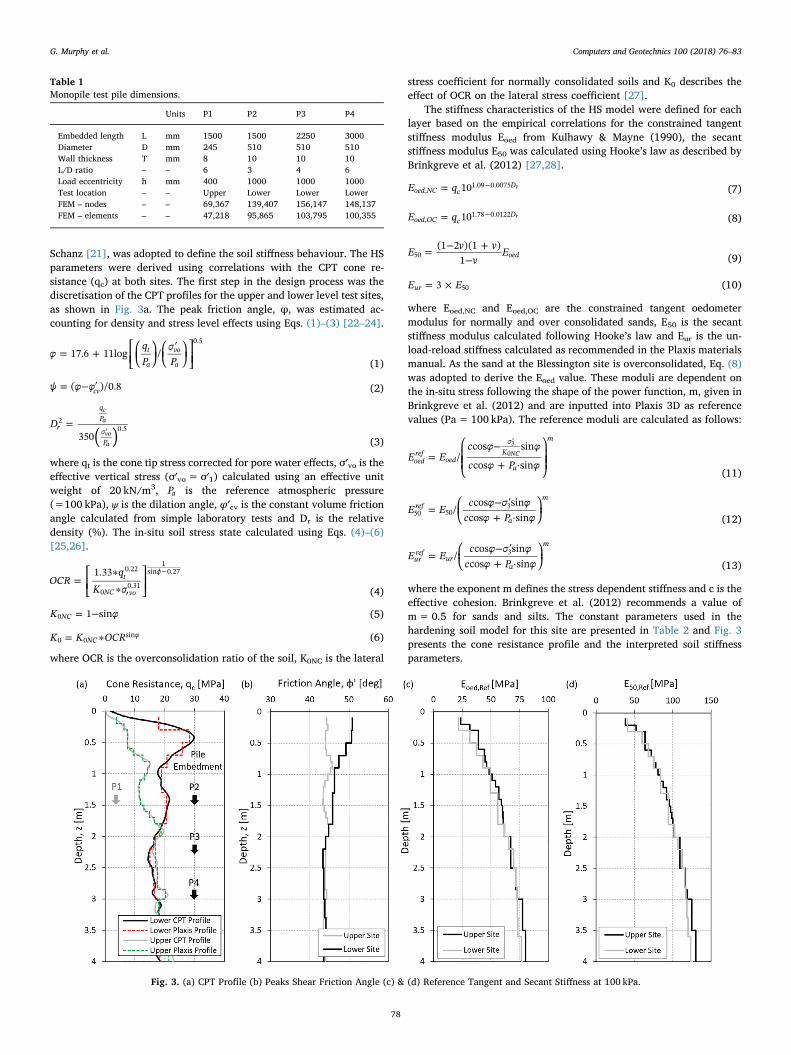
where the exponent m defines the stress dependent stiffness and c is theeffective cohesion. Brinkgreve et al. (2012) recommends a value ofm=0.5 for sands and silts. The constant parameters used in thehardening soil model for this site are presented in Table 2 and Fig. 3presents the cone resistance profile and the interpreted soil stiffnessparameters.
Table 1Monopile test pile dimensions.
Units P1 P2 P3 P4
Embedded length L mm 1500 1500 2250 3000Diameter D mm 245 510 510 510Wall thickness T mm 8 10 10 10L/D ratio – – 6 3 4 6Load eccentricity h mm 400 1000 1000 1000Test location – – Upper Lower Lower LowerFEM – nodes – – 69,367 139,407 156,147 148,137FEM – elements – – 47,218 95,865 103,795 100,355
Fig. 3. (a) CPT Profile (b) Peaks Shear Friction Angle (c) & (d) Reference Tangent and Secant Stiffness at 100 kPa.
G. Murphy et al. Computers and Geotechnics 100 (2018) 76–83
78
2.3. Post processing soil reaction curves
Soil reaction curves can be extracted from the 3D FE model for fu-ture application into a less computationally intensive 1D spring model.The soil reaction curves can be calculated by examining the stressesacting on the pile structural elements, following the methodologies of[2,10,16]. For each loading stage, the stresses acting on the pile in-terface elements are outputted at fixed stress points as effective normalstresses and horizontal and vertical shear stresses. The stresses at eachgauss point along the pile circumference are resolved into resultantforces acting in the loading (y) direction using Gaussian quadrature.The angle of the each stress relative to the y-direction in the horizontalplane is determined from the coordinates of the node points from thecorresponding pile plate elements. The total area of each plate elementis determined as the cross product of the corner node coordinates, andthe appropriate Gaussian weight factor is applied to each stress pointbased on the stress point nomenclature, as defined in [28].
The soils distributed reaction force in the y-direction, p, is thencalculated at the midpoint of each discretisation depth by summing allthe resolved lateral forces acting on the external pile surface over thediscretisation interval. Likewise, the distributed moment, m, is calcu-lated from the vertical shear forces acting around the pile centreline.The base shear and base moment are calculated in a similar mannerfrom the stresses acting on the internal pile shaft. The profiles of hor-izontal pile displacement (y) with depth (z) are extracted from the plateelements within Plaxis 3D by generating load-displacement curves atfixed depths corresponding to the mid-point of the elements along thepile for each load stage.
This process is repeated for each discretisation depth and automatedusing a code implemented in Matlab to reduce calculation time. Theforces in the load direction and bending moments along the pile cir-cumference are then used to create bending moment and shear forceprofiles along the pile shaft. The bending moments along the length ofthe pile can be calculated from the extracted soil stresses by doubleintegration of the lateral forces (in the y-direction) on the external pilesurface, p, and the equivalent forces on the internal pile surface, s.These are then combined with the distributed moments due to the
vertical shear stress acting on the internal and external pile faces as inEq. (14).
∬ ∫= + + + + +M F h z p s dz m m dz·( ) ( )· ( )·zz z
int0 0 (14)
where Mz is the bending moment at depth below mudline z, F is theapplied load above mudline, h is the height of load application abovemudline, m is the distributed moment due to vertical shear forces on theexternal pile surface and mint is the distributed moment due to verticalshear forces on the internal pile surface. To develop the additional re-action springs proposed by Byrne et al. to be implemented in a Winklerbeam model, the base shear – displacement, S-y, and base moment-rotation, Mb-θ, can be calculated as:
∫=S s dz·L
0 (15)
∫=M m dz·bL
int0 (16)
where L is the pile embedded length. Equilibrium can be checked bycomparing the sum of the forces and moments in the load direction tothe applied load. A moment equilibrium tolerance of less than 1% wasachieved in this study.
3. Field testing
3.1. Monopile static loading field tests
To validate the FE models, a series of field tests were conductedusing prototype scale piles embedded in an over-consolidated densesand deposit. Four open-ended steel piles with diameters of 245mmand 510mm were driven to embedded lengths between 1500mm and3000mm (with slenderness ration, L/D, between 3 and 6), see Table 1.The piles were installed at two locations in an active quarry. The first(upper) location was excavated more than ten years before the loadtests were performed. The second (lower) location was excavated morerecently.
The test site is located in Blessington, approximately 25 km south-west of Dublin in Ireland. The site consists of a uniformly graded,horizontally bedded, heavily over-consolidated, and very dense sanddeposit. An extensive site investigation comprising CPT, SeismicDilatometer Testing (SDMT), plate load testing, sonic core sampling,trial pits (for soil classification testing), and in-situ geophysical testinghave been undertaken and detailed descriptions of soil properties havebeen described in previous publications, see [20,29–31]. The watertable is> 10m below ground level (bgl) at the upper site and 2.5m bgl.at the lower site. The CPT qc profiles shown in Fig. 3(a) reveal that theqc values are notably larger over the top 2m bgl at the lower site. Atdepths greater than 2m bgl, the profiles become very similar. Test pileP1 was instrumented using strain gauges attached to the tension andcompression faces of the pile. The strain gauge data was used to derivebending moment profiles for each load increment applied in a staticload test as described in detail by Xue et al. and Murphy et al. [32,33].The test piles were loaded (using maintained load increments) until pilehead displacement continued without the addition of a further loadincrement. The test configuration used for the 510mm pile was similarto the 245mm tests described in Murphy et al., however, a load ec-centricity of 1m was used, compared with an eccentricity of 0.4m forthe 245mm pile tests. The test load was measured using an in-line loadcell, the lateral displacement of the test piles was measured at threelocations using linear displacement transducers and the pile rotationwas measured using four digital inclinometers. The measured load-displacement response of the field test piles are presented in Fig. 4(solid lines).
Table 2Constant soil model inputs.
Parameter Symbol Units Value
Effective soil weight γ kN/m3 20Effective cohesion c′ kN/m2 0.1Reference stress Pa kN/m2 100Poissons ratio ν – 0.2Void ratio emax – 0.91
emin – 0.57Interface Stiffness Rinter – 0.7
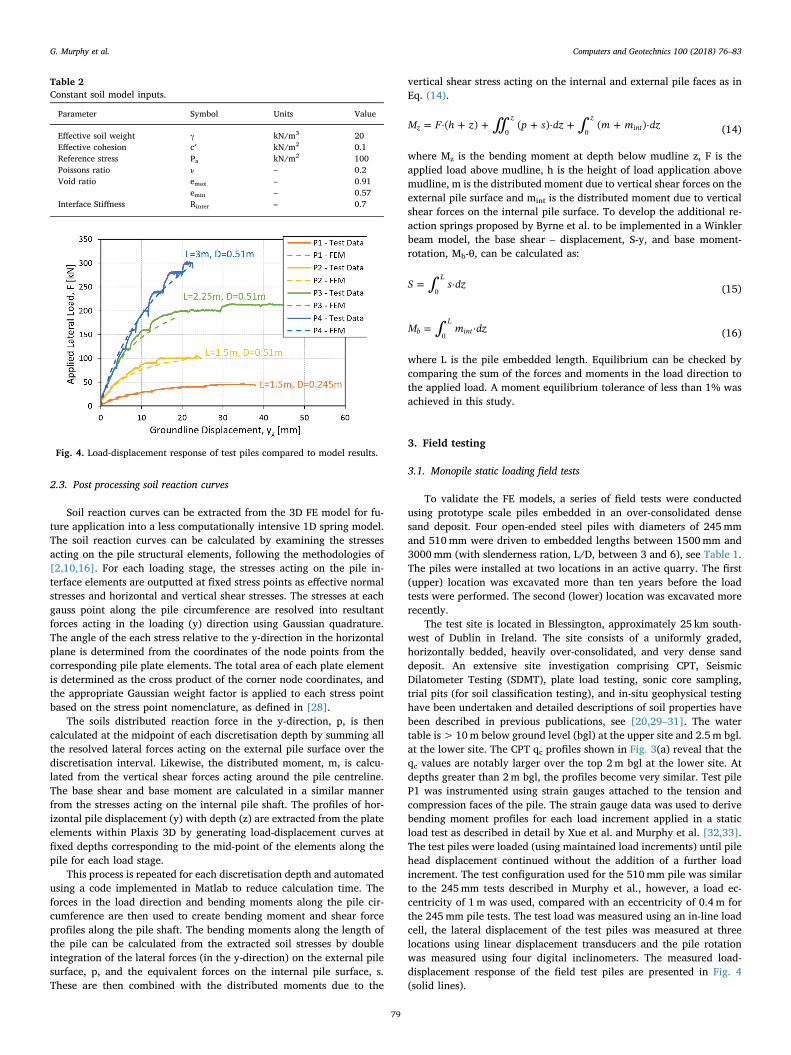
Fig. 4. Load-displacement response of test piles compared to model results.
G. Murphy et al. Computers and Geotechnics 100 (2018) 76–83
79
4. Analysis and 3D FE model validation
Once each model run was completed, the load-displacement and soilreaction curves were extracted from each load stage using the dis-placement and stresses acting along the pile shaft, following the pro-cedure outlined previously. A comparison of the Plaxis model outputswith the field tests is shown in Fig. 4 which demonstrates the excellentagreement between the FEM displacements and the measured groundline displacements for all piles.
4.1. Consideration of installation stresses
The bearing capacity and stiffness response of a pile in sand is pri-marily dependent on the sand density and the in-situ stress state. Pileinstallation by driving will result in large shear strains and a significantincrease in stress along the shaft and near the pile tip. These changeswill increase the lateral bearing capacity and are critically dependenton the degree of plugging experienced by the pile during installation,see [31,34]. Most current numerical studies do not take installationeffects into account, however some recent studies have examined thisissue in detail and with some success using more advanced constitutivesoil models [35,36].
Gavin and Lehane (2005) observed that the average base stressmobilised during a hammer blow is in the range of 10–20% of the qcvalue [37]. When pile driving ceases a residual stress will remain at thepile tip, resulting in ‘locked-in’ stress in the vicinity of the pile base.Despite the increase in sophistication and computational power ofcommercially available FEM software most FEM codes do not permitthe full simulation of the pile installation and the piles are simply
“wished in place” with only the overburden stresses acting on the pile.This is due to large mesh distortion issues when considering large de-formations [36,38]. In this paper, a hybrid approach was adopted toapproximate the residual base stresses generated during pile driving.Firstly, the pile is “wished in place”, then a series of vertical displace-ments were applied to the pile head to push (or jack) the pile a smalldistance into the soil mesh. Small vertical displacement increments(≈1%D) were used to approximate the final stages of pile driving. Thestresses at the pile base were examined at each displacement stage. Dueto the uncertainty over the residual forces locked into field piles afterdriving, and the difficulties in measuring and separating the internal
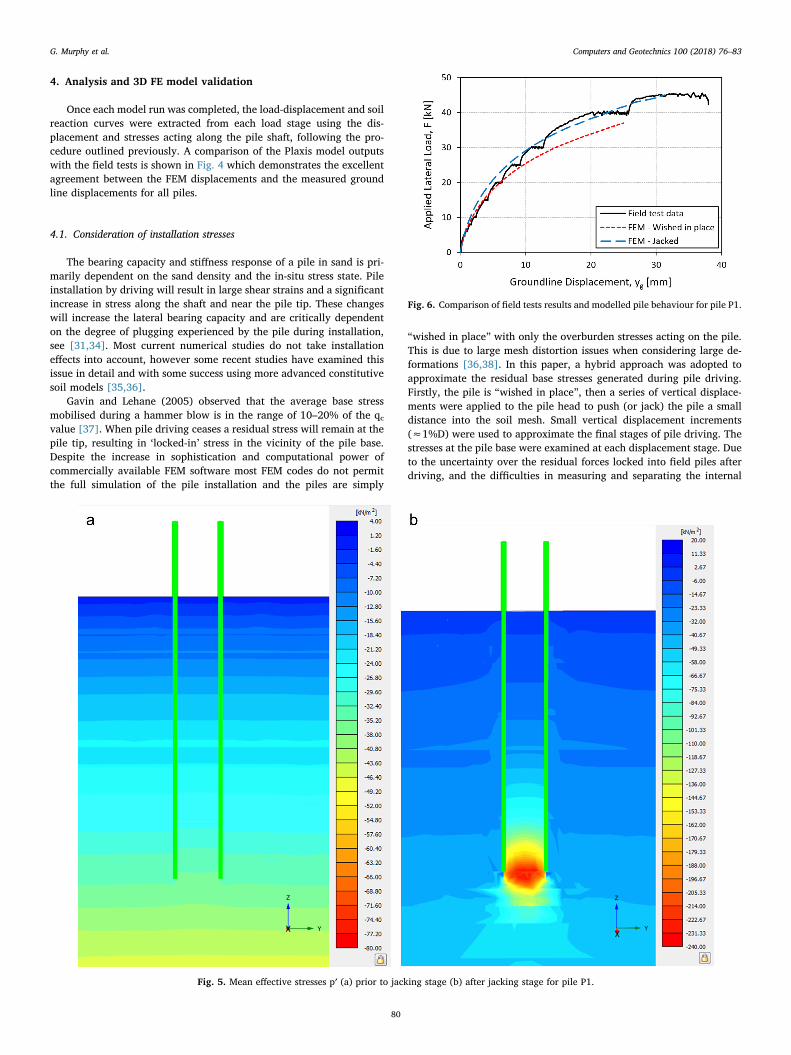
Fig. 5. Mean effective stresses p′ (a) prior to jacking stage (b) after jacking stage for pile P1.
Fig. 6. Comparison of field tests results and modelled pile behaviour for pile P1.
G. Murphy et al. Computers and Geotechnics 100 (2018) 76–83
80
and external shaft friction of field piles, an approximation of the stressincrease caused by pile driving was made. As an initial test, the verticalhead displacement was increased in increments until an approximateten-fold increase in mean effective stress (p′) was obtained numerically
at the pile base, see Fig. 5. The models were then reset and the pile waswished in place, the chosen vertical displacement (to achieve the ten-fold increase in p′) was then applied prior to the lateral loading beingapplied. The resulting vertical stress at the base corresponded to ap-proximately 15–20 times the in-situ vertical stress, σ′v0, or around 2–5%of the CPT cone resistance, qc, which was deemed to be an appropriateestimate of the residual base stress for an open-ended pile. The sameprocess was applied to each model pile with consistent results.
The benefits of applying a jacking stage in capturing the overall pileresponse is shown for pile P1 in Fig. 6. It is evident that applying thejacking stage provides a better match to the overall pile response, albeitslightly over-predicting the initial stiffness. In practice, for full scaleoffshore wind turbine design, there will typically be a sizeable verticalload component due to the self-weight of the wind turbine structure,which should be included in any FE model. For a conservative (i.e. lessstiff) design at full scale, it may be appropriate to include the verticalload component only.
The modelling approach was further validated by comparing thecalculated pile shaft bending moments in P1 to those measured usingstrain gauges as shown in Fig. 7 [33]. A comparison of sample p-ycurves extracted from the pile P1 “Jacked” and “Wished-in-Place”models are provided in Fig. 8. It is evident that applying a jacking stageonly has a minor influence on the p-y curves at shallow and mid-depths,but significantly affects the p-y curves in the high stress zone near thepile toe.
4.2. Effect of slenderness ratio on soil reaction components
To gain a better understanding of the effect of pile slenderness ratio(L/D) on the relative contribution of the different soil resistance com-ponents, the contribution of each component was calculated as a per-centage of the applied moment around the point of rotation (equal tothe restoring moment exerted by the soil on the pile). The total momentcontribution from the p-y and base shear components (i.e. force com-ponents) were calculated by multiplying the component force at eachdepth interval by its distance from the point of rotation (i.e. point ofzero lateral displacement, calculated during each load step) and sum-ming the calculated moments together for each component. The con-tribution due the distributed moment caused by vertical shaft shear
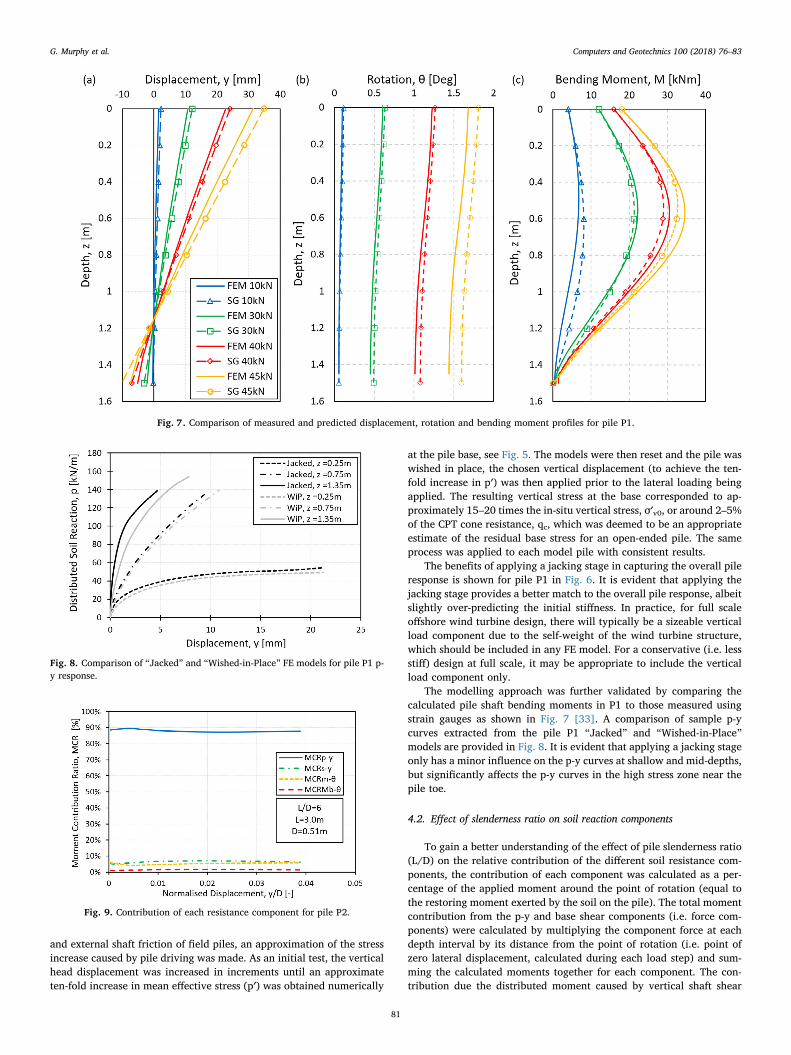
Fig. 7. Comparison of measured and predicted displacement, rotation and bending moment profiles for pile P1.
Fig. 8. Comparison of “Jacked” and “Wished-in-Place” FE models for pile P1 p-y response.
Fig. 9. Contribution of each resistance component for pile P2.
G. Murphy et al. Computers and Geotechnics 100 (2018) 76–83
81
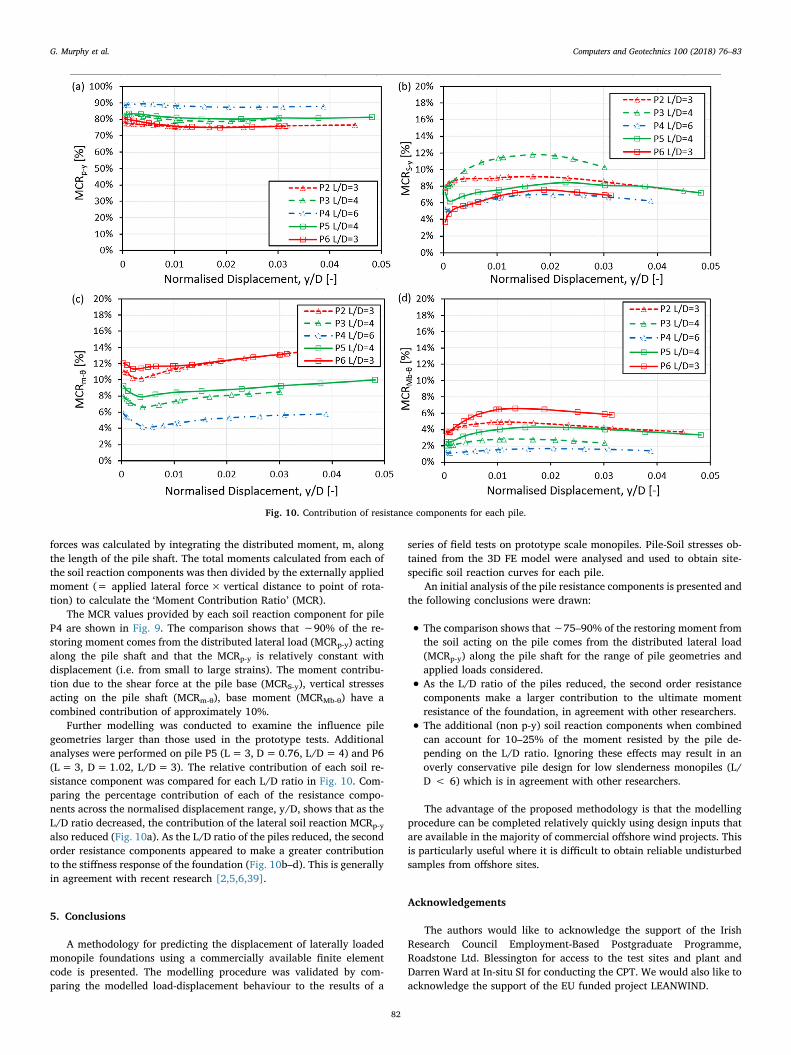
forces was calculated by integrating the distributed moment, m, alongthe length of the pile shaft. The total moments calculated from each ofthe soil reaction components was then divided by the externally appliedmoment (= applied lateral force× vertical distance to point of rota-tion) to calculate the ‘Moment Contribution Ratio’ (MCR).
The MCR values provided by each soil reaction component for pileP4 are shown in Fig. 9. The comparison shows that ∼90% of the re-storing moment comes from the distributed lateral load (MCRp-y) actingalong the pile shaft and that the MCRp-y is relatively constant withdisplacement (i.e. from small to large strains). The moment contribu-tion due to the shear force at the pile base (MCRS-y), vertical stressesacting on the pile shaft (MCRm-θ), base moment (MCRMb-θ) have acombined contribution of approximately 10%.
Further modelling was conducted to examine the influence pilegeometries larger than those used in the prototype tests. Additionalanalyses were performed on pile P5 (L= 3, D=0.76, L/D=4) and P6(L=3, D=1.02, L/D=3). The relative contribution of each soil re-sistance component was compared for each L/D ratio in Fig. 10. Com-paring the percentage contribution of each of the resistance compo-nents across the normalised displacement range, y/D, shows that as theL/D ratio decreased, the contribution of the lateral soil reaction MCRp-y
also reduced (Fig. 10a). As the L/D ratio of the piles reduced, the secondorder resistance components appeared to make a greater contributionto the stiffness response of the foundation (Fig. 10b–d). This is generallyin agreement with recent research [2,5,6,39].
5. Conclusions
A methodology for predicting the displacement of laterally loadedmonopile foundations using a commercially available finite elementcode is presented. The modelling procedure was validated by com-paring the modelled load-displacement behaviour to the results of a
series of field tests on prototype scale monopiles. Pile-Soil stresses ob-tained from the 3D FE model were analysed and used to obtain site-specific soil reaction curves for each pile.
An initial analysis of the pile resistance components is presented andthe following conclusions were drawn:
• The comparison shows that∼75–90% of the restoring moment fromthe soil acting on the pile comes from the distributed lateral load(MCRp-y) along the pile shaft for the range of pile geometries andapplied loads considered.
• As the L/D ratio of the piles reduced, the second order resistancecomponents make a larger contribution to the ultimate momentresistance of the foundation, in agreement with other researchers.
• The additional (non p-y) soil reaction components when combinedcan account for 10–25% of the moment resisted by the pile de-pending on the L/D ratio. Ignoring these effects may result in anoverly conservative pile design for low slenderness monopiles (L/D < 6) which is in agreement with other researchers.
The advantage of the proposed methodology is that the modellingprocedure can be completed relatively quickly using design inputs thatare available in the majority of commercial offshore wind projects. Thisis particularly useful where it is difficult to obtain reliable undisturbedsamples from offshore sites.
Acknowledgements
The authors would like to acknowledge the support of the IrishResearch Council Employment-Based Postgraduate Programme,Roadstone Ltd. Blessington for access to the test sites and plant andDarren Ward at In-situ SI for conducting the CPT. We would also like toacknowledge the support of the EU funded project LEANWIND.
Fig. 10. Contribution of resistance components for each pile.
G. Murphy et al. Computers and Geotechnics 100 (2018) 76–83
82
References
[1] Ewea. The European offshore wind industry. Key Trends Stat 2016; 2017, 33.[2] Byrne BW, Mcadam R, Burd HJ, Houlsby GT, Martin CM, Zdravkovi L, et al. New
design methods for large diameter piles under lateral loading for offshore windapplications. Front Offshore Geotech 2015;III:705–10.
[3] API. API Recommended Practice 2A-WSD Planning, Designing, and ConstructingFixed Offshore Platforms—Working Stress Design. 22nd ed.; 2014.
[4] DNV GL AS. DNVGL-ST-0126: support structures for wind turbines; 2016.[5] Byrne B, McAdam R, Burd H, Houlsby G, Martin C, Beuckelaers W, et al. PISA: new
design methods for offshore wind turbine monopiles. In: Proceeding offshore siteinvestig geotech conf, London, UK; 2017.
[6] Burd H, Byrne B, McAdam R, Houlsby G, Martin C, Beuckelaers W, et al. Designaspects for monopile foundations. In: Proceeding 19th ICSMGE, Seoul; 2017.
[7] Fan C, Long J. Assessment of existing methods for predicting soil response of lat-erally loaded piles in sand. Comput Geotech 2005;32:274–89. http://dx.doi.org/10.1016/j.compgeo.2005.02.004.
[8] Lesny K, Paikowsky S, Gurbuz A. Scale effects in lateral load response of largediameter monopiles. In: Proc Sess Geo-Denver 2007 contemp issues deep found;2007.
[9] Achmus M, Kuo Y-S, Abdel-Rahman K. Behavior of monopile foundations undercyclic lateral load. Comput Geotech 2009;36:725–35. http://dx.doi.org/10.1016/j.compgeo.2008.12.003.
[10] Bekken L. Lateral behaviour of large diameter offshore monopile foundations forwind turbines. Delft University of Technology; 2009.
[11] Kim Y, Jeong S. Analysis of soil resistance on laterally loaded piles based on 3Dsoil–pile interaction. Comput Geotech 2011;38:248–57. http://dx.doi.org/10.1016/j.compgeo.2010.12.001.
[12] Zdravković L, Taborda DMG, Potts DM, Jardine RJ, Sideri M, Schroeder FC.Numerical modelling of large diameter piles under lateral loading for offshore windapplications. In: Third int symp front offshore geotech (ISFOG 2015), Oslo Norway;2015. p. 759–64.
[13] Gupta BK, Basu D. Analysis of laterally loaded rigid monopiles and poles in mul-tilayered linearly varying soil. Comput Geotech 2016;72:114–25. http://dx.doi.org/10.1016/j.compgeo.2015.11.008.
[14] Thieken K, Achmus M, Lemke K. A new static p-y approach for piles with arbitrarydimensions in sand. Geotechnik 2015;38:267–88. http://dx.doi.org/10.1002/gete.201400036.
[15] Lesny K, Wiemann J. Finite-element-modelling of large diameter monopiles foroffshore wind energy converters. GeoCongress 2006, Reston, VA: American Societyof Civil Engineers; 2006. p. 1–6. http://dx.doi.org/10.1061/40803(187)212.
[16] Zdravković L, Taborda DMG, Potts DM, Jardine RJ, Sideri M, Schroeder FC, et al.Numerical modelling of large diameter piles under lateral loading for offshore windapplications. Front. Offshore Geotech. III, Oslo Norway; 2015. p. 759–64.
[17] Wang D, Bienen B, Nazem M, Tian Y, Zheng J, Pucker T, et al. Large deformationfinite element analyses in geotechnical engineering. Comput Geotech2015;65:104–14. http://dx.doi.org/10.1016/j.compgeo.2014.12.005.
[18] Khoa HDV, Jostad HP. Application of a cyclic accumulation model UDCAM to FEanalyses of offshore foundations. In: Proc 4th Congrès Int Géotechnique – Ouvrages-Structures. CIGOS 2017; 2017. p. 656–67.
[19] Jostad HP, Grimstad G, Andersen KH, Sivasithamparam N. A FE procedure forcalculation of cyclic behaviour of offshore foundations under partly drained con-ditions. Front Offshore Geotech III 2015. 978-1.
[20] Doherty P, Kirwan L, Gavin K, Igoe D, Tyrrell S, Ward D, et al. An overview of theUCD geotechnical research site at Blessington. In: Caprani C, O’Connor A, editors.Proc BCRI 2012, 6–7th Sept. 2012, Dublin, Dublin, Ireland: Bridge and ConcreteResearch Ireland; 2012. p. 499–504.
[21] Schanz T, Vermeer A, Bonnier P. The hardening soil model: formulation and ver-ification. In: Beyond 2000 Comput Geotech 10 years PLAXIS Int Proc Int Sympbeyond 2000 Comput Geotech Amsterdam Netherlands 1820 March 1999; 1999. p.281.
[22] Bolton MD. The strength and dilatancy of Sands. Géotechnique 1986;36:65–78.[23] Kulhawy F, Mayne PW. Manual on estimating soil properties for foundation design;
1990.[24] Lunne T, Christoffersen HP. Interpretation of cone penetrometer data for offshore
sands. In: 15th Annu OTC Houston, TX, May 2–5; 1983.[25] Mayne PW, Kulhawy F. Ko – OCR relationships in soils. J Geotech Eng Div
1982;108:851–72.[26] Mayne PW. Stress strain strength flow parameters from enhanced in-situ tests. In:
Proceedings, Int Conf In-Situ Meas Soil Prop Case Hist. [In-Situ 2001], Bali,Indones; 2001. p. 27–48.
[27] Kulhawy F, Mayne PW. Manual on estimating soil properties for foundation design;1990.
[28] Brinkgreve RBJ. PLAXIS 3D reference manual; 2013.[29] Gavin K, O’Kelly B, Adekunte A. A field investigation of vertical footing response on
sand. Proc ICE – Geotech Eng 2009;162:257–67. http://dx.doi.org/10.1680/geng.2009.162.5.257.
[30] Tolooiyan A, Gavin K. Modelling the cone penetration test in sand using cavityexpansion and arbitrary Lagrangian Eulerian finite element methods. ComputGeotech 2011;38:482–90. http://dx.doi.org/10.1016/j.compgeo.2011.02.012.
[31] Igoe D, Gavin K, O’Kelly BC. Shaft capacity of open-ended piles in sand. J GeotechGeoenviron Eng 2011;137:903–13. http://dx.doi.org/10.1061/(ASCE)GT.1943-5606.0000511.
[32] Xue J, Murphy G, Doherty P, Igoe D, Gavin K. Optimization technique to determinethe p-y curves of laterally loaded stiff piles in dense sand. Geotech Test J2016;39:20140257. http://dx.doi.org/10.1520/GTJ20140257.
[33] Murphy G, Doherty P, Cadogan D, Gavin K. Field experiments on instrumentedwinged-monopiles. ICE Proc – Geotech Eng Press 2016;169:227–39. http://dx.doi.org/10.1680/jgeen.15.00134.
[34] Gavin KG. Behaviour of open and closed ended piles in sand – PhD Thesis. TrinityCollege Dublin; 1998.
[35] Phuong NTV, van Tol AF, Elkadi ASK, Rohe A. Numerical investigation of pile in-stallation effects in sand using material point method. Comput Geotech2016;73:58–71. http://dx.doi.org/10.1016/j.compgeo.2015.11.012.
[36] Dijkstra J, Broere W, Heeres OM. Numerical simulation of pile installation. ComputGeotech 2011;38:612–22. http://dx.doi.org/10.1016/j.compgeo.2011.04.004.
[37] Gavin K, Lehane BM. Estimating the end bearing resistance of pipe piles in sandusing the final filling ratio. Front Offshore Geotech, Perth: Taylor and Francis; 2005.p. 717–24. http://dx.doi.org/10.1201/NOE0415390637.ch81.
[38] Dijkstra J, Broere W, van Tol AF. Eulerian simulation of the installation process of adisplacement pile. contemp. top. situ testing, anal. reliab. found., Reston, VA:American Society of Civil Engineers; 2009, p. 135–42. http://dx.doi.org/10.1061/41022(336)18.
[39] Lam IP. Diameter effects on p-y curves. Deep mar found – a perspect des constr deepmar found; 2009, 88.
G. Murphy et al. Computers and Geotechnics 100 (2018) 76–83
83