Embed Size (px)
Citation preview
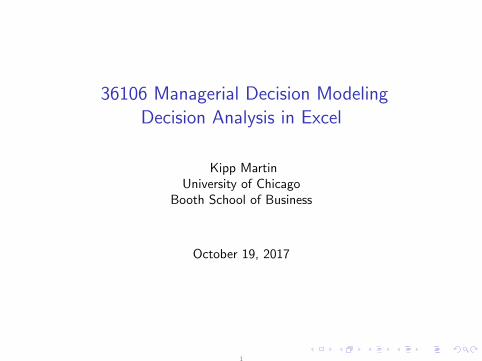
36106 Managerial Decision ModelingDecision Analysis in Excel
Kipp MartinUniversity of Chicago
Booth School of Business
October 19, 2017
1
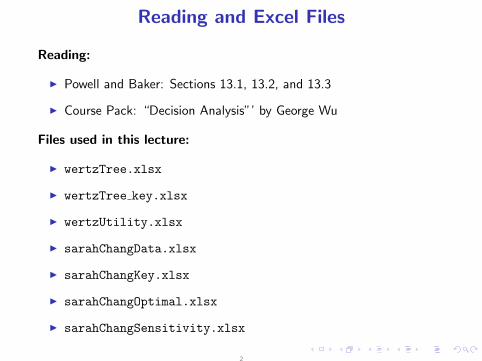
Reading and Excel Files
Reading:
I Powell and Baker: Sections 13.1, 13.2, and 13.3
I Course Pack: “Decision Analysis”’ by George Wu
Files used in this lecture:
I wertzTree.xlsx
I wertzTree key.xlsx
I wertzUtility.xlsx
I sarahChangData.xlsx
I sarahChangKey.xlsx
I sarahChangOptimal.xlsx
I sarahChangSensitivity.xlsx
2
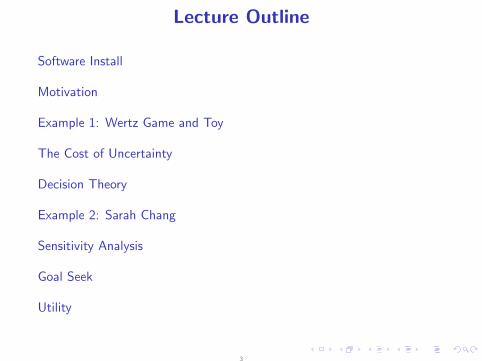
Lecture Outline
Software Install
Motivation
Example 1: Wertz Game and Toy
The Cost of Uncertainty
Decision Theory
Example 2: Sarah Chang
Sensitivity Analysis
Goal Seek
Utility
3
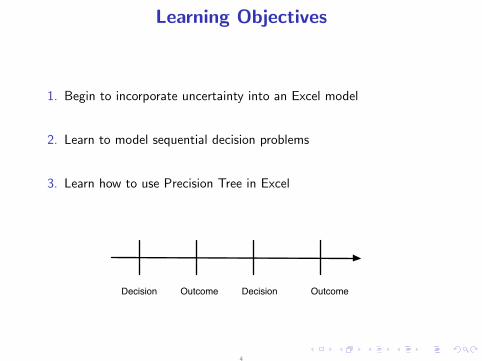
Learning Objectives
1. Begin to incorporate uncertainty into an Excel model
2. Learn to model sequential decision problems
3. Learn how to use Precision Tree in Excel
Decision Outcome Decision Outcome
4
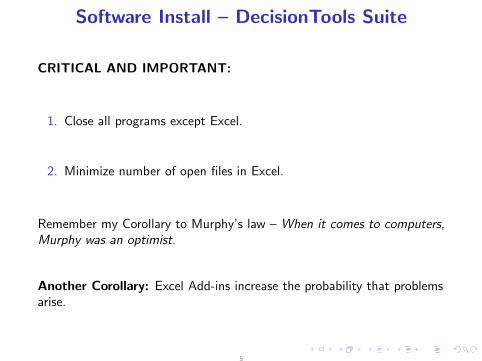
Software Install – DecisionTools Suite
CRITICAL AND IMPORTANT:
1. Close all programs except Excel.
2. Minimize number of open files in Excel.
Remember my Corollary to Murphy’s law – When it comes to computers,Murphy was an optimist.
Another Corollary: Excel Add-ins increase the probability that problemsarise.
5
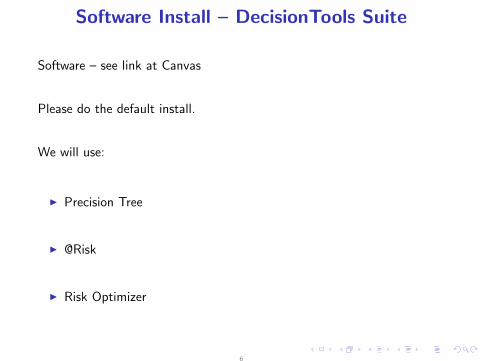
Software Install – DecisionTools Suite
Software – see link at Canvas
Please do the default install.
We will use:
I Precision Tree
I @Risk
I Risk Optimizer
6

Software Install – DecisionTools Suite
If you do the default install, you should see desktop icons like:
7
Software Install – DecisionTools Suite
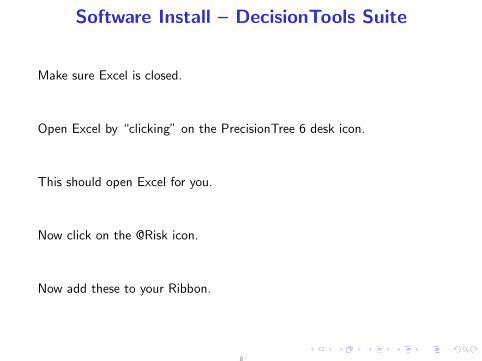
Make sure Excel is closed.
Open Excel by “clicking” on the PrecisionTree 6 desk icon.
This should open Excel for you.
Now click on the @Risk icon.
Now add these to your Ribbon.
8
Software Install – DecisionTools Suite
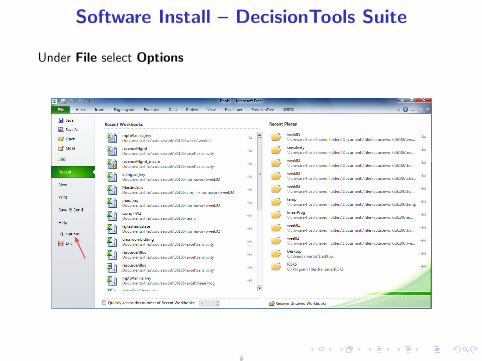
Under File select Options
9
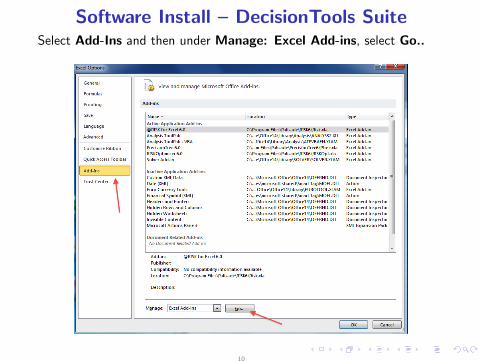
Software Install – DecisionTools SuiteSelect Add-Ins and then under Manage: Excel Add-ins, select Go..
10
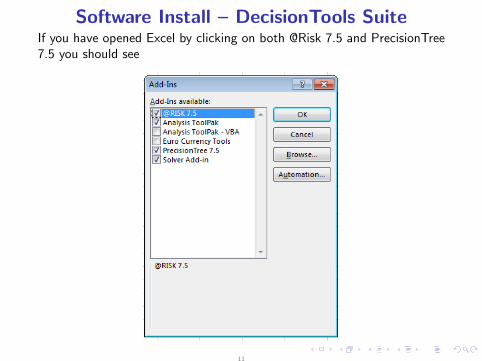
Software Install – DecisionTools SuiteIf you have opened Excel by clicking on both @Risk 7.5 and PrecisionTree7.5 you should see
11
Software Install – DecisionTools Suite
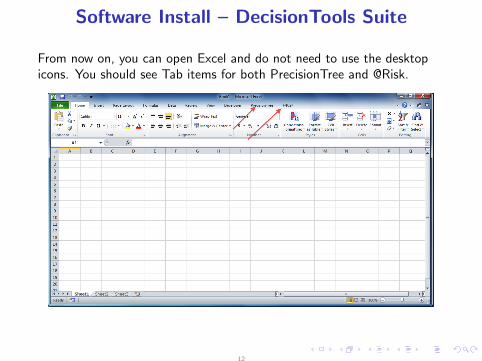
From now on, you can open Excel and do not need to use the desktopicons. You should see Tab items for both PrecisionTree and @Risk.
12
Software Install – DecisionTools Suite
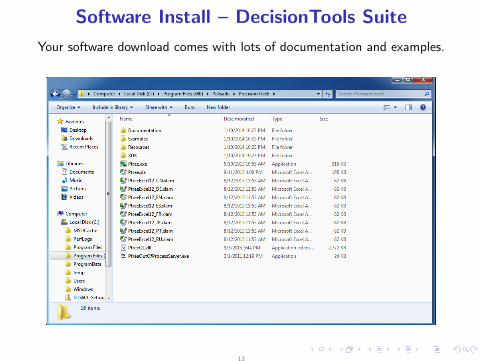
Your software download comes with lots of documentation and examples.
13
Motivation
See http:
//www.palisade.com/cases/bucknell.asp?caseNav=byProduct
I Disaster Planning
I Geothermal Power Plant Equipment Procurement
I Portfolio Management
I Exchange Rate Analysis
I Endangered Species Protection
I Pollution Cleanup
14
Motivation
Key Concept: most people do not understand
I the concept of an optimal solution
I variables
I parameters
I constraints
I an objective function
Thinking about your problem in the context of these ideas may bevery beneficial.
15
Motivation
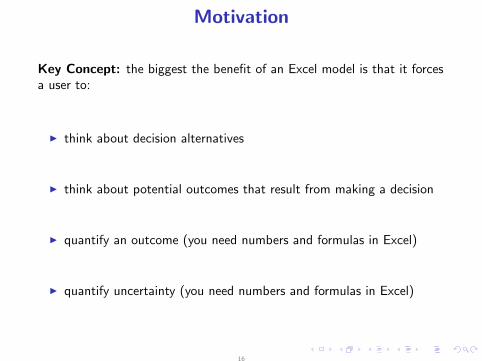
Key Concept: the biggest the benefit of an Excel model is that it forcesa user to:
I think about decision alternatives
I think about potential outcomes that result from making a decision
I quantify an outcome (you need numbers and formulas in Excel)
I quantify uncertainty (you need numbers and formulas in Excel)
16
Motivation
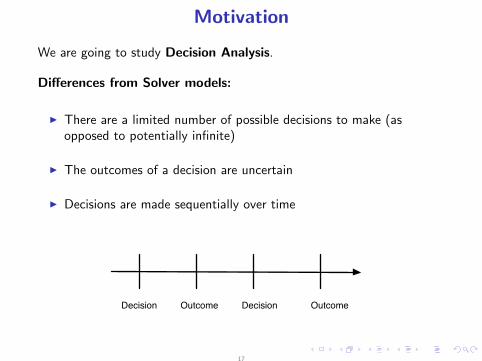
We are going to study Decision Analysis.
Differences from Solver models:
I There are a limited number of possible decisions to make (asopposed to potentially infinite)
I The outcomes of a decision are uncertain
I Decisions are made sequentially over time
Decision Outcome Decision Outcome
17
Motivation
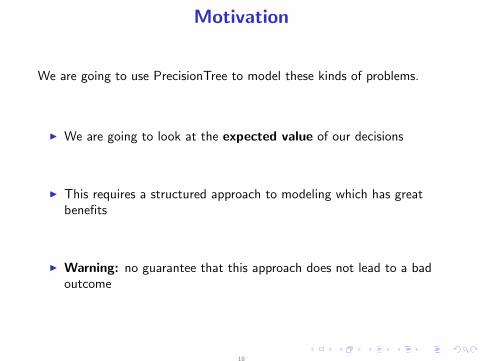
We are going to use PrecisionTree to model these kinds of problems.
I We are going to look at the expected value of our decisions
I This requires a structured approach to modeling which has greatbenefits
I Warning: no guarantee that this approach does not lead to a badoutcome
18
Motivation
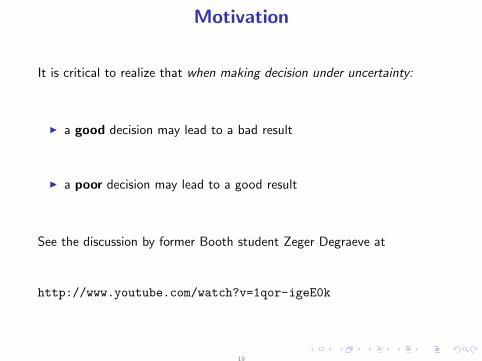
It is critical to realize that when making decision under uncertainty:
I a good decision may lead to a bad result
I a poor decision may lead to a good result
See the discussion by former Booth student Zeger Degraeve at
http://www.youtube.com/watch?v=1qor-igeE0k
19
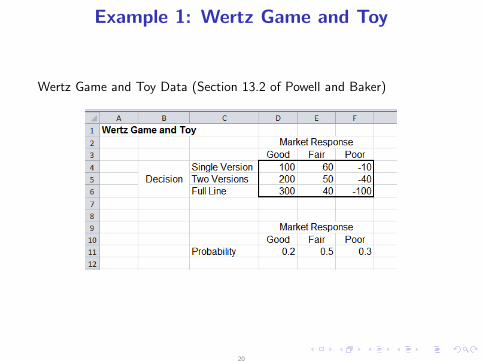
Example 1: Wertz Game and Toy
Wertz Game and Toy Data (Section 13.2 of Powell and Baker)
20
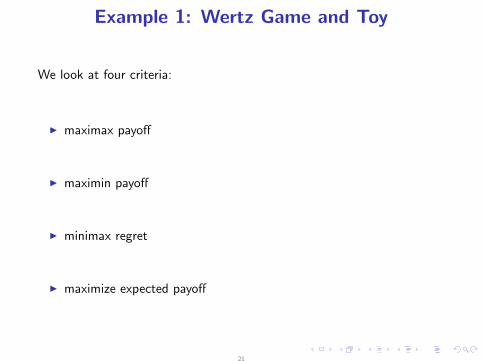
Example 1: Wertz Game and Toy
We look at four criteria:
I maximax payoff
I maximin payoff
I minimax regret
I maximize expected payoff
21
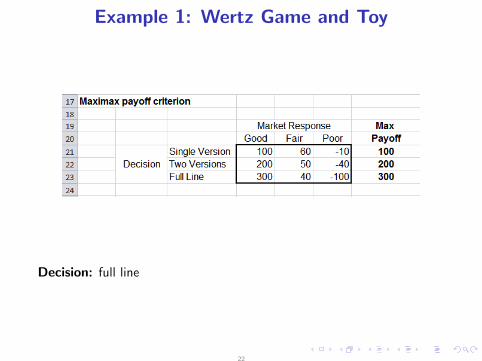
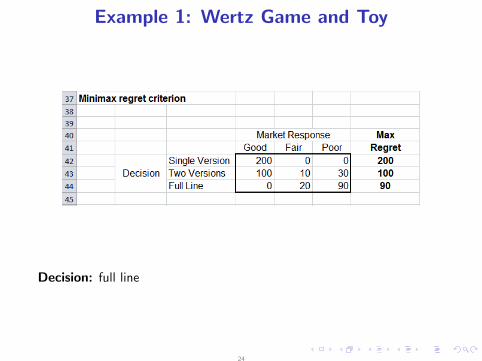
Example 1: Wertz Game and Toy
Decision: full line
22
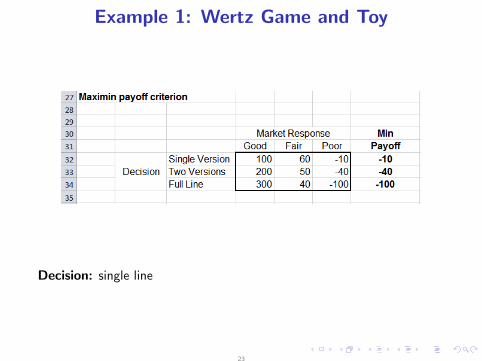
Example 1: Wertz Game and Toy
Decision: single line
23
Example 1: Wertz Game and Toy
Decision: full line
24
Example 1: Wertz Game and Toy
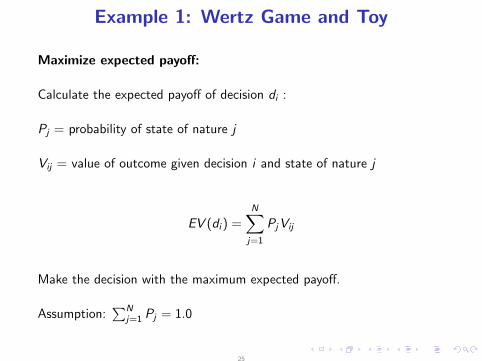
Maximize expected payoff:
Calculate the expected payoff of decision di :
Pj = probability of state of nature j
Vij = value of outcome given decision i and state of nature j
EV (di ) =N∑j=1
PjVij
Make the decision with the maximum expected payoff.
Assumption:∑N
j=1 Pj = 1.0
25
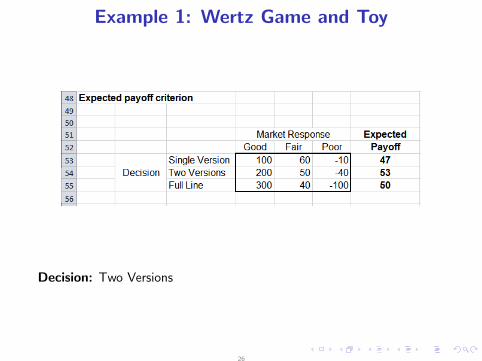
Example 1: Wertz Game and Toy
Decision: Two Versions
26
The Cost of Uncertainty
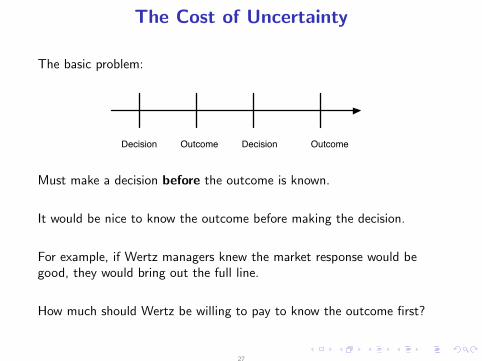
The basic problem:
Decision Outcome Decision Outcome
Must make a decision before the outcome is known.
It would be nice to know the outcome before making the decision.
For example, if Wertz managers knew the market response would begood, they would bring out the full line.
How much should Wertz be willing to pay to know the outcome first?
27
The Cost of Uncertainty
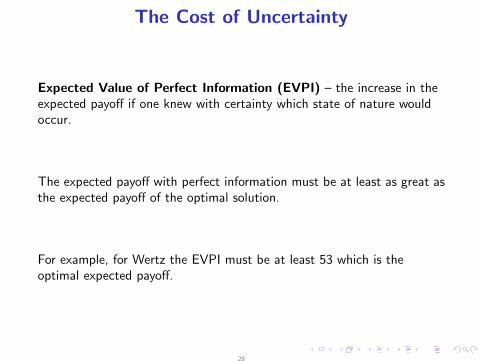
Expected Value of Perfect Information (EVPI) – the increase in theexpected payoff if one knew with certainty which state of nature wouldoccur.
The expected payoff with perfect information must be at least as great asthe expected payoff of the optimal solution.
For example, for Wertz the EVPI must be at least 53 which is theoptimal expected payoff.
28
The Cost of Uncertainty
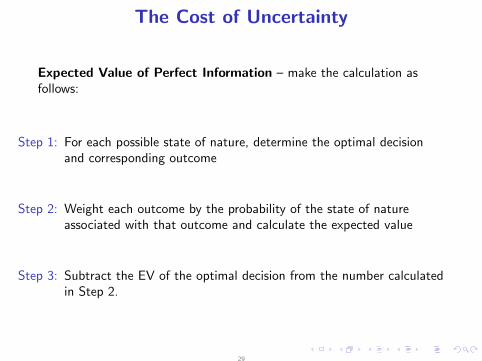
Expected Value of Perfect Information – make the calculation asfollows:
Step 1: For each possible state of nature, determine the optimal decisionand corresponding outcome
Step 2: Weight each outcome by the probability of the state of natureassociated with that outcome and calculate the expected value
Step 3: Subtract the EV of the optimal decision from the number calculatedin Step 2.
29
The Cost of Uncertainty
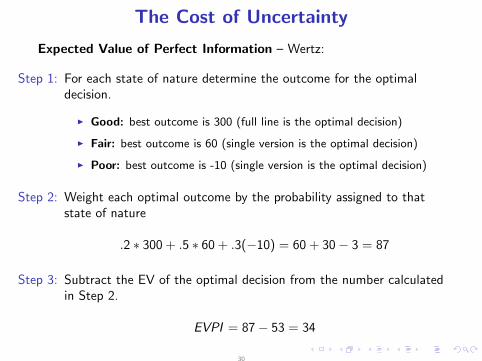
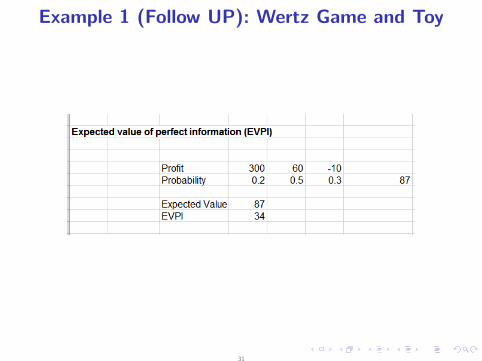
Expected Value of Perfect Information – Wertz:
Step 1: For each state of nature determine the outcome for the optimaldecision.
I Good: best outcome is 300 (full line is the optimal decision)
I Fair: best outcome is 60 (single version is the optimal decision)
I Poor: best outcome is -10 (single version is the optimal decision)
Step 2: Weight each optimal outcome by the probability assigned to thatstate of nature
.2 ∗ 300 + .5 ∗ 60 + .3(−10) = 60 + 30 − 3 = 87
Step 3: Subtract the EV of the optimal decision from the number calculatedin Step 2.
EVPI = 87 − 53 = 34
30
Example 1 (Follow UP): Wertz Game and Toy
31
Example : Wertz Game and Toy
Wertz is a very simple model.
There is only one decision made at time 0
It is trivial to find the optimal decision in an Excel table. Just calculatethe expected payoff for each decision.
However, real life is more complicated, and often involves a sequence ofdecisions.
More sophisticated tools are required.
32
Decision Theory
See Decision Analysis by George Wu.
Four Steps in Decision Making Process
Step 1: Structuring a Decision Problem (alternatives, uncertainties, andobjectives)
Step 2: Assessment and Information Gathering
Step 3: Evaluation of Decision Problem (PrecisionTree used in this step)
Step 4: Sensitivity Analysis (PrecisionTree used in this step)
33
Decision Theory
Step 1: Structuring a Decision Problem Instead of the Solver (A(adjustable cells), B (best cell), and C (constraint cells) ) we have:
I What are the alternatives?
I What are the critical uncertainties?
I What are the objectives?
34
Decision Theory
Step 2: Assessment and Information Gathering: Collect the relevantinformation,
I assess the values of the outcomes given decisions that were made(e.g. in Wertz the outcome of a good market response, given thedecision to produce the full line is 300)
I determine the likelihood of uncertain events (e.g. in Wertz theprobability of a fair market response is 0.5)
Discussion Point: What is meant by the probability of an event?
35
Decision Theory
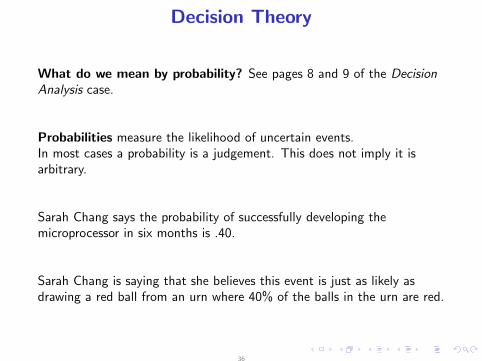
What do we mean by probability? See pages 8 and 9 of the DecisionAnalysis case.
Probabilities measure the likelihood of uncertain events.In most cases a probability is a judgement. This does not imply it isarbitrary.
Sarah Chang says the probability of successfully developing themicroprocessor in six months is .40.
Sarah Chang is saying that she believes this event is just as likely asdrawing a red ball from an urn where 40% of the balls in the urn are red.
36
Decision Theory
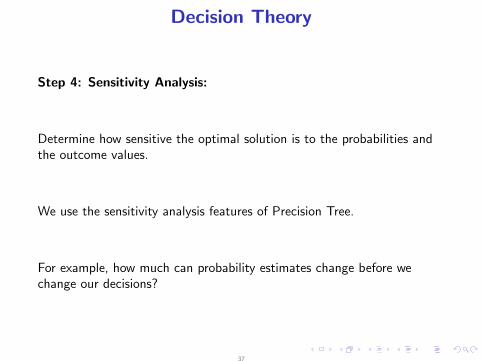
Step 4: Sensitivity Analysis:
Determine how sensitive the optimal solution is to the probabilities andthe outcome values.
We use the sensitivity analysis features of Precision Tree.
For example, how much can probability estimates change before wechange our decisions?
37
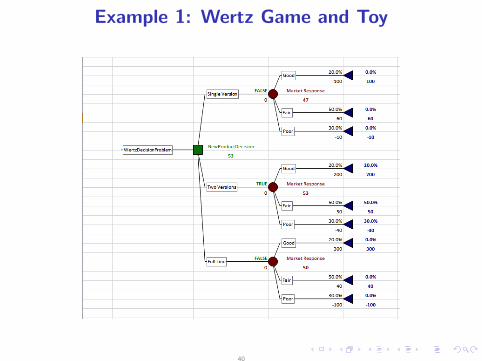
Example 1: Wertz Game and Toy
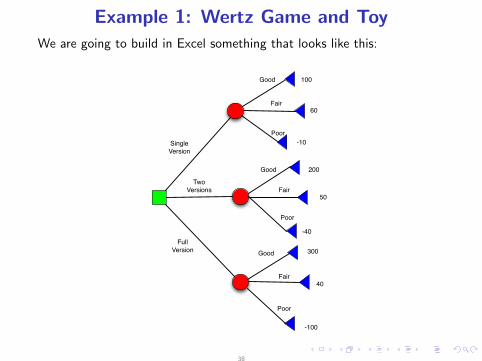
We are going to build in Excel something that looks like this:
SingleVersion
TwoVersions
FullVersion
Good
Fair
Poor
100
60
-10
Good
Fair
Poor
200
50
-40
Good
Fair
Poor
300
40
-100
38
Example 1: Wertz Game and Toy
Icon coding scheme:
I a green square – a point in time where we make a decision
I a red circle – a chance node, an uncertain outcome occurs
I a blue triangle – indicates the end of branch
Time proceeds left to right.
Probabilities and monetary values are placed next to nodes
Expected values are computed by the folding-back process
The optimal path is indicated by TRUE nodes.
39
Example 1: Wertz Game and Toy
40
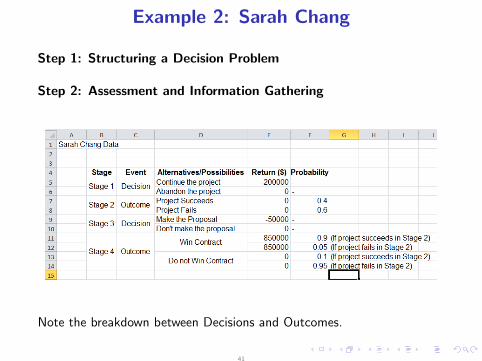
Example 2: Sarah Chang
Step 1: Structuring a Decision Problem
Step 2: Assessment and Information Gathering
Note the breakdown between Decisions and Outcomes.
41
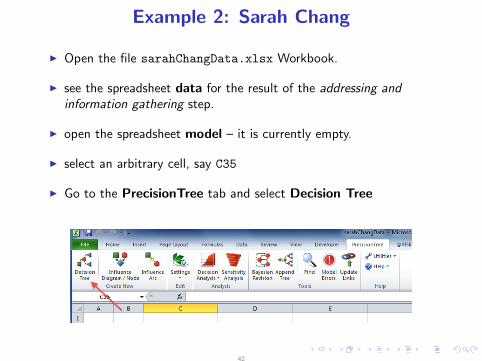
Example 2: Sarah Chang
I Open the file sarahChangData.xlsx Workbook.
I see the spreadsheet data for the result of the addressing andinformation gathering step.
I open the spreadsheet model – it is currently empty.
I select an arbitrary cell, say C35
I Go to the PrecisionTree tab and select Decision Tree
42
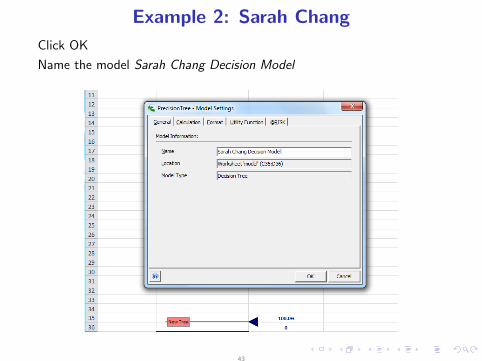
Example 2: Sarah Chang
Click OK
Name the model Sarah Chang Decision Model
43
Example 2: Sarah Chang
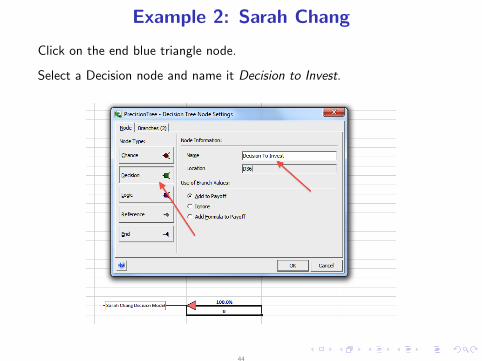
Click on the end blue triangle node.
Select a Decision node and name it Decision to Invest.
44
Example 2: Sarah Chang
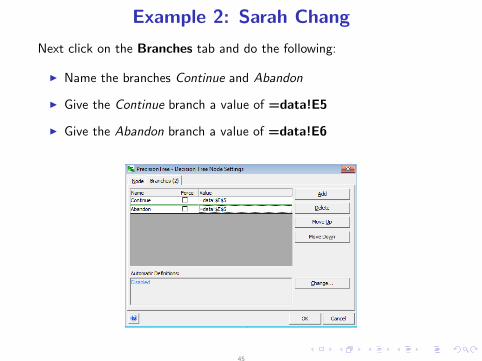
Next click on the Branches tab and do the following:
I Name the branches Continue and Abandon
I Give the Continue branch a value of =data!E5
I Give the Abandon branch a value of =data!E6
45
Example 2: Sarah Chang
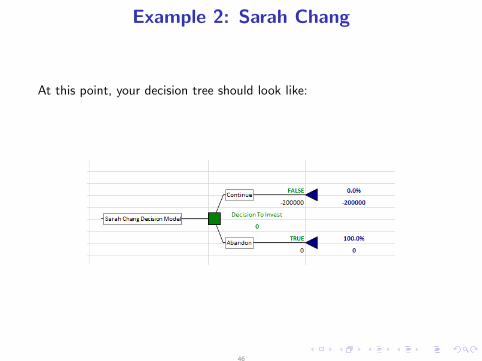
At this point, your decision tree should look like:
46
Example 2: Sarah Chang
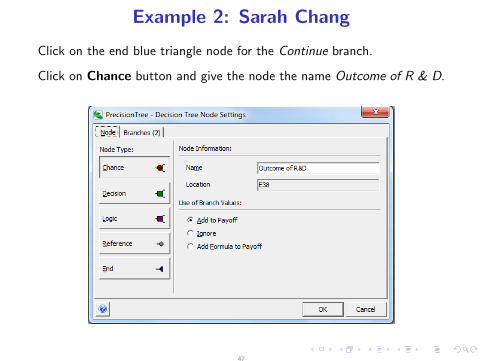
Click on the end blue triangle node for the Continue branch.
Click on Chance button and give the node the name Outcome of R & D.
47
Example 2: Sarah Chang
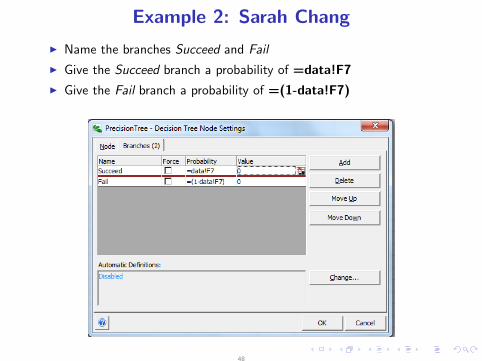
I Name the branches Succeed and Fail
I Give the Succeed branch a probability of =data!F7
I Give the Fail branch a probability of =(1-data!F7)
48
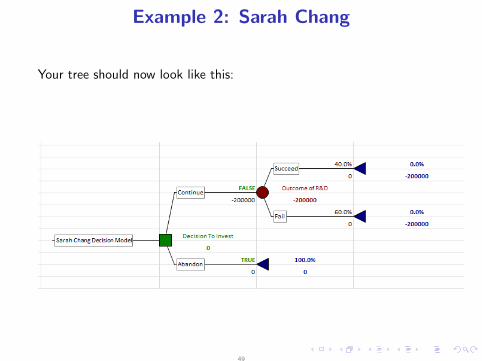
Example 2: Sarah Chang
Your tree should now look like this:
49
Example 2: Sarah Chang
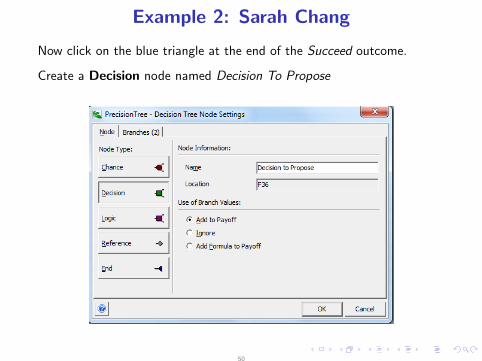
Now click on the blue triangle at the end of the Succeed outcome.
Create a Decision node named Decision To Propose
50
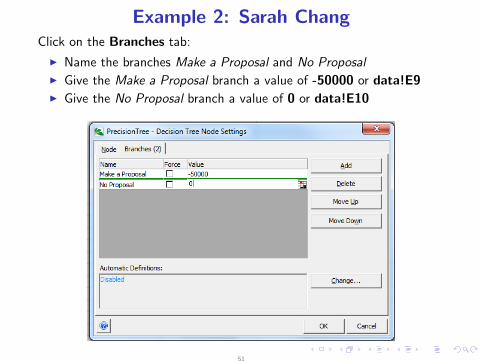
Example 2: Sarah ChangClick on the Branches tab:
I Name the branches Make a Proposal and No ProposalI Give the Make a Proposal branch a value of -50000 or data!E9I Give the No Proposal branch a value of 0 or data!E10
51
Example 2: Sarah Chang
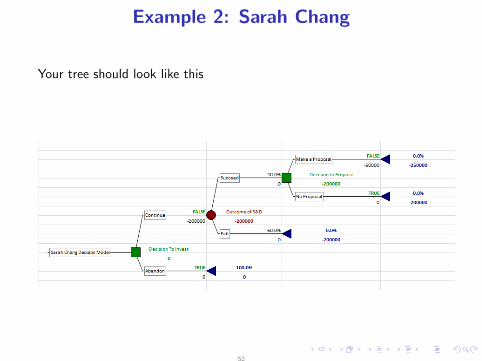
Your tree should look like this
52
Example 2: Sarah Chang
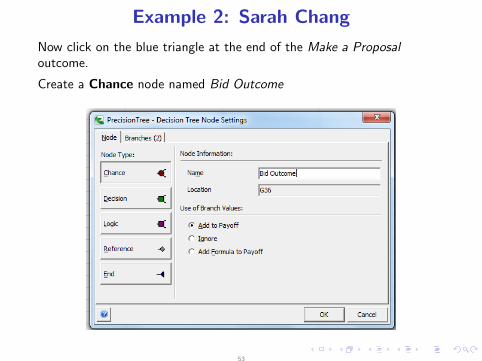
Now click on the blue triangle at the end of the Make a Proposaloutcome.
Create a Chance node named Bid Outcome
53
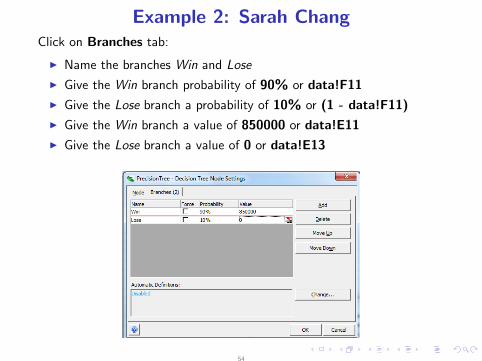
Example 2: Sarah ChangClick on Branches tab:
I Name the branches Win and Lose
I Give the Win branch probability of 90% or data!F11
I Give the Lose branch a probability of 10% or (1 - data!F11)
I Give the Win branch a value of 850000 or data!E11
I Give the Lose branch a value of 0 or data!E13
54
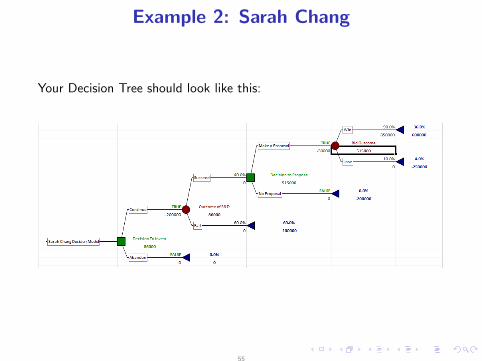
Example 2: Sarah Chang
Your Decision Tree should look like this:
55
Example 2: Sarah Chang
Wow that was a lot of work!
Sarah may wish to submit a Proposal even if the R&D failed.
Consider the blue triangle termination node at the end of the fail branchof the Outcome of R&D chance node.
The structure of the decision and outcome nodes at the end of the failbranch are identical to those at the end of the succeed node.
However, the probabilities and values differ.
Do a copy and paste!
56
Example 2: Sarah Chang
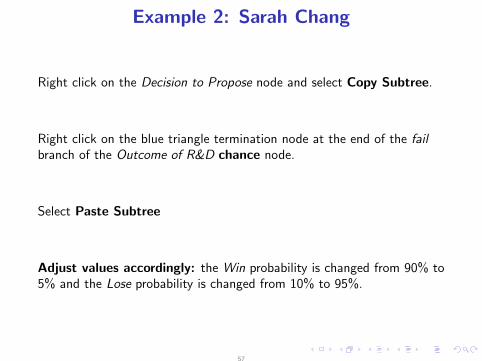
Right click on the Decision to Propose node and select Copy Subtree.
Right click on the blue triangle termination node at the end of the failbranch of the Outcome of R&D chance node.
Select Paste Subtree
Adjust values accordingly: the Win probability is changed from 90% to5% and the Lose probability is changed from 10% to 95%.
57
Example 2: Sarah Chang
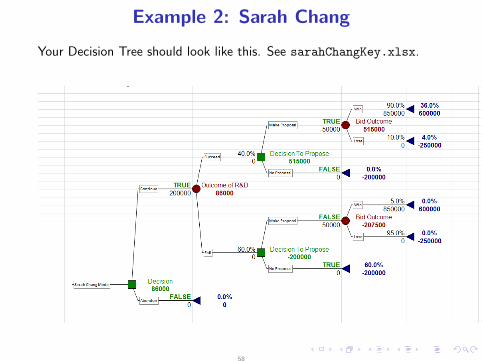
Your Decision Tree should look like this. See sarahChangKey.xlsx.
58
Example 2: Sarah Chang
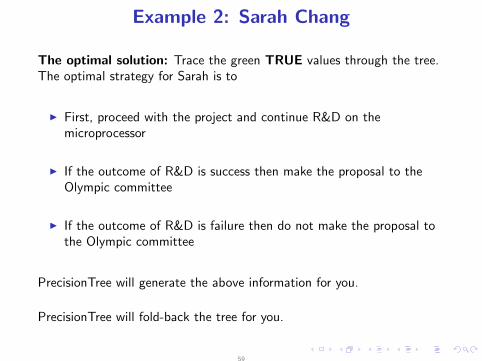
The optimal solution: Trace the green TRUE values through the tree.The optimal strategy for Sarah is to
I First, proceed with the project and continue R&D on themicroprocessor
I If the outcome of R&D is success then make the proposal to theOlympic committee
I If the outcome of R&D is failure then do not make the proposal tothe Olympic committee
PrecisionTree will generate the above information for you.
PrecisionTree will fold-back the tree for you.
59
Example 2: Sarah Chang
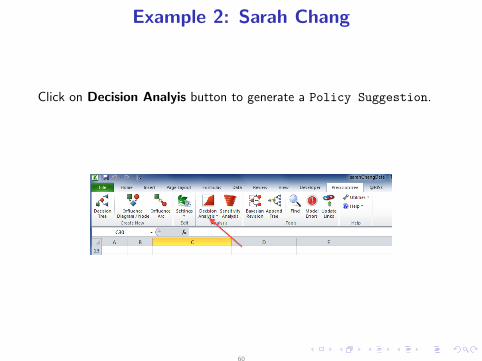
Click on Decision Analyis button to generate a Policy Suggestion.
60
Example 2: Sarah Chang
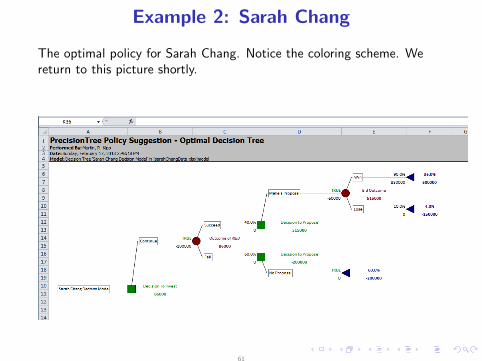
The optimal policy for Sarah Chang. Notice the coloring scheme. Wereturn to this picture shortly.
61
Example 2: Sarah Chang
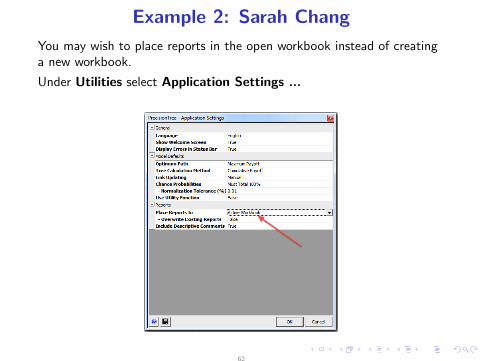
You may wish to place reports in the open workbook instead of creatinga new workbook.
Under Utilities select Application Settings ...
62
Optimal Value
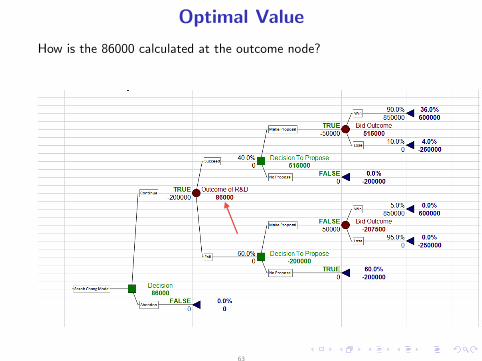
How is the 86000 calculated at the outcome node?
63
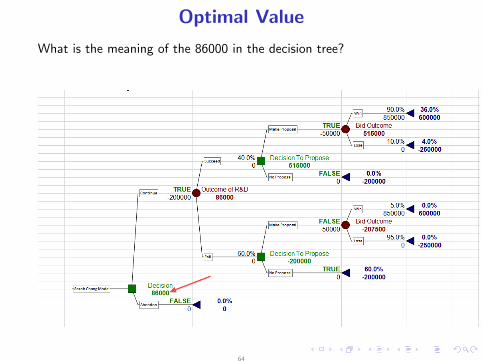
Optimal Value
What is the meaning of the 86000 in the decision tree?
64
Optimal Value
You should understand:
I How the numbers at each decision node are calculated (and whatthey mean)
I How the numbers at the outcome nodes are calculated
I How the numbers at the terminal nodes are calculated
65
Optimal Value
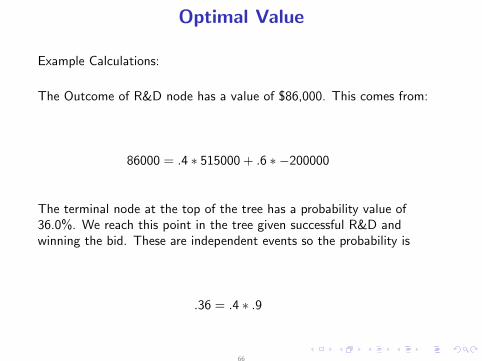
Example Calculations:
The Outcome of R&D node has a value of $86,000. This comes from:
86000 = .4 ∗ 515000 + .6 ∗ −200000
The terminal node at the top of the tree has a probability value of36.0%. We reach this point in the tree given successful R&D andwinning the bid. These are independent events so the probability is
.36 = .4 ∗ .9
66
Optimal Value
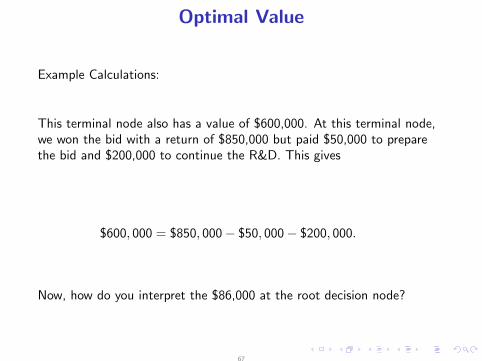
Example Calculations:
This terminal node also has a value of $600,000. At this terminal node,we won the bid with a return of $850,000 but paid $50,000 to preparethe bid and $200,000 to continue the R&D. This gives
$600, 000 = $850, 000 − $50, 000 − $200, 000.
Now, how do you interpret the $86,000 at the root decision node?
67
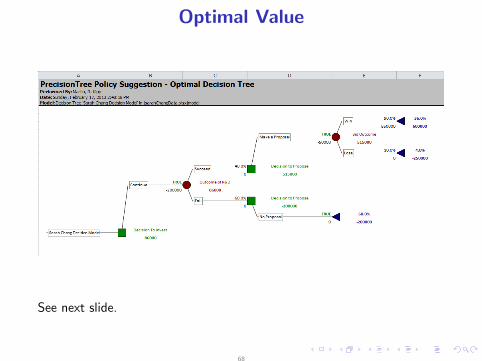
Optimal Value
See next slide.
68
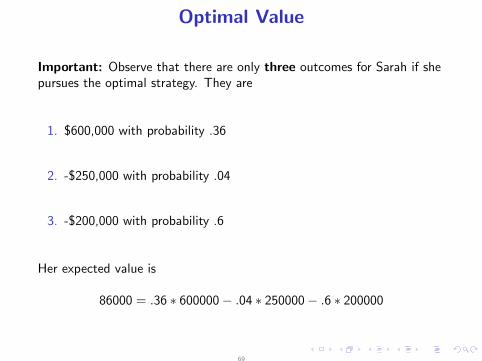
Optimal Value
Important: Observe that there are only three outcomes for Sarah if shepursues the optimal strategy. They are
1. $600,000 with probability .36
2. -$250,000 with probability .04
3. -$200,000 with probability .6
Her expected value is
86000 = .36 ∗ 600000 − .04 ∗ 250000 − .6 ∗ 200000
69
Expected Monetary Value
We maximize expected monetary value. What if we have a one-timedecision?
Che-Lin example of drug company where they are repeating the processmany times.
Expected value does have meaning here.
70
Some Tips
I Separate the model from the data
I Separate the model from the data – you get the idea
I Make use of copy and paste – but be careful of cell references
I Make sure probabilities sum to 1.0
I Do not play with the formulas generated by PrecsionTree (blue, red,green)
I You should only edit through the user interface
71
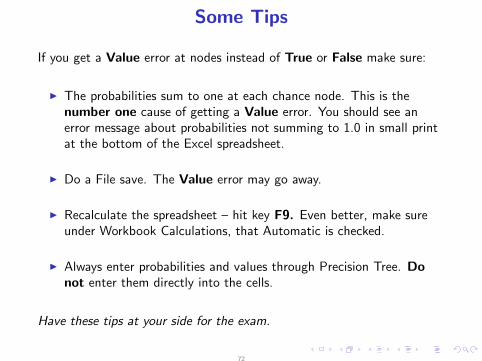
Some Tips
If you get a Value error at nodes instead of True or False make sure:
I The probabilities sum to one at each chance node. This is thenumber one cause of getting a Value error. You should see anerror message about probabilities not summing to 1.0 in small printat the bottom of the Excel spreadsheet.
I Do a File save. The Value error may go away.
I Recalculate the spreadsheet – hit key F9. Even better, make sureunder Workbook Calculations, that Automatic is checked.
I Always enter probabilities and values through Precision Tree. Donot enter them directly into the cells.
Have these tips at your side for the exam.
72
Some Tips
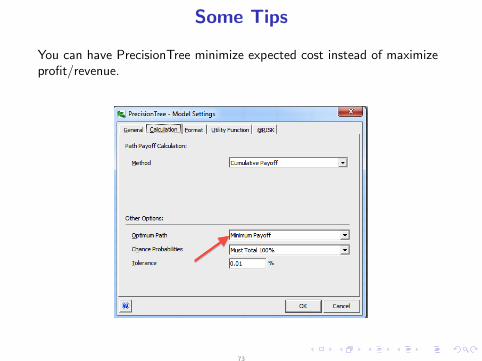
You can have PrecisionTree minimize expected cost instead of maximizeprofit/revenue.
73
Some Tips
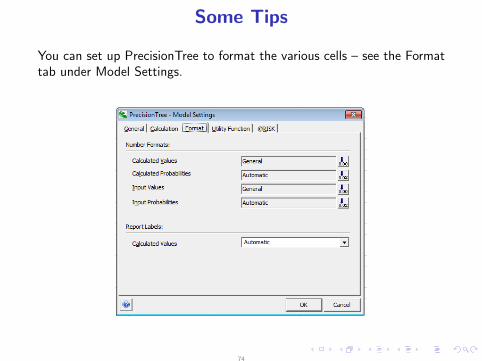
You can set up PrecisionTree to format the various cells – see the Formattab under Model Settings.
74
Sensitivity Analysis
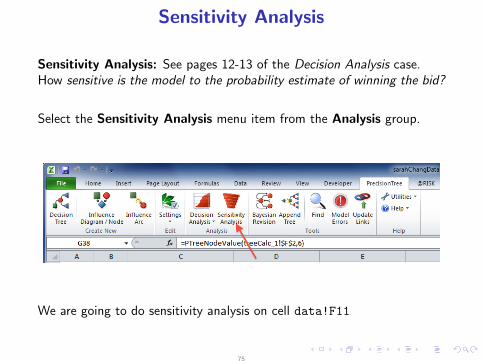
Sensitivity Analysis: See pages 12-13 of the Decision Analysis case.How sensitive is the model to the probability estimate of winning the bid?
Select the Sensitivity Analysis menu item from the Analysis group.
We are going to do sensitivity analysis on cell data!F11
75
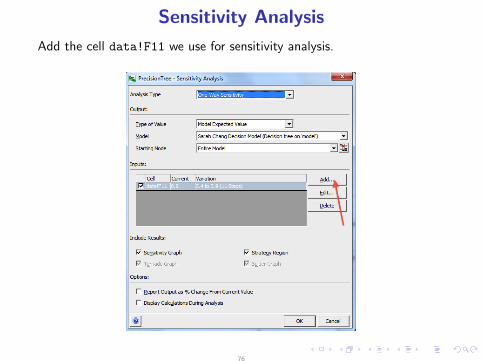
Sensitivity Analysis
Add the cell data!F11 we use for sensitivity analysis.
76
Sensitivity Analysis
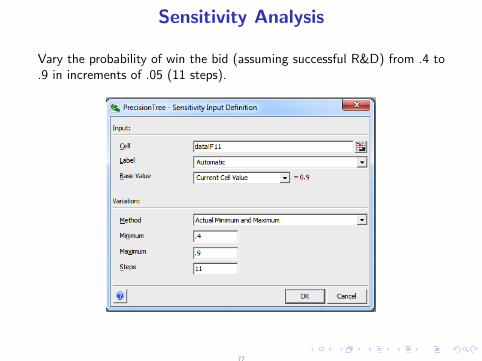
Vary the probability of win the bid (assuming successful R&D) from .4 to.9 in increments of .05 (11 steps).
77
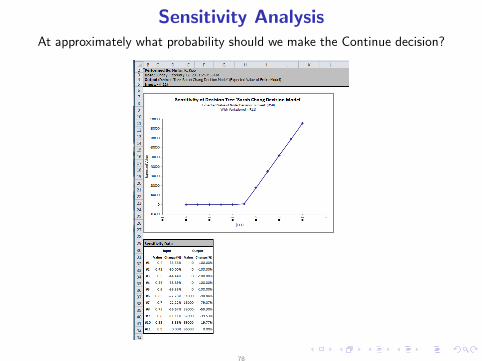
Sensitivity AnalysisAt approximately what probability should we make the Continue decision?
78
Sensitivity Analysis
79
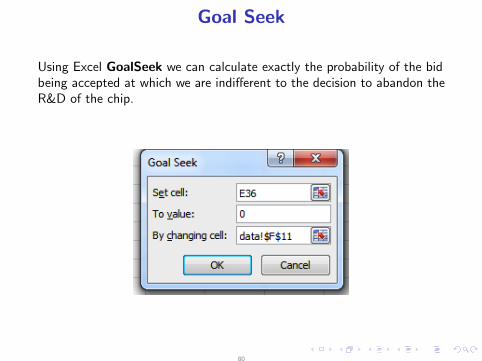
Goal Seek
Using Excel GoalSeek we can calculate exactly the probability of the bidbeing accepted at which we are indifferent to the decision to abandon theR&D of the chip.
80
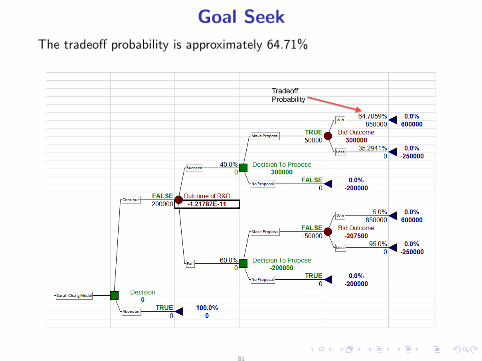
Goal Seek
The tradeoff probability is approximately 64.71%
81
Goal Seek
What is the expected value of the continue decision?
What is the expected value of the abandon decision?
Which do you prefer?
82
Goal Seek
Oil Drilling Example (practice midterm) – the optimal decision is to nothire the geologist. How much would the report have to cost in order tobe indifferent between a hire and no hire decision?
Perhaps the kind of question that would appear on the final.
83
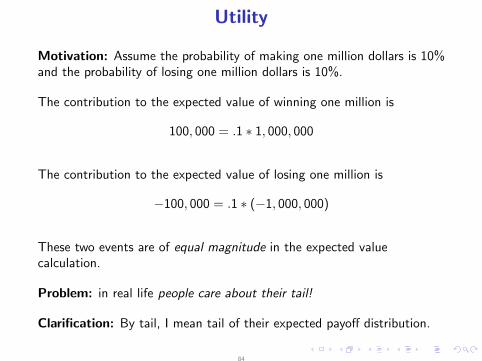
Utility
Motivation: Assume the probability of making one million dollars is 10%and the probability of losing one million dollars is 10%.
The contribution to the expected value of winning one million is
100, 000 = .1 ∗ 1, 000, 000
The contribution to the expected value of losing one million is
−100, 000 = .1 ∗ (−1, 000, 000)
These two events are of equal magnitude in the expected valuecalculation.
Problem: in real life people care about their tail!
Clarification: By tail, I mean tail of their expected payoff distribution.
84
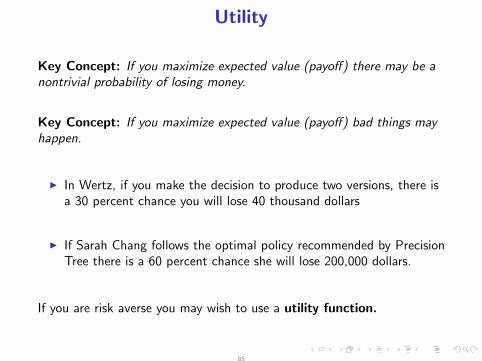
Utility
Key Concept: If you maximize expected value (payoff) there may be anontrivial probability of losing money.
Key Concept: If you maximize expected value (payoff) bad things mayhappen.
I In Wertz, if you make the decision to produce two versions, there isa 30 percent chance you will lose 40 thousand dollars
I If Sarah Chang follows the optimal policy recommended by PrecisionTree there is a 60 percent chance she will lose 200,000 dollars.
If you are risk averse you may wish to use a utility function.
85
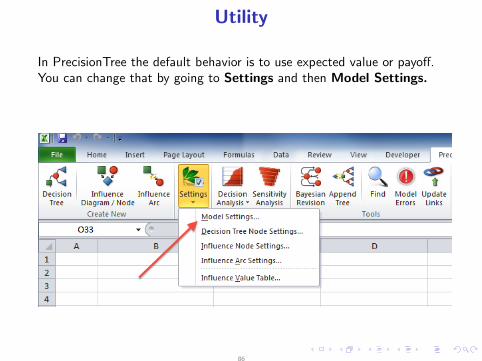
Utility
In PrecisionTree the default behavior is to use expected value or payoff.You can change that by going to Settings and then Model Settings.
86
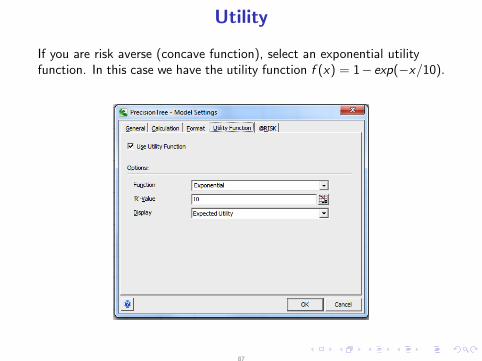
Utility
If you are risk averse (concave function), select an exponential utilityfunction. In this case we have the utility function f (x) = 1− exp(−x/10).
87
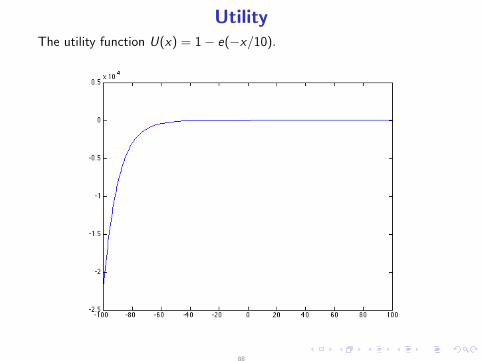
UtilityThe utility function U(x) = 1 − e(−x/10).
88
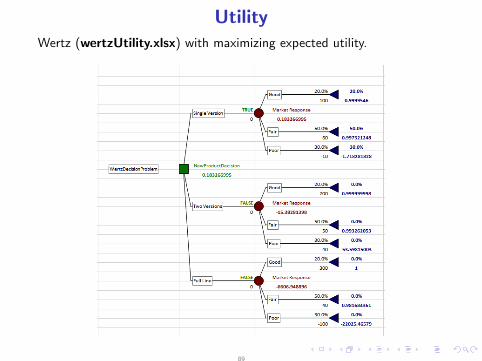
UtilityWertz (wertzUtility.xlsx) with maximizing expected utility.
89
Utility
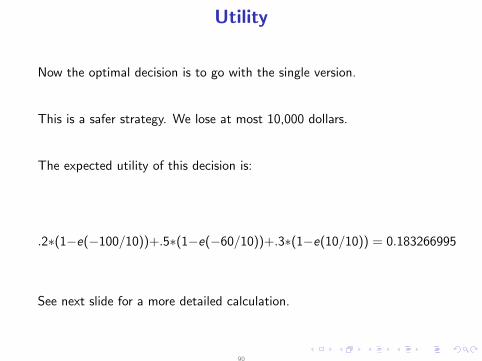
Now the optimal decision is to go with the single version.
This is a safer strategy. We lose at most 10,000 dollars.
The expected utility of this decision is:
.2∗(1−e(−100/10))+.5∗(1−e(−60/10))+.3∗(1−e(10/10)) = 0.183266995
See next slide for a more detailed calculation.
90
Utility
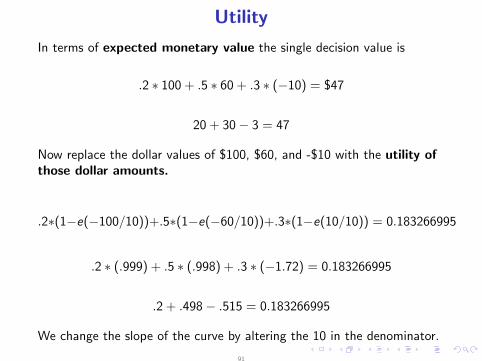
In terms of expected monetary value the single decision value is
.2 ∗ 100 + .5 ∗ 60 + .3 ∗ (−10) = $47
20 + 30 − 3 = 47
Now replace the dollar values of $100, $60, and -$10 with the utility ofthose dollar amounts.
.2∗(1−e(−100/10))+.5∗(1−e(−60/10))+.3∗(1−e(10/10)) = 0.183266995
.2 ∗ (.999) + .5 ∗ (.998) + .3 ∗ (−1.72) = 0.183266995
.2 + .498 − .515 = 0.183266995
We change the slope of the curve by altering the 10 in the denominator.
91
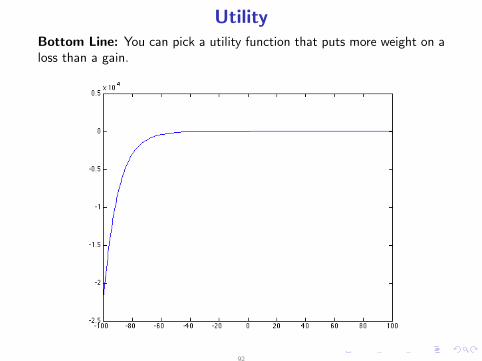
UtilityBottom Line: You can pick a utility function that puts more weight on aloss than a gain.
92
Utility
When applying this material in the public sector it may be difficult tomeasure the value of outcomes even when probabilities are reasonablyestimated.
Consider “black swan” events.
Blizzards are good examples.
93