Embed Size (px)
Citation preview

S T A T E O F N E W Y O R K C I T Y ’ S H O U S I N G & N E I G H B O R H O O D S 2 0 1 0 9
mU
lTI-FAm
IlY R
ENTA
l HO
US
ING
New York City’s multi-family Rental Housing and the market Downturn
In recent years, news stories nationwide have given substantial attention to the difficulties single-family homeowners have faced amid the housing market downturn. New York City has many homeowners who have experienced such difficulties, as we reported in previous editions of the State of the City.3 But approxi-mately two-thirds of city residents rent their homes, and increasing numbers of those tenants are being affected by the housing downturn. Many tenants living in 2–4 unit properties suffered displacement and dis-ruption when the owners of those properties defaulted on their mortgages, as the Furman Center highlighted in several previous reports.4
1 For the purposes of this chapter, the term “multi-family rental properties” includes only privately owned rental properties with five or more units. HUD also uses this unit cut-off when defining multi-family properties. This segment of the housing market differs from smaller rental properties because a larger share of units in multi-family rental properties are subject to rent regulation (which applies primarily to properties with six or more units) and because it has a distinct form of financing. In addition, the secondary financing markets typically group 2–4 unit properties with single-family properties. We also exclude public housing, cooperative apartments, and condominiums. Although a substantial share of New Yorkers live in public housing properties with five or more units, public housing properties face very different issues than privately owned multi-family rental properties. Cooperative and condominium properties are also subject to unique dynamics related to their ownership structures. These properties are also primarily owner-occupied. While a number of cooperative and condominium units may be renter-occupied, we cannot identify these units and therefore exclude them in our analysis of multi-family rental properties.
Although we exclude public housing units from our analysis, the units analyzed in this chapter do include subsidized, privately owned units, which constitute 11 percent of the multi-family rental units in the city and 22 percent of the units in multi-family rental properties with 100 or more units. These subsidized units—which include those financed with HUD Insurance, HUD Project-based Rental Assistance, the Mitchell-Lama program, or Low Income Housing Tax Credits—are part of the Furman Center’s Subsidized Housing Information Project (SHIP) database, which is discussed on page 145.
2 This percentage is drawn from the New York City Department of Finance Real Property Assessment Database (RPAD), which provides property-specific data.
3 Armstrong (2009); Armstrong (2010).
4 Armstrong et al. (2008); Armstrong et al. (2010).
The housing downturn extends to larger proper-ties, as well. Renters in multi-family rental buildings experience uncertainty or deteriorating living condi-tions when the property they inhabit faces foreclosure. In order to better understand the market downturn’s effects on New York City’s multi-family rental proper-ties and their residents, this year’s chapter provides a comprehensive portrait of these properties and the stresses they face.
Our analysis reveals that the market downturn has affected different sizes of multi-family rental properties in distinct ways. Over the entire period for which we have data, multi-family rental properties with five to nineteen units consistently received fore-closure notices at a higher rate than other multi-family rental properties. Although the rate of foreclosure notices filed on very large multi-family rental proper-ties (with 100 or more units) remains lower than the rate for smaller properties, these larger properties saw dramatic increases in the rate of foreclosure notices during the past five years when compared to the period of 2000 through 2005.5 This increase has been particu-larly dramatic in Manhattan. These properties also saw the sharpest drop in prices during the period of 2006 through 2009. Although the causes of foreclosure for any individual building are likely complex, the chap-ter discusses the characteristics of different types of multi-family rental properties and explores how these factors might shape the market downturn’s effects on these properties.
5 Our analysis of multi-family rental properties is not skewed by the Stuyvesant Town and Peter Cooper Village default. Although that complex contains 11,298 units, it is made up of two legal properties and represents only two of the 136 Manhattan defaults in 2010 in our data.
Privately owned, multi-family rental properties with five or more units (“multi-family rental properties”) represent the largest share of New York City’s housing stock.1 New York City contains approximately 55,000 such multi- family rental properties, with over 1.3 million units. Approximately 40 percent of all residential units in the city and 43 percent of all privately owned units are
located in multi-family rental properties.2 New York is unique among U.S. cities in the estimated number and share of residents who live in multi-family rental properties.

10 T H E F U R M A N C E N T E R F O R R E A L E S T A T E & U R B A N P O L I C Y
The first part of this chapter describes New York City’s multi-family rental properties and discusses what we know about the tenants who live in these properties. We then review the historic development of multi-fam-ily rental properties in the city and explain how this his-tory affected the size, location, and other characteristics of these properties. The analysis in this section reveals, for example, that New York City’s smaller multi-family rental properties are typically older and more likely to be subject to rent regulation than are multi-family rental properties with 100 or more units.
In the second part of the chapter, our analysis turns to the current state of New York City’s multi-family rental properties. The sales prices of multi-family rental properties declined 29 percent between 2007 and 2010, and the number of multi-family rental properties sold in 2010 was only one-third the number sold in 2005. Larger multi-family rental properties saw more dramatic price declines than have smaller multi-family rental proper-ties. Signs of financial distress among multi-family rental properties increased in the past few years. Between 2006 and 2010, the annual rate of foreclosures among multi-family rental properties was 50 percent higher than the rate between 2000 and 2005. Lower income neighbor-hoods in Brooklyn have faced particularly high rates of foreclosure notices on multi-family rental properties. Properties that received a notice of foreclosure in the last 10 years had 15 percent more housing code violations during the six months before and six months after the quarter in which they received the foreclosure notice comapared to other quarters, indicating a possible con-nection between financial hardship and physical distress.
The financial difficulties of large multi-family properties, such as Stuyvesant Town and Peter Cooper Village in Manhattan and the portfolio of buildings owned by Ocelot Capital Group in the Bronx, have received considerable attention in recent years. The popular press has repeatedly told stories of large and expensive properties bought at high prices by specula-tive investors with unrealistic expectations of future rental income. Although this account may accurately depict the predicament faced by some multi-family rental properties, it fails to adequately capture the mar-ket downturn’s broad impacts on New York City’s varied stock of multi-family rental properties. This year’s
chapter seeks to remedy that gap and provide a more complete and nuanced understanding of how the different types of properties in this vital segment of New York City’s housing stock fared in recent years.
multi-Family Rental Properties Are a Defining Feature of New York City Housing Multi-family rental properties constitute a critical component of New York City’s housing stock. These properties account for a larger share of New York’s residential units than any of the city’s other housing types, which include single family homes, 2–4 unit buildings, condominiums, cooperative apartments, and public housing. Forty percent of all residential units (both rental and owner-occupied) are in multi-family rental properties.6
multi-Family Rental Households Differ From New York City’s General Population Households living in multi-family rental properties have lower incomes than other New York City households. Citywide, the median income for these households in 2008 was $36,980, compared with $52,099 for house-holds living in other housing types and $45,970 for all households.7 This difference is found across all five bor-oughs. Households residing in multi-family rental prop-erties are slightly smaller and younger than other New York City households, with a mean size of 2.1 people and median head of household age of 44, compared with 2.4 people and 46 years old for all households citywide.
Hispanic households are more likely than other households to live in multi-family rental properties. Fifty percent of New York City’s Hispanic households live in multi-family rental properties, compared with 37 percent of non-Hispanic black households, 36 percent of non-Hispanic white households, and only 31 percent of Asian households. Although only
6 In comparison, 10 percent of residential units in the city are found in single-family homes, 25 percent of units are in 2–4 unit properties, five percent are in condominiums, 14 percent are in cooperative apartments, and six percent are in public housing properties. These percentages include both rental and owner-occupied units in each of the building classes.
7 Median income figures are taken from the Housing Vacancy Survey (2008) because multi-family rental households can be identified in this dataset. The American Community Survey, which is used to report median income in the City and Borough pages, reports somewhat higher incomes for the population at large.
S T A T E O F N E W Y O R K C I T Y ’ S H O U S I N G & N E I G H B O R H O O D S 2 0 1 0 11
mU
lTI-FAm
IlY R
ENTA
l HO
US
ING
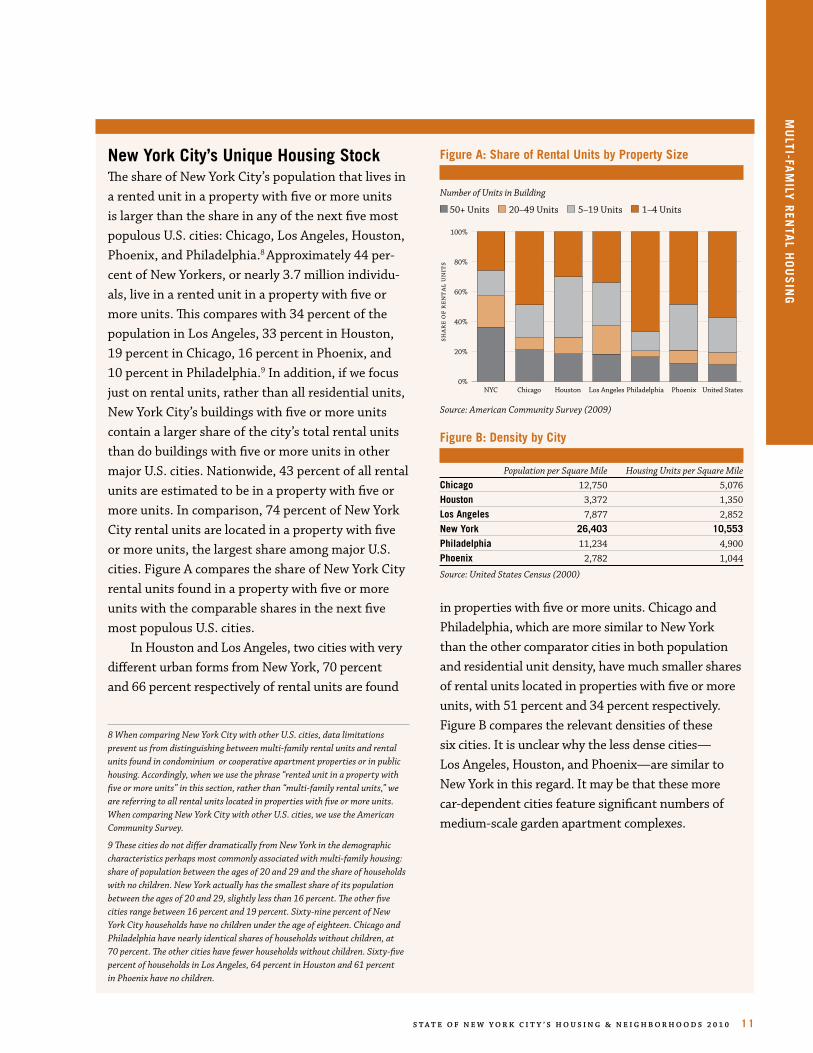
New York City’s Unique Housing StockThe share of New York City’s population that lives in a rented unit in a property with five or more units is larger than the share in any of the next five most populous U.S. cities: Chicago, Los Angeles, Houston, Phoenix, and Philadelphia.8 Approximately 44 per-cent of New Yorkers, or nearly 3.7 million individu-als, live in a rented unit in a property with five or more units. This compares with 34 percent of the population in Los Angeles, 33 percent in Houston, 19 percent in Chicago, 16 percent in Phoenix, and 10 percent in Philadelphia.9 In addition, if we focus just on rental units, rather than all residential units, New York City’s buildings with five or more units contain a larger share of the city’s total rental units than do buildings with five or more units in other major U.S. cities. Nationwide, 43 percent of all rental units are estimated to be in a property with five or more units. In comparison, 74 percent of New York City rental units are located in a property with five or more units, the largest share among major U.S. cities. Figure A compares the share of New York City rental units found in a property with five or more units with the comparable shares in the next five most populous U.S. cities.
In Houston and Los Angeles, two cities with very different urban forms from New York, 70 percent and 66 percent respectively of rental units are found
8 When comparing New York City with other U.S. cities, data limitations prevent us from distinguishing between multi-family rental units and rental units found in condominium or cooperative apartment properties or in public housing. Accordingly, when we use the phrase “rented unit in a property with five or more units” in this section, rather than “multi-family rental units,” we are referring to all rental units located in properties with five or more units. When comparing New York City with other U.S. cities, we use the American Community Survey.
9 These cities do not differ dramatically from New York in the demographic characteristics perhaps most commonly associated with multi-family housing: share of population between the ages of 20 and 29 and the share of households with no children. New York actually has the smallest share of its population between the ages of 20 and 29, slightly less than 16 percent. The other five cities range between 16 percent and 19 percent. Sixty-nine percent of New York City households have no children under the age of eighteen. Chicago and Philadelphia have nearly identical shares of households without children, at 70 percent. The other cities have fewer households without children. Sixty-five percent of households in Los Angeles, 64 percent in Houston and 61 percent in Phoenix have no children.
in properties with five or more units. Chicago and Philadelphia, which are more similar to New York than the other comparator cities in both population and residential unit density, have much smaller shares of rental units located in properties with five or more units, with 51 percent and 34 percent respectively. Figure B compares the relevant densities of these six cities. It is unclear why the less dense cities—Los Angeles, Houston, and Phoenix—are similar to New York in this regard. It may be that these more car-dependent cities feature significant numbers of medium-scale garden apartment complexes.
Figure B: Density by City
Population per Square Mile Housing Units per Square MileChicago 12,750 5,076Houston 3,372 1,350los Angeles 7,877 2,852New York 26,403 10,553Philadelphia 11,234 4,900Phoenix 2,782 1,044
Source: United States Census (2000)
Figure A: Share of Rental Units by Property Size
0%
20%
40%
60%
80%
100%
NYC Chicago Houston Los Angeles Philadelphia Phoenix
shar
e o
f re
nta
l u
nit
s
United States0
20
40
60
80
100
120Number of Units in Building
50+ Units 20–49 Units 5–19 Units 1–4 Units
Source: American Community Survey (2009)
12 T H E F U R M A N C E N T E R F O R R E A L E S T A T E & U R B A N P O L I C Y
23 percent of all New York households are Hispanic, 29 percent of households who live in multi-family rental properties are Hispanic.
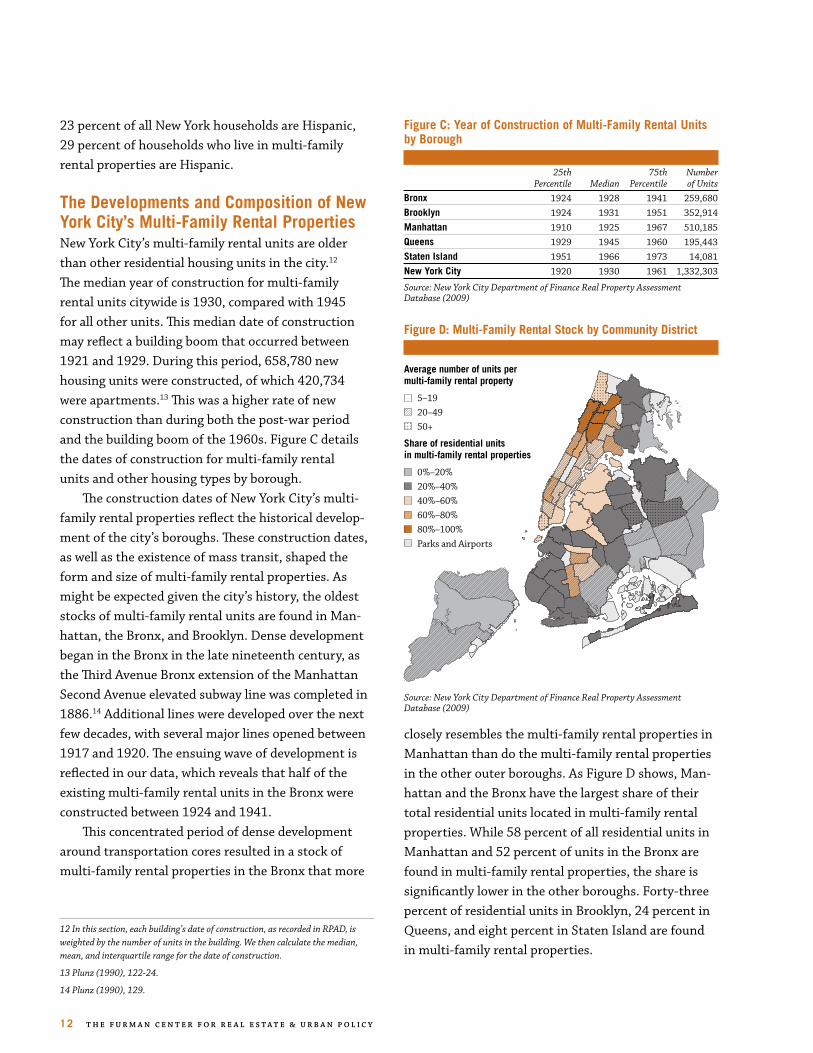
The Developments and Composition of New York City’s multi-Family Rental PropertiesNew York City’s multi-family rental units are older than other residential housing units in the city.12 The median year of construction for multi-family rental units citywide is 1930, compared with 1945 for all other units. This median date of construction may reflect a building boom that occurred between 1921 and 1929. During this period, 658,780 new housing units were constructed, of which 420,734 were apartments.13 This was a higher rate of new construction than during both the post-war period and the building boom of the 1960s. Figure C details the dates of construction for multi-family rental units and other housing types by borough.
The construction dates of New York City’s multi-family rental properties reflect the historical develop-ment of the city’s boroughs. These construction dates, as well as the existence of mass transit, shaped the form and size of multi-family rental properties. As might be expected given the city’s history, the oldest stocks of multi-family rental units are found in Man-hattan, the Bronx, and Brooklyn. Dense development began in the Bronx in the late nineteenth century, as the Third Avenue Bronx extension of the Manhattan Second Avenue elevated subway line was completed in 1886.14 Additional lines were developed over the next few decades, with several major lines opened between 1917 and 1920. The ensuing wave of development is reflected in our data, which reveals that half of the existing multi-family rental units in the Bronx were constructed between 1924 and 1941.
This concentrated period of dense development around transportation cores resulted in a stock of multi-family rental properties in the Bronx that more
12 In this section, each building’s date of construction, as recorded in RPAD, is weighted by the number of units in the building. We then calculate the median, mean, and interquartile range for the date of construction.
13 Plunz (1990), 122-24.
14 Plunz (1990), 129.
closely resembles the multi-family rental properties in Manhattan than do the multi-family rental properties in the other outer boroughs. As Figure D shows, Man-hattan and the Bronx have the largest share of their total residential units located in multi-family rental properties. While 58 percent of all residential units in Manhattan and 52 percent of units in the Bronx are found in multi-family rental properties, the share is significantly lower in the other boroughs. Forty-three percent of residential units in Brooklyn, 24 percent in Queens, and eight percent in Staten Island are found in multi-family rental properties.
Figure C: Year of Construction of multi-Family Rental Units by Borough
25th 75th Number Percentile Median Percentile of Units
Bronx 1924 1928 1941 259,680Brooklyn 1924 1931 1951 352,914manhattan 1910 1925 1967 510,185queens 1929 1945 1960 195,443Staten Island 1951 1966 1973 14,081New York City 1920 1930 1961 1,332,303
Source: New York City Department of Finance Real Property Assessment Database (2009)
Figure D: multi-Family Rental Stock by Community District
• • • • • • • • • •• • • • • • • • • •• • • • • • • • • •• • • • • • • • • •• • • • • • • • • •• • • • • • • • • •• • • • • • • • • •• • • • • • • • • •• • • • • • • • • •• • • • • • • • • •• • • • • • • • • •• • • • • • • • • •
• • • • • • • •• • • • • • • •• • • • • • • •• • • • • • • •• • • • • • • •• • • • • • • •• • • • • • • •• • • • • • • •• • • • • • • •• • • • • • • •• • • • • • • •• • • • • • • •• • • • • • • •
• • • • • • • •• • • • • • • •• • • • • • • •• • • • • • • •• • • • • • • •• • • • • • • •• • • • • • • •• • • • • • • •• • • • • • • •• • • • • • • •• • • • • • • •• • • • • • • •• • • • • • • •
• • • • • • • • • • •• • • • • • • • • • •• • • • • • • • • • •• • • • • • • • • • •• • • • • • • • • • •• • • • • • • • • • •• • • • • • • • • • •• • • • • • • • • • •• • • • • • • • • • •• • • • • • • • • • •• • • • • • • • • • •
• • • • • • • • • • • • • • • • •• • • • • • • • • • • • • • • • •• • • • • • • • • • • • • • • • •• • • • • • • • • • • • • • • • •• • • • • • • • • • • • • • • • •• • • • • • • • • • • • • • • • •• • • • • • • • • • • • • • • • •• • • • • • • • • • • • • • • • •• • • • • • • • • • • • • • • • •• • • • • • • • • • • • • • • • •• • • • • • • • • • • • • • • • •
•
Average number of units per multi-family rental property
5–19 20–49 50+
Share of residential units in multi-family rental properties
0%–20% 20%–40% 40%–60% 60%–80% 80%–100% Parks and Airports• • • • • • • • • •
• • • • • • • • • •• • • • • • • • • •• • • • • • • • • •• • • • • • • • • •• • • • • • • • • •• • • • • • • • • •• • • • • • • • • •• • • • • • • • • •• • • • • • • • • •• • • • • • • • • •• • • • • • • • • •
• • • • • • • •• • • • • • • •• • • • • • • •• • • • • • • •• • • • • • • •• • • • • • • •• • • • • • • •• • • • • • • •• • • • • • • •• • • • • • • •• • • • • • • •• • • • • • • •• • • • • • • •
• • • • • • • •• • • • • • • •• • • • • • • •• • • • • • • •• • • • • • • •• • • • • • • •• • • • • • • •• • • • • • • •• • • • • • • •• • • • • • • •• • • • • • • •• • • • • • • •• • • • • • • •
• • • • • • • • • • •• • • • • • • • • • •• • • • • • • • • • •• • • • • • • • • • •• • • • • • • • • • •• • • • • • • • • • •• • • • • • • • • • •• • • • • • • • • • •• • • • • • • • • • •• • • • • • • • • • •• • • • • • • • • • •
• • • • • • • • • • • • • • • • •• • • • • • • • • • • • • • • • •• • • • • • • • • • • • • • • • •• • • • • • • • • • • • • • • • •• • • • • • • • • • • • • • • • •• • • • • • • • • • • • • • • • •• • • • • • • • • • • • • • • • •• • • • • • • • • • • • • • • • •• • • • • • • • • • • • • • • • •• • • • • • • • • • • • • • • • •• • • • • • • • • • • • • • • • •
•
• • • • • • • • • •• • • • • • • • • •• • • • • • • • • •• • • • • • • • • •• • • • • • • • • •• • • • • • • • • •• • • • • • • • • •• • • • • • • • • •• • • • • • • • • •• • • • • • • • • •• • • • • • • • • •• • • • • • • • • •
• • • • • • • •• • • • • • • •• • • • • • • •• • • • • • • •• • • • • • • •• • • • • • • •• • • • • • • •• • • • • • • •• • • • • • • •• • • • • • • •• • • • • • • •• • • • • • • •• • • • • • • •
• • • • • • • •• • • • • • • •• • • • • • • •• • • • • • • •• • • • • • • •• • • • • • • •• • • • • • • •• • • • • • • •• • • • • • • •• • • • • • • •• • • • • • • •• • • • • • • •• • • • • • • •
• • • • • • • • • • •• • • • • • • • • • •• • • • • • • • • • •• • • • • • • • • • •• • • • • • • • • • •• • • • • • • • • • •• • • • • • • • • • •• • • • • • • • • • •• • • • • • • • • • •• • • • • • • • • • •• • • • • • • • • • •
• • • • • • • • • • • • • • • • •• • • • • • • • • • • • • • • • •• • • • • • • • • • • • • • • • •• • • • • • • • • • • • • • • • •• • • • • • • • • • • • • • • • •• • • • • • • • • • • • • • • • •• • • • • • • • • • • • • • • • •• • • • • • • • • • • • • • • • •• • • • • • • • • • • • • • • • •• • • • • • • • • • • • • • • • •• • • • • • • • • • • • • • • • •
•
Source: New York City Department of Finance Real Property Assessment Database (2009)

S T A T E O F N E W Y O R K C I T Y ’ S H O U S I N G & N E I G H B O R H O O D S 2 0 1 0 13
mU
lTI-FAm
IlY R
ENTA
l HO
US
ING
Our Size Classes for multi-Family Rental PropertiesThere is no precise science for dividing multi-family rental properties into size classes based on the number of units in the property. We have divided multi-family rental properties into four groups: 5–19 units, 20–49 units, 50-99 units, and 100+ units. These divisions are similar to the classes used in other studies of multi-family rental properties10 and by the U.S Census Bureau.11
To give readers a brief sense of what a multi-family rental property in each of these class sizes might look like, we offer the following representative examples.
REPRESENTATIvE mUlTI-FAmIlY RENTAl PROPERTY SIzES
10 Herbert (2001) (report for HUD divided properties into groups with 5–19 units, 20–49 units, 50–99 units, 100–249 units, and 250 units and larger); Agpar (2007) (defining smaller multi-family rental properties as those properties with between 5 and 49 units, but further dividing this group into 5–19 unit properties and 20–49 unit properties.). In addition, in the late 1990s the Federal Housing Administration initiated a Small Projects Processing initiative to provide new mortgage processing and underwriting procedures for properties with between 5 and 20 units.
11 The U.S. Census Bureau, in grouping New York City properties for the Housing and Vacancy Survey (HVS), divides multi-family rental properties into groups of 5 units, 6–9 units, 10–12 units, 13–19 units, 20–49 units, 50–99 units, 100–199 units, and 200+ units.
5–19 Units
Units: 10Buildings: 1Floors: 3Year Built: 1915Borough: BrooklynZoning: R6
100+ Units
Units: 106Buildings: 1Floors: 6Year Built: 1931Borough: QueensZoning: R7-1
20–49 Units
Units: 32Buildings: 1Floors: 5Year Built: 1920Borough: BrooklynZoning: R8X
Units: 128Buildings: 2Floors: 6 eachYear Built: 1964Borough: BronxZoning: R6
50–99 Units
Units: 82Buildings: 1Floors: 6Year Built: 1937Borough: BrooklynZoning: R6B
Units: 486Buildings: 1Floors: 35Year Built: 1976Borough: ManhattanZoning: C6-4
14 T H E F U R M A N C E N T E R F O R R E A L E S T A T E & U R B A N P O L I C Y
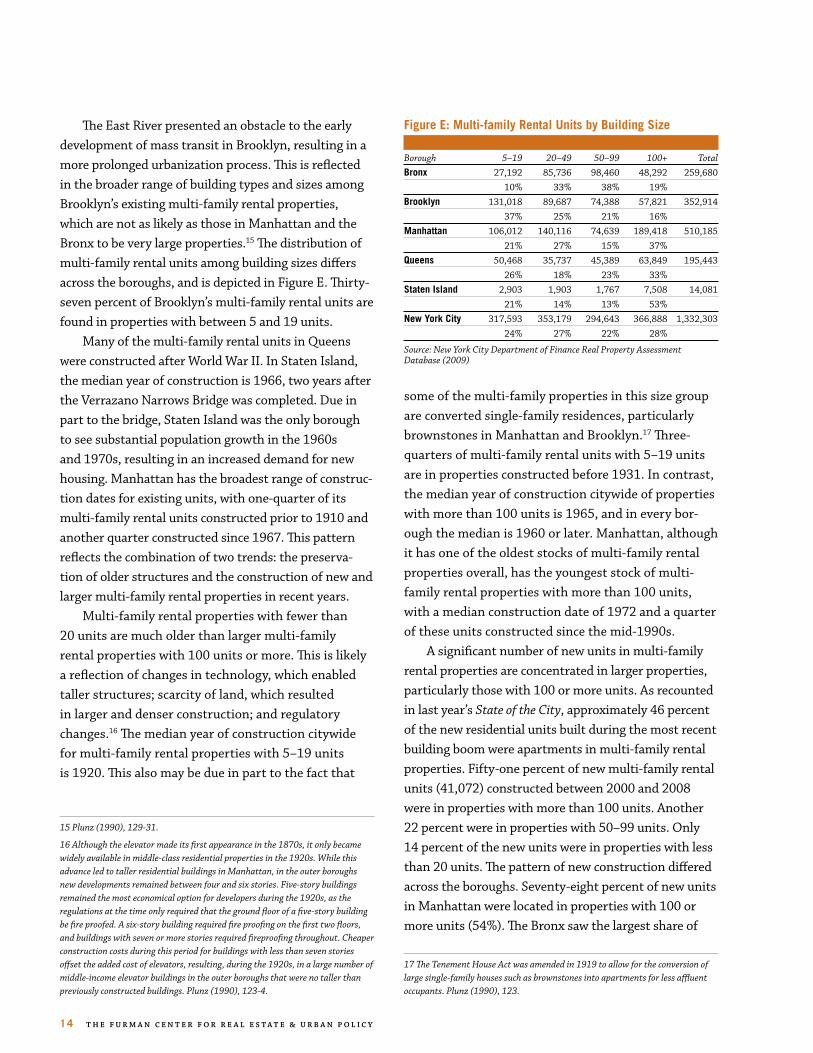
The East River presented an obstacle to the early development of mass transit in Brooklyn, resulting in a more prolonged urbanization process. This is reflected in the broader range of building types and sizes among Brooklyn’s existing multi-family rental properties, which are not as likely as those in Manhattan and the Bronx to be very large properties.15 The distribution of multi-family rental units among building sizes differs across the boroughs, and is depicted in Figure E. Thirty-seven percent of Brooklyn’s multi-family rental units are found in properties with between 5 and 19 units.
Many of the multi-family rental units in Queens were constructed after World War II. In Staten Island, the median year of construction is 1966, two years after the Verrazano Narrows Bridge was completed. Due in part to the bridge, Staten Island was the only borough to see substantial population growth in the 1960s and 1970s, resulting in an increased demand for new housing. Manhattan has the broadest range of construc-tion dates for existing units, with one-quarter of its multi-family rental units constructed prior to 1910 and another quarter constructed since 1967. This pattern reflects the combination of two trends: the preserva-tion of older structures and the construction of new and larger multi-family rental properties in recent years.
Multi-family rental properties with fewer than 20 units are much older than larger multi-family rental properties with 100 units or more. This is likely a reflection of changes in technology, which enabled taller structures; scarcity of land, which resulted in larger and denser construction; and regulatory changes.16 The median year of construction citywide for multi-family rental properties with 5–19 units is 1920. This also may be due in part to the fact that
15 Plunz (1990), 129-31.
16 Although the elevator made its first appearance in the 1870s, it only became widely available in middle-class residential properties in the 1920s. While this advance led to taller residential buildings in Manhattan, in the outer boroughs new developments remained between four and six stories. Five-story buildings remained the most economical option for developers during the 1920s, as the regulations at the time only required that the ground floor of a five-story building be fire proofed. A six-story building required fire proofing on the first two floors, and buildings with seven or more stories required fireproofing throughout. Cheaper construction costs during this period for buildings with less than seven stories offset the added cost of elevators, resulting, during the 1920s, in a large number of middle-income elevator buildings in the outer boroughs that were no taller than previously constructed buildings. Plunz (1990), 123-4.
some of the multi-family properties in this size group are converted single-family residences, particularly brownstones in Manhattan and Brooklyn.17 Three-quarters of multi-family rental units with 5–19 units are in properties constructed before 1931. In contrast, the median year of construction citywide of properties with more than 100 units is 1965, and in every bor-ough the median is 1960 or later. Manhattan, although it has one of the oldest stocks of multi-family rental properties overall, has the youngest stock of multi-family rental properties with more than 100 units, with a median construction date of 1972 and a quarter of these units constructed since the mid-1990s.
A significant number of new units in multi-family rental properties are concentrated in larger properties, particularly those with 100 or more units. As recounted in last year’s State of the City, approximately 46 percent of the new residential units built during the most recent building boom were apartments in multi-family rental properties. Fifty-one percent of new multi-family rental units (41,072) constructed between 2000 and 2008 were in properties with more than 100 units. Another 22 percent were in properties with 50–99 units. Only 14 percent of the new units were in properties with less than 20 units. The pattern of new construction differed across the boroughs. Seventy-eight percent of new units in Manhattan were located in properties with 100 or more units (54%). The Bronx saw the largest share of
17 The Tenement House Act was amended in 1919 to allow for the conversion of large single-family houses such as brownstones into apartments for less affluent occupants. Plunz (1990), 123.
Figure E: multi-family Rental Units by Building Size
Borough 5–19 20–49 50–99 100+ TotalBronx 27,192 85,736 98,460 48,292 259,680 10% 33% 38% 19% Brooklyn 131,018 89,687 74,388 57,821 352,914 37% 25% 21% 16% manhattan 106,012 140,116 74,639 189,418 510,185 21% 27% 15% 37% queens 50,468 35,737 45,389 63,849 195,443 26% 18% 23% 33% Staten Island 2,903 1,903 1,767 7,508 14,081 21% 14% 13% 53% New York City 317,593 353,179 294,643 366,888 1,332,303 24% 27% 22% 28%
Source: New York City Department of Finance Real Property Assessment Database (2009)

mU
lTI-FAm
IlY R
ENTA
l HO
US
ING
new units concentrated in properties with between 50 and 99 units. In Brooklyn and Queens, new construc-tion was more evenly distributed across building sizes. Figure F reports the distribution of new multi-family rental construction across the boroughs.
The date of a property’s construction plays a crucial role in determining whether the property is subject to New York City’s rent regulations. Perhaps the most distinguishing characteristic of New York City’s multi-family rental stock is the substantial num-ber of units that are governed by rent regulations.18 Seventy-four percent of New York City’s multi-family rental units are rent-regulated, compared with 50 percent of the overall rental stock. Over 83 percent of multi-family rental units in the Bronx and in Queens and 79 percent in Manhattan are rent-regulated. In Brooklyn, 62 percent of these units are rent-regulated, and in Staten Island, 58 percent of units have rent restrictions. The share of multi-family rental units that are rent-regulated also varies widely across neighbor-hoods. Figure G depicts the rent-regulated share of all multi-family rental units in each sub-borough area.
Smaller multi-family rental properties are more likely to be subject to rent restrictions. The primary rent regulations apply to properties with six or more units constructed prior to 1974. As noted above, multi-family rental properties with 5–19 units have an earlier average date of construction than do larger multi-family rental properties. Citywide, 72 percent of units in multi-family rental properties with fewer than 20 units and 75 percent of units in properties with between 20 and 49 units are rent-regulated.19 In comparison, rent restrictions apply to only 42 percent of units in properties with more than 100 units.
18 Our use of the terms “rent regulation” and “rent restrictions” refers to both rent-stabilized and rent-controlled apartments. Rent restrictions generally apply to properties with six or more units constructed before December 31, 1973. Some units in properties that have received special tax benefits for construction or renovation may also be subject to rent restrictions. Pursuant to the Rent Regulation Reform Act of 1997, these restrictions may terminate for particular units due to vacancy or luxury decontrol provisions. An apartment is no longer subject to rent regulation when the rent reaches $2,000 or more per month and the apartment either becomes vacant (vacancy decontrol) or the existing tenants have a household income in excess of $175,000 for each of the prior two years (luxury decontrol). For recent discussions of rent regulation in New York City see Citizens Budget Commission (2010); see also New York City Rent Guidelines Board (2010).
19 The percentage is even higher for very small multi-family rental properties; 83 percent of properties with between five and 9 units are rent regulated.
The size of a multi-family rental property can also affect the available sources of financing. Traditionally, smaller multi-family rental properties have obtained financing more frequently from savings institutions, while larger properties have drawn more financing from Fannie Mae and Freddie Mac. In addition, smaller properties are less likely to be able to access fixed rate financing, which is more prevalent among mortgages
Figure F: New multi-Family Rental Units by Property Size (completed 2000–2008)
Borough 5–19 20–49 50–99 100+ TotalBronx 1,457 1,638 6,956 2,824 12,875 11% 13% 54% 22% Brooklyn 5,705 3,708 3,542 3,543 16,498 35% 22% 21% 21% manhattan 1,238 3,003 4,651 31,013 39,905 3% 8% 12% 78% queens 3,115 1,785 1,869 3,692 10,461 30% 17% 18% 35% Staten Island 135 0 285 0 420 32% 0% 68% 0% New York City 11,650 10,134 17,303 41,072 80,159 14% 13% 22% 51%
Source: New York City Department of City Planning
Figure G: Share of multi-family Properties that are Rent Regulated
80%-100%
60%-80%
40%-60%
Insufficient Data
Parks and Airports
S T A T E O F N E W Y O R K C I T Y ’ S H O U S I N G & N E I G H B O R H O O D S 2 0 1 0 15
Note: Our data sources lack sufficient observations for these community districts to reliably identify the share of multi-family properties that are rent regulated. Source: Housing Vacancy Survey (2008)

16 T H E F U R M A N C E N T E R F O R R E A L E S T A T E & U R B A N P O L I C Y
for properties with 100 or more units.20 Rent regula-tions and the structure of financing can affect a multi-family rental property owner’s ability to respond to changes in the market.
Rent Increases in Recent YearsThe median rent in New York City, as reported by existing tenants to the U.S. Census Bureau, rose, on average, 4.5 percent annually from 2003 to 2009. There is a dramatic and growing disparity in rent paid by households living in multi-family rental properties that moved into their units in the past 10 years and the rent paid by households that moved into their units in prior years. It is likely that much of this disparity is due to the effects of rent regulation. Figure H depicts the current median rent, by year of move-in, for multi-family rental property households in New York. The most dramatic difference is found in Manhattan, where households that moved in between 2005 and 2008 currently pay median rents nearly double that of their neighbors who moved in ten years earlier.
On average, New York City’s multi-family rental property residents have lived in their units for eleven years, with a median stay of six years. This compares with an average stay for residential property owners of 16 years and a median stay of 11 years. As would be expected, multi-family rental residents with some type of rent regulation have been in their units far longer than other multi-family rental residents. The average multi-family rental resident in a rent-regulated unit has resided in their home for 12 years (with a median of eight years), compared with an average of four years (and a median of only two) for those in units that are not regulated.
This pattern of higher rents being paid by newer tenants helps to shed light on stories of property own-ers who purchased multi-family rental properties for high prices with the intention of turning over a large percentage of tenants and dramatically increasing
20 As of 1991, the share of properties in different size classes that had fixed rate mortgages was fairly comparable. This had changed by 2001, when nearly 80 percent of properties with more than 100 units had fixed-rate mortgages, compared with 60 percent of properties with less than twenty units. See Joint Center for Housing Studies (2006), 8. This may be due in part to the influence of securitization, which was more prevalent among mortgages for larger properties.
rents. Stuyvesant Town and Peter Cooper Village rep-resent the most publicized examples of this phenom-enon. According to some accounts, the new owners’ inability to convert as many rent-regulated apartments into market-rate units as they intended played a signif-icant role in the property’s financial difficulties.21 The aggressive plans of owners and investors were stymied by a variety of factors, including unexpected difficul-ties in evicting existing tenants, unrealistic expecta-tions of the potential for rent decontrol (including both vacancy decontrol and luxury decontrol), unantic-ipated increases in building management and mainte-nance costs, and a market downturn that resulted in lower-than-expected increases in market rents.
Although some studies have documented specific examples of this pattern,22 the lack of avail-able data regarding the financing, rent rolls, operating costs, turnover rates, and other factors for the vast majority of multi-family rental properties renders it impossible to accurately determine how prevalent this business model has become in New York’s multi- family rental market.
21 Bagli (2010a), A12; Bagli (2010b), A23; Wei & Karmin (2009), M12.
22 For example, a November 2009 report by the Association for Neighborhood and Housing Development analyzed the underwriting terms and performance of ten multi-family rental property loans that were packaged into commercial mortgage- backed securities. As the report noted, the information available for these securitized loans, which includes financing terms and underwriting assumptions, cannot be obtained through public records for loans that are not securitized. See also Shultz (2009), which estimates that “probably close to 100,000” multi-family rental housing units in New York City are “carrying ... loans far in excess of their ability to pay.”
Figure H: median Current Rent by Year moved in for Renters in multi-Family Rental Properties
Bronx Brooklyn Manhattan Queens Staten Island New York City
0
500
1000
1500
2000
$0
$500
$1,000
$1,500
$2,000
Before 1980 1980s 1990s 2000-2004 2005-2008
Source: Housing Vacancy Survey (2008)

mU
lTI-FAm
IlY R
ENTA
l HO
US
ING
Sales volume and Price Changes in Recent YearsSales of multi-family rental properties rose dramati-cally between 1993 and 2005, peaking at 2,556 multi-family property sales.23 This was the highest number of sales recorded in our data (which begin in 1974). The number of properties sold declined slightly over the next two years, before dropping to 1,616 sales in 2008 and then down to 1,192 sales in 2010. Brooklyn and Queens saw the most dramatic declines in the number of properties sold, with 70 percent fewer multi-family rental property sales in 2010 than in 2005. Manhat-tan saw a 66 percent decline; in the Bronx, 52 percent fewer multi-family rental properties were sold in 2010 than in 2005.24
Smaller multi-family rental properties saw the the most significant reduction in sales volume. Sales of properties with 5–19 units steadily declined between 2005 and 2010 , falling 57 percent. The sales numbers fluctuated more for buildings in other class sizes, as shown in Figure I.
Multi-family rental properties have not been immune from the broader decline in prices across the housing market. The average sales price per unit for multi-family rental properties fell by 28 percent between 2007 and 2010, as measured by the Furman Center’s hedonic price index.25 This decline is less than that of single-family properties, which declined 32 percent, and 2–4 unit properties, which declined 38 percent, during the same period. Prices for multi-family rental properties in Queens declined 14 percent between 2007 and 2009 before rising slightly in 2010. Prices peaked in 2008 in the Bronx and Brooklyn, with subsequent declines of 23 and 25 percent to 2009 aver-age prices and then a small increase in 2010. Manhattan experienced a dramatic 48 percent average price decline
23 The Furman Center’s sales data are assembled from sources provided by the New York City Department of Housing Preservation and Development and the Department of Finance. These data are then matched to RPAD. Due to data limitations our hedonic index of sales prices is restricted to sales from 2001 forward.
24 The very small volume of sales on Staten Island makes comparisons between years less helpful. Between 2005 and 2010 the number of multi-family rental properties sold on Staten Island fluctuated between a high of 23 in 2006 and a low of six in 2010.
25 Prices rose by two percent between 2009 and 2010.
between 2007 and 2010.26 Citywide, smaller multi- family rental properties with 5–19 units had the smallest average price decline, falling 23 percent between 2007 and 2009. Prices for properties with 20–49 and 50–99 units declined 48 and 37 percent respectively during this period.27
These declines followed a period of rapid price appreciation that ended in 2007. Prices for 5–19 unit properties rose a particularly dramatic 129 percent between 2001 and 2007. Average price appreciation over this period was less for larger property classes, with a 114 percent increase for 20–49 unit properties during the same period and an 88 percent increase for sales of properties with more than 50 units.
26 Staten Island saw only 164 properties transact during our sample period, resulting in a large margin error for the 68 percent price decline observed in that borough.
27 20–49 unit properties declined 33 percent 2007 and 2009 and 50–99 unit properties declined 31 percent from their peak in 2008 to their lowest values, in 2009.
Figure I: Sales volumes of multi-Family Rental Properties (2005–2010)
2005 2006 2007 2008 2009 20105–19 Units 1,845 1,666 1,538 1,082 641 78720–49 Units 481 527 508 337 196 21050–99 Units 152 276 221 141 80 139100 + Units 78 65 70 56 31 55Total Sales 2,556 2,534 2,337 1,616 948 1,192
Source: New York City Department of Finance, Furman Center
S T A T E O F N E W Y O R K C I T Y ’ S H O U S I N G & N E I G H B O R H O O D S 2 0 1 0 17

18 T H E F U R M A N C E N T E R F O R R E A L E S T A T E & U R B A N P O L I C Y
Figure J: Number of Properties Receiving Lis Pendens by Borough
Bronx Brooklyn Manhattan Queens New York City
0
100
200
300
400
500
600
700
800
0
100
200
300
400
500
600
700
800
93 94 95 96 97 98 99 00 01 02 03 04 05 06 07 08 09 10
Note: Staten Island is omitted from this figure due to the very small number of multi-family rental properties that received lis pendens in the borough. Sources: Public Data Corporation, New York City Department of Finance Real Property Assessment Data, Furman Center
multi-Family Rental Property mortgage Foreclosures in New York CityAs multi-family rental property prices declined over the past few years and the city felt the effects of the recession, the number of foreclosure notices filed on multi-family rental properties rose. In New York State, a lender files a public notice of foreclosure, or lis pendens, to begin the foreclosure process. Lenders issue this notice of foreclosure after a borrower is more than 90 days delinquent on mortgage pay-ments. Although the filing of a lis pendens may not necessarily result in an actual foreclosure—the building owner may avoid foreclosure by curing the delinquency, refinancing or modifying the mort-gage, or selling the property and paying off the mortgage—it nonetheless provides the most readily identifiable public record that a property owner is having difficulty making mortgage payments.
Citywide, 2,146 different multi-family rental properties have received at least one lis pendens since 2006.28 Of these properties, 691 also had at least one lis pendens between 1993 and 2005, and 141 had at least two other lis pendens during that period. Smaller multi-family rental properties were disproportionately more likely to have multiple lis pendens, perhaps due to greater volatility among these properties, as we discuss below. Figure J depicts the numbers of lis pendens filed on multi-family rental properties in New York annu-ally between 1993, the first year for which we have data, and the end of 2010. As the figure reveals, New York City also saw high numbers of lis pendens filed on multi-family rental properties in the early 1990s. This occurred during a period marked by similar reductions in housing prices and a broad economic decline. As dis-cussed in the 2008 State of the City, housing prices fell citywide by nearly 30 percent between 1989 and 1996. This came on the heels of both the nationwide reces-sion that began in the late 1980s and the savings and loan crisis. According to news reports at the time, New York City saw a substantial increase in the number of renters who found it difficult to pay their rent and the
28 Some of these properties have received multiple lis pendens during this period.
number of owners who fell seriously behind on their taxes or defaulted on their mortgages.29
The number of lis pendens on multi-family rental properties began to decline in 1995, a few years into a period of sustained economic growth nationally. Through the late 1990s, the city averaged approxi-mately 500 multi-family rental lis pendens annually. These numbers began to drop in the early 2000s, reaching a low of 275 multi-family rental lis pendens citywide in 2005. Since 2006, there have been, on average, 505 foreclosure notices filed on the city’s multi-family rental properties each year, compared with 362 annually during the prior six year period, when both prices and sales volume were rising. The most dramatic increase, as Figure J shows, occurred in Brooklyn. Brooklyn had 412 multi-family rental foreclosures initiated in 2009 alone, far more than the numbers annually during the 1990s. The Bronx and Queens have experienced less dramatic changes in the number of lis pendens. In Manhattan, the recent volume of lis pendens has increased, but remains well below the levels in 1993 and 1994.
29 The very small volume of sales on Staten Island makes comparisons between years less helpful. Between 2005 and 2010 the number of multi-family rental properties sold on Staten Island fluctuated between a high of 23 in 2006 and a low of six in 2010.
mU
lTI-FAm
IlY R
ENTA
l HO
US
ING
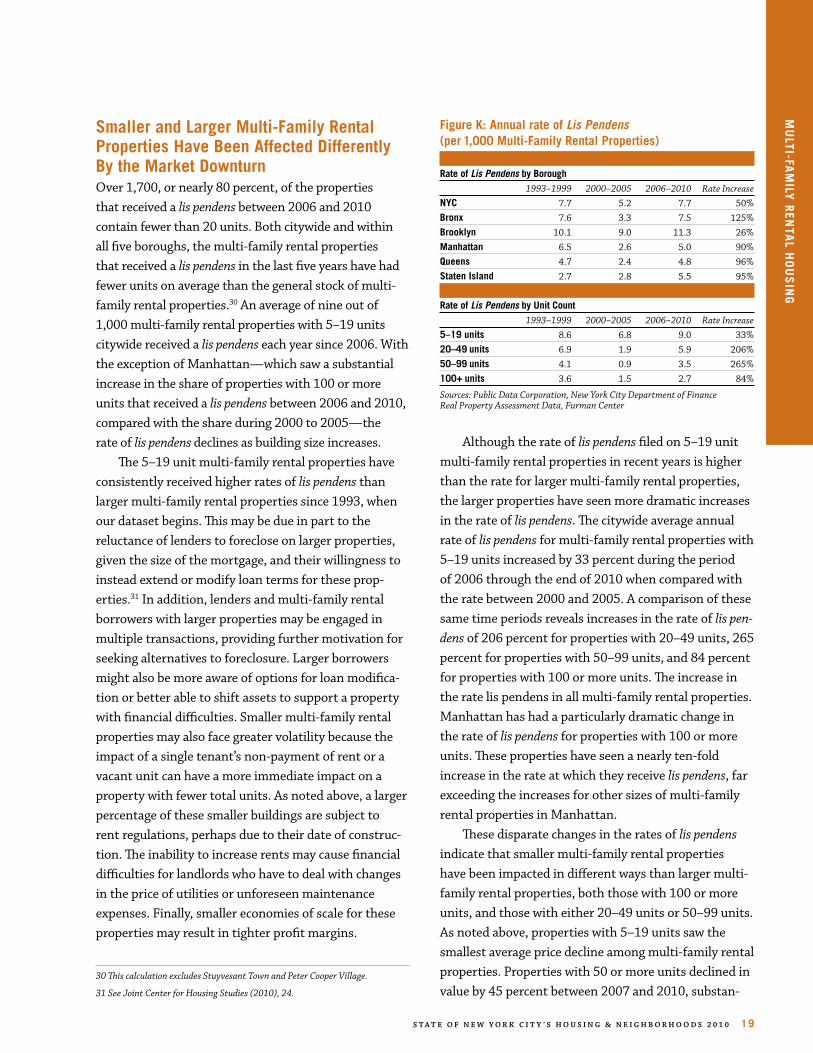
Smaller and larger multi-Family Rental Properties Have Been Affected Differently By the market DownturnOver 1,700, or nearly 80 percent, of the properties that received a lis pendens between 2006 and 2010 contain fewer than 20 units. Both citywide and within all five boroughs, the multi-family rental properties that received a lis pendens in the last five years have had fewer units on average than the general stock of multi-family rental properties.30 An average of nine out of 1,000 multi-family rental properties with 5–19 units citywide received a lis pendens each year since 2006. With the exception of Manhattan—which saw a substantial increase in the share of properties with 100 or more units that received a lis pendens between 2006 and 2010, compared with the share during 2000 to 2005—the rate of lis pendens declines as building size increases.
The 5–19 unit multi-family rental properties have consistently received higher rates of lis pendens than larger multi-family rental properties since 1993, when our dataset begins. This may be due in part to the reluctance of lenders to foreclose on larger properties, given the size of the mortgage, and their willingness to instead extend or modify loan terms for these prop-erties.31 In addition, lenders and multi-family rental borrowers with larger properties may be engaged in multiple transactions, providing further motivation for seeking alternatives to foreclosure. Larger borrowers might also be more aware of options for loan modifica-tion or better able to shift assets to support a property with financial difficulties. Smaller multi-family rental properties may also face greater volatility because the impact of a single tenant’s non-payment of rent or a vacant unit can have a more immediate impact on a property with fewer total units. As noted above, a larger percentage of these smaller buildings are subject to rent regulations, perhaps due to their date of construc-tion. The inability to increase rents may cause financial difficulties for landlords who have to deal with changes in the price of utilities or unforeseen maintenance expenses. Finally, smaller economies of scale for these properties may result in tighter profit margins.
30 This calculation excludes Stuyvesant Town and Peter Cooper Village.
31 See Joint Center for Housing Studies (2010), 24.
Although the rate of lis pendens filed on 5–19 unit multi-family rental properties in recent years is higher than the rate for larger multi-family rental properties, the larger properties have seen more dramatic increases in the rate of lis pendens. The citywide average annual rate of lis pendens for multi-family rental properties with 5–19 units increased by 33 percent during the period of 2006 through the end of 2010 when compared with the rate between 2000 and 2005. A comparison of these same time periods reveals increases in the rate of lis pen-dens of 206 percent for properties with 20–49 units, 265 percent for properties with 50–99 units, and 84 percent for properties with 100 or more units. The increase in the rate lis pendens in all multi-family rental properties. Manhattan has had a particularly dramatic change in the rate of lis pendens for properties with 100 or more units. These properties have seen a nearly ten-fold increase in the rate at which they receive lis pendens, far exceeding the increases for other sizes of multi-family rental properties in Manhattan.
These disparate changes in the rates of lis pendens indicate that smaller multi-family rental properties have been impacted in different ways than larger multi-family rental properties, both those with 100 or more units, and those with either 20–49 units or 50–99 units. As noted above, properties with 5–19 units saw the smallest average price decline among multi-family rental properties. Properties with 50 or more units declined in value by 45 percent between 2007 and 2010, substan-
Figure K: Annual rate of Lis Pendens (per 1,000 multi-Family Rental Properties)
Rate of Lis Pendens by Borough 1993–1999 2000–2005 2006–2010 Rate IncreaseNYC 7.7 5.2 7.7 50%Bronx 7.6 3.3 7.5 125%Brooklyn 10.1 9.0 11.3 26%manhattan 6.5 2.6 5.0 90%queens 4.7 2.4 4.8 96%Staten Island 2.7 2.8 5.5 95%
Rate of Lis Pendens by Unit Count 1993–1999 2000–2005 2006–2010 Rate Increase5–19 units 8.6 6.8 9.0 33%20–49 units 6.9 1.9 5.9 206%50–99 units 4.1 0.9 3.5 265%100+ units 3.6 1.5 2.7 84%
Sources: Public Data Corporation, New York City Department of Finance Real Property Assessment Data, Furman Center
S T A T E O F N E W Y O R K C I T Y ’ S H O U S I N G & N E I G H B O R H O O D S 2 0 1 0 19

Figure m: Foreclosure Incidence by Community District
Community districts with the highest share of multi-family rental properties receiving a lis pendens since 2006 Number of Units in Properties that Percent of Properties that Received an LP properties Received an LPBK 03 Bedford Stuyvesant 240 12.5% 2,009BK 16 Brownsville 69 11.1% 525QN 14 Rockaway / Broad Channel 27 10.1% 524BK 04 Bushwick 215 8.9% 1,556BX 09 Parkchester / Soundview 41 8.5% 1,225BK 08 Crown Heights / Prospect Heights 136 8.4% 1,450BK 05 East New York / Starrett City 68 8.4% 587BK 17 East Flatbush 78 8.1% 699BK 13 Coney Island 33 7.9% 379QN 13 queens village 4 7.4% 40
Community districts with the highest number of multi-family rental properties receiving a lis pendens since 2006 Number of Percent of Units in Properties that Properties that Properties that Received an LP Received an LP Received an LPBK 03 Bedford Stuyvesant 240 12.5% 2,009BK 04 Bushwick 215 8.9% 1,556BK 08 Crown Heights / Prospect Heights 136 8.4% 1,450MN 10 Central Harlem 111 5.8% 1,628BK 01 Green Point / Williamsburg 102 3.2% 1,410
Community districts with the highest number of multi-family rental units in properties receiving a lis pendens since 2006 Number of Units in Percent of Number of Properties that Units that Properties that Received an LP Received an LP Received an LPMN 06 Stuyvesant Town / Turtle Bay 13,162 25.1% 28MN 11 East Harlem 2,612 8.2% 78BK 03 Bedford Stuyvesant 2,009 8.9% 240MN 12 Washington Heights / Inwood 1,986 3.4% 70MN 10 Central Harlem 1,628 4.1% 111
Sources: Public Data Corporation, New York City Department of Finance Real Property Assessment Data, Furman Center
tially more than the 20 percent decline among 5–19 unit properties. Dramatic price declines can cause sub-stantial difficulties for property owners seeking to refi-nance their mortgage when a balloon payment comes due on a mortgage financed during a period of higher valuations. Hence, while the steady rates of lis pendens filed on smaller multi-family rental properties may reflect recurring financial stresses or volatile income streams, the dramatic increase in the rate of lis pendens among larger multi-family rental properties appears to more likely be the result of price declines and difficul-ties either refinancing a mortgage or meeting ongoing mortgage payments.
The Neighborhoods most Affected by multi-family Rental Foreclosures As noted earlier, among the boroughs, Brooklyn has the largest share of its multi-family rental units located in properties with fewer than 20 units. Given this fact, as well as its higher rate of lis pendens borough-wide, it is not surprising that seven of the 10 community districts with the highest rate of lis pendens on multi-family rent-als since 2006 are in Brooklyn, as shown in Figure M.
Thirteen percent of multi-family rental properties in Bedford Stuyvesant, or 240 properties containing 2,009 units, have received a lis pendens since 2006.32 Eleven and 10 percent respectively of the multi-family rental proper-ties in Brownsville in Brooklyn and Rockaway/Broad Channel in Queens received a foreclosure notice during this period. More than eight percent of the multi-family rental properties in Bushwick, Parkchester/Soundview, South Crown Heights/Lefferts Garden, East New York/Starrett City, and East Flatbush also received lis pendens between 2006 and 2010. These rates are all substantially higher than the 3.9 percent of multi-family rental proper-ties citywide that received a lis pendens during this period.
32 265 lis pendens were filed in Bedford Stuyvesant during this period for all housing types.
Figure l: Increase in the Share of multi-Family Rental Properties Receiving a Lis Pendens Between 2000–2005 and 2006–2010
-50% to 0%
0% to 50%
50% to 100%
100% to 200%
More than 200%
Parks and Airports
20 T H E F U R M A N C E N T E R F O R R E A L E S T A T E & U R B A N P O L I C Y
Source: Public Data Corporation, Furman Center

S T A T E O F N E W Y O R K C I T Y ’ S H O U S I N G & N E I G H B O R H O O D S 2 0 1 0 21
mU
lTI-FAm
IlY R
ENTA
l HO
US
ING
Multi-family rental lis pendens have largely been concentrated in neighborhoods with low median household incomes. All but two (Queens Village and Rockaway/Broadchannel) of the 10 community districts with the highest rates of lis pendens filed on multi-family rental properties had median household incomes below the citywide median. Residents of multi-family rental properties in Queens Village and Rockaway/Broad Channel had median incomes under $25,000, substan-tially lower than other residents in these two neigh-borhoods. Neighborhoods with the highest rates of lis pendens were also marked by low homeownership rates, low median monthly rents, and high rates of poverty. With the exception of Coney Island and Rockaway/Broad Channel, these neighborhoods had relatively large non-white populations. Nearly all of the neighborhoods had high shares of households with children.
These neighborhoods with high rates of lis pendens in recent years also experienced high rates of lis pen-dens during prior periods. With the exception of Coney Island, the rates of lis pendens on 1–4 family properties in these community districts were above the citywide median. Housing prices also appreciated in these neigh-borhoods, during the years prior to the market down-turn, at a higher rate than the citywide median.33
Multi-family rental housing is the most prevalent type of housing in Washington Heights/Inwood, Central Harlem, and East Harlem, three of the five districts with the highest number of multi-family rental units in prop-erties that received a lis pendens. These neighborhoods saw dramatic rates of price appreciation in their multi-family rental properties between 2000 and 2007. Prices then dropped precipitously in each of these neighbor-hoods over the next one or two years.
33 In nine of the 10 districts, 2–4 unit properties are the most prevalent housing type, and in all nine these properties appreciated at a higher rate than the rate citywide. In the tenth district, Queens Village, single-family properties are the most prevalent housing type and the neighborhood also saw a higher rate of appreciation for this housing type than the rate citywide.
mortgage Foreclosures and Property ConditionsIt is often believed that property owners facing financial difficulty will either defer or ignore building repairs and routine maintenance.34 While systemati-cally assessing the maintenance of buildings is diffi-cult, new housing code violations provide one measure of declining building conditions. A review of housing code violations between the first quarter of 2004 and the fourth quarter of 2009 therefore can provide insight into the relationship between a building’s physical upkeep and the financial difficulties that likely cause a lis pendens.
Over our sample period, the average quarterly rate of new violations for buildings that received a lis pendens at some point during the entire sample period was 31 percent higher than for buildings that never received a lis pendens.35 This suggests that buildings that become financially distressed are operating at lower maintenance levels on an ongoing basis.
Relative to its average rate of violations during other quarters in our sample, a building receives, on average, 21 percent more violations per quarter during the specific quarter in which the lis pendens was filed, and 15 percent more violations per quarter during the five-quarter period that includes the quarter in which the lis pendens was filed, the previous two quarters, and the subsequent two quarters. While this prelimi-nary analysis suggests a link between a building’s financial and physical condition, to fully assess this link would require a more in-depth quantitative analy-sis, incorporating rent regulations, housing assistance, and other factors that may alter a property owner’s incentives and ability to maintain the property. We hope to undertake that analysis as additional relevant data become available.
34 The relationship between financial distress and physical distress, particularly in the context of properties in the Bronx owned by Ocelot Capital Group, is discussed in Fernandez & Lee (2009), A21. A report by the Citizens Housing & Planning Council argues that building owners who are unable to pay their debt service and unable to refinance “may be tempted to reduce maintenance and operation expenditures.” Shultz (2009), 20.
35 Buildings that receive a lis pendens average 0.043 new violations per quarter (excluding the two quarters before and after the quarter of the lis pendens and that quarter), while buildings that receive no lis pendens receive on average 0.033 violations per quarter. For more on our analysis of housing code violations in relation to lis pendens please see the Data Sources and Methodology appendix.

22 T H E F U R M A N C E N T E R F O R R E A L E S T A T E & U R B A N P O L I C Y
The Foreclosure Process for multi-Family Rental Properties and Tenant ProtectionsThe foreclosure process differs slightly for home loans—loans secured by the mortgage on a 1–4 family property that the borrower uses as a primary residence—and multi-family rental property mort-gages. For home loans, New York State requires a lender to provide a pre-foreclosure notice to the bor-rower at least 90 days prior to beginning legal action to inform the borrower of steps that can be taken to avoid foreclosure.36 This pre-foreclosure notice is not required for multi-family rental properties.
New York State does, however, require a party seeking to foreclose upon a residential property to provide notice of the foreclosure to any tenants residing at the property.37 This notice provides basic information regarding the tenants’ rights during the foreclosure process and the contact information for the foreclosing party. Under New York State law, ten-ants in multi-family rental properties are entitled to remain in their units for the longer of either 90 days from the date of the lis pendens or the term of their lease. The federal Protecting Tenants at Foreclosure Act prohibits eviction for 90 days from the foreclo-sure sale or during the term of the lease.38
Tenants living in rent-regulated units receive additional protections. Under New York law, these tenants can only be evicted for one of several statutorily defined reasons, which do not include foreclosure.39 These protections remain in place even if ownership of the property changes. However, it is unclear how many tenants are aware of and able to invoke these legal protections, and to what extent new landlords have sought to remove existing tenants.40
36 N.Y. Real Prop. Acts. Law § 1304 (effective Sept. 1, 2008).
37 N.Y. Laws § 1303. The legislature enacted the portion of this statute requiring that notice be given to tenants and outlining the requirements for this notice on December 15, 2009. 2009 N.Y. Sess. Laws. Ch. 507, § 1 (effective Jan. 14, 2010).
38 Protecting Tenants at Foreclosure Act of 2009, Pub. L. No. 111-22, §§ 701-04 (2009) (effective May 20, 2009).
Type and Sources of Financing for multi-Family Rental Properties and National Data on Originations and DelinquenciesMulti-family lending is typically provided through40 short-term (5, 7, or 10 year) balloon loans. These loans, although they may have a fixed interest rate during the repayment term, do not fully amortize over the term of the loan. As a result, they require payment of a large “balloon payment” at maturity. Typically, borrowers will seek to refinance before maturity or, in some cases, sell the property.
Local thrifts and savings banks provided the largest share of multi-family mortgage financ-ing until the mid-1980s, when the role of Fannie Mae and Freddie Mac, the government-sponsored enterprises (GSEs), began to expand significantly and the pool of commercial mortgage-backed securi-ties (CMBS) which included multi-family mortgages grew. Although we cannot identify the precise sources of current funding for multi-family rental properties in New York City, we can draw on the Fed-eral Reserve’s flow of funds estimate for the share of financing provided nationally by these different entities in recent years. Between 2000 and 2009, the GSEs’ share of all outstanding multi-family mort-gage debt increased from 23 to 36 percent, making the GSEs the single largest source of multi-family loans. This increase has come as the holdings of sav-ings institutions and agency- and GSE-backed mort-gage pools have declined. Commercial banking saw a slight increase between 2007 and 2008 in its share of holdings. During the first six months of 2010, eight out of 10 newly issued apartment loans had
39 N.Y. COMP. CODES R. & REGS. tit. 9, § 2524.1(a) (West 1987) (“As long as the tenant continues to pay the rent to which the owner is entitled, no tenant shall be denied a renewal lease or be removed from any housing accommodation by action to evict ... except on one or more of the grounds specified in this Code.”).
40 For further discussion of the experience of tenants living in foreclosed properties and the legal protections provided to tenants, see Johnson (2010); Rodriguez (2010); Williams (2010); Been & Glasshauser (2009).

S T A T E O F N E W Y O R K C I T Y ’ S H O U S I N G & N E I G H B O R H O O D S 2 0 1 0 23
mU
lTI-FAm
IlY R
ENTA
l HO
US
ING
some form of government support, either through the Federal Housing Administration (FHA), Fannie Mae, or Freddie Mac.
Although we cannot obtain data for all mort-gages in New York City, due to the lack of a public reporting requirement, data reported pursuant to the Home Mortgage Disclosure Act (HMDA) pro-vide some information regarding multi-family loan originations in New York. HMDA requires banks to report the terms and volume of the mortgages they issue based on the level of activity in their single-family mortgage business. Banks subject to this reporting requirement must also report on their multi-family mortgages. Because lenders who specialize in multi-family mortgages don’t issue single-family mortgages that trigger the reporting requirement, HMDA data cover only a portion of the multi-family lending in New York. Therefore, it is difficult to determine whether year-to-year changes in this data represent differences in over-all activity or just in the share of overall activity reported through HMDA.
A review of recent HMDA data reveals that reported multi-family rental property purchase loan originations and aggregate loan amounts in New York declined between 2005 and 2008 before
rising sharply in 2009. A similar, but less uniform across boroughs, decline in total originations and aggregate loan amounts occurred for refinancing loans between 2004 and 2008, with an even more dramatic increase of 260 percent in originations citywide between 2008 and 2009. This substan-tial increase in originations and total borrowing is largely attributable to historically low interest rates.
Although data limitations prevent us from reporting multi-family rental delinquency rates in New York City, national data reveal that in recent years multi-family rental loans have performed better than single-family mortgages. Commercial/multi-family mortgages held in CMBS had a 30+ day delinquency rate of 8.58 percent as of the third quarter of 2010, a record high.41 This rate has risen steadily since the second quarter of 2007, when the rate stood at 0.31 percent. Similar loans held by FDIC-insured banks and thrifts had a 90+ day delin-quency rate of 4.41 percent in the third quarter of 2010. This rate has also risen steadily since 2007 but remains 2.17 percent lower than the 1991 high for this series of loans. The 60+ day delinquency rates for these loans held in life insurance company port-folios or held or insured by Fannie Mae and Freddie Mac were all under one percent, well below the high-est levels for each of these series, but still multiple times higher than the rates in 2007. These numbers do not include construction and development loans.
The national delinquency rate for single-family residential mortgages, as of November 2010, was 9.02 percent, nearly two percentage points below the rate in January 2010. This rate hovered around four to five percent between 1995 and 2006. While the single-family delinquency rate nearly doubled from 2006 to 2010, and currently exceeds the rate for commercial mortgages, the rate of increase in delinquencies in the last five years was considerably more dramatic in the commercial/multi-family loan portfolios.
41 Mortgage Bankers Association (2010).

conclusionSome analysts contend that multi-family rental prop-erty owners will face even more substantial hardships in the next few years, as mortgages originated between 2005 and 2007 reach maturity and borrowers seek to refinance properties.42 As noted, a large portion of multi-family rental loans are balloon loans with five, seven and 10 year terms and borrowers rely on fre-quent refinancing.43 Declining values, in conjunction with potentially tighter credit markets and stricter underwriting standards, may pose insurmountable obstacles for owners of multi-family rental properties reaching the end of their mortgage terms. Although data from the Home Mortgage Disclosure Act indicate a sharp increase in lending in some portions of the multi-family rental mortgage market, it is not clear that properties with mortgages financed during the strong market of a few years ago will be able to obtain needed credit. Hence it is quite possible that we have not yet seen the worst of the market downturn’s effect on multi-family rental properties in New York City.
In the past year, state and federal governments have introduced initiatives that aim to confront the challenges facing multi-family rental properties. The Multifamily Mortgage Resolution Program, a part of the Dodd-Frank Wall Street Reform and Consumer Protection Act, directs HUD to develop a program to ensure the protection of current and future tenants and at-risk multi-family properties but provides little guid-ance on this program. In August 2010, then-Governor Paterson signed a bill that will allow the State of New York Mortgage Agency (SONYMA) to insure loans for the purpose of refinancing overleveraged apartment properties. Under this law, SONYMA will be able to insure refinanced mortgages of up to $150 million for properties originally financed between 2004 and 2008. The city’s Department of Housing Preservation and Development launched a Proactive Preservation Effort
42 A report by Deutsche Bank’s CMBS research team analyzes fixed-rate loans in CMBS and finds that the most problematic loans are short term loans originated in 2005–2007 that will reach maturity between 2010 and 2013, when many will have negative equity. See Parkus [and An] (2009). The report also forecasts a substantial and steady increase, between 2014 and 2017, in the total value of loans reaching maturity. Slightly more than $30 billion in such loans reached maturity in 2010 and nearly $150 billion will reach maturity in 2017 alone.
43 Joint Center for Housing Studies (2009), ii.
in January 2011 to identify and address deteriorating physical conditions in multifamily buildings before they endanger the health and safety of residents and threaten the quality of the surrounding neighborhood.
Although it would be premature to assess these programs, they reveal an increased focus on multi- family rental housing and recognition of that stock’s vital role in housing New Yorkers at all income levels. Further research is needed to better understand this housing and assess appropropriate interventions in this market. In particular, a firmer grasp of the financing of these properties, the business model of their owners, the outcomes for properties that receive a lis pendens, and the characteristics of both landlords and tenants would help policymakers to effectively address threats to the multi-family rental housing stock.
The challenges faced by New York City’s multi- family rental properties are as diverse as the housing stock itself. These properties, which house nearly half of New York City’s residents, demand careful analysis by researchers and policymakers crafting the city’s future housing policies.
APPendiX: dAtA sources And metHodologyWe rely on the New York City Department of Finance Real Property Assessment Database (RPAD) for por-tions of our property-specific data, including the share of residential units located in multi-family rental properties and the date of construction for properties. RPAD allows us to distinguish between units in multi-family rental properties and units in smaller (2–4 unit) rental properties, single-family homes, cooperative apartments, condominiums, and public housing. It cannot, however, tell us whether condominium units, cooperative units, or single-family homes are occupied by their owner or a renter.
Data limitations prevent us from directly compar-ing the share of New York City residential units in multi-family rental properties with the shares in other cities. The American Community Survey (ACS), which we use for data regarding other cities, does not distin-guish between privately-owned rental units and public housing. The ACS, which is discussed in more detail at page 137, reports whether a respondent household
24 T H E F U R M A N C E N T E R F O R R E A L E S T A T E & U R B A N P O L I C Y

S T A T E O F N E W Y O R K C I T Y ’ S H O U S I N G & N E I G H B O R H O O D S 2 0 1 0 25
mu
lti-fAm
ily r
entA
l Ho
us
ing
rents or owns its residence and the size, by unit count, of the building in which the respondent resides. As a result, the ACS allows us to provide the percentage of renter households who live in all building types of a certain size. This includes—in addition to renters in multi-family rental properties—those renters who live in multi-family ownership buildings, such as condo-miniums and cooperative apartments, and who rent their apartment from the unit’s owner.
Throughout this report when we refer to “multi-family rental properties” we will only be referencing units in privately owned rental properties with five or more units. In contrast, a reference to “multi-family buildings” will include all buildings (both publicly and privately owned) with five or more units: those with only rental units (the multi-family rental properties) and those with ownership units that may or may not be rented by the individual owner. When discussing multi-family rental properties in New York City only, we use the term “property” because our data sources identify properties under common ownership, which may con-tain multiple buildings. However, when comparing New York City with other U.S. cities using the ACS, we use the term “building” because the ACS survey asks respon-dents to report the size of the building they live in.
We use the U.S. Census Bureau’s New York City Housing and Vacancy Survey (HVS) for our data regarding the characteristics of households that reside in multi-family rental properties. The HVS is also our source for data regarding rent regulation.
One identifying feature of multi-family rental properties is the relative infrequency with which they are sold. Forty-eight percent have no recorded sale and another 30 percent have sold only once since 1974. Repeat sales housing price indexes are commonly used to track the value of single-family or 2–4 family homes. These indexes, such as the Furman Center index of housing price avppreciation reported on the city, borough, and community district pages of the State of the City, are averages of the percentage price changes between consecutive sales of individual properties in a given area. This method provides a reliable indicator of changes in overall property values if the proper-ties that actually sell repeatedly are representative of all properties and the number of properties that sell
repeatedly in a given period is reasonably large. Both of these conditions are tenuous for multi-family rental properties in New York City. Based on the average number of annual sales per year from 2000 to 2009, multi-family rental properties sell on average once every 30 years, and it is highly possible that properties that are changing ownership are of different quality than the average building. Figure N shows the share of New York City 1–4 unit properties and multi-family rental properties that have sold a total of 0, 1, 2, 3, and 4 or more times since 1974, and illustrates that rela-tive infrequency with which these properties transact.
An alternative to the repeat sales methodology is a hedonic price index, so called because the method sta-tistically accounts for the contribution to the sales price of a property’s characteristics such as square footage, number of units, and location. The index is composed of the remaining changes in average sales prices from year to year after accounting for the characteristics of the individual properties being sold. Since the method does not rely on repeated transactions, many more sales can be used to estimate overall price trends, and differential value changes of properties with higher turnover rates exert less influence in the index. For these reasons, we report price changes based on the hedonic index for multi-family rental properties.
When compared to the repeat sales index, the hedonic price indexes for multi-family rental proper-ties for each borough and the entire city measure lower or similar appreciation in prices from 2001 to a high in 2006 or 2007 and greater subsequent declines. For example, citywide, the margin of error for the dramatic 126 percent increase in price from 2001 to 2007, as measured by the hedonic index, overlaps with the 136 percent increase measured by the repeat sales method. However, the subsequent 29 percent decline
figure n: share of Properties by number of recorded sales since 1974 by number of units
Sales 1–4 Units 5-19 Units 20-49 Units 50-99 Units 100+ Units Total0 29.2% 68.5% 50.6% 53.2% 45.7% 30.6%1 37.6% 21.9% 27.3% 25.9% 29.4% 36.9%2 20.1% 5.9% 12.7% 12.0% 14.7% 19.6%3 8.4% 2.4% 5.5% 5.7% 6.4% 8.3%4 or more 4.8% 1.3% 3.8% 3.2% 3.7% 4.7%
Source: New York City Department of Finance, Furman Center

26 T H E F U R M A N C E N T E R F O R R E A L E S T A T E & U R B A N P O L I C Y
measured by the hedonic index is more drastic than the 19 percent measured by the repeat sales method.
Unlike owner-occupied, single-family residences, multi-family rental buildings generate monthly rental income, so the value of a particular property is ideally calculated as the discounted value of its net operat-ing income. The value of a building is then determined by rents, operating and maintenance costs, vacancy rates, required return on equity, and how these fac-tors are expected to change over time. While rents, costs, vacancy rates, and investment opportunities have surely all changed in our measurement period, we do not have access to comprehensive or representa-tive financial data for multi-family buildings in New York. As a result, we rely on observed sales prices and the hedonic index methodology to describe changes in property values.
To determine whether properties receive a higher rate of housing code violations during the period around a lis pendens we first count the number of new housing code violations received by a building during each quarter. We then compare these quarterly counts during the period extending from six months prior to the quarter in which the property received a lis pendens until six months after that quarter to all other quarters. For example, if a building received a lis pendens in the first quarter of 2009, we consider that quarter, as well as the third and fourth quarters of 2008 and the second and third of 2009.
Our analysis also takes into account trends in quarterly housing code violation rates for all build- ings that received a lis pendens from 2004 to 2009. We did not include new housing code violations prior to 2004 because the introduction of New York City’s 311 system in 2003 affected the interpretation of new violations reports.
In separate negative binomial regression models predicting the number of violations in a given quarter, we calculate a 21 percent increase in violations dur-ing the same quarter of a lis pendens and a 15 percent increase during the five quarter window including the lis pendens relative to all other quarters. The mod-els include an indicator for a lis pendens in the same quarter or in the window also including the previous
and subsequent two quarters as well as property level and quarter indicator variables so that the comparison is to the same property after accounting for changes over time across all buildings in the rate of violations. The unit of observation is a property level quarter. The modeled coefficients for the quarter and window of the lis pendens variables are statistically significant at the five and 10 percent levels, respectively.
referencesArmstrong, Amy, Vicki Been, Caroline K. Bhalla, Ingrid Gould Ellen, Allegra Glashausser, Simon McDonnell, Max Weselcouch, Benjamin Winter, and Courtney Wolf. 2009. State of New York City’s Housing and Neigh-borhoods 2008. Furman Center for Real Estate and Urban Policy.
Armstrong, Amy, Vicki Been, Caroline K. Bhalla, Ingrid Gould Ellen, Josiah Madar, Simon McDonnell, Claudia Sharygin, and Max Weselcouch. 2010. State of New York City’s Housing and Neighborhoods 2009. Furman Center for Real Estate and Urban Policy.
Apgar, William and Shekar Narasimhan. 2007. Enhancing Access to Capital for Smaller Unsubsidized Multifamily Rental Properties. Harvard Joint Center for Housing Studies.
Association for Neighborhood and Housing Develop-ment. 2009. Predatory Equity: Evolution of a Crisis.
Bagli, Charles V. 2010a. N.Y. Housing Complex is Turned over to Creditors, New York Times, Jan. 25, 2010, at A12.
Bagli, Charles V. 2010b. A Rent Spike May Loom at Stuyvesant Town, New York Times, Dec. 15, 2010, at A23.
Been, Vicki and Allegra Glashausser. 2009. Tenants: Innocent Victims of the Nation’s Foreclosure Crisis, 2 Albany Government Law Review 1.

S T A T E O F N E W Y O R K C I T Y ’ S H O U S I N G & N E I G H B O R H O O D S 2 0 1 0 27
mu
lti-fAm
ily r
entA
l Ho
us
ing
Citizens Budget Commission. 2010. Rent Regulation: Beyond the Rhetoric.
Fernandez, Manny and Jennifer Lee. 2009. As Landlords Struggle Financially, Their Apartments Fall into Disrepair, New York Times, July 15, 2009.
Furman Center for Real Estate and Urban Policy. 2008. New Analysis of NYC Foreclosures Data Reveals 15,000 Renter Households Living in Buildings that Entered Foreclosure in 2007.
Furman Center for Real Estate and Urban Policy. 2010. Foreclosed Properties in NYC: A Look at the Last 15 Years. Herbert, Christopher E. 2001. An Assessment of the Availability and Cost of Financing for Small Multifamily Properties. Abt Associates Inc.
Johnson, Creola. 2010. Renters Evicted En Masse: Collateral Damage Arising from the Subprime Foreclosure Crisis, 62 Florida Law Review 975.
Joint Center for Housing Studies. 2006. Enhancing Access to Capital for Smaller Multi-family Properties. Harvard University.
Joint Center for Housing Studies. 2008. America’s Rental Housing: The Key to a Balanced National Policy. Harvard University.
Joint Center for Housing Studies. 2009. Meeting Multifamily Housing Finance Needs During and After the Credit Crisis: A Policy Brief. Harvard University.
Joint Center for Housing Studies. 2010. State of the Nation’s Housing. Harvard University.
Kennedy, Shawn G. 1994. Defaults Rise, Posing Peril For Housing, New York Times, May 31,1994, at B1.
Mortgage Bankers Association. 2010. Mortgage Delinquency Rates for Major Investor Groups: Q3 2010.
Parkus, Richard and Jing An. 2009. The Future Refinancing Crisis in Commercial Real Estate. Deutsche Bank CMBS Research.
Plunz, Richard. 1990. A History of Housing in New York City. Columbia University Press.
Reiss, David. 2009. Landlords of Last Resort: Should the Government Subsidize the Mortgages of Privately-Owned, Small Multifamily Buildings?, 31 Western New England Law Review 915.
Rodriguez-Dod, Eloisa. 2010. Stop Shutting the Door on Renters: Protecting Tenants from Foreclosure Evictions, 20 Cornell Journal of Law and Public Policy 243.
Schnare, Ann B. 2001. The Impact of Changes in Multi-family Housing Finance on Older Urban Areas. Brookings Institution Center on Urban and Metropolitan Policy and Harvard Joint Center for Housing Studies.
Shultz, Harold. 2009. Debt Threat: Saving Multifamily Rental Housing from Zombie Mortgages. Citizens Housing & Planning Council.
Wei, Lingling and Craig Karmin. 2009. An Apartment Complex Teeters, Wall Street Journal, Oct. 15, 2009, at M12.
Williams, Aleatra P. 2010. Real Estate Market Meltdown, Foreclosures and Tenants’ Rights, 43 Indiana Law Review 1185.