Embed Size (px)
Citation preview
Research Methodology 46
3. Materials and methodology
3.1. Materials
The chemicals used in the study were zirconium oxcychloride (CDH Pvt. Ltd.,
India), thorium nitrate (Loba Chemia Pvt. Ltd., India), sodium tungstate (Qualigens,
India), sodium molybdate (CDH), sodium selenite (CDH Pvt. Ltd., India),
orthophosphoric acid (Qualigens, India), methylene bue (CDH Pvt. Ltd., India),
malachite green (CDH Pvt. Ltd., India), nitric acid (CDH Pvt. Ltd., India), sodium
chloride (Loba Chemi Pvt. Ltd., India), sodium hydroxide (Loba Chemi Pvt. Ltd.,
India), potassium hydroxide (Loba Chemi Pvt. Ltd., India), lithium nitrate (CDH Pvt.
Ltd., India), potassium chloride (CDH Pvt. Ltd., India), potassium nitrate (Loba
Chemi Pvt. Ltd., India), nickel nitrate (CDH Pvt. Ltd., India), calcium nitrate (Loba
Chemi Pvt. Ltd., India), strontium nitrate (Loba Chemi Pvt. Ltd., India), chromium
nitrate (CDH India), cobalt nitrate (CDH India), zinc nitrate (CDH Pvt. Ltd., India),
magnesium nitrate (CDH Pvt. Ltd., India), barium nitrate (Loba Chemi Pvt. Ltd.,
India), sodium nitrate (CDH Pvt. Ltd., India), ferrous nitrate (Loba Chemi Pvt. Ltd.,
India), copper nitrate (Loba Chemi Pvt. Ltd., India), lead nitrate (Loba Chemi Pvt.
Ltd., India), pectin (Loba Chemi Pvt. Ltd., India), aniline (Loba Chemi Pvt. Ltd.,
India), ammonium per sulphate (Loba Chemi Pvt. Ltd., India). The chemicals used in
this study were used as received. Double distilled water was used for each dilution
and washing. All other reagents used were of analytical reagent grade.
3.2. Instruments
X-ray diffractrometer, Phillips (Holland), model PW 1148/89 was used for x-ray
diffraction analysis. Perkin Elmer FTIR spectrometer was used to determine the
functional groups and vibrations in the compounds. Morphology and particle size of
the material was studied using scanning electron microscope (SEM Qant-250, model
9393) and transmission electron microscope (FEI Tecnai F 20). The concentrations of
dyes were determined using UV-visible spectrophotometer (Systronics 2202).
Magnetic stirrer was used for stirring the different samples. Temperature controlled
electric oven was used for drying the sample. pH meter (ElicoL1-10, India) was used
for pH measurement and muffle furnace (MSW-275, India) was used for heating the
samples.
Research Methodology
47
3.3. Preparation of pectin gels
The pectin gels were prepared by mixing varying amount of pectin (1 to 5 g) into 100
mL of double distilled water with constant stirring. The resulting mixtures were
stirred for half an hour on magnetic stirrer.
3.4. Synthesis of polyaniline (PANI)
The polyaniline was prepared by mixing 10% aniline and 0.1 M ammonium per
sulphate as initiator prepared (in 1 M HCl) at 1:1 volume ratio with constant stirring.
The mixture was maintained below 10°C for an hour with constant stirring. After half
an hour green color gels of polyaniline were obtained (Stejskal, 2002).
3.5. Synthesis of nanocomposite ion exchangers
3.5.1. Synthesis of pectin zirconium (IV) selenotungstophospate (Pc/ZSWP)
nanocomposite ion exchanger
Preparation of reagents
The solution of ZrOCl2.8H2O (0.1 M) was prepared in 0.1 M HCl. The solutions of
NaWO4.2H2O (0.1 M), Na2SeO3 (0.1 M) and H3PO4 (0.1 M) were prepared in
demineralized water.
Methodology
The pectin zirconium (IV) selenotungstophosphate nanocomposite ion exchanger was
synthesized by sol-gel method. The inorganic precipitate of zirconium (IV)
selenotungstophospate (ZSWP) was prepared at room temperature by mixing the
solutions of 0.1 M sodium selenite, 0.1 M sodium tungstate and 0.1 M H3PO4 with
0.1 M zirconium oxychloride drop wise in 1:1:1:1 volume ratio with constant stirring
(AL-Othman et al., 2011). The pH of reaction mixture was maintained between 0-1
by adding 1 M nitric acid or 1 M ammonia solutions. The resultant slurry was stirred
for 1 hour constantly on the magnetic stirrer. The gel of pectin was added into the
inorganic precipitate of ZSWP with constant stirring. The resultant yellowish-white
precipitates obtained were then kept for digestion for 24 hrs. The supernatant liquid
was decanted and the gels were filter under suction and washed with distilled water.
The precipitates obtained were dried in an oven at 50°C. The dried composite ion
Research Methodology 48
exchange material was broken into small granules of uniform size. The ion exchanger
material was converted into H+
form by treating with 0.1 M HNO3 for 24 hrs. The
Pc/ZSWP nanocomposite was washed with double distilled water several times in
order to remove excess of acid and dried at 50°C. Using similar procedure numbers of
samples were prepared by varying the concentration of pectin. Based on the ion
exchange capacity values, sample-3 was chosen for detailed further studies.
3.5.2. Synthesis of polyaniline zirconium (IV) selenotungstophosphate (PANI/
ZSWP) nanocomposite ion exchanger
Preparation of reagents
The solution of ZrOCl2.8H2O (0.1 M and 0.2 M) was prepared in 0.1 M HCl. The
solution of NaWO4.2H2O (0.1 M and 0.2 M), Na2SeO3 (0.1 M and 0.2 M) and H3PO4
(0.1 M and 0.2 M) were prepared in demineralized water (DMW).
Methodology
The polyaniline zirconium (IV) selenotungstophosphate nanocomposite ion exchanger
was synthesized by sol-gel method. In this method, firstly the inorganic precipitate of
zirconium (IV) selenotungstophosphate (ZSWP) were prepared at room temperature
by adding the solutions of sodium selenite, sodium tungstate and orthophosphoric
acid to the solution of zirconium oxychloride drop wise in 1:1:1:1 volume ratio with
constant stirring (Siddiqi and Pathania, 2003a). The pH of reaction mixture was
maintained between 0-1 by adding 1 M nitric acid or 1 M ammonia solutions. The
resultant slurry was stirred for 3 hrs constantly on the magnetic stirrer at 65°C. The
dark green gel of polyaniline was added into the inorganic precipitate of ZSWP with
constant stirring. The mixture was stirred for 2 hrs constantly on the magnetic stirrer
at room temperature. The resultant green colored precipitates obtained were then kept
for digestion for 24 hrs. The supernatant liquid was decanted and the gels were filter
under suction and washed with distilled water to remove the excess of impurities. The
precipitates of PANI/ZSWP obtained were dried at 50°C in a hot air oven. The dried
composite ion exchange material was broken into small granules of uniform size. The
ion exchanger was converted into H+
form by treating with 0.1 N HNO3 for 24 hrs.
The PANI/ZSWP nanocomposite ion exchanger was washed with DMW several
times in order to remove excess of acid and dried at 50°C. The different samples of
Research Methodology
49
PANI/ZSWP nanocomposite ion exchanger were prepared by varying the different
components as shown in Table 4.2.1 On the basis of Na+ ion exchange capacity and
yield percentage; sample-4 was selected for further studies.
3.5.3. Synthesis of pectin thorium (IV) tungstomolybdate (Pc/TWM) nanocomposite
ion exchanger
Preparation of reagents
The solution of ThNO3.6H2O (0.05 M) was prepared 0.1N HNO3. The solutions of
NaWO4.2H2O (0.05 M) and NaMoO4 2H2O (0.05 M) were prepared in demineralized
water.
Methodology
The pectin zirconium (IV) selenotungstophosphate nanocomposite ion exchanger was
synthesized by sol-gel method. In a typical method, firstly the inorganic precipitate of
thorium (IV) tungstomolybdate (TWM) was prepared at room temperature by adding
the solutions of 0.05 M sodium tungstate and 0.05 M sodium molybdate to the
solution of 0.05 M thorium nitrate drop wise in 1:1:1 volume ratio with constant
stirring. The pH of reaction mixture was maintained between 0-1 by adding 1 M nitric
acid or 1 M ammonia solutions. This mixture was stirred constantly for two hrs at
80°C on the magnetic stirrer. The gel of pectin was added into the inorganic
precipitate of TWM with constant stirring (Varshney et al., 2005). The solutions were
kept on a magnetic stirrer for four hrs at 80°C. The resultant yellowish precipitates
obtained were then kept for digestion for 24 hrs. Then the supernatant liquid was
decanted and the gels were filter under suction and washed with distilled water. The
precipitates obtained were dried in an oven at 50°C. The dried composite ion
exchange material was broken into small granules of uniform size. The ion exchanger
material was converted into H+
form by treating with 1 M HNO3 for 24 hrs. The
Pc/TWM nanocomposite was washed with double distilled water several times in
order to remove excess of acid and dried at 50°C. Using similar procedure numbers of
samples were prepared by varying the concentration of pectin, based upon the ion
exchange capacity sample-3 was chosen for further detailed studies.
Research Methodology 50
3.5.4. Synthesis of polyaniline thorium (IV) tungstomolybdophosphate (PANI/
TWMP) nanocomposite ion exchanger
Preparation of reagents
The solution of ThNO3.6H2O (0.05 M and 0.1M) was prepared in 0.1N HNO3. The
solutions of NaWO4.2H2O (0.05 M and 0.1 M), NaMoO4.2H2O (0.05 M and 0.1 M)
and H3PO4 (0.05 M, 0.1 M and 0.5 M) were prepared in demineralized water.
Methodology
Polyaniline thorium (IV) tungstomolybdophosphate (PANI/TWMP) nanocomposite
ion exchanger was synthesized using sol-gel method. Firstly, the inorganic precipitate
of thorium (IV) tungstomolybdophosphate (TWMP) was prepared at room
temperature by adding the solutions of sodium tungstate, sodium molybdate and
H3PO4 to the solution of thorium nitrate drop wise in 1:1:1:1 volume ratio with
constant stirring (De and Chowdhury, 1974). The pH of resultant mixture was
maintained between 0-1 by adding 1 M nitric acid or 1 M ammonia solutions. The
resultant slurry was stirred for 3 hrs constantly on the magnetic stirrer at 65°C. Then
dark green gel of polyaniline was added into the inorganic precipitate of TWMP with
constant stirring. The mixture was stirred for 2 hrs constantly on the magnetic stirrer
at room temperature. The resultant green colored precipitates obtained were then kept
for digestion for 24 hrs. The supernatant liquid was decanted and the gels were filter
under suction and washed with distilled water to remove the excess of impurities. The
precipitates of PANI/TWMP obtained were dried at 50°C in a hot air oven. The dried
composite ion exchange material was broken into small granules of uniform size. The
ion exchanger was converted into H+
form by treating with 0.1 M HNO3 for 24 hrs.
The PANI/TWMP nanocomposite ion exchanger was washed with DMW several
times in order to remove excess of acid and dried at 50°C. On the basis of Na+ ion
exchange capacity and yield percentage as shown in Table 4.4.1, sample-7 was
selected for further studies.
3.6. Ion exchange capacity
The ion exchange capacity of the synthesized materials was investigated by standard
column process (Siddiqi and Pathania, 2003b). In this process, 1.0 g of nanocomposite
ion exchanger in H+ form was taken in glass column with internal diameter of 1 cm
Research Methodology
51
fitted with glass wool at the bottom. 1M solution of alkali or alkaline earth metal
nitrates (LiNO3, KNO3, NaNO3, Ca(NO3)2, Ba(NO3)2 and Sr(NO3)2 ) were used as
eluents to elute H+ ions completely from the composite cation exchanger column
maintaining the flow rate of 0.5 mL per minute. The collected effluent was titrated
with standard solution of 0.1 M NaOH using phenolphthalein as indicator. The ion
exchange capacity in meq/g, was calculated using the formula as
𝐼.𝐸.𝐶 =𝑁 𝑋 𝑉
𝑊𝑚𝑒𝑞/𝑔 (𝟐.𝟏)
Where ‘N’ is the Normality,
‘V’ is the volume of alkali used in mL and
‘W’ is the weight of nanocomposite ion exchanger taken in grams
3.7. pH titration
The pH titration studies of the synthesized nanocomposite ion exchangers were
determined by using the method as described earlier (Topp and Pepper, 1949). In this
method, 0.5 g of the nanocomposite ion exchangers in H⁺ form were placed in each of
the several 250 mL flask containing equimolar solution of alkali metal chloride and
their hydroxide in different volume ratio. The volume was kept at 50 mL to maintain
the ionic strength constant. The pH of the solution in each flask was recorded after 24
hrs at room temperature till the equilibrium attained. The pH was plotted against the
milli-equivalents of OH⁻ ions added.
3.8. Effect of eluent concentration
The optimum concentration of eluent for complete elution of H+
ions from
nanocomposite ion exchangers was determined by passing the fixed volume 250 mL
of NaNO3 solution of different concentration through a column containing 1.0 g of
nanocomposite ion exchangers in H+ form. The flow rate of the eluent was maintained
at 0.5 mL/min. The collected effluent was titrated against 0.1 M NaOH solution to
find the H⁺ ions eluted out from the column.
Research Methodology 52
3.9. Elution behaviour
In this study, NaNO3 solution of optimum concentration was passed for complete
elution of H+
ions through a column containing 1.0 g of the nanocomposite ion
exchangers in H+ form. The effluent was collected in 10.0 mL fraction at a flow rate
of 0.5 mL/min and each fraction was titrated against a 0.1 M sodium hydroxide.
3.10. Thermal studies
To determine the effect of heating temperature on ion exchange capacity of
nanocomposite ion exchangers, 1.0 g of nanocomposite ion exchangers in H+
form
was heated at different temperatures (100-700°C) in muffle furnace for 1 hour. The
weight, colour and Na+ ion exchange capacity of the nanocomposite ion exchangers
were noted after cooling them at room temperature. The ion exchange capacity of
nanocomposite was determined by standard column process as discussed in section
3.6.
3.11. Distribution studies (Kd)
The distribution coefficient of metal ions Mg2+
, Ca2+
, Sr2+
, Ba2+
, Pb2+
, Cr3+
, Cd2+
,
Zn2+
, Cu2+
, Fe3+
, Ni2+
, Al3+
, Co2+
, Th4+
and Zr4+
was determined by batch method in
different solvents of analytical interest. For this, 0.2 g of the nanocomposite
exchanger beads in H+ ion form were taken in 20 mL of different metal nitrate
solutions in the required medium and kept for 24 hrs with continuous shaking at 25 ±
2°C to attain the equilibrium. The metal ions in the solution before and after
equilibrium were determined by titrating against standard 0.01 M solution of EDTA.
The distribution coefficient (Kd) values were calculated by using the formula as
(Reilley et al., 1959):
𝐾𝑑 =𝐼−𝐹
𝐹 𝑋
𝑉
𝑀 𝑚𝐿/𝑔 (2.2)
Where,
I is the initial amount of the metal ion in the solution phase
F is the final volume of the metal ion in the solution after treatment with ion
exchanger
V is the volume of the solution (mL) is the amount of ion exchanger taken (g).
Research Methodology
53
3.12. Quantitative separations of metal ions from synthetic binary mixtures
Quantitative separations of some important metal ions of analytical utility were
achieved on columns of different nanocomposite ion exchangers. 1.0 g of
nanocomposite ion exchangers in H+ form was taken in glass column of internal
diameter 0.6 cm and a height of 35 cm. The column was washed thoroughly with
double distilled water and then with the suitable solvent. The mixtures of metal ions,
each with initial concentration 0.1 M were loaded and allowed to pass through the
column at a flow rate of 0.20 mL/min. This mixture was circulated two or three times
to ensure the complete absorption of metal ions on the ion exchanger. The absorbed
metal ions were eluted with suitable solvent of required concentration. The effluent
was collected in 10 mL fractions at a flow rate of 5-6 drops per minute. The metal
ions in the effluent were determined titrimetrically using standard solution of 0.01 M
disodium salt of EDTA (Reilley et al., 1959).
3.13. Selective separation of metal ions from synthetic mixtures
The selective separations of metal ions from synthetic mixtures were achieved on
columns of Pc/ZSWP, Pc/TWM, PANI/ ZSWP and PANI/TWMP. In this method, 1.0
g of nanocomposite ion exchangers in H+ form was taken in glass column and washed
thoroughly with dimineralized water. The known concentrations of mixtures of
different metal ions were passed through the column many times. Then the varying
concentrations of suitable solvent were used to elute the metal ions from the columns
of nanocomposite ion exchangers. The amounts of the metal ions were calculated as
per the procedure discussed in section 3.12. The different separations achieved on
different columns of ion exchangers are as follows:
The selective separation of Cu2+
and Th4+
from the synthetic mixtures containing
(Cu2+
, Zn2+
, Ni2+
, Pb2+
, Cd2+
, Mg2+
and Co2+
) for Cu2+
and (Th4+
, Zn2+
, Ni2+
, Pb2+
,
Ba2+
, Sr2+
and Co2+
) for Th4+
were achieved on the column of Pc/ZSWP
nanocomposite ion exchanger. The amount of the Cu2+
and Th4+
ions in the mixture
was varied keeping the amount of the other metal ions constant in the synthetic
mixture.
The selective separation of Cu2+
and Ca2+
from a synthetic mixture of (Cu2+
, Pb2+
,
Zn2+
, Ni2+
, Fe3+
, Mg2+
, Al3+
) for Cu2+
and (Ca2+
, Pb2+
, Zn2+
, Ni2+
, Al3+
, Mg2+
, Ba2+
)
Research Methodology 54
for Ca2+
were achieved on the column of PANI/ZSWP nanocomposite ion exchanger.
The amount of the Cu2+
and Ca2+
ions in the mixture was varied keeping the amount
of the other metal ions constant in the synthetic mixture.
The selective separation of Cr3+
and Pb2+
from synthetic mixture of (Cr3+
, Zn2+
, Ni2+
,
Pb2+
, Sr2+
, Mg2+
, Cd2+
) for Cr3+
and (Pb2+
, Zn2+
, Ni2+
, Al3+
, Co2+
, Mg2+
, Fe3+
) for Pb2+
were achieved on the column of Pc/TWM nanocomposite ion exchanger. The amount
of the Cr3+
and Pb2+
ions in the mixture was varied keeping the amount of the other
metal ions constant in the synthetic mixture.
The selective separation of Cu2+
and Pb2+
from a synthetic mixture of (Cu2+
, Zn2+
,
Ni2+
, Pb2+
, Sr2+
, Mg2+
, Ba2+
) for Cu2+
and (Pb2+
, Zn2+
, Ni2+
, Al3+
, Cd2+
, Mg2+
, Fe3+
)
for Pb2+
were achieved on the column of PANI/TWMP nanocomposite ion
exchanger. The amount of the Cu2+
and Pb2+
ions in the mixture was varied keeping
the amount of the other metal ions constant in the synthetic mixture.
3.14. Photocatalytic activity
The photocatalytic activity of Pc/ZSWP, Pc/TWM, PANI/ZSWP and PANI/TWMP
nanocomposite ion exchangers were explored for the degradation of methylene blue
and malachite green in presence of solar light. The photocatalytic experiments were
performed using a double walled pyrex glass chamber jacketed with thermostatic
water circulation to maintain constant temperature (25oC±1). The magnetic stirrer was
used for the controlled agitation of the mixture. 100 mg of nanocomposite ion
exchangers was added into 1.5 x 10⁻⁵
M solution of methylene blue and 2 x10⁻⁶
M
solution of malachite dye to form slurries (Liu et al., 2013; Rupa et al., 2007; Xu et
al., 2008). The slurry was subjected to the two reaction conditions. In first reaction
condition, the slurry was kept in dark to attain the adsorption-desorption equilibrium
and then exposed to sunlight for further photocatalysis. On the other hand the slurry
was placed directly in sunlight for synergistic adsorption-photocatalysis under second
reaction condition. 3 mL dye solution was withdrawn at different intervals of time,
centrifuged to remove particles of nanocomposite ion exchangers and absorbance was
recorded in the range of 300 to 750 nm. The kinetics for the photocatalytic
degradation of MB and MG was investigated at 662 nm and 620 nm. The percent
degradation of dye was calculated using formula as:
Research Methodology
55
% 𝐷𝑒𝑔𝑟𝑎𝑑𝑎𝑡𝑖𝑜𝑛 =𝐶𝑜−𝐶𝑡
𝐶𝑜 𝑋 100 (2.3)
where, Co and Ct are the concentrations of dye at equilibrium and at time t.
The rates of photocatalytic degradation of dyes were determined using pseudo first
order kinetic model as follow:
𝑟 = −𝑑𝐶
𝑑𝑡= 𝑘𝑎𝑝𝑝 𝑡 (2.4)
On integrating the above equation, we get
𝐼𝑛𝐶0
𝐶𝑡= 𝐾𝑎𝑝𝑝 𝑡 (2.5)
Where kapp is the apparent rate constant, C0 is the concentrations of dye before
illumination and Ct is the concentration of dye at time t.
3.15. Characterization techniques
3.15.1. Fourier Transform Infra Red (FTIR) analysis
Infrared spectroscopy is a powerful analytical technique, which provides useful
information about the structure of the molecules and bonding. The technique is based
upon the principle that a chemical substance shows selective absorption in infrared
region giving rise to absorption bands, called as IR absorption spectrum, which
extends over a wide wavelength range. A molecule absorbs radiation only when the
natural frequency of vibration of atoms is the same as the frequency of the incident
radiation. After absorbing the correct wavelength of radiation, the molecule starts
vibrating. This occurs due to absorption of energy of the IR radiation.
Various bands in FTIR spectrums correspond to characteristic functional groups and
bonds present in the chemical substance. FTIR spectrum of a chemical substance is
thus a fingerprint for its identification. Band position in infrared may be expressed
conveniently by wave number ν, whose unit is cm-1
. Band intensities in FTIR
spectrum may be expressed either as transmittance (T) or absorbance (A).
Methodology:
The FTIR study of nanocomposite ion exchangers was performed using KBr method.
In this method, 10-30 mg of the nanocomposite ion exchangers in H⁺ form was taken
Research Methodology 56
and thoroughly mixed with 100 mg of KBr to fine powder. A disc was formed by
applying a pressure of 80,000 psi in a moisture free atmosphere. FTIR spectrum was
recorded in the region 400-4000 cm⁻1. The FTIR spectrum was obtained using Nicolet
5700 FTIR spectrophotometer installed in SAIF Lab Punjab University, Chandigarh.
3.15.2. X-ray Diffraction (XRD) Analysis
X-ray diffraction is a non-destructive analytical technique for identification and
quantitative analysis of various crystalline forms of molecules. Diffraction occurs
when the waves collide with a regular structure in which the repeating distance is
approximately equal to wavelength of the wave. The X-rays have wavelengths of the
order of angstrom. The X-rays gets easily diffracted from materials which, are
crystalline and have repeating and regular atomic structures. When X-rays interact
with a crystalline substance or a crystalline phase a diffraction pattern is obtained.
The powder diffraction method is thus suitable for the characterization and
identification of poly-crystalline phases. The easy accessibility of X-ray diffraction
(XRD) makes it useful technique not only for the phase identification, but also for the
identification of lattice structure and for the modelling of the basic unit (Cullity,
1978). It has been used to provide useful information of molecule such as crystallinity
of the material, lattice parameters, grain size, bond lengths and plane spacing. Thus
the XRD technique has been used for the identification of unknown sample.
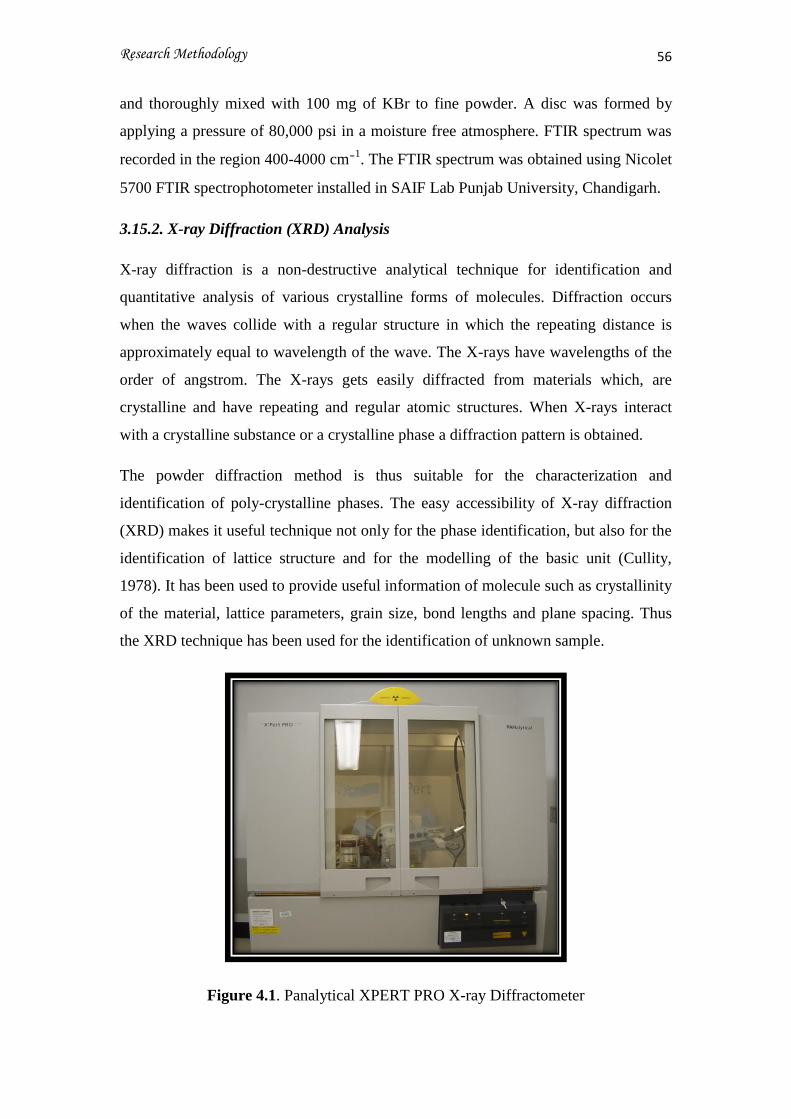
Figure 4.1. Panalytical XPERT PRO X-ray Diffractometer
Research Methodology
57
In a typical X-ray diffractometer, X-rays are generated within an evacuated tube and
exit through a window made of a light element e.g. beryllium. Inside the tube, a
current is passed through a tungsten filament to generate electrons. The electrons are
then accelerated through a potential difference towards a metal target, such as copper.
When the incoming electrons have sufficient energy to eject electrons from the K
shell of copper, a characteristic spectrum is formed. The characteristic spectrum
consists of discrete energy, which occurs due to X- rays emitted by transition of
electrons from K shell into L shell, gives rise to copper Kα peaks. The transition of
electron from the M shell gives Kβ peaks and the electrons from the N shell gives Kα
peaks. Kα and Kβ peaks are the most prominent in the peaks characteristic spectrum.
When the required parameters are met, the X-rays that get scattered from a crystalline
solid interfere constructively, and produce a diffracted beam of light.
The d spacing between diffraction planes is calculated using Bragg’s diffraction
formula (Humphreys, 2013)
. nλ =2d sinθ (2.6)
where λ = wavelength of X-ray, d = inter planar spacing, θ = diffraction angle and n
= 0, 1, 2, 3, etc.
Methodology
X-ray diffraction analysis was performed by using manganese filtered Cu Kα
radiation at 298 K was used. The instrument was equipped with graphite
monochromator and operated at 40 kV and 30 mA. The XRD instrument used was
Panalytical XPERT PRO X-Ray Diffractometer installed at SAIF lab, Panjab
University Chandigarh and Department of Physics, Himachal Pardesh University,
Shimla, India.
3.15.3. Thermogravimetric Analysis (TGA)
The thermal analysis technique has been used to determine the physical property of a
substance or its reaction products was measured as a function of temperature whilst
the substance is subjected to a controlled temperature program. TGA has been used to
determine the thermal stability, material characterization, compositional analysis,
simulation of industrial processes, kinetic studies and corrosion studies etc. It has
Research Methodology 58
commonly used to characteristics of materials such as polymers, composites for the
determination of degradation temperatures, absorbed moisture content of materials,
the level of inorganic and organic components in materials, decomposition points
of explosives and thermal stability of composites etc.
The thermal gravimetric analysis is used to study the change in the weight of samples
with variation in temperature in a controlled atmosphere. A derivative weight loss
curve identifies the temperature where weight loss is most prominent. If the
compounds in the mixture are known, then the percentage by mass can be determined
by taking the weight of what is left in the mixture and dividing it by the initial mass.
Knowing the mass of the original mixture and the total mass of impurities liberating
upon heating, the stoichiometric ratio can be used to calculate the percent mass of the
substance in a sample.
The analyzer usually consists of a high-precision balance with a pan (generally
platinum) loaded with the sample. A different process using a quartz crystal
microbalance has been devised for measuring smaller samples on the order of a
microgram (versus milligram with conventional TGA). The sample is placed in a
small electrically heated oven with a thermocouple to accurately measure the
temperature. The atmosphere may be purged with an inert gas to prevent oxidation or
other undesired reactions. A computer is used to control the instrument
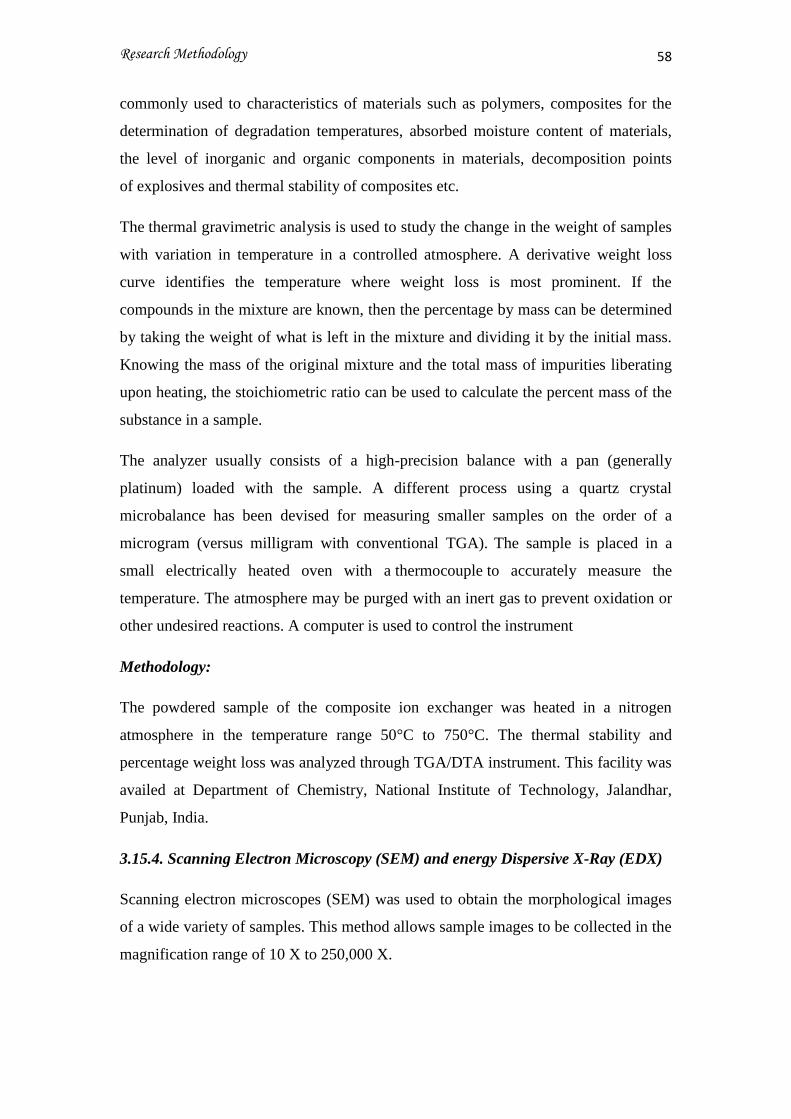
Methodology:
The powdered sample of the composite ion exchanger was heated in a nitrogen
atmosphere in the temperature range 50°C to 750°C. The thermal stability and
percentage weight loss was analyzed through TGA/DTA instrument. This facility was
availed at Department of Chemistry, National Institute of Technology, Jalandhar,
Punjab, India.
3.15.4. Scanning Electron Microscopy (SEM) and energy Dispersive X-Ray (EDX)
Scanning electron microscopes (SEM) was used to obtain the morphological images
of a wide variety of samples. This method allows sample images to be collected in the
magnification range of 10 X to 250,000 X.
Research Methodology
59
In SEM, a finely focused electron beam (generally 5-20 keV) is directed onto the
specific area under investigation in a high vacuum environment is used to form the
images. The interaction of the electron beam with the sample yield backscattered
(BSE) electrons, secondary electrons, X-rays with characteristic energies, or photons.
The emitted electrons and photons can be analyzed to determine the surface
morphology, and chemical composition using energy dispersive X-rays. A volume of
order of a cubic meter is required. The backscattered electrons (BSE) are the electrons
that interact with the sample and escape the specimen. These electrons therefore do
not lose most of the energy.
The secondary electrons are loosely bound outer shell electrons from the sample that
are ejected by inelastic collisions with the beam electrons. These electrons have
relatively low energy (less than 50 eV) and therefore have a surface escape
probability. The scattered electrons provide a lot of information about surface
morphology of the sample, and some are detected by detector. The secondary
electrons are accelerated by the detector and make them collide to a scintillator. The
photons are thus generated, detected by a photomultiplier.
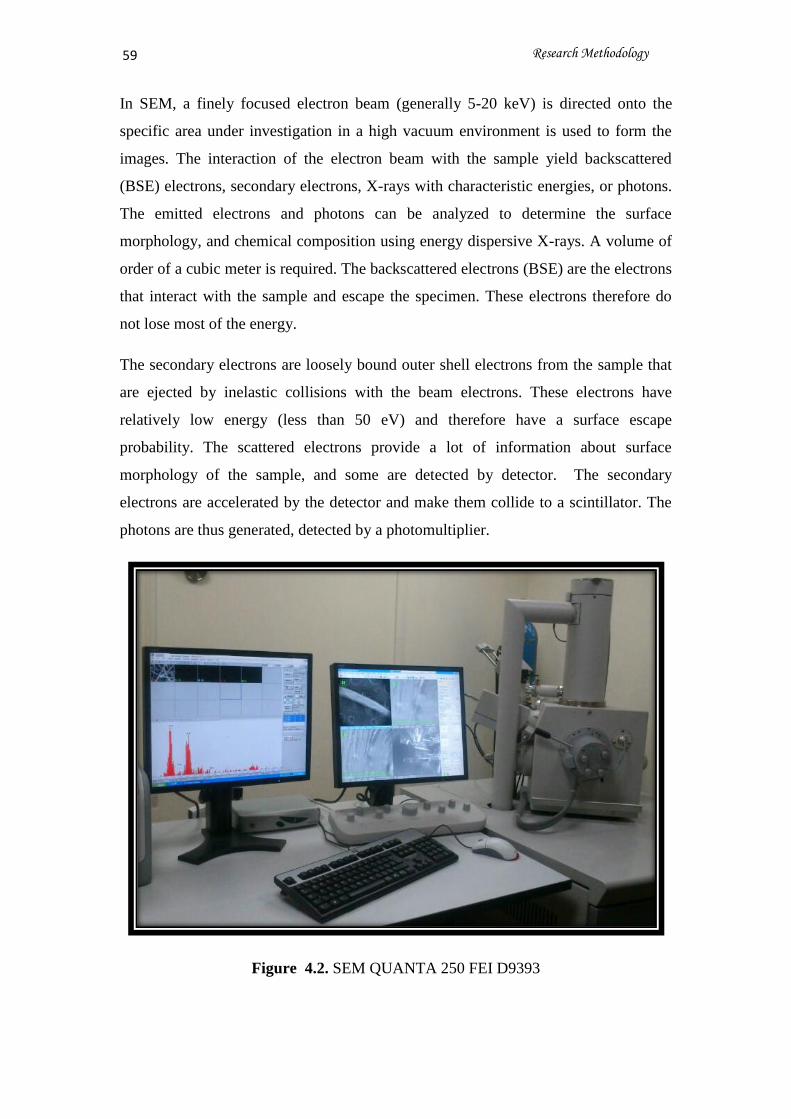
Figure 4.2. SEM QUANTA 250 FEI D9393
Research Methodology 60
The X-rays are produced by higher energy electrons transiting to the lower energy
shell left vacant by an ejected secondary electron. The energy released in this process
can be emitted in the form of X-rays, which are characteristic of the source atom.
These X-rays are detected by an energy-dispersive spectrometer (EDS), which is
composed of a liquid N2-cooled Si (Li) crystal. This crystal ejects a photoelectron on
exposure to X-ray. The energy of the photoelectron is given up in the form of charge
which is converted to a signal by a voltage converter. EDX analysis allows the
chemical identification of areas as small as a square micrometer and typically can
detect atoms that are up to a micron in depth.
Methodology
In the SEM analysis the nanocomposite ion exchangers was stocked over a holder and
gold-sputtered before examination. The samples were scanned at different
magnification. The elemental analysis was also done with the EDX equipped with
SEM. The SEM instrument used was QUANTA 250 FEI D9393 installed at Himachal
Pradesh University, Shimla, India.
3.15.5. Transmission Electron Microscopy (TEM):
Transmission electron microscopy or TEM is an electron based technique used to
study materials. The difference between SEM and TEM lies in the fact that latter uses
transmitted beam of electrons while former uses non-transmitted electrons as a basis
for image formation. A beam of electrons is transmitted through a thin sample and
detected on the other side. A heated pointed filament is used to produce electrons.
These electrons then pass through anode and into condenser lenses to vary the
electron beam spot size. After passing through scan coils, the electron beam is passed
through the sample and then to objective lens and aperture to eliminate highly
scattered electrons. The beam is enlarged by using a projector lens, which then strikes
on phosphor screen for viewing on photographic plate.
Research Methodology
61
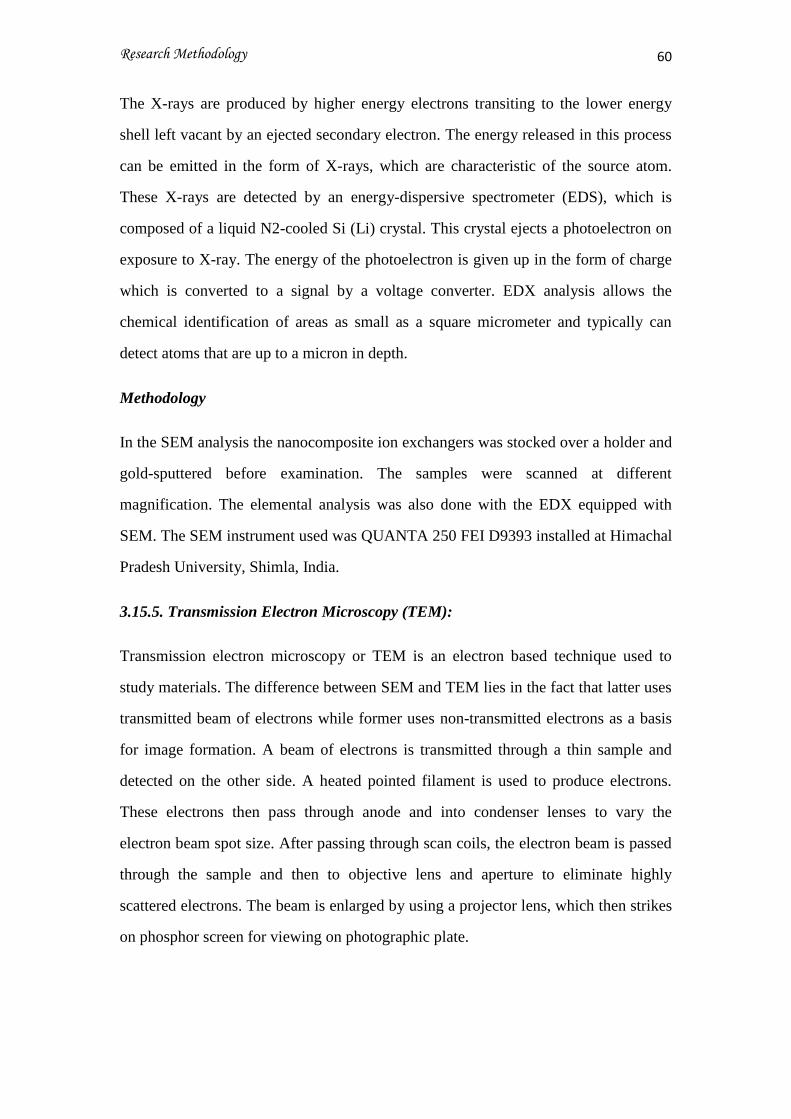
Figure 4.3. FEI Tecnai TEM F20
Electrons interact with matter very strongly. The dark areas of image represent the
regions where electrons are not transmitted, and the lighter areas which are
transparent to photographic film.
The TEM instruments are capable of processing images at higher resolutions than
other conventional light microscopes. The reason is the small de Broglie wavelength
of the electrons. TEM thus forms major analysis method in both physical and
biological sciences.
Methodology
In the TEM analysis, 0.01 mg of nanocomposite ion exchangers was added to
minimum quantity of ethanol to form fine suspension. The suspension was sonicated
in ultrasonic cleaner for 30 minutes. The drop of suspensions of nanocomposite was
placed onto a carbon copper grid and analyzed under FEI Tecnai F 20 transmission
electron microscopy. The same procedure has been repeated for all other synthesized
samples to determine the particle size.
3.16. Ultraviolet-visible spectroscopy (Band Gap Studies)
Research Methodology 62
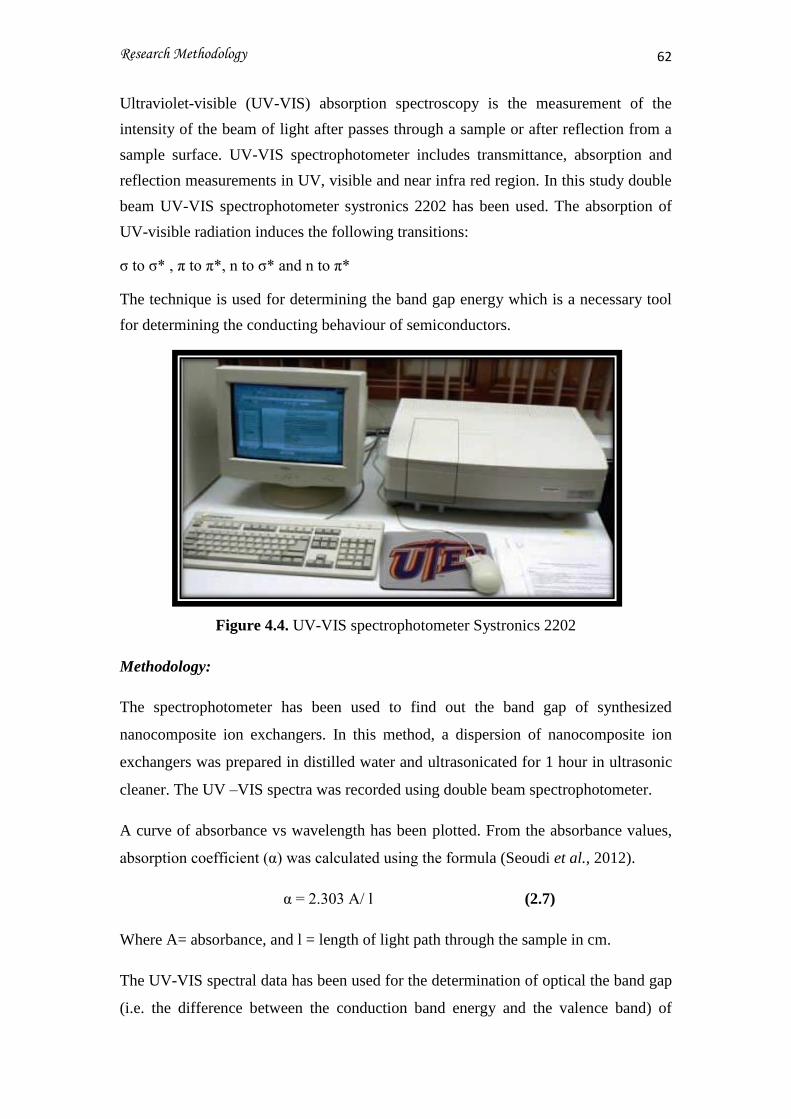
Ultraviolet-visible (UV-VIS) absorption spectroscopy is the measurement of the
intensity of the beam of light after passes through a sample or after reflection from a
sample surface. UV-VIS spectrophotometer includes transmittance, absorption and
reflection measurements in UV, visible and near infra red region. In this study double
beam UV-VIS spectrophotometer systronics 2202 has been used. The absorption of
UV-visible radiation induces the following transitions:
σ to σ* , π to π*, n to σ* and n to π*
The technique is used for determining the band gap energy which is a necessary tool
for determining the conducting behaviour of semiconductors.
Figure 4.4. UV-VIS spectrophotometer Systronics 2202
Methodology:
The spectrophotometer has been used to find out the band gap of synthesized
nanocomposite ion exchangers. In this method, a dispersion of nanocomposite ion
exchangers was prepared in distilled water and ultrasonicated for 1 hour in ultrasonic
cleaner. The UV –VIS spectra was recorded using double beam spectrophotometer.
A curve of absorbance vs wavelength has been plotted. From the absorbance values,
absorption coefficient (α) was calculated using the formula (Seoudi et al., 2012).
α = 2.303 A/ l (2.7)
Where A= absorbance, and l = length of light path through the sample in cm.
The UV-VIS spectral data has been used for the determination of optical the band gap
(i.e. the difference between the conduction band energy and the valence band) of
Research Methodology
63
various semiconductor metal oxide nanoparticles using the Tauc relation (Patil et al.,
2010; Dinesha et al., 2010).
αhν = A (hν- Eg)n (2.8)
where, α is the absorption coefficient and d is the thickness of the sample and Eg is
the energy band gap, n (1/2, 1, 2) is a constant dependent on the degree of transition,
n=1/2 for direct band gap semiconductors. hν is incident photon energy.
The band gap is then evaluated by plotting hν versus (αhν)2
and extrapolating the
tangent on the X-axis (Tauc Plots).
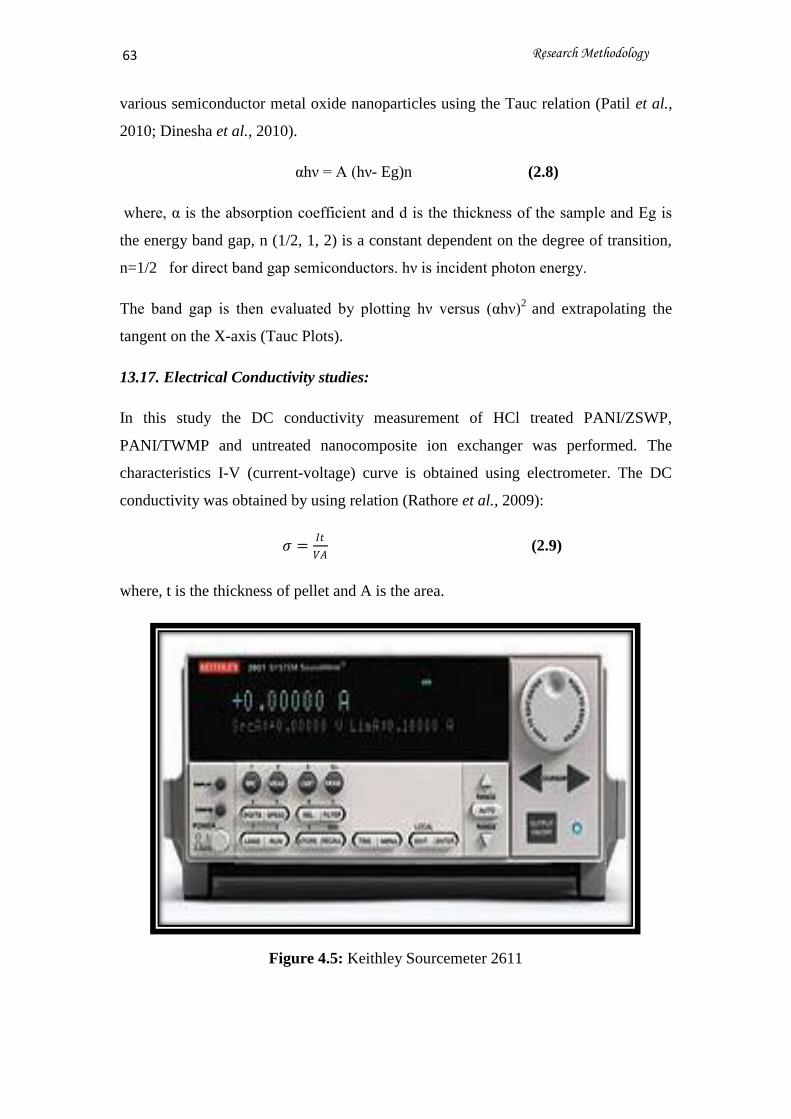
13.17. Electrical Conductivity studies:
In this study the DC conductivity measurement of HCl treated PANI/ZSWP,
PANI/TWMP and untreated nanocomposite ion exchanger was performed. The
characteristics I-V (current-voltage) curve is obtained using electrometer. The DC
conductivity was obtained by using relation (Rathore et al., 2009):
𝜎 =𝐼𝑡
𝑉𝐴 (2.9)
where, t is the thickness of pellet and A is the area.
Figure 4.5: Keithley Sourcemeter 2611
Research Methodology 64
Methodology:
The nanocomposite ion exchangers were treated with 1 M HCl. Then nanocomposite
ion exchangers were mixed with PVA (Poly vinyl alcohol) as binder and pressed
uniaxially to form pellets by applying a high pressure of 25 KN for 15 minutes. The
pellets formed were of 1-2 mm thickness and 8 mm in diameter. Fine quality silver
paint was applied on both sides of pellet for good electrical contacts. Then the
electrical conductivity measurements were carried out by four probe method using
Keithley source meter.
The variation of DC conductivity with temperature was studied with help of
temperature control attached to Keithley source meter. Conductivity was measured
with temperature in 300-473K range during heating cycle using a temperature
controller.
13.18. Antimicrobial studies
The antimicrobial activities of synthesized nanocomposite ion exchangers were
studied by growth curve method (optical density method) against two bacteria namely
Escherichia coli and Staphylococcus aureus.
Methodology of antibacterial susceptibility testing:
The antimicrobial activity of nanocomposite ion exchangers was determined using
optical density method. The strains of Staphylococcus aureus and Escherichia coli
were collected from the Department of Microbiology, Post Graduate Institute of
Research and Development, Chandigarh (PGI), India. Reference strains of S. aureus
(MTCC 737), E. coli (MTCC 739) was obtained from IMTech Chandigarh, India.
In this method, colony of E. coli was picked from the overnight nutrient agar plate
culture and inoculated into 10 mL nutrient broth (NB). It was then incubated at 37°C
under shaking condition of 100 rpm for 24 hrs. The culture was diluted to 10-5
CFU/mL (colony forming unit per mL) with NB according to MacFarland standard
(Sadiq et al., 2005). 5mL of the diluted culture was pipette out into conical flasks
containing 95 mL NB. The different concentrations of nanocomposite ion exchangers
were added into the flasks. The flasks were then incubated in an incubator shaker at
100 rpm and 37°C for 24 hrs. The high rotation was done to minimize aggregation

Research Methodology
65
and settlement of the nanocomposite ion exchangers during the incubation period. The
positive control was also studied which shows the growth of bacteria in the absence of
nanocomposite ion exchangers. After every hour each sample was analyzed for
optical density using spectrophotometer at 620 nm. The antibacterial activity of
various synthesized nanocomposite ion exchangers was also studied against S. aureus
in similar manner. The optical density (O.D) was plotted against time of incubation
(Rizwan et al., 2010; Williams et al., 2006).


![Semantic Texture for Robust Dense Trackingjc8515/pubs/semantic_texture.pdf · pitch [rad] 0.2 0.1 0.0 0.1 0.2 yaw [rad] 0.2 0.1 0.0 0.1 0.2 5000 10000 15000 20000 25000 Figure 1](https://img.pdfslide.us/doc/110x75/5fbdd04c8e5fb64df2490e3f/semantic-texture-for-robust-dense-jc8515pubssemantictexturepdf-pitch-rad.jpg)