Embed Size (px)
Citation preview
PhiliPPineS environment monitor 2005
21
3. Coastal and Marine resourCes under Pressure
The. main. pressures. affecting. Philippine.coastal. and. marine. areas. are. agriculture. and.forestry. activities,. urban. and. industrial.development,. tourism.development,.oil.and.gas.exploration,. minerals. and. mining,. population.growth. and. fish. consumption,. and. climate.change.. This. chapter. explores. each. of. these.issues,. including. their. social,. political,. and.economic.context..
agriculture and forestry.. The. early. onset. of.industrial. logging. in. the. Philippines—.combined. with. a. lack. of. proper. forest.management—has. resulted. in. the. loss. of.nearly. 80. percent. of. the. Philippines’. original.forest. cover.. In. 1990,. 10.6. million. hectares.were. classified. as. forest;. by. 2005,. the. total.had. declined. to. 7.2. million. hectares,. or.a. loss. of. 3.4. million. hectares. (FAO. 2005).. Over.the. past. 15. years,. the. average. annual. forest.loss. was. equivalent. to. almost. 227,000. hectares.per. year.. Forest. loss. combined. with. poor. land.management. and. unsustainable. farming.practices. lead. to. soil. erosion. and. increased.flooding,. resulting. in. higher. costs. of.infrastructure. maintenance,. as. well. as. higher.risks. to. lives,. property,. and. productivity..Soil. erosion. reduces. light,. smothers. marine.organisms,. and. prevents. the. recruitment. and.recovery.of.areas.that.have.been.silted.over..
Agricultural. runoff. is. a. growing. source. of.pollution. in. bays. and. near-shore. waters.. The.surface.runoff.consists.of.residues.from.livestock.and. poultry,. fertilizer. and. pesticides,. and.decaying.plant.matter.
urban and industrial development.. Almost. all.near-shore.ecosystems.within.or.near.urbanized.areas. in. the. Philippines. are. threatened. by.organic. pollution—that. is,. nutrients. from.industrial,.commercial,.and.domestic.wastewater.carrying. organic. wastes. and. fertilizer. residue..nutrients.enhance.the.growth.of.algae.(including.those.that.cause.red.tides).and.bacteria,.which.in.
turn.reduces. light.and.oxygen,.resulting. in. fish.kills..Red.tide.has.become.a.yearly.occurrence.in.some.coastal.areas.of.the.country.
Sewerage. infrastructure. is. inadequate. or.nonexistent.. Centralized. sewerage. collection.and. treatment. facilities. cover. only. parts. of.Metro. Manila,. while. Metro. Cebu. and. Metro.Davao have no centralized sewerage systems.at. all.. Many. areas. have. septic. tanks. that. often.do.not.have.seepage.or.leaching.devices.and.are.not. maintained,. thus. making. them. often.inefficient. and. ineffective. in. reducing. nutrient.pollution.. The. expansion. of. domestic. water.supply. systems. in. major. coastal. cities. is. also.increasing.the.volume.of.wastewater.
Each. year,. nearly. 2.2. million. tons. of. organic.pollution.are.produced.by.domestic.(48.percent),.agricultural. (37. percent),. and. industrial. (15.percent). sectors. (World. Bank. 2003).. The.industrial. sector. accounts. for. most,. if. not. all,.of. the. toxic. and. hazardous. waste. discharged.into. water. bodies,. a. finding. confirmed. by.studies. carried. out. by. the. Environmental. and.natural.Resources.Accounting.Project.(EnRAP)..
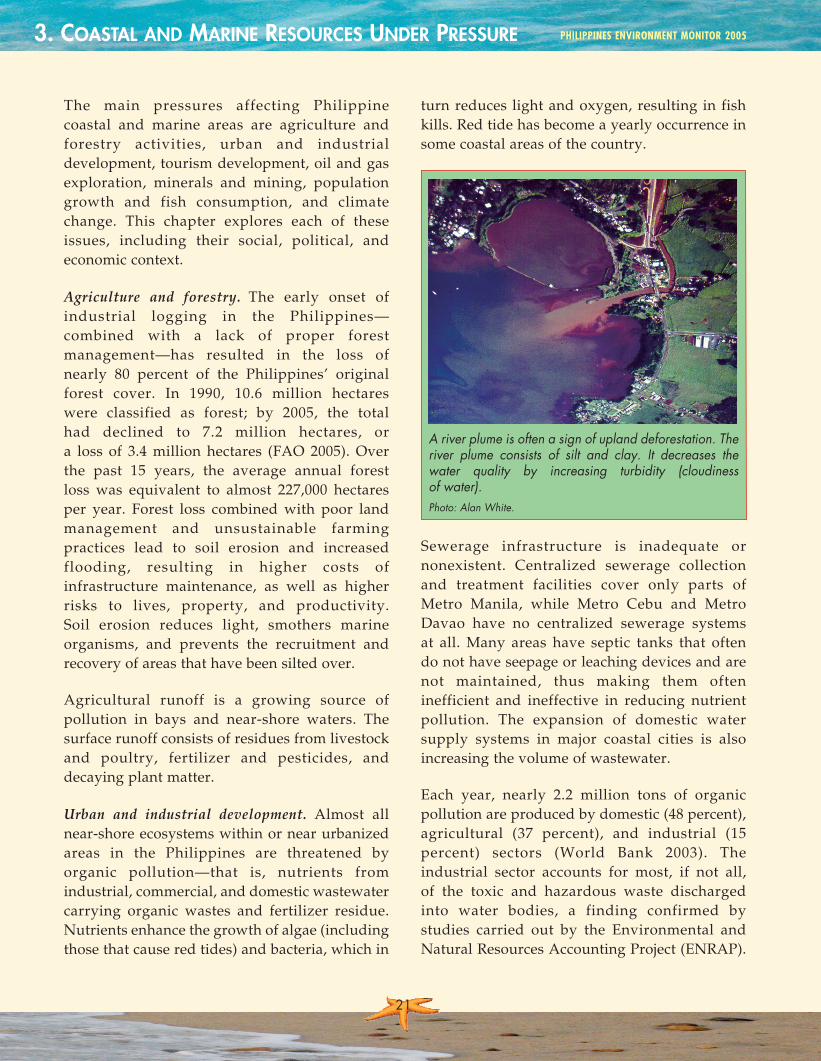
A river plume is often a sign of upland deforestation. The river plume consists of silt and clay. It decreases the water quality by increasing turbidity (cloudiness of water). Photo: Alan White.
PEMFinal.indb 21 10/08/2006 07:32:21
2222
The.main.substances.are.mercury.(Hg),.chromium.(Cr),. sulfides,. phenols,. phosphorus. pentoxide,.and.fluoride..
Tourism development.. Coastal. tourism. has.contributed. to. the. pollution. of. coastal. areas..Pollution. from. this. sector. is. usually. lumped.under. the. household. sector,. as. the. generated.waste.is.domestic.
Waste. from. tourism. activities. also. primarily.affects. the. business. itself.. A. concrete. example.of. this. is. Boracay. where,. for. a. time,. the.number.of. tourists.dwindled.as.a.result.of.high.coliform. counts. from. its. beaches.. Most. coastal.resorts. are. still. poorly. planned. in. terms. of.environmental. protection.. The. larger. resorts.have.only.recently.begun.to.implement.stringent.environmental. practices. on. their. properties.(Hütcche.et.al..2002)..In.many.cases,.the.building.
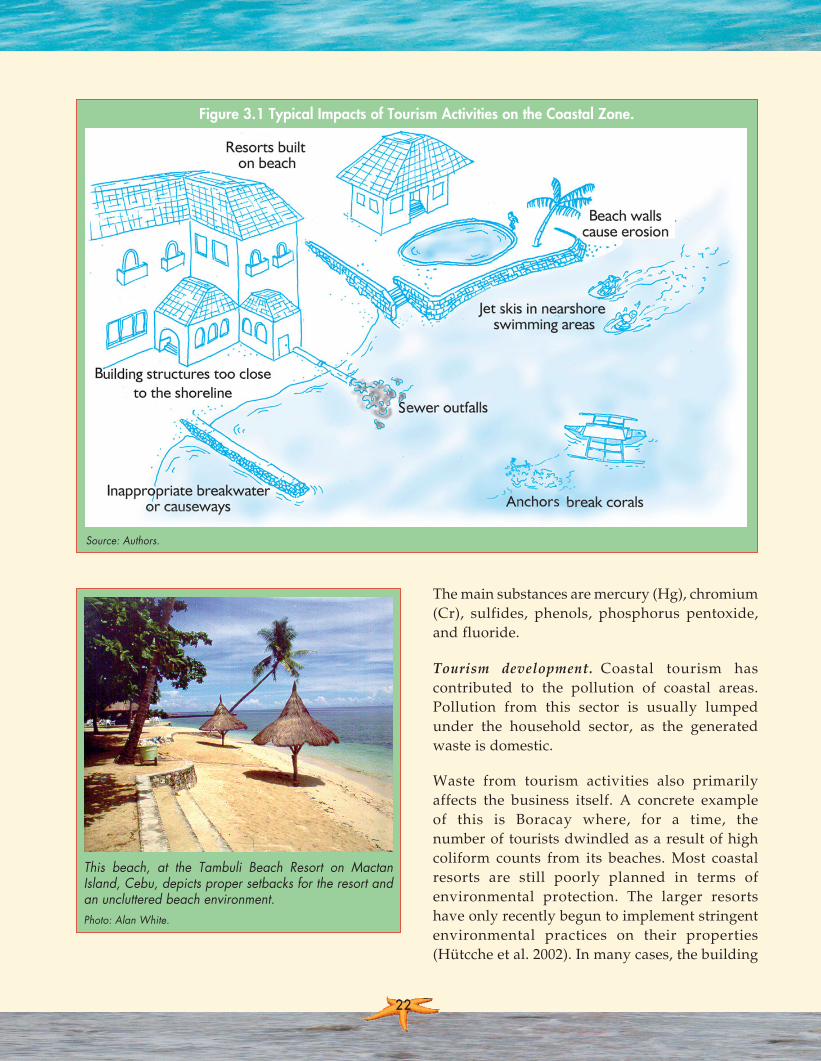
Source: Authors.
Figure 3.1 Typical Impacts of Tourism Activities on the Coastal Zone.
This beach, at the Tambuli Beach Resort on Mactan Island, Cebu, depicts proper setbacks for the resort and an uncluttered beach environment.Photo: Alan White.
PEMFinal.indb 22 10/08/2006 07:32:24
PhiliPPineS environment monitor 2005PhiliPPineS environment monitor 2005
2323
setback.and.waste.management. regulations.are.not. being. followed. and. deterioration. in. beach.quality.quickly.ensues..
Figure.3.1.shows.some.of.the.most.common.impacts.from.tourism.activities.on.the.coastal.zone.
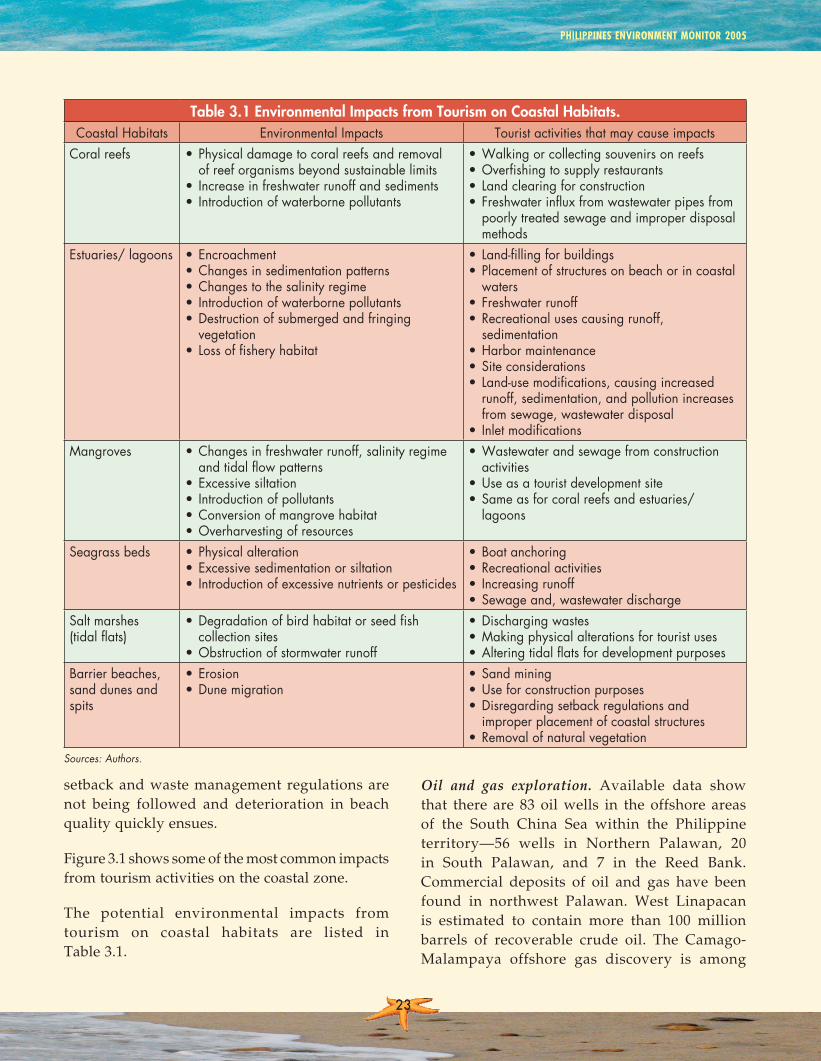
The. potential. environmental. impacts. from.tourism. on. coastal. habitats. are. listed. in.Table.3.1.
Table 3.1 Environmental Impacts from Tourism on Coastal Habitats.Coastal Habitats Environmental Impacts Tourist activities that may cause impacts
Coral reefs • Physical damage to coral reefs and removal of reef organisms beyond sustainable limits
• Increase in freshwater runoff and sediments• Introduction of waterborne pollutants
• Walking or collecting souvenirs on reefs• Overfishing to supply restaurants• Land clearing for construction• Freshwater influx from wastewater pipes from
poorly treated sewage and improper disposal methods
Estuaries/ lagoons • Encroachment• Changes in sedimentation patterns• Changes to the salinity regime• Introduction of waterborne pollutants• Destruction of submerged and fringing
vegetation• Loss of fishery habitat
• Land-filling for buildings• Placement of structures on beach or in coastal
waters• Freshwater runoff• Recreational uses causing runoff,
sedimentation • Harbor maintenance• Site considerations• Land-use modifications, causing increased
runoff, sedimentation, and pollution increases from sewage, wastewater disposal
• Inlet modificationsMangroves • Changes in freshwater runoff, salinity regime
and tidal flow patterns• Excessive siltation• Introduction of pollutants • Conversion of mangrove habitat • Overharvesting of resources
• Wastewater and sewage from construction activities
• Use as a tourist development site• Same as for coral reefs and estuaries/
lagoons
Seagrass beds • Physical alteration• Excessive sedimentation or siltation• Introduction of excessive nutrients or pesticides
• Boat anchoring• Recreational activities• Increasing runoff• Sewage and, wastewater discharge
Salt marshes (tidal flats)
• Degradation of bird habitat or seed fish collection sites
• Obstruction of stormwater runoff
• Discharging wastes• Making physical alterations for tourist uses• Altering tidal flats for development purposes
Barrier beaches, sand dunes and spits
• Erosion• Dune migration
• Sand mining• Use for construction purposes• Disregarding setback regulations and
improper placement of coastal structures• Removal of natural vegetation
Sources: Authors.
oil and gas exploration.. Available. data. show.that. there. are. 83. oil. wells. in. the. offshore. areas.of. the. South. China. Sea. within. the. Philippine.territory—56. wells. in. northern. Palawan,. 20.in. South. Palawan,. and. 7. in. the. Reed. Bank..Commercial. deposits. of. oil. and. gas. have. been.found. in. northwest. Palawan.. West. Linapacan.is. estimated. to. contain. more. than. 100. million.barrels. of. recoverable. crude. oil.. The. Camago-Malampaya. offshore. gas. discovery. is. among.
PEMFinal.indb 23 10/08/2006 07:32:26
2424
the. major. natural. gas. deposits. of. the. country,.estimated. to.contain.2.5. to.3.2. trillion.cubic. feet.of. recoverable. gas. (Balce. and. Pablico. 1997)..This. discovery. of. offshore. commercial. natural.gas. resources. provided. the. impetus. for. the.development.of.the.Philippine.gas.industry.
Other. offshore. gas. deposits. have. been.discovered.in.the.Reed.Bank.and.South.Palawan..DangerousGroundsandSpratlyIslands,whichare. claimed. in. part. by. other. nations. as. well. as.the.Philippines,.share.a.common.geology.as.the.Reed.Band.and.north.Palawan,.suggesting.that.potentially. large. petroleum. reserves. may. also.be.found.in.these.areas.
Another. major. site. for. oil. and. gas. exploration.activities.in.the.last.three.decades.is.the.Western.Sulu.basin..This. is.a.“frontier”. (underexplored).region. with. comparatively. low. drilling. density.(11.wells.within.Philippine.territorial.waters;.10.wells.offshore.Sabah.since.1970)..
The. main. environmental. impacts. of. oil. and.gas. include.operational.wastes,.such.as.drilling.fluids. and. drilling. muds;. drainage;. leaks. from.offshore.pipelines;.and.oil.spills..noise.and.other.kinds. of. disturbance. from. offshore. oil. and. gas.operations.may.also.affect.marine.mammals.
Minerals and mining.. Sand. and. gravel. mining.is. a. common. activity. in. coastal. areas.. In. many.cases,. it. leads. to. increased. coastal. erosion..Land-based. mining. can. cause. significant.environmental. impacts,. many. of. which. are.harmful.to.human.health..Mine.tailings.disposal.has. often. been. indiscriminate.. Some. tailings.have.found.their.way.into.coastal.waters..Improper.impoundment. of. wastes. and. tailings. may. lead.to. disastrous. accidents,. such. as. the. case. of.massive. toxic. spills. from. Marcopper. in.Marinduque.. It. was. estimated. that. the. amount.of. lost. income. due. to. the. accident,. and. from.coastal. fishing. alone,. was. PhP. 9.2. million. in.1996.(Box.3.1).(Bennagen.1998).
Box 3.1 Decades of Mining Destroyedan Island Paradise.
Marcopper began mining copper on Marinduque Island in the Philippines four decades ago. It dumped millions of tons of toxic mining waste into Marinduque’s coastal waters and polluted its rivers. As a result, local inhabitants have lost their health, livelihoods and some even their lives. After a major accident in 1996, the Philippine Government closed down the mine.
Recent field investigations and a scientific survey funded by Oxfam Australia’s Mining Ombudsman revealed that—almost a decade after the mine has been closed—a main river is still polluted from the continuous runoff from the mine and old tailings left behind. The high acid and metal levels in the river are a hazard to humans and aquatic life. Local health is strongly affected by skin diseases, which local people blame on toxic mine waste. Fishermen have lost limbs, which they believe is the result of arsenic contamination. Stomach complaints, dementia, and cancer are also common. Local inhabitants have received little or no rehabilitation of their environment, nor any payment of compensation.
Michael (only legs shown) and Jay. Michael has skin problems, which local people blame on the mine waste pumped into Calancan Bay.Photo: David Sproule/Oxfam Australia.
Source: Adapted from full case study, which is available at: http://www.oxfam.org.au.
PEMFinal.indb 24 10/08/2006 07:32:28
PhiliPPineS environment monitor 2005PhiliPPineS environment monitor 2005
2525
While. the. exploitation. of. land-based. metallic.and. nonmetallic. mineral. deposits. is. a. major.contributor. to. the. country’s. economy,. the.potential.of.mining.marine.mineral.resources. in.Philippine. offshore. areas. has. received. little.attention.. As. technological. advances. in. ocean.mining. develop,. ocean. floor. minerals. will.probably.be.explored.as.possible.alternative.sites.for. future. mineral. exploitation.. Polymetallic.sulfides. and. manganese. deposits. are. among.the. potential. mineral. resources. from. the. ocean.floor.. Based. on. knowledge. of. tectonic.environments. favorable. to. the. formation,.accumulation,. and. preservation. of. polymetallic.sulfides,. the. marginal. basins. around. the.Philippines. are. promising. exploration. grounds.(Yumul 1993). Sulfide deposits contain copper,lead,. zinc,. silver,. gold,. and. possibly. other.alloys.. The. Scarborough. Seamount. Chain.Plateau.offshore.of.northeastern.Luzon,.and.the.Cagayan. de. Sulu. Ridge. in. the. Sulu. Basin,. are.likely. sites. for. these. sulfide. deposits.. For.manganese. nodules,. only. the. West. Philippine.Basin.appears.to.be.a.good.target.site..
The. potential. environmental. impacts. of.marine. mining. include. pollution. from. waste.and. mine. tailings,. increased. water. turbidity.(cloudiness.in.water),.and.debris.and.sediments.that. may. have. an. effect. on. local. marine. life..Removal. of. sand. from. the. sea. floor. can. cause.severe.erosion.and. loss.of.marine.habitat;. such.alterations. may. also. cause. a. change. in. wave.regime. that. could. affect. coastal. erosion.. noise.and.other.kinds.of.disturbances.from.operations.may.also.affect.marine.mammals.
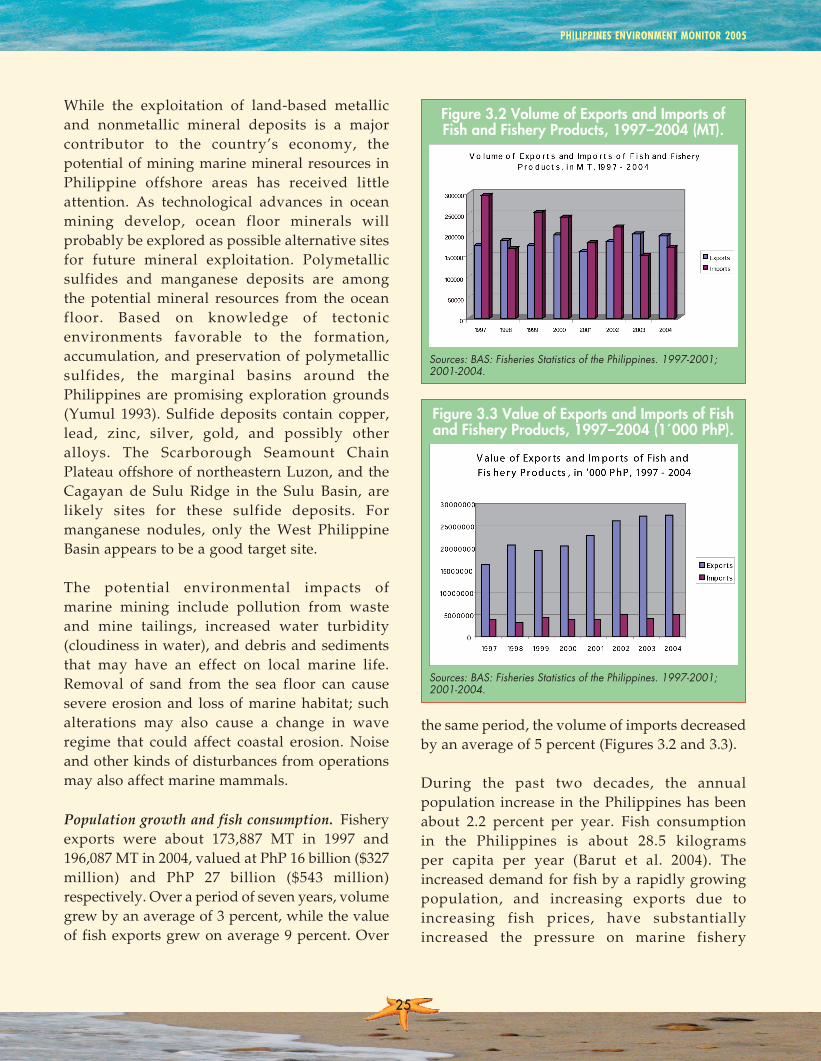
Population growth and fish consumption.. Fishery.exports. were. about. 173,887. MT. in. 1997. and.196,087.MT.in.2004,.valued.at.PhP.16.billion.($327.million). and. PhP. 27. billion. ($543. million).respectively..Over.a.period.of.seven.years,.volume.grew.by.an.average.of.3.percent,.while.the.value.of. fish.exports.grew.on.average.9.percent..Over.
the.same.period,.the.volume.of.imports.decreased.by.an.average.of.5.percent.(Figures.3.2.and.3.3).
During the past two decades, the annual.population. increase. in. the.Philippines.has.been.about. 2.2. percent. per. year.. Fish. consumption.in. the. Philippines. is. about. 28.5. kilograms.per. capita. per. year. (Barut. et. al.. 2004).. The.increased.demand.for.fish.by.a.rapidly.growing.population,. and. increasing. exports. due. to.increasing. fish. prices,. have. substantially.increased. the. pressure. on. marine. fishery.
Sources: BAS: Fisheries Statistics of the Philippines. 1997-2001; 2001-2004.
Figure 3.2 Volume of Exports and Imports of Fish and Fishery Products, 1997–2004 (MT).
Sources: BAS: Fisheries Statistics of the Philippines. 1997-2001; 2001-2004.
Figure 3.3 Value of Exports and Imports of Fish and Fishery Products, 1997–2004 (1´000 PhP).
PEMFinal.indb 25 10/08/2006 07:32:30
2626
resources. over. the. past. two. decades.. Table. 3.2.illustrates. a. projection,. which. assumes. that.average. fish. consumption. continues. to. be. 28.5.kilograms.per.capita.per.year.
Without. any. change. in. fish. consumption. and.no. active. human. population. management.program,. domestic. demand. for. fish. will. reach.3.2. billion. kilograms. (3.2. million. MT). by. 2020,.given. the. projected. population. growth. rate. of.the.country..
If. increased. demand. is. met. solely. by. marine.capture. fisheries,. such. increased. pressure. on.the. fisheries. sector. could. lead. to. an. eventual.collapse.of.fisheries.and.the.fishing.industry.
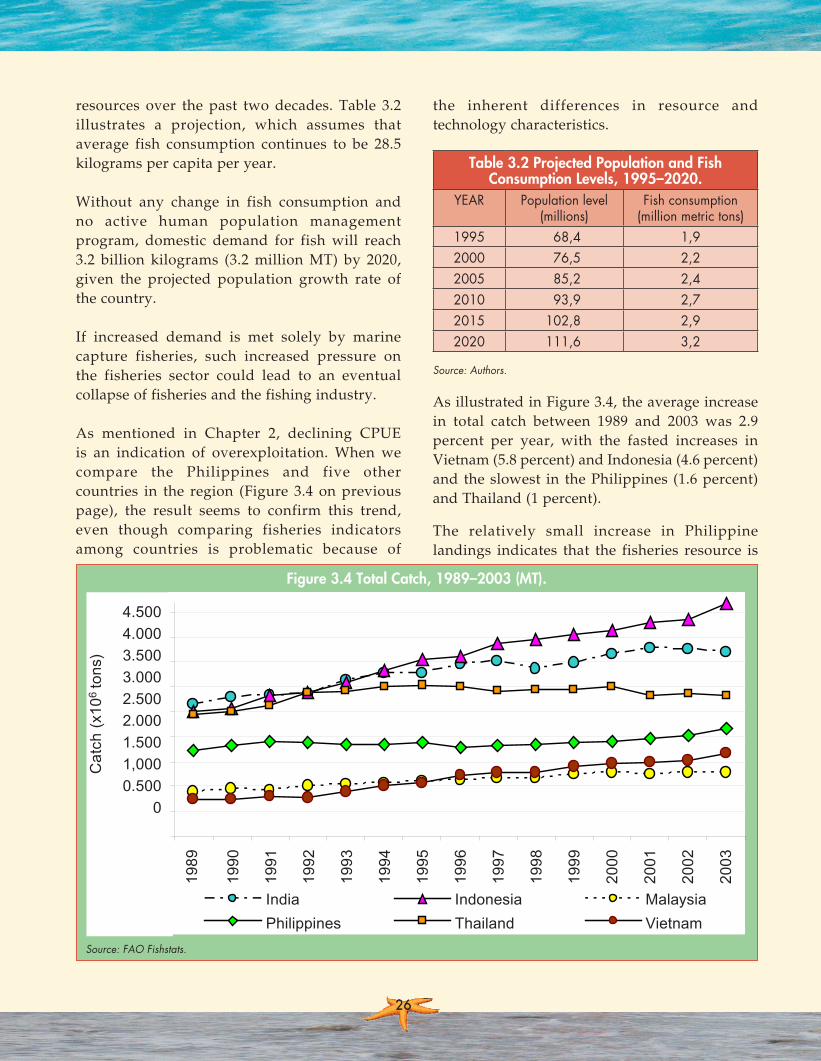
As. mentioned. in. Chapter. 2,. declining. CPUE.is. an. indication. of. overexploitation.. When. we.compare. the. Philippines. and. five. other.countries. in. the. region. (Figure. 3.4. on. previous.page),. the. result. seems. to. confirm. this. trend,.even. though. comparing. fisheries. indicators.among. countries. is. problematic. because. of.
the. inherent. differences. in. resource. and.technology.characteristics.
Table 3.2 Projected Population and Fish Consumption Levels, 1995–2020.
YEAR Population level (millions)
Fish consumption (million metric tons)
1995 68,4 1,92000 76,5 2,22005 85,2 2,42010 93,9 2,72015 102,8 2,92020 111,6 3,2
Source: Authors.
As.illustrated.in.Figure.3.4,.the.average.increase.in. total. catch. between. 1989. and. 2003. was. 2.9.percent. per. year,. with. the. fasted. increases. in.vietnam.(5.8.percent).and.Indonesia.(4.6.percent).and. the.slowest. in. the.Philippines. (1.6.percent).and.Thailand.(1.percent).
The. relatively. small. increase. in. Philippine.landings. indicates. that. the. fisheries. resource. is.
Source: FAO Fishstats.
Figure 3.4 Total Catch, 1989–2003 (MT).
0
500,000
1,000,0001,500,000
2,000,000
2,500,000
3,000,000
3,500,0004,000,000
4,500,000
1989
1990
1991
1992
1993
1994
1995
1996
1997
1998
1999
2000
2001
2002
2003
Cat
ch (t
ons)
India Indones ia Malays iaPhilippines Thailand V ietnam
4.5004.0003.5003.0002.5002.0001.5001,0000.500
0
Cat
ch (
x106
tons
)
1989
1990
1991
1992
1993
1994
1995
1996
1997
1998
1999
2000
2001
2002
2003
India
Philippines
Indonesia
Thailand
Malaysia
Vietnam
PEMFinal.indb 26 10/08/2006 07:32:33

PhiliPPineS environment monitor 2005PhiliPPineS environment monitor 2005
2727
more. heavily. exploited. than. elsewhere.. An.analysis.of.mullet,.grouper,.and.bream.landings.(the.part.of.the.fish.catch.that.is.brought.ashore).is. particularly. worrying.. Figure. 3.5. illustrates.the. change. in. landings. of. these. fish,. which.represent. important. target. species.over. the. last.three.decades.
Because. marine. capture. fisheries. are. over-exploited,. the. growing. demand. for. fish.will. eventually. have. to. be. met. by. an. increase.in. aquaculture. production.. Costs. to. the.environment,. however,. will. have. to. be. taken.into.account..Environmentally.friendly.aquaculture.is.possible.with.adequate.planning,. investment,.and. consideration. of. potential. impacts. and.mitigation.on.vulnerable.coastal.mangrove.and.reef.ecosystems..
Climate change.. The. Intergovernmental. Panel.on. Climate. Change. (IPCC). has. concluded. that.(a).atmospheric.greenhouse.gases.have.increased;.(b). the.average.surface.temperature.of. the.earth.has. increased. since. 1861. by. about. 0.6. degrees.Celsius;. (c). global. average. sea. level. have. risen.between.0.1.and.0.2.meters;.and.(d). rainfall.has.increased. by. 0.2. to. 0.3. percent. per. decade. over.the.tropical.land.areas..
Potential. impacts. of. climate. change. on. coastal.areas.are.summarized.in.Box.3.2.
The. potential. influence. of. climate. change. and.sea-level. rise. on. Philippine. coastal. areas. and.resources. is. only. now. beginning. to. be. studied..nevertheless,. based. on. measurements. over. the.last. 100. years. and. various. projected. global.scenarios,. fairly. good. inferences. can. be. made.about. the. possible. impact. of. such. changes. on.Philippine.coasts.over.the.next.50.to.100.years.
Temperatures.seem.to.be.rising.slightly.all.over.the. Philippines. and. in. the. surrounding. coastal.waters..The.1990s.were.the.warmest.decade.in.the.last.century,.and.1998.was.the.warmest.year.on.record. in. the. Philippines.. That. year. coincided.with.the.most.extensive.coral.bleaching.episode.ever.observed.on.Philippine.coral.reefs;.about.15.to.20.percent.of.the.country’s. living.corals.were.killed..Average.air.temperature.in.the.Philippines.has.risen.by.about.0.5.degrees.Celsius.since.1980..This. warming. has. been. accompanied. by. a. 6.percent.average.decline.in.annual.rainfall.over.the.last.century..This.drying.occurs.primarily.during.theDecembertoFebruaryseason(WWF1999).
Sea. level. is. monitored. at. Manila. and. Legaspi..Time.series.show.a.small.rise.in.relative.sea.level.
Note: Figure shows average landings between 1970–1975 and 1998–2003; Benchmark is composite, Mullet (Indonesia, Malaysia, Thailand), Grouper (Indonesia, Malaysia), Bream (Indonesia, Malaysia, Thailand).
Source: FAO Fishstats.
Figure 3.5 Change in Landings, Philippines vs. Benchmark, 1970-2003.
0
100
200
300
400
500
600
Mullet Grouper B ream
Chan
ge in
land
ing
quan
tity
(%) P hilippines
B enchmark
The density of fish traps in parts of Manila Bay is a lot higher than the fish remaining.Photo: Alan White.
PEMFinal.indb 27 10/08/2006 07:32:36
2828
before. the. 1960s,. and. a. more. rapid. increase. of.between.20.(Legaspi).and.40.centimeters.(Manila).up.to.the.present.day..Other.measures.of.relative.sea.level,.using.localized.tide.gauges.in.Cebu.and.Jolo,.indicate.a.relative.fall.in.sea.level.at.rates.of.a.few.millimeters.per.year,.but.the.tide.gauge.in.Manila.Bay.again.registers.a.rise. in.relative.sea.level.of.2.centimeters.per.year.between.1963.and.1980..In.the.adjacent.delta.region,.an.average.of.3.centimeters.per.year.was.documented.on.the.basis.of. the.emergence.of.groundwater. in.well.pipes.and.tidal.flooding..Most.of.this.relative.change.in.sea. level. is. due. to. excessive. land. reclamation,.groundwater.withdrawal,.and.possible.subsidence.
Box 3.2 Potential Impacts of Climate Change and Sea-Level Rise on Coastal Systems.
Climate change and a rise in sea-level can have a number of biophysical and related socio-economic impacts on the Philippines. Potential biophysical impacts: • Increased coastal erosion. • Inhibition of primary production processes. • More extensive coastal inundation. • Higher storm-surge flooding. • Landward intrusion of seawater in estuaries
and aquifers. • Changes in surface water quality and
groundwater characteristics. • Changes in the distribution of pathogenic
microorganisms.• Higher sea-surface temperature.
Potential socio-economic impacts:• Increased loss of property and coastal habitats.• Increased flood risk and potential loss of life.• Damage to coastal protection works and other
infrastructure.• Increased disease risk.• Loss of renewable and subsistence resources.• Loss of tourism, recreation, and transportation
functions.• Impacts on agriculture and aquaculture through
decline in soil and water quality.
Source: IPCC Third Assessment Report, 2001.
at.the.monitoring.sites.monitoring,.but.nonetheless.a. small. residual. rise. in. sea. level. along. the.Philippine.coast.remains.that.may.be.due.to.global.change.and.ocean.warming.1.
1. The.IPCC.Third.Assessment.Report.states:.“sea-level.rise.is. regarded.as.one.of. the.more.certain.outcomes.of.global.warming.and.already.is.taking.place..Over.the.past.100.years,.global.sea. level.has.risen.by.an.average.of.1-2.millimeters.per.year,.and.scientists.anticipate.that.this.rate.will.accelerate.during.the.next.few.decades.and.into.the.22nd.century.”
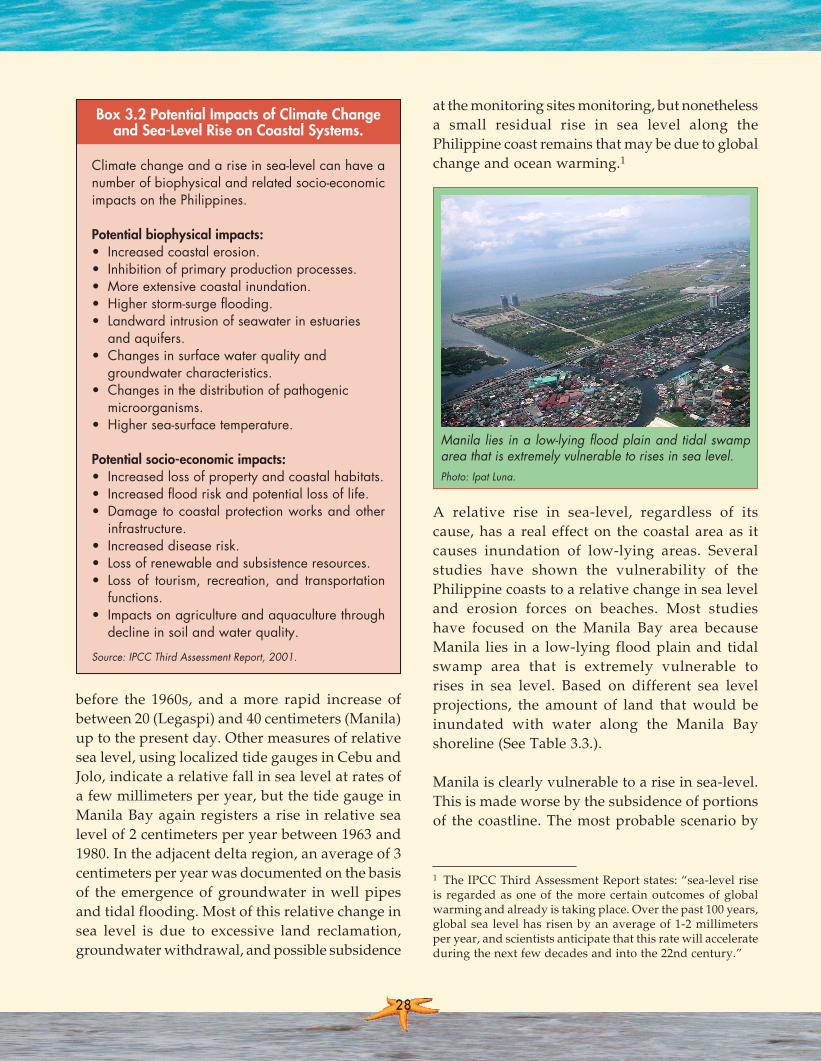
A. relative. rise. in. sea-level,. regardless. of. its.cause,.has.a. real. effect.on. the. coastal. area.as. it.causes. inundation. of. low-lying. areas.. Several.studies. have. shown. the. vulnerability. of. the.Philippine.coasts.to.a.relative.change.in.sea.level.and. erosion. forces. on. beaches.. Most. studies.have. focused. on. the. Manila. Bay. area. because.Manila. lies. in.a. low-lying. flood.plain.and. tidal.swamp. area. that. is. extremely. vulnerable. to.rises. in. sea. level.. Based. on. different. sea. level.projections,. the. amount. of. land. that. would. be.inundated. with. water. along. the. Manila. Bay.shoreline.(See.Table.3.3.).
Manila.is.clearly.vulnerable.to.a.rise.in.sea-level..This.is.made.worse.by.the.subsidence.of.portions.of. the.coastline..The.most.probable.scenario.by.
Manila lies in a low-lying flood plain and tidal swamp area that is extremely vulnerable to rises in sea level.Photo: Ipat Luna.
PEMFinal.indb 28 10/08/2006 07:32:39
PhiliPPineS environment monitor 2005PhiliPPineS environment monitor 2005
2929
2100. of. a. 1-meter. rise. in. sea. level. would. affect.approximately. 2.3. million. people. living. in. the.coastal. area. in. Manila. (based. on. population.projections.for.2025).
Table 3.3 Endangered Area of Land along the Manila Bay Coast in Different Projected Sea-Level
Rise Scenarios for 2100.Sea level rise scenario
(meter)Area to be inundated
(hectares)0.3 20901.0 55552.0 8905
Source: Perez et al. 1999.
The. vulnerability. of. other. coastal. areas. of. the.Philippines.will.depend.on.the.actual.rise.in.sea.level.as.a.result.of.global.changes.in.temperature,.glacial. ice.melting,.and.other. factors,. including.shoreline.topography.and.elevation..Most.major.Philippinecities—suchasDapitan, inLingayenGulf,partsofDavaoCity,andreclaimedportionsof. Cebu. City. among. others—are. situated. on.relatively.low-lying.areas.
Projected.possible. increases. in. storm.frequency.and. strength. due. to. global. warming. will. also.affect. coastal.areas.with. flooding. from.extreme.high. tides,. mud. slides,. and. increased. erosion.rates..Although.data.on.changes.in.storm.patterns.is.still.preliminary,.even.assuming.the.status.quo.it.is.clear.that.higher.tides.combined.with.regular.typhoon-strength. storms. will. yearly. cause.significant. damage. along. the. coasts. that. are.exposed.to.such.storms..Such.damage.can.only.be.mitigated. with. preventive. planning. along.shoreline.areas.and.the.implementation.of.building.and.development.setbacks.along.beaches.and.all.low-lying.shorelines.
Climate.change.would.also.strongly.affect.coral.reefs.through.a.changing.marine.biochemistry..As.the.ocean.warms,.its.capacity.to.dissolve.carbon.dioxide.could.decrease.by.14.to.30.percent,.leading.to. a. decrease. in. biological. carbonate. formation.that.is.essential.for.reef.building.(Hardy.2003).
In. summary,. climate. change. and. sea-level. rise.could.have.major. impacts.on.Philippine.marine.and.coastal.resources..
To. prevent. or. mitigate. these. various. changes.and. impacts,. climate. change. responses. and.measures—such. as. the. implementation. of.setback. regulations,. appropriate. land. planning.in. coastal. areas,. and. the. strengthening. of. coral.reef. management. to. enhance. the. natural.resilience. of. coral. reef. communities—need. to.be. part. of. ICRM. schemes. and. strategies.. In.addition,. more. studies. on. mitigation. and.adaptation. to. climate. change. in. coastal. areas.are.needed.
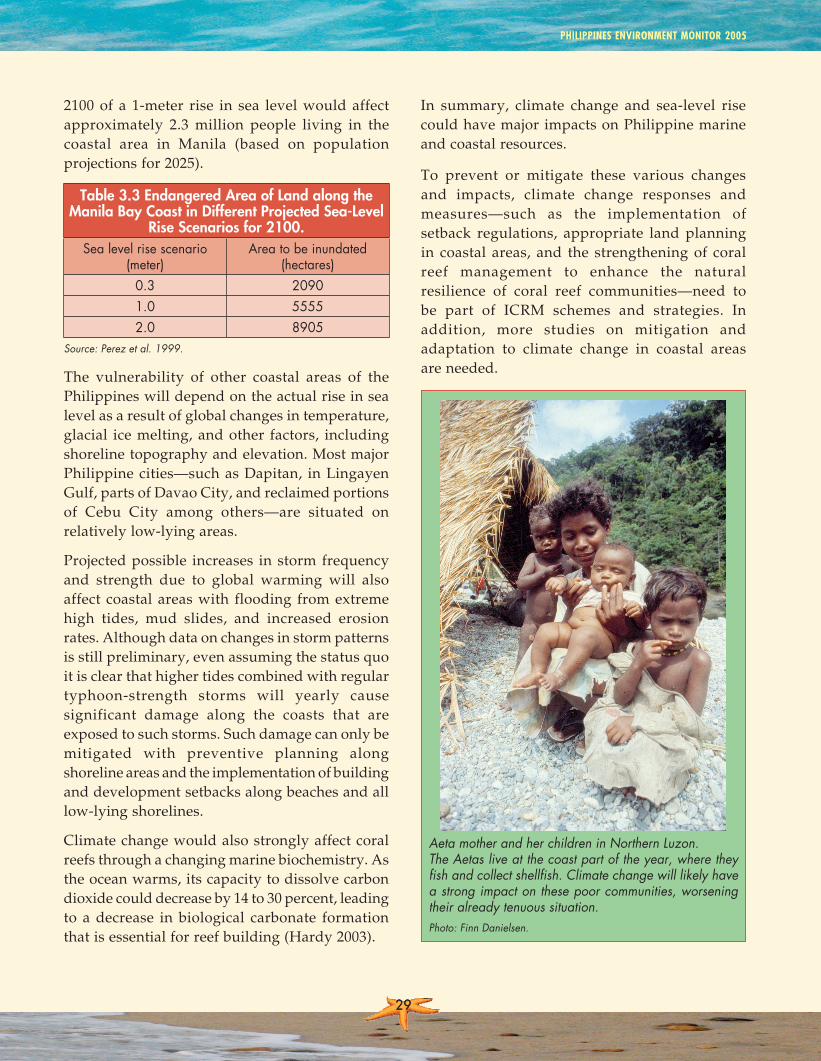
Aeta mother and her children in Northern Luzon. The Aetas live at the coast part of the year, where they fish and collect shellfish. Climate change will likely have a strong impact on these poor communities, worsening their already tenuous situation.Photo: Finn Danielsen.
PEMFinal.indb 29 10/08/2006 07:32:42