Embed Size (px)
Citation preview
The Forestry Sector: Costs of Environmental Damage and Net Benefits of Priority Interventions
A Contribution to the Philippines Country Environmental Analysis
Submitted to: The World Bank
November, 2008
Prepared by: Antonio P. Carandang 1
1 World Bank Consultant. The findings, interpretations, and conclusions expressed herein are those of the author, and do not necessarily reflect the views of the World Bank and its affiliated organizations, or those of the Executive Directors of the World Bank or the governments they represent. This paper represents work in progress and comments to the author are invited [[email protected]].
2
Report Outline 1.0 Background:
1.1 Importance of the Sector 1.2 Policy and Institutions Setting 1.3 The Forestry Sector Dilemma 1.4 The Costs of Deforestation
2.0 Methodology 2.1 List of Activities Conducted
2.2 Framework for Economic Valuation 2.3 The Total Economic Value (TEV) Approach 2.4 Identification of Interventions and Estimating Costs and Benefits 2.5 Distributional Analysis
3.0 Environmental Services of Forests
4.0 The Philippine Forests: Environmental Setting
5.0 The Forest Ecosystems 6.0 Forest Depletion Estimates
6.1 Rates of Forest Depletion 6.2 Analysis of Forest Changes 6.3 Distributional Impacts of Forest Depletion
7.0 The Way Forward 7.1 Proposed Interventions 7.2 Assumptions of Interventions 7.3 Total Economic Value of Interventions 8.0 Conclusions 9.0 References
3
LIST OF TABLES Table 1. Identified Potential Interventions. Table 2. Ecosystem Services and Functions (adopted from Costanza, et.al. 1997, as modified). Table 3. The Philippine Natural Resources Profile Table 4. Regional Distribution of Forests, by Canopy Density, 2005 (in '000 ha) Table 5. National Land Use Accounts, ‘000 ha (various years) Table 6. Forest Depletion Estimates, ‘000 ha Table 7. Summary of Forest Depletion (1992-2003) Table 8. Net Price of Forest Changes (1992-2003) Table 9. Forgone Values of Forest Lost (1992-2003), 2003 prices in mil P Table 10. Summary of Asset Value (AV) of Second Growth Production Forests under Three
Scenarios Table 11. Top 6 Environmental Damage Receptors and Magnitude of Damage.
Table 12. Forest Tenurial Instruments in the Philippines Table 13. Summary of the NPVs of Selected Interventions.
4
LIST OF FIGURES Figure 1. Forestry Sector Problem Tree, RMPFD, 2003. Figure 2. Valuation Framework. Figure 3. Philippines Forest Cover (1934-2003). Figure 4. Dipterocarp Forest Conversion (1935-2003). Figure 5. Tenurial Instruments in Philippine Forests (2006)
5
Annex 1. Deforestation in the Philippines Annex 2. Appendix Tables LIST OF APPENDIX TABLES
Appendix Table 1. Area account by forest type. Appendix Table 2. Pine forests accounts. Appendix Table 3. Account of rattan associated with dipterocarp forests (Mil lm). Appendix Table 4. Average national market price and stumpage value of forest and agricultural
products, 2006 prices. Appendix Table 5. New Rates of Forest charges per DENR Administrative Order No. 2000-63. Appendix Table 6. Labor requirement in CBFM areas (Camacho, et.al., 2007). Appendix Table 7. Summary of economic values in peso per ha of different tenurial instruments
in the Philippines (Francisco, 2004). Appendix Table 8. Scenario 1. Optimum harvest option. Appendix Table 9. Scenario 2 - Status quo with TLA expiration and CBFM & IFMA continuation
in a limited cutting regime. Appendix Table 10. Scenario 3 . Banning all timber harvesting in natural forests but still with
NTFP harvest. Appendix Table 11. Matrix of environmental damage, likely receptors and magnitude of damage. Appendix Table 12. Various valuation results used in the study (adjusted to 2006 prices using
12% discount rate). Appendix Table 13. TEV analysis of Intervention 1. Appendix Table 14. TEV analysis of Intervention 2. Appendix Table 15. TEV analysis of Intervention 3.
6
Final Report
The Forestry Sector: Costs of Environmental Damage and Net Benefits of Priority Interventions 1
by: Antonio P. Carandang, Ph. D. 2
1.0 Background
In the early 1960s up to late 1970s, the forestry sector in the Philippines played an important role in the economy of the country as it contributed substantial percentage in its growth. This was the time, when the logging industry was a boom with majority of around 400 logging firms that operated in the country operating during that period. Through the years, however, the forestry sector in the Philippines continuously declined in three major fronts, physical in terms of resource depletion, economic in view of its declining economic contributions and environmental in terms of ecosystem degradation (Revised Master Plan for Forestry Development - RMPFD, 2003). Most of the country’s once rich forests which generated substantial revenues to the government and the society are now gone. Such decline has been largely attributed to a number of inadequate and poorly-implemented forestry policies. These policies led to the rapid exploitation of timber from virgin forests at prices far below real market values and with rents mostly captured by loggers and corrupt government officials. Whatever rents derived by the government dissipated through inefficiencies in the system. The proliferation of only short duration timber licenses in the past discouraged long term investments in forest development and dampened the initiatives of the private sector. Forest destruction rose to very alarming levels while forest recovery through natural and artificial means never coped with the forest destruction rate. Furthermore, the institutions mandated to implement forest policies to address all these problems had not been equipped to fully address the situation. Meanwhile, the social settings in the uplands and forest adjacent communities continue to exert pressure on natural resources, making the tasks of conserving the forests more difficult. The very high incidence of poverty in the uplands continues to exacerbate the environmental degradation problems.
1 A study under the World Bank’s “Philippines Country Environmental Analysis.” Project Identification #P108566 2 Consultant ([email protected]).
7
The objectives of this consultancy are to: (i) quantify the current benefits from the forestlands; (ii) estimate the costs of deforestation in order to provide a comparison with respect to other forms of degradation of natural resources in terms of magnitude; (iii) assess distributional impacts of deforestation, as well as interventions, focusing on inter-sectoral impacts (e.g. on agricultural productivity), population sub-groups (i.e. upland versus lowland rural communities; urban population) and across geographic areas; and (iv) analyze the costs and benefits of major interventions and management options aimed at raising the net social benefits from forestlands. 1.1 Importance of the sector The forestry sector is the major centerpiece of the country’s natural resource base and ecosystems. Although the sector’s productivity has been declining, its contribution to the economy in terms of gross value added, export revenues, full-time job creations, and the provision of biomass fuels, are still significant. Its continued development and that of the environmental sector is a pre-requisite to a sustained growth in agriculture and other industries. However, the sector continues to reel from many threats to forest resources, among which are: the tremendous pressure from an increasing population in search of land to till and forest resources to use, the loss of vital watershed functions and loss of biodiversity and inadequate forest development, management, and conservation efforts.
In spite of all the constraints being faced, forestry in the Philippines still has considerable potentials for the development of the country – economically and ecologically. Several potentials identified by RMPFD (2003) are as follows: putting all forest areas under appropriate forest management systems that seek to obtain optimum economic and environmental benefits for forest communities, other stakeholders, and the society in general; expanding the area under forest cover through plantation establishment, enrichment planting and assisted natural regeneration; enhancing sustainable access to residual forests (through legally-allowed modalities) within production forest areas to improve wood supply position and manage the same in sustainable manner; and, revitalizing the forest-based industries through rationalization and appropriate incentives, improved primary and down-stream processing, and new product development.
1.2 Policy and Institutional Setting In recent years, all forestry sector policies emanated from the 1987 Philippine Constitution
particularly, Article II (State Policies), Article XII (National Economy and Patrimony) and Article XIII (Social Justice and Human Rights). Specifically, Article II champions the right of the people to a healthful environment (Section 16) and recognizes and promotes the rights of indigenous cultural communities (Section 22). Section 1 of Article XII provides a more equitable distribution of opportunities, income and wealth as one of the goals of national economy. While Section 2 of the same Article states that the exploration, development and utilization of natural resources shall be under the full control and supervision of the State. As such, the State may directly undertake such activities, or it may enter into co-production, joint venture or production sharing agreements with Filipino citizens or corporations or associations with at least 60% of the capital owned by such
8
citizens. Because of this great State power over natural resources, it opens up immense opportunities for the government in effecting forestry resources management in a sustainable manner.
The government, as a direct manager of natural resources, has delegated major public forest administration and management functions to one of its mandated functionaries, the Department of Environment and Natural Resources (DENR). It manages the forests through its regional field offices and other designated institutions, whether publicly or privately owned. As a sectoral institution, however, the public forest administration (PFA) in the country is beset by inefficiencies in various fronts, from program planning and implementation to law enforcement, because of policy weaknesses that permeated through various forest administrations through time. As described by Chandrasekharan (2003), the PFA in the country is “marked by inadequacies in terms of commitment, funds, facilities and specific skills and lack of incentives and freedom to respond to emerging situations.” The RMPFD (2003) also stated that the institutions of public forest administration (PFA) in Philippines today struggle with inherent inadequacies, despite many years of faltering efforts to grow stronger. The PFA is entrusted with the following major, but conflicting, missions/functions:
• An enforcement authority, and a forest police force (without adequate ‘real authority’ in terms of appropriate legal instruments);
• An enterprise function, to produce and market timber and other products (without the needed flexibility, freedom and financial control);
• Servicing sectoral development through, inter alia, planning, informing, monitoring and training (without adequate means, mechanisms and capability).
The dilemma of forest policy and institutions in the country is that they are weakened by each other’s weaknesses. This results to confused appreciation on the importance of the sector as a true pillar of the rural and national economy and as a backbone of environmental development and protection in the country. 1.3 The Forestry Sector Dilemma Early in this report, the decline of the forestry sector was attributed to a number of inadequate and poorly-implemented forestry policies. This led to the rapid exploitation of timber from virgin forests at prices far below real market values, the continued denudation of forestlands and the takeover of many forest lands by informal settlers. The RMPFD (2003) concluded that the many ills of the forestry sector can be traced from sector’s policy weaknesses some of which are as follows:
• Lack of a comprehensive, balanced and legislated policy covering the entire forestry sector.
• Policy weaknesses in forestry, ranging from gaps, irrelevancies, inappropriateness and difficulties to implement.
• Unstable forestry policies, frequent and arbitrary changes of policies, (with every change of government), mostly made at the DENR level.
9
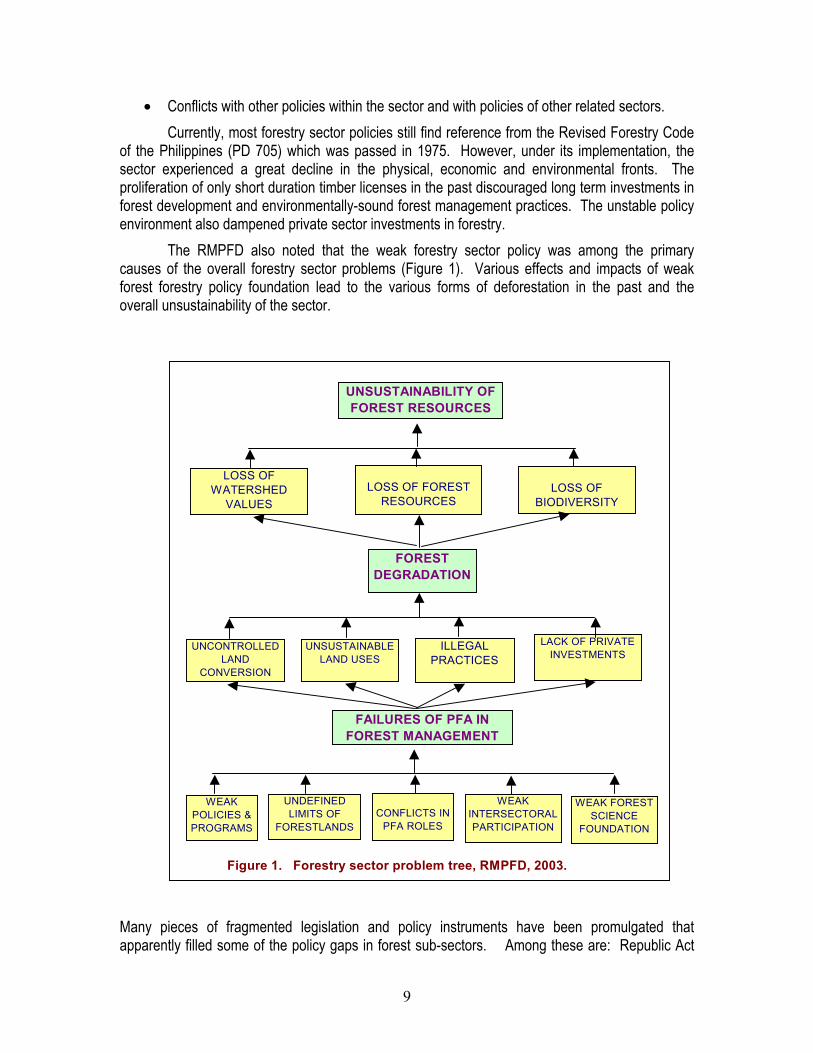
• Conflicts with other policies within the sector and with policies of other related sectors. Currently, most forestry sector policies still find reference from the Revised Forestry Code of the Philippines (PD 705) which was passed in 1975. However, under its implementation, the sector experienced a great decline in the physical, economic and environmental fronts. The proliferation of only short duration timber licenses in the past discouraged long term investments in forest development and environmentally-sound forest management practices. The unstable policy environment also dampened private sector investments in forestry. The RMPFD also noted that the weak forestry sector policy was among the primary causes of the overall forestry sector problems (Figure 1). Various effects and impacts of weak forest forestry policy foundation lead to the various forms of deforestation in the past and the overall unsustainability of the sector.
WEAK POLICIES & PROGRAMS
UNCONTROLLED LAND
CONVERSION
FOREST DEGRADATION
FAILURES OF PFA IN FOREST MANAGEMENT
ILLEGAL PRACTICES
LACK OF PRIVATE INVESTMENTS
LOSS OF FOREST RESOURCES
UNSUSTAINABILITY OF FOREST RESOURCES
LOSS OF WATERSHED
VALUESLOSS OF
BIODIVERSITY
UNSUSTAINABLE LAND USES
UNDEFINED LIMITS OF
FORESTLANDSCONFLICTS IN
PFA ROLES
WEAK INTERSECTORAL PARTICIPATION
WEAK FOREST SCIENCE
FOUNDATION
Figure 1. Forestry sector problem tree, RMPFD, 2003.
Many pieces of fragmented legislation and policy instruments have been promulgated that apparently filled some of the policy gaps in forest sub-sectors. Among these are: Republic Act
10
(RA) 8371 (Indigenous People’s Rights Act of 1997), RA 7942 (Philippine Mining Act of 1995), and RA 7160 (Local Government Code of 1991). These three laws have significant effects on the sustainable management of forest resources because of the issue of jurisdiction and priorities. With respect to RA 8371, indigenous peoples (IP’s) have the right to title over their ancestral lands. It also means that their right over the management of these lands have been strengthened. However, certain issues of jurisdiction over forest lands and resources prevent full implementation of this RA. There were indications that the processes of issuing titles and certificates to indigenous peoples have been compromised to allow mining and other activities.
On the other hand, RA 7942 brings forth the issue of whether mining within forest lands have priority over forest development or whether forest or biodiversity use has primacy over mineral exploration in mineral lands. These confusions happen because many of the recently proclaimed mineral lands are within previously classified public forestlands and protected areas. With respect to responsibility of local government units to participate in forest management in their areas of jurisdiction, there are still certain devolved forest management functions under RA 7160 that has not been fully operationalized, e.g., management of communal forests and watersheds and management of social forestry areas.
Still, there are other laws and policy instruments that impinge on the development of the sector. RA 7161 of 1992 for example, updated rates of forest charges but in one of its provisions, enforced a ban on cutting of all mangrove trees. This law has been cited as a disincentive to many people’s organization in mangrove CBFMs as community members have been denied the privilege of harvesting what they have planted. This provision also prevents the development of degraded mangrove areas by people’s organizations attempting to integrate sustainable utilization of planted mangroves in their framework plan.
In summary, the absence of a harmonized legislated forest sector policy; lack of a proper hierarchy in the system of policies; proliferation of fragmented and piecemeal policies causing conflicts, overlaps and disorder in their implementation; frequent policy changes and their corresponding implementing rules and regulations (IRR) being initiated by any forestry administration; inadequacies of policy implementation; and the difficulty in making structural changes in forestry organizations, further compounded the forestry sector woes (RMPFD, 2003). As such, forest industries in the country continue to exist in limbo while poverty in the uplands continue to exacerbate, wreaking havoc to whatever remaining resources in their midst. Thus, the cycle of poverty and environmental degradation in the Philippine uplands continues to proliferate.
1.4 The Costs of Deforestation
This study focuses on the phenomenon of deforestation in the Philippines, its impacts and
potentially strategic interventions needed to positively modify the trends in the sector. Deforestation produces an array of negative effects to the environment and economy like loss of economic opportunities due to resource depletion, loss of habitat for biodiversity, loss of fertile soil, pollution of water systems, and a string of other bad effects. These environmental externalities are not usually taken into account nor fully understood by the landuse managers in their decisions.
Deforestation has historically been very high in the Philippines. However, some
divergences exist with regard to the rate of deforestation in the past. According to World Bank
11
(2007), the rate of deforestation during 1990-2005 was about 2.2 percent per year, which is very high by way of international comparison. Estimates of 100,000 hectares forest lost per year have mostly been noted in many Philippine Congress hearings trying to justify a total commercial log ban policy for the country. On the other hand, ENRAP (2000) indicates that by 1996 a reversal from forest depreciation to appreciation has been taking place, at least in economic terms. Such reversal has coincided with a less intensive use of forestlands for the extraction of fuelwood as well as with a shift from large-scale users of forest resources to small-scale community users. Also, the rate of exploitation of forest resources had necessarily diminished as a result of the previous extended process of deforestation as well as substantial forest recovery from various forest development initiatives. Between 1989 and 2004, the total reported cumulative hectarage of government reforestation accomplishment totaled to around 600,000 ha (PFS, 2004). At present, the actual forest plantation figure is estimated to be largely lower than this because of mortality due to poor maintenance and protection activities. In 2003 FRA report, the total forest plantation in existence was estimated to be only around 330,000 ha.
Indeed, there has been a reported turnaround in the area of forests in the country. The
Forest Management Bureau reported in 2005 that the country has around 7.2 mil ha of forested lands improving on earlier government official estimate of only 5.4 mil ha of forests in 1997. Such increase from 1997 figure was a result of re-definition of some forest terms pertaining to forest cover according to internationally accepted terminologies as well as correction of previous official forest statistics which were based from interpolations/extrapolations of 1969 and 1988 nationwide forest assessments. For example, there are now new terms of closed broadleaf forests corresponding to old growth and residual dipterocarp forests before. The formerly submarginal areas are now termed open broadleaf and open mixed forests. In addition, forested areas within alienable and disposable lands were included in this latest report. In a report by Acosta (2008), there was indeed an annual increase of 54,480 ha in the total forest area of the country between 1988 and 2003 official forestry statistics. These rates of deforestation and forest area appreciation have carefully been examined by the author in succeeding discussions with a full supplemental report (Annex 1) fully devoted to such topic. 2.0 Methodology 2.1 List of activities conducted Among the major activities followed in this study are as follows:
a. Scanning and review of relevant forest degradation and environmental valuation reports and collation of secondary data
A review of relevant studies/reports and secondary data related to changes in the
conditions of forest resources as well as their economic impacts was conducted. Secondary data from academic institutions, research centers, government offices, and international forestry organizations (FAO, ITTO, CIFOR, etc.) were gathered.
b. Listing and discussion of the main externalities of goods and services provided by
forests in the Philippines
12
Environmental services such as biodiversity, reduced soil erosion, as well as those related
to the support of livelihoods of poor communities living in upland areas that rely on forest resources for generating a part of their income were examined. An overview of the multiple benefits associated with forests ecosystems was listed. In this regard, a distinction between primary and secondary forests, grasslands, and other relevant types of forests was made in association with different dynamics in land use changes and exploitation of forest resources.
c. Formulation of a database and aggregate resource accounting format that would
capture forestland use dynamics
A data base was developed for assembling and organizing in a coherent way the most up to date statistics on forestlands, deforestation, changes in land use of forestlands, services provided by forestlands, including fuelwood gathering, employment opportunities, market prices, valuation results, etc. and can be found in Annex 2 – Appendix Tables. The data were disaggregated to reflect different types of forests (e.g. rattan, mangroves, grassland, pine trees, etc.). Various types of forests covered under different tenure arrangements or types of management were documented as well.
d. Conduct of interviews and additional field data gathering
Interviews with individual experts on the subject to validate assumptions that were used in the various stages of the analysis were conducted. Further, primary data on specific forest management or tenurial type were gathered in selected regions. Among the select management groups visited are as follows: community based management project, timber license agreement, LGU or water district-managed forest, open access areas, and IFMA holders.
Among the relevant information gathered are as follows:
• Basic information about the area e.g., location, land area, upland population within the
project area/concerned site, historical account of changes in management of the area, etc.
• Historical account/rate of landuse changes due to incidence of erosion, forest fire, infestation and other calamities;
• Current management interventions:, purposes and targets; • Income from forests by project/households (socio-economic profile); • Estimated costs of managing such areas, cost of protection and resource monitoring; • Impacts of the current forest management set-up: benefits and costs from interventions;
and • Awareness and views of respondent with current policies and developments in their area,
recommendations on how to address environmental degradation in their area.
Additional regional data on market prices as well as selected historical regional landuse data were gathered to augment existing national data on damage estimation on selected regions.
13
2.2 Framework for Economic Valuation According to Bennagen (2006), the field of economic valuation draws from welfare
economics theory the basic premise that the purpose of an economic activity is to increase the well being of individuals who make up the society and that each individual is the best judge of how well off he or she is in a given situation (as adopted from Freeman, 1993). The approach of economic valuation is therefore utilitarian or anthropocentric as distinct from intrinsic. Bennagen further added that the fundamental principle in economic valuation is scarcity. A misunderstanding or non-recognition of this principle in the valuation of environmental resources would lead to erroneous economic values.
The social cost of forest depletion was estimated based on the existing data, market related information on stumpage values, and clearly identifiable assumptions. Several methodologies were considered in the estimation whenever applicable. The net price method and the asset value approach were used to value the appreciation or depreciation of natural assets through time. The net price was primarily used to value timber and major non-timber forest products (NTFP) lost in the process of degradation. Of particular NTFP interest is rattan where volume can be approximated based on series of inventories already conducted. There were no empirical estimates on the amounts and values of other NTFP’s lost during period analyzed. On the other hand, the asset value represents the net value of benefit streams of proposed or planned resource use activities while net price is a point estimate of a physical asset value. In analyzing the costs and benefits of proposed interventions, on the other hand, the total economic value approach was used. The Net Price (NP) Method
Net pricing as applied to forest resource valuation is defined as the average net price (potential or actual) per unit of resource, which is the difference between the current per unit revenue and per unit production costs. The costs include extraction charges, transportation, interest payment to capital and any other costs that are incurred in using different factors of production. This method accounts for the physical change of stocks of natural assets and its corresponding economic values. The change in stock arises from actual or potential harvesting, damage, and conversion (net of growth). This gives us the physical accounts of area and volume; and the economic accounts in current and constant prices. Thus, the net price gives us the actual or potential value of a resource in a point in time when such valuation is conducted. The Asset Value Approach
The asset value approach measures the annual asset value change of the resource stocks by estimating the stream of goods and services derived from the potential use of the physical resource over time. The future stream of benefits and costs of the assets is computed in present value terms through the discounting process. Hence, asset value represents the net value of benefit streams of proposed or planned resource use activities.
14
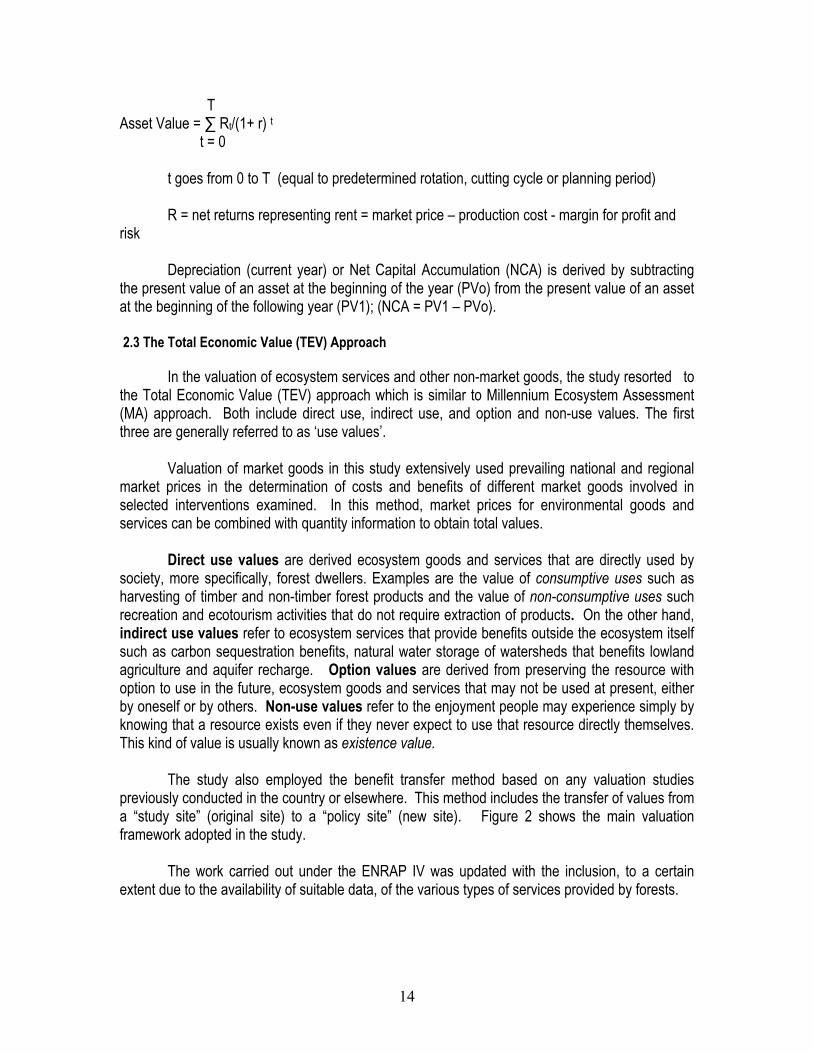
T Asset Value = ∑ Rt/(1+ r) t t = 0
t goes from 0 to T (equal to predetermined rotation, cutting cycle or planning period)
R = net returns representing rent = market price – production cost - margin for profit and risk
Depreciation (current year) or Net Capital Accumulation (NCA) is derived by subtracting the present value of an asset at the beginning of the year (PVo) from the present value of an asset at the beginning of the following year (PV1); (NCA = PV1 – PVo). 2.3 The Total Economic Value (TEV) Approach In the valuation of ecosystem services and other non-market goods, the study resorted to the Total Economic Value (TEV) approach which is similar to Millennium Ecosystem Assessment (MA) approach. Both include direct use, indirect use, and option and non-use values. The first three are generally referred to as ‘use values’.
Valuation of market goods in this study extensively used prevailing national and regional
market prices in the determination of costs and benefits of different market goods involved in selected interventions examined. In this method, market prices for environmental goods and services can be combined with quantity information to obtain total values. Direct use values are derived ecosystem goods and services that are directly used by society, more specifically, forest dwellers. Examples are the value of consumptive uses such as harvesting of timber and non-timber forest products and the value of non-consumptive uses such recreation and ecotourism activities that do not require extraction of products. On the other hand, indirect use values refer to ecosystem services that provide benefits outside the ecosystem itself such as carbon sequestration benefits, natural water storage of watersheds that benefits lowland agriculture and aquifer recharge. Option values are derived from preserving the resource with option to use in the future, ecosystem goods and services that may not be used at present, either by oneself or by others. Non-use values refer to the enjoyment people may experience simply by knowing that a resource exists even if they never expect to use that resource directly themselves. This kind of value is usually known as existence value.
The study also employed the benefit transfer method based on any valuation studies
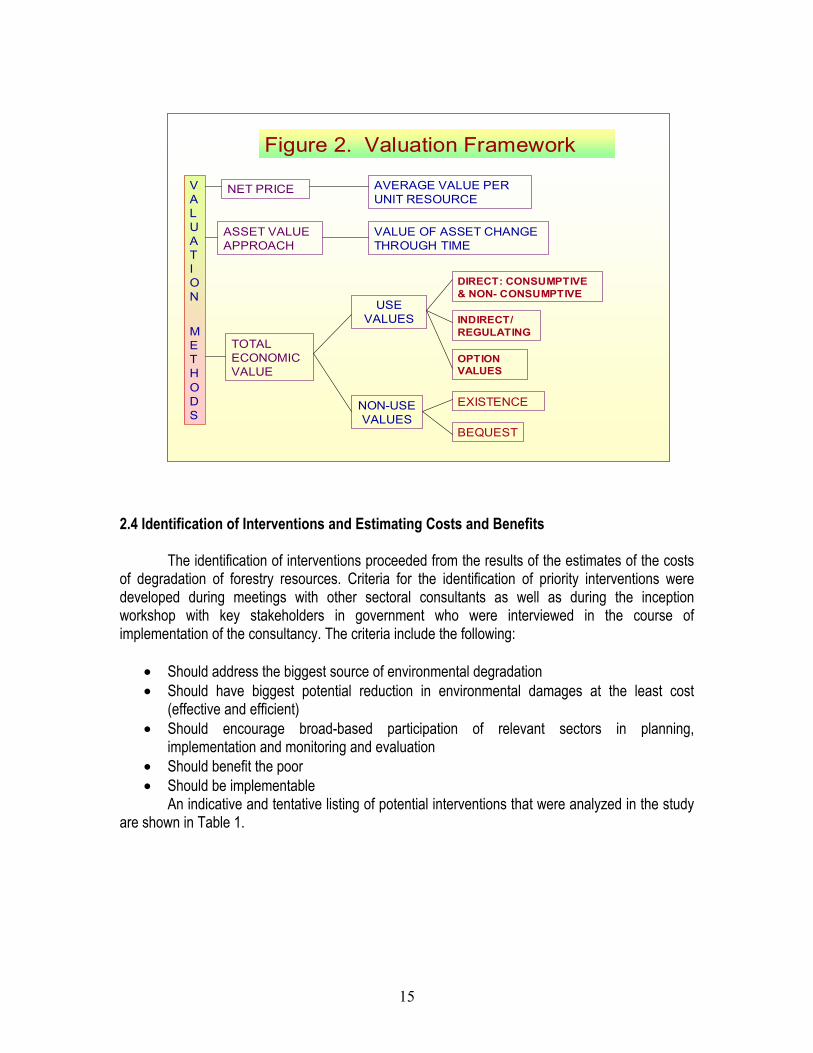
previously conducted in the country or elsewhere. This method includes the transfer of values from a “study site” (original site) to a “policy site” (new site). Figure 2 shows the main valuation framework adopted in the study.
The work carried out under the ENRAP IV was updated with the inclusion, to a certain
extent due to the availability of suitable data, of the various types of services provided by forests.
15
Figure 2. Valuation Framework
NET PRICE
ASSET VALUE APPROACH
TOTAL ECONOMIC VALUE
VALUATION
METHODS
USE VALUES
NON-USE VALUES
DIRECT: CONSUMPTIVE & NON- CONSUMPTIVE
OPTION VALUES
EXISTENCE
BEQUEST
AVERAGE VALUE PER UNIT RESOURCE
VALUE OF ASSET CHANGE THROUGH TIME
INDIRECT/ REGULATING
2.4 Identification of Interventions and Estimating Costs and Benefits
The identification of interventions proceeded from the results of the estimates of the costs of degradation of forestry resources. Criteria for the identification of priority interventions were developed during meetings with other sectoral consultants as well as during the inception workshop with key stakeholders in government who were interviewed in the course of implementation of the consultancy. The criteria include the following:
• Should address the biggest source of environmental degradation • Should have biggest potential reduction in environmental damages at the least cost
(effective and efficient) • Should encourage broad-based participation of relevant sectors in planning,
implementation and monitoring and evaluation • Should benefit the poor • Should be implementable
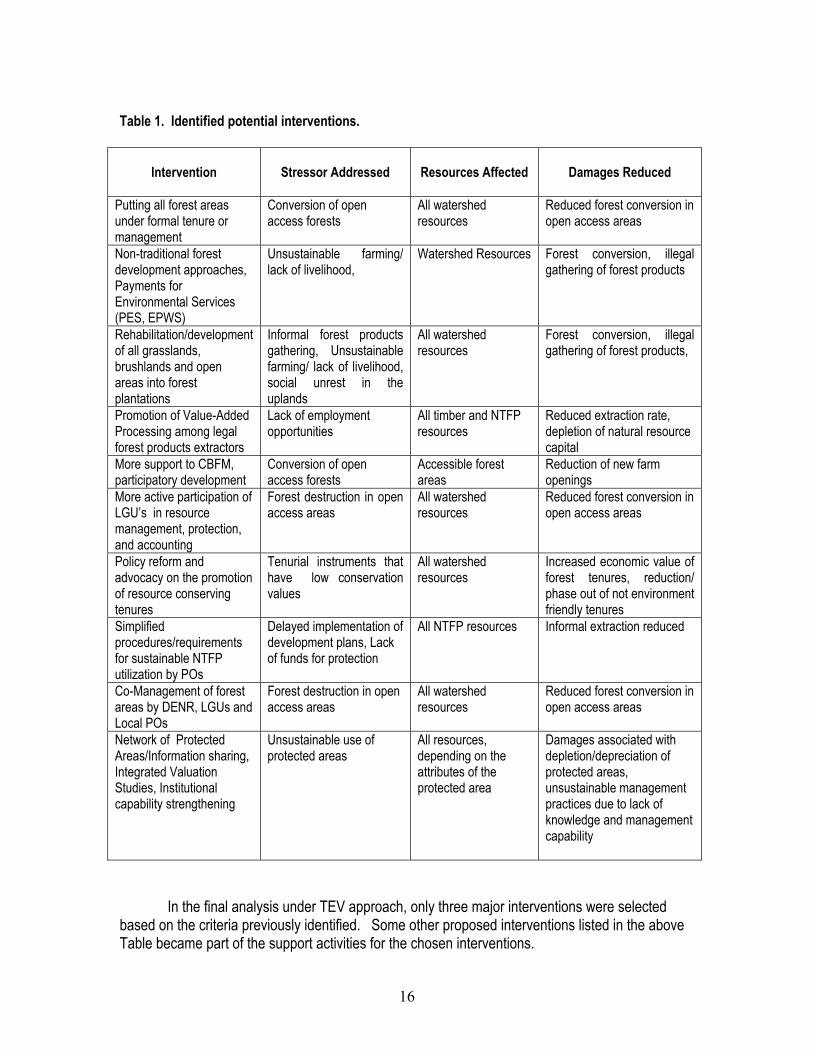
An indicative and tentative listing of potential interventions that were analyzed in the study are shown in Table 1.
16
Table 1. Identified potential interventions.
Intervention
Stressor Addressed
Resources Affected
Damages Reduced
Putting all forest areas under formal tenure or management
Conversion of open access forests
All watershed resources
Reduced forest conversion in open access areas
Non-traditional forest development approaches, Payments for Environmental Services (PES, EPWS)
Unsustainable farming/ lack of livelihood,
Watershed Resources Forest conversion, illegal gathering of forest products
Rehabilitation/development of all grasslands, brushlands and open areas into forest plantations
Informal forest products gathering, Unsustainable farming/ lack of livelihood, social unrest in the uplands
All watershed resources
Forest conversion, illegal gathering of forest products,
Promotion of Value-Added Processing among legal forest products extractors
Lack of employment opportunities
All timber and NTFP resources
Reduced extraction rate, depletion of natural resource capital
More support to CBFM, participatory development
Conversion of open access forests
Accessible forest areas
Reduction of new farm openings
More active participation of LGU’s in resource management, protection, and accounting
Forest destruction in open access areas
All watershed resources
Reduced forest conversion in open access areas
Policy reform and advocacy on the promotion of resource conserving tenures
Tenurial instruments that have low conservation values
All watershed resources
Increased economic value of forest tenures, reduction/ phase out of not environment friendly tenures
Simplified procedures/requirements for sustainable NTFP utilization by POs
Delayed implementation of development plans, Lack of funds for protection
All NTFP resources Informal extraction reduced
Co-Management of forest areas by DENR, LGUs and Local POs
Forest destruction in open access areas
All watershed resources
Reduced forest conversion in open access areas
Network of Protected Areas/Information sharing, Integrated Valuation Studies, Institutional capability strengthening
Unsustainable use of protected areas
All resources, depending on the attributes of the protected area
Damages associated with depletion/depreciation of protected areas, unsustainable management practices due to lack of knowledge and management capability
In the final analysis under TEV approach, only three major interventions were selected based on the criteria previously identified. Some other proposed interventions listed in the above Table became part of the support activities for the chosen interventions.
17
3.0 Environmental Services of Forests
Forest ecosystems provide a wide range of economic commodities and perform
environmental services that benefit mankind. Many of these are being traded and have actual market values while others are not traded in the market, thus have no prices, and therefore tend to be overused by society, leading to their depletion and degradation. Traditionally, these services are viewed as follows:
a. Protective – ecosystem’s function such as soil stabilization and erosion control, ecosystems protection, protection of headwaters, habitat for biodiversity, and amelioration of micro-climate, among others;
b. Productive – economic functions such as production of water, production of goods and services that are traded in the market systems
c. Aesthetic – aesthetic functions such as provision of beautiful sceneries, recreation venues, and eco-tourism services, among others;
d. Cultural and historical – forests serve as venues for cultural practices, tribal ceremonies, as ancestral burial grounds, and are venues for the preservation of natural historical monuments; and
e. Scientific – forests serve as sites of experiments, research studies, repository of scientific information, and training laboratories for researchers and students. In modern-times appreciation of ecosystems’ values, such services can be classified into
four general types; provisioning, regulating, cultural and supporting. This typology has been adopted by Bennagen, et. al. (2006) based on the framework for the integrated assessment and valuation of ecosystem functions and services used in the study proposed by de Groot in 2002 as modified applying the Millennium Ecosystem Assessment (MA)2 as shown in Figure 1. The numerous and diverse functions of a forest ecosystem can be grouped into a few major functions which in turn provide goods and services that are valued by society. Ecosystem valuation allows the conversion of these values into monetary units (economic values) that serve as inputs into the decision and policy-making processes to determine appropriate management interventions. The interventions to be undertaken would affect the ecosystem structure and processes and in turn affect the functioning of the ecosystem.
Using the MA typology, the classified ecosystems’ services are further elaborated as follows:
a. Provisioning services are direct uses or options for ecosystem use that are both
consumptive and non-consumptive. Consumptive goods are timber, non-timber forest products (NTFPs), traditional medicine, fuelwood, subsistence agriculture and
2 The Millennium Ecosystem Assessment (MA), an international work program of the United Nations, was launched in June 2001 and completed in March 2005 to meet the needs of decision makers and the public for scientific information concerning the consequences of ecosystem change for human well-being and the options for responding to those changes (Millennium Ecosystem Assessment. 2005. Ecosystems and Human Well-being: Synthesis. Island Press, Washington, DC)
18
fisheries while the non-consumptive services include recreation/tourism, research and education, and bio-prospecting;
b. Regulating services are indirect uses provided by the forest ecosystems that include
watershed protection (i.e., water regulation and supply), carbon sequestration and storage, drought mitigation, physical protection, pest regulation, and others;
c. Cultural services are non-material benefits and include non-use values obtained from
the ecosystem such as spiritual and religious values, aesthetic, cultural heritage and existence value, among others; and
d. Supporting services of the forest ecosystem include the ecological services such as
nutrient cycling, primary production, soil formation and others that are necessary for the functioning of the provisioning, regulating and cultural services of the ecosystem.
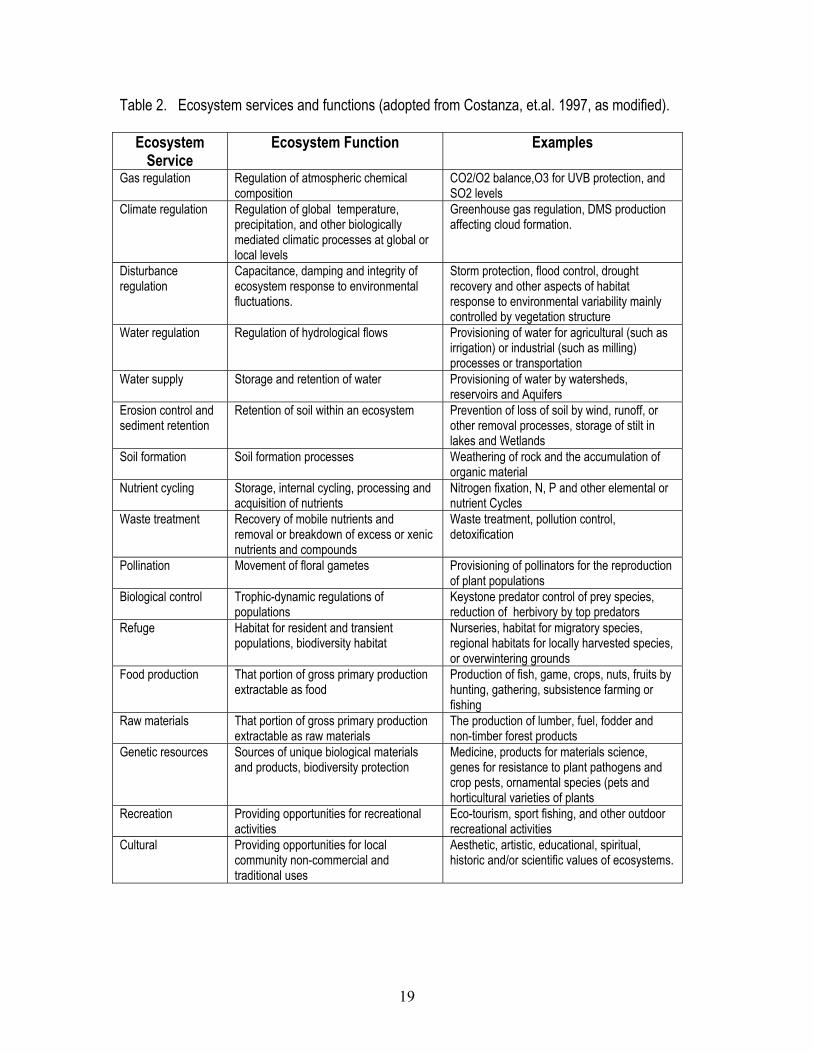
Costanza, et. al., in their study on the value of the world’s ecosystem services and natural capital, provided an extensive listing of ecosystem’s services and functions as provided in Table 2. Many of these functions also apply to Philippine forests.
19
Table 2. Ecosystem services and functions (adopted from Costanza, et.al. 1997, as modified).
Ecosystem Service
Ecosystem Function Examples
Gas regulation Regulation of atmospheric chemical composition
CO2/O2 balance,O3 for UVB protection, and SO2 levels
Climate regulation Regulation of global temperature, precipitation, and other biologically mediated climatic processes at global or local levels
Greenhouse gas regulation, DMS production affecting cloud formation.
Disturbance regulation
Capacitance, damping and integrity of ecosystem response to environmental fluctuations.
Storm protection, flood control, drought recovery and other aspects of habitat response to environmental variability mainly controlled by vegetation structure
Water regulation Regulation of hydrological flows Provisioning of water for agricultural (such as irrigation) or industrial (such as milling) processes or transportation
Water supply Storage and retention of water Provisioning of water by watersheds, reservoirs and Aquifers
Erosion control and sediment retention
Retention of soil within an ecosystem Prevention of loss of soil by wind, runoff, or other removal processes, storage of stilt in lakes and Wetlands
Soil formation Soil formation processes Weathering of rock and the accumulation of organic material
Nutrient cycling Storage, internal cycling, processing and acquisition of nutrients
Nitrogen fixation, N, P and other elemental or nutrient Cycles
Waste treatment Recovery of mobile nutrients and removal or breakdown of excess or xenic nutrients and compounds
Waste treatment, pollution control, detoxification
Pollination Movement of floral gametes Provisioning of pollinators for the reproduction of plant populations
Biological control Trophic-dynamic regulations of populations
Keystone predator control of prey species, reduction of herbivory by top predators
Refuge Habitat for resident and transient populations, biodiversity habitat
Nurseries, habitat for migratory species, regional habitats for locally harvested species, or overwintering grounds
Food production That portion of gross primary production extractable as food
Production of fish, game, crops, nuts, fruits by hunting, gathering, subsistence farming or fishing
Raw materials That portion of gross primary production extractable as raw materials
The production of lumber, fuel, fodder and non-timber forest products
Genetic resources Sources of unique biological materials and products, biodiversity protection
Medicine, products for materials science, genes for resistance to plant pathogens and crop pests, ornamental species (pets and horticultural varieties of plants
Recreation Providing opportunities for recreational activities
Eco-tourism, sport fishing, and other outdoor recreational activities
Cultural Providing opportunities for local community non-commercial and traditional uses
Aesthetic, artistic, educational, spiritual, historic and/or scientific values of ecosystems.
20
4.0 The Philippine Forests: Environmental Setting Tropical forests are located along the equator in Asia (East Indies), Africa (Congo River
basin), and South America (Amazon basin). They cover about 7 percent of Earth’s land area. Between 50% to 80% of all plant and animal species on Earth (between 3 to 4 billion species of organisms where only 15% are classified) lived and exist in tropical forests including half of Earth’s bird species, and 90% of primates. The Philippine forests belong to this very diverse tropical rainforests that straddles along the equatorial belt.
The Philippines is an archipelago composed of 7,100 islands spread from 5o to 20o north of the equator and has a total land area of around 30 million hectares. More than 52 percent of the land area (15.8 million hectares) is classified as public forestlands while the rest is alienable and disposable. Recent estimates in the just concluded Forest Resources Assessment project of the DENR showed that around 7.159 mil ha of the country’s land area are still forested or with forests under various canopy covers, including those forests within alienable and disposable lands. Much of the Philippine forests are in hilly and mountainous areas above 18 % in slope. Its coastlines extend to about 36,000 kilometers and have a total of 68.0 mil ha of territorial waters with around 2.6 mil ha of coral reefs.
The climate is humid and rainfall is generally abundant, especially in East of Luzon, Eastern Visayas Region and most of Mindanao Island. As in most Southeast Asian countries, this upland situation is favorable even to human habitation where the soil is suited for agriculture. However, the hilly and mountainous topography renders the upland soils highly susceptible to erosion once disturbed. Table 3 shows the brief profile of the Philippine natural resources situation.
21
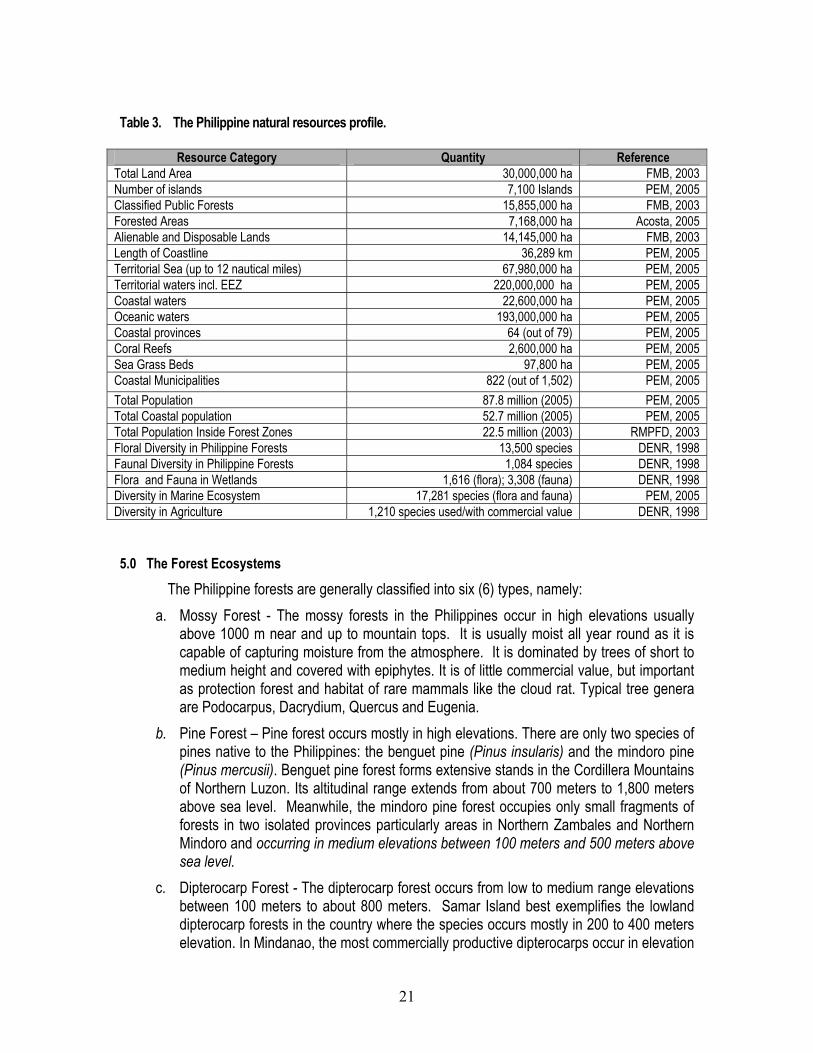
Table 3. The Philippine natural resources profile.
Resource Category Quantity Reference Total Land Area 30,000,000 ha FMB, 2003 Number of islands 7,100 Islands PEM, 2005 Classified Public Forests 15,855,000 ha FMB, 2003 Forested Areas 7,168,000 ha Acosta, 2005 Alienable and Disposable Lands 14,145,000 ha FMB, 2003 Length of Coastline 36,289 km PEM, 2005 Territorial Sea (up to 12 nautical miles) 67,980,000 ha PEM, 2005 Territorial waters incl. EEZ 220,000,000 ha PEM, 2005 Coastal waters 22,600,000 ha PEM, 2005 Oceanic waters 193,000,000 ha PEM, 2005 Coastal provinces 64 (out of 79) PEM, 2005 Coral Reefs 2,600,000 ha PEM, 2005 Sea Grass Beds 97,800 ha PEM, 2005 Coastal Municipalities 822 (out of 1,502) PEM, 2005 Total Population 87.8 million (2005) PEM, 2005 Total Coastal population 52.7 million (2005) PEM, 2005 Total Population Inside Forest Zones 22.5 million (2003) RMPFD, 2003 Floral Diversity in Philippine Forests 13,500 species DENR, 1998 Faunal Diversity in Philippine Forests 1,084 species DENR, 1998 Flora and Fauna in Wetlands 1,616 (flora); 3,308 (fauna) DENR, 1998 Diversity in Marine Ecosystem 17,281 species (flora and fauna) PEM, 2005 Diversity in Agriculture 1,210 species used/with commercial value DENR, 1998 5.0 The Forest Ecosystems
The Philippine forests are generally classified into six (6) types, namely: a. Mossy Forest - The mossy forests in the Philippines occur in high elevations usually
above 1000 m near and up to mountain tops. It is usually moist all year round as it is capable of capturing moisture from the atmosphere. It is dominated by trees of short to medium height and covered with epiphytes. It is of little commercial value, but important as protection forest and habitat of rare mammals like the cloud rat. Typical tree genera are Podocarpus, Dacrydium, Quercus and Eugenia.
b. Pine Forest – Pine forest occurs mostly in high elevations. There are only two species of pines native to the Philippines: the benguet pine (Pinus insularis) and the mindoro pine (Pinus mercusii). Benguet pine forest forms extensive stands in the Cordillera Mountains of Northern Luzon. Its altitudinal range extends from about 700 meters to 1,800 meters above sea level. Meanwhile, the mindoro pine forest occupies only small fragments of forests in two isolated provinces particularly areas in Northern Zambales and Northern Mindoro and occurring in medium elevations between 100 meters and 500 meters above sea level.
c. Dipterocarp Forest - The dipterocarp forest occurs from low to medium range elevations between 100 meters to about 800 meters. Samar Island best exemplifies the lowland dipterocarp forests in the country where the species occurs mostly in 200 to 400 meters elevation. In Mindanao, the most commercially productive dipterocarps occur in elevation
22
ranges of 500 – 700 meters. This type of forest is best developed where rainfall is more or less uniform throughout the year, or where there is only short dry season. Dipterocarps forests are the country’s most valuable forests commercially. These forest types are dominated by various hardwood species internationally known as Philippine mahogany with other equally important non-dipterocarp species. The common genera of Dipterocarps are as follows: Shorea, Dipterocarpus, Hopea, Parashorea, Pentacme, Anisoptera and Vatica.
d. Molave Forest: The molave forest occurs in areas with low to medium elevations and in regions with very distinct wet and dry seasons. It typically sits in limestone soils or ultra basic rocks near coastal areas. Most of Palawan’s near shore forests are classified as molave forests. Among the species abundantly occurring in this forest type are Vitex parviflora (molave), Intsia bijuga (ipil), Toona calantas (kalantas), Pterocarpus indicus (narra), Sindora supa (supa), Diospyros philippinensis (kamagong), Wallaceodenrdron celebicum (banuyo) and Afzelia rhomboidea (Akle). In the general classification of forests in the Philippines, this forest type is usually lumped under dipterocarp forests.
e. Beach Forest - The beach forest occurs on sandy beaches above the high tide limits where the original form of vegetation had been left undisturbed. Typical beach forest association includes Pandanus spp,, Calophyllum inophyllum, Terminalia catappa, Casuarina equisetifolia and Hertiera littoralis. Bushes and small trees with thorny stems are also abundant in this forest type. This forest type is small in terms of area and no exact records are available in official forestry statistics.
f. Mangrove Forest - The mangrove forest occurs along the tidal flats and at the mouths of streams and along the shores of protected bays. It is dominated by the bacauan family (Rhizophoraceae) which once was the principal source of tan bark. Some species also occurs in islands with sandy and rocky shores, particularly, bakauan bato, also from genus Rhizopora. There are distinct species zonations in mangrove forests. In the seaward and middleward zones, true mangrove species occur, while in the landward zones, there forms an association of true mangroves and mangrove associates defining a distinct ecotone between the mangroves zones towards the dry lands.
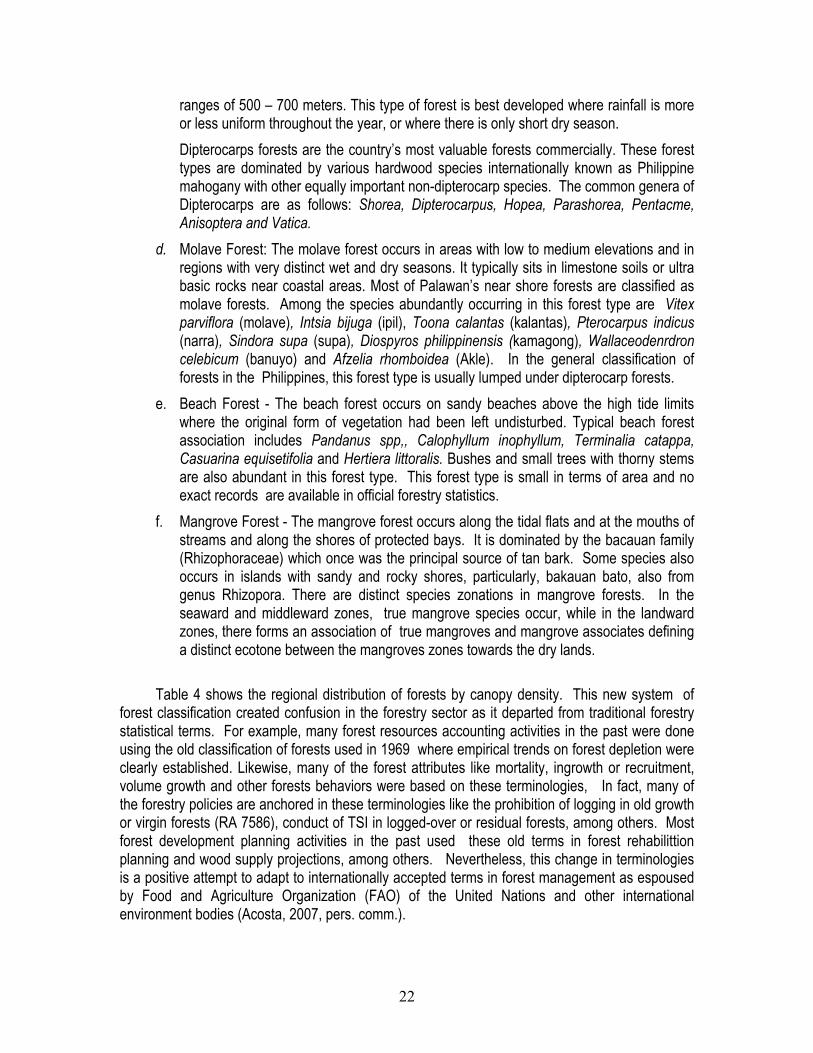
Table 4 shows the regional distribution of forests by canopy density. This new system of
forest classification created confusion in the forestry sector as it departed from traditional forestry statistical terms. For example, many forest resources accounting activities in the past were done using the old classification of forests used in 1969 where empirical trends on forest depletion were clearly established. Likewise, many of the forest attributes like mortality, ingrowth or recruitment, volume growth and other forests behaviors were based on these terminologies, In fact, many of the forestry policies are anchored in these terminologies like the prohibition of logging in old growth or virgin forests (RA 7586), conduct of TSI in logged-over or residual forests, among others. Most forest development planning activities in the past used these old terms in forest rehabilittion planning and wood supply projections, among others. Nevertheless, this change in terminologies is a positive attempt to adapt to internationally accepted terms in forest management as espoused by Food and Agriculture Organization (FAO) of the United Nations and other international environment bodies (Acosta, 2007, pers. comm.).
23
Table 4. Regional distribution of forests, by canopy density, 2005 (in '000 ha). Region Closed
Canopy Open Canopy Forest Plantations*
Mangrove (Natural)
TOTAL FORESTS % OF TOTAL
ARMM 106.3 96.7 1.6 45.8 250.3 3% CAR 384.9 246.8 40.6 672.3 9% NCR 2.8 0.0 2.8 0% R-01 37.7 117.2 34.7 0.2 189.8 3% R-02 503.1 604.5 33.6 8.6 1149.8 16% R-03 226.2 304.2 58.7 0.4 589.5 8%
R-04-A 117.2 161.2 11.3 289.7 4% R-04-B 484.9 604.2 48.5 57.6 1195.1 17% R-05 50.6 90.3 2.1 13.5 156.5 2% R-06 105.9 104.7 49.4 4.6 264.5 4% R-07 2.2 43.0 17.8 11.8 74.9 1% R-08 36.5 410.1 34.5 38.8 519.8 7% R-09 29.7 126.8 3.5 22.3 182.2 3% R-10 107.1 226.4 1.5 2.5 337.5 5% R-11 177.5 241.0 0.5 2.0 421.0 6% R-12 126.4 218.9 2.6 1.4 349.2 5% R-13 64.7 431.8 26.7 523.3 7%
TOTAL –PHIL 2,560.9 4,030.6 329.6 247.4 7,168.4 100% % of total 36.0% 56.0% 5.0% 3.0% 100.0%
Source: Acosta, 2005. This figure includes other broadleaved forests that may not be of dipterocarp forest type but cannot be segregated at the moment, pending conclusions of field validations being conducted.
24
The recent statistics showed a significant increase in previous total forest statistics. From a total forest area of 5.4 mil ha in 1997, the 2003 figure shows 7.2 mil ha, an increase of around 1.8 mil ha because of greater vegetation coverage by recent methods as well as detection of forest growth in previously classified non-forested areas.. Among the conclusions of the NFA report (Acosta, 2005) are as follows:
• The 2003 NFA indicate that the forest cover of the country has increased from 6.5 million hectares in 1988 to 7.2 million hectares in 2003. Ninetyone (91) % of this forest is in public forestlands while 9% is in alienable or disposable lands. This increase is attributed to natural regeneration and plantings, in both public and private lands. A significant area of other wooded lands exist, indicating that lands previously under pasture, grasslands, and agriculture are growing tree cover, either by natural regeneration or planting.
• The increase in forest, however, does not necessarily mean an improvement in forest
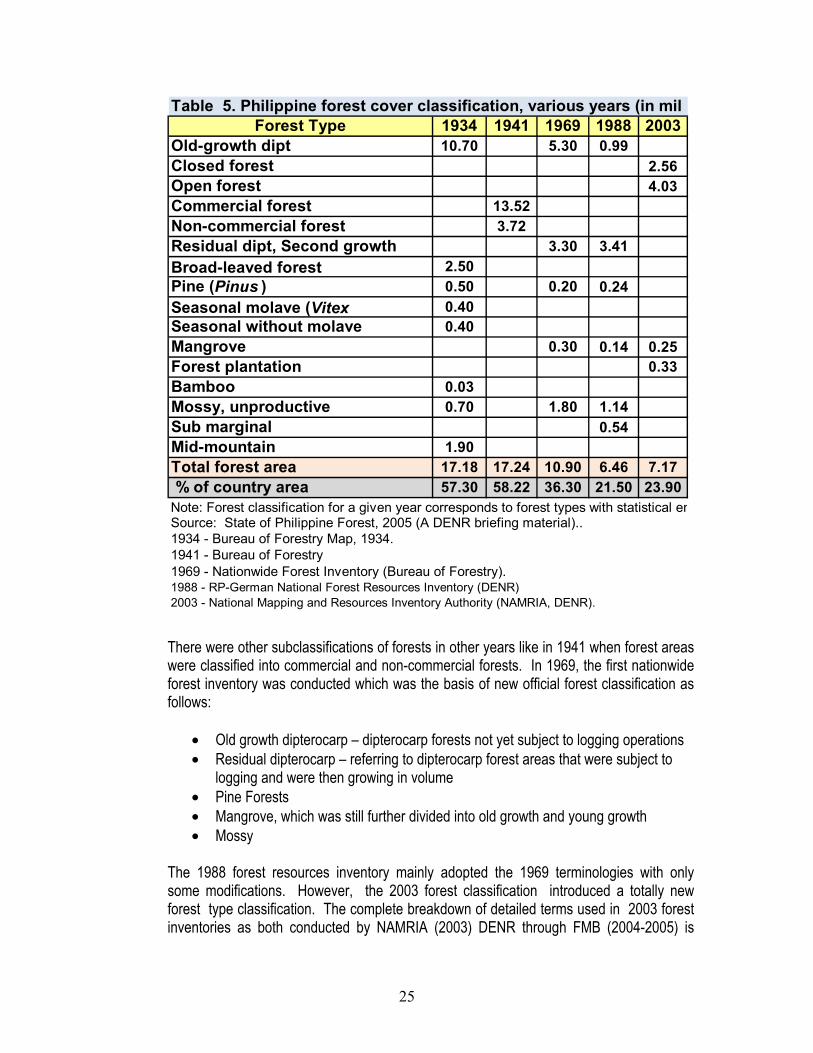
quality. In forestlands, the open canopy forests ( 10%-40% canopy density) constitute 55%; only 38% is closed canopy forest. In A or D lands, 70% is open canopy forest and only 10% is closed canopy forest. This indicates that more work should be expended in protecting the closed canopy forests from degradation, through effective measures to prevent encroachment, fire management, and closing these forests to extraction. likewise, there should be a deliberate effort to protect the open canopy forests from further degradation, and to initiate massive timber stand improvement (TSI) and enrichment plantings in these areas. Table 5 shows the different forest classifications adopted by the country in various years In 1934 for example, the Bureau of Forestry has these official forest classifications:
• Old growth dipterocarp • Broad leaved forests • Pine – coniferous forests in the Cordillera Region, and Provinces of Mindoro and
Zambales • Seasonal molave (Vitex parviflora) • Seasonal without molave • Bamboo • Mossy (unproductive) • Midmountain forests
25
Table 5. Philippine forest cover classification, various years (in mil hForest Type 1934 1941 1969 1988 2003
Old-growth dipt 10.70 5.30 0.99 Closed forest 2.56Open forest 4.03Commercial forest 13.52 Non-commercial forest 3.72 Residual dipt, Second growth 3.30 3.41 Broad-leaved forest 2.50 Pine (Pinus ) 0.50 0.20 0.24 Seasonal molave (Vitex 0.40 Seasonal without molave 0.40 Mangrove 0.30 0.14 0.25Forest plantation 0.33Bamboo 0.03 Mossy, unproductive 0.70 1.80 1.14 Sub marginal 0.54 Mid-mountain 1.90 Total forest area 17.18 17.24 10.90 6.46 7.17 % of country area 57.30 58.22 36.30 21.50 23.90Note: Forest classification for a given year corresponds to forest types with statistical enSource: State of Philippine Forest, 2005 (A DENR briefing material)..1934 - Bureau of Forestry Map, 1934.1941 - Bureau of Forestry1969 - Nationwide Forest Inventory (Bureau of Forestry).1988 - RP-German National Forest Resources Inventory (DENR)2003 - National Mapping and Resources Inventory Authority (NAMRIA, DENR). There were other subclassifications of forests in other years like in 1941 when forest areas were classified into commercial and non-commercial forests. In 1969, the first nationwide forest inventory was conducted which was the basis of new official forest classification as follows:
• Old growth dipterocarp – dipterocarp forests not yet subject to logging operations • Residual dipterocarp – referring to dipterocarp forest areas that were subject to
logging and were then growing in volume • Pine Forests • Mangrove, which was still further divided into old growth and young growth • Mossy
The 1988 forest resources inventory mainly adopted the 1969 terminologies with only some modifications. However, the 2003 forest classification introduced a totally new forest type classification. The complete breakdown of detailed terms used in 2003 forest inventories as both conducted by NAMRIA (2003) DENR through FMB (2004-2005) is
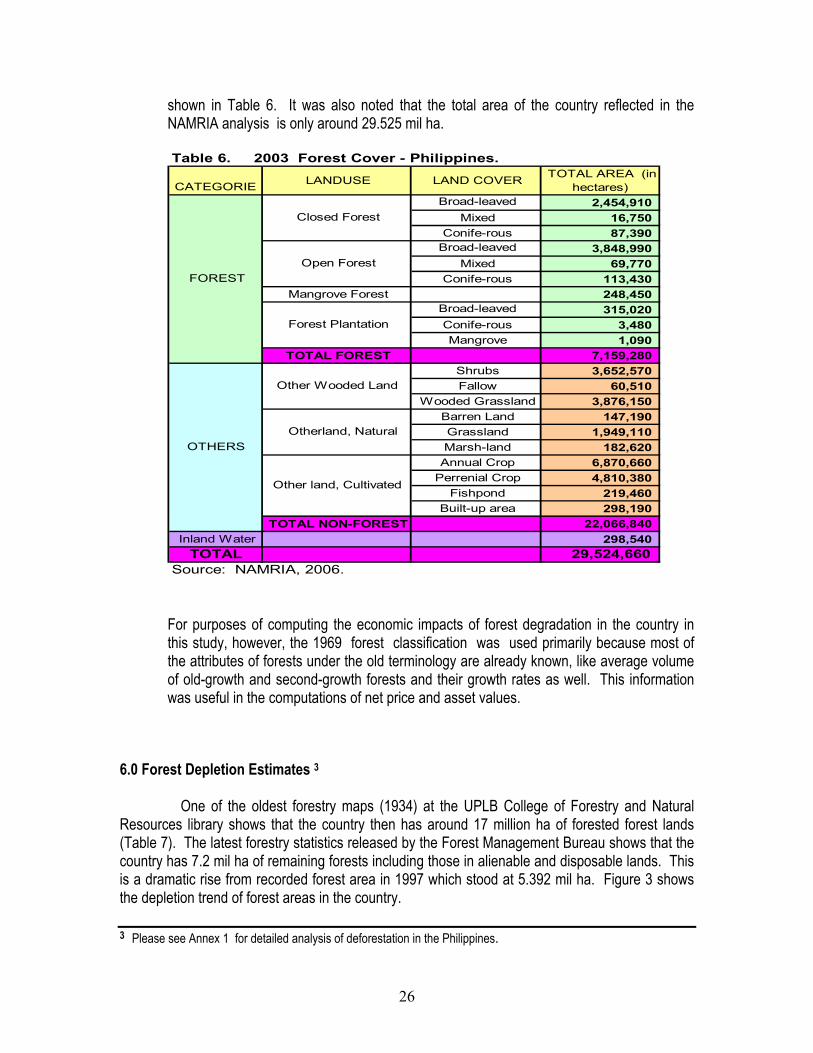
26
shown in Table 6. It was also noted that the total area of the country reflected in the NAMRIA analysis is only around 29.525 mil ha. Table 6. 2003 Forest Cover - Philippines.
CATEGORIE LANDUSE LAND COVER TOTAL AREA (in
hectares) Broad-leaved 2,454,910
Mixed 16,750 Conife-rous 87,390
Broad-leaved 3,848,990 Mixed 69,770
Conife-rous 113,430 Mangrove Forest 248,450
Broad-leaved 315,020 Conife-rous 3,480 Mangrove 1,090
TOTAL FOREST 7,159,280 Shrubs 3,652,570 Fallow 60,510
Wooded Grassland 3,876,150 Barren Land 147,190 Grassland 1,949,110 Marsh-land 182,620 Annual Crop 6,870,660
Perrenial Crop 4,810,380 Fishpond 219,460
Built-up area 298,190 TOTAL NON-FOREST 22,066,840
Inland Water 298,540 TOTAL 29,524,660
Source: NAMRIA, 2006.
FOREST
Closed Forest
Open Forest
Forest Plantation
OTHERS
Other Wooded Land
Otherland, Natural
Other land, Cultivated
For purposes of computing the economic impacts of forest degradation in the country in this study, however, the 1969 forest classification was used primarily because most of the attributes of forests under the old terminology are already known, like average volume of old-growth and second-growth forests and their growth rates as well. This information was useful in the computations of net price and asset values.
6.0 Forest Depletion Estimates 3
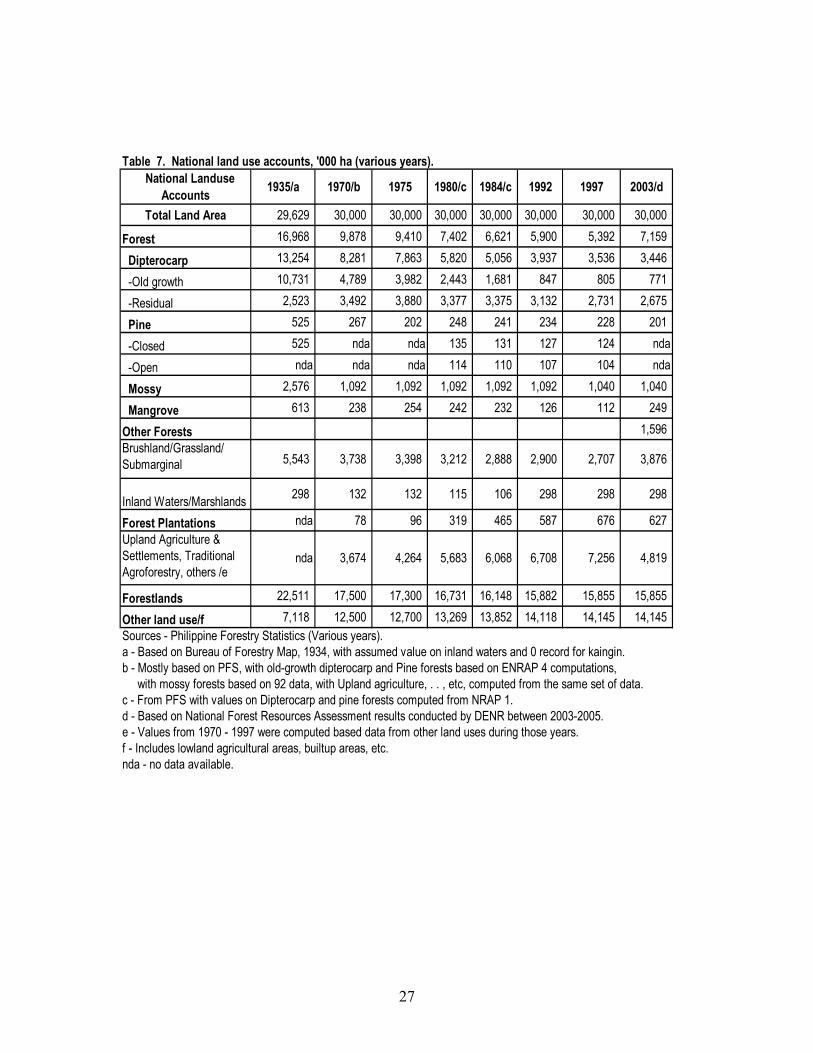
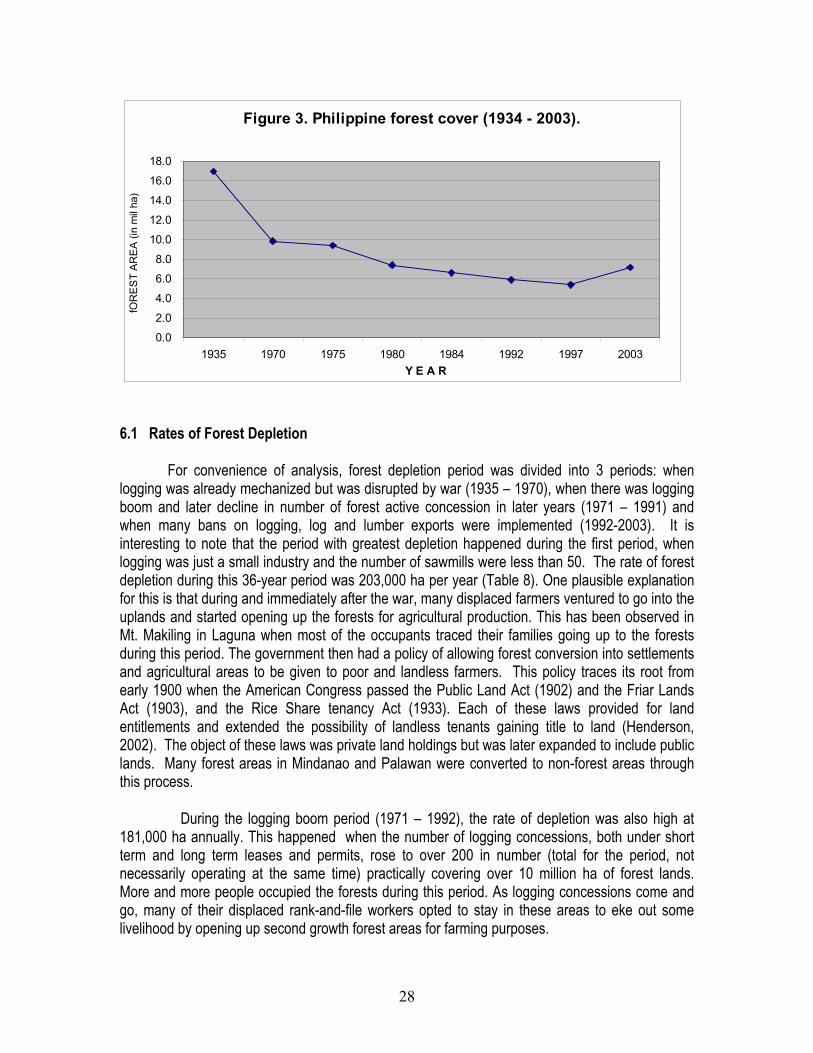
One of the oldest forestry maps (1934) at the UPLB College of Forestry and Natural Resources library shows that the country then has around 17 million ha of forested forest lands (Table 7). The latest forestry statistics released by the Forest Management Bureau shows that the country has 7.2 mil ha of remaining forests including those in alienable and disposable lands. This is a dramatic rise from recorded forest area in 1997 which stood at 5.392 mil ha. Figure 3 shows the depletion trend of forest areas in the country. 3 Please see Annex 1 for detailed analysis of deforestation in the Philippines.
27
Table 7. National land use accounts, '000 ha (various years).
National Landuse Accounts 1935/a 1970/b 1975 1980/c 1984/c 1992 1997 2003/d
Total Land Area 29,629 30,000 30,000 30,000 30,000 30,000 30,000 30,000
Forest 16,968 9,878 9,410 7,402 6,621 5,900 5,392 7,159
Dipterocarp 13,254 8,281 7,863 5,820 5,056 3,937 3,536 3,446
-Old growth 10,731 4,789 3,982 2,443 1,681 847 805 771
-Residual 2,523 3,492 3,880 3,377 3,375 3,132 2,731 2,675
Pine 525 267 202 248 241 234 228 201
-Closed 525 nda nda 135 131 127 124 nda
-Open nda nda nda 114 110 107 104 nda
Mossy 2,576 1,092 1,092 1,092 1,092 1,092 1,040 1,040
Mangrove 613 238 254 242 232 126 112 249
Other Forests 1,596Brushland/Grassland/ Submarginal 5,543 3,738 3,398 3,212 2,888 2,900 2,707 3,876
Inland Waters/Marshlands 298 132 132 115 106 298 298 298
Forest Plantations nda 78 96 319 465 587 676 627Upland Agriculture & Settlements, Traditional Agroforestry, others /e
nda 3,674 4,264 5,683 6,068 6,708 7,256 4,819
Forestlands 22,511 17,500 17,300 16,731 16,148 15,882 15,855 15,855
Other land use/f 7,118 12,500 12,700 13,269 13,852 14,118 14,145 14,145Sources - Philippine Forestry Statistics (Various years).a - Based on Bureau of Forestry Map, 1934, with assumed value on inland waters and 0 record for kaingin.b - Mostly based on PFS, with old-growth dipterocarp and Pine forests based on ENRAP 4 computations, with mossy forests based on 92 data, with Upland agriculture, . . , etc, computed from the same set of data.c - From PFS with values on Dipterocarp and pine forests computed from NRAP 1. d - Based on National Forest Resources Assessment results conducted by DENR between 2003-2005. e - Values from 1970 - 1997 were computed based data from other land uses during those years.f - Includes lowland agricultural areas, builtup areas, etc.nda - no data available.
28
Figure 3. Philippine forest cover (1934 - 2003).
0.0
2.0
4.0
6.0
8.0
10.0
12.0
14.0
16.0
18.0
1935 1970 1975 1980 1984 1992 1997 2003Y E A R
fOR
ES
T A
RE
A (i
n m
il ha
)
6.1 Rates of Forest Depletion
For convenience of analysis, forest depletion period was divided into 3 periods: when logging was already mechanized but was disrupted by war (1935 – 1970), when there was logging boom and later decline in number of forest active concession in later years (1971 – 1991) and when many bans on logging, log and lumber exports were implemented (1992-2003). It is interesting to note that the period with greatest depletion happened during the first period, when logging was just a small industry and the number of sawmills were less than 50. The rate of forest depletion during this 36-year period was 203,000 ha per year (Table 8). One plausible explanation for this is that during and immediately after the war, many displaced farmers ventured to go into the uplands and started opening up the forests for agricultural production. This has been observed in Mt. Makiling in Laguna when most of the occupants traced their families going up to the forests during this period. The government then had a policy of allowing forest conversion into settlements and agricultural areas to be given to poor and landless farmers. This policy traces its root from early 1900 when the American Congress passed the Public Land Act (1902) and the Friar Lands Act (1903), and the Rice Share tenancy Act (1933). Each of these laws provided for land entitlements and extended the possibility of landless tenants gaining title to land (Henderson, 2002). The object of these laws was private land holdings but was later expanded to include public lands. Many forest areas in Mindanao and Palawan were converted to non-forest areas through this process.
During the logging boom period (1971 – 1992), the rate of depletion was also high at 181,000 ha annually. This happened when the number of logging concessions, both under short term and long term leases and permits, rose to over 200 in number (total for the period, not necessarily operating at the same time) practically covering over 10 million ha of forest lands. More and more people occupied the forests during this period. As logging concessions come and go, many of their displaced rank-and-file workers opted to stay in these areas to eke out some livelihood by opening up second growth forest areas for farming purposes.
29
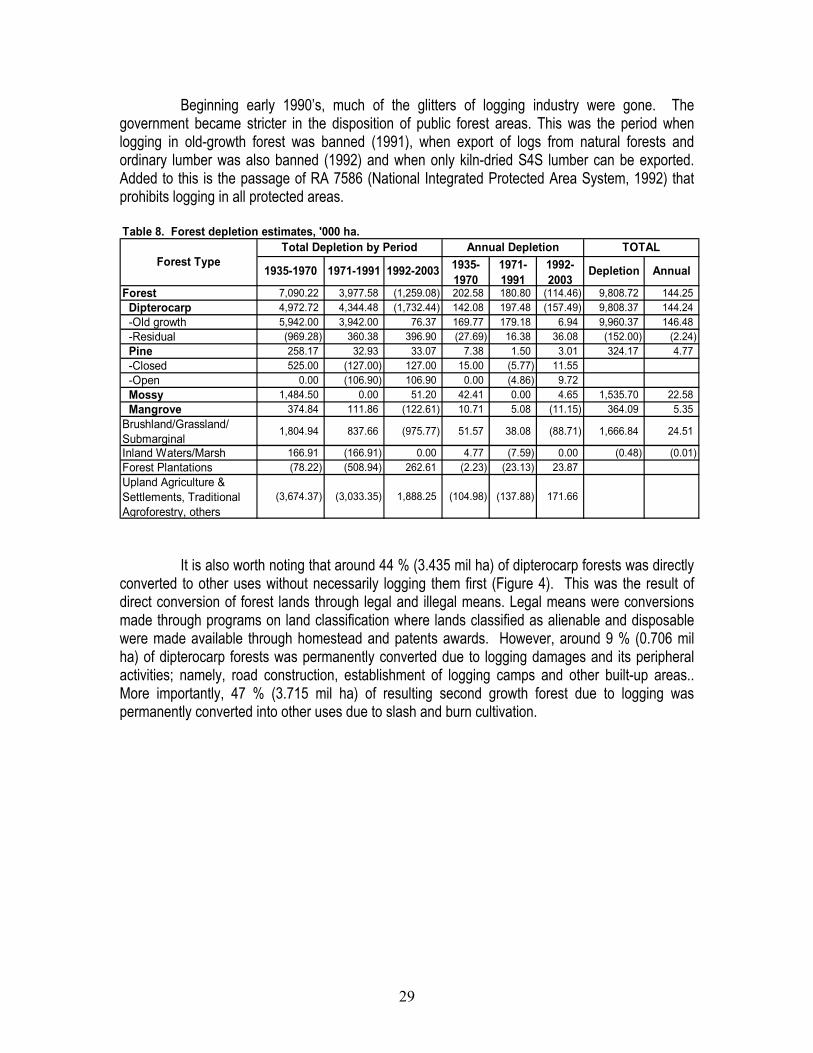
Beginning early 1990’s, much of the glitters of logging industry were gone. The government became stricter in the disposition of public forest areas. This was the period when logging in old-growth forest was banned (1991), when export of logs from natural forests and ordinary lumber was also banned (1992) and when only kiln-dried S4S lumber can be exported. Added to this is the passage of RA 7586 (National Integrated Protected Area System, 1992) that prohibits logging in all protected areas. Table 8. Forest depletion estimates, '000 ha.
Forest 7,090.22 3,977.58 (1,259.08) 202.58 180.80 (114.46) 9,808.72 144.25 Dipterocarp 4,972.72 4,344.48 (1,732.44) 142.08 197.48 (157.49) 9,808.37 144.24 -Old growth 5,942.00 3,942.00 76.37 169.77 179.18 6.94 9,960.37 146.48 -Residual (969.28) 360.38 396.90 (27.69) 16.38 36.08 (152.00) (2.24) Pine 258.17 32.93 33.07 7.38 1.50 3.01 324.17 4.77 -Closed 525.00 (127.00) 127.00 15.00 (5.77) 11.55 -Open 0.00 (106.90) 106.90 0.00 (4.86) 9.72 Mossy 1,484.50 0.00 51.20 42.41 0.00 4.65 1,535.70 22.58 Mangrove 374.84 111.86 (122.61) 10.71 5.08 (11.15) 364.09 5.35Brushland/Grassland/ Submarginal
1,804.94 837.66 (975.77) 51.57 38.08 (88.71) 1,666.84 24.51
Inland Waters/Marsh 166.91 (166.91) 0.00 4.77 (7.59) 0.00 (0.48) (0.01)Forest Plantations (78.22) (508.94) 262.61 (2.23) (23.13) 23.87 Upland Agriculture & Settlements, Traditional Agroforestry, others
(3,674.37) (3,033.35) 1,888.25 (104.98) (137.88) 171.66
1971-1991
1992-2003
Forest Type1935-1970 1971-1991 1992-2003
TOTAL
Depletion Annual
Total Depletion by Period Annual Depletion 1935-1970
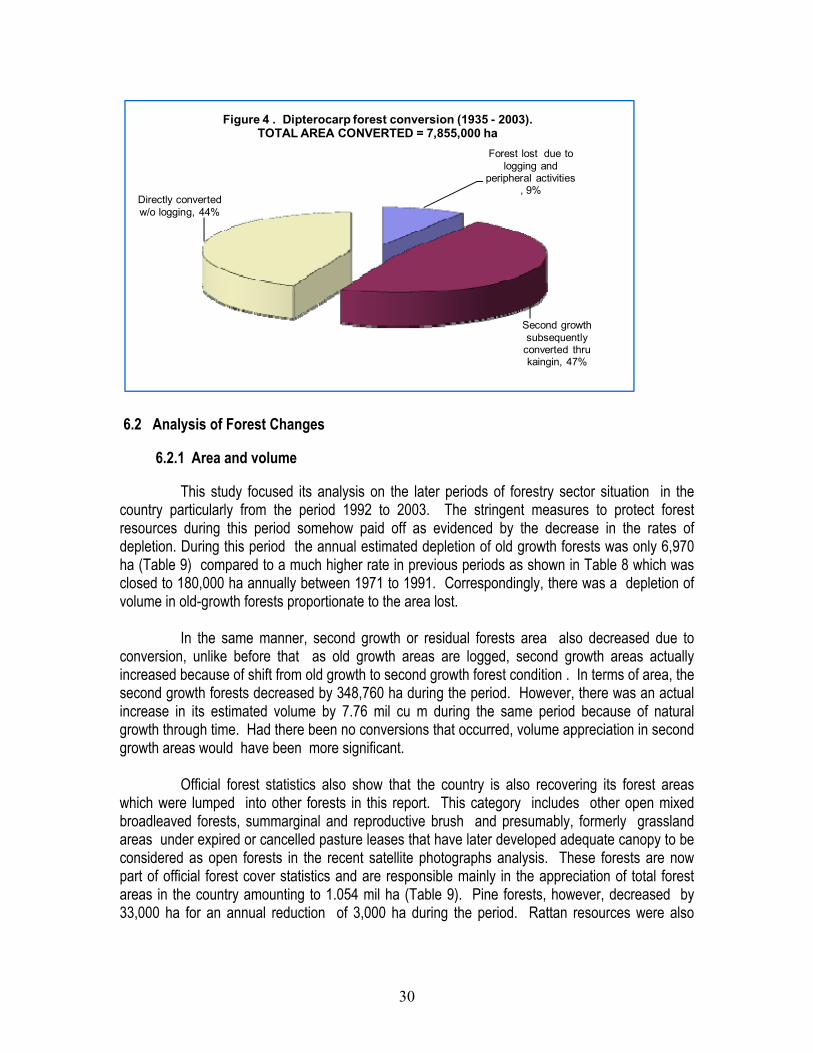
It is also worth noting that around 44 % (3.435 mil ha) of dipterocarp forests was directly converted to other uses without necessarily logging them first (Figure 4). This was the result of direct conversion of forest lands through legal and illegal means. Legal means were conversions made through programs on land classification where lands classified as alienable and disposable were made available through homestead and patents awards. However, around 9 % (0.706 mil ha) of dipterocarp forests was permanently converted due to logging damages and its peripheral activities; namely, road construction, establishment of logging camps and other built-up areas.. More importantly, 47 % (3.715 mil ha) of resulting second growth forest due to logging was permanently converted into other uses due to slash and burn cultivation.
30
Forest lost due to logging and
peripheral activities , 9%
Second growth subsequently
converted thru kaingin, 47%
Directly converted w/o logging, 44%
Figure 4 . Dipterocarp forest conversion (1935 - 2003). TOTAL AREA CONVERTED = 7,855,000 ha
6.2 Analysis of Forest Changes
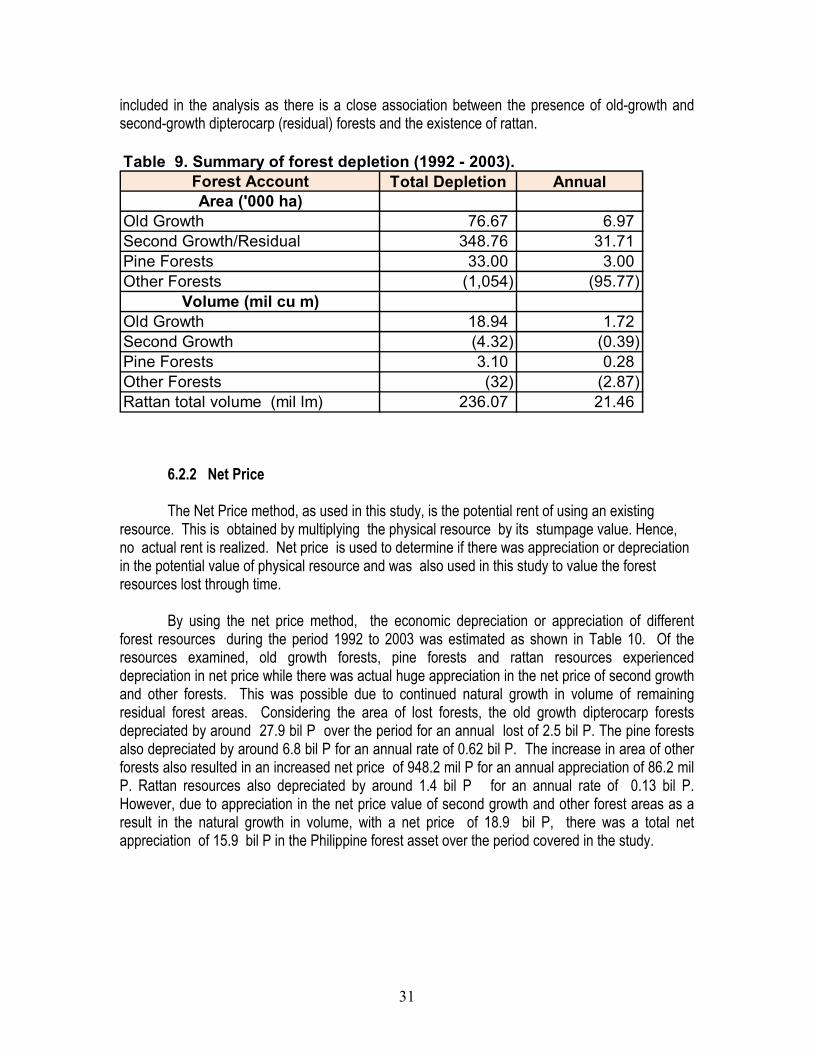
6.2.1 Area and volume This study focused its analysis on the later periods of forestry sector situation in the country particularly from the period 1992 to 2003. The stringent measures to protect forest resources during this period somehow paid off as evidenced by the decrease in the rates of depletion. During this period the annual estimated depletion of old growth forests was only 6,970 ha (Table 9) compared to a much higher rate in previous periods as shown in Table 8 which was closed to 180,000 ha annually between 1971 to 1991. Correspondingly, there was a depletion of volume in old-growth forests proportionate to the area lost. In the same manner, second growth or residual forests area also decreased due to conversion, unlike before that as old growth areas are logged, second growth areas actually increased because of shift from old growth to second growth forest condition . In terms of area, the second growth forests decreased by 348,760 ha during the period. However, there was an actual increase in its estimated volume by 7.76 mil cu m during the same period because of natural growth through time. Had there been no conversions that occurred, volume appreciation in second growth areas would have been more significant. Official forest statistics also show that the country is also recovering its forest areas which were lumped into other forests in this report. This category includes other open mixed broadleaved forests, summarginal and reproductive brush and presumably, formerly grassland areas under expired or cancelled pasture leases that have later developed adequate canopy to be considered as open forests in the recent satellite photographs analysis. These forests are now part of official forest cover statistics and are responsible mainly in the appreciation of total forest areas in the country amounting to 1.054 mil ha (Table 9). Pine forests, however, decreased by 33,000 ha for an annual reduction of 3,000 ha during the period. Rattan resources were also
31
included in the analysis as there is a close association between the presence of old-growth and second-growth dipterocarp (residual) forests and the existence of rattan.
Forest Account Total Depletion AnnualArea ('000 ha)
Old Growth 76.67 6.97Second Growth/Residual 348.76 31.71Pine Forests 33.00 3.00Other Forests (1,054) (95.77)
Volume (mil cu m)Old Growth 18.94 1.72Second Growth (4.32) (0.39)Pine Forests 3.10 0.28Other Forests (32) (2.87)Rattan total volume (mil lm) 236.07 21.46
Table 9. Summary of forest depletion (1992 - 2003).
6.2.2 Net Price
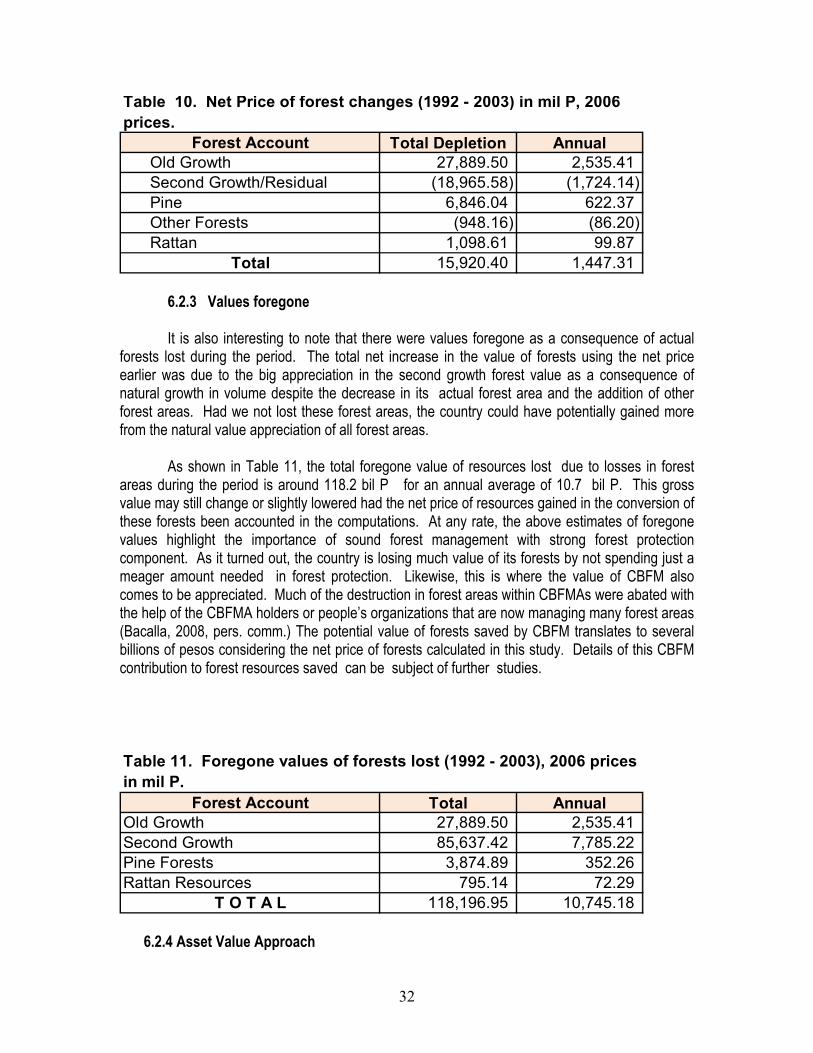
The Net Price method, as used in this study, is the potential rent of using an existing resource. This is obtained by multiplying the physical resource by its stumpage value. Hence, no actual rent is realized. Net price is used to determine if there was appreciation or depreciation in the potential value of physical resource and was also used in this study to value the forest resources lost through time. By using the net price method, the economic depreciation or appreciation of different forest resources during the period 1992 to 2003 was estimated as shown in Table 10. Of the resources examined, old growth forests, pine forests and rattan resources experienced depreciation in net price while there was actual huge appreciation in the net price of second growth and other forests. This was possible due to continued natural growth in volume of remaining residual forest areas. Considering the area of lost forests, the old growth dipterocarp forests depreciated by around 27.9 bil P over the period for an annual lost of 2.5 bil P. The pine forests also depreciated by around 6.8 bil P for an annual rate of 0.62 bil P. The increase in area of other forests also resulted in an increased net price of 948.2 mil P for an annual appreciation of 86.2 mil P. Rattan resources also depreciated by around 1.4 bil P for an annual rate of 0.13 bil P. However, due to appreciation in the net price value of second growth and other forest areas as a result in the natural growth in volume, with a net price of 18.9 bil P, there was a total net appreciation of 15.9 bil P in the Philippine forest asset over the period covered in the study.
32
Forest Account Total Depletion AnnualOld Growth 27,889.50 2,535.41Second Growth/Residual (18,965.58) (1,724.14)Pine 6,846.04 622.37Other Forests (948.16) (86.20)Rattan 1,098.61 99.87
Total 15,920.40 1,447.31
Table 10. Net Price of forest changes (1992 - 2003) in mil P, 2006 prices.
6.2.3 Values foregone It is also interesting to note that there were values foregone as a consequence of actual forests lost during the period. The total net increase in the value of forests using the net price earlier was due to the big appreciation in the second growth forest value as a consequence of natural growth in volume despite the decrease in its actual forest area and the addition of other forest areas. Had we not lost these forest areas, the country could have potentially gained more from the natural value appreciation of all forest areas. As shown in Table 11, the total foregone value of resources lost due to losses in forest areas during the period is around 118.2 bil P for an annual average of 10.7 bil P. This gross value may still change or slightly lowered had the net price of resources gained in the conversion of these forests been accounted in the computations. At any rate, the above estimates of foregone values highlight the importance of sound forest management with strong forest protection component. As it turned out, the country is losing much value of its forests by not spending just a meager amount needed in forest protection. Likewise, this is where the value of CBFM also comes to be appreciated. Much of the destruction in forest areas within CBFMAs were abated with the help of the CBFMA holders or people’s organizations that are now managing many forest areas (Bacalla, 2008, pers. comm.) The potential value of forests saved by CBFM translates to several billions of pesos considering the net price of forests calculated in this study. Details of this CBFM contribution to forest resources saved can be subject of further studies.
Forest Account Total AnnualOld Growth 27,889.50 2,535.41Second Growth 85,637.42 7,785.22Pine Forests 3,874.89 352.26Rattan Resources 795.14 72.29
T O T A L 118,196.95 10,745.18
Table 11. Foregone values of forests lost (1992 - 2003), 2006 prices in mil P.
6.2.4 Asset Value Approach
33
The asset value approach was appropriately applied to second growth forests where utilization is allowed per current policies, especially in production forests that are yet to be finally identified on the ground. Nevertheless, enough safeguards for sustainability of resources were inputted in the calculations that were heavily leaned on the conservative side. Several assumptions were made and these are also shown in Appendix Tables 8 – 10 provided in Annex 2. Three Scenarios were chosen to emphasize the utility of asset value approach. These scenarios are management regimes hypothetically applied over a 25 year period. These are potential policy options that the Philippine government could take among an array of options for second growth forests and include the following scenarios:
a. Scenario 1. Optimum sustainable harvest options in production forests including non-timber products (NTFPs) utilization using accepted modes under the 1987 Philippine Constitution. Assumptions: A total of 1.722 million ha shall be earmarked as permanent production forests where timber harvests can be allowed. These areas are composed primarily of second growth forests. Using a 40 year cutting cycle, around 30,000 ha of these forests shall be allowed for harvest each year. With an estimated average volume of 139.4 cu m/ha (this is a conservative estimate as mature second growth could have as much as 181 cu m/ha) and with a lot of safety factors, an average yield of 52 cu m per ha can be harvested from these second growth forests. There is also an underlying assumption that all production forests shall be managed and protected strictly as such and no conversion would be allowed to happen. Under this assumption, a potential sustainable harvest of 1.6 mil cu m realizable. This harvest is more than the natural forest timber requirement of the country which is around 1.2 mil cu m. (Please also refer to App. Table 8). b. Scenario 2. Status Quo (a continuation of current timber utilization system with TLA all expiring by 2011 and with limited utilization in IFMA, CBFM, and other areas, with NTFP utilization in production forests). Assumptions: A total of 6,000 ha are earmarked for annual harvesting as a continuation of current harvesting rate but to decrease through time as more TLAs expire. A total of 0.3 mil cu m of harvest is realizable under this option annually. c. Scenario 3. Total Logging Ban with NTFP utilization in production forests. Assumptions: Still 1.722 mil ha of forest to be earmarked as production forests but only the NTFPs would be allowed to be utilized within production forests.
Other scenarios could have been chosen and maybe subjected to further studies. The above options nevertheless represent three possible policy directions the government could take in the management of production forests and were used to illustrate the asset value approach. Under this exercise, it can be noted that the asset value approach draws its strength in distinguishing the economic superiority of specific policy options or interventions in a formal market system using discounting and constant market prices. The resulting asset values are actually net present values (NPV) of chosen scenarios.
34
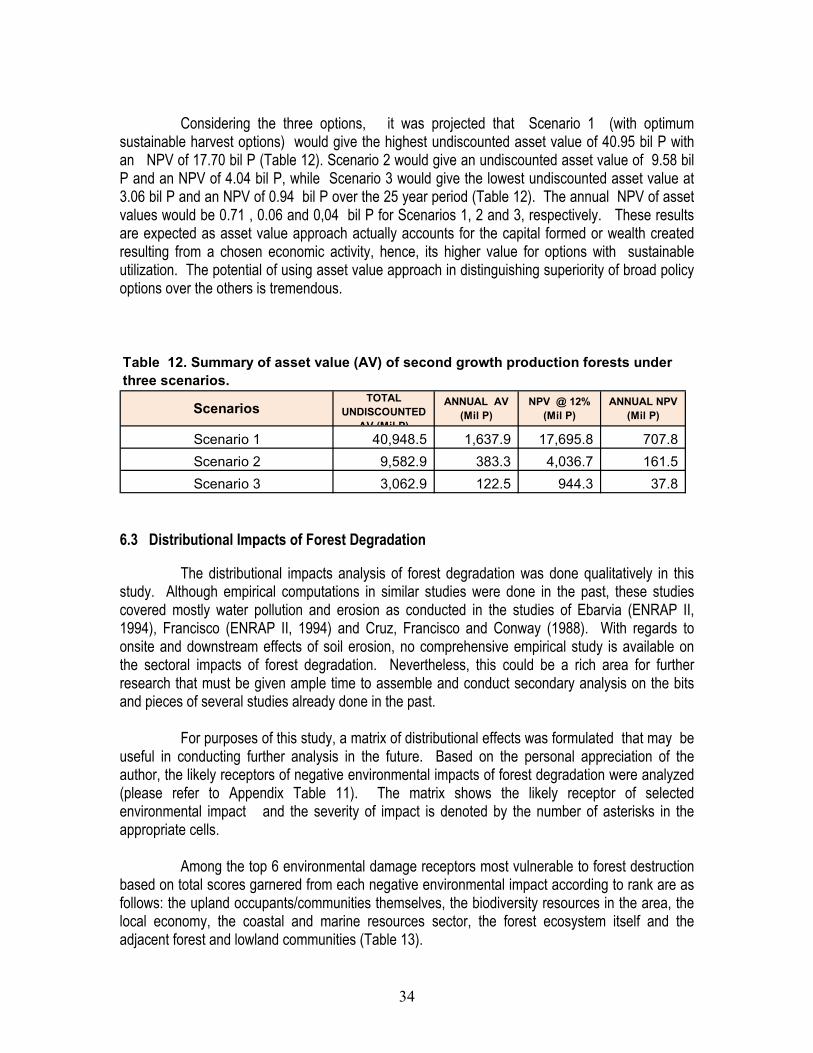
Considering the three options, it was projected that Scenario 1 (with optimum sustainable harvest options) would give the highest undiscounted asset value of 40.95 bil P with an NPV of 17.70 bil P (Table 12). Scenario 2 would give an undiscounted asset value of 9.58 bil P and an NPV of 4.04 bil P, while Scenario 3 would give the lowest undiscounted asset value at 3.06 bil P and an NPV of 0.94 bil P over the 25 year period (Table 12). The annual NPV of asset values would be 0.71 , 0.06 and 0,04 bil P for Scenarios 1, 2 and 3, respectively. These results are expected as asset value approach actually accounts for the capital formed or wealth created resulting from a chosen economic activity, hence, its higher value for options with sustainable utilization. The potential of using asset value approach in distinguishing superiority of broad policy options over the others is tremendous.
ScenariosTOTAL
UNDISCOUNTED AV (Mil P)
ANNUAL AV (Mil P)
NPV @ 12% (Mil P)
ANNUAL NPV (Mil P)
Scenario 1 40,948.5 1,637.9 17,695.8 707.8Scenario 2 9,582.9 383.3 4,036.7 161.5Scenario 3 3,062.9 122.5 944.3 37.8
Table 12. Summary of asset value (AV) of second growth production forests under three scenarios.
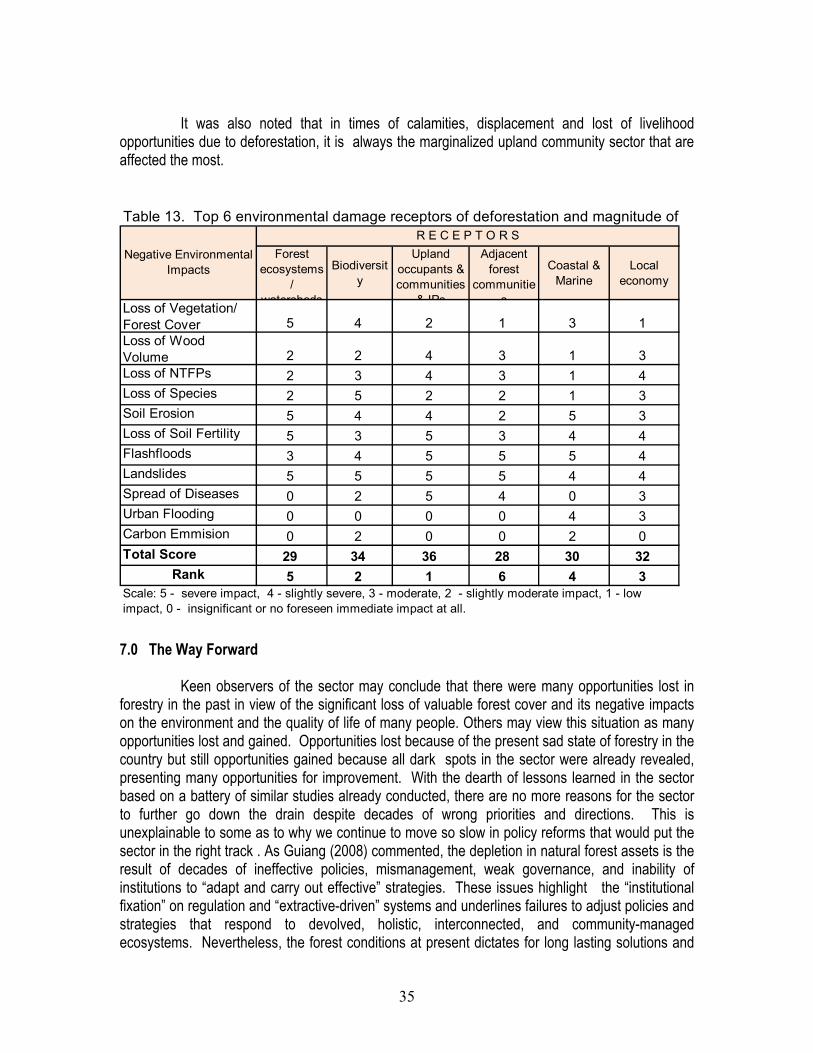
6.3 Distributional Impacts of Forest Degradation The distributional impacts analysis of forest degradation was done qualitatively in this study. Although empirical computations in similar studies were done in the past, these studies covered mostly water pollution and erosion as conducted in the studies of Ebarvia (ENRAP II, 1994), Francisco (ENRAP II, 1994) and Cruz, Francisco and Conway (1988). With regards to onsite and downstream effects of soil erosion, no comprehensive empirical study is available on the sectoral impacts of forest degradation. Nevertheless, this could be a rich area for further research that must be given ample time to assemble and conduct secondary analysis on the bits and pieces of several studies already done in the past. For purposes of this study, a matrix of distributional effects was formulated that may be useful in conducting further analysis in the future. Based on the personal appreciation of the author, the likely receptors of negative environmental impacts of forest degradation were analyzed (please refer to Appendix Table 11). The matrix shows the likely receptor of selected environmental impact and the severity of impact is denoted by the number of asterisks in the appropriate cells. Among the top 6 environmental damage receptors most vulnerable to forest destruction based on total scores garnered from each negative environmental impact according to rank are as follows: the upland occupants/communities themselves, the biodiversity resources in the area, the local economy, the coastal and marine resources sector, the forest ecosystem itself and the adjacent forest and lowland communities (Table 13).
35
It was also noted that in times of calamities, displacement and lost of livelihood opportunities due to deforestation, it is always the marginalized upland community sector that are affected the most. Table 13. Top 6 environmental damage receptors of deforestation and magnitude of
Forest ecosystems
/ watersheds
Biodiversity
Upland occupants & communities
& IPs
Adjacent forest
communities
Coastal & Marine
Local economy
Loss of Vegetation/ Forest Cover 5 4 2 1 3 1Loss of Wood Volume 2 2 4 3 1 3Loss of NTFPs 2 3 4 3 1 4Loss of Species 2 5 2 2 1 3Soil Erosion 5 4 4 2 5 3Loss of Soil Fertility 5 3 5 3 4 4Flashfloods 3 4 5 5 5 4Landslides 5 5 5 5 4 4Spread of Diseases 0 2 5 4 0 3Urban Flooding 0 0 0 0 4 3Carbon Emmision 0 2 0 0 2 0Total Score 29 34 36 28 30 32
Rank 5 2 1 6 4 3
Negative Environmental Impacts
R E C E P T O R S
Scale: 5 - severe impact, 4 - slightly severe, 3 - moderate, 2 - slightly moderate impact, 1 - low impact, 0 - insignificant or no foreseen immediate impact at all.
7.0 The Way Forward Keen observers of the sector may conclude that there were many opportunities lost in forestry in the past in view of the significant loss of valuable forest cover and its negative impacts on the environment and the quality of life of many people. Others may view this situation as many opportunities lost and gained. Opportunities lost because of the present sad state of forestry in the country but still opportunities gained because all dark spots in the sector were already revealed, presenting many opportunities for improvement. With the dearth of lessons learned in the sector based on a battery of similar studies already conducted, there are no more reasons for the sector to further go down the drain despite decades of wrong priorities and directions. This is unexplainable to some as to why we continue to move so slow in policy reforms that would put the sector in the right track . As Guiang (2008) commented, the depletion in natural forest assets is the result of decades of ineffective policies, mismanagement, weak governance, and inability of institutions to “adapt and carry out effective” strategies. These issues highlight the “institutional fixation” on regulation and “extractive-driven” systems and underlines failures to adjust policies and strategies that respond to devolved, holistic, interconnected, and community-managed ecosystems. Nevertheless, the forest conditions at present dictates for long lasting solutions and
36
adherence to long term plans that have been well-thought and formulated. The glitters of current popular concerns to gain media mileage must not distract the career forestry professionals from pursuing right steps towards resource sustainability. 7.1 Proposed Interventions
Below are proposed interventions this study offer to help solve forest degradation problems in the country and identify the paths towards resource sustainability. Each intervention is not exclusive of the others, as the problems in the sector may not be solved entirely by just one group of interventions alone. As designed, a specific intervention required a group of activities that are supportive of each other. Under each intervention, a description is provided together with stressors being addressed, some basic assumptions and support activities necessary for the interventions to take place. A general requisite along these interventions is the need to refocus the public forest administration in the country to be more facilitative, be more concentrated on development and enterprise functions, and be less regulatory. This would entail curtailing or complete removal of DENR’s regulatory functions and transferring them to a more localized regulatory body backed up by a lean national agency under the DENR to coordinate and give guidance to this local body. Although there is always a wisdom of doing regulation on national scope because of less familiarity, hence, less abuse, such centralized regulation is much replete with knowledge on local development dynamics and greater local level participation.
The impacts of these interventions were then analyzed based on the assumptions made. Among the interventions considered in this study are described as follows: Intervention 1: Closing all open access areas by putting them under formal tenure or management system with formal/indicative plans formulated and being implemented on the ground. One strategic problem pervading in the Philippine uplands is the open-access nature of many forest areas in the country. Open access areas are those public forest areas with no formal management system, hence, open to possession or occupation by anyone who has guts and enterprising enough to do so. Many forest areas with cancelled, expired or suspended timber license agreements or any tenurial instrument for that matter had been subject to illegal occupation. This has been exacerbated by the phenomenally increasing population in the uplands, estimated to be between 20 to 25 million (RMPFD, 2003). Most of these people are totally or partially dependent on forest lands and resources for their livelihood. As most of the destructions in Philippine forests happened in open access areas, it is worthy to note how much open access areas the country still has. Based on 2006 Philippine Forestry Statistics (PFS), the total forest area under the formal tenure is around 11.388 mil ha including State held tenure on protected areas and reservations comprising 71.83 % of total forest lands (Table 14). Open access areas include areas with expired and cancelled instruments as well as
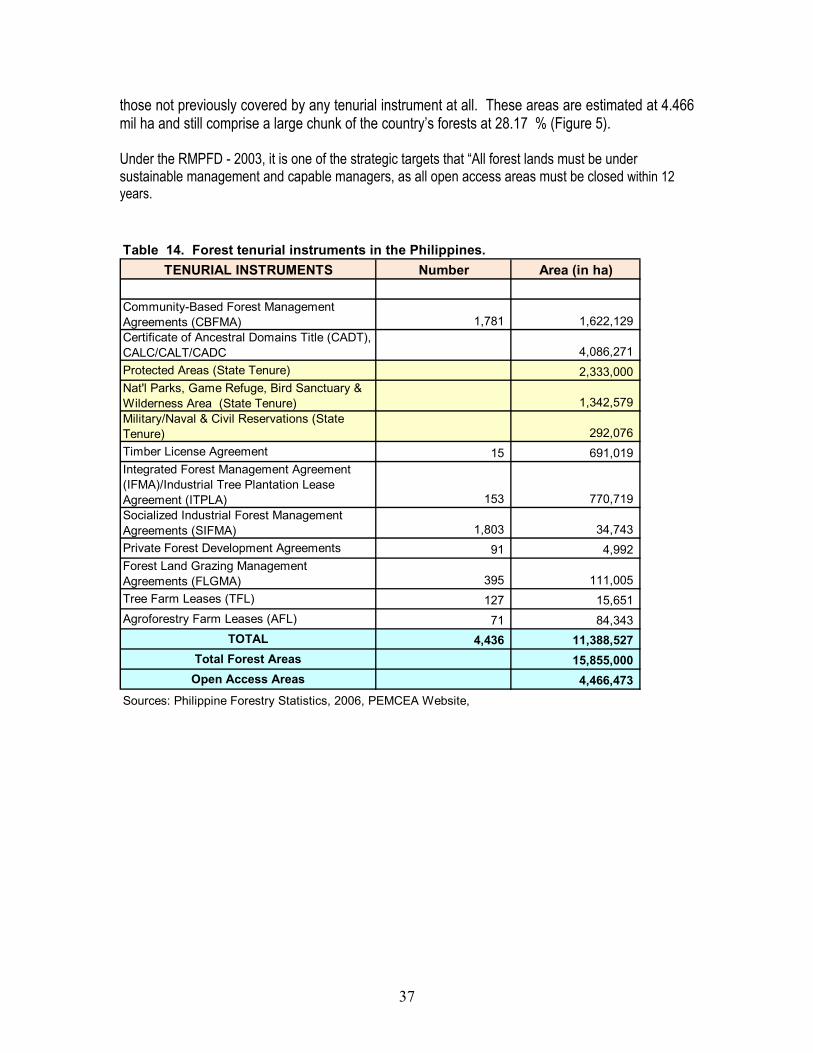
37
those not previously covered by any tenurial instrument at all. These areas are estimated at 4.466 mil ha and still comprise a large chunk of the country’s forests at 28.17 % (Figure 5). Under the RMPFD - 2003, it is one of the strategic targets that “All forest lands must be under sustainable management and capable managers, as all open access areas must be closed within 12 years. Table 14. Forest tenurial instruments in the Philippines.
TENURIAL INSTRUMENTS Number Area (in ha)
Community-Based Forest Management Agreements (CBFMA) 1,781 1,622,129 Certificate of Ancestral Domains Title (CADT), CALC/CALT/CADC 4,086,271 Protected Areas (State Tenure) 2,333,000 Nat'l Parks, Game Refuge, Bird Sanctuary & Wilderness Area (State Tenure) 1,342,579 Military/Naval & Civil Reservations (State Tenure) 292,076 Timber License Agreement 15 691,019 Integrated Forest Management Agreement (IFMA)/Industrial Tree Plantation Lease Agreement (ITPLA) 153 770,719 Socialized Industrial Forest Management Agreements (SIFMA) 1,803 34,743 Private Forest Development Agreements 91 4,992 Forest Land Grazing Management Agreements (FLGMA) 395 111,005 Tree Farm Leases (TFL) 127 15,651 Agroforestry Farm Leases (AFL) 71 84,343
TOTAL 4,436 11,388,527 Total Forest Areas 15,855,000
Open Access Areas 4,466,473Sources: Philippine Forestry Statistics, 2006, PEMCEA Website,
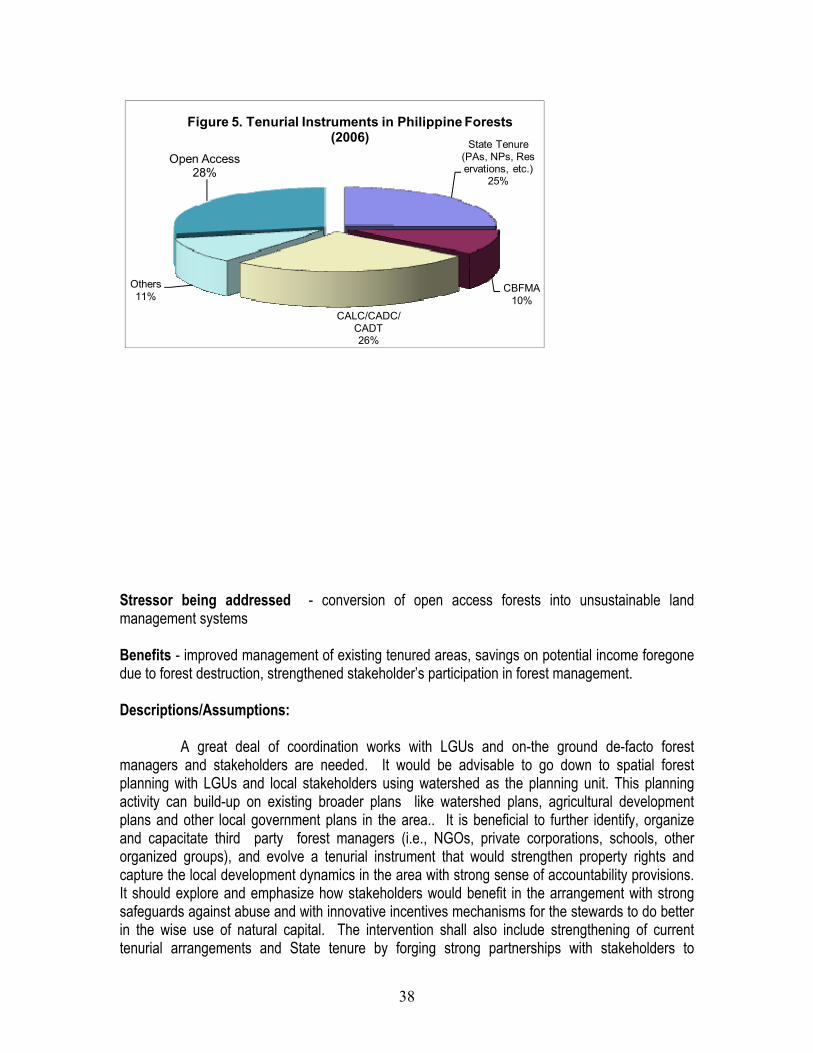
38
State Tenure (PAs, NPs, Reservations, etc.)
25%
CBFMA10%
CALC/CADC/ CADT26%
Others11%
Open Access28%
Figure 5. Tenurial Instruments in Philippine Forests (2006)
Stressor being addressed - conversion of open access forests into unsustainable land management systems Benefits - improved management of existing tenured areas, savings on potential income foregone due to forest destruction, strengthened stakeholder’s participation in forest management. Descriptions/Assumptions: A great deal of coordination works with LGUs and on-the ground de-facto forest managers and stakeholders are needed. It would be advisable to go down to spatial forest planning with LGUs and local stakeholders using watershed as the planning unit. This planning activity can build-up on existing broader plans like watershed plans, agricultural development plans and other local government plans in the area.. It is beneficial to further identify, organize and capacitate third party forest managers (i.e., NGOs, private corporations, schools, other organized groups), and evolve a tenurial instrument that would strengthen property rights and capture the local development dynamics in the area with strong sense of accountability provisions. It should explore and emphasize how stakeholders would benefit in the arrangement with strong safeguards against abuse and with innovative incentives mechanisms for the stewards to do better in the wise use of natural capital. The intervention shall also include strengthening of current tenurial arrangements and State tenure by forging strong partnerships with stakeholders to
39
promote long term investments that are both economically and environmentally feasible. As such, there should be redefinition of roles among stakeholders. The DENR, for example, should be more facilitative in promoting forest development and less regulatory. It should be noted that the best option under asset value approach which is sustainable utilization of forest resources can also be integrated in this intervention. Support activities: Strong policy and institutional support both at the national and local levels, piloting in few strategic areas and a focused information and education (IEC) program. Intervention 2: Rehabilitation of all forest lands needing rehabilitation (includes grasslands, brushlands and areas cultivated for annual crops) using different forest development schemes, e.g., commercial forest plantations, agroforestry, and reforestation for carbon market, among others, with the intention of making this investment profitable and sustainable. The government has been pouring in billions of pesos to reforestation. The country had the regular reforestation program since 1916 to 1988, had contract reforestation in 1989 to 1991, had the forestry sector project in 1996 to 2003, had the green Philippine highway lately and is contemplating to pour in additional billions of pesos to forest rehabilitation. However inefficient these past program were, it is still a necessary direction to attract money to reforestation. This time, however, it is imperative for the investors to make money out of this venture. This is a necessary condition for the investments in forestry to be sustainable. The RMPFD, 2003 estimated that the country only needs 460,000 ha of fully-established and well-managed forest plantations to supply the country’s plantation wood requirements with still enough to spare for export. All other areas may be developed for other purposes like watershed protection, biodiversity conservation, etc. The important thing here is for the investors to focus on a product and work their way backwards in order to attain the maximum yield and quality of timber or other forest crops that they intend to produce. In the process, all areas to be developed will be granted tenure for long term management, hence, will also close open access areas to be covered by rehabilitation. The phase of development depends on the strength of buy-ins among interested developers that include the public sector. Likewise, it would be strategic for the government identify as early as possible, permanent production forest areas as well as areas intended as permanent protection forests. Stressors addressed – population and poverty in the uplands which are primary triggers of conversion of open access forests, and dwindling wood supply Support activities - Organizing investment fora; policy and technology support for value added processing; ensure strong buy-ins from LGUs, private investors, and communities through investment friendly policy environment; and strong technical assistance to investors. Other support activities include a workable and reliable information system including updated maps on where forest development options are possible; market assistance, market development, product diversification, forest certification, forest securitization, and promotion of value-added processing among legal forest products extractors, among others.
40
Intervention 3: Adoption and institutionalization of non-traditional forest development approaches/market-based instruments like employing and institutionalizing payments for environmental services (PES), equitable payment for watershed services (EPWS), watershed user’s fees (WUF), and other instruments with innovative financing mechanisms. For purposes of this paper, these payment mechanisms are lumped into the term PES. The idea of PES is to evolve and institutionalize a package of compensation mechanism for the developers and protectors of forests (the sellers) that provide environmental services for the users (the buyers) of such environmental services. Although on a broader coverage, PES may include institutionalization of corresponding fees and payments for using the environment with the idea of using the funds generated under these schemes in investing in environmentally sound activities. Under the concept of PES being proposed in this paper, an agreement shall be forged between the sellers and buyers of services where both parties assume certain responsibilities to ensure the sustainable flow of benefits to both sides. On its part, the government must ensure that it will provide the necessary environment in terms of policies and legal structures for negotiations to take place. A facilitator is needed to consummate the agreement. Such facilitator may also act as a monitor/auditor later to ensure compliance in the agreements. Under such setup, the incentives to develop and protect forest resources must be able to offset the opportunity costs of the sellers in engaging in such resource conserving activities in order to sustain their interest. In the same manner, the benefits derived by buyers must be significant enough to sustain their interest in the payments. The PES markets that are in various stages of development so far can be categorized into the following:
a. compliance market like carbon forestry, water quality, and biodiversity offsets, among others, whose drivers include emission cap, international protocols, trade agreements and government regulations;
b. voluntary markets like voluntary carbon forestry, voluntary watershed management payments, and voluntary biodiversity offsets, among others, whose drivers include corporate responsibility, private sector initiatives and voluntary PES agreements between or among concerned watershed stakeholders; and
c. government-mediated PES projects like that in China, Mexico and Danube whose drivers include internationally funded projects and government initiated PES.
Stressors addressed: lack of financing for sustainable forest development Support Activities: Piloting of PES, guidelines on institutionalization, organization of buyers and sellers group, and identification of measures on how to safeguard the sanctity of covenants between them 7.2 Total Economic Value of Interventions
41
A 25-year implementation period was used to analyze the total economic impacts of proposed interventions. All interventions selected in this study are likely to give positive economic results considering that they were chosen to address identified stressors in the environment with a presumption of eliminating activities that contribute to environmental degradation and to further enhance the forests’ environmental services. The analysis further considered that most of the identified services evaluated adds up to the total economic value of interventions. The TEV analysis shows that there is good economic wisdom in facilitating the closure of all open access areas (Intervention 1) as this option gave the second highest NPV among the interventions with 82.4 bil P at 12 % discount rate (Table 15). The bulk of benefits from this option comes from the savings on preventing natural forests conversion that gave a very high foregone value in the earlier sections using the net price method with an undiscounted total value of 197.2 bil P, followed by the regulating function, particularly soil erosion control that gave an undiscounted value of 166.4 bil P. The third highest value was provided by carbon uptake functions of forest with 131.4 bil P in undiscounted benefits (please also refer to Appendix Table 13)..
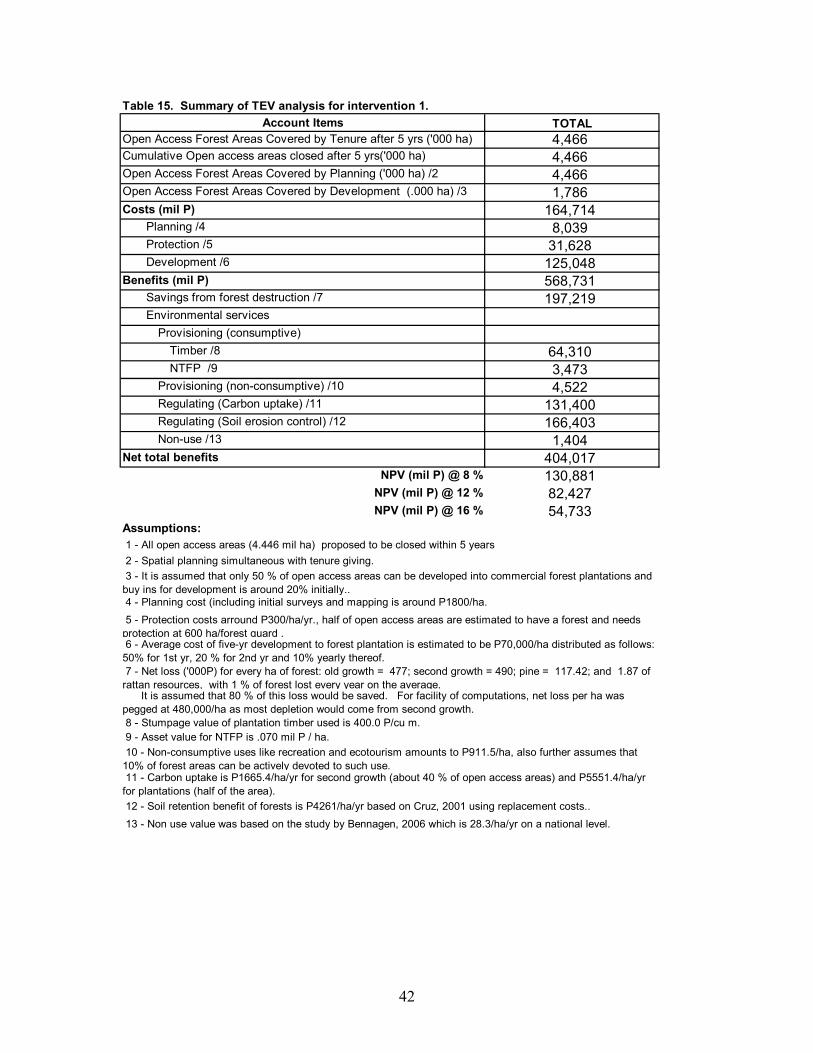
42
Table 15. Summary of TEV analysis for intervention 1.Account Items TOTAL
Open Access Forest Areas Covered by Tenure after 5 yrs ('000 ha) 4,466Cumulative Open access areas closed after 5 yrs('000 ha) 4,466Open Access Forest Areas Covered by Planning ('000 ha) /2 4,466Open Access Forest Areas Covered by Development (.000 ha) /3 1,786Costs (mil P) 164,714
Planning /4 8,039Protection /5 31,628Development /6 125,048
Benefits (mil P) 568,731Savings from forest destruction /7 197,219Environmental services
Provisioning (consumptive) Timber /8 64,310NTFP /9 3,473
Provisioning (non-consumptive) /10 4,522Regulating (Carbon uptake) /11 131,400Regulating (Soil erosion control) /12 166,403Non-use /13 1,404
Net total benefits 404,017NPV (mil P) @ 8 % 130,881
NPV (mil P) @ 12 % 82,427NPV (mil P) @ 16 % 54,733
Assumptions:
12 - Soil retention benefit of forests is P4261/ha/yr based on Cruz, 2001 using replacement costs.. 13 - Non use value was based on the study by Bennagen, 2006 which is 28.3/ha/yr on a national level.
7 - Net loss ('000P) for every ha of forest: old growth = 477; second growth = 490; pine = 117.42; and 1.87 of rattan resources, with 1 % of forest lost every year on the average. It is assumed that 80 % of this loss would be saved. For facility of computations, net loss per ha was pegged at 480,000/ha as most depletion would come from second growth. 8 - Stumpage value of plantation timber used is 400.0 P/cu m. 9 - Asset value for NTFP is .070 mil P / ha. 10 - Non-consumptive uses like recreation and ecotourism amounts to P911.5/ha, also further assumes that 10% of forest areas can be actively devoted to such use. 11 - Carbon uptake is P1665.4/ha/yr for second growth (about 40 % of open access areas) and P5551.4/ha/yr for plantations (half of the area).
1 - All open access areas (4.446 mil ha) proposed to be closed within 5 years 2 - Spatial planning simultaneous with tenure giving. 3 - It is assumed that only 50 % of open access areas can be developed into commercial forest plantations and buy ins for development is around 20% initially.. 4 - Planning cost (including initial surveys and mapping is around P1800/ha. 5 - Protection costs arround P300/ha/yr., half of open access areas are estimated to have a forest and needs protection at 600 ha/forest guard . 6 - Average cost of five-yr development to forest plantation is estimated to be P70,000/ha distributed as follows: 50% for 1st yr, 20 % for 2nd yr and 10% yearly thereof.
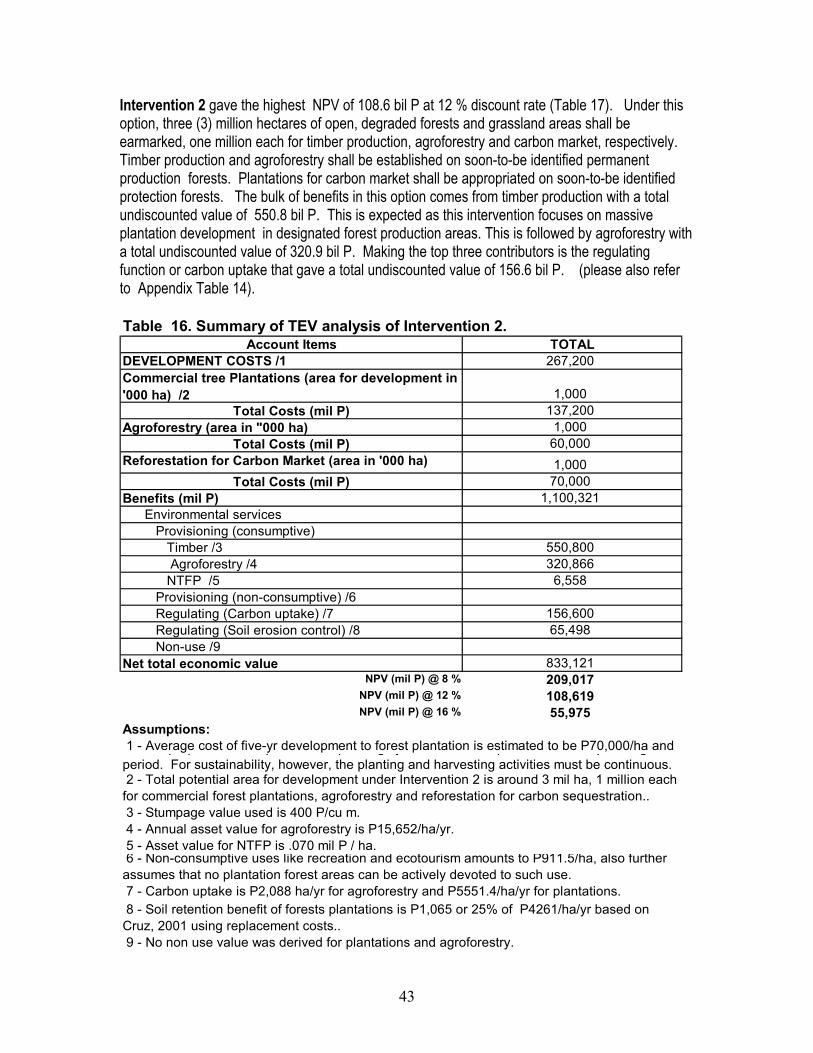
43
Intervention 2 gave the highest NPV of 108.6 bil P at 12 % discount rate (Table 17). Under this option, three (3) million hectares of open, degraded forests and grassland areas shall be earmarked, one million each for timber production, agroforestry and carbon market, respectively. Timber production and agroforestry shall be established on soon-to-be identified permanent production forests. Plantations for carbon market shall be appropriated on soon-to-be identified protection forests. The bulk of benefits in this option comes from timber production with a total undiscounted value of 550.8 bil P. This is expected as this intervention focuses on massive plantation development in designated forest production areas. This is followed by agroforestry with a total undiscounted value of 320.9 bil P. Making the top three contributors is the regulating function or carbon uptake that gave a total undiscounted value of 156.6 bil P. (please also refer to Appendix Table 14). Table 16. Summary of TEV analysis of Intervention 2.
Account Items TOTALDEVELOPMENT COSTS /1 267,200Commercial tree Plantations (area for development in '000 ha) /2 1,000
Total Costs (mil P) 137,200Agroforestry (area in "000 ha) 1,000
Total Costs (mil P) 60,000Reforestation for Carbon Market (area in '000 ha) 1,000
Total Costs (mil P) 70,000Benefits (mil P) 1,100,321
Environmental services Provisioning (consumptive)
Timber /3 550,800 Agroforestry /4 320,866NTFP /5 6,558
Provisioning (non-consumptive) /6 Regulating (Carbon uptake) /7 156,600Regulating (Soil erosion control) /8 65,498Non-use /9
Net total economic value 833,121NPV (mil P) @ 8 % 209,017
NPV (mil P) @ 12 % 108,619NPV (mil P) @ 16 % 55,975
5 - Asset value for NTFP is .070 mil P / ha. 6 - Non-consumptive uses like recreation and ecotourism amounts to P911.5/ha, also further assumes that no plantation forest areas can be actively devoted to such use. 7 - Carbon uptake is P2,088 ha/yr for agroforestry and P5551.4/ha/yr for plantations. 8 - Soil retention benefit of forests plantations is P1,065 or 25% of P4261/ha/yr based on Cruz, 2001 using replacement costs.. 9 - No non use value was derived for plantations and agroforestry.
Assumptions: 1 - Average cost of five-yr development to forest plantation is estimated to be P70,000/ha and p p p , p g y p p gperiod. For sustainability, however, the planting and harvesting activities must be continuous. 2 - Total potential area for development under Intervention 2 is around 3 mil ha, 1 million each for commercial forest plantations, agroforestry and reforestation for carbon sequestration.. 3 - Stumpage value used is 400 P/cu m. 4 - Annual asset value for agroforestry is P15,652/ha/yr.
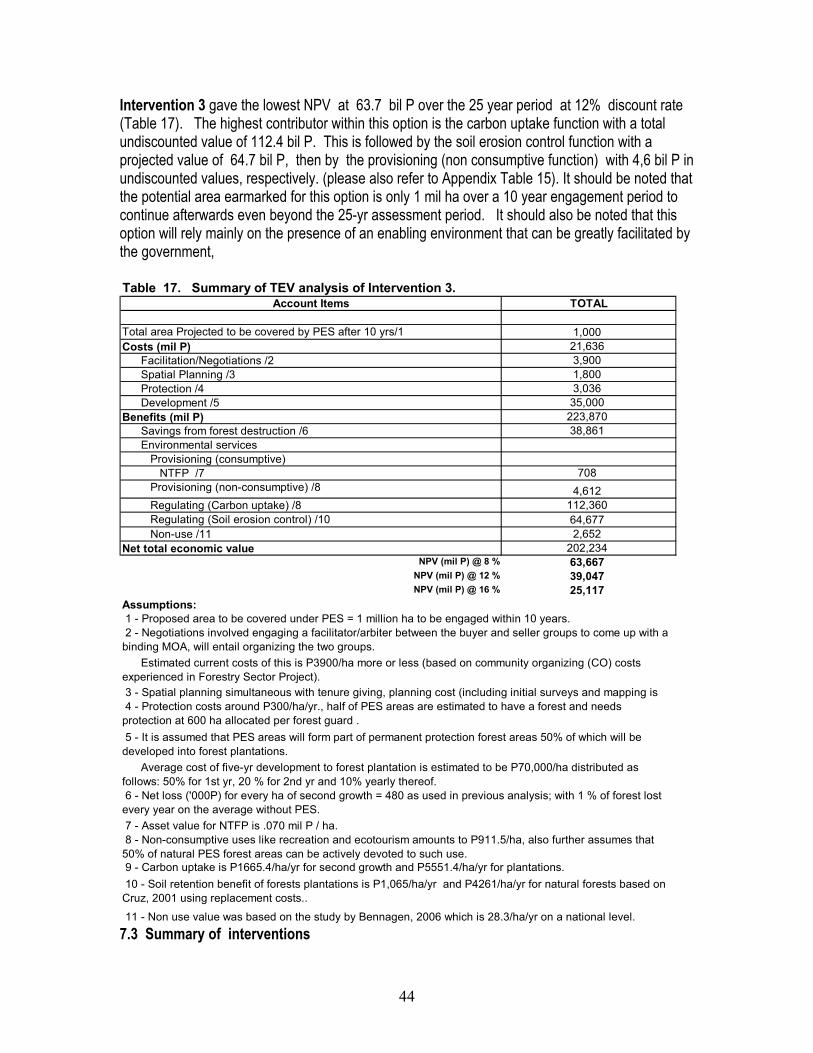
44
Intervention 3 gave the lowest NPV at 63.7 bil P over the 25 year period at 12% discount rate (Table 17). The highest contributor within this option is the carbon uptake function with a total undiscounted value of 112.4 bil P. This is followed by the soil erosion control function with a projected value of 64.7 bil P, then by the provisioning (non consumptive function) with 4,6 bil P in undiscounted values, respectively. (please also refer to Appendix Table 15). It should be noted that the potential area earmarked for this option is only 1 mil ha over a 10 year engagement period to continue afterwards even beyond the 25-yr assessment period. It should also be noted that this option will rely mainly on the presence of an enabling environment that can be greatly facilitated by the government, Table 17. Summary of TEV analysis of Intervention 3.
Account Items TOTAL
Total area Projected to be covered by PES after 10 yrs/1 1,000Costs (mil P) 21,636
Facilitation/Negotiations /2 3,900Spatial Planning /3 1,800Protection /4 3,036Development /5 35,000
Benefits (mil P) 223,870Savings from forest destruction /6 38,861Environmental services
Provisioning (consumptive) NTFP /7 708
Provisioning (non-consumptive) /8 4,612Regulating (Carbon uptake) /8 112,360Regulating (Soil erosion control) /10 64,677Non-use /11 2,652
Net total economic value 202,234NPV (mil P) @ 8 % 63,667
NPV (mil P) @ 12 % 39,047NPV (mil P) @ 16 % 25,117
Assumptions:
11 - Non use value was based on the study by Bennagen, 2006 which is 28.3/ha/yr on a national level.
8 - Non-consumptive uses like recreation and ecotourism amounts to P911.5/ha, also further assumes that 50% of natural PES forest areas can be actively devoted to such use. 9 - Carbon uptake is P1665.4/ha/yr for second growth and P5551.4/ha/yr for plantations.
5 - It is assumed that PES areas will form part of permanent protection forest areas 50% of which will be developed into forest plantations. Average cost of five-yr development to forest plantation is estimated to be P70,000/ha distributed as follows: 50% for 1st yr, 20 % for 2nd yr and 10% yearly thereof. 6 - Net loss ('000P) for every ha of second growth = 480 as used in previous analysis; with 1 % of forest lost every year on the average without PES. 7 - Asset value for NTFP is .070 mil P / ha.
1 - Proposed area to be covered under PES = 1 million ha to be engaged within 10 years. 2 - Negotiations involved engaging a facilitator/arbiter between the buyer and seller groups to come up with a binding MOA, will entail organizing the two groups. Estimated current costs of this is P3900/ha more or less (based on community organizing (CO) costs experienced in Forestry Sector Project). 3 - Spatial planning simultaneous with tenure giving, planning cost (including initial surveys and mapping is 4 - Protection costs around P300/ha/yr., half of PES areas are estimated to have a forest and needs protection at 600 ha allocated per forest guard .
10 - Soil retention benefit of forests plantations is P1,065/ha/yr and P4261/ha/yr for natural forests based on Cruz, 2001 using replacement costs..
7.3 Summary of interventions
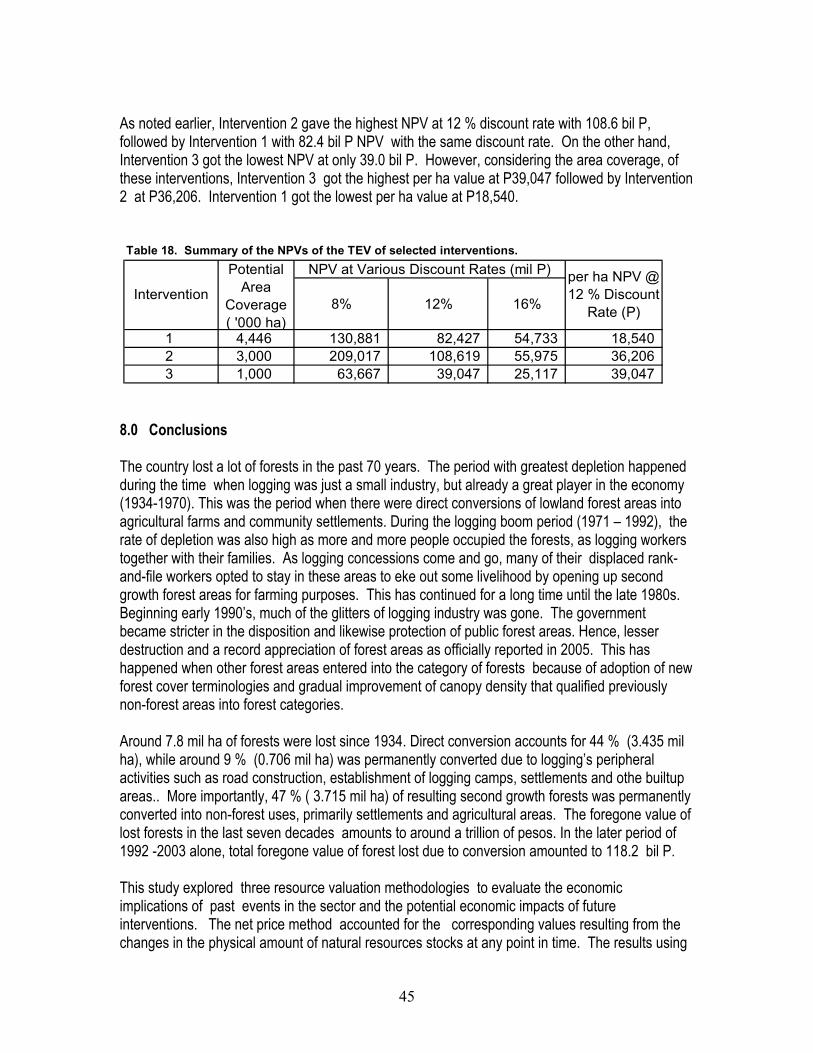
45
As noted earlier, Intervention 2 gave the highest NPV at 12 % discount rate with 108.6 bil P, followed by Intervention 1 with 82.4 bil P NPV with the same discount rate. On the other hand, Intervention 3 got the lowest NPV at only 39.0 bil P. However, considering the area coverage, of these interventions, Intervention 3 got the highest per ha value at P39,047 followed by Intervention 2 at P36,206. Intervention 1 got the lowest per ha value at P18,540.
Table 18. Summary of the NPVs of the TEV of selected interventions.
8% 12% 16%
1 4,446 130,881 82,427 54,733 18,5402 3,000 209,017 108,619 55,975 36,2063 1,000 63,667 39,047 25,117 39,047
Intervention
NPV at Various Discount Rates (mil P)Potential Area
Coverage ( '000 ha)
per ha NPV @ 12 % Discount
Rate (P)
8.0 Conclusions The country lost a lot of forests in the past 70 years. The period with greatest depletion happened during the time when logging was just a small industry, but already a great player in the economy (1934-1970). This was the period when there were direct conversions of lowland forest areas into agricultural farms and community settlements. During the logging boom period (1971 – 1992), the rate of depletion was also high as more and more people occupied the forests, as logging workers together with their families. As logging concessions come and go, many of their displaced rank-and-file workers opted to stay in these areas to eke out some livelihood by opening up second growth forest areas for farming purposes. This has continued for a long time until the late 1980s. Beginning early 1990’s, much of the glitters of logging industry was gone. The government became stricter in the disposition and likewise protection of public forest areas. Hence, lesser destruction and a record appreciation of forest areas as officially reported in 2005. This has happened when other forest areas entered into the category of forests because of adoption of new forest cover terminologies and gradual improvement of canopy density that qualified previously non-forest areas into forest categories. Around 7.8 mil ha of forests were lost since 1934. Direct conversion accounts for 44 % (3.435 mil ha), while around 9 % (0.706 mil ha) was permanently converted due to logging’s peripheral activities such as road construction, establishment of logging camps, settlements and othe builtup areas.. More importantly, 47 % ( 3.715 mil ha) of resulting second growth forests was permanently converted into non-forest uses, primarily settlements and agricultural areas. The foregone value of lost forests in the last seven decades amounts to around a trillion of pesos. In the later period of 1992 -2003 alone, total foregone value of forest lost due to conversion amounted to 118.2 bil P. This study explored three resource valuation methodologies to evaluate the economic implications of past events in the sector and the potential economic impacts of future interventions. The net price method accounted for the corresponding values resulting from the changes in the physical amount of natural resources stocks at any point in time. The results using
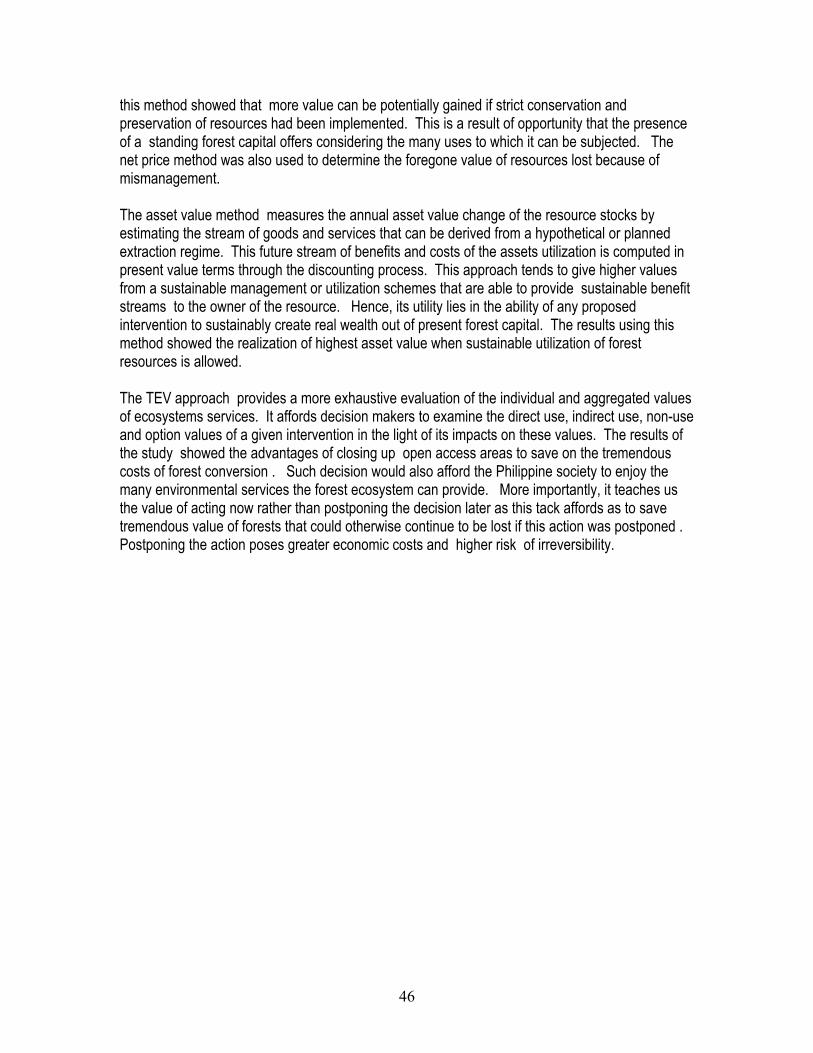
46
this method showed that more value can be potentially gained if strict conservation and preservation of resources had been implemented. This is a result of opportunity that the presence of a standing forest capital offers considering the many uses to which it can be subjected. The net price method was also used to determine the foregone value of resources lost because of mismanagement. The asset value method measures the annual asset value change of the resource stocks by estimating the stream of goods and services that can be derived from a hypothetical or planned extraction regime. This future stream of benefits and costs of the assets utilization is computed in present value terms through the discounting process. This approach tends to give higher values from a sustainable management or utilization schemes that are able to provide sustainable benefit streams to the owner of the resource. Hence, its utility lies in the ability of any proposed intervention to sustainably create real wealth out of present forest capital. The results using this method showed the realization of highest asset value when sustainable utilization of forest resources is allowed. The TEV approach provides a more exhaustive evaluation of the individual and aggregated values of ecosystems services. It affords decision makers to examine the direct use, indirect use, non-use and option values of a given intervention in the light of its impacts on these values. The results of the study showed the advantages of closing up open access areas to save on the tremendous costs of forest conversion . Such decision would also afford the Philippine society to enjoy the many environmental services the forest ecosystem can provide. More importantly, it teaches us the value of acting now rather than postponing the decision later as this tack affords as to save tremendous value of forests that could otherwise continue to be lost if this action was postponed . Postponing the action poses greater economic costs and higher risk of irreversibility.
47
9.0 References Acosta, R. T. 2008. Pers. Comm. Acosta, R.T. 2008. Deforestation in the Philippines. A reaction paper presented during the
Country Environmental Analysis Workshop. Discovery Suite, Ortigas Center. June 16, 2008. Acosta, R.T. 2005. State of the Philippine Forests: The National Forest Assessment of 2003. Paper
presented at the Philippines Forestry Forum, 2-3 June 2005, Asian Development Bank, Mandaluyong, Philippines.
Bacalla, D. 2008. Pers. Comm. Bautista, Germelino (2006): Natural Resources. Paper prepared for the Rural Growth and
Development Revisited Study, World Bank, Manila.
Bello, A. S, R.T. Buen, and J.E. Seve, 2000. Accounting for Unmarketed Fuelwood Production, 1995 (With 1996 – 2000 Projections). ENRAP IV Technical Paper.
Bennagen, E. and J. Javier, 2006. Economic Valuation of the SINP Ecosystem Services. REECS funded through UNDP, Manila.
Bennagen, E. 1991. Bamboo Resources Accounting. NRAP-PHASE 1
Camacho, S. et. al. 2007. Analysis of Employment Generated From Small Holder Upland Development Projects in Selected CBFM Sites.
Carandang, M.G, M.M, Calderon, A.P. Carandang and N.T. Iglesia, 2001. Assessment of Status and Prospects: Private Land Tree Plantations in the Philippines. Swedish International Development Agency (SIDA) and UPLB College of Forestry and Natural Resources.
Carandang, A. 2003a. Community-based Forest Management (Consultancy Report: SPPD/PHI/01/010).
Carandang, A. P., et. al. 1999. Wood Supply and Demand Study/Wood Balance Model: Mainland Palawan. Forestry Development Center, UPLB-CFNR through UPLBFI and Palawan Tropical Forestry Protection Program.
Carandang, A. et.al. 1991. Pine Forests Resources Accounting. NRAP-PHASE 1. Chandrasekharan, C. 2003. Policy and Institutions Development in the Philippine Forestry Sector
(Consultant Report: SPPD/PHI/01/010) Chokkalingam, U. et. al. 2006. “One Century of Forest Rehabilitation in the Philippines:
Approaches, Outcomes and Lessons. CIFOR, Bogor, Indonesia.
48
Coxhead, I, 2002. Development and the Upland Resource Base Economic and Policy Context, and Lessons from a Philippine Watershed Philippine Journal of Development, XXIX (1), 2002
DENR, 2003. Revised Master Plan for Forestry Development. De Los Angeles, Marian and Ma. Eugenia Bennagen (1991): Economic Aspects of Forest Policies,
Natural Resource Accounting Project (NRAP-Phase I). ENRAP Reports (1992, 1994, 1996, 2000): Main Reports. Executive Order 263, 1995 – “Adopting Community-Based Forest Management as the National
Strategy to Ensure the Sustainable Development of the Country’s Forestlands Resources and Providing Mechanisms for its Implementation”, July 19, 1995.
FDC. 2005. Evaluation of typhoon (in November and December 2004) damages in Infanta and
Real, Quezon and Dingalan, Aurora. Terminal Report. Forestry Development Center, College of Forestry and Natural Resources, University of the Philippines Los Baños.
Fernandez, V. et. al. 1989. Status Survey of Some Companies with Cancelled/Expired Timber
Licenses. Forestry Development Center, UPLB. FMB, 2005. National Forest and Tree Resources Assessment 2003-2005 Report: Philippines
Forest Management Bureau, Department of Environment and Natural Resources, Visayas Avenue, Diliman Quezon City, Philippines
Francisco, H. and M. de los Angeles. Soil Resources Depreciation And Deforestation: Philippine case study in resource accounting. FAO-UN.
Guiang, E. 2008. Comments and Suggestions on the “The Forestry Sector: Costs of the Environmental Damage and Net Benefits of Priority Interventions, Workshop Paper, Discovery Suites, Ortigas Center, Metro Manila (June 17, 2008).
Henderson C. 2002. ADB Notes on Poverty in the Philippines. ITTO (2003) Achieving the ITTO Objective 2000 and Sustainable Forest Management in the
Philippines. Kenneth M. Chomitz, 1999. Environment-Poverty Connections In Tropical Deforestation
Development Research Group, World Bank Kummer, D. 1991. Deforestation in the Postwar Philippines. Geography Research Paper, no. 234.
Chicago and London: University Press. Mallion, et. al., 200. Market-Based Instrument for Land Resources in the Makiling Forest Reserve Nash, J. 2002. Population Reference Bureau: Healthy People Need Healthy Forests—
(Population And Deforestation)
49
Nguyen, T.H and D.T.Tran. 1999. Using the Travel Cost Method (TCM) to Evaluate the Tourism
Benefits of Cuc Phuong National Park NSCB (National Statistical Coordination Board; 2003) State of the Philippine Land and Soil
Resources. Pabuayon, I.1991. Bamboo Resources Accounting. NRAP-PHASE 1. Peskin, H. (1996) Depreciation of Environmental Assets. Volume V: Refinement of Accounts,
Study 2. ENRAP Phase III. Manila. PEM, 2005. Philippine Environmental Monitor
Ritter, Michael E. The Physical Environment: an Introduction to Physical Geography. 2006. http://www.uwsp.edu/geo/faculty/ritter/ geog101/textbook/title_page.html
RMPFD, 2003. Sustainable Forest Management, Poverty Alleviation and Food Security in Upland Communities in the Philippines: The Revised Master Plan for Forestry Development in the Philippines. UNDP-FAO-DENR (Project PHI/01/010)
Segayo, M. L. 1997. Estimates of Environmental damages in irrigation systems (Technical paper-ENRAP 4)
World Bank (2007) The Little Green Data Book. Washington, D.C. World Bank (2006) Where is the Wealth of Nations? Measuring Capital for the 21st Century.
Washington, D.C. World Bank. 2006. Combating Illegal Logging and Corruption in the Forestry Sector: Strengthening
Forest Law Enforcement and Governance (http:/www.siteresources:worldbank.org)