Embed Size (px)
Citation preview
3 Chapter Environmental Effects
Table of Contents List of Figures ..................................................................................................................................... 3-ii List of Tables...................................................................................................................................... 3-iii Introduction .........................................................................................................................................3-1 Forest Plan Direction ..........................................................................................................................3-1 Scope of the Analysis .........................................................................................................................3-1 Affected Environment..........................................................................................................................3-1 Environmental Effects .........................................................................................................................3-1
3.1 Forest Vegetation Resource .........................................................................................................3-2 Introduction .........................................................................................................................................3-2 Forest Plan Direction ..........................................................................................................................3-2 Scope of the Analysis .........................................................................................................................3-5 Affected Environment..........................................................................................................................3-6 Environmental Effects .........................................................................................................................3-7 Cumulative Effects ............................................................................................................................3-12 Short and Long Term Effects of Implementing the Action Alternatives. ...........................................3-13 Forest Plan Consistency...................................................................................................................3-14 Irreversible and Irretrievable Commitments......................................................................................3-14 Project Record ..................................................................................................................................3-14
3.2 Fire and Fuels Resource.............................................................................................................3-15 Forest Plan Direction ........................................................................................................................3-15 Scope of the Analysis .......................................................................................................................3-18 Affected Environment........................................................................................................................3-19 Environmental Effects .......................................................................................................................3-20 Direct and Indirect Effects.................................................................................................................3-20 Cumulative Effects ............................................................................................................................3-24 Forest Plan Consistency...................................................................................................................3-25 Irreversible and Irretrievable Commitments......................................................................................3-25 Project Record ..................................................................................................................................3-25
3.3 Wildlife Resource ........................................................................................................................3-26 Introduction .......................................................................................................................................3-26 Forest Plan Direction ........................................................................................................................3-26 Scope of the Analysis .......................................................................................................................3-27 Affected Environment........................................................................................................................3-27 Summary of Environmental Effects – Direct, Indirect, and Cumulative Effects................................3-27 Forest Plan Consistency...................................................................................................................3-44 Irreversible and Irretrievable Commitments......................................................................................3-46 Project Record ..................................................................................................................................3-46
3.4 Watershed Resource ..................................................................................................................3-47 Introduction .......................................................................................................................................3-47 Forest Plan Direction ........................................................................................................................3-47 Scope of the Analysis .......................................................................................................................3-48 Affected Environment........................................................................................................................3-50 Environmental Effects .......................................................................................................................3-51 Direct and Indirect Effects.................................................................................................................3-51 Cumulative Effects of Alternatives-...................................................................................................3-53 Forest Plan Consistency...................................................................................................................3-55 Irreversible and Irretrievable Commitments......................................................................................3-55 Project Record ..................................................................................................................................3-55
3.5 Fisheries Resource .....................................................................................................................3-56 Introduction .......................................................................................................................................3-56 Forest Plan Direction ........................................................................................................................3-56 Scope of the Analysis .......................................................................................................................3-56 Affected Environment........................................................................................................................3-57
3-i
Environmental Effects .......................................................................................................................3-58 Cumulative Effects ............................................................................................................................3-63 Cumulative Effects of this Project .....................................................................................................3-63 Threatened, Endangered, Sensitive and MIS Species Determination .............................................3-64 Forest Plan Consistency...................................................................................................................3-64 Irreversible and Irretrievable Commitments......................................................................................3-64 Project Record ..................................................................................................................................3-64
3.6 Soils.............................................................................................................................................3-65 Introduction .......................................................................................................................................3-65 Forest Plan Direction ........................................................................................................................3-65 Scope of the Analysis .......................................................................................................................3-65 Affected Environment........................................................................................................................3-66 Background .......................................................................................................................................3-66 Environmental Effects .......................................................................................................................3-70 Cumulative Effects ............................................................................................................................3-73 Forest Plan Consistency...................................................................................................................3-74 Irreversible and Irretrievable Commitments......................................................................................3-74 Project Record ..................................................................................................................................3-75
3.7 Other Disclosures........................................................................................................................3-76 Legal and Regulatory Requirements ................................................................................................3-76
List of Figures Figure 3.1-1 Predicted changes in tree diameters over time. .................................................................3-10 Figure 3.4-1 Location of Crooked River Project Activity Area and Water Analysis Areas......................3-49 Figure 3.4-2 BOISED Predicted % Over Natural Sediment for No Action and Alternatives...................3-53 Figure 3.5-1 Erosion on a non-system road in an RCA in Coyote Gulch. ..............................................3-59 Figure 3.5-2 Examples of RCAs of intermittent channels in the project area. ........................................3-61 Figure 3.5-3 RCAs of Dick Ross Creek (left) and Moonshine Creek......................................................3-62 Figure 3.5-4 Photograph Dick Ross and Moonshine Creek. ..................................................................3-62 Figure 3.6-1 Landtypes within the Crooked River Project Area..............................................................3-67
3-ii
3-iii
List of Tables Table 3.1-1 Forest Potential Vegetation Groups ......................................................................................3-3 Table 3.1-2 Desired Size Class Percentages of Forested Vegetation by PVG........................................3-4 Table 3.1-3 Desired Percentage Ranges of Canopy Closure in the Large Tree Size Class....................3-4 Table 3.1-4 Desired Percentage Ranges for Species Composition for Forested PVGs. .........................3-5 Table 3.1-5 Desired Range of Snags Per Acre for PVGs.........................................................................3-5 Table 3.1-6 Current Size Class Percentages of Forested Vegetation by PVG ........................................3-6 Table 3.1-7 Current Canopy Closure Percentages for Large Tree Stands by PVG.................................3-7 Table 3.1-8 Current Snags per Acre for PVG 1, 2, 5 and 6 ......................................................................3-7 Table 3.2-1 Fire regime characteristics by PVG. ....................................................................................3-19 Table 3.2-2 Predicted fire behavior.........................................................................................................3-20 Table 3.2-3 FRID Index value for each alternative. ................................................................................3-21 Table 3.2-4 Predicted post treatment fire behavior modeling results. ....................................................3-22 Table 3.2-5 Comparison of the acres proposed for treatment in WUI for each alternative ....................3-22 Table 3.3-1 Wildlife species analyzed for effects....................................................................................3-29 Table 3.3-2. Measurement of meeting the Wildlife Resource objective .................................................3-35 Table 3.3-3. Representation of Project Effects Analysis for Wildlife Resource ......................................3-36 Table 3.3-4. Priority habitats and wildlife species. ..................................................................................3-45 Table 3.4-1 Relevant Forest-wide standards and objectives..................................................................3-48 Table 3.4-2 Summary of Stream Types. .................................................................................................3-50 Table 3.4-3 Road Density and Miles of Roads within RCAs...................................................................3-50 Table 3.4-4 Existing Watershed Conditions, Predicted Sediment. .........................................................3-51 Table 3.4-5 Baseline, Alternative Implementation, and Long-term Predicted Sediment. .......................3-52 Table 3.5-1 Miles of permanent road decommissioned within RCAs by alternative...............................3-59 Table 3.5-2 Trend in RCA condition........................................................................................................3-60 Table 3.6-1 Summary of Soil Characteristics..........................................................................................3-68

3 - Environmental Effects
Crooked River Vegetation Management Project 3-1
Introduction This chapter describes the physical, biological, and social characteristics of the environment that may be affected by the alternatives presented in Chapter 2. It also describes the expected effects of the alternatives on those environmental characteristics. Chapter 3 is organized by resources and includes resources associated with project Objectives and Key Issues in Chapter 1 that are key components of the environment or that must be analyzed due to law, regulation, or policy. Each resource section includes the following information:
Resource Title Objectives and or Key Issues Forest Plan Direction Scope of the Analysis Affected Environment Environmental Effects
Each resource section is based on a specialist’s analysis. Additional information on the affected environment for each resource is included in the specialist’s reports. These analyses and reports are located within the Crooked River Vegetation Management Project EA project record.
Forest Plan Direction This section describes Forest Plan direction for the resource.
Scope of the Analysis This section describes the spatial (geographical) boundaries and timeframes used for analysis of each resource. The spatial scope of analysis may be the project area, watershed, big-game hunting zone, economic zone of influence, or west side of the Forest depending on the affected resource over temporary (less than 3 years), short (3-15 years), or long term (greater than 15 years) time frames.
Affected Environment This section describes the current and desired condition of relevant environmental characteristics for each resource, with a focus on project Objectives and Indicators.
Environmental Effects The environmental effects section forms the scientific and analytic basis for the comparison of alternatives presented in Chapter 2. NEPA (National Environmental Policy Act) regulations recognize three categories of effects:
Direct effects are caused by an action and occur at the same time and place. Indirect effects are caused by an action, but occur at a later time or different place. Cumulative effects result from incremental impact of an action when added to other past, present,
and reasonably foreseeable actions, regardless of what agency or person undertakes the other actions (40 CFR 1508.7 and 8)
3.1 - Forest Vegetation Resource
3.1 Forest Vegetation Resource Objective Move vegetation toward the desired future conditions defined in the Forest Plan, with an emphasis on promoting the development of large tree forest structures, reintroducing fire into the ecosystem, and improving forest health. Measurements
Effects to tree size class distributions, canopy closure, species composition, and snag habitat.
Introduction The overall condition of forest, grass, and shrubland in the Crooked River Vegetation Management Project Area has changed as a result of wildfire suppression, livestock grazing, and timber management practices implemented since the late 1800s. Early seral trees (ponderosa pine, and Douglas-fir on some sites) are declining and climax tree species (Douglas-fir, and grand fir on some sites) are increasing in abundance and distribution due to lack of understory burns that favor seral tree species establishment. Most of the forest stands are currently overstocked with small to medium size trees. Dwarf mistletoe is present in some stands. The seral forests, especially the large ponderosa pine forest structure, have been declining due to the lack of natural fires, timber harvest and through tree mortality caused by increased understory tree density, inter-tree competition, age, poor vigor, insects and disease. The proposed activities would alter vegetation structure, composition, and density to achieve the Purpose and Need of this project and move the stands toward the desired conditions The mechanical thinning would remove both sawlog and biomass (small) size trees. Prescribed burning would reduce fuels and rejuvenate grass, forb, and shrub species. These restoration treatments would move the vegetation towards the future desired condition, which includes creating more fire resilient conditions, promoting the development of large tree forest structure and forest health by reducing densities, ladder fuels and ground fuels, and increasing seral species and the number of snags. The USDA Forest Service’s Forest Vegetation Simulator (FVS) was used as a tool to compare changes in vegetative structure over time.
Forest Plan Direction The Forest Plan provides management direction for Vegetation and Timberland Resources. This direction is noted in goals, objectives, standards, and guidelines for each Management Prescription Category (MPC) and Management Area. This project is located in Management Area 2 - Snake River, and lands within the project area have been identified as Management Prescription Category (MPC) 5.1- restoration and maintenance emphasis within forested landscapes, and MPC 5.2 - commodity production emphasis within forested landscapes. The restoration and maintenance emphasis (MPC 5.1) direction has been used for this project. The emphasis in MPC 5.1 is on restoring or maintaining vegetation within desired conditions in order to provide a diversity of habitats, reduced risk from disturbance events, and sustainable resources for human use. Commodity production is an outcome of restoring or maintaining the resilience/resistance of forested vegetation to disturbance events. Achievement of timber growth and yield is not the primary purpose. Restoration occurs through management activities and succession. Combinations of mechanical and prescribed fire treatments are used to restore forested areas while maintaining or improving resources such as soils, water quality, fish and wildlife habitat, and recreation settings. (Forest Plan p. III-87). Forest vegetation desired conditions in Appendix A of the Forest Plan are described using habitat type groups, based on the potential climax vegetation. Potential climax vegetation in turn provides an indicator of environmental conditions that affect the composition and structure of forest vegetation. Individual habitat types are named according to the dominant climax overstory species in conjunction with key understory species. At the level of the Forest Plan, forested habitat types have been grouped into potential vegetation groups (PVGs) that share similar environmental characteristics, site productivity, and disturbance regimes (Table 3.1-1Forest Plan p. A-17).
Crooked River Vegetation Management Project 3-2

3.1 - Forest Vegetation Resource
Table 3.1-1 Forest Potential Vegetation Groups Potential Vegetation Groups PVG 1 - Dry Ponderosa Pine/Xeric Douglas-fir PVG 2 – Warm Dry Douglas-fir/Moist Ponderosa Pine PVG 3 – Cool Moist Douglas-fir PVG 4 – Cool Dry Douglas-fir PVG 5 – Dry Grand Fir PVG 6 – Cool Moist Grand Fir PVG 7 – Cool Dry Subalpine fir PVG 8 – Warm Moist Subalpine fir PVG 9 – Hydric Subalpine fir PVG 10 – Persistent Lodgepole Pine PVG 11 – High Elevation Subalpine fir
Within the Crooked River Project Area, only stands within PVGs 1, 2, 5 & 6 will be affected by the proposed vegetation management treatments; therefore the following discussions will only compare conditions in these four PVG types.
Desired Condition Appendix A of the Forest Plan contains the desired condition tables, mapping criteria, and classification descriptions for vegetation outside of designated wilderness areas. Desired forest conditions do not represent a static state, but rather are dynamic because the ecosystems have evolved naturally to respond to natural succession and disturbances. The desired conditions are not something that every acre of forest at every point in time will posses, there will always be variability. Achievement of desired conditions well distributed across the planning unit is a long-term goal for forest and range management (Forest Plan p. A-1). Historical range of variability (HRV) concepts were used to develop these desired conditions (Forest Plan FEIS p.3-579). This analysis focuses on forest vegetation. Forest vegetation refers to land that contains at least 10% crown cover by forest trees of any size, or land that formerly had tree cover and is presently at an earlier seral stage. Forest vegetation will be described by PVG. The components of forest vegetation analyzed are tree size class, canopy closure, species composition, and snags. Coarse woody debris is analyzed in the Soils section. Tree Size Class Table 3.1-2 displays the range of desired tree size classes. Tree size class is determined by the size of the overstory trees. The average diameter of the trees in the uppermost tree layer determines the stand’s tree size class. Stand densities have a direct effect on stand growth and tree size class. Very dense stands often show reduced growth rates, high potential for insect mortality, and increased risk to fire. Tree size class is based on the following diameter groupings: Grass/Forb/Shrub/Seedling <4.5 feet tall Sapling 0.1” – 4.9” DBH Small trees 5.0” – 11.9” DBH Medium trees 12” – 19.9” DBH Large trees >20” DBH
Crooked River Vegetation Management Project 3-3
3.1 - Forest Vegetation Resource
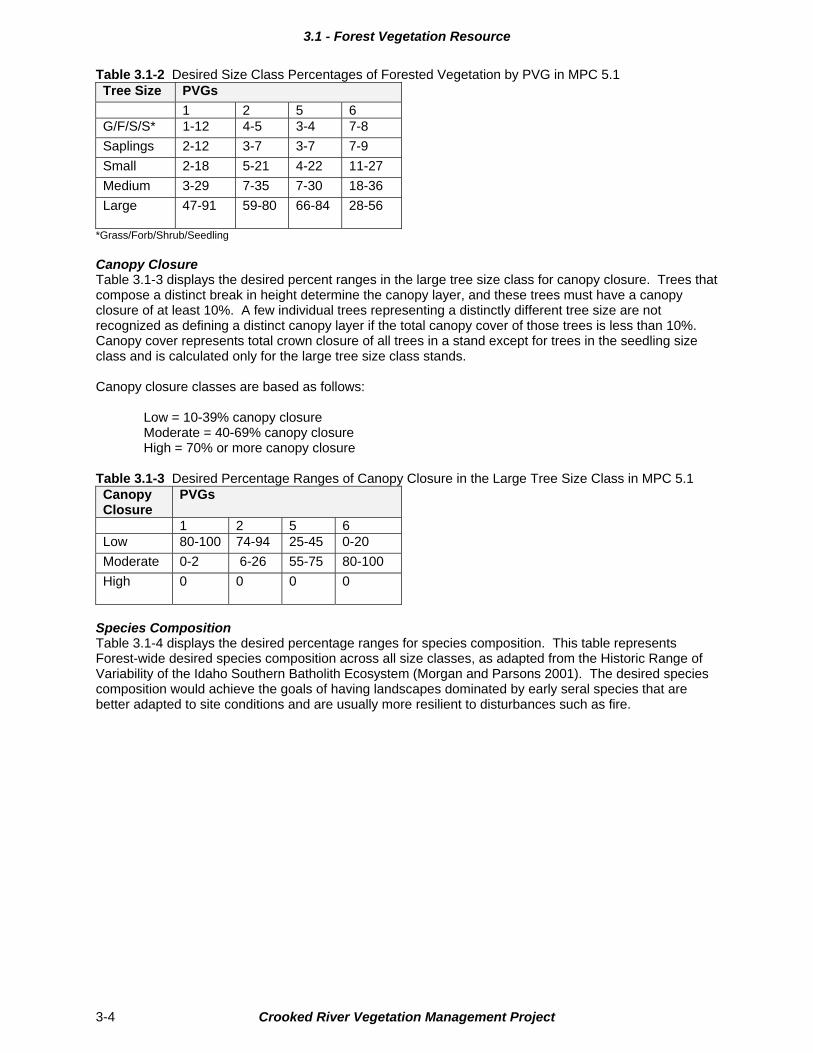
Table 3.1-2 Desired Size Class Percentages of Forested Vegetation by PVG in MPC 5.1 Tree Size PVGs
1 2 5 6 G/F/S/S* 1-12 4-5 3-4 7-8
Saplings 2-12 3-7 3-7 7-9
Small 2-18 5-21 4-22 11-27
Medium 3-29 7-35 7-30 18-36
Large 47-91
59-80 66-84 28-56
*Grass/Forb/Shrub/Seedling
Canopy Closure Table 3.1-3 displays the desired percent ranges in the large tree size class for canopy closure. Trees that compose a distinct break in height determine the canopy layer, and these trees must have a canopy closure of at least 10%. A few individual trees representing a distinctly different tree size are not recognized as defining a distinct canopy layer if the total canopy cover of those trees is less than 10%. Canopy cover represents total crown closure of all trees in a stand except for trees in the seedling size class and is calculated only for the large tree size class stands. Canopy closure classes are based as follows: Low = 10-39% canopy closure Moderate = 40-69% canopy closure High = 70% or more canopy closure Table 3.1-3 Desired Percentage Ranges of Canopy Closure in the Large Tree Size Class in MPC 5.1 Canopy Closure
PVGs
1 2 5 6 Low 80-100 74-94 25-45 0-20
Moderate 0-2 6-26 55-75 80-100
High
0 0 0 0
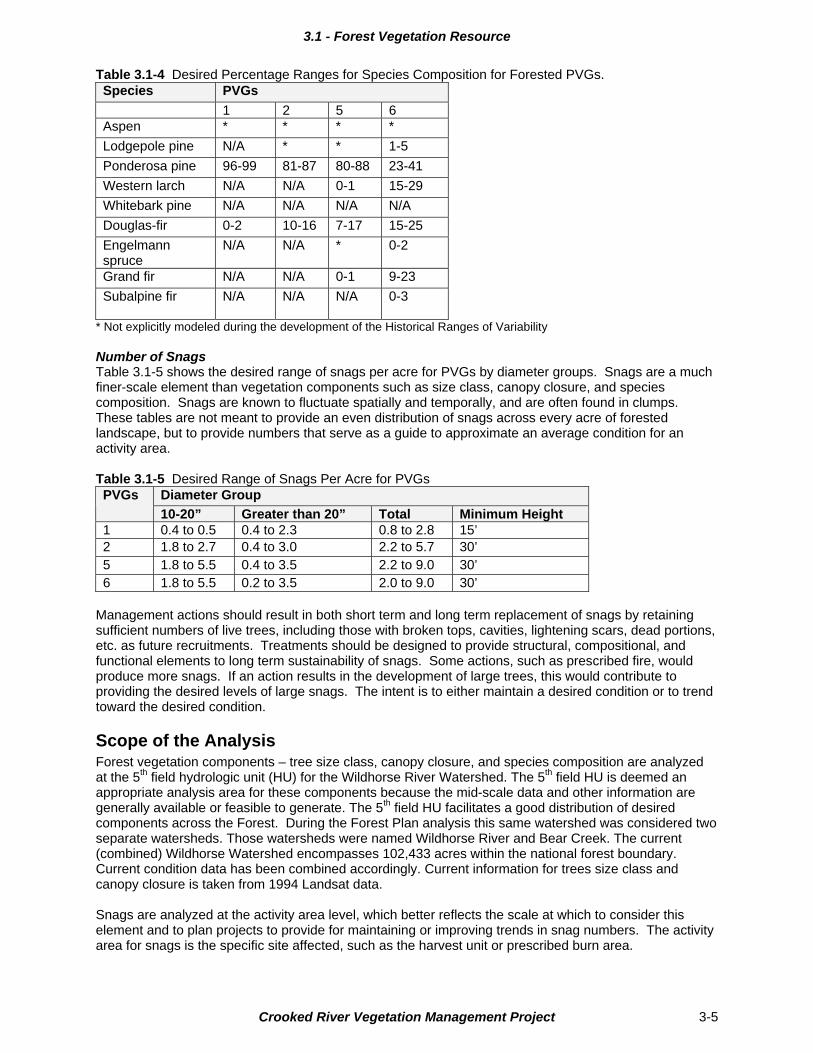
Species Composition Table 3.1-4 displays the desired percentage ranges for species composition. This table represents Forest-wide desired species composition across all size classes, as adapted from the Historic Range of Variability of the Idaho Southern Batholith Ecosystem (Morgan and Parsons 2001). The desired species composition would achieve the goals of having landscapes dominated by early seral species that are better adapted to site conditions and are usually more resilient to disturbances such as fire.
Crooked River Vegetation Management Project 3-4
3.1 - Forest Vegetation Resource
Table 3.1-4 Desired Percentage Ranges for Species Composition for Forested PVGs. Species PVGs
1 2 5 6 Aspen * * * *
Lodgepole pine N/A * * 1-5
Ponderosa pine 96-99 81-87 80-88 23-41
Western larch N/A N/A 0-1 15-29
Whitebark pine N/A N/A N/A N/A
Douglas-fir 0-2 10-16 7-17 15-25
Engelmann spruce
N/A N/A * 0-2
Grand fir N/A N/A 0-1 9-23
Subalpine fir
N/A N/A N/A 0-3
* Not explicitly modeled during the development of the Historical Ranges of Variability Number of Snags Table 3.1-5 shows the desired range of snags per acre for PVGs by diameter groups. Snags are a much finer-scale element than vegetation components such as size class, canopy closure, and species composition. Snags are known to fluctuate spatially and temporally, and are often found in clumps. These tables are not meant to provide an even distribution of snags across every acre of forested landscape, but to provide numbers that serve as a guide to approximate an average condition for an activity area. Table 3.1-5 Desired Range of Snags Per Acre for PVGs
Diameter Group PVGs
10-20” Greater than 20” Total Minimum Height 1 0.4 to 0.5 0.4 to 2.3 0.8 to 2.8 15’ 2 1.8 to 2.7 0.4 to 3.0 2.2 to 5.7 30’ 5 1.8 to 5.5 0.4 to 3.5 2.2 to 9.0 30’ 6 1.8 to 5.5 0.2 to 3.5 2.0 to 9.0 30’
Management actions should result in both short term and long term replacement of snags by retaining sufficient numbers of live trees, including those with broken tops, cavities, lightening scars, dead portions, etc. as future recruitments. Treatments should be designed to provide structural, compositional, and functional elements to long term sustainability of snags. Some actions, such as prescribed fire, would produce more snags. If an action results in the development of large trees, this would contribute to providing the desired levels of large snags. The intent is to either maintain a desired condition or to trend toward the desired condition.
Scope of the Analysis Forest vegetation components – tree size class, canopy closure, and species composition are analyzed at the 5th field hydrologic unit (HU) for the Wildhorse River Watershed. The 5th field HU is deemed an appropriate analysis area for these components because the mid-scale data and other information are generally available or feasible to generate. The 5th field HU facilitates a good distribution of desired components across the Forest. During the Forest Plan analysis this same watershed was considered two separate watersheds. Those watersheds were named Wildhorse River and Bear Creek. The current (combined) Wildhorse Watershed encompasses 102,433 acres within the national forest boundary. Current condition data has been combined accordingly. Current information for trees size class and canopy closure is taken from 1994 Landsat data. Snags are analyzed at the activity area level, which better reflects the scale at which to consider this element and to plan projects to provide for maintaining or improving trends in snag numbers. The activity area for snags is the specific site affected, such as the harvest unit or prescribed burn area.
Crooked River Vegetation Management Project 3-5

3.1 - Forest Vegetation Resource
Affected Environment
Current Conditions Current condition for tree size class and canopy closure is derived from Landsat Satellite Imagery processed for the Southwest Idaho Ecogroup (Boise, Payette, and Sawtooth National Forests) by the University of Montana. Species composition described in this section is based on professional observations during field reconnaissance, sample plot data, and knowledge of local stand conditions and stand dynamics. Current condition for snags is from data on snags per acre compiled from stand exam plots measured from 1994 – 2000 in strata (timber types) and PVG combinations, the same as those proposed for treatment. Forest vegetation is described in this section using Potential Vegetation Groups (PVGs) as indicators of environmental conditions. Forested stands in the same PVG share similar environmental characteristics, site productivity, and disturbance regimes (Forest Plan p. A-17). Within the Crooked River Project Area, the forested stands that would be undergoing vegetation treatment fall within 4 major PVG types. The approximate acreage of each type is as follows:
83 acres in PVG 1 1965 acres in PVG 2 519 acres in PVG 5 1128 acres in PVG 6
There is also approximately 1780 acres of Grass/Shrubland vegetation types that would be treated with prescribed fire to reduce conifer encroachment and rejuvenate grass, forb and brush species under Alternative B. Tree Size Class Table 3.1-6 displays the current tree size class percentages by PVG within the 5th field HU for the Wildhorse River Watershed. Notes indicate whether the current percentages are within the desired range or a certain amount above or below that range. Table 3.1-6 Current Size Class Percentages of Forested Vegetation by PVG Tree Size PVG
1 2 5 6 G/F/S/S* 7%
Within range 33% Above by 28%
15% Above by 11%
23% Above by 15%
Saplings 0.6% Below by1%
0.8% Below by 2%
8% Above by 1%
8% Within range
Small 30% Above by 12%
26% Above by 5%
23% Above by 1%
16% Within range
Medium 44% Above by 15 %
20% Within range
27% Within range
34% Within range
Large 19% Below by 28%
20% Below by 39%
27% Below by 39%
20% Below by 8%
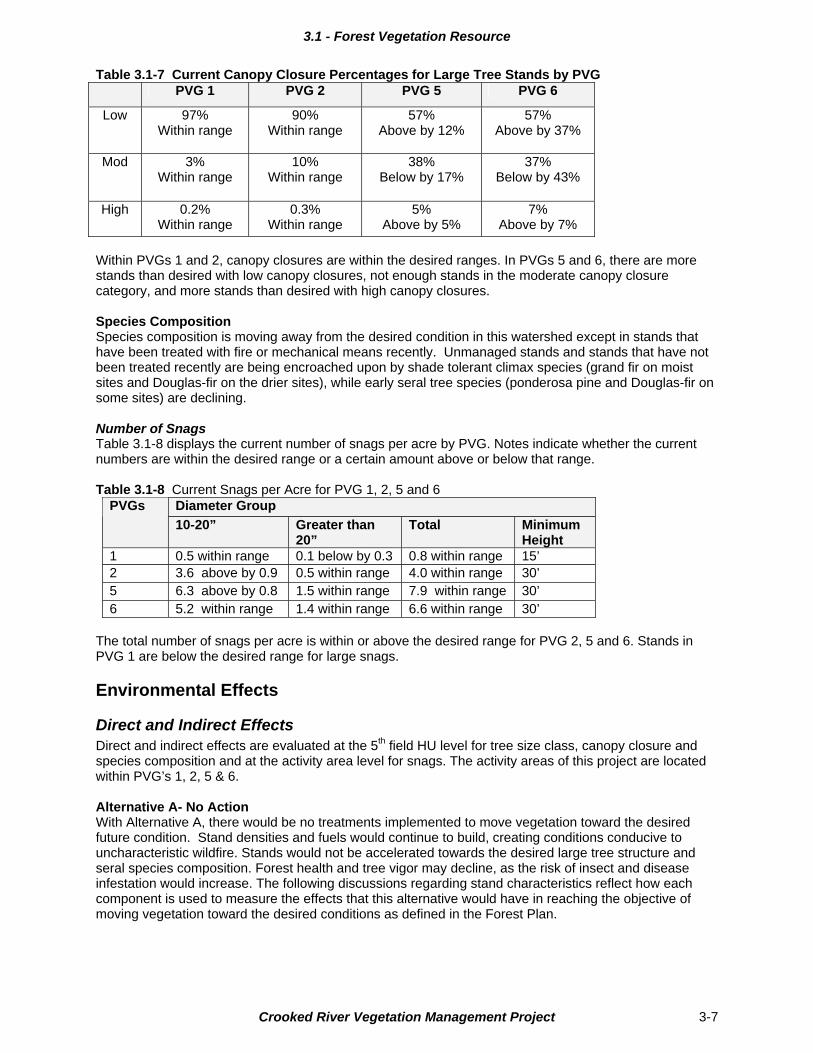
*Grass/Forb/Shrub/Seedling Within PVG 1, there are more stands than desired in the small and medium tree size classes and not enough in the large tree size class. PVGs 2, 5 and 6 have more stands in the seedling size class than desired and not enough in the large tree size class. Canopy Closure Table 3.1-7 displays the current canopy closure percentages for large tree stands by PVG within the 5th field HU for the Wildhorse River Watershed. Notes indicate whether the current percentages are within the desired range or a certain amount above or below that range.
Crooked River Vegetation Management Project 3-6
3.1 - Forest Vegetation Resource
Table 3.1-7 Current Canopy Closure Percentages for Large Tree Stands by PVG PVG 1 PVG 2 PVG 5 PVG 6
Low 97% Within range
90% Within range
57% Above by 12%
57% Above by 37%
Mod 3% Within range
10% Within range
38% Below by 17%
37% Below by 43%
High 0.2% Within range
0.3% Within range
5% Above by 5%
7% Above by 7%
Within PVGs 1 and 2, canopy closures are within the desired ranges. In PVGs 5 and 6, there are more stands than desired with low canopy closures, not enough stands in the moderate canopy closure category, and more stands than desired with high canopy closures. Species Composition Species composition is moving away from the desired condition in this watershed except in stands that have been treated with fire or mechanical means recently. Unmanaged stands and stands that have not been treated recently are being encroached upon by shade tolerant climax species (grand fir on moist sites and Douglas-fir on the drier sites), while early seral tree species (ponderosa pine and Douglas-fir on some sites) are declining. Number of Snags Table 3.1-8 displays the current number of snags per acre by PVG. Notes indicate whether the current numbers are within the desired range or a certain amount above or below that range. Table 3.1-8 Current Snags per Acre for PVG 1, 2, 5 and 6
Diameter Group PVGs
10-20” Greater than 20”
Total Minimum Height
1 0.5 within range 0.1 below by 0.3 0.8 within range 15’ 2 3.6 above by 0.9 0.5 within range 4.0 within range 30’ 5 6.3 above by 0.8 1.5 within range 7.9 within range 30’ 6 5.2 within range 1.4 within range 6.6 within range 30’
The total number of snags per acre is within or above the desired range for PVG 2, 5 and 6. Stands in PVG 1 are below the desired range for large snags.
Environmental Effects
Direct and Indirect Effects Direct and indirect effects are evaluated at the 5th field HU level for tree size class, canopy closure and species composition and at the activity area level for snags. The activity areas of this project are located within PVG’s 1, 2, 5 & 6. Alternative A- No Action With Alternative A, there would be no treatments implemented to move vegetation toward the desired future condition. Stand densities and fuels would continue to build, creating conditions conducive to uncharacteristic wildfire. Stands would not be accelerated towards the desired large tree structure and seral species composition. Forest health and tree vigor may decline, as the risk of insect and disease infestation would increase. The following discussions regarding stand characteristics reflect how each component is used to measure the effects that this alternative would have in reaching the objective of moving vegetation toward the desired conditions as defined in the Forest Plan.
Crooked River Vegetation Management Project 3-7
3.1 - Forest Vegetation Resource
Effects to Tree Size Class Within PVG 1, there are more stands in the small and medium tree size classes than desired and not enough in the large tree size class. In PVGs 2, 5 and 6 there are more stands in the seedling size class than desired and not enough in the large tree size class. There would not be a direct effect to tree size class with the No Action alternative. However, possible indirect effects include damage from uncharacteristic wildfire, and insects and disease. If these stands are not treated, fuel loads and fuel ladders would continue to build up and the risk of damage by uncharacteristic wildfire would increase over time. Tree size class percentages would change over time as growth and mortality occurs with some tree size classes developing into the next larger size classes. Conversely, natural events, such as wildfire, windthrow or elevated insect/disease levels, may cause stands to move into a smaller size class as larger trees are killed. The existing large tree size stands would not be maintained as long as they would be with restoration treatments. Movement toward desired levels of large trees in PVG 1, 2, 5 and 6 would be slower than with the action alternatives given the retention of denser, more competitive stand conditions. Stands left untreated would lose vigor and become more susceptible to insect and disease infestations due to crowded conditions. Medium tree size class stands are less likely to live long enough to develop into large tree size class stands. A Forest Vegetation Simulation growth analysis using stand exam information collected in 1999 was completed to assess the development of stand structures. Stands that currently have average stand diameters of 7 to 12 inches would take 70 to 90 years to reach the point where the average stand diameters are 20 inches with no treatment Effects to Canopy Closure Over time, stands with low and moderate canopy closure would eventually become stands with moderate and high canopy closure due to increased tree densities, natural regeneration and growth of crown diameters. High density stands, currently with high crown closure, would continue to have a high canopy closure over the short term and then decline in response to insect, weather and/or disease related mortality. Effects to Species Composition Without treatment, current species composition would continue to move away from desired conditions. Species composition would continue to trend toward shade tolerant climax species, primarily grand fir and Douglas-fir. As stand densities increase and less light reaches the forest floor, the climax species would continue to increase in abundance and dominate the stands. Seral species, such as ponderosa pine, would eventually give way to the climax species, leaving behind occasional large remnants. Over the short term there would be little to no change in tree species composition, but over the long term seral tree species would decline. Effects to Number of Snag Snags would continue to vary across the project area. Without implementing the project, snags would continue to fluctuate in response to natural disturbances across the landscape. Areas with good access to stands would likely be below desired ranges due to firewood cutting, while areas of limited or no access would be within or exceed desired ranges. It is anticipated that grand fir and ponderosa pine snags would be maintained or increased, while Douglas-fir snags would be removed for firewood where they are near existing open roads. Areas that are lacking the desired amount of snags would eventually see an increase in snag composition through natural processes, but at a much slower rate than if the area were treated with prescribed burning. Alternative B - Proposed Action With Alternative B, there would be 3,242 acres treated to move vegetation toward desired future condition by reducing densities, reducing ladder fuels and ground fuels, promoting large tree structure, improving forest health, and increasing seral species and the number of snags. The following discussions regarding stand characteristics reflect how each component is used to measure the effects that this alternative would have in reaching the objective of moving vegetation towards the desired conditions as defined in the Forest Plan. Effects to Tree Size Class Thinning Treatments Promoting large tree structure is a part of the Purpose and Need for this project. With Alternative B there are 228 acres of large tree stands that would be mechanically treated and then underburned. These
Crooked River Vegetation Management Project 3-8
3.1 - Forest Vegetation Resource
stands would remain in the large tree size class after treatment. Restoration treatments that utilize thinning activities to reduce tree densities would favor retention of larger diameter, healthy, dominant ponderosa pine and Douglas-fir. These large trees would benefit from the increased availability of water and become more vigorous and resistant to fire, insect, and disease damage. Medium sized trees in these same stands would benefit from increased access to water and sunlight and would experience accelerated diameter growth. The use of underburning following the thinning operations would reduce ground fuels and ladder fuels. The periodic underburning planned for the future would maintain ground fuels and fuel ladders at low levels. The increased resources available to these trees and the reduced risk of uncharacteristic wildfire would maintain the current large tree structure and accelerate the growth of medium size trees that would replace the large trees as they succumb to mortality agents. Approximately 1,466 acres of stands that are currently in the medium tree size class would also be mechanically thinned and then underburned. These stands would remain in this size class immediately after treatment. However, these treated stands would grow into the large tree size class at an accelerated rate. This accelerated diameter growth would be similar in degree in the medium size trees in the large tree stands noted in the preceding paragraph. These density reduction restoration treatments increase the resources available to the remaining trees increasing vigor and making them more resistant and resilient to damage from fire, insects and disease. Underburning these stands after thinning and continuing to underburn over time would reduce the risk of uncharacteristic wildfire and increase the chances of these stands developing into large tree size class stands. The Forest Vegetation Simulator (FVS) was used to compare changes in stand growth, tree mortality, and average diameters over time. This FVS modeling shows that stands that have been logged to reduce densities have increased diameter growth and decreased mortality. The medium tree size stands are composed of younger, more vigorous trees and can take advantage of the increased availability of resources better than the large tree size stands. A typical medium tree size stand would increase diameter growth by 18% to 24% compared to an untreated stand over an 80-year period. The same stand would have 60% to 75% less mortality over the same period. A typical large tree size class stand would not have the same high vigor and would increase diameter growth by only about 3% to 10% over 80 years. However, mortality would decrease in the large tree size class stand by 60% to 84% as a result of less competition for resources. Average stand diameters in the medium tree size stands would increase by about 8 inches at the time of harvest. In the large tree stands average diameters would increase by 16 to 23 inches when they are harvested. This increase in average diameters occurs at the time the stands are cut. This immediate increase is the result of cutting many of the smaller diameter trees – the average diameter is then based on just the larger trees that are left. After the smaller trees are removed, the remaining trees have more resources available and then begin to increase diameter growth rates. Two typical medium tree size class stands are displayed on the following page (Figure 3.1-1). These illustrations show what these stands look like now, how they would appear 20 years after a restoration treatment and the average stand diameters in each instance.
Crooked River Vegetation Management Project 3-9

3.1 - Forest Vegetation Resource
Figure 3.1-1 Predicted changes in tree diameters over time.
Medium Size Class: Current Condition - Average Dia 12” Condition 20 Years After Harvest - Average Dia 23”
Medium Size Class: Current Condition - Average Dia 11” Condition 20 Years After Harvest - Average Dia 20”
Crooked River Vegetation Management Project 3-10

3.1 - Forest Vegetation Resource
Forest Underburns Stands in the large, medium and small tree size classes would be underburned with no other treatment. Approximately 233 acres of plantations (small size class trees) would be underburned to reduce densities, raise crown base heights, and reduce ground fuels. Densities would be reduced from 300-400 trees per acre (TPA) to 150-200 TPA. This density reduction would promote diameter growth, which would move these stands more quickly into the medium tree size class. Mechanical thinning would be used if monitoring shows that the underburn has not reduced densities sufficiently. Trees in these treated stands would have more resources available to them, resulting in more vigor and less susceptibility to fire damage and insect and disease infestation. The risk of damage from wildfire would be reduced by decreasing ground fuels and raising the crown base heights. Approximately 1,147 acres of medium tree size class stands and 157 acres of large tree size class stands would be underburned only. Underburning these stands would reduce ground fuels and fuel ladders. These stands would be underburned in the future on a periodic basis which would maintain ground fuels and fuel ladders at low levels. These restoration underburns would decrease the risk of uncharacteristic wildfire and increase the chances that these stands would remain in the large tree size class or grow from the medium trees size class into the large tree size class. Summary Within PVG 1 there are more stands than desired in the small and medium tree size classes and not enough in the large tree size class. PVGs 2, 5 and 6 have more stands in the seedling size class than desired and not enough in the large tree size class. Within PVG 1, 90 acres of forest stands would be underburned. These stands are in the small and medium tree size classes. Underburning these stands would reduce ground fuels and ladder fuels, decreasing the risk of damage by uncharacteristic wildfire. This would increase the chance that these stands would develop into large tree size class stands. Within PVGs 2, 5, and 6, 1,466 acres of thinning operations followed by underburning, 1,083 acres of prescribed burning in forest stands, and 471 acres of prescribed burning in riparian conservation areas (RCAs) would be implemented within medium tree size class stands. All of these activities would reduce the risk of uncharacteristic wildfire damage, and the thinning operations would accelerate diameter growth. If Alternative B is implemented, the stands that are thinned would develop more quickly into large tree size class stands and the stands that are underburned would be less likely to be damaged by uncharacteristic wild fire before they can develop into large tree size class stands. Effects to Canopy Closure Within PVGs 1 and 2, canopy closures are within the desired ranges as described in the Forest Plan. In PVGs 5 and 6, there are more stands than desired with low canopy closures, not enough stands in the moderate canopy closure category, and more stands than desired with high canopy closures. With Alternative B, thinning treatments would reduce canopy closure on 190 acres of large tree size class stands in PVGs 5 and 6. The canopy closure in these stands would shift from high to moderate, which would move conditions toward the desired range. By reducing the amount of canopy cover in these stands, competition for sunlight would be reduced, resulting in an increase in diameter growth and tree vigor. Canopy cover in the medium size tree class stands is currently at the moderate or high levels. Most stands currently at moderate levels would remain within the moderate range, and stands with high canopy closure would move to more moderate levels. This would also result in increased diameter growth, and accelerate the movement of these stands to the desired large tree size. Effects to Species Composition Thinning and underburn restoration treatments in Alternative B would move the species composition toward the desired condition of predominantly seral species. All proposed treatments reduce the percentage of climax species such as grand fir. Sapling size climax species down to four inches in diameter would also be removed during the thinning operations. The initial and periodic future underburns would kill most of the existing understory trees and trees that regenerate in the future. The additional sunlight available after thinning operations would reduce densities and the exposed soil caused by thinning and underburning would create conditions suitable for regeneration of ponderosa pine. Future underburns would be planned to avoid groups of ponderosa pine regeneration to allow these groups to grow and create a mosaic of age classes.
Crooked River Vegetation Management Project 3-11

3.1 - Forest Vegetation Resource
Effects to Number of Snags With this alternative, existing snags would be retained unless they posed a safety hazard. Large trees with apparent rot or broken tops would be retained for snag replacements. During the periodic underburn operations some trees would be damaged or killed. This would increase the number of snags and snag replacements. Decommissioning non-system roads would reduce firewood cutting access and limit snag removal. This alternative would move the current snag condition towards the desired condition at a faster rate than with the No Action alternative. The total number of snags per acre is currently within or above the desired range in PVGs 2, 5 and 6. Alternative B would maintain or increase the number of snags in those PVGs. Stands in PVG 1 are below the desired range for large snags. The underburns planned for PVG 1 would increase the number of large snags in that PVG. Alternative C With Alternative C, there would be 2,972 acres treated to move vegetation toward the desired future condition by reducing densities, reducing ladder fuels and ground fuels, promoting large tree structure, improving forest health, and increasing seral species and snag habitat. Under Alternative C, the amount of forested stands to be thinned and underburned would be 212 acres less than with Alternative B. Part of this reduction in treatment acres is because no new road would be constructed and access would not be available to treat stands in the Gopher Gulch area. The stand densities and existing ground fuels and fuel ladders in this area make underburning these stands impractical without thinning them first. There are 190 acres of planned thinning followed by underburning in the Gopher Gulch area that would not be implemented with Alternative C. The other areas that would not be thinned are in two RCAs, totaling 22 acres. All other treatments proposed in Alternative B would be the same. The following discussions regarding stand characteristics reflect how each component is used to measure the effects that this alternative will have in reaching the objective of moving vegetation toward the desired conditions defined in the Forest Plan. Effects to Tree Size Class, Canopy Closure, and Species Composition The overall effect on tree size class, canopy closure, and species composition at the Wildhorse River 5th field HU scale is minimal when these 190 acres are considered. However, the 190 acres that would not be treated in the Gopher Gulch area would continue to be at risk from damage by uncharacteristic wildfire and insect outbreaks. Tree densities would continue to increase, fuel ladders would increase, and ground fuels would continue to build up. The forest stands in the Gopher Gulch drainage are fairly contiguous. Any natural disturbance such as an uncharacteristic wildfire or insect outbreak would put the Gopher Gulch area as a whole at risk. Effects to Number of Snags Snag numbers would likely increase in the Gopher Gulch area. The old road into this area is closed and firewood cutters cannot remove snags. The increasing stand densities would cause increased mortality.Any wildfire in the area would increase snag numbers. The 22 acres of RCAs that would not be treated would continue to grow denser, ground fuels would continue to build up and fuel ladders would increase. These are small areas though and leaving them untreated would not cause the same risks as described for the Gopher Gulch area.
Cumulative Effects Cumulative effects combine the effects of the alternatives with conditions in the watershed created by past, present, and reasonably foreseeable actions. The area considered for cumulative effects is the Wildhorse 5th field hydrologic unit (HU). The Wildhorse Watershed encompasses 102,433 acres within the national forest boundary. There are 62,064 acres of forested land in the watershed. About 83% of the forested acres are in PVGs 1, 2, 5, and 6. The remaining 17% of the forested area is in PVGs 7 and 9 which are higher elevation subalpine fir habitat types. Most of the past, current and future forest
Crooked River Vegetation Management Project 3-12
3.1 - Forest Vegetation Resource
management in the Wildhorse Watershed is in the more productive areas encompassed by PVGs 2, 5, and 6. There are 13,586 acres of private land in the watershed of which about 4,030 acres are forested. About 2,170 (54%) of those forested acres have been managed using various cutting methods. About 57% of this managament was intermediate silvicultural treatments (partial cuts) and the remainder was regeneration treatments (clearcuts). Of the 88,848 acres of national forest land in the watershed, about 58,035 acres are forested. Approximately 26,510 (46%) of those forested acres have been managed in the past. Around 45% of this managament was intermediate silvicultural treatments (partial cuts) and the remainder was regeneration treatments (clearcuts and shelterwood cuts). The reasonably foreseeable actions on private land in the Wildhorse Watershed include additional harvest treatments in the easily accessible areas, precommercial thinning in the regeneration treatment areas, and fuel reduction treatments around structures. Activities planned on National Forest System lands in this watershed include precommercial thinning about 1,900 acres of young conifer plantations, treatments similar to those in Alternative B in forested stands including plantation with larger trees, and periodic underburns to maintain low levels of ground fuels and fuel ladders. The stands that would be treated with Alternative B would be treated again in the future using prescribed fire to maintain low fuel loads, and thinning to maintain crown separation in the overstory. Firewood harvest would be an ongoing activity in the area Most of the past harvest operations on Forest Service and private lands moved the forest vegetation toward the desired condition of more open stands dominated by seral, fire resistant tree species. However, large diameter seral species were removed. The precommercial thinning planned on Forest Service lands would keep these stands moving in the desired direction. Firewood cutting would remove some fuels but would not have a marked affect in the watershed. The overall cumulative effects of forest vegetation management in the Wildhorse Watershed, including treatments proposed in Alternative B and Alternative C, would continue to move forest vegetation toward the desired condition. Alternative B would move about 293 more acres of vegetation toward the desired condition than Alternative C. This condition would be one of open stands dominated by fire resistant tree species that would be maintained in that condition with prescribed fire and future mechanical treatments. Forest stands that are managed to create and maintain this desired condition would be more vigorous and more resilient to disturbance. These managed stands would be more resistant to uncharacteristic wildfire, insect infestation, and infections by disease and would resemble and function similarly to the stands that existed in the Wildhorse area prior to European settlement (Forest Plan FEIS p.3-579). The cumulative effects of Alternative A, the No Action alternative, would slow the progress of restoring these forest stands to the desired historic conditions. In some cases, the lack of vegetation treatments may result in these stands moving away from the desired conditions. The forest stands would continue to lack the desired characteristics that would make them more resistant to insect infestation, disease outbreaks and damage from uncharacteristic wildfire.
Short and Long Term Effects of Implementing the Action Alternatives. The primary short term effects of the action alternatives would be the beneficial impacts related to the reduction of wildfire risk. The planned vegetation treatments in Alternatives B and C would move the project area to a condition of more historic components resembling Fire Condition Class One (see Fire and Fuels Resource section in Chapter 3). Stand densities would be significantly lower and species composition would be more historic with the promotion of early seral species that are fire resistant. The primary long term effects of the action alternatives are an increase in stand vigor as a result of decreased competition for resources, and the removal of low vigor and dwarf mistletoe affected trees. These stands would be in a condition that would allow for the use of prescribed fire to maintain low fuel loads and prevent encroachment of climax tree species.
Crooked River Vegetation Management Project 3-13
3.1 - Forest Vegetation Resource
Crooked River Vegetation Management Project 3-14
Forest Plan Consistency Alternatives B and C are consistent with the Forest Plan direction for vegetation management, as the proposed activities work to maintain or restore vegetation to the desired conditions. Alternative A is not consistent with the Forest Plan direction for vegetation because no treatment activities are proposed and stands would continue to move away from the desired conditions.
Irreversible and Irretrievable Commitments There are no irreversible or irretrievable commitments associated with the vegetation management proposed in this project.
Project Record This EA herby incorporates by reference the Vegetation Specialist Report in the Project Record (40 CFR 1502.21). The Vegetation Specialist Report is located in the Project Record and contains the detailed data, analysis, and technical documentation that the Vegetation Specialist relied upon to reach the conclusions in this EA.
3.2 - Fire and Fuels Resource
3.2 Fire and Fuels Resource Objectives Move vegetation toward the desired future conditions defined in the Forest Plan, with an emphasis on promoting the development of large tree forest structures and reintroducing fire into the ecosystem, and improving forest health. Reduce the risk of uncharacteristic and undesirable wildland fire, with an emphasis on wildland urban interface protection. Measurements
Fire Return Interval Departure (FRID). Predicted fire behavior.
Forest Plan Direction
Desired Condition The following section defines the desired condition for the project area from a fire and fuels management perspective. The Forest Plan defines goals, objectives, standards, and guidelines for the project area. Chapter 1 of this EA describes how the project Objectives tier to the Forest Plan. This section describes the specific measurements that will be used to compare the alternative actions. This section describes:
what the measurements mean, how the measurements are applicable to the project objectives, what the measurements desired results are for this project and why the desired results were selected.
The measurements that were selected for this analysis are fire return interval departure and predicted fir behavior. These measurements are discussed below. Fire Return Interval Departure Fire Return Interval Departure (FRID) is based on the historic fire return interval (the historical interval between fires, in years) for the vegetation type of interest, and the years that have elapsed since the last fire. From maps and fire history studies of where and when fires have occurred in the past, average fire return intervals for each vegetation type class can be determined, and along with the time that has elapsed since the last fire, a derived index can be calculated to quantify the departure of an area from its average fire return interval. (Keifer 2001)
The equation to calculate FRID is: FRID index = (Years since last fire - Natural Fire Return Interval) / Natural Fire Return Interval
This measurement applies to the purpose statement of “Move vegetation toward the desired future conditions defined in the Forest Plan, with an emphasis on promoting the development of large tree forest structures and reintroducing fire into the ecosystem, and improving forest health. ” The beginning portion of this purpose statement, “Move vegetation toward the desired future conditions defined in the Forest Plan, with an emphasis on promoting the development of large tree forest structures…” is analyzed in the Vegetation Resource Section and will not be analyzed again in this section. The latter part of this purpose statement, “…reintroducing fire into the ecosystem.“ will be analyzed in this section by comparing the existing FRID to the post treatment FRID value. FRID is used to measure movement toward the historic fire return interval. The desired condition is to have a FRID index value near zero. A FRID index of zero would mean that the fire return interval is the same as the historic mean. Any FRID index greater than zero means that there more years have elapsed since the last fire than would have historically occurred. For example, a FRID index of 1 means that an area has missed 1 fire return interval, a FRID index of 2 means that 2 fire return intervals have been missed and so on. In contrast to this, a negative FRID index means that the area is burning more frequently than historically occurred. For example, a FRID index of negative one means that the area is burning twice as often as the historic fire return interval.
Crooked River Vegetation Management Project 3-15

3.2 - Fire and Fuels Resource
The reason that moving the project area toward the historic (pre-European settlement) fire return interval is desirable is because, wildland fire is the ecological process by which many of the desired vegetative attributes in the Forest Plan were historically maintained. The historic fire return interval for this project is defined as the pre-European settlement (approximately 1600-1900) condition. This period in time was selected because fire suppression and European management practices were not influencing the vegetation and there is research available to indicate what the fire return interval during this period was. Also, during this period, fire regimes in the types of vegetation present today were functioning and research is available that documents the historic range of variability during this time period (Morgan and Parsons 2001, as referenced in the Forest Plan).
Predicted Fire Behavior Fire behavior predictions are estimations of the characteristics of a wildland fire under user defined conditions. For this analysis, the fire behavior predictions were made using Fuels Management Analyst (FMA) Plus (Carlton 2005). FMA uses weather conditions, stand data, and fuel model inputs that are input by the user. The outputs from the model used in this analysis include: flame length, torching index, crowning index, and fire type. These inputs and outputs are defined below. Inputs For this analysis, modeling of WUI treatments were completed using 97th percentile weather conditions. 97th percentile weather conditions are defined as weather conditions for only which only 3% of the days during fire season are hotter, drier and windier; these could be considered extreme conditions for fire behavior. 97th percentile weather was used in WUI areas because it is important that the proposed treatments are effective under the full range of weather conditions that could occur on the site. Outside WUI areas, 90th percentile weather conditions were used. 90th percentile weather conditions are defined as weather conditions for only which 10% of the days during fire season are more hot, dry and windy. 90th percentile weather conditions were used because they are more likely to be representative of conditions if an unplanned wildland fire occurred in any given fire season. Plot data and ocular estimates were used to estimate the current condition of representative stands for vegetative and fuel model inputs. The stand data for pre treatment was based on field reconnaissance that included inventory plots and ocular estimates of conditions. Post treatment stand data were based on pre-treatment conditions, the proposed action and conversations with the project silviculturalist. All data and model runs used for modeling can be found in the Fuels Specialist Report Project Record. In order to evaluate the alternatives using the measurable objectives, three representative stands were modeled. The three types of representative stands that were modeled are:
1. a WUI stand; 2. a Non-WUI Stand; & 3. a Plantation.
The following is a brief description of what these stands are representative of. WUI stand The modeling results from WUI stands are representative of a typical stand proposed for mechanical and prescribed fire treatment, outside of the riparian conservation areas. Non-WUI Stand The modeling results from Non-WUI stands are representative of a typical stand proposed for mechanical and prescribed fire treatment, outside of the riparian conservation areas. Plantation The modeling results from Plantations are representative of a typical stand proposed for mechanical and/or prescribed fire treatment, within plantations and outside of the riparian conservation areas.
These three stands were modeled to represent:
1. existing conditions 2. post-treatment conditions for all three alternatives
Crooked River Vegetation Management Project 3-16
3.2 - Fire and Fuels Resource
Outputs The outputs of the model that are used in this analysis include torching index, crowning index, fire type, and flame length. These are used because they aid in determining the potential for stand replacing wildfire, which may or may not be desired, depending upon the fire regime. Flame length is used in the analyses only in the WUI setting because outside the WUI areas, flame length is not a good indicator of whether an area is within its historic fire regime. The following defines the outputs of the FMA model: Torching Index (T.I.) is the 20-foot windspeed at which crown fire is expected to initiate. In other words, the higher the TI, the more resistant to torching and passive crown fire a stand is. The primary driver of TI is the canopy base height. Crowning Index (C.I.) is the 20-foot windspeed at which active crown fire is possible. In other words, the higher the CI the more resistant to active crown fire a stand is. The primary driver of CI is canopy bulk density. Fire Type – There are three types of fires predicted in the model:
Surface Fire – is a fire that burns only in the surface fuelbed. This is predicted when the 20-foot windspeed is input at a value less than the TI or CI.
Passive Crown Fire – (also called torching) is small scale and consumes the canopies of only single or small groups of trees. This is predicted when the 20-foot windspeed is input at a value greater than the TI, but less than the CI.
Active Crown Fire – occurs when the surface fire ignites trees crowns and fire spread is able to propagate through the canopy. This is predicted when the 20-foot windspeed is input at a value greater than the TI and CI.
The fire behavior prediction measurements were selected to compare the alternative actions to the purpose statement of, “Reduce the risk of uncharacteristic and undesirable wildland fire, with an emphasis on wildland urban interface protection “. These measurements allow the reader to compare predicted fire behavior from various alternative actions. For this project, the following definitions apply:
Uncharacteristic wildland fire – is defined as a wildland fire that causes fire behavior and/or effects that are not within the historic fire regime for a given area. Some examples of this would be: stand replacing fire in a non-lethal fire regime; or excessive mortality of overstory trees in a dry, grand fir potential vegetation group, where historically a low percentage of the larger trees would be killed by wildland fire.
Undesirable wildland fire – is defined as unwanted wildland fire. This differs from an uncharacteristic fire in that it is within its natural fire regime, but due to social or political reasons is not desired in a given area at a given time under certain circumstances. Some examples of this would be: a wildland fire that burns a home or outbuilding; or a stand replacing fire originating on federal property that stand replace the timber on a private parcel.
Wildland / Urban Interface (WUI) – is defined as the line, area, or zone where structures and other human developments meet or intermingle with wildland or vegetative fuel (USDA Forest Service 2003b).
The reason that reducing the potential for uncharacteristic and undesired wildland fire is desirable is because the project area is a fire environment. This means that there has historically been and will continue to be hot, dry portions of the year where both human and natural caused ignitions occur. A fire history analysis of Forest Service data was completed in the project area and shows that there have been 36 documented fires suppressed in the project area from 1958 through 2006. A number of large wildfires have also occurred in similar areas on the Council Ranger District in the past 60 years. This fire history combined with fire history research (Mehl et.al. 1998, Barrett 1984, 1987, 1988, 1994, & 2000, Steele et. al. 1986 & Sloan 1998) indicate that the project area is indeed a fire adapted environment that has been affected by past management actions. Managing the live and dead fuels prior to an unplanned ignition will aid in managing subsequent unplanned wildland fires and reduce the risk of undesirable or uncharacteristic wildland fire.
In order to reduce the risk for potential uncharacteristic and undesirable wildland fire, the desired post treatment for fire behavior predictions are:
Crooked River Vegetation Management Project 3-17
3.2 - Fire and Fuels Resource
In WUI areas: Post treatment predicted fire behavior (under 97th percentile weather conditions) should be:
flame lengths less than four feet increased torching index increased crowning index surface fire
In non-WUI areas: Post treatment predicted fire behavior (under 90th percentile weather conditions) should be:
increased torching index increased crowning index surface fire
The rationale for the selection of the predicted fire behavior measurements in WUI areas are:
Flame lengths less than four feet – is considered relevant because it is considered the upper limit at which a fire can be attacked directly with personnel using hand tools and correlates to approximately 100 BTUs per second per foot of fire front (NWCG 1992).
Increased Torching Index, Increased Crowning Index, and Surface Fire – are desirable because increasing the TI and CI lowers the potential for isolated tree torching and crown fire activity. Torching and crown fire activity within ½ mile of structures has the potential to cause spotting and erratic fire behavior that can create difficulty when attempting to protect WUI.
In order to protect the improvements in the project area, flame lengths in excess of four feet and erratic fire behavior are not desirable. Therefore the above criteria were put on the predicted fire behavior to reduce the potential for undesirable wildland fire. The rationale for the selection of the predicted fire behavior measurements in non-WUI areas are:
Increased Torching Index, Increased Crowning Index, and Surface Fire – are desirable because the historic fire regimes in the project area are primarily nonlethal and mixed I. A fire regime is defined as the characteristics of fire in a given ecosystem, including factors such as frequency, intensity, severity, and patch size. The terms used for the different fire regimes are: Nonlethal, Mixed1, Mixed2, and Lethal. Nonlethal fires are generally of lowest intensity and severity with the smallest patches of mortality, while lethal fires are generally of highest intensity and severity with the largest patches of mortality. The others fall in between. (USDA Forest Service 2003b).
These nonlethal and mixed I fire regimes historically experienced relatively frequent, low intensity fires with small patches of stand replacement fire. Therefore, creating conditions with less potential for torching and crown fire behavior will minimize the potential for uncharacteristic wildland fire in the project area.
Scope of the Analysis The direct and indirect effects of the alternatives will be analyzed within the project area. The cumulative effects will be analyzed within and adjacent to the project area. The Wildland / Urban Interface (WUI) treatments will be analyzed within ½ mile of Lafferty Campground, homes and other structures in the project area. A map of the WUI areas is available in the project record. The powerline that runs through the project area is not considered WUI for this analysis, as the vegetation in the powerline corridor is maintained by the power company; although, many of the proposed treatments would aid in protecting the powerline from direct flame impingement. In the event of a wildfire, some actions, if time and resources were available (i.e. - shutting down power when heavy smoke or flame impingement is expected to occur to avoid arcing, scraping an area around wooden poles to bare mineral soil, wrapping wooden poles with fire resistant material, etc) would be completed. These measures are somewhat effective at sustaining power supplies, and it is felt that further analysis is not needed for the powerline corridor as WUI.
Crooked River Vegetation Management Project 3-18
3.2 - Fire and Fuels Resource
Affected Environment
Current Condition The current condition in the project area is broken into the following sections: 1) Fire Return Interval Departure and 2) Predicted Fire Behavior. This section allows the reader to have some baseline conditions to compare the alternative action to and to understand the rationale for selecting this project area. Existing Fire Return Interval Departure Historically, fire return intervals in the project area varied depending upon the Potential Vegetation Group (USDA Forest Service 2003b).
Potential Vegetation Groups (PVGs) are descriptions of potential climax vegetation that indicate environmental conditions on sites that share similar environmental characteristics, site productivity, and disturbance regimes. Additional information on PVGs and detailed descriptions of the PVGs may be found in Appendix A of the Forest Plan.
The primary PVGs in the project area are: 2 - Warm, Dry Douglas-fir / Moist Ponderosa Pine; 5 – Dry Grand Fir; 6 – Cool, Moist Grand Fir; grasslands; and shrublands. A more detailed description of vegetation in the project area can be found in the Vegetation Specialist Report.
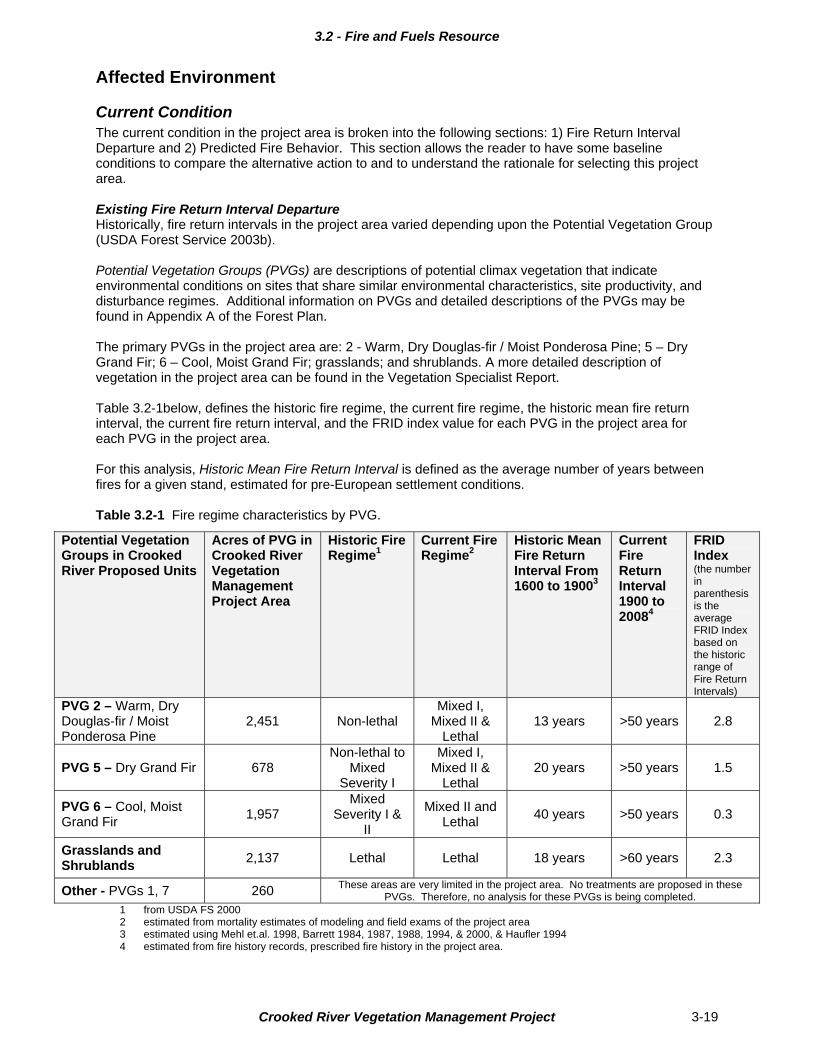
Table 3.2-1below, defines the historic fire regime, the current fire regime, the historic mean fire return interval, the current fire return interval, and the FRID index value for each PVG in the project area for each PVG in the project area.
For this analysis, Historic Mean Fire Return Interval is defined as the average number of years between fires for a given stand, estimated for pre-European settlement conditions. Table 3.2-1 Fire regime characteristics by PVG.
1 from USDA FS 2000
Potential Vegetation Groups in Crooked River Proposed Units
Acres of PVG in Crooked River Vegetation Management Project Area
Historic Fire Regime1
Current Fire Regime2
Historic Mean Fire Return Interval From 1600 to 19003
Current Fire Return Interval 1900 to 20084
FRID Index (the number in parenthesis is the average FRID Index based on the historic range of Fire Return Intervals)
PVG 2 – Warm, Dry Douglas-fir / Moist Ponderosa Pine
2,451 Non-lethal Mixed I,
Mixed II & Lethal
13 years >50 years 2.8
PVG 5 – Dry Grand Fir 678 Non-lethal to
Mixed Severity I
Mixed I, Mixed II &
Lethal 20 years >50 years 1.5
PVG 6 – Cool, Moist Grand Fir
1,957 Mixed
Severity I & II
Mixed II and Lethal
40 years >50 years 0.3
Grasslands and Shrublands
2,137 Lethal Lethal 18 years >60 years 2.3
Other - PVGs 1, 7 260 These areas are very limited in the project area. No treatments are proposed in these PVGs. Therefore, no analysis for these PVGs is being completed.
2 estimated from mortality estimates of modeling and field exams of the project area 3 estimated using Mehl et.al. 1998, Barrett 1984, 1987, 1988, 1994, & 2000, & Haufler 1994 4 estimated from fire history records, prescribed fire history in the project area.
Crooked River Vegetation Management Project 3-19

3.2 - Fire and Fuels Resource
The current fire return interval in the project area has been altered due to past management activity. Fire suppression, grazing, timber management, road construction, and other management activities in the project area have altered the fire regime and fire return intervals from the historic fire regimes and fire return intervals. The results of this past management are that the current forest structure would support more intense/lethal fire than would historically be expected in each of the forested PVGs. The current fire return intervals are also greater than the historic fire return intervals in the project area. As seen in Table 3.1-1, PVGs with more frequent historic fire return intervals have the highest FRID index departure values. Existing Predicted Fire Behavior The outputs of the fire behavior modeling for the existing condition are shown in the table below. Table 3.2-2 Predicted fire behavior.
Predicted Fire Behavior – Existing Conditions
Modeling Results Representative of a:
Torching Index
Crowning Index
Fire Type
Flame Length (feet)
WUI Stand 9 mph 32 mph Passive Crown Fire
4.3
Non WUI Stands 9 mph 32 mph Passive Crown Fire
Not Applicable1
Plantation 8 mph 16 mph Passive Crown Fire
Not Applicable1
1 - Flame length is not defined as one of measurements outside of the WUI. In WUI areas In forested WUI areas that are proposed for treatment, the predicted fire behavior in a representative stand would have flame lengths slightly over four feet and would experience torching of individual and small groups of trees if a fire under 97th percentile weather conditions. Neither of these fire behavior characteristics are desirable when attempting to protect improvements and could potentially cause containment and control problems.
In non-WUI areas In both the forest stands including the plantations torching of individual and small groups of trees would be expected. This type of fire behavior is expected because of the ladder fuels present. These ladder fuels allow a surface fire to get into the crowns of the trees, causing passive crown fire behavior. The crowning indices in the project area indicate that there is a relatively high potential for active crown fire to occur in the plantations and it is reasonable to assume that active crown fire could occur in stands of larger trees under more extreme conditions than were modeled for this analysis. The CI of 16 in plantations and 32 in the representative forest stand are values that could be seen within the project area. Passing fronts and fire generated winds at speeds in excess of 35 mph, although not common, do occur in the project area.
Environmental Effects This portion of the paper will describe the effects of the alternatives in relation to the fire management objectives identified for this project. For example, the objective of “moving conditions toward the desired future conditions defined in the Forest Plan” will be broken down into three sections describing the effects from:
1. Alternative A - No Action Alternative 2. Alternative B - Proposed Action Alternative 3. Alternative C
Direct and Indirect Effects Fire Return Interval Departure This section will compare the effects of each alternative action on the FRID for which the desired condition is to have a FRID index value near 0 (Table 3.2-3).
Crooked River Vegetation Management Project 3-20

3.2 - Fire and Fuels Resource
Table 3.2-3 FRID Index value for each alternative.
Alternative
PVG
Historic Mean Fire
Return Interval
Post Treatment
Fire Return Interval
FRID Index Value
2 13 >50 >2.8 5 20 >50 >1.5 6 40 >50 >0.3
Existing Condition
Grassland 18 >60 >2.3 2 13 >70 >4.4 5 20 >70 >2.5 6 40 >70 >0.8
A
Grassland 18 >80 >3.4 2 13 15 0.2 5 20 22 0.1 6 40 50 0.3
B
Grassland 18 20 0.1 2 13 16 0.2 5 20 25 0.3 6 40 50 0.3
C
Grassland 18 22 0.2
Alternative A – No Action As is shown in the above table, Alternative A would move conditions in the project area further from desired conditions. This would be primarily due to the continued exclusion of fire from the ecosystem. The FRID in PVGs with historically high frequency fire regimes (i.e. PVG 2, 5 and grasslands) would be most dramatic. The potential effects of missing numerous fire cycles, are that when fire is eventually returned to the ecosystem, there may be more risk of losing key ecosystem components, there may be dramatic changes in fire and vegetation attributes and vegetation attributes may be substantially altered (Hahn et al, 2008). In contrast to this, PVGs with relatively longer historic fire return intervals, such as PVG 6, exhibit less of a departure from historic fire return intervals, although in the case of much of the Crooked River Project Area it is estimated that the historic fire return intervals are high, especially when an area of PVG 6 is surrounded by PVGs with more frequent fire return intervals. The species, historic stumps, and relic trees in much of the PVG 6 are large diameter widely spaced ponderosa pine with mid-aged (20-80) year old grand fir in the understory. These widely spaced old (200+year) large diameter trees indicate that frequent low intensity fires burned through some of the stands that are in PVG 6. It is felt that the FRID index for PVG 6 reflects the low end for the areas of PVG 6 proposed for treatment within the project area. Some fire history research in the area indicates that historic fire return interval ranges in PVG6 were as low as 11 years (Barrett 1994). This helps to further support this hypothesis. This is not to say that all PVG 6 in the project area reflect such a low fire return interval, but that it is possible that some of the PVG 6 in the area may have historically had a more frequent fire return interval than indicated by table Table 3.2-3.
Alternative B – Proposed Action This Alternative would move conditions closer to the desired future conditions identified in the Forest Plan. Although there would still be slight departure from desired conditions, these FRID values are quite close to the desired condition of zero. Alternative C This Alternative would also move conditions closer to the desired conditions. The effects of this alternative are almost identical to those of Alternative B. The primary difference between these alternatives is that fewer acres are proposed for treatment under Alternative C. Therefore, the average departure in the project area would be slightly elevated from the FRID values for alternative B.
Crooked River Vegetation Management Project 3-21
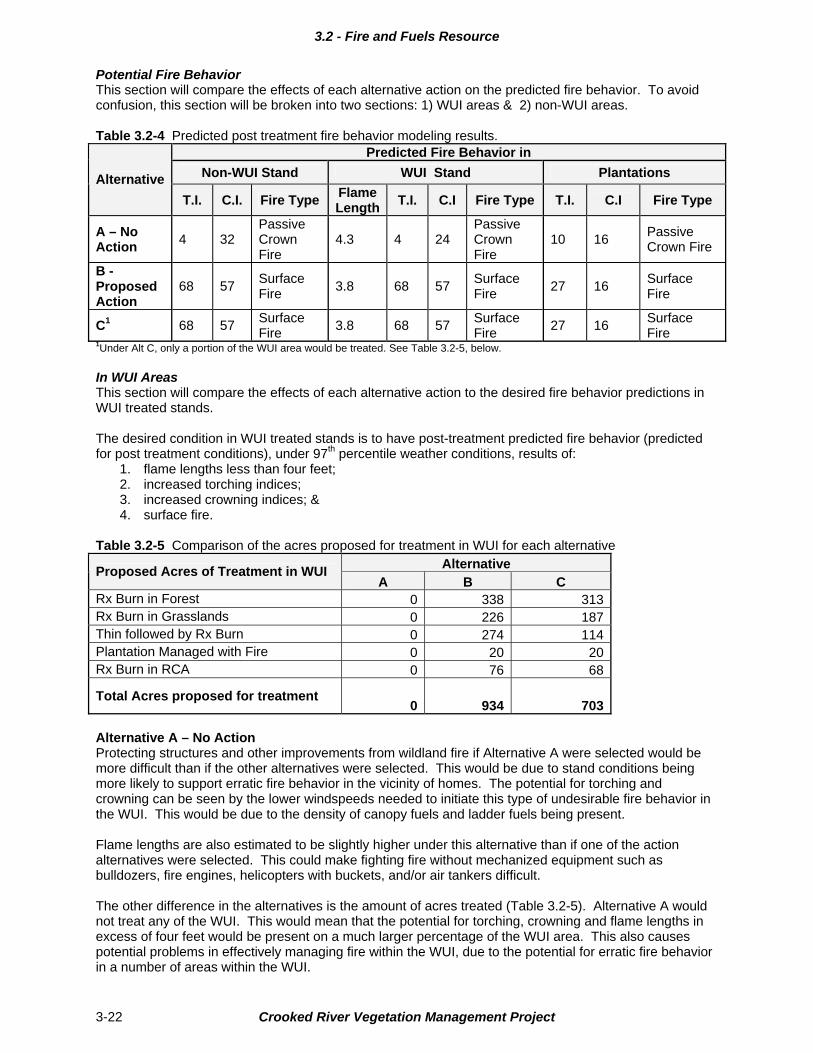
3.2 - Fire and Fuels Resource
Potential Fire Behavior This section will compare the effects of each alternative action on the predicted fire behavior. To avoid confusion, this section will be broken into two sections: 1) WUI areas & 2) non-WUI areas. Table 3.2-4 Predicted post treatment fire behavior modeling results.
Predicted Fire Behavior in
Non-WUI Stand WUI Stand Plantations Alternative
T.I. C.I. Fire Type Flame Length
T.I. C.I Fire Type T.I. C.I Fire Type
A – No Action
4 32 Passive Crown Fire
4.3 4 24 Passive Crown Fire
10 16 Passive Crown Fire
B - Proposed Action
68 57 Surface Fire
3.8 68 57 Surface Fire
27 16 Surface Fire
C1 68 57 Surface Fire
3.8 68 57 Surface Fire
27 16 Surface Fire
1Under Alt C, only a portion of the WUI area would be treated. See Table 3.2-5, below. In WUI Areas This section will compare the effects of each alternative action to the desired fire behavior predictions in WUI treated stands.
The desired condition in WUI treated stands is to have post-treatment predicted fire behavior (predicted for post treatment conditions), under 97th percentile weather conditions, results of:
1. flame lengths less than four feet; 2. increased torching indices; 3. increased crowning indices; & 4. surface fire.
Table 3.2-5 Comparison of the acres proposed for treatment in WUI for each alternative
Alternative Proposed Acres of Treatment in WUI
A B C Rx Burn in Forest 0 338 313 Rx Burn in Grasslands 0 226 187 Thin followed by Rx Burn 0 274 114 Plantation Managed with Fire 0 20 20 Rx Burn in RCA 0 76 68
Total Acres proposed for treatment 0 934 703
Alternative A – No Action Protecting structures and other improvements from wildland fire if Alternative A were selected would be more difficult than if the other alternatives were selected. This would be due to stand conditions being more likely to support erratic fire behavior in the vicinity of homes. The potential for torching and crowning can be seen by the lower windspeeds needed to initiate this type of undesirable fire behavior in the WUI. This would be due to the density of canopy fuels and ladder fuels being present. Flame lengths are also estimated to be slightly higher under this alternative than if one of the action alternatives were selected. This could make fighting fire without mechanized equipment such as bulldozers, fire engines, helicopters with buckets, and/or air tankers difficult. The other difference in the alternatives is the amount of acres treated (Table 3.2-5). Alternative A would not treat any of the WUI. This would mean that the potential for torching, crowning and flame lengths in excess of four feet would be present on a much larger percentage of the WUI area. This also causes potential problems in effectively managing fire within the WUI, due to the potential for erratic fire behavior in a number of areas within the WUI.
Crooked River Vegetation Management Project 3-22
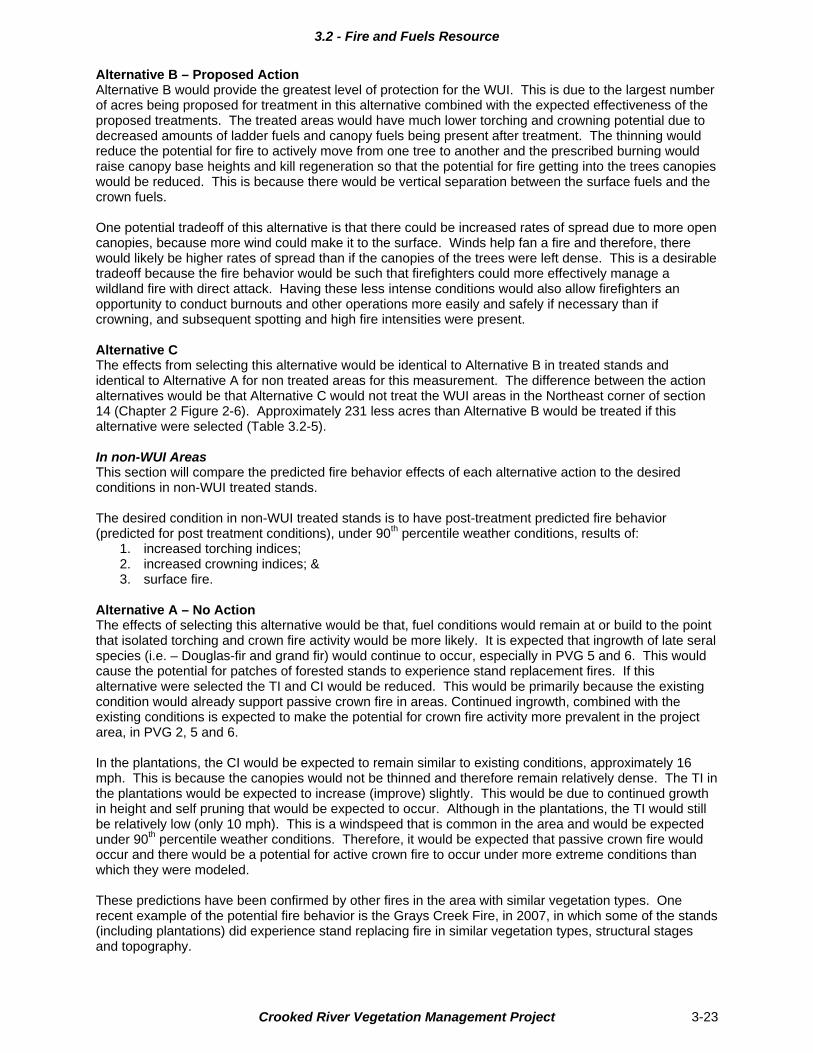
3.2 - Fire and Fuels Resource
Alternative B – Proposed Action Alternative B would provide the greatest level of protection for the WUI. This is due to the largest number of acres being proposed for treatment in this alternative combined with the expected effectiveness of the proposed treatments. The treated areas would have much lower torching and crowning potential due to decreased amounts of ladder fuels and canopy fuels being present after treatment. The thinning would reduce the potential for fire to actively move from one tree to another and the prescribed burning would raise canopy base heights and kill regeneration so that the potential for fire getting into the trees canopies would be reduced. This is because there would be vertical separation between the surface fuels and the crown fuels. One potential tradeoff of this alternative is that there could be increased rates of spread due to more open canopies, because more wind could make it to the surface. Winds help fan a fire and therefore, there would likely be higher rates of spread than if the canopies of the trees were left dense. This is a desirable tradeoff because the fire behavior would be such that firefighters could more effectively manage a wildland fire with direct attack. Having these less intense conditions would also allow firefighters an opportunity to conduct burnouts and other operations more easily and safely if necessary than if crowning, and subsequent spotting and high fire intensities were present.
Alternative C The effects from selecting this alternative would be identical to Alternative B in treated stands and identical to Alternative A for non treated areas for this measurement. The difference between the action alternatives would be that Alternative C would not treat the WUI areas in the Northeast corner of section 14 (Chapter 2 Figure 2-6). Approximately 231 less acres than Alternative B would be treated if this alternative were selected (Table 3.2-5).
In non-WUI Areas This section will compare the predicted fire behavior effects of each alternative action to the desired conditions in non-WUI treated stands.
The desired condition in non-WUI treated stands is to have post-treatment predicted fire behavior (predicted for post treatment conditions), under 90th percentile weather conditions, results of:
1. increased torching indices; 2. increased crowning indices; & 3. surface fire.
Alternative A – No Action The effects of selecting this alternative would be that, fuel conditions would remain at or build to the point that isolated torching and crown fire activity would be more likely. It is expected that ingrowth of late seral species (i.e. – Douglas-fir and grand fir) would continue to occur, especially in PVG 5 and 6. This would cause the potential for patches of forested stands to experience stand replacement fires. If this alternative were selected the TI and CI would be reduced. This would be primarily because the existing condition would already support passive crown fire in areas. Continued ingrowth, combined with the existing conditions is expected to make the potential for crown fire activity more prevalent in the project area, in PVG 2, 5 and 6. In the plantations, the CI would be expected to remain similar to existing conditions, approximately 16 mph. This is because the canopies would not be thinned and therefore remain relatively dense. The TI in the plantations would be expected to increase (improve) slightly. This would be due to continued growth in height and self pruning that would be expected to occur. Although in the plantations, the TI would still be relatively low (only 10 mph). This is a windspeed that is common in the area and would be expected under 90th percentile weather conditions. Therefore, it would be expected that passive crown fire would occur and there would be a potential for active crown fire to occur under more extreme conditions than which they were modeled. These predictions have been confirmed by other fires in the area with similar vegetation types. One recent example of the potential fire behavior is the Grays Creek Fire, in 2007, in which some of the stands (including plantations) did experience stand replacing fire in similar vegetation types, structural stages and topography.
Crooked River Vegetation Management Project 3-23
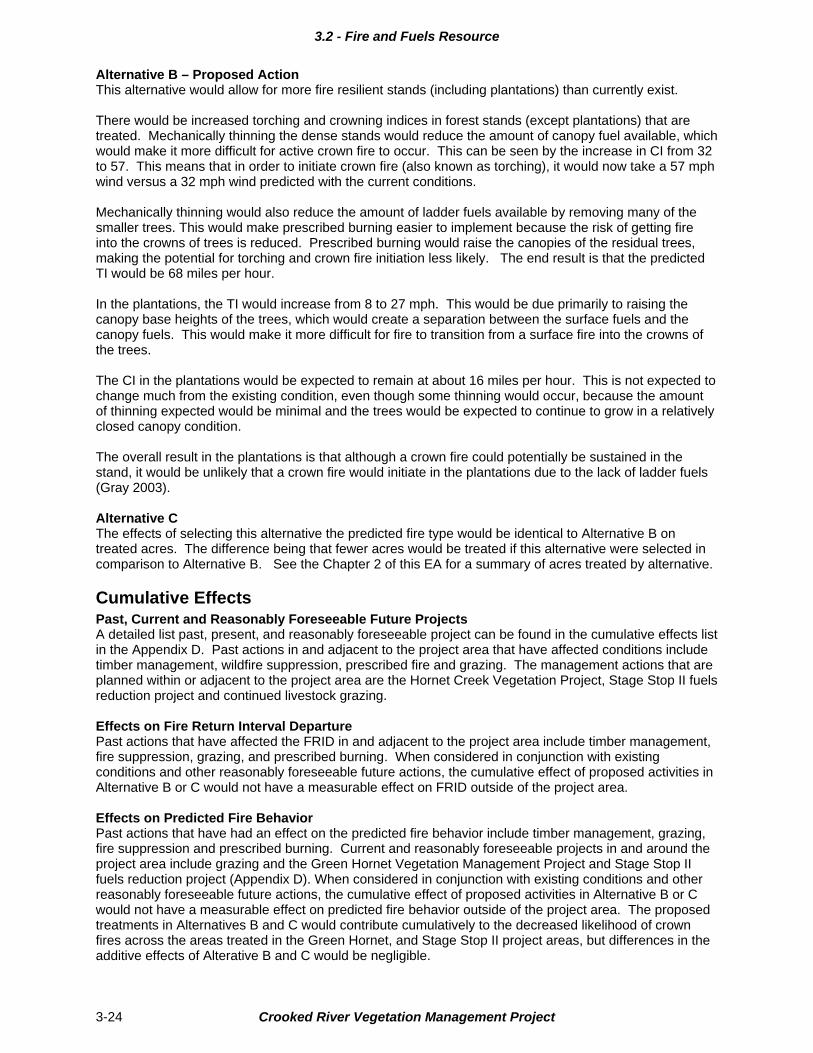
3.2 - Fire and Fuels Resource
Alternative B – Proposed Action This alternative would allow for more fire resilient stands (including plantations) than currently exist. There would be increased torching and crowning indices in forest stands (except plantations) that are treated. Mechanically thinning the dense stands would reduce the amount of canopy fuel available, which would make it more difficult for active crown fire to occur. This can be seen by the increase in CI from 32 to 57. This means that in order to initiate crown fire (also known as torching), it would now take a 57 mph wind versus a 32 mph wind predicted with the current conditions. Mechanically thinning would also reduce the amount of ladder fuels available by removing many of the smaller trees. This would make prescribed burning easier to implement because the risk of getting fire into the crowns of trees is reduced. Prescribed burning would raise the canopies of the residual trees, making the potential for torching and crown fire initiation less likely. The end result is that the predicted TI would be 68 miles per hour. In the plantations, the TI would increase from 8 to 27 mph. This would be due primarily to raising the canopy base heights of the trees, which would create a separation between the surface fuels and the canopy fuels. This would make it more difficult for fire to transition from a surface fire into the crowns of the trees. The CI in the plantations would be expected to remain at about 16 miles per hour. This is not expected to change much from the existing condition, even though some thinning would occur, because the amount of thinning expected would be minimal and the trees would be expected to continue to grow in a relatively closed canopy condition. The overall result in the plantations is that although a crown fire could potentially be sustained in the stand, it would be unlikely that a crown fire would initiate in the plantations due to the lack of ladder fuels (Gray 2003).
Alternative C The effects of selecting this alternative the predicted fire type would be identical to Alternative B on treated acres. The difference being that fewer acres would be treated if this alternative were selected in comparison to Alternative B. See the Chapter 2 of this EA for a summary of acres treated by alternative.
Cumulative Effects Past, Current and Reasonably Foreseeable Future Projects A detailed list past, present, and reasonably foreseeable project can be found in the cumulative effects list in the Appendix D. Past actions in and adjacent to the project area that have affected conditions include timber management, wildfire suppression, prescribed fire and grazing. The management actions that are planned within or adjacent to the project area are the Hornet Creek Vegetation Project, Stage Stop II fuels reduction project and continued livestock grazing. Effects on Fire Return Interval Departure Past actions that have affected the FRID in and adjacent to the project area include timber management, fire suppression, grazing, and prescribed burning. When considered in conjunction with existing conditions and other reasonably foreseeable future actions, the cumulative effect of proposed activities in Alternative B or C would not have a measurable effect on FRID outside of the project area. Effects on Predicted Fire Behavior Past actions that have had an effect on the predicted fire behavior include timber management, grazing, fire suppression and prescribed burning. Current and reasonably foreseeable projects in and around the project area include grazing and the Green Hornet Vegetation Management Project and Stage Stop II fuels reduction project (Appendix D). When considered in conjunction with existing conditions and other reasonably foreseeable future actions, the cumulative effect of proposed activities in Alternative B or C would not have a measurable effect on predicted fire behavior outside of the project area. The proposed treatments in Alternatives B and C would contribute cumulatively to the decreased likelihood of crown fires across the areas treated in the Green Hornet, and Stage Stop II project areas, but differences in the additive effects of Alterative B and C would be negligible.
Crooked River Vegetation Management Project 3-24
3.2 - Fire and Fuels Resource
Crooked River Vegetation Management Project 3-25
Forest Plan Consistency The action alternatives are consistent with Forest Plan direction for Fire Management standards and guidelines with emphasis on fuel management. Alternatives B and C would move the current condition toward the desired condition.
Irreversible and Irretrievable Commitments There are no irreversible or irretrievable commitments expected if any of the alternatives are selected from a fire management perspective.
Project Record This EA hereby incorporates by reference the Fire and Fuels Specialist Report and Fuels Specialist Report Project Record in the Project Record (40 CFR 1502.21). This report and project record contain the detailed data, methodologies, analysis, conclusions, references, and technical documentation that the Fire & Fuels Specialist relied upon to reach the conclusion in this EA.
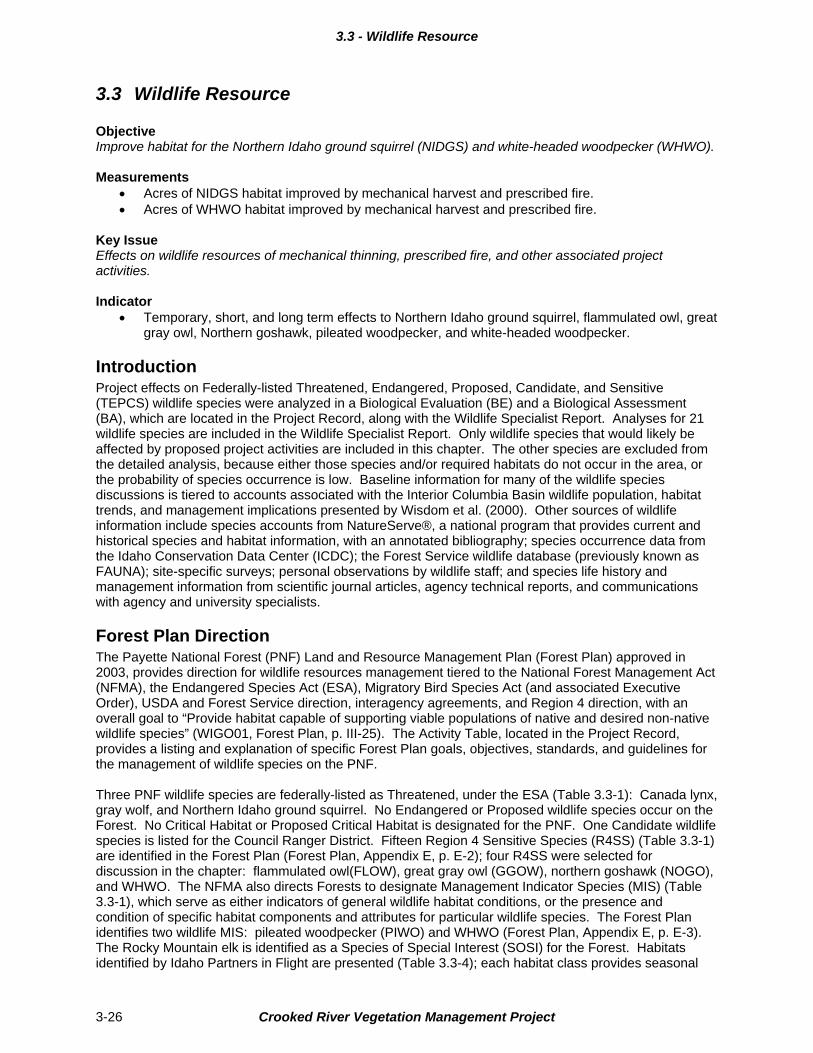
3.3 - Wildlife Resource
3.3 Wildlife Resource Objective Improve habitat for the Northern Idaho ground squirrel (NIDGS) and white-headed woodpecker (WHWO). Measurements
Acres of NIDGS habitat improved by mechanical harvest and prescribed fire. Acres of WHWO habitat improved by mechanical harvest and prescribed fire.
Key Issue Effects on wildlife resources of mechanical thinning, prescribed fire, and other associated project activities. Indicator
Temporary, short, and long term effects to Northern Idaho ground squirrel, flammulated owl, great gray owl, Northern goshawk, pileated woodpecker, and white-headed woodpecker.
Introduction Project effects on Federally-listed Threatened, Endangered, Proposed, Candidate, and Sensitive (TEPCS) wildlife species were analyzed in a Biological Evaluation (BE) and a Biological Assessment (BA), which are located in the Project Record, along with the Wildlife Specialist Report. Analyses for 21 wildlife species are included in the Wildlife Specialist Report. Only wildlife species that would likely be affected by proposed project activities are included in this chapter. The other species are excluded from the detailed analysis, because either those species and/or required habitats do not occur in the area, or the probability of species occurrence is low. Baseline information for many of the wildlife species discussions is tiered to accounts associated with the Interior Columbia Basin wildlife population, habitat trends, and management implications presented by Wisdom et al. (2000). Other sources of wildlife information include species accounts from NatureServe®, a national program that provides current and historical species and habitat information, with an annotated bibliography; species occurrence data from the Idaho Conservation Data Center (ICDC); the Forest Service wildlife database (previously known as FAUNA); site-specific surveys; personal observations by wildlife staff; and species life history and management information from scientific journal articles, agency technical reports, and communications with agency and university specialists.
Forest Plan Direction The Payette National Forest (PNF) Land and Resource Management Plan (Forest Plan) approved in 2003, provides direction for wildlife resources management tiered to the National Forest Management Act (NFMA), the Endangered Species Act (ESA), Migratory Bird Species Act (and associated Executive Order), USDA and Forest Service direction, interagency agreements, and Region 4 direction, with an overall goal to “Provide habitat capable of supporting viable populations of native and desired non-native wildlife species” (WIGO01, Forest Plan, p. III-25). The Activity Table, located in the Project Record, provides a listing and explanation of specific Forest Plan goals, objectives, standards, and guidelines for the management of wildlife species on the PNF. Three PNF wildlife species are federally-listed as Threatened, under the ESA (Table 3.3-1): Canada lynx, gray wolf, and Northern Idaho ground squirrel. No Endangered or Proposed wildlife species occur on the Forest. No Critical Habitat or Proposed Critical Habitat is designated for the PNF. One Candidate wildlife species is listed for the Council Ranger District. Fifteen Region 4 Sensitive Species (R4SS) (Table 3.3-1) are identified in the Forest Plan (Forest Plan, Appendix E, p. E-2); four R4SS were selected for discussion in the chapter: flammulated owl(FLOW), great gray owl (GGOW), northern goshawk (NOGO), and WHWO. The NFMA also directs Forests to designate Management Indicator Species (MIS) (Table 3.3-1), which serve as either indicators of general wildlife habitat conditions, or the presence and condition of specific habitat components and attributes for particular wildlife species. The Forest Plan identifies two wildlife MIS: pileated woodpecker (PIWO) and WHWO (Forest Plan, Appendix E, p. E-3). The Rocky Mountain elk is identified as a Species of Special Interest (SOSI) for the Forest. Habitats identified by Idaho Partners in Flight are presented (Table 3.3-4); each habitat class provides seasonal
Crooked River Vegetation Management Project 3-26
3.3 - Wildlife Resource
habitat for priority bird species identified for west-central Idaho and migratory landbirds that likely occur on the Council Ranger District.
Scope of the Analysis Wildlife resources were analyzed at the Action Area, Project Area, and Activity Areas, depending on the species considered and the scale of effects. The Action Area was identified as a larger area affected directly, or indirectly, by the proposed federal action; this is not just the immediate project area. For the wildlife analyses, the Action Area is described by the combination of the Bear, Wildhorse River, and Hornet Creek 5th Hydrologic Unit (HU) watersheds, as a portion of the Brownlee ESA Section 7 Consultation Watershed. These three 5th HUs were combined as the Wildlife analysis Action Area, because the eastern boundary of the Project Area coincides with the eastern boundary of the Wildhorse River watershed. In order to appropriately consider project effects to wildlife habitats outside, but adjacent to, the Project Area, the Hornet Creek watershed was included in the wildlife analysis Action Area. Project effects on federally-listed Threatened, Endangered, Proposed, Candidate, and Sensitive (TEPCS) wildlife species at the Action Area and Project Area levels are included in the Biological Assessment, Biological Evaluation, and the Wildlife Specialist Report, located in the Project Record. The wildlife analyses considered the effects to habitats and species over temporary (<3 years), short (3-15 years), and long-term (>15 years) time frames. The Project Area (approximately 7,490 acres) is the land where proposed agency management activities would occur. Within the Project Area, the units designated for silvicultural treatments (approximately 3,710 acres), followed by underburns in those units, and the burn blocks in grasslands identified for prescribed fire (approximately 1,780 acres) are sometimes referred to as Activity Areas. No treatment would occur on approximately 2,000 acres within the Project Area. Project effects to wildlife species were evaluated, based on modeling of changes to species source habitats, along with a qualitative analysis of effects to species habitat components. The source habitat model was based on Potential Vegetation Groups (PVGs), stand structure, and canopy closure that are identified in the Forest Plan viability analysis and refined by information developed for the ongoing analysis for the Payette National Forest Wildlife Conservation Strategy (Federal Register, Vol. 72, Bi 178, September 14, 2007, pp. 52540-52542). Source habitat models are best applied at the mid-scale, identified as the 5th HU Watershed level.
Affected Environment
Background for Current Condition The description of current conditions for wildlife involves identification of habitat requirements (source habitats) for each species, availability of those habitats {based on a Geographical Information System (GIS) analysis of Potential Vegetation Groups (PVGs)}, and probability of occurrence for each wildlife species analyzed. Source habitat is defined by those characteristics of macro vegetation that contribute to stationary or positive wildlife species population growth. Forested and non-forested vegetative and structural components of wildlife habitats in the Crooked River project area are described in the Forest Vegetation Resource section of this chapter. Current condition descriptions also are tiered to the Final Environmental Impact Statement (FEIS, Volumes 1-3; USDA Forest Service 2003a) that was prepared for the Forest Plan. The wildlife species analyzed for this EA are presented in Table 3.3-1, including habitat identified by PVG, probability of wildlife species occurrence in the Project Area, and notations of current habitat availability for each species. Source habitats are based on species accounts from Wisdom et al. (2000), NatureServe®, the Idaho Conservation Data Center (ICDC), the Forest Service FAUNA database, cited scientific literature, and personal communications with species specialists. Detailed species analyses, including habitat maps and PVG tabular data, are located in the Wildlife Specialist Report in the Project Record.
Summary of Environmental Effects – Direct, Indirect, and Cumulative Effects Effects of agency management actions vary widely, depending on the wildlife species concerned and the specific habitat components involved. This project includes design features that favor improvements to NIDGS and WHWO habitat, which, in general, leads to forested stands dominated by large-diameter
Crooked River Vegetation Management Project 3-27
3.3 - Wildlife Resource
Crooked River Vegetation Management Project 3-28
ponderosa pine, Douglas-fir, and Grand fir in a more open distribution, with appropriate canopy closures, and mostly a grass, forb, and open-shrub understory. Within northern goshawk NOGO nesting territories, forested habitat would be manipulated to provide habitat components that support NOGO prey species and provide habitat that is maintained by a characteristic fire regime. Most wildlife species would benefit from the proposed silvicultural and prescribed fire management, while some other species may lose specific habitat components in the temporary or short-term time frames, but benefit from the habitat changes in the long-term (Table 3.3-3). In general, for all of the species discussed in this section, Alternatives B and C have almost identical effects to source habitats. The differences in the two alternatives include a 380-acre reduction in thinning and burning and a reduction in the mileage of roads decommissioned and no new road construction (See the comparison of Alternatives in Chapter 2). The direct, indirect, and cumulative effects of these differences in treatment acreages and miles of various road management strategies are probably not measurable, but a qualitative analysis is presented for each alternative.
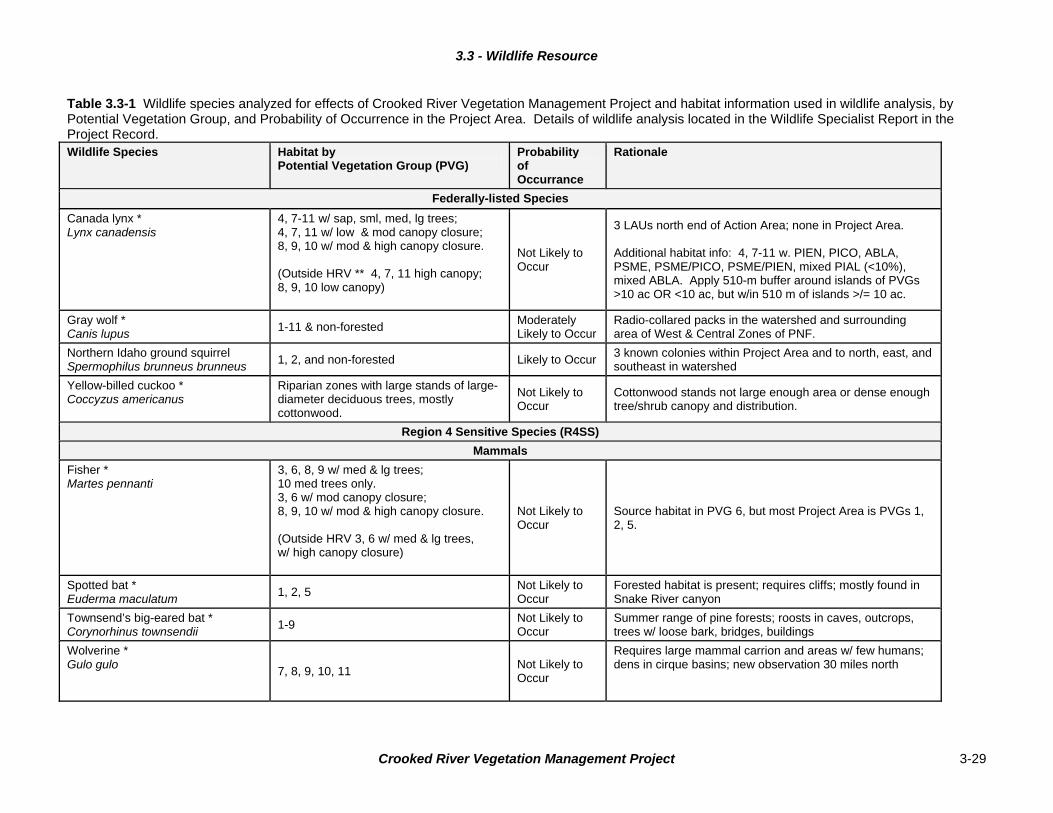
3.3 - Wildlife Resource
Table 3.3-1 Wildlife species analyzed for effects of Crooked River Vegetation Management Project and habitat information used in wildlife analysis, by Potential Vegetation Group, and Probability of Occurrence in the Project Area. Details of wildlife analysis located in the Wildlife Specialist Report in the Project Record. Wildlife Species Habitat by
Potential Vegetation Group (PVG) Probability of Occurrance
Rationale
Federally-listed Species
Canada lynx * Lynx canadensis
4, 7-11 w/ sap, sml, med, lg trees; 4, 7, 11 w/ low & mod canopy closure; 8, 9, 10 w/ mod & high canopy closure. (Outside HRV ** 4, 7, 11 high canopy; 8, 9, 10 low canopy)
Not Likely to Occur
3 LAUs north end of Action Area; none in Project Area. Additional habitat info: 4, 7-11 w. PIEN, PICO, ABLA, PSME, PSME/PICO, PSME/PIEN, mixed PIAL (<10%), mixed ABLA. Apply 510-m buffer around islands of PVGs >10 ac OR <10 ac, but w/in 510 m of islands >/= 10 ac.
Gray wolf * Canis lupus
1-11 & non-forested Moderately Likely to Occur
Radio-collared packs in the watershed and surrounding area of West & Central Zones of PNF.
Northern Idaho ground squirrel Spermophilus brunneus brunneus
1, 2, and non-forested Likely to Occur 3 known colonies within Project Area and to north, east, and southeast in watershed
Yellow-billed cuckoo * Coccyzus americanus
Riparian zones with large stands of large-diameter deciduous trees, mostly cottonwood.
Not Likely to Occur
Cottonwood stands not large enough area or dense enough tree/shrub canopy and distribution.
Region 4 Sensitive Species (R4SS)
Mammals
Fisher * Martes pennanti
3, 6, 8, 9 w/ med & lg trees; 10 med trees only. 3, 6 w/ mod canopy closure; 8, 9, 10 w/ mod & high canopy closure. (Outside HRV 3, 6 w/ med & lg trees, w/ high canopy closure)
Not Likely to Occur
Source habitat in PVG 6, but most Project Area is PVGs 1, 2, 5.
Spotted bat * Euderma maculatum
1, 2, 5 Not Likely to Occur
Forested habitat is present; requires cliffs; mostly found in Snake River canyon
Townsend’s big-eared bat * Corynorhinus townsendii
1-9 Not Likely to Occur
Summer range of pine forests; roosts in caves, outcrops, trees w/ loose bark, bridges, buildings
Wolverine * Gulo gulo
7, 8, 9, 10, 11 Not Likely to Occur
Requires large mammal carrion and areas w/ few humans; dens in cirque basins; new observation 30 miles north
Crooked River Vegetation Management Project 3-29
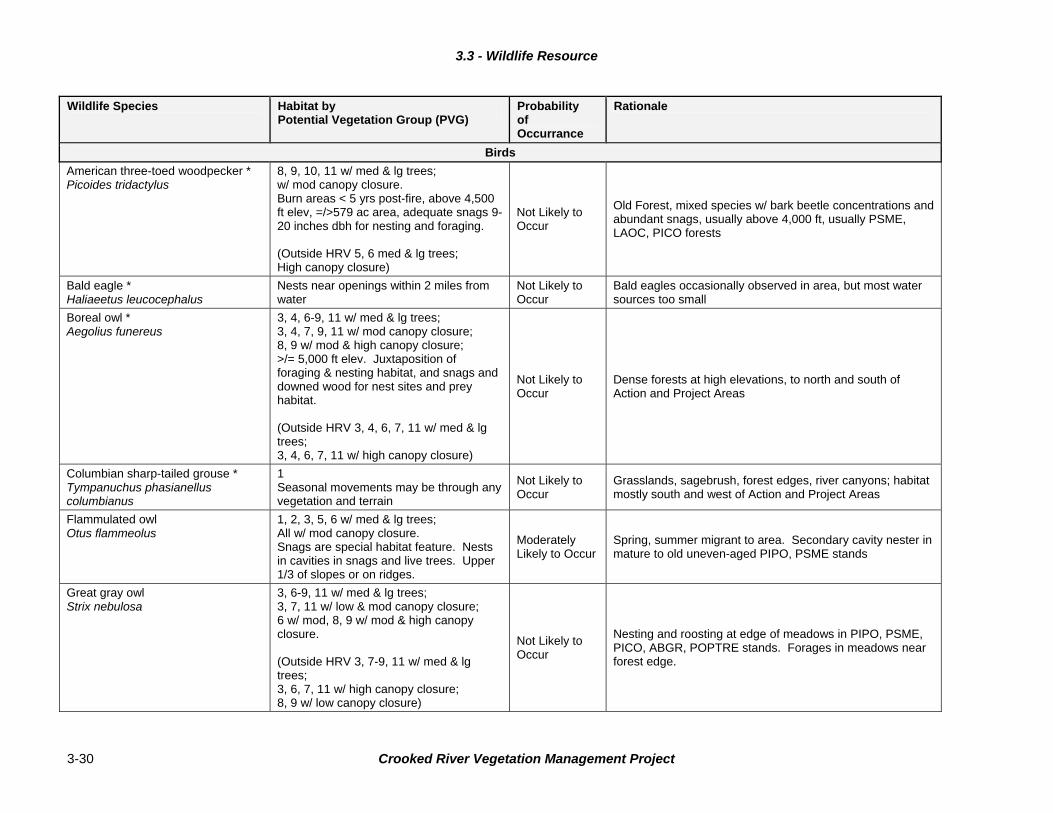
3.3 - Wildlife Resource
Wildlife Species Habitat by Probability Rationale Potential Vegetation Group (PVG) of
Occurrance
Birds
American three-toed woodpecker * Picoides tridactylus
8, 9, 10, 11 w/ med & lg trees; w/ mod canopy closure. Burn areas < 5 yrs post-fire, above 4,500 ft elev, =/>579 ac area, adequate snags 9-20 inches dbh for nesting and foraging. (Outside HRV 5, 6 med & lg trees; High canopy closure)
Not Likely to Occur
Old Forest, mixed species w/ bark beetle concentrations and abundant snags, usually above 4,000 ft, usually PSME, LAOC, PICO forests
Bald eagle * Haliaeetus leucocephalus
Nests near openings within 2 miles from water
Not Likely to Occur
Bald eagles occasionally observed in area, but most water sources too small
Boreal owl * Aegolius funereus
3, 4, 6-9, 11 w/ med & lg trees; 3, 4, 7, 9, 11 w/ mod canopy closure; 8, 9 w/ mod & high canopy closure; >/= 5,000 ft elev. Juxtaposition of foraging & nesting habitat, and snags and downed wood for nest sites and prey habitat. (Outside HRV 3, 4, 6, 7, 11 w/ med & lg trees; 3, 4, 6, 7, 11 w/ high canopy closure)
Not Likely to Occur
Dense forests at high elevations, to north and south of Action and Project Areas
Columbian sharp-tailed grouse * Tympanuchus phasianellus columbianus
1 Seasonal movements may be through any vegetation and terrain
Not Likely to Occur
Grasslands, sagebrush, forest edges, river canyons; habitat mostly south and west of Action and Project Areas
Flammulated owl Otus flammeolus
1, 2, 3, 5, 6 w/ med & lg trees; All w/ mod canopy closure. Snags are special habitat feature. Nests in cavities in snags and live trees. Upper 1/3 of slopes or on ridges.
Moderately Likely to Occur
Spring, summer migrant to area. Secondary cavity nester in mature to old uneven-aged PIPO, PSME stands
Great gray owl Strix nebulosa
3, 6-9, 11 w/ med & lg trees; 3, 7, 11 w/ low & mod canopy closure; 6 w/ mod, 8, 9 w/ mod & high canopy closure. (Outside HRV 3, 7-9, 11 w/ med & lg trees; 3, 6, 7, 11 w/ high canopy closure; 8, 9 w/ low canopy closure)
Not Likely to Occur
Nesting and roosting at edge of meadows in PIPO, PSME, PICO, ABGR, POPTRE stands. Forages in meadows near forest edge.
Crooked River Vegetation Management Project 3-30
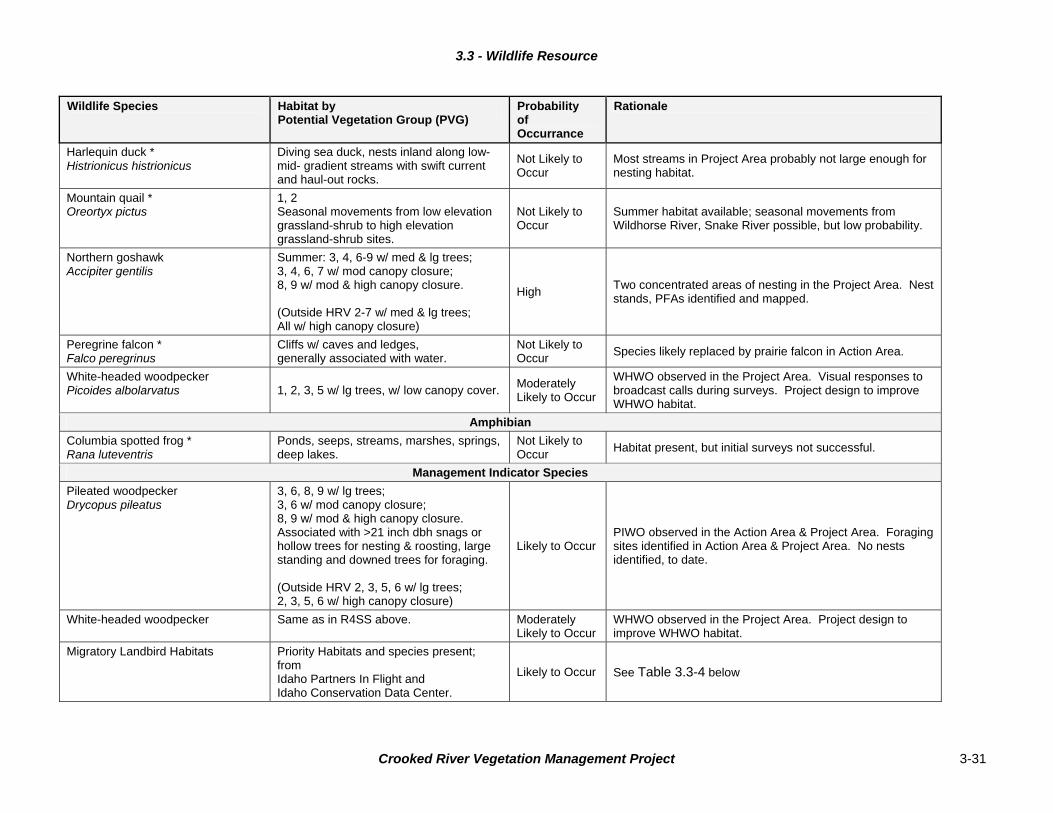
3.3 - Wildlife Resource
Wildlife Species Habitat by Probability Rationale Potential Vegetation Group (PVG) of
Occurrance
Harlequin duck * Histrionicus histrionicus
Diving sea duck, nests inland along low- mid- gradient streams with swift current and haul-out rocks.
Not Likely to Occur
Most streams in Project Area probably not large enough for nesting habitat.
Mountain quail * Oreortyx pictus
1, 2 Seasonal movements from low elevation grassland-shrub to high elevation grassland-shrub sites.
Not Likely to Occur
Summer habitat available; seasonal movements from Wildhorse River, Snake River possible, but low probability.
Northern goshawk Accipiter gentilis
Summer: 3, 4, 6-9 w/ med & lg trees; 3, 4, 6, 7 w/ mod canopy closure; 8, 9 w/ mod & high canopy closure. (Outside HRV 2-7 w/ med & lg trees; All w/ high canopy closure)
High Two concentrated areas of nesting in the Project Area. Nest stands, PFAs identified and mapped.
Peregrine falcon * Falco peregrinus
Cliffs w/ caves and ledges, generally associated with water.
Not Likely to Occur
Species likely replaced by prairie falcon in Action Area.
White-headed woodpecker Picoides albolarvatus 1, 2, 3, 5 w/ lg trees, w/ low canopy cover.
Moderately Likely to Occur
WHWO observed in the Project Area. Visual responses to broadcast calls during surveys. Project design to improve WHWO habitat.
Amphibian
Columbia spotted frog * Rana luteventris
Ponds, seeps, streams, marshes, springs, deep lakes.
Not Likely to Occur
Habitat present, but initial surveys not successful.
Management Indicator Species
Pileated woodpecker Drycopus pileatus
3, 6, 8, 9 w/ lg trees; 3, 6 w/ mod canopy closure; 8, 9 w/ mod & high canopy closure. Associated with >21 inch dbh snags or hollow trees for nesting & roosting, large standing and downed trees for foraging. (Outside HRV 2, 3, 5, 6 w/ lg trees; 2, 3, 5, 6 w/ high canopy closure)
Likely to Occur PIWO observed in the Action Area & Project Area. Foraging sites identified in Action Area & Project Area. No nests identified, to date.
White-headed woodpecker
Same as in R4SS above.
Moderately Likely to Occur
WHWO observed in the Project Area. Project design to improve WHWO habitat.
Migratory Landbird Habitats Priority Habitats and species present; from Idaho Partners In Flight and Idaho Conservation Data Center.
Likely to Occur See Table 3.3-4 below
Crooked River Vegetation Management Project 3-31
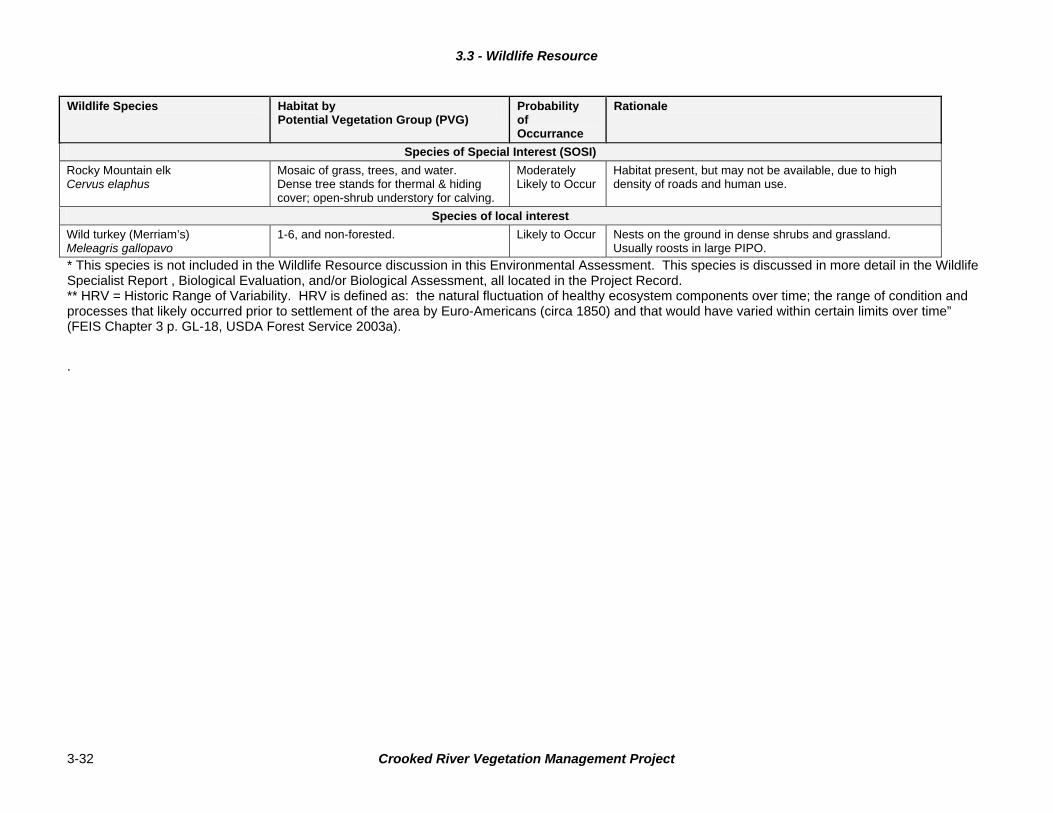
3.3 - Wildlife Resource
Crooked River Vegetation Management Project 3-32
Wildlife Species Habitat by Potential Vegetation Group (PVG)
Probability of Occurrance
Rationale
Species of Special Interest (SOSI)
Rocky Mountain elk Cervus elaphus
Mosaic of grass, trees, and water. Dense tree stands for thermal & hiding cover; open-shrub understory for calving.
Moderately Likely to Occur
Habitat present, but may not be available, due to high density of roads and human use.
Species of local interest
Wild turkey (Merriam’s) Meleagris gallopavo
1-6, and non-forested. Likely to Occur Nests on the ground in dense shrubs and grassland. Usually roosts in large PIPO.
* This species is not included in the Wildlife Resource discussion in this Environmental Assessment. This species is discussed in more detail in the Wildlife Specialist Report , Biological Evaluation, and/or Biological Assessment, all located in the Project Record. ** HRV = Historic Range of Variability. HRV is defined as: the natural fluctuation of healthy ecosystem components over time; the range of condition and processes that likely occurred prior to settlement of the area by Euro-Americans (circa 1850) and that would have varied within certain limits over time” (FEIS Chapter 3 p. GL-18, USDA Forest Service 2003a). .
3.3 Wildlife Resource
Federally-listed Wildlife Species Gray wolf Current Condition Gray wolves were analyzed at a scale that encompasses the West and Central Zones of the Forest, due to the large home ranges and dynamic population characteristics of the species. Wolves are listed under the ESA as an Experimental / Non-Essential Population in the portion of Idaho south of Interstate 90. Wolves in Idaho are managed under the Northern Rocky Mountains Wolf Recovery Plan (USDI Fish and Wildlife Service 1987), by IDFG through an interagency agreement with FWS. On 06 Mar 2009, the Secretary of the Interior affirmed the decision by the FWS, “to remove the gray wolf from the list of threatened and endangered species in the Northern Rocky Mountains”, including the entire state of Idaho. The delisting rules will be published in the Federal Register; delisting would become effective 30 days after publication. Fitting this time frame, wolves could be delisted by the middle of April 2009 (Nadeau 2009). Wolves use whatever habitats that support their prey species, which is most commonly large mammal species (deer, elk, moose, and, opportunistically, livestock). The mosaic of forested and non-forested habitats across the West and Central zones of the PNF provides excellent habitat for big game species and wolves. All PVGs (1-11, and non-forested lands) combined provide various vegetative and structural components of wolf habitat, based on prey species availability and appropriate locations for denning and rendezvous sites. All of the Action Area, as a sub-set of the Southern Idaho gray wolf population, is considered occupied wolf habitat by IDFG, Forest Service, the Nez Perce Tribe, and the FWS (S. Nadeau, IDFG, personal communication, July 2008). Four radio-monitored packs (Cuddy Mountain Pack, Lick Creek Pack, Oxbow Pack, and Blue Bunch Pack) either use the Action Area and Project Area, or have the potential of moving into the area, depending on other pack distributions and availability of large mammal prey. Direct and Indirect Effects to the Gray Wolf Alternative A – No Action The proposed mechanical thinning, prescribed burning, and road management would not occur in the foreseeable future. Alternatives B and C Both Action Alternatives would have the same effects on wolves, mostly due to the project effects on prey species and their habitats (See the discussion for the Rocky Mountain elk, below). Temporary direct effects to wolves would include disruption of wolf activity at den and rendezvous sites and possible displacement from the area by project activities. This effect on wolf activity was noted by direct observation and radio telemetry by the wildlife biologist in multiple study areas in Idaho, Montana, and Washington. Indirectly, displacement of prey species could lead to displacement of wolves. In general, returning the area to an historical wildfire regime, which maintains a mosaic of habitats, would likely be more advantageous for both ungulate prey and wolves. All proposed project activities, including tree harvest, log haul, prescribed burning, road construction and decommissioning, and administrative activities would occur in the temporary time frame and would be eliminated or reduced to acceptable levels for wolves, by implementing required Forest Plan standards and guidelines and by applying mitigation measures for other species, such as NIDGS and elk. Cumulative Effects Short-term and long-term effects of implementing the project may be beneficial to wolves. Opening the distribution of trees in many of the stands in the Project Area would lower habitat security for ungulate prey, thereby improving hunting opportunities for wolves. These benefits would be small relative to large area encompassed by the East and Central Zones of the Payette National Forest. Effects Determination Considering the information above, it was determined that the proposed project may affect, but would not likely jeopardize the continued existence of, the gray wolf population in Southern Idaho.
Crooked River Vegetation Management Project 3-33
3.3 Wildlife Resource
Northern Idaho Ground Squirrel Current Condition NIDGS, while generally managed by identified colonies and metapopulations, also were analyzed at the Action, Project, and Activity Area levels, with consideration for new locations of individuals, based on field observations by wildlife staff, and including habitat improvement opportunities. The NIDGS is listed under the ESA as a Threatened species. The Forest Service is an active cooperator with NIDGS recovery efforts, assisting with the planning, writing, and implementation of the NIDGS Recovery Plan (USDI Fish and Wildlife Service 2003). The Recovery Plan identifies habitat requirements and management goals for the species. In 2007, the NIDGS Technical Team mapped Potential NIDGS habitat, using LandSat imagery, combined with data from vegetation sampling. This map illustrates that most of the non-forested areas in the Action Area are potential habitat, with no restriction on elevation. In the past 4 years, NIDGS have been documented at several new sites, to elevations above 7,400 feet, and in different habitats. NIDGS will use forested stands, especially those with a more open canopy and a wider distribution of trees. NIDGS will disperse into disturbed sites, including areas that have been manipulated by tree thinning (to a level of 20-25% canopy closure), followed by underburning. This thinning and burning manipulation of forested sites is a NIDGS habitat improvement technique, which is accepted by the FWS, IDFG, and Forest Service. Several NIDGS sites in the Action Area have been treated with this improvement technique. A positive response from NIDGS occurred on these sites, indicated by an influx of NIDGS to these thinned and burned areas. General movements of NIDGS into these sites have been noted up to several years following treatments (M. Henon and B. Rautsaw, USFS, personal communications, March 2009). NIDGS activities in these treated sites included feeding on grasses and forbs, use of woody debris for hiding cover, and digging of seasonal burrows (Council Ranger District files). The Recovery Plan and the PNF Habitat Restoration Plan for NIDGS (2000) identify colonies and specific habitat management activities needed to support NIDGS recovery on the Forest. Thirty NIDGS colonies occur in the Action Area, within a 15-mile radius of the Project Area. 2008 population estimates for these colonies range from Mill Creek at 0 animals, to Squirrel Manor at 195 animals (Evans Mack and Bond 2008). A 17-acre portion of the 81-acre Cottonwood Corrals NIDGS colony (2008 population estimate = 15) lies east of the Project Area, adjacent to harvest Units 41, 120, and 121, and associated prescribed burn blocks. The 30-acre Halfway NIDGS colony (2008 population estimate = 10) occurs on private land in the Dick Ross Creek area, just east of Crooked River, and lies completely inside the Project Area, adjacent to harvest Units 59, 66, 75, 208, 210, and associated prescribed burn blocks. A 14-acre portion of the 207-acre Rocky Comfort Flat colony (2008 population estimate = 60) is adjacent to the northwest corner of the Project Area. Over the past decade, NIDGS dispersal occurred from the Cottonwood Corrals and Summit colonies into adjacent forested stands that had been treated with tree thinning and prescribed burns, to mimic vegetative and structural conditions of other occupied NIDGS sites in the area (M. Henon and B. Rautsaw, USFS, personal communications, March 2009). Additional detail on NIDGS population characteristics is available in the Wildlife Resources Specialist Report on file in the Project Record. Direct and Indirect Effects to NIDGS Alternative A – No Action The No Action Alternative would leave habitat conditions near NIDGS colonies at current stand densities and species composition. If the proposed management activities did not occur, the opportunity to improved NIDGS habitat would not occur in the foreseeable future. Failure to implement this project would impede the pace of achieving recovery, increase the risk of losing a colony (due to a long-term reduction of habitat quality and availability), and raise the long-term cost of recovery (by shifting a project that supports NIDGS recovery to some other location and to some unknown time in the future). Allowing further tree encroachment into NIDGS colonies (B. Rautsaw, USFS personal communication, March 2009), that occur in naturally open sites in the Project Area, would continue the current trend of decreasing quality and overall availability of NIDGS habitat in the Action Area, an area of nearly 184,000 acres, where most of the known NIDGS colonies occur (USDI Fish and Wildlife Service 2003).
Crooked River Vegetation Management Project 3-34
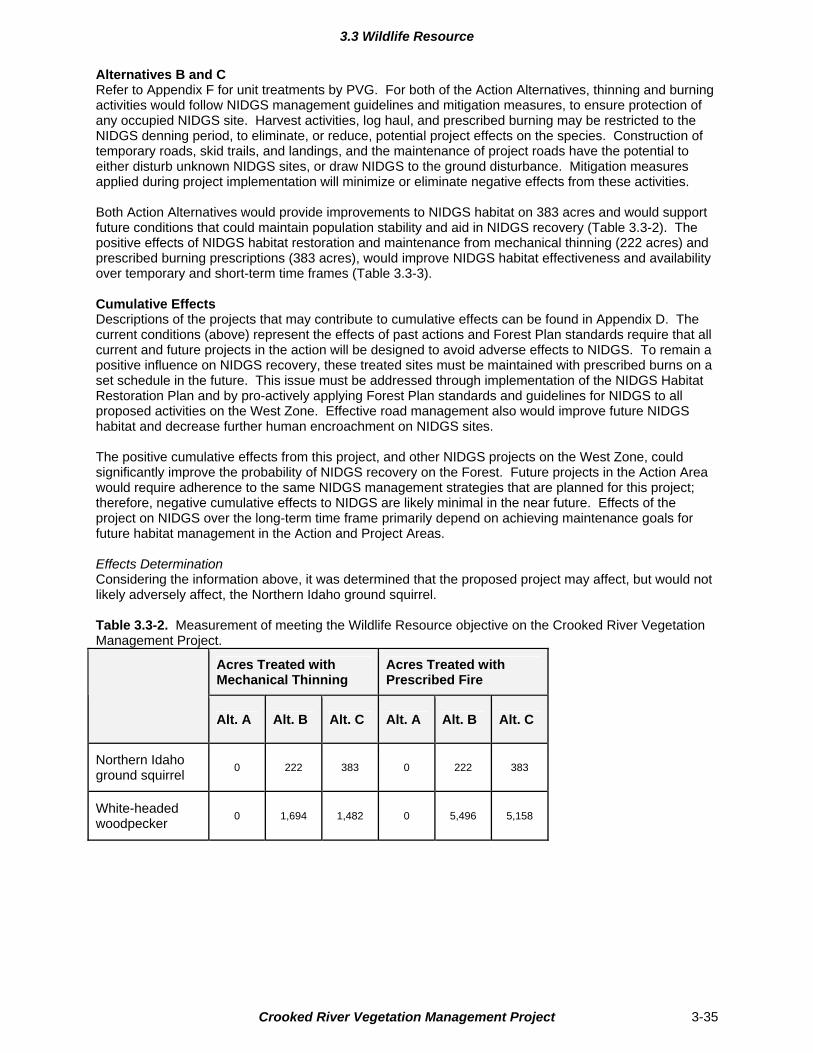
3.3 Wildlife Resource
Alternatives B and C Refer to Appendix F for unit treatments by PVG. For both of the Action Alternatives, thinning and burning activities would follow NIDGS management guidelines and mitigation measures, to ensure protection of any occupied NIDGS site. Harvest activities, log haul, and prescribed burning may be restricted to the NIDGS denning period, to eliminate, or reduce, potential project effects on the species. Construction of temporary roads, skid trails, and landings, and the maintenance of project roads have the potential to either disturb unknown NIDGS sites, or draw NIDGS to the ground disturbance. Mitigation measures applied during project implementation will minimize or eliminate negative effects from these activities. Both Action Alternatives would provide improvements to NIDGS habitat on 383 acres and would support future conditions that could maintain population stability and aid in NIDGS recovery (Table 3.3-2). The positive effects of NIDGS habitat restoration and maintenance from mechanical thinning (222 acres) and prescribed burning prescriptions (383 acres), would improve NIDGS habitat effectiveness and availability over temporary and short-term time frames (Table 3.3-3). Cumulative Effects Descriptions of the projects that may contribute to cumulative effects can be found in Appendix D. The current conditions (above) represent the effects of past actions and Forest Plan standards require that all current and future projects in the action will be designed to avoid adverse effects to NIDGS. To remain a positive influence on NIDGS recovery, these treated sites must be maintained with prescribed burns on a set schedule in the future. This issue must be addressed through implementation of the NIDGS Habitat Restoration Plan and by pro-actively applying Forest Plan standards and guidelines for NIDGS to all proposed activities on the West Zone. Effective road management also would improve future NIDGS habitat and decrease further human encroachment on NIDGS sites. The positive cumulative effects from this project, and other NIDGS projects on the West Zone, could significantly improve the probability of NIDGS recovery on the Forest. Future projects in the Action Area would require adherence to the same NIDGS management strategies that are planned for this project; therefore, negative cumulative effects to NIDGS are likely minimal in the near future. Effects of the project on NIDGS over the long-term time frame primarily depend on achieving maintenance goals for future habitat management in the Action and Project Areas. Effects Determination Considering the information above, it was determined that the proposed project may affect, but would not likely adversely affect, the Northern Idaho ground squirrel. Table 3.3-2. Measurement of meeting the Wildlife Resource objective on the Crooked River Vegetation Management Project.
Acres Treated with Mechanical Thinning
Acres Treated with Prescribed Fire
Alt. A Alt. B Alt. C Alt. A Alt. B Alt. C
Northern Idaho ground squirrel
0 222 383 0 222 383
White-headed woodpecker
0 1,694 1,482 0 5,496 5,158
Crooked River Vegetation Management Project 3-35
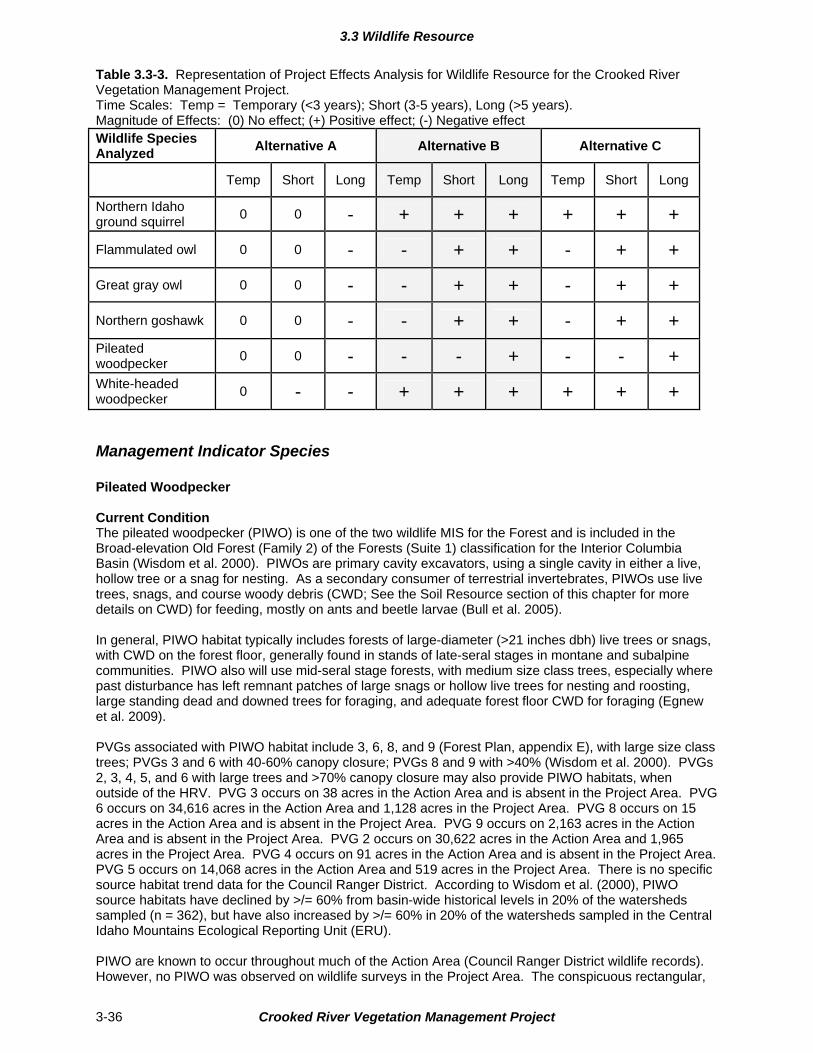
3.3 Wildlife Resource
Table 3.3-3. Representation of Project Effects Analysis for Wildlife Resource for the Crooked River Vegetation Management Project. Time Scales: Temp = Temporary (<3 years); Short (3-5 years), Long (>5 years). Magnitude of Effects: (0) No effect; (+) Positive effect; (-) Negative effect Wildlife Species Analyzed
Alternative A Alternative B Alternative C
Temp Short Long Temp Short Long Temp Short Long
Northern Idaho ground squirrel
0 0 - + + + + + +
Flammulated owl 0 0 - - + + - + +
Great gray owl 0 0 - - + + - + +
Northern goshawk 0 0 - - + + - + + Pileated woodpecker
0 0 - - - + - - + White-headed woodpecker
0 - - + + + + + +
Management Indicator Species Pileated Woodpecker Current Condition The pileated woodpecker (PIWO) is one of the two wildlife MIS for the Forest and is included in the Broad-elevation Old Forest (Family 2) of the Forests (Suite 1) classification for the Interior Columbia Basin (Wisdom et al. 2000). PIWOs are primary cavity excavators, using a single cavity in either a live, hollow tree or a snag for nesting. As a secondary consumer of terrestrial invertebrates, PIWOs use live trees, snags, and course woody debris (CWD; See the Soil Resource section of this chapter for more details on CWD) for feeding, mostly on ants and beetle larvae (Bull et al. 2005). In general, PIWO habitat typically includes forests of large-diameter (>21 inches dbh) live trees or snags, with CWD on the forest floor, generally found in stands of late-seral stages in montane and subalpine communities. PIWO also will use mid-seral stage forests, with medium size class trees, especially where past disturbance has left remnant patches of large snags or hollow live trees for nesting and roosting, large standing dead and downed trees for foraging, and adequate forest floor CWD for foraging (Egnew et al. 2009). PVGs associated with PIWO habitat include 3, 6, 8, and 9 (Forest Plan, appendix E), with large size class trees; PVGs 3 and 6 with 40-60% canopy closure; PVGs 8 and 9 with >40% (Wisdom et al. 2000). PVGs 2, 3, 4, 5, and 6 with large trees and >70% canopy closure may also provide PIWO habitats, when outside of the HRV. PVG 3 occurs on 38 acres in the Action Area and is absent in the Project Area. PVG 6 occurs on 34,616 acres in the Action Area and 1,128 acres in the Project Area. PVG 8 occurs on 15 acres in the Action Area and is absent in the Project Area. PVG 9 occurs on 2,163 acres in the Action Area and is absent in the Project Area. PVG 2 occurs on 30,622 acres in the Action Area and 1,965 acres in the Project Area. PVG 4 occurs on 91 acres in the Action Area and is absent in the Project Area. PVG 5 occurs on 14,068 acres in the Action Area and 519 acres in the Project Area. There is no specific source habitat trend data for the Council Ranger District. According to Wisdom et al. (2000), PIWO source habitats have declined by >/= 60% from basin-wide historical levels in 20% of the watersheds sampled (n = 362), but have also increased by >/= 60% in 20% of the watersheds sampled in the Central Idaho Mountains Ecological Reporting Unit (ERU). PIWO are known to occur throughout much of the Action Area (Council Ranger District wildlife records). However, no PIWO was observed on wildlife surveys in the Project Area. The conspicuous rectangular,
Crooked River Vegetation Management Project 3-36
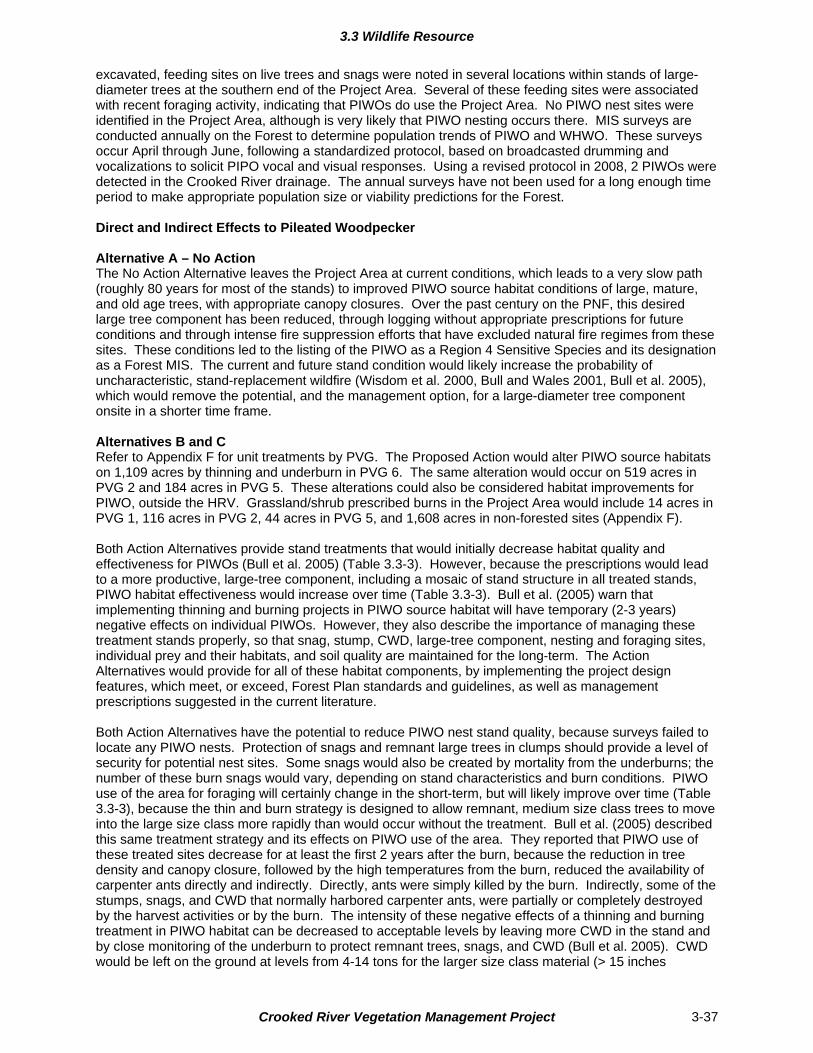
3.3 Wildlife Resource
excavated, feeding sites on live trees and snags were noted in several locations within stands of large-diameter trees at the southern end of the Project Area. Several of these feeding sites were associated with recent foraging activity, indicating that PIWOs do use the Project Area. No PIWO nest sites were identified in the Project Area, although is very likely that PIWO nesting occurs there. MIS surveys are conducted annually on the Forest to determine population trends of PIWO and WHWO. These surveys occur April through June, following a standardized protocol, based on broadcasted drumming and vocalizations to solicit PIPO vocal and visual responses. Using a revised protocol in 2008, 2 PIWOs were detected in the Crooked River drainage. The annual surveys have not been used for a long enough time period to make appropriate population size or viability predictions for the Forest. Direct and Indirect Effects to Pileated Woodpecker Alternative A – No Action The No Action Alternative leaves the Project Area at current conditions, which leads to a very slow path (roughly 80 years for most of the stands) to improved PIWO source habitat conditions of large, mature, and old age trees, with appropriate canopy closures. Over the past century on the PNF, this desired large tree component has been reduced, through logging without appropriate prescriptions for future conditions and through intense fire suppression efforts that have excluded natural fire regimes from these sites. These conditions led to the listing of the PIWO as a Region 4 Sensitive Species and its designation as a Forest MIS. The current and future stand condition would likely increase the probability of uncharacteristic, stand-replacement wildfire (Wisdom et al. 2000, Bull and Wales 2001, Bull et al. 2005), which would remove the potential, and the management option, for a large-diameter tree component onsite in a shorter time frame. Alternatives B and C Refer to Appendix F for unit treatments by PVG. The Proposed Action would alter PIWO source habitats on 1,109 acres by thinning and underburn in PVG 6. The same alteration would occur on 519 acres in PVG 2 and 184 acres in PVG 5. These alterations could also be considered habitat improvements for PIWO, outside the HRV. Grassland/shrub prescribed burns in the Project Area would include 14 acres in PVG 1, 116 acres in PVG 2, 44 acres in PVG 5, and 1,608 acres in non-forested sites (Appendix F). Both Action Alternatives provide stand treatments that would initially decrease habitat quality and effectiveness for PIWOs (Bull et al. 2005) (Table 3.3-3). However, because the prescriptions would lead to a more productive, large-tree component, including a mosaic of stand structure in all treated stands, PIWO habitat effectiveness would increase over time (Table 3.3-3). Bull et al. (2005) warn that implementing thinning and burning projects in PIWO source habitat will have temporary (2-3 years) negative effects on individual PIWOs. However, they also describe the importance of managing these treatment stands properly, so that snag, stump, CWD, large-tree component, nesting and foraging sites, individual prey and their habitats, and soil quality are maintained for the long-term. The Action Alternatives would provide for all of these habitat components, by implementing the project design features, which meet, or exceed, Forest Plan standards and guidelines, as well as management prescriptions suggested in the current literature. Both Action Alternatives have the potential to reduce PIWO nest stand quality, because surveys failed to locate any PIWO nests. Protection of snags and remnant large trees in clumps should provide a level of security for potential nest sites. Some snags would also be created by mortality from the underburns; the number of these burn snags would vary, depending on stand characteristics and burn conditions. PIWO use of the area for foraging will certainly change in the short-term, but will likely improve over time (Table 3.3-3), because the thin and burn strategy is designed to allow remnant, medium size class trees to move into the large size class more rapidly than would occur without the treatment. Bull et al. (2005) described this same treatment strategy and its effects on PIWO use of the area. They reported that PIWO use of these treated sites decrease for at least the first 2 years after the burn, because the reduction in tree density and canopy closure, followed by the high temperatures from the burn, reduced the availability of carpenter ants directly and indirectly. Directly, ants were simply killed by the burn. Indirectly, some of the stumps, snags, and CWD that normally harbored carpenter ants, were partially or completely destroyed by the harvest activities or by the burn. The intensity of these negative effects of a thinning and burning treatment in PIWO habitat can be decreased to acceptable levels by leaving more CWD in the stand and by close monitoring of the underburn to protect remnant trees, snags, and CWD (Bull et al. 2005). CWD would be left on the ground at levels from 4-14 tons for the larger size class material (> 15 inches
Crooked River Vegetation Management Project 3-37
3.3 Wildlife Resource
diameter), depending on the PVG: >75% in the large diameter class for PVGs 2 and 5; >65% in the large class for PVG 6, as noted in the Soils Resource section of this chapter. Bull et al. (2005) also discussed the long-term positive effects of this sort of stand treatment, which leads to larger trees faster than would occur if not treated, thereby creating two options for future stand management. Some snags would also be created by mortality from the underburns; the number of these burn snags would vary, depending on stand characteristics and burn conditions. The stands could be maintained at some stage of movement toward stands with a large tree component, but with an open understory achieved with maintenance burns. Or, another option would be to conduct the thinning and underburning, then let the stands trend toward the large tree component, without maintenance burns (see maintenance burn in Chapter 2); this scenario would allow the stands to fill in with understory species, creating a dense canopy of large diameter trees and variable understory of the more classic PIWO habitats. Alternative C would decrease the thin and underburn of PIWO habitat by roughly 26 acres; otherwise, the two Action Alternatives would have the same effect on PIWO habitat (Table 3.3-3). Cumulative Effects Descriptions of the projects that may contribute to cumulative effects can be found in Appendix D. The current conditions (above) represent the effects of past actions and Forest Plan standards require that all current and future projects in the action will be designed to not degrade PIWO population viability. When considered in conjunction with existing conditions and other reasonably foreseeable future actions, the cumulative effect of proposed activities on PIWO habitat are considered to be negative in the temporary and short term, but beneficial in the long term (see discussion above). The effects are not likely to be significant relative to the larger Action area and are not likely to degrade population viability. Effects Determination Considering the information above, it was determined that the proposed project may impact individual pileated woodpeckers, but will not likely cause a trend toward Federal listing or loss of viability to the population or species. White-headed Woodpecker Current Condition The white-headed woodpecker (WHWO) is one of the PNF MIS, is listed as a Region 4 Sensitive Species, and is included in the Low-elevation Old Forest (Family 1) classification for the Interior Columbia Basin (Wisdom et al. 2000). The WHWO is a primary consumer of conifer seeds (mostly pine) and a secondary consumer of terrestrial invertebrates (mostly beetle larvae). Key habitat components include large-diameter ponderosa pine stands, with sufficient numbers of live trees (>10 inches dbh), mostly for foraging and roosting, and large-diameter (>15 inches dbh) live trees and soft snags and stumps for nesting and foraging (Egnew et al. 2009). WHWO habitat is typically montane coniferous forest dominated by large-diameter ponderosa pine with a relatively open canopy and open understory. PVGs associated with WHWO habitat include 1, 2, 3, and 5 (Forest Plan, Appendix E), with large tree size and low canopy closure (10-39%), although WHWO are found most often in stands on the high end of the low canopy closure category (Egnew et al. 2009). PVG 1 occurs on 6,374 acres in the Action Area and 83 acres in the Project Area. PVGs 2, 3, and 5 occur as noted for PIWO. Nutt et al. (2007) suggested that PVGs 1, 2, 3, 5, and 6, in the large tree size class and low canopy closure condition, provide WHWO habitat under HRV on the Boise National Forest (BNF). Historically, in PVG 6, the large tree size class occurred on average 56% of the time (low end was 28%) and 0-20% of the large tree size class occurred in a low canopy closure. On the PNF, the habitat types that make up PVG 6 tend to be wetter, than on the BNF, hence, the conditions preferred by WHWO would occur even less frequently. PVG 6 occurs on 34,616 acres in the Action Area and 1,128 acres in the Project Area. There is no specific source habitat trend data for the Council Ranger District. According to Wisdom et al. (2000), WHWO source habitats have declined by >/= 60% from basin-wide historical levels in 40% of the watersheds sampled (n = 283), but have also increased by >/= 60% in roughly 30% of the watersheds sampled in the Central Idaho Mountains ERU.
Crooked River Vegetation Management Project 3-38
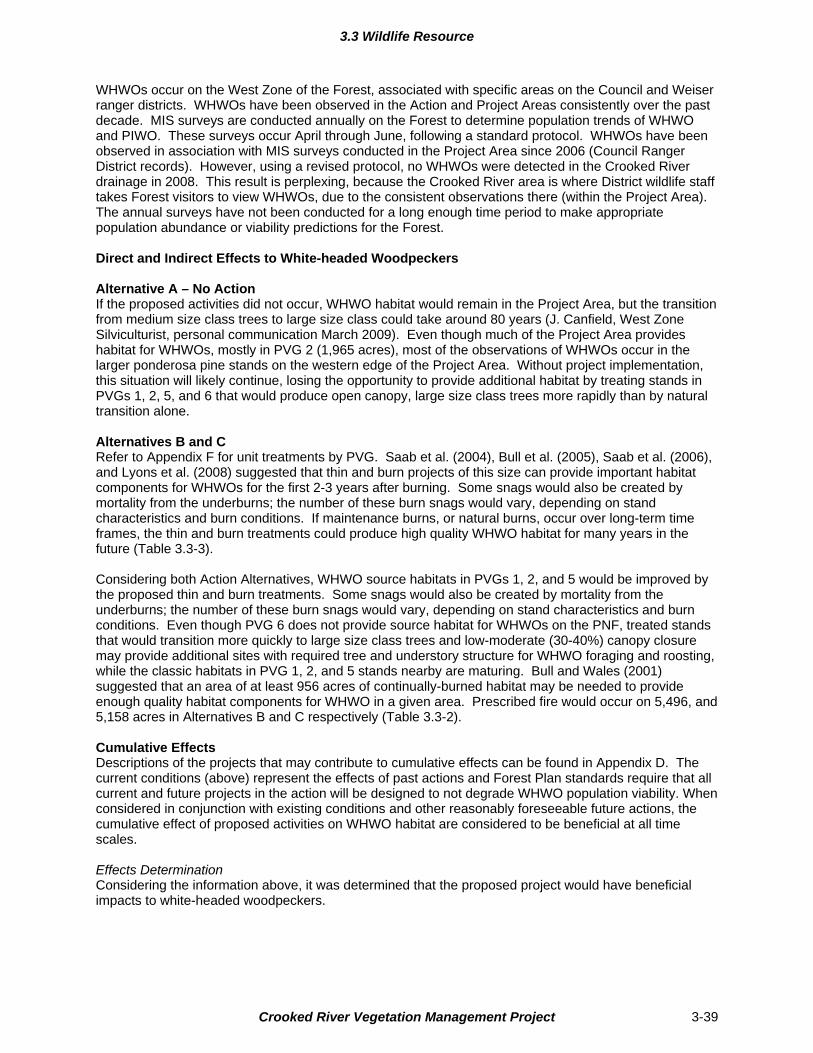
3.3 Wildlife Resource
WHWOs occur on the West Zone of the Forest, associated with specific areas on the Council and Weiser ranger districts. WHWOs have been observed in the Action and Project Areas consistently over the past decade. MIS surveys are conducted annually on the Forest to determine population trends of WHWO and PIWO. These surveys occur April through June, following a standard protocol. WHWOs have been observed in association with MIS surveys conducted in the Project Area since 2006 (Council Ranger District records). However, using a revised protocol, no WHWOs were detected in the Crooked River drainage in 2008. This result is perplexing, because the Crooked River area is where District wildlife staff takes Forest visitors to view WHWOs, due to the consistent observations there (within the Project Area). The annual surveys have not been conducted for a long enough time period to make appropriate population abundance or viability predictions for the Forest. Direct and Indirect Effects to White-headed Woodpeckers Alternative A – No Action If the proposed activities did not occur, WHWO habitat would remain in the Project Area, but the transition from medium size class trees to large size class could take around 80 years (J. Canfield, West Zone Silviculturist, personal communication March 2009). Even though much of the Project Area provides habitat for WHWOs, mostly in PVG 2 (1,965 acres), most of the observations of WHWOs occur in the larger ponderosa pine stands on the western edge of the Project Area. Without project implementation, this situation will likely continue, losing the opportunity to provide additional habitat by treating stands in PVGs 1, 2, 5, and 6 that would produce open canopy, large size class trees more rapidly than by natural transition alone. Alternatives B and C Refer to Appendix F for unit treatments by PVG. Saab et al. (2004), Bull et al. (2005), Saab et al. (2006), and Lyons et al. (2008) suggested that thin and burn projects of this size can provide important habitat components for WHWOs for the first 2-3 years after burning. Some snags would also be created by mortality from the underburns; the number of these burn snags would vary, depending on stand characteristics and burn conditions. If maintenance burns, or natural burns, occur over long-term time frames, the thin and burn treatments could produce high quality WHWO habitat for many years in the future (Table 3.3-3). Considering both Action Alternatives, WHWO source habitats in PVGs 1, 2, and 5 would be improved by the proposed thin and burn treatments. Some snags would also be created by mortality from the underburns; the number of these burn snags would vary, depending on stand characteristics and burn conditions. Even though PVG 6 does not provide source habitat for WHWOs on the PNF, treated stands that would transition more quickly to large size class trees and low-moderate (30-40%) canopy closure may provide additional sites with required tree and understory structure for WHWO foraging and roosting, while the classic habitats in PVG 1, 2, and 5 stands nearby are maturing. Bull and Wales (2001) suggested that an area of at least 956 acres of continually-burned habitat may be needed to provide enough quality habitat components for WHWO in a given area. Prescribed fire would occur on 5,496, and 5,158 acres in Alternatives B and C respectively (Table 3.3-2). Cumulative Effects Descriptions of the projects that may contribute to cumulative effects can be found in Appendix D. The current conditions (above) represent the effects of past actions and Forest Plan standards require that all current and future projects in the action will be designed to not degrade WHWO population viability. When considered in conjunction with existing conditions and other reasonably foreseeable future actions, the cumulative effect of proposed activities on WHWO habitat are considered to be beneficial at all time scales. Effects Determination Considering the information above, it was determined that the proposed project would have beneficial impacts to white-headed woodpeckers.
Crooked River Vegetation Management Project 3-39

3.3 Wildlife Resource
Region 4 Sensitive Species Only Sensitive Species that have a moderate to high probability of occurrence in the Project Area and/or are species of concern were included in this discussion. The WHWO discussion is not repeated in this section. Flammulated Owl Current Condition The flammulated owl (FLOW) is listed as a Region 4 Sensitive Species and is included in the Broad-elevation Old Forest (Family 2) classification for the Interior Columbia Basin (Wisdom et al. 2000). FLOWs are neo-tropical migrants, wintering in central Mexico, Guatemala, and El Salvador. They are obligate cavity nesters, using both natural cavities and old holes excavated by woodpeckers in large trees and snags. Source habitats include open, mature stands of montane forests at mid-elevation. These habitats include mature and old forest stands of open ponderosa pine and Douglas-fir. FLOWs also will use old forest with multi-layered canopies in aspen, cottonwood, and willow. They typically nest in open, mature, montane forests. Roosting and calling sites require dense stands, usually with scattered thickets of saplings and/or shrubs. Foraging sites are typically in grassland – forest edge habitat (Egnew et al. 2009). Source habitats are associated with PVGs 2, 3, 4, and 5 (Evans Mack and Bond 2007; Forest Plan, Appendix E), in the medium (12-19 inch dbh) and large (>/= 20 inches dbh) structural stages with canopy closures of 40-70% and 10-40%, respectively (Evans Mack and Bond 2007, Nutt and Hescock 2007). Acreages for these PVGs were presented above for other species. Source habitat for FLOWs has declined in Central Idaho Mountains ERU by 51% from historic levels (Wisdom et al. 2000). West Zone FLOW habitat includes stands with increasing tree densities (probably associated with wildfire suppression), as noted in general for the ERU (Wisdom et al. 2000). Overall, FLOW habitat has decreased range-wide, mostly due to habitat alteration associated with timber harvest of dense stands of large trees and a high road density that leads to loss of large snags to firewood cutting. There is no specific source habitat trend data for the Council Ranger District. According to Wisdom et al. (2000), FLOW source habitats have declined by >/= 60% from basin-wide historical levels in nearly 30% of the watersheds sampled (n = 351), but have also increased by >/= 60% in roughly 20% of the watersheds sampled in the Central Idaho Mountains ERU. Surveys for FLOWs were conducted on the PNF by IDFG in 1991 (Frederick and Moore 1991). Due to uncertainties of the status of FLOWs on the Forest, transects for FLOW surveys were re-established on the Forest in 2005. Transects included some areas surveyed in 1991, but were also expanded to areas across the entire Forest. Surveys were conducted by IDFG under a cooperative agreement with the PNF in 2005 and 2007. The highest numbers of birds were found at transects in Dukes Creek (11 birds in 1991 and 8 birds in 2005) at the west edge of the Weiser Ranger District, approximately 10 miles southwest of the Project Area. FLOWs have been documented on the Council Ranger District in several locations, from annual surveys conducted cooperatively by IDFG and the Forest in 1991, 2005, and 2007 (Evans Mack 2005, Evans Mack 2007). In 1991, 5 birds were documented in the Crooked River drainage; 2005 surveys located only 1 FLOW (Evans Mack 2005). 2007 surveys documented 11 birds on the Crooked River transect (Evans Mack and Bond 2007); in 2008, 4 Flows were detected (Bond 2008). Direct and Indirect Effects to Flammulated Owls Alternative A – No Action Not implementing the project would have both positive and negative effects on FLOW habitat. In the temporary and short-term time frames, if no habitat were altered, canopy closure and stand density would continue to slowly increase, which would support FLOWs. However, in the long-term, higher densities of stands and canopy closures would not favor FLOW nesting. The probability of uncharacteristic wildfires is likely higher with the No Action Alternative. Alternatives B and C Refer to Appendix F for unit treatments by PVG. Lowering the risk of stand-replacement fires and altering habitat to trend toward large-diameter live and snag ponderosa pine, as planned in both Action Alternatives may be more beneficial to FLOWs over a long-term time frame (Table 3.3-3). Some snags would also be created by mortality from the underburns; the number of these burn snags would vary,
Crooked River Vegetation Management Project 3-40

3.3 Wildlife Resource
depending on stand characteristics and burn conditions. Coincidentally, some of the forest management strategies applied for NOGO management may benefit FLOWs as well. Providing a more open stand, with larger size class trees would be beneficial, in general, if the canopy closure remains at appropriate levels and stands with thicker structure remain in close proximity. Opening the stand below 40% canopy closure would likely be detrimental to FLOW habitat in the temporary and short-term time frames. In both Action Alternatives, where FLOW survey transects occur, at least 40% canopy closure would be retained for FLOW habitat, in combinations of thicket-like, tree and shrub growth, adjacent to more open stands of large diameter trees. Cumulative Effects Descriptions of the projects that may contribute to cumulative effects can be found in Appendix D. The current conditions (above) represent the effects of past actions and Forest Plan standards require that all current and future projects in the action will be designed to not degrade FLOW population viability. When considered in conjunction with existing conditions and other reasonably foreseeable future actions, the cumulative effect of proposed activities on FLOW habitat would be temporarily, but beneficial in the short to long term (see discussion above). The effects are not likely to be significant relative to the larger Action area and are not likely to degrade population viability. Effects Determination Considering the information above, it was determined that the proposed project may impact individual flammulated owls, but will not likely cause a trend toward Federal listing or loss of viability to the population or species. Northern Goshawk Current Condition Northern goshawks (NOGO) were analyzed at Action and Project levels and also at territory, foraging area, and nest site levels, as required by interagency agreement and Forest Service Region 4 direction. The northern goshawk (NOGO) is listed as a Region 4 Sensitive Species and is included in the Broad-elevation Old Forest (Family 2) of the Forests (Suite 1) classification for the Interior Columbia Basin (Wisdom et al. 2000). NOGOs are a secondary and tertiary consumer of terrestrial herbivores and predators. These birds influence terrestrial vertebrate populations by predation and/or displacement. NOGO nests provide nesting habitat for other species, such as great-horned owls. Habitat requirements include low-elevation, montane forests, that include open stands of ponderosa pine to mixed-species conifer stands, to open stands of aspen. Nest stands are usually located on north-facing slopes, near water. Nest trees may be medium to large size class, but are usually located in dense stands near more open habitats that allow for hunting prey. Nests are often used for several years, alternating with other nests, sometimes on an annual basis. This creates a nesting area that may have several nest stands. Source habitats are associated with PVGs 3, 4, 6, and 7 (Forest Plan, Appendix E), in the medium and large tree structural stages, with moderate canopy closures (40-69%) and (Nutt and Hescock 2007) and in PVGs 8 and 9 in the medium and large tree size class with moderate and high canopy closures (>40%)(Egnew et al. 2009). Outside of HRV, PVGs 2- 7 may be used in medium to large size classes with high crown closures (>70%). This range of PVGs for source habitats illustrates the adaptability of NOGOs to many different habitat scenarios. Acreages for all of these PVGs were presented above for other species. There is no specific source habitat trend data for the Council Ranger District. According to Wisdom et al. (2000), NOGO source habitats have declined by >/= 60% from basin-wide historical levels in nearly 30% of the watersheds sampled (n = 351), but have also increased by >/= 60% in roughly 20% of the watersheds sampled in the Central Idaho Mountains ERU. NOGO distribution has increased over historical levels in Central Idaho, mostly due to fire suppression over the past 60+ years (Wisdom et al. 2000). In general, forested stands have become more dense, providing secure nesting sites and fledging areas for young (Wisdom et al. 2000). The management strategy used for NOGOs in Region 4 adopted the guidelines developed for NOGOs in the Southwest Region (Reynolds et al. 1992), with updated information provided in 2007 (Youtz et al. 2007). These NOGO guidelines require surveys to identify the presence of NOGO nests, both active and historical, delineation of a >/= 600-acre Post Fledging Area (PFA) for each nesting pair, including identification of 6 nest stands (including known nests) within each PFA, and delineation of an approximately 6,000-acre territory. Each nest stand is a managed area of at least 30 acres surrounding the nest tree. Within the PFA, a specific management strategy is applied, which includes mechanical harvest and prescribed burning to maintain habitat that resists stand-replacement wildfires (Wisdom et al. 2000; Youtz et al.
Crooked River Vegetation Management Project 3-41

3.3 Wildlife Resource
2007). Mechanical harvest may also be used to create openings of 2-4acres in forested stands, to enhance prey species habitats. These management strategies are designed to include stand-specific tree size classes, dominant species, stand densities, and canopy closures. Over a dozen NOGO nests have been located in the Action Area over the past decade. Numbers of active nests fluctuate year-to-year, due to over-winter nest survival, prey and habitat availability, and disturbance. Two concentrated areas of NOGO nest sites were identified in the Project Area, one several miles northeast of Lafferty Campground, at the north end of the Project Area, and one in the Moonshine Creek area, at the south end of the Project Area (Figure 2-5). Three nests were identified for each of these areas; all of these nests have been active over the past 4-5 years. The Moonshine Creek nesting area produced at least one fledged bird each year in 2006, 2007, and 2008. The Lafferty nesting site produced at least one fledged bird in 2006 and 2007; no birds were observed at this site in 2008. PFAs were constructed at approximately 1,000 acres each, because the required mosaic of vegetation structure was not present in a 600-acre area around the nest stands. Habitat management follows the NOGO guidelines and includes harvest and prescribed burn strategies to improve stand structure in the PFAs, while reducing the risk of losing the forested stands from uncharacteristic wildfire. Tree size class and canopy closure guidelines differ, depending on the dominant tree species in the stand (Youtz et al. 2007; See harvest guidelines for NOGO PFAs in Chapter 2). These requirements are described in the proposed harvest design features and in the Timber Sale Contract. Regardless of project implementation, all project activities in the PFAs will be restricted during the nesting season (March 1 - September 30), or until the wildlife biologist can verify that family groups have dispersed from the PFAs. Direct and Indirect Effects to Northern Goshawk Alternative A – No Action Without implementing the project, NOGO nest stands and PFAs would continue to function, but with a higher risk of uncharacteristic fire that could lead to complete removal of current stand structure and security for NOGOs. Harvest and burn strategies to improve NOGO habitat and provide for quality prey species habitat would not occur, leaving NOGO source habitat to slowly increase in tree density and canopy closure, while increasing the risk of a stand-replacement fire. Alternatives B and C Refer to Appendix F for unit treatments by PVG. Both Action Alternatives provide for appropriate habitat management for NOGOs, following specific Forest Plan standards and guidelines, as well as Regional NOGO management guidelines, both Alternatives would be beneficial to NOGOs (Table 3.3-3). Under Alternative C, approximately 380 acres of mechanical thinning and prescribed burning in a ponderosa pine and Douglas-fir forest, plus the planned riparian habitat treatment, would be dropped. These changes would have little effect on NOGO survival at either the Action or Project Area levels. The ponderosa pine/Douglas-fir stand that would be dropped under Alternative C is located outside of the both PFAs, but is likely within the territory of the Moonshine mated pair. The District wildlife staff has observed goshawks hunting in this stand for the past 3 years (Council Ranger District files). Without the thin and burn prescription implementation, this stand would still be at risk for an uncharacteristic wildfire. Not treating the RCA would slightly increase the risk of uncharacteristic fire in the riparian stand as well; however, because the stands surrounding the riparian site would be treated, the risk of a stand-replacement fire burning to the riparian site would be very low. Cumulative Effects Descriptions of the projects that may contribute to cumulative effects can be found in Appendix D. The current conditions (above) represent the effects of past actions and Forest Plan standards require that all current and future projects in the action will be designed to not degrade NOGO population viability. When considered in conjunction with existing conditions and other reasonably foreseeable future actions, the cumulative effect of proposed activities on NOGO habitat would be temporary, but beneficial in the short to long term (see discussion above). The effects are not likely to be significant relative to the larger Action area and are not likely to degrade population viability. Effects Determination Considering the information above, it was determined that the proposed project may impact individual northern goshawks, but will not likely cause a trend toward Federal listing or loss of viability to the population or species.
Crooked River Vegetation Management Project 3-42
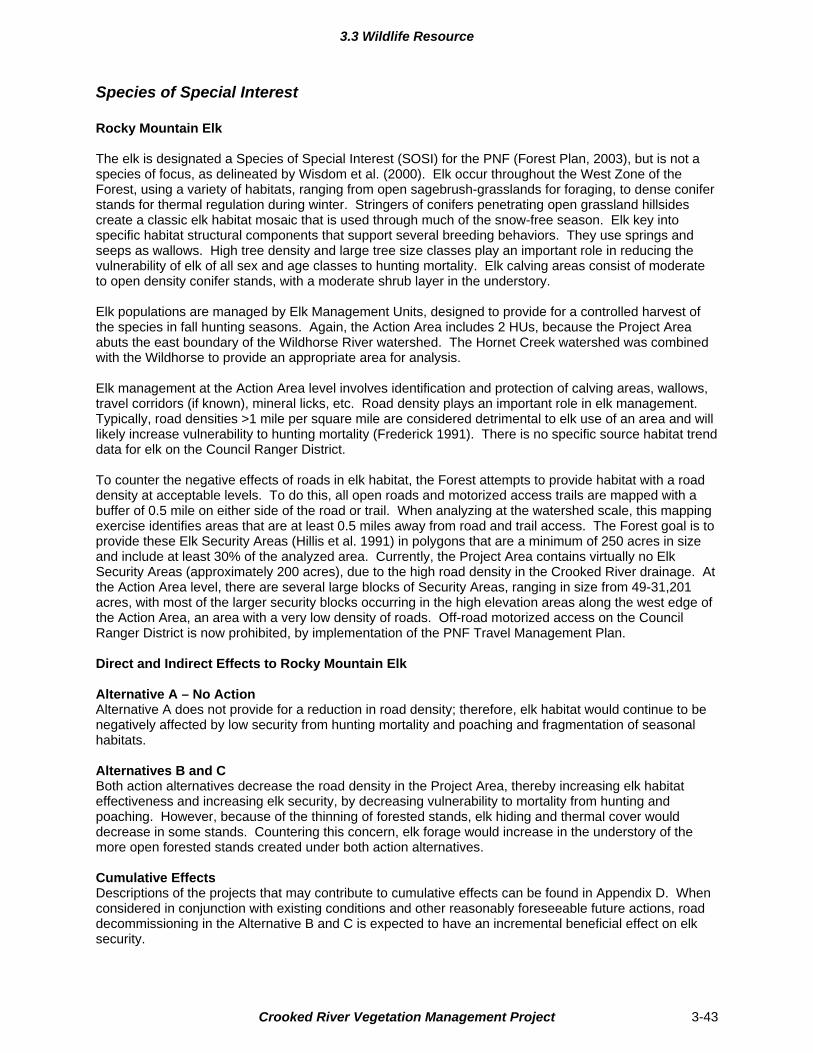
3.3 Wildlife Resource
Species of Special Interest Rocky Mountain Elk The elk is designated a Species of Special Interest (SOSI) for the PNF (Forest Plan, 2003), but is not a species of focus, as delineated by Wisdom et al. (2000). Elk occur throughout the West Zone of the Forest, using a variety of habitats, ranging from open sagebrush-grasslands for foraging, to dense conifer stands for thermal regulation during winter. Stringers of conifers penetrating open grassland hillsides create a classic elk habitat mosaic that is used through much of the snow-free season. Elk key into specific habitat structural components that support several breeding behaviors. They use springs and seeps as wallows. High tree density and large tree size classes play an important role in reducing the vulnerability of elk of all sex and age classes to hunting mortality. Elk calving areas consist of moderate to open density conifer stands, with a moderate shrub layer in the understory. Elk populations are managed by Elk Management Units, designed to provide for a controlled harvest of the species in fall hunting seasons. Again, the Action Area includes 2 HUs, because the Project Area abuts the east boundary of the Wildhorse River watershed. The Hornet Creek watershed was combined with the Wildhorse to provide an appropriate area for analysis. Elk management at the Action Area level involves identification and protection of calving areas, wallows, travel corridors (if known), mineral licks, etc. Road density plays an important role in elk management. Typically, road densities >1 mile per square mile are considered detrimental to elk use of an area and will likely increase vulnerability to hunting mortality (Frederick 1991). There is no specific source habitat trend data for elk on the Council Ranger District. To counter the negative effects of roads in elk habitat, the Forest attempts to provide habitat with a road density at acceptable levels. To do this, all open roads and motorized access trails are mapped with a buffer of 0.5 mile on either side of the road or trail. When analyzing at the watershed scale, this mapping exercise identifies areas that are at least 0.5 miles away from road and trail access. The Forest goal is to provide these Elk Security Areas (Hillis et al. 1991) in polygons that are a minimum of 250 acres in size and include at least 30% of the analyzed area. Currently, the Project Area contains virtually no Elk Security Areas (approximately 200 acres), due to the high road density in the Crooked River drainage. At the Action Area level, there are several large blocks of Security Areas, ranging in size from 49-31,201 acres, with most of the larger security blocks occurring in the high elevation areas along the west edge of the Action Area, an area with a very low density of roads. Off-road motorized access on the Council Ranger District is now prohibited, by implementation of the PNF Travel Management Plan. Direct and Indirect Effects to Rocky Mountain Elk Alternative A – No Action Alternative A does not provide for a reduction in road density; therefore, elk habitat would continue to be negatively affected by low security from hunting mortality and poaching and fragmentation of seasonal habitats. Alternatives B and C Both action alternatives decrease the road density in the Project Area, thereby increasing elk habitat effectiveness and increasing elk security, by decreasing vulnerability to mortality from hunting and poaching. However, because of the thinning of forested stands, elk hiding and thermal cover would decrease in some stands. Countering this concern, elk forage would increase in the understory of the more open forested stands created under both action alternatives. Cumulative Effects Descriptions of the projects that may contribute to cumulative effects can be found in Appendix D. When considered in conjunction with existing conditions and other reasonably foreseeable future actions, road decommissioning in the Alternative B and C is expected to have an incremental beneficial effect on elk security.
Crooked River Vegetation Management Project 3-43

3.3 Wildlife Resource
Migratory Landbird Habitats Migratory landbird habitats were considered at these same levels, in order to analyze project effects on important seasonal habitats, as required by Executive Order 13186 (January 2001), tiered to the Migratory Bird Treaty Act. Idaho Partners in Flight (DPF) identifies13 priority wildlife habitats that support migratory birds and priority species in the state (Table 3.3-4). Thirty-five priority wildlife species are identified; 22 of these are migratory; 14 of these are neotropical migrants. Project effects on forested and non-forested habitats have already been discussed in this chapter. Direct and Indirect Effects to Migratory Landbird Habitats Alternative A – No Action Vegetated habitats could be affected detrimentally if a large, uncharacteristic wildlife occurred in the Action or Project areas. Forested habitats could be severely altered with a complete loss of tree canopy and understory plants. The understory vegetation would sprout within a few seasons following such a fire, but the tree canopy could require decades to reach pre-fire conditions, depending on stand species composition and onsite environmental conditions. The grassland-forb-sagebrush complex habitats would likely begin to sprout the same season as the wildfire, providing early succession habitats quickly, but the forested habitats would take much longer to recover. Alternatives B and C The proposed thinning and underburn would alter all forested habitats where these activities occurred, as noted in earlier discussions. Both Action Alternatives would produce the same effects on these habitats; with only a slight difference, because 380 acres less of forested habitat would be altered in Alternative C. The Alternative would also have some beneficial effects to forested habitats, because of no new road construction, roughly 11 miles of road decommissioning, and no thinning or burning in riparian zones. As discussed earlier, both Action Alternatives would likely shift the forested habitats to a more characteristic fire regime, thereby providing source habitats that were less prone to stand-replacement wildfires. Cumulative Effects The Crooked River drainage has been mined, logged, farmed, and ranched over the past century. Logging, livestock grazing, minor mining projects, and associated road construction and use have continued in the Action Area throughout the past 50 years. On inholdings of private land within the Project Area, logging, livestock grazing, and associated road construction and use have been the main impacts to bird habitats in the immediate area. All of these activities occur currently and are expected to continue in the foreseeable future. The PNF Travel Management Plan recently closed the Council Ranger District to off-road vehicle use, drastically reducing the level of human disturbance in many bird habitats. Implementation of either Action Alternative would decrease the amount of roads in the Project Area and better manage vehicle access to much the watershed. The thinning and underburn activities would develop forested stands that were maintained with a more characteristic fire regime, thereby providing secure bird habitats for the long-term. Prescribed burning of the grassland-sagebrush complexes would reduce fire fuels and stimulate grass, forb, and shrub growth, providing better habitat for many bird species for the long-term.
Forest Plan Consistency Alternative A is not consistent with Forest Plan objectives to move forested stands toward the desired condition. Both Action Alternatives are consistent with the Forest Plan, because they provide actions that move toward the desired condition. This analysis complies with Forest Plan direction. The analysis also complies with requirements set forth under Section 7 of the Endangered Species Act of 1973, as amended {19 U.S.C. 1536 (c), 50 CFR 402.12 (f), and 402.14 (c)}, as well as Section 7 Counterpart Consultation Regulations, as noted in the Alternative Conservation Agreement (ACA, March 2004), between USDA Forest Service and the USDI Fish and Wildlife Service, in support of the National Fire Plan.
Crooked River Vegetation Management Project 3-44
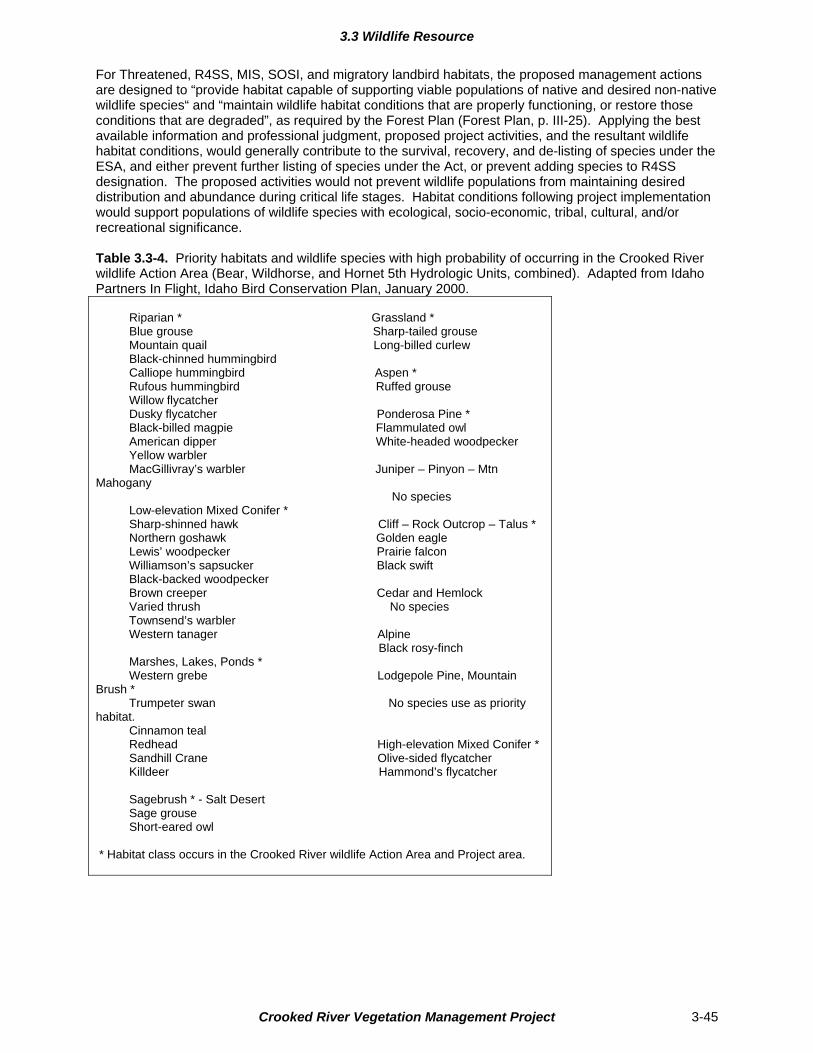
3.3 Wildlife Resource
For Threatened, R4SS, MIS, SOSI, and migratory landbird habitats, the proposed management actions are designed to “provide habitat capable of supporting viable populations of native and desired non-native wildlife species“ and “maintain wildlife habitat conditions that are properly functioning, or restore those conditions that are degraded”, as required by the Forest Plan (Forest Plan, p. III-25). Applying the best available information and professional judgment, proposed project activities, and the resultant wildlife habitat conditions, would generally contribute to the survival, recovery, and de-listing of species under the ESA, and either prevent further listing of species under the Act, or prevent adding species to R4SS designation. The proposed activities would not prevent wildlife populations from maintaining desired distribution and abundance during critical life stages. Habitat conditions following project implementation would support populations of wildlife species with ecological, socio-economic, tribal, cultural, and/or recreational significance. Table 3.3-4. Priority habitats and wildlife species with high probability of occurring in the Crooked River wildlife Action Area (Bear, Wildhorse, and Hornet 5th Hydrologic Units, combined). Adapted from Idaho Partners In Flight, Idaho Bird Conservation Plan, January 2000. Riparian * Grassland * Blue grouse Sharp-tailed grouse Mountain quail Long-billed curlew Black-chinned hummingbird Calliope hummingbird Aspen * Rufous hummingbird Ruffed grouse Willow flycatcher Dusky flycatcher Ponderosa Pine * Black-billed magpie Flammulated owl American dipper White-headed woodpecker Yellow warbler MacGillivray’s warbler Juniper – Pinyon – Mtn Mahogany No species Low-elevation Mixed Conifer * Sharp-shinned hawk Cliff – Rock Outcrop – Talus * Northern goshawk Golden eagle Lewis’ woodpecker Prairie falcon Williamson’s sapsucker Black swift Black-backed woodpecker Brown creeper Cedar and Hemlock Varied thrush No species Townsend’s warbler Western tanager Alpine Black rosy-finch Marshes, Lakes, Ponds * Western grebe Lodgepole Pine, Mountain Brush * Trumpeter swan No species use as priority habitat. Cinnamon teal Redhead High-elevation Mixed Conifer * Sandhill Crane Olive-sided flycatcher Killdeer Hammond’s flycatcher Sagebrush * - Salt Desert Sage grouse Short-eared owl * Habitat class occurs in the Crooked River wildlife Action Area and Project area.
Crooked River Vegetation Management Project 3-45
3.3 Wildlife Resource
Crooked River Vegetation Management Project 3-46
Irreversible and Irretrievable Commitments There are no irreversible or irretrievable commitments of resources associated with wildlife resource management proposed for this project.
Project Record This EA incorporates, by reference, the Wildlife Specialist Report, Biological Evaluation, and Biological Assessment in the Project Record (40 CFR 1502.21). The Wildlife Specialist Report, BE, and BA are located in the Project Record; these documents contain detailed data, data analysis, technical discussion, and reference citations that the Wildlife Biologist relied upon to reach conclusions in this EA.
3.4 - Watershed Resource
3.4 Watershed Resource Objective Improve watershed condition
Measurements Miles of road decommissioned within riparian conservation areas (RCAs). Percent over natural sediment (%ON) over the long term as modeled by BOISED.
Key Issue Effects of proposed timber harvest, prescribed burning, and associated road actions (reconstruction, mitigation, temporary road construction and obliteration) on water quality and quantity.
Indicators Percent over natural (%ON) sediment during project implementation and over the long term as
modeled by BOISED. Miles of road decommissioned within riparian conservation areas (RCAs).
Introduction This chapter provides a description of the existing condition of the water resource in the Crooked River subwatershed with respect to the above indicators and measurements, and the effects of the listed alternatives for the Crooked River Vegetation Management Project on existing watershed conditions. This chapter also includes information related to the guidance of the Forest Plan. Additional information supporting this section is incorporated by reference and is located in the project record, on file at the Council Ranger District Office in Council, Idaho.
Forest Plan Direction The Land and Resource Management Plan (Forest Plan) identifies Forest-wide and management area specific goals, objectives, and standards and guidelines aimed at protection and enhancement of the water resources and associated aquatic habitat.
Crooked River Vegetation Management Project 3-47
3.4 - Watershed Resource
Table 3.4-1 Relevant Forest-wide standards and objectives. Forest Plan Standard or Guideline
Description of Forest Plan Standard or Guideline
SWST01
Management actions shall be designed in a manner that maintains or restores water quality to fully support beneficial uses and native and desired non-native fish species and their habitat, except as allowed under SWRA Standard #4 below. Use the MATRIX located in Appendix B to assist in determining compliance with this standard.
SWST04
Management actions will neither degrade nor retard attainment of properly functioning soil, water, riparian, and aquatic desired conditions, except: Where outweighed by demonstrable short- or long-term benefits to watershed resource conditions; or Where the Forest Service has limited authority (e.g., access roads, hydropower, etc.). In these cases, the Forest Service shall work with permittee(s) to minimize the degradation of watershed resource conditions. Use the MATRIX located in Appendix B to assist in determining compliance with this standard.
SWST07
Within legal authorities, ensure that new proposed management activities within watersheds containing 303(d) listed water bodies improve or maintain overall progress toward beneficial use attainment for pollutants that led to that listing
SWOB18
Reduce road-related effects on soil productivity, water quality, and riparian/aquatic species and their habitats. Refer to the Watershed and Aquatic Recovery Strategy (WARS) for mid-scale prioritization indicators to assist in fine and site/project scale restoration prioritization planning.
Snake River Management Area Forest Plan Direction for Soil, Water and Fishery Resources
Objective 0230 Restore riparian vegetation and floodplain function by reducing the adverse effects of roads through relocation, reconstruction, or obliteration in the Brownlee Creek and Wildhorse River drainages
Scope of the Analysis The watershed analysis area of approximately 14,980 acres includes all land ownerships within the Payette National Forest boundary in the Crooked River Subwatershed (6th field Hydrologic Unit) within the Wildhorse River watershed (Figure 3.4-1). The project area encompasses 7483 acres of this subwatershed, or approximately 50%. The time scales for effects analysis are defined in the Forest Plan as temporary (0-3 years), short term (> 3 years to 15 years), and long term (>15 years) (Forest Plan p. III-4).
Crooked River Vegetation Management Project 3-48

3.4 - Watershed Resource
Figure 3.4-1 Location of Crooked River Project Activity Area and Water Analysis Areas
Crooked River Vegetation Management Project 3-49
3.4 - Watershed Resource
Affected Environment
Current Condition There are approximately 21 miles of perennial streams and 28 miles of intermittent streams within the Crooked River subwatershed, and approximately 11 miles of perennial streams and 21 miles of intermittent stream channels within the project area (Table 3.4-2). The Crooked River is the prominent perennial stream within the analysis area. Table 3.4-2 Summary of Stream Types within Crooked River Subwatershed (HUC 6) and Crooked River Vegetation Management Project Activity Area. Subwatershed Stream Type Total Miles Miles within
Project Activity Area
Subwatershed Drainage Density (miles per square mile)
Crooked River Perennial 21 11 0.9
Intermittent 28 21 1.20
Total 49 32 2.10 Watershed condition indicators for the Crooked River subwatershed include temperature, sediment, and road density/location. Water temperature is characterized as “functioning at risk”, sediment as “functioning at risk”, and road density as “functioning at unacceptable risk”. Miles of road decommissioned and the resulting effect on water quality and quantity (i.e., timing of peak and/or base flow) yields in the subwatershed will be the chief indicators/measurements for this Chapter; for a more detailed discussion of watershed condition indicators and the effects of each alternative, refer to the Water Resources Specialist Report, on file in the project record at the Council Ranger District Office. Research has identified roads as the major source of management-induced sediment in forested watersheds (Megahan 1977, Duncan et al. 1987, Belt et al. 1992., Rothwell 1993). According to GIS data on file at the Council Ranger District office, the Crooked River subwatershed contains approximately 123 miles of road, and the project area contains 75 miles; this includes roads on all land ownerships within the Payette National Forest exterior boundary (Figure 3.4-1). Within the subwatershed, there are 34.1 miles of road within riparian conservation areas (RCAs), defined for this project as 120 feet on either side of an intermittent stream channel and 240 feet on either side of a perennial channel (Table 3.4-3). Within the project area itself, 23.8 miles of road are located within RCAs. There is a mix of open year long, seasonally closed, and permanently closed roads, with a number of road miles on the private lands in the middle project area, and a road that Idaho Power Company maintains and uses to access power lines. These are also included in the analysis. Table 3.4-3 Road Density and Miles of Roads within RCAs Area Total Road
Miles Road Density (miles/square mile)
Miles of Roads within RCAs
Number of road/stream crossings*
Project area 74.7 6.6 23.8 72+* Crooked River Subwatershed
123.2 5.2 34.1 169
*Approximate count The BOISED sediment yield model calculates predicted sediment delivered to streams from each subwatershed based on landtype, past and proposed harvests, existing and proposed roads, and fire events (Reinig et al. 1991). The measure, annual percent over natural (%ON), is the predicted amount of sediment from previous and proposed management activities that is above the natural level that would be expected for each subwatershed without management activities. This is important because sediment can affect the water quality in streams, which can change the physical characteristics of a channel and affect aquatic organisms and fish species (Luce and Wemple 2001).
Crooked River Vegetation Management Project 3-50
3.4 - Watershed Resource
In BOISED, natural erosion rates are based on the inherent erodability of landtypes described in the "Soil-Hydrologic Reconnaissance Survey, Council Ranger District, Payette National Forest" (Larson et al. 1973). Although the BOISED model evaluates surface and mass erosion to provide estimates of natural sediment yields, model outputs are expressed as average yields of total sediment contributed to a subwatershed. Actual sediment yields for individual years may vary from modeled values by an order of magnitude or more because of climate variables, including precipitation timing and amount. Results are best used for developing a quantitative index of cumulative sediment yield to provide a basis for the relative comparison of sediment inputs from different management proposals within a watershed. The %ON of the Crooked River subwatershed in its existing condition (2009) and over the long term (16+ years) is displayed for clarity (Table 3.4-4). Table 3.4-4 Existing Watershed Conditions, Predicted Sediment. Watershed Baseline 2009 %ON 2025+ %ON
Crooked River 26.3 26.3
Environmental Effects NOTE: The measurements and indicators for the water resource for this project are the same, and will be used to both address the issue statement and track the purpose and need statement listed above.
Direct and Indirect Effects Background As road density increases, the potential for watershed impacts is increased. Roads intercept subsurface water or stream channels and increase the drainage network. Changes in drainage network and/or changes in vegetation conditions can lead to changes in the timing and/or magnitude of flows and temperature of water being delivered to streams within drainages. As roads intercept subsurface water, this water is forced to the surface where it is heated more rapidly by air/surface temperatures and or sunlight. Once water is on the surface, it flows off more quickly than it would have as subsurface water (Belt et al. 1992, Luce et al. 2001). This quickening of flow gives the water more energy to pick up and transport sediment and cut down into the ground surface. This process brings water and sediment to the streams and tributaries faster, potentially creating higher peak flows, lower base flows, and higher temperatures. Where roads occupy portions of the floodplain, the ability of a stream channel to meander is reduced, resulting in a reduction in the width of and available habitat in a riparian area. Culverts in a road system have the potential to accelerate flow through a constricted path, which can increase erosion. They may also plug during high flows, which can result in accelerated erosion or mass failure as the stream channel negotiates another flow path. Culverts may also block or impede aquatic organism and fish passage (Luce and Wemple 2001). Alternative A – No Action Taking no action (i.e., no project activities would take place) would result in zero miles of road decommissioned and would not reduce predicted sediment below the baseline (Table 3.4-5). As most of the long-term sediment reduction predicted for each action alternative would be from road decommissioning, the No Action alternative would not produce a long-term reduction benefit to meet the watershed condition sediment indicator in Appendix B of the Forest Plan, nor would it reduce road or drainage densities. Therefore, no change in the timing or magnitude of peak and/or base flows associated with the road network would be expected. In addition, there would be no opportunity to provide mitigation on the existing road network, such as upgraded culverts and gravel at stream crossings, which would result in no improvement to stream habitat where roads are currently located. Alternative B – Proposed Action Along with harvest and prescribed fire activities described in Chapter 2, Alternative B proposes approximately 9.6 miles of road decommissioning, 4.5 of which are in riparian areas. Three culverts (Moonshine Creek, Crooked River, and Coyote Gulch) would be upgraded in an effort to improve fish and aquatic organism passage and accommodate high flows.
Crooked River Vegetation Management Project 3-51
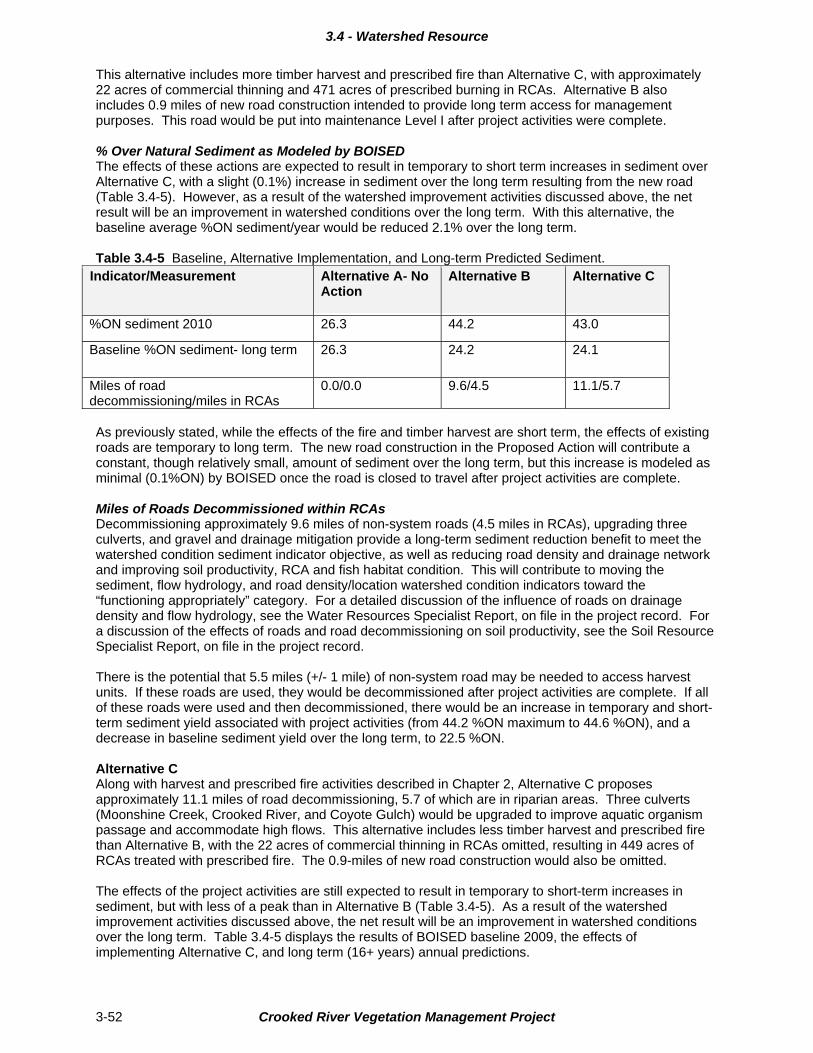
3.4 - Watershed Resource
This alternative includes more timber harvest and prescribed fire than Alternative C, with approximately 22 acres of commercial thinning and 471 acres of prescribed burning in RCAs. Alternative B also includes 0.9 miles of new road construction intended to provide long term access for management purposes. This road would be put into maintenance Level I after project activities were complete. % Over Natural Sediment as Modeled by BOISED The effects of these actions are expected to result in temporary to short term increases in sediment over Alternative C, with a slight (0.1%) increase in sediment over the long term resulting from the new road (Table 3.4-5). However, as a result of the watershed improvement activities discussed above, the net result will be an improvement in watershed conditions over the long term. With this alternative, the baseline average %ON sediment/year would be reduced 2.1% over the long term. Table 3.4-5 Baseline, Alternative Implementation, and Long-term Predicted Sediment.
Indicator/Measurement Alternative A- No Action
Alternative B Alternative C
%ON sediment 2010 26.3 44.2 43.0
Baseline %ON sediment- long term 26.3 24.2 24.1
Miles of road decommissioning/miles in RCAs
0.0/0.0 9.6/4.5 11.1/5.7
As previously stated, while the effects of the fire and timber harvest are short term, the effects of existing roads are temporary to long term. The new road construction in the Proposed Action will contribute a constant, though relatively small, amount of sediment over the long term, but this increase is modeled as minimal (0.1%ON) by BOISED once the road is closed to travel after project activities are complete. Miles of Roads Decommissioned within RCAs Decommissioning approximately 9.6 miles of non-system roads (4.5 miles in RCAs), upgrading three culverts, and gravel and drainage mitigation provide a long-term sediment reduction benefit to meet the watershed condition sediment indicator objective, as well as reducing road density and drainage network and improving soil productivity, RCA and fish habitat condition. This will contribute to moving the sediment, flow hydrology, and road density/location watershed condition indicators toward the “functioning appropriately” category. For a detailed discussion of the influence of roads on drainage density and flow hydrology, see the Water Resources Specialist Report, on file in the project record. For a discussion of the effects of roads and road decommissioning on soil productivity, see the Soil Resource Specialist Report, on file in the project record. There is the potential that 5.5 miles (+/- 1 mile) of non-system road may be needed to access harvest units. If these roads are used, they would be decommissioned after project activities are complete. If all of these roads were used and then decommissioned, there would be an increase in temporary and short-term sediment yield associated with project activities (from 44.2 %ON maximum to 44.6 %ON), and a decrease in baseline sediment yield over the long term, to 22.5 %ON. Alternative C Along with harvest and prescribed fire activities described in Chapter 2, Alternative C proposes approximately 11.1 miles of road decommissioning, 5.7 of which are in riparian areas. Three culverts (Moonshine Creek, Crooked River, and Coyote Gulch) would be upgraded to improve aquatic organism passage and accommodate high flows. This alternative includes less timber harvest and prescribed fire than Alternative B, with the 22 acres of commercial thinning in RCAs omitted, resulting in 449 acres of RCAs treated with prescribed fire. The 0.9-miles of new road construction would also be omitted. The effects of the project activities are still expected to result in temporary to short-term increases in sediment, but with less of a peak than in Alternative B (Table 3.4-5). As a result of the watershed improvement activities discussed above, the net result will be an improvement in watershed conditions over the long term. Table 3.4-5 displays the results of BOISED baseline 2009, the effects of implementing Alternative C, and long term (16+ years) annual predictions.
Crooked River Vegetation Management Project 3-52
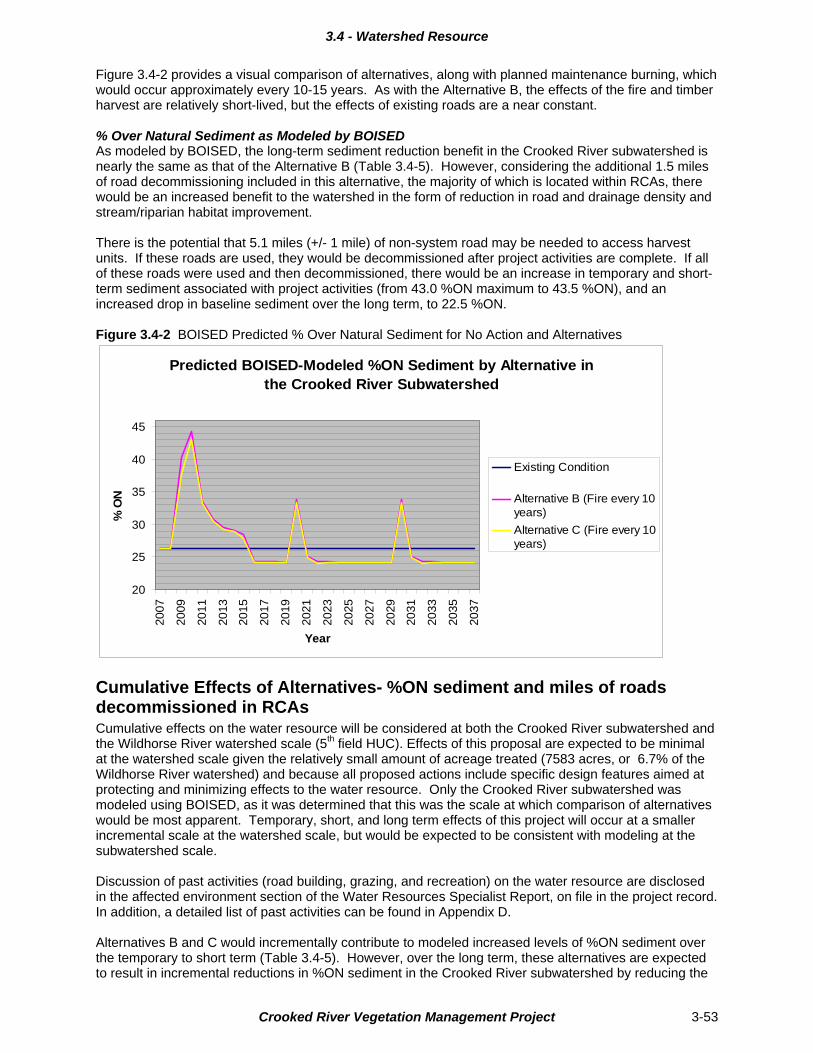
3.4 - Watershed Resource
Figure 3.4-2 provides a visual comparison of alternatives, along with planned maintenance burning, which would occur approximately every 10-15 years. As with the Alternative B, the effects of the fire and timber harvest are relatively short-lived, but the effects of existing roads are a near constant. % Over Natural Sediment as Modeled by BOISED As modeled by BOISED, the long-term sediment reduction benefit in the Crooked River subwatershed is nearly the same as that of the Alternative B (Table 3.4-5). However, considering the additional 1.5 miles of road decommissioning included in this alternative, the majority of which is located within RCAs, there would be an increased benefit to the watershed in the form of reduction in road and drainage density and stream/riparian habitat improvement. There is the potential that 5.1 miles (+/- 1 mile) of non-system road may be needed to access harvest units. If these roads are used, they would be decommissioned after project activities are complete. If all of these roads were used and then decommissioned, there would be an increase in temporary and short-term sediment associated with project activities (from 43.0 %ON maximum to 43.5 %ON), and an increased drop in baseline sediment over the long term, to 22.5 %ON. Figure 3.4-2 BOISED Predicted % Over Natural Sediment for No Action and Alternatives
Predicted BOISED-Modeled %ON Sediment by Alternative in the Crooked River Subwatershed
20
25
30
35
40
45
2007
2009
2011
2013
2015
2017
2019
2021
2023
2025
2027
2029
2031
2033
2035
2037
Year
% O
N
Existing Condition
Alternative B (Fire every 10years)
Alternative C (Fire every 10years)
Cumulative Effects of Alternatives- %ON sediment and miles of roads decommissioned in RCAs Cumulative effects on the water resource will be considered at both the Crooked River subwatershed and the Wildhorse River watershed scale (5th field HUC). Effects of this proposal are expected to be minimal at the watershed scale given the relatively small amount of acreage treated (7583 acres, or 6.7% of the Wildhorse River watershed) and because all proposed actions include specific design features aimed at protecting and minimizing effects to the water resource. Only the Crooked River subwatershed was modeled using BOISED, as it was determined that this was the scale at which comparison of alternatives would be most apparent. Temporary, short, and long term effects of this project will occur at a smaller incremental scale at the watershed scale, but would be expected to be consistent with modeling at the subwatershed scale. Discussion of past activities (road building, grazing, and recreation) on the water resource are disclosed in the affected environment section of the Water Resources Specialist Report, on file in the project record. In addition, a detailed list of past activities can be found in Appendix D. Alternatives B and C would incrementally contribute to modeled increased levels of %ON sediment over the temporary to short term (Table 3.4-5). However, over the long term, these alternatives are expected to result in incremental reductions in %ON sediment in the Crooked River subwatershed by reducing the
Crooked River Vegetation Management Project 3-53
3.4 - Watershed Resource
overall road network and density through decommissioning and through improvements to road surfaces and drainage that reduce road-related sediment contributions. Therefore, the Wildhorse River watershed will also benefit in the long term; however, because of the larger scale, this incremental reduction would be a smaller percent. Reasonably foreseeable future actions (RFFAs) that may cumulatively influence the water resource in conjunction with past and present activities include: forest management and/or mining activities on private lands, livestock grazing on public and private lands, fire suppression, fire wood cutting, dispersed recreation and continued OHV/ATV use. The planned maintenance burning in association with this project (approximately every 10-15 years) will increase sedimentation incrementally over a temporary time scale following burning operations but will return to baseline conditions within three years after burning ( Figure 3.4-2). Summary of Effects of all action alternatives The direct effects of taking no action would maintain the current conditions in the Crooked River subwatershed, including sediment inputs mainly due to roads. There would be zero miles of road decommissioning. Therefore, the effects of the existing road network conditions on water quality and quantity would remain the same. All action alternatives result in temporary to short term increases in predicted %ON sediment due to increased road use, road decommissioning, and harvest activities. Alternative B has the greatest potential to increase %ON sediment due to the new road construction and the increased acres of mechanical treatment and prescribed burning. Implementation of project design features and mitigation measures (see below and Chapter 2 Table 2-5) and Best Management Practices are expected to minimize temporary to short term effects on sediment in both action alternatives. Both action alternatives meet Forest Plan direction for long term improvements to sediment yields, as well as to the existing road system and decommissioning of roads. Alternative C, with more road decommissioning and no new road construction, will result in an overall greater improvement to watershed condition indicators over the long term.
Project Design Features and Mitigations Common to all Action Alternatives To minimize potential sediment delivery related to soil disturbance in harvest units, no salvage harvest or equipment would be allowed within a minimum of 120 feet of intermittent stream channels and 240 feet of perennial stream channels (Belt et al. 1992). Debris torrents and landslides that originate on hill slopes will often pass through riparian buffers (Belt et al. 1992, Wondzell and King 2003, Karr et al. 2004); therefore, to minimize the likelihood of management-induced mass wasting, temporary road construction would not occur on landslide-prone areas (Dixon 2009). Erosion control measures would be required during temporary road construction and culvert placement, which would minimize sediment delivery (Chapter 2 Table 2-5). Temporary road construction (up to 1 mile) that occurs on or near ridge tops and outside of RCAs would not result in measurable sediment delivery to streams due to the long distances from the channels, proper design and drainage, and closure to public use through decommissioning after project activities are complete (Belt at al. 1992, Burroughs and King 1989). Graveling at stream crossings and other drainage improvements prior to log haul would further mitigate temporary sediment delivery from mechanical thinning operations traffic (Burroughs and King 1989). Sediment and substrate embeddedness in the analysis area is expected to improve in the long term because of these measures; see the Fisheries Resource section of Chapter 3 for a detailed discussion of substrate embeddedness and RCA disturbance and rehabilitation. Nelson et al. (2004) evaluated relationships between road density and fish habitat attributes on the PNF, and found that sediment deposition (e.g., percent surface fines) increased with road density. Decommissioning between 9.6 and 11.1 miles of non-system road, 4.5-5.7 miles of which are within RCAs, would reduce road density in the analysis area and further reduce short and long term rates of sediment delivery to stream channels.
Crooked River Vegetation Management Project 3-54
3.4 - Watershed Resource
Crooked River Vegetation Management Project 3-55
Forest Plan Consistency Both action alternatives are consistent with the Forest Plan because they are expected to produce a long term benefit by reducing sediment to the Crooked River subwatershed. The action alternatives are consistent with water quality standards SWST01 and SWST04, SWST07, SWOB18, and Snake River Management Area Objective 0230. Compliance with Forest-wide direction (standards and guidelines) applicable to this project is documented in a Forest Plan Activity Table located in the project record.
Irreversible and Irretrievable Commitments Proposed actions would be expected to cause no irreversible or irretrievable commitments of water resources.
Project Record This Environmental Analysis incorporates by reference the Watershed Resource Specialist Report in the Project Record (40 CFR 1502.21). The Watershed Resource Specialist Report contains the detailed data, methodologies, analysis, references, and other technical documentation used in this assessment.
3.5 - Fisheries Resource
3.5 Fisheries Resource Objective Improve watershed condition.
Measurement Miles of road decommissioned within riparian conservation areas (RCAs).
Key Issue Effects of thinning, prescribed fire, road management and other project activities on RCAs, water quality and fish habitat.
Indicator Trend in RCA condition.
Introduction This section provides an assessment of the existing condition of the fish habitat and fish populations in the Crooked River subwatershed and the effects of three alternatives for the Crooked River Vegetation Management Project on the existing condition of fish habitat. This section contains information related to the guidance of the Forest Plan. Additional information supporting this section is incorporated by reference and is located in the project record.
Forest Plan Direction The Forest Plan standards, objectives, and guidelines that are applicable to this project are included in the Environmental Assessment Chapter 2, mitigation measure/project design features Table 2-5. Forest Plan standards (binding limitations placed on management actions) with particular relevance to this analysis can be found in Table 3.4-1 In addition, and of particular relevance to this project, Forest Plan management area soil, water, riparian and aquatic resources objective SWRAO0235 states that the Forest will "restore structure and composition of shrub and deciduous tree components in those portions of riparian areas where these components are missing or on a downward trend due to historic livestock use, fire exclusion, conifer encroachment, roads, and non-native plants." The management activities proposed for RCAs in all action alternatives are intended to meet SWRAO0234 objective. Appendix B in the Forest Plan specifically addresses soil, water, riparian, and aquatic resources. Part of Appendix B is the Aquatic Conservation Strategy, which is a long-term strategy to restore and maintain the ecological health of watersheds and aquatic ecosystems contained within lands administered by the Payette National Forest. Appendix B also includes tables to document the desired condition, existing condition, effects of the project, and a key for making Endangered Species Act determinations. These tables have been completed for the project and are located in the Project Record. The Crooked River subwatershed identified as a high priority watershed for restoration in the Payette National Forest Watershed and Aquatic Restoration Strategy (Forest Plan).
Scope of the Analysis The fish habitat analysis area encompasses a larger area than the proposed project area and includes all land ownerships within the Payette National Forest boundary, in the Crooked River 6th field Hydrologic Unit (HU), which was determined to be the appropriate scale to assess baseline, direct and indirect effects, and cumulative effects (Figure 3.4-1). The scope of analysis for this section is referred to as the analysis area.
Crooked River Vegetation Management Project 3-56
3.5 - Fisheries Resource
Affected Environment
Current Condition Management Indicator, Threatened, and Sensitive Fish Species Bull trout (Salvelinus confluentus) is the only aquatic Management Indicator Species (MIS) for the Payette National Forest (Forest Plan p. E-3), and occur in Crooked River. Burns et al. (2005) provides an assessment of bull trout viability and trend on the Payette National Forest. Columbia River bull trout were listed as threatened June 10, 1998 by the USDI Fish and Wildlife Service (Federal Register 1998, 63FR31647). Critical habitat for bull trout has been designated by the US Fish and Wildlife Service (Federal Register 2004, 69FR59996). A biological assessment for bull trout will be completed. A biological evaluation (FSM 2672.42) for Chinook salmon (Oncorhynchus tshawytscha), steelhead (O. mykiss), and westslope cutthroat trout (O. clarki lewisi), none of which occur in or directly downstream of the analysis area is on file in the Project Record. Fish Populations The Payette National Forest has collected fish distribution and abundance data on a regular basis from 2001 through 2008 (Greenway 2009; data on file PNF Supervisors Office, McCall, Idaho). These data and reports have provided baseline information to evaluate current fish distribution and fish habitat condition in the analysis area. Bull trout, redband trout (O. mykiss gairdneri), a native species, and brook trout (S. fontinalis), a non-native species, have all been documented within the project area. Extensive hybridization between bull trout and brook trout has been confirmed using genetic analysis (Spruell 2000). The Fisheries Specialist report on file in the Project Record provides a more detailed assessment of bull trout local population characteristics within the analysis area. Actions that Have Affected the Current Condition A combination of land management activities, including road construction, mining operations, and timber harvest, have affected the condition of fish habitat in the vicinity of the proposed project. Roads located near riparian areas and stream channels have altered riparian function by reducing shade, large woody debris (LWD) recruitment, and increased the amount of sediment entering streams. Culverts on Moonshine Creek and Crooked River hinder or block fish passage. Fish Habitat Habitat data were compared with Forest Plan default values for Watershed Condition Indicators (WCIs) to assess if habitat parameters are functioning appropriately (FA), functioning at risk (FR), or functioning at unacceptable risk (FUR) (Forest Plan p. B-12-21). Forest Plan WCIs provide a means to assess how management actions may influence the condition and trend of aquatic resources, including native and desired non-native fish (Forest Plan p. B-12-21). The functioning appropriately value for WCIs can also be interpreted to indicate desired future condition for various habitat parameters. The time scales for effects analysis are defined in the Forest Plan as temporary (0-3 years), short term (> 3 years to 15 years), and long term (>15 years) (Forest Plan p. III-4). It was determined that the following WCIs were relevant for the analysis of effects for the proposed project: sediment and embeddedness, and RCAs. Fish habitat inventories were completed in portions of the watershed in 2001 and 2004. These surveys have provided the baseline information to evaluate current condition throughout the project area. Inventory data are on file at the Payette National Forest Supervisors Office and detailed information on current condition of sediment, RCA, and other WCIs can be referenced in the Fisheries Specialist Report (Project Record). Sediment and substrate embeddedness High levels of sediment can cause an overall loss of productivity and diversity within a stream. Excess sediment can degrade spawning gravels, reduce embryo survival and emergence, impair growth and survival of juvenile salmonids, fill pool habitat, and reduce the productivity of aquatic macroinvertebrates and other prey items for fish (Bjornn et al. 1977, pgs 11-40, Suttle et al. 2004). Region 1 and Region 4 of the Forest Service often use an estimate of the percent of streambed surface covered by fine sediment as an indicator of fine sediment levels in the streambed. Nelson et al. (2004a) found that an estimate of surface fines was not an accurate predictor of depth fines in streams of the Payette National Forest, and that depth fines often were twice as high as estimated surface fines. Given the known inaccuracies, estimates are provided here as a relative indicator of overall fine sediment in the substrate and are used
Crooked River Vegetation Management Project 3-57

3.5 - Fisheries Resource
in conjunction with the substrate embeddedness WCI. The extensive road system on Federal, State, and private lands within the analysis area, in addition to other human-related disturbance such as logging and livestock grazing, have likely increased sediment and substrate embeddedness above natural conditions. Sediment and embeddedness are considered FR. Estimated surface fines in Crooked River range from 19% to 20%. Surface fines in tributaries to Crooked River (Dick Ross Creek and Moonshine Creek), range from 30% to 81%. From Wolman pebble counts, fines (< 2mm) and small gravel (2-8mm) combined were the dominant substrate in Moonshine Creek, Dick Ross Creek, and an unnamed creek (tributary to Crooked River). Gravel (8-64mm), small cobble (64-128mm) and cobble (128-256mm) combined were dominant in all Crooked River reaches. Riparian Conservation Areas Riparian areas influence the delivery of sediment, organic matter, and woody debris to streams, providing root strength for channel stability, shading the stream, and influencing water quality (Gregory et al. 1991). RCA widths should be sufficient to provide riparian functions, including delivery of organic matter and woody debris, stream shading, and bank stability (Gregory et al. 1991, McDade et al. 1990, Belt et al. 1992). The Forest Plan (Appendix B), provides options and criteria for RCA delineation. Option 2 (pg. B-34) was selected, which uses site-specific information on potential vegetation groups (PVG) to determine site potential tree heights. The PVGs within the project area are predominantly PVG-1 (dry ponderosa pine/xeric Douglas-fir), PVG-2 (warm dry Douglas-fir/moist ponderosa pine), PVG-5 (dry grand fir), and PVG-6 (cool moist grand fir) (GIS data on file, PNF Supervisors Office, McCall, ID). The site potential tree height for these four PVGs is 120 ft, 120 ft, 110 ft, and 120 ft respectively (Appendix. B, Table B-5). The greater of the four site potential tree heights (120 ft) was selected as the RCA distance for intermittent stream channels and the distance was doubled (240 ft) for perennial stream channels. There are 34 miles of road within RCAs (as defined above) in the analysis area of which 23.8 miles are within the project area. Roads within RCAs can reduce the potential for Large WoodyDebris (LWD) recruitment and stream shade, increase sediment inputs to stream channels, and alter other riparian processes (Furniss et al.1991). RCAs in the analysis area are considered FR largely due to roads, livestock grazing, irrigation and development of private pastures. The Fisheries Specialist Report on file in the Project Record provides additional information on RCA conditions.
Environmental Effects
Direct and Indirect Effects Miles of road decommissioning within RCAs Roads can accelerate erosion and sediment loading to streams (Furniss et al. 1991; Belt et al. 1992; Luce et al. 2001). Nelson et al. (2004b) evaluated relationships between road density and fish habitat attributes on the Payette National Forest, and found that sediment deposition (e.g., percent surface fines) was positively correlated with road density. Similar trends in sediment delivery and road density were modeled for the Oregon Coast range (Luce et al. 2001). Road decommissioning can result in temporary increases in sediment delivery, but when done correctly result in long term reductions in erosion and sediment delivery as vegetation establishes and infiltration improves, thus allowing for reduced fine sediment in fish habitat (Switalski et al. 2004, Foltz 2007). Given the direct relationship between the amount of roads and sediment loading, the miles of road decommissioning was used as an indicator of sediment and substrate embeddedness in fish habitat. The Watershed section provides BOISED model predicted sediment yield related to project activities including harvest, log haul, road surface improvements, road reconstruction, temporary road construction and road decommissioning (Table 3.4-5). An estimate of sediment yield related to the prescribed fire is also provided. Alternative A – No Action The existing condition would be maintained with Alternative A. Road decommissioning on National Forest system lands within the analysis area would not occur in the foreseeable future (Table 3.5-1). The existing condition of elevated sediment contributions from roads throughout the analysis area would be
Crooked River Vegetation Management Project 3-58

3.5 - Fisheries Resource
maintained (see BOISED model output in the Watershed section) until future projects are funded to address the road-related erosion (Table 3.4-5; Figure 3.5-1). Table 3.5-1 Miles of permanent road decommissioned within RCAs by alternative
Alternative A B C
Miles of decommissioning within RCAs 0 4.5 5.7
Figure 3.5-1 Erosion on a non-system road in an RCA in Coyote Gulch.
Alternative B – Proposed Action Under Alternative B, there would be 4.5 miles of road decommissioned within RCAs within the analysis area (Table 3.5-1). The direct effect would be a reduction in permanent road miles with an indirect effect of a temporary increase in sediment delivery to stream channels followed by a short to long term decrease in sediment delivery. The new road construction across the ephemeral channel in Gopher Gulch would use an existing road crossing; therefore, sediment delivery to the ephemeral channel would be minimal. Mitigations, such as application of straw or wood mulch, and scattering duff and woody debris, would be used to minimize erosion immediately following decommissioning (Zurstadt 2006, Foltz 2007). The reduction in roads would improve the sediment and substrate embeddedness WCIs in the long term (see BOISED model output in the Watershed section), but not by enough to trend the WCIs out of the FR category. Alternative C This alternative would decommission 5.7 miles of road within RCAs (Table 3.5-1). The direct effect would be a reduction in permanent road miles with an indirect effect of a temporary increase in sediment delivery to stream channels that is greater than alternative B. Mitigations, such as application of straw or wood mulch, and scattering duff and woody debris, would be used to minimize erosion immediately following decommissioning (Zurstadt 2006, Foltz 2007). The sediment and substrate embeddedness WCIs would be improved in the long term by a greater amount than Alternative B (see BOISED model output in the Watershed section), but remain FR. Cumulative effects of alternatives (miles of road decommissioning) Road decommissioning on private lands within the analysis area is not anticipated in the foreseeable future. Other actions listed in Appendix D of the EA have had no effect on this indicator. When Alternative A (No Action) is combined with all of the above-mentioned actions, the indicator would be
Crooked River Vegetation Management Project 3-59
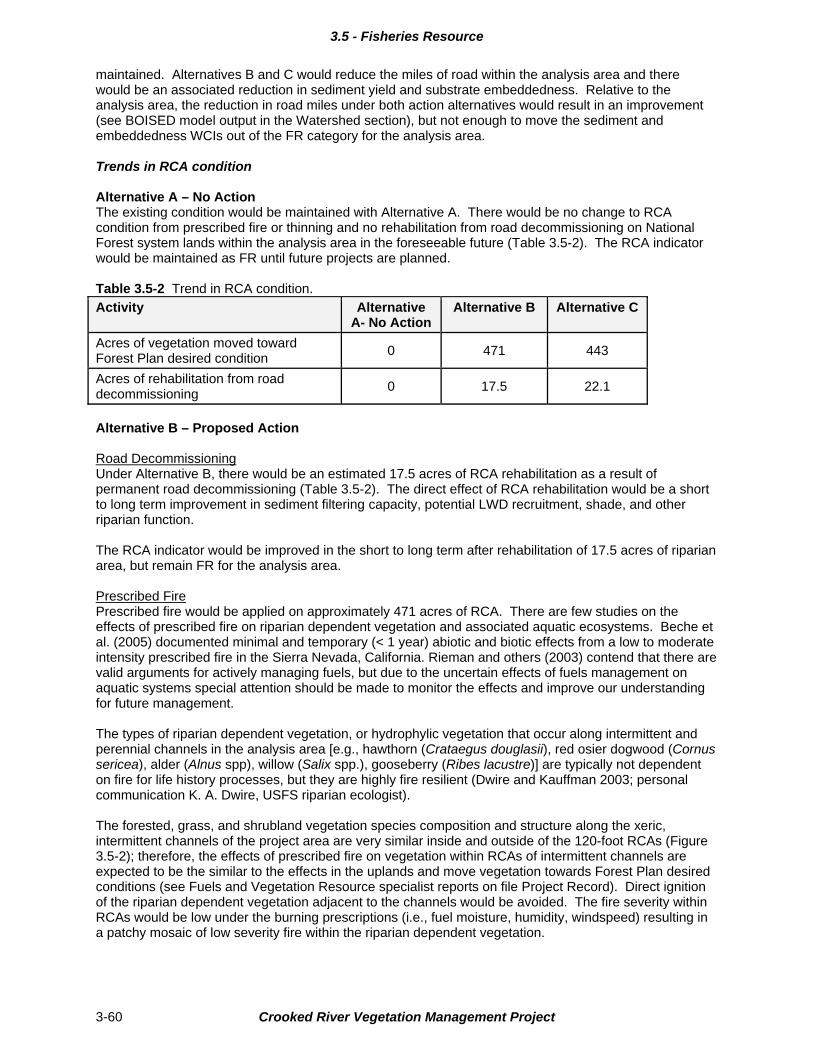
3.5 - Fisheries Resource
maintained. Alternatives B and C would reduce the miles of road within the analysis area and there would be an associated reduction in sediment yield and substrate embeddedness. Relative to the analysis area, the reduction in road miles under both action alternatives would result in an improvement (see BOISED model output in the Watershed section), but not enough to move the sediment and embeddedness WCIs out of the FR category for the analysis area. Trends in RCA condition Alternative A – No Action The existing condition would be maintained with Alternative A. There would be no change to RCA condition from prescribed fire or thinning and no rehabilitation from road decommissioning on National Forest system lands within the analysis area in the foreseeable future (Table 3.5-2). The RCA indicator would be maintained as FR until future projects are planned. Table 3.5-2 Trend in RCA condition.
Activity Alternative A- No Action
Alternative B Alternative C
Acres of vegetation moved toward Forest Plan desired condition
0 471 443
Acres of rehabilitation from road decommissioning
0 17.5 22.1
Alternative B – Proposed Action Road Decommissioning Under Alternative B, there would be an estimated 17.5 acres of RCA rehabilitation as a result of permanent road decommissioning (Table 3.5-2). The direct effect of RCA rehabilitation would be a short to long term improvement in sediment filtering capacity, potential LWD recruitment, shade, and other riparian function. The RCA indicator would be improved in the short to long term after rehabilitation of 17.5 acres of riparian area, but remain FR for the analysis area. Prescribed Fire Prescribed fire would be applied on approximately 471 acres of RCA. There are few studies on the effects of prescribed fire on riparian dependent vegetation and associated aquatic ecosystems. Beche et al. (2005) documented minimal and temporary (< 1 year) abiotic and biotic effects from a low to moderate intensity prescribed fire in the Sierra Nevada, California. Rieman and others (2003) contend that there are valid arguments for actively managing fuels, but due to the uncertain effects of fuels management on aquatic systems special attention should be made to monitor the effects and improve our understanding for future management. The types of riparian dependent vegetation, or hydrophylic vegetation that occur along intermittent and perennial channels in the analysis area [e.g., hawthorn (Crataegus douglasii), red osier dogwood (Cornus sericea), alder (Alnus spp), willow (Salix spp.), gooseberry (Ribes lacustre)] are typically not dependent on fire for life history processes, but they are highly fire resilient (Dwire and Kauffman 2003; personal communication K. A. Dwire, USFS riparian ecologist). The forested, grass, and shrubland vegetation species composition and structure along the xeric, intermittent channels of the project area are very similar inside and outside of the 120-foot RCAs (Figure 3.5-2); therefore, the effects of prescribed fire on vegetation within RCAs of intermittent channels are expected to be the similar to the effects in the uplands and move vegetation towards Forest Plan desired conditions (see Fuels and Vegetation Resource specialist reports on file Project Record). Direct ignition of the riparian dependent vegetation adjacent to the channels would be avoided. The fire severity within RCAs would be low under the burning prescriptions (i.e., fuel moisture, humidity, windspeed) resulting in a patchy mosaic of low severity fire within the riparian dependent vegetation.
Crooked River Vegetation Management Project 3-60
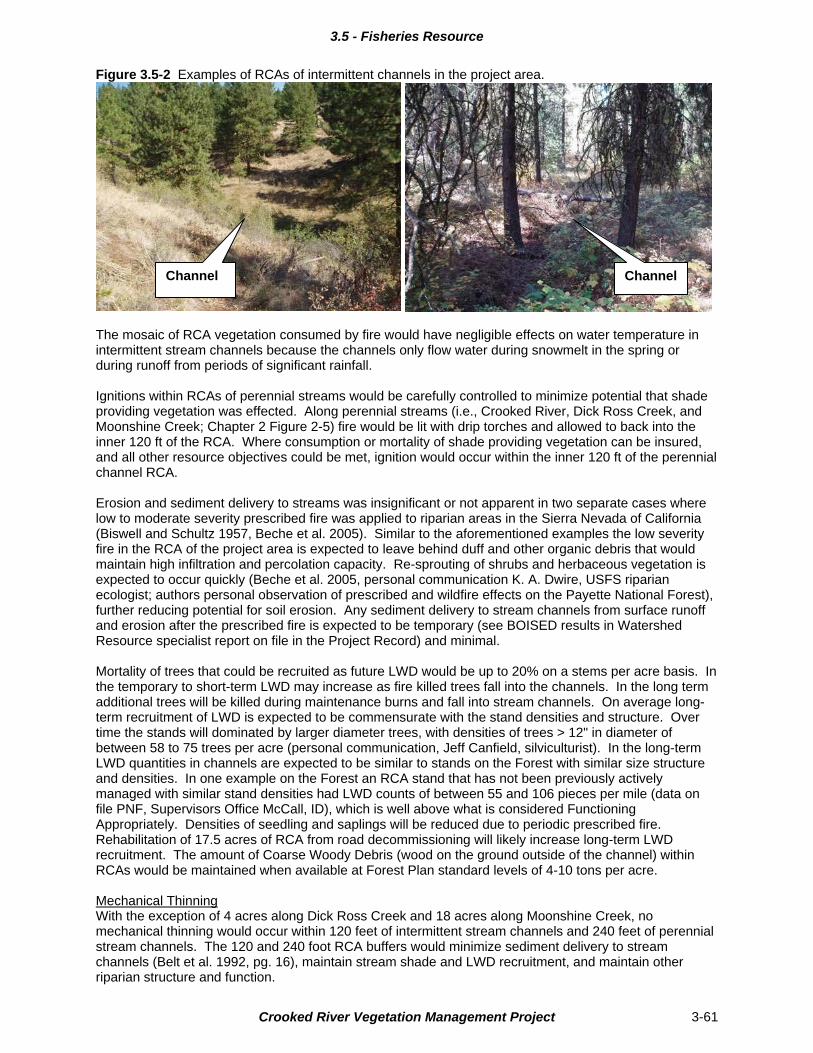
3.5 - Fisheries Resource
Figure 3.5-2 Examples of RCAs of intermittent channels in the project area.
Channel Channel
The mosaic of RCA vegetation consumed by fire would have negligible effects on water temperature in intermittent stream channels because the channels only flow water during snowmelt in the spring or during runoff from periods of significant rainfall. Ignitions within RCAs of perennial streams would be carefully controlled to minimize potential that shade providing vegetation was effected. Along perennial streams (i.e., Crooked River, Dick Ross Creek, and Moonshine Creek; Chapter 2 Figure 2-5) fire would be lit with drip torches and allowed to back into the inner 120 ft of the RCA. Where consumption or mortality of shade providing vegetation can be insured, and all other resource objectives could be met, ignition would occur within the inner 120 ft of the perennial channel RCA. Erosion and sediment delivery to streams was insignificant or not apparent in two separate cases where low to moderate severity prescribed fire was applied to riparian areas in the Sierra Nevada of California (Biswell and Schultz 1957, Beche et al. 2005). Similar to the aforementioned examples the low severity fire in the RCA of the project area is expected to leave behind duff and other organic debris that would maintain high infiltration and percolation capacity. Re-sprouting of shrubs and herbaceous vegetation is expected to occur quickly (Beche et al. 2005, personal communication K. A. Dwire, USFS riparian ecologist; authors personal observation of prescribed and wildfire effects on the Payette National Forest), further reducing potential for soil erosion. Any sediment delivery to stream channels from surface runoff and erosion after the prescribed fire is expected to be temporary (see BOISED results in Watershed Resource specialist report on file in the Project Record) and minimal. Mortality of trees that could be recruited as future LWD would be up to 20% on a stems per acre basis. In the temporary to short-term LWD may increase as fire killed trees fall into the channels. In the long term additional trees will be killed during maintenance burns and fall into stream channels. On average long-term recruitment of LWD is expected to be commensurate with the stand densities and structure. Over time the stands will dominated by larger diameter trees, with densities of trees > 12" in diameter of between 58 to 75 trees per acre (personal communication, Jeff Canfield, silviculturist). In the long-term LWD quantities in channels are expected to be similar to stands on the Forest with similar size structure and densities. In one example on the Forest an RCA stand that has not been previously actively managed with similar stand densities had LWD counts of between 55 and 106 pieces per mile (data on file PNF, Supervisors Office McCall, ID), which is well above what is considered Functioning Appropriately. Densities of seedling and saplings will be reduced due to periodic prescribed fire. Rehabilitation of 17.5 acres of RCA from road decommissioning will likely increase long-term LWD recruitment. The amount of Coarse Woody Debris (wood on the ground outside of the channel) within RCAs would be maintained when available at Forest Plan standard levels of 4-10 tons per acre. Mechanical Thinning With the exception of 4 acres along Dick Ross Creek and 18 acres along Moonshine Creek, no mechanical thinning would occur within 120 feet of intermittent stream channels and 240 feet of perennial stream channels. The 120 and 240 foot RCA buffers would minimize sediment delivery to stream channels (Belt et al. 1992, pg. 16), maintain stream shade and LWD recruitment, and maintain other riparian structure and function.
Crooked River Vegetation Management Project 3-61
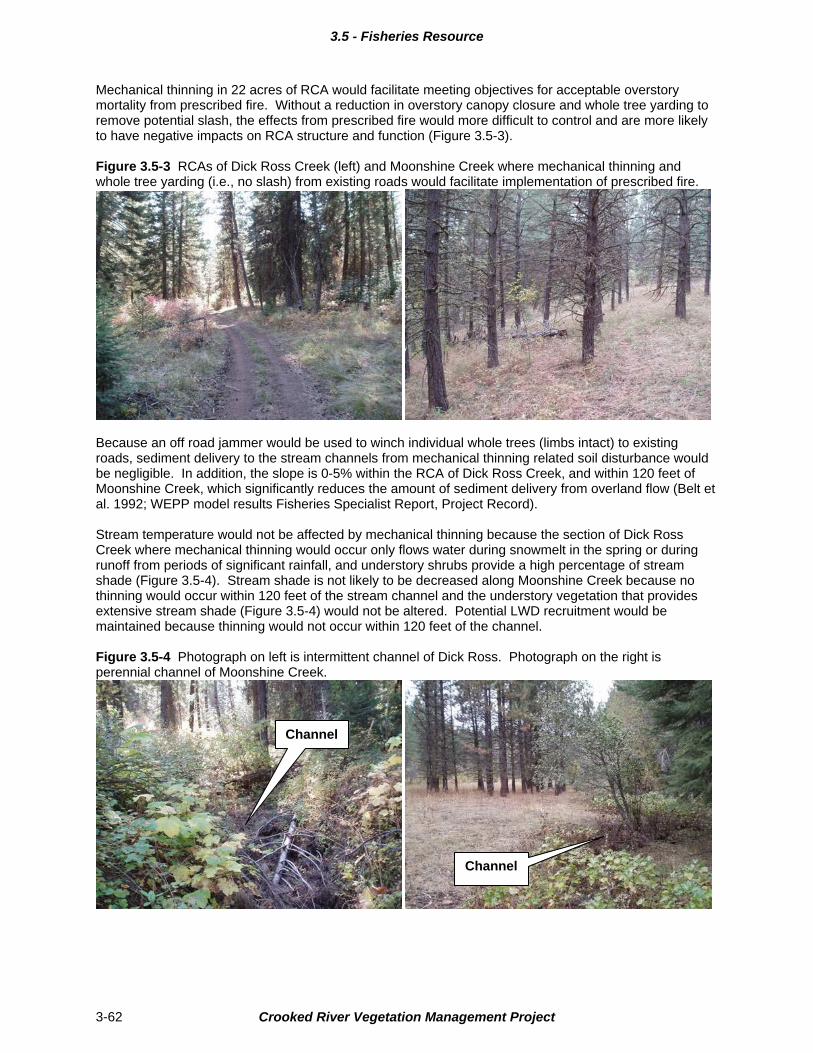
3.5 - Fisheries Resource
Mechanical thinning in 22 acres of RCA would facilitate meeting objectives for acceptable overstory mortality from prescribed fire. Without a reduction in overstory canopy closure and whole tree yarding to remove potential slash, the effects from prescribed fire would more difficult to control and are more likely to have negative impacts on RCA structure and function (Figure 3.5-3). Figure 3.5-3 RCAs of Dick Ross Creek (left) and Moonshine Creek where mechanical thinning and whole tree yarding (i.e., no slash) from existing roads would facilitate implementation of prescribed fire.
Because an off road jammer would be used to winch individual whole trees (limbs intact) to existing roads, sediment delivery to the stream channels from mechanical thinning related soil disturbance would be negligible. In addition, the slope is 0-5% within the RCA of Dick Ross Creek, and within 120 feet of Moonshine Creek, which significantly reduces the amount of sediment delivery from overland flow (Belt et al. 1992; WEPP model results Fisheries Specialist Report, Project Record). Stream temperature would not be affected by mechanical thinning because the section of Dick Ross Creek where mechanical thinning would occur only flows water during snowmelt in the spring or during runoff from periods of significant rainfall, and understory shrubs provide a high percentage of stream shade (Figure 3.5-4). Stream shade is not likely to be decreased along Moonshine Creek because no thinning would occur within 120 feet of the stream channel and the understory vegetation that provides extensive stream shade (Figure 3.5-4) would not be altered. Potential LWD recruitment would be maintained because thinning would not occur within 120 feet of the channel. Figure 3.5-4 Photograph on left is intermittent channel of Dick Ross. Photograph on the right is perennial channel of Moonshine Creek.
Channel
Channel
Crooked River Vegetation Management Project 3-62
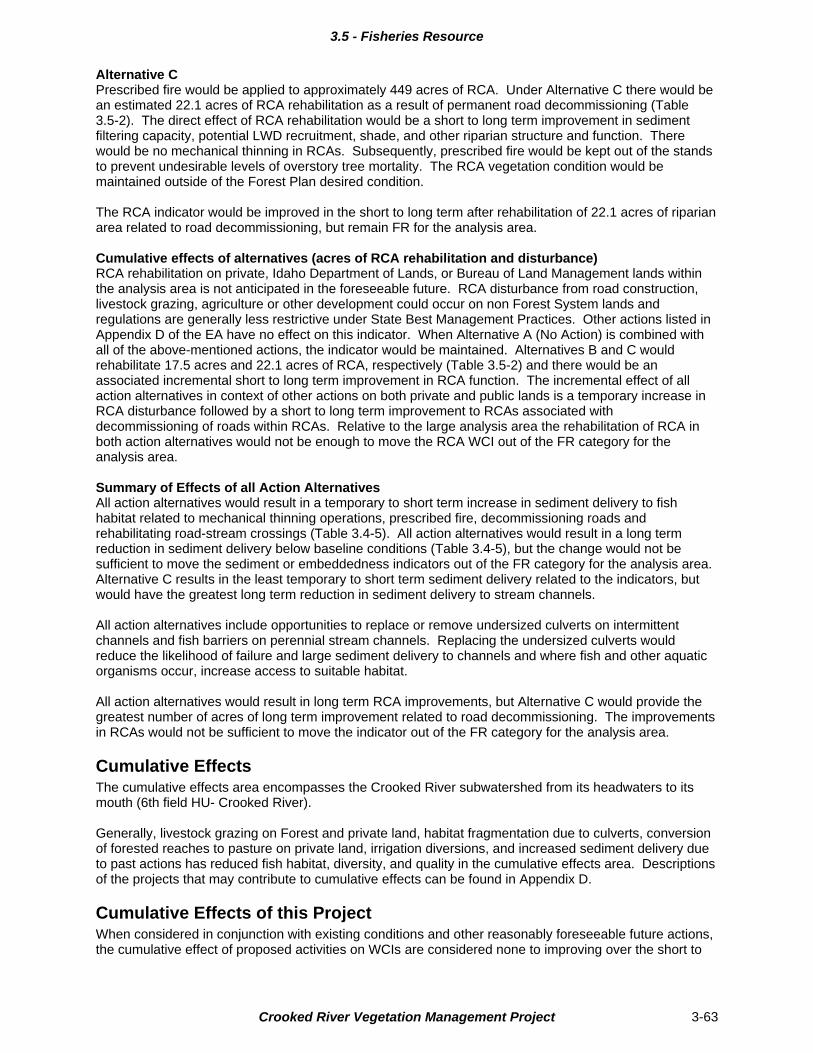
3.5 - Fisheries Resource
Alternative C Prescribed fire would be applied to approximately 449 acres of RCA. Under Alternative C there would be an estimated 22.1 acres of RCA rehabilitation as a result of permanent road decommissioning (Table 3.5-2). The direct effect of RCA rehabilitation would be a short to long term improvement in sediment filtering capacity, potential LWD recruitment, shade, and other riparian structure and function. There would be no mechanical thinning in RCAs. Subsequently, prescribed fire would be kept out of the stands to prevent undesirable levels of overstory tree mortality. The RCA vegetation condition would be maintained outside of the Forest Plan desired condition. The RCA indicator would be improved in the short to long term after rehabilitation of 22.1 acres of riparian area related to road decommissioning, but remain FR for the analysis area. Cumulative effects of alternatives (acres of RCA rehabilitation and disturbance) RCA rehabilitation on private, Idaho Department of Lands, or Bureau of Land Management lands within the analysis area is not anticipated in the foreseeable future. RCA disturbance from road construction, livestock grazing, agriculture or other development could occur on non Forest System lands and regulations are generally less restrictive under State Best Management Practices. Other actions listed in Appendix D of the EA have no effect on this indicator. When Alternative A (No Action) is combined with all of the above-mentioned actions, the indicator would be maintained. Alternatives B and C would rehabilitate 17.5 acres and 22.1 acres of RCA, respectively (Table 3.5-2) and there would be an associated incremental short to long term improvement in RCA function. The incremental effect of all action alternatives in context of other actions on both private and public lands is a temporary increase in RCA disturbance followed by a short to long term improvement to RCAs associated with decommissioning of roads within RCAs. Relative to the large analysis area the rehabilitation of RCA in both action alternatives would not be enough to move the RCA WCI out of the FR category for the analysis area. Summary of Effects of all Action Alternatives All action alternatives would result in a temporary to short term increase in sediment delivery to fish habitat related to mechanical thinning operations, prescribed fire, decommissioning roads and rehabilitating road-stream crossings (Table 3.4-5). All action alternatives would result in a long term reduction in sediment delivery below baseline conditions (Table 3.4-5), but the change would not be sufficient to move the sediment or embeddedness indicators out of the FR category for the analysis area. Alternative C results in the least temporary to short term sediment delivery related to the indicators, but would have the greatest long term reduction in sediment delivery to stream channels. All action alternatives include opportunities to replace or remove undersized culverts on intermittent channels and fish barriers on perennial stream channels. Replacing the undersized culverts would reduce the likelihood of failure and large sediment delivery to channels and where fish and other aquatic organisms occur, increase access to suitable habitat. All action alternatives would result in long term RCA improvements, but Alternative C would provide the greatest number of acres of long term improvement related to road decommissioning. The improvements in RCAs would not be sufficient to move the indicator out of the FR category for the analysis area.
Cumulative Effects The cumulative effects area encompasses the Crooked River subwatershed from its headwaters to its mouth (6th field HU- Crooked River). Generally, livestock grazing on Forest and private land, habitat fragmentation due to culverts, conversion of forested reaches to pasture on private land, irrigation diversions, and increased sediment delivery due to past actions has reduced fish habitat, diversity, and quality in the cumulative effects area. Descriptions of the projects that may contribute to cumulative effects can be found in Appendix D.
Cumulative Effects of this Project When considered in conjunction with existing conditions and other reasonably foreseeable future actions, the cumulative effect of proposed activities on WCIs are considered none to improving over the short to
Crooked River Vegetation Management Project 3-63
3.5 - Fisheries Resource
Crooked River Vegetation Management Project 3-64
long term given the reduction in roads (especially roads near streams), and trend in forest and RCA vegetation toward desired conditions.
Threatened, Endangered, Sensitive and MIS Species Determination Bull trout will not be adversely affected because the project area is downstream of documented bull trout spawning and rearing habitat, and sediment, substrate embeddedness, and RCAs will be maintained or improved. Project effects on bull trout viability will be negligible.
Forest Plan Consistency The action would meet Forest Plan standards and guidelines, and maintain or improve the watershed by maintaining current conditions or trending toward the desired future condition found in the Forest Plan.
Irreversible and Irretrievable Commitments Proposed actions would be expected to cause no irreversible or irretrievable commitments of habitat for management indicator fish species, other listed fish species, or desired native and non-native fish species. Listed bull trout (also management indicator species) are found in Crooked River. The action would not be likely to adversely affect this listed fish species.
Project Record This Environmental Analysis incorporates by reference the Fisheries Resource Specialist Report in the Project Record (40 CFR 1502.21). The Fisheries Resource Specialist Report contains the detailed data, methodologies, analysis, references, and other technical documentation used in this assessment.
3.6 - Soil Resource
3.6 Soils Key Issue What are the effects of salvage harvest, road management and reforestation activities on the long-term productivity of the soil. Indicators
Levels of Detrimental Soil Disturbance (DD) Levels of Total Soil Resource Commitment (TSRC) across the project area Levels of Coarse Woody Debris (CWD)
Introduction Long term soil productivity can be affected through detrimental disturbances to the soil that are impactive and persistent, through long-term commitments of the soil resource to facilities (i.e. roads, landings, skidtrails, campgrounds, gravel pits, etc.), and through practices that do not maintain desired levels of CWD. Prescribed fires and the activities associated with prescribed fires can have effects on the soil resource through the removal of ground cover and vegetation, the heating of the soil surface and subsurface, the loss of coarse woody debris, and the creation of soil disturbances with firelines. Vegetation management activities have the potential to affect long-term soil productivity through road, skidtrail, and landing development and through harvest and post harvest activities that may utilize heavy equipment to remove logs and to expedite reforestation. Soil erosion is not specifically discussed or analyzed in this section but is directly related to the issue and indicator (sediment) presented in the water section of this chapter.
Forest Plan Direction Soil protective cover, soil organic matter, and coarse woody debris are at levels that maintain or restore soil productivity and hydrologic functions where conditions are at risk or degraded. Soils have adequate physical, biological, and chemical properties to support desired vegetation growth. Management actions result in no long-term degradation of soil, water, riparian, and aquatic conditions. (Forest Plan, page III-18).
Scope of the Analysis The analysis area for the effects on soil resources are activity areas, which are specific to each indicator being analyzed. The Forest Plan describes the activity area as “the smallest logical land area where the effect that is being analyzed or monitored is expected to occur.” (Forest Plan p. GL-1) The Forest Plan further describes specific activity areas that are to be utilized for analysis. These descriptions were utilized to arrive at the following activity areas for the Crooked River Project:
For the DD indicator, the activity areas are each of the individual treatment areas (harvest units). DD’s are effects that cause soils to be compacted, displaced, severely burned, or puddled to an extent that the disturbance meets the criteria to be detrimental to the long-term productivity of the soil. These effects are confined to the individual treatment areas.
For the TSRC indicator, the activity area is National Forest System lands within the project area. TSRC’s are effects that cause more visible and generally longer term reductions in soil productivity than DD - such as roads, landings, constructed skidtrails, recreational trails, administrative facilities, livestock driveways, areas of concentrated livestock use, etc. These effects can occur within the entire project area, both within and outside of individual treatment areas.
For the CWD indicator, the activity areas are each of the individual treatment areas (harvest units and burn units). CWD is woody material that is on the ground and has a diameter of at least 3 inches and a length of at least 6 feet. As CWD becomes incorporated into the soil it contributes to long-term soil productivity by providing micro sites for moisture retention and for microbial activity. The effects of the project on CWD are confined to individual treatment areas.
Crooked River Vegetation Management Project 3-65
3.6 - Soil Resource
Affected Environment
Background The project area occurs within the following four Landtype Association Groups (percent of project area represented by the Landtype Association is in parenthesis): Plateaus and Escarpments (83.9%), Alluvial Lands (14.5%), Periglacial Uplands and Mountain Slopes (.9%), and Fluvial Mountain Slopes (0.7%). Figure 3.6-1 displays the Crooked River Project Area with the distribution of landtypes within the project area. Table 3.6-1 displays selected landtype information and soil interpretations for the landtypes occurring within the Crooked River Project Area. These soil and landtype interpretations were utilized as a tool in developing site specific mitigation measures to ensure that soil productivity standards were achieved in the action alternatives. Plateaus and Escarpments This Landtype Association (Landtypes 130-1, 131, 131-1, 132b, 132b-1, 132b-2, 132c, 134, and 134-1 in the project area) is characterized by relatively stable lands that have formed as the direct result of the geologic structure of basalt flows that originally produced relatively flat lands. This post basalt flow landscape has subsequently been tilted, uplifted, and eroded over time producing landforms (landtypes) that consist of moderately to steeply sloping dipslopes, scarp slopes, and escarpments. This Landtype Association is the dominant Landtype Association within the project area and occurs on all areas surrounding the Alluvial Lands that are at the center of the project area. The associated soils are, dominantly, moderately deep to deep, medium to fine textured with low to moderate productivity potentials and variable moisture holding capacities, depending on soil depth. Slopes range from 5 to 70%, inherent erosion hazards are moderately low to moderately high, (depending on slope), and risk for slides and slumps is very low to moderate. The primary management concerns associated with these landtypes are the steepness of some slopes and the compaction potential related to the medium to fine textured surface soils. Alluvial Lands This Landtype Association (Landtypes 101-2 and 102 in the project area, 14.5% of the area) is characterized by the nearly level to gently sloping alluvial lands at the lowest elevations (4200 to 4700 feet). Riparian areas are common within these landtypes which are generally within close proximity to streams. Soils are dominantly deep with standing water and high water tables common, especially during snowmelt. Soil textures range from gravelly loam to clay loam with areas of skeletal (rocky) soils interspersed throughout. Slopes range from 0 to 25%, inherent erosion hazard is very low to low, and risk for slides and slumps is very low. These lands provide an important buffer to soil erosion and sediment production from the surrounding uplands. The primary management concern associated with this landtype is the close proximity to streams and the compaction and trafficability concerns related to fine textured soils and high water tables. The private lands in the center of the project area occur, predominantly, on this Landtype Association. Periglacial Uplands and Mountain Slopes This Landtype Association (Landtype 109-5 in the project area, total of less than 1%) occurs at the highest elevation within the project area just south of Crooked River Point (over 6900 feet) and is the result of the processes of freezing/thawing and wetting/drying. These lands are characterized by rolling uplands and smooth mountain slopes. The associated soils are moderately deep to deep, range in texture from gravelly loam to sandy loam, and have low to moderate productivity potentials. Slopes range from 25 to 40%, inherent erosion hazards are low to moderate, (depending on slope), and risk for slides and slumps is low to moderately low. The primary management concerns associated with this landtype is the short growing season and the compaction potential on fine textured surface soils. Fluvial Mountain Slopes This Landtype Association (Landtype 120b-8 in the project area, total of less than 1%) occurs only in very far west central portion of the project area and is characterized by moderately sloping lands that have been influenced by the force of running water (fluvial). Soils are dominantly moderately deep to deep with textures ranging from sandy loam to loam and moderate to high productivities Slopes range from 30 to 50%, inherent erosion hazard is moderately high, and risk for slides and slumps is low to moderate. The primary management concern on these lands is the very low bearing strength and resulting compaction potential of the soils.
Crooked River Vegetation Management Project 3-66
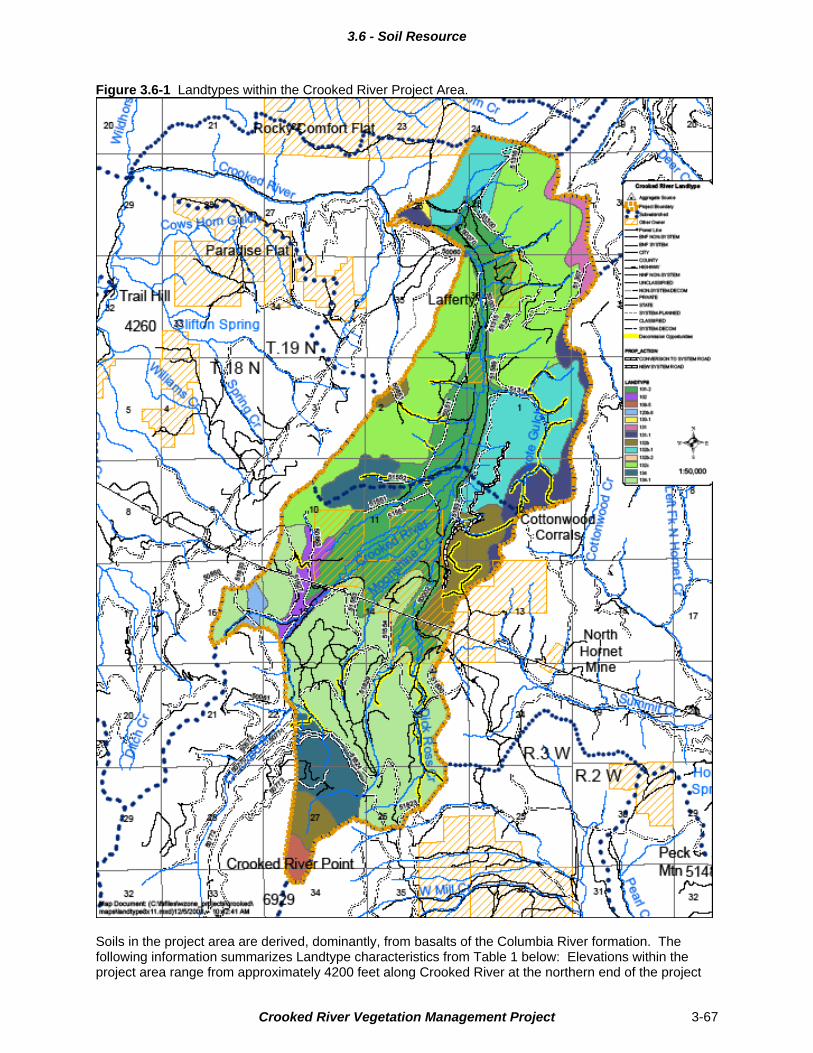
3.6 - Soil Resource
Figure 3.6-1 Landtypes within the Crooked River Project Area.
Soils in the project area are derived, dominantly, from basalts of the Columbia River formation. The following information summarizes Landtype characteristics from Table 1 below: Elevations within the project area range from approximately 4200 feet along Crooked River at the northern end of the project
Crooked River Vegetation Management Project 3-67
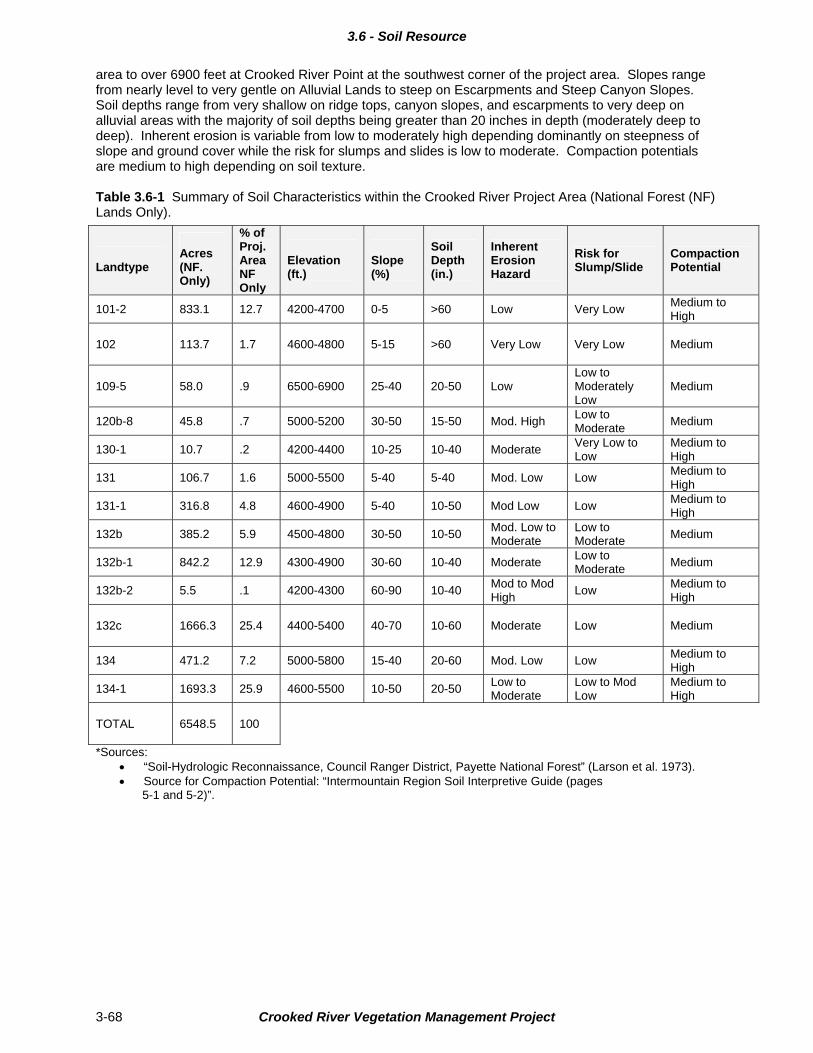
3.6 - Soil Resource
area to over 6900 feet at Crooked River Point at the southwest corner of the project area. Slopes range from nearly level to very gentle on Alluvial Lands to steep on Escarpments and Steep Canyon Slopes. Soil depths range from very shallow on ridge tops, canyon slopes, and escarpments to very deep on alluvial areas with the majority of soil depths being greater than 20 inches in depth (moderately deep to deep). Inherent erosion is variable from low to moderately high depending dominantly on steepness of slope and ground cover while the risk for slumps and slides is low to moderate. Compaction potentials are medium to high depending on soil texture. Table 3.6-1 Summary of Soil Characteristics within the Crooked River Project Area (National Forest (NF) Lands Only).
*Sources:
Landtype
Acres (NF. Only)
% of Proj. Area NF Only
Elevation (ft.)
Slope (%)
Soil Depth (in.)
Inherent Erosion Hazard
Risk for Slump/Slide
Compaction Potential
101-2 833.1 12.7 4200-4700 0-5 >60 Low Very Low Medium to High
102 113.7 1.7 4600-4800 5-15 >60 Very Low Very Low Medium
109-5 58.0 .9 6500-6900 25-40 20-50 Low Low to Moderately Low
Medium
120b-8 45.8 .7 5000-5200 30-50 15-50 Mod. High Low to Moderate
Medium
130-1 10.7 .2 4200-4400 10-25 10-40 Moderate Very Low to Low
Medium to High
131 106.7 1.6 5000-5500 5-40 5-40 Mod. Low Low Medium to High
131-1 316.8 4.8 4600-4900 5-40 10-50 Mod Low Low Medium to High
132b 385.2 5.9 4500-4800 30-50 10-50 Mod. Low to Moderate
Low to Moderate
Medium
132b-1 842.2 12.9 4300-4900 30-60 10-40 Moderate Low to Moderate
Medium
132b-2 5.5 .1 4200-4300 60-90 10-40 Mod to Mod High
Low Medium to High
132c 1666.3 25.4 4400-5400 40-70 10-60 Moderate Low Medium
134 471.2 7.2 5000-5800 15-40 20-60 Mod. Low Low Medium to High
134-1 1693.3 25.9 4600-5500 10-50 20-50 Low to Moderate
Low to Mod Low
Medium to High
TOTAL
6548.5
100
“Soil-Hydrologic Reconnaissance, Council Ranger District, Payette National Forest” (Larson et al. 1973). Source for Compaction Potential: “Intermountain Region Soil Interpretive Guide (pages
5-1 and 5-2)”.
Crooked River Vegetation Management Project 3-68
3.6 - Soil Resource
Current Condition The current condition of the soil resource has been influenced by both natural processes (i.e. climatic events, floods, drought, wind, fire, etc.) and human related disturbances (i.e. roading, grazing, timber harvest, recreation, power line development, etc.). Natural processes have been and continue to be the foundation of soil formation while human related disturbances have effects on soil productivity and soil hydrologic function. Detrimental Disturbance “Detrimental soil disturbance (DD) is the alteration of natural soil characteristics that results in the immediate or prolonged loss of soil productivity and natural soil-hydrologic conditions.” (Forest Plan p. GL-10). DD’s are those effects on the soil resource that cause soils to be compacted, displaced, severely burned, or puddled to an extent that the disturbance meets the criteria (Forest Plan p. GL-10) to be detrimental to long-term soil productivity. DD’s are often small in size, scattered throughout areas of past management and are not always readily visible. Areas that have had little or no past human related disturbances that would compact, displace, puddle or severely burned soils generally have very little or no DD. Detrimental disturbances can persist for decades but, normally, DD’s successfully recover from a detrimental to a non-detrimental condition through natural processes (i.e. freeze/thaw processes, wet/dry cycles, root penetration, rodent burrowing, etc). Because of the difficulty in visually identifying DD’s and because of their small size and scattered occurrence, the most effective manner in which to eliminate the addition of DD’s, on areas where meeting the Forest Plan standard for DD is an issue, is to prevent additional DD from being produced through mitigation measures and project design features. The Forest Plan requires DD to be below and remain below 15% within activity areas unless current conditions for DD are already above 15%. In each activity area where the current condition of DD is above 15%, management activities are required to move DD toward or below 15% within each of those activity areas. Existing DD’s in the Crooked River Project Area have generally been produced as a result of the random movement and use of heavy equipment associated with past logging activities. Additional, but much smaller, amounts of DD may exist from grazing and OHV use off of roads and trails. Those areas where DD’s were produced more than 50 years ago have generally recovered to a nondetrimental condition through natural processes over time while the more recent DD’s have only partially recovered. For the Crooked River Project, activity areas have been stratified into the following three categories – those that received tractor or tractor/jammer harvest in the past, those that received skyline or helicopter harvest in the past, and those that have had no entries for timber harvest. This stratification was made to address the two management scenerios for meeting the Forest Plan standard (see paragraph above – DD less than 15% and DD greater than 15%). All activity areas that have received tractor or tractor/jammer harvest in the past (39 units) are, initially, assumed to have the potential for DD levels to be greater than 15%. An inventory to assess the condition of these units in regard to existing DD was begun in the fall of 2008. Inventory of a total of 15 units was completed prior to snowfall with 8 of the 15 (units 31, 36, 38, 48, 49, 53, 58, and 60) having DD levels in excess of 15%. These 8 units as well as the remaining 24 units that were tractor logged in the past (but not yet inventoried for DD) and are scheduled to be harvested by tractor or tractor/jammer methods in the Crooked River Project (units 1, 3, 4, 5, 7, 8, 13, 21, 26, 27, 32, 33, 39, 41, 44, 45, 46, 52, 64, 120, 121, 131, 139, 211)will be managed as if the existing condition of DD is greater than 15% – requiring an improvement in the amount of DD within each unit. The assumption that these previously tractor harvested units where DD inventory could not be completed have DD levels higher than 15% creates a worst case scenario for these activity areas and requires an improvement in the DD condition to meet the Forest Plan standard. Any DD monitoring that is conducted prior to the harvest of these 24 units and that shows DD levels below 15% will not require improvement in DD conditions for those units. The activity areas that have received skyline or helicopter harvest in the past are assumed, as is assumed in other projects, to have DD levels that are very low, well below 15%. This assumption is supported by observations of past timber sales that have utilized skyline and helicopter harvest and where very little DD has been produced – generally the existing DD within these areas is associated only with some portions of the skyline corridors.
Crooked River Vegetation Management Project 3-69
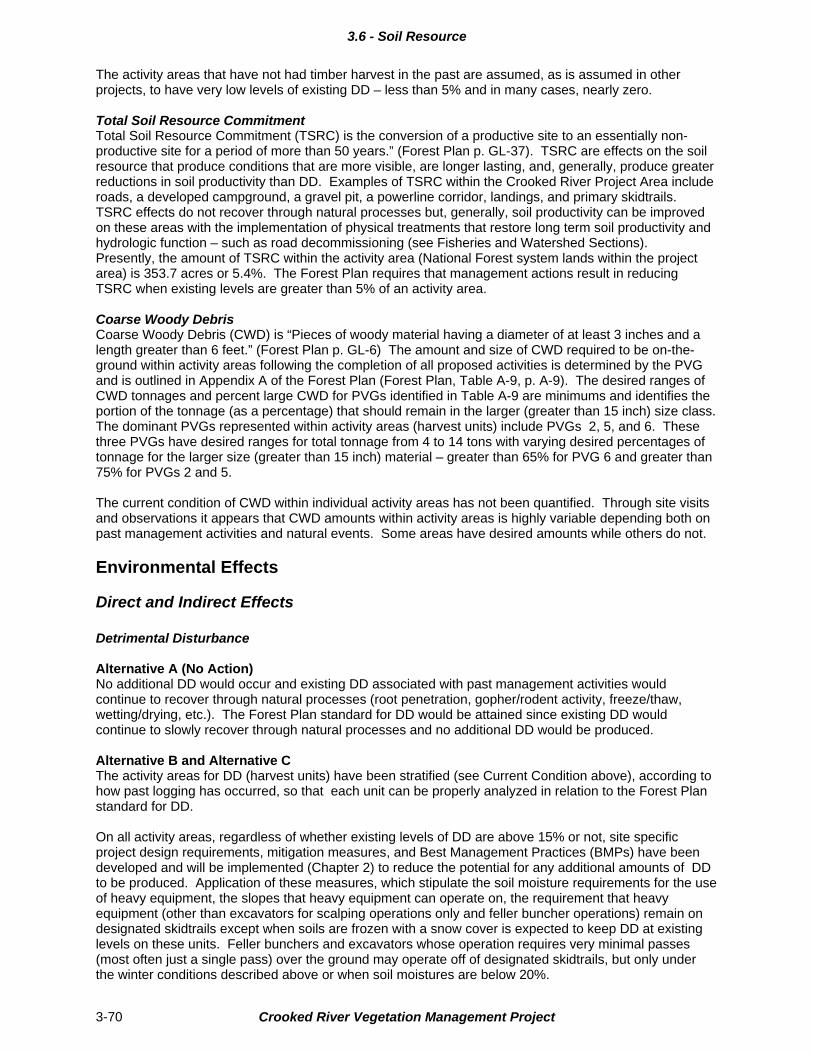
3.6 - Soil Resource
The activity areas that have not had timber harvest in the past are assumed, as is assumed in other projects, to have very low levels of existing DD – less than 5% and in many cases, nearly zero. Total Soil Resource Commitment Total Soil Resource Commitment (TSRC) is the conversion of a productive site to an essentially non-productive site for a period of more than 50 years.” (Forest Plan p. GL-37). TSRC are effects on the soil resource that produce conditions that are more visible, are longer lasting, and, generally, produce greater reductions in soil productivity than DD. Examples of TSRC within the Crooked River Project Area include roads, a developed campground, a gravel pit, a powerline corridor, landings, and primary skidtrails. TSRC effects do not recover through natural processes but, generally, soil productivity can be improved on these areas with the implementation of physical treatments that restore long term soil productivity and hydrologic function – such as road decommissioning (see Fisheries and Watershed Sections). Presently, the amount of TSRC within the activity area (National Forest system lands within the project area) is 353.7 acres or 5.4%. The Forest Plan requires that management actions result in reducing TSRC when existing levels are greater than 5% of an activity area. Coarse Woody Debris Coarse Woody Debris (CWD) is “Pieces of woody material having a diameter of at least 3 inches and a length greater than 6 feet.” (Forest Plan p. GL-6) The amount and size of CWD required to be on-the-ground within activity areas following the completion of all proposed activities is determined by the PVG and is outlined in Appendix A of the Forest Plan (Forest Plan, Table A-9, p. A-9). The desired ranges of CWD tonnages and percent large CWD for PVGs identified in Table A-9 are minimums and identifies the portion of the tonnage (as a percentage) that should remain in the larger (greater than 15 inch) size class. The dominant PVGs represented within activity areas (harvest units) include PVGs 2, 5, and 6. These three PVGs have desired ranges for total tonnage from 4 to 14 tons with varying desired percentages of tonnage for the larger size (greater than 15 inch) material – greater than 65% for PVG 6 and greater than 75% for PVGs 2 and 5. The current condition of CWD within individual activity areas has not been quantified. Through site visits and observations it appears that CWD amounts within activity areas is highly variable depending both on past management activities and natural events. Some areas have desired amounts while others do not.
Environmental Effects
Direct and Indirect Effects Detrimental Disturbance Alternative A (No Action) No additional DD would occur and existing DD associated with past management activities would continue to recover through natural processes (root penetration, gopher/rodent activity, freeze/thaw, wetting/drying, etc.). The Forest Plan standard for DD would be attained since existing DD would continue to slowly recover through natural processes and no additional DD would be produced. Alternative B and Alternative C The activity areas for DD (harvest units) have been stratified (see Current Condition above), according to how past logging has occurred, so that each unit can be properly analyzed in relation to the Forest Plan standard for DD. On all activity areas, regardless of whether existing levels of DD are above 15% or not, site specific project design requirements, mitigation measures, and Best Management Practices (BMPs) have been developed and will be implemented (Chapter 2) to reduce the potential for any additional amounts of DD to be produced. Application of these measures, which stipulate the soil moisture requirements for the use of heavy equipment, the slopes that heavy equipment can operate on, the requirement that heavy equipment (other than excavators for scalping operations only and feller buncher operations) remain on designated skidtrails except when soils are frozen with a snow cover is expected to keep DD at existing levels on these units. Feller bunchers and excavators whose operation requires very minimal passes (most often just a single pass) over the ground may operate off of designated skidtrails, but only under the winter conditions described above or when soil moistures are below 20%.
Crooked River Vegetation Management Project 3-70
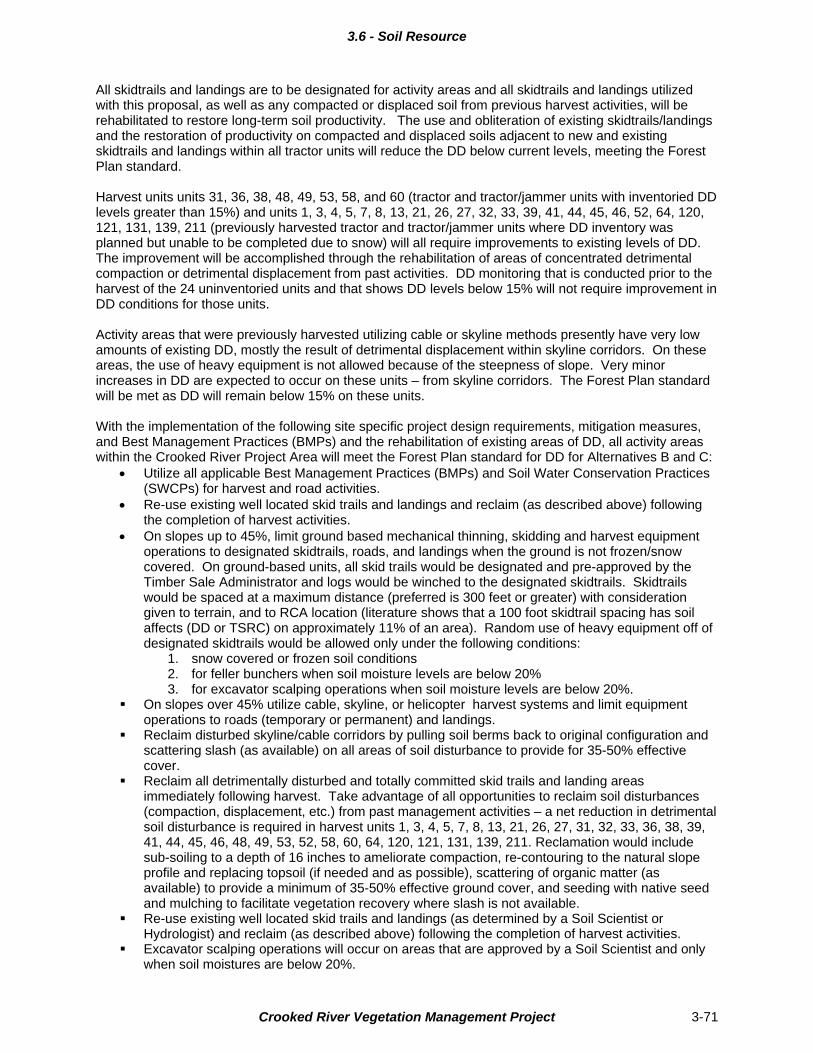
3.6 - Soil Resource
All skidtrails and landings are to be designated for activity areas and all skidtrails and landings utilized with this proposal, as well as any compacted or displaced soil from previous harvest activities, will be rehabilitated to restore long-term soil productivity. The use and obliteration of existing skidtrails/landings and the restoration of productivity on compacted and displaced soils adjacent to new and existing skidtrails and landings within all tractor units will reduce the DD below current levels, meeting the Forest Plan standard. Harvest units units 31, 36, 38, 48, 49, 53, 58, and 60 (tractor and tractor/jammer units with inventoried DD levels greater than 15%) and units 1, 3, 4, 5, 7, 8, 13, 21, 26, 27, 32, 33, 39, 41, 44, 45, 46, 52, 64, 120, 121, 131, 139, 211 (previously harvested tractor and tractor/jammer units where DD inventory was planned but unable to be completed due to snow) will all require improvements to existing levels of DD. The improvement will be accomplished through the rehabilitation of areas of concentrated detrimental compaction or detrimental displacement from past activities. DD monitoring that is conducted prior to the harvest of the 24 uninventoried units and that shows DD levels below 15% will not require improvement in DD conditions for those units. Activity areas that were previously harvested utilizing cable or skyline methods presently have very low amounts of existing DD, mostly the result of detrimental displacement within skyline corridors. On these areas, the use of heavy equipment is not allowed because of the steepness of slope. Very minor increases in DD are expected to occur on these units – from skyline corridors. The Forest Plan standard will be met as DD will remain below 15% on these units. With the implementation of the following site specific project design requirements, mitigation measures, and Best Management Practices (BMPs) and the rehabilitation of existing areas of DD, all activity areas within the Crooked River Project Area will meet the Forest Plan standard for DD for Alternatives B and C:
Utilize all applicable Best Management Practices (BMPs) and Soil Water Conservation Practices (SWCPs) for harvest and road activities.
Re-use existing well located skid trails and landings and reclaim (as described above) following the completion of harvest activities.
On slopes up to 45%, limit ground based mechanical thinning, skidding and harvest equipment operations to designated skidtrails, roads, and landings when the ground is not frozen/snow covered. On ground-based units, all skid trails would be designated and pre-approved by the Timber Sale Administrator and logs would be winched to the designated skidtrails. Skidtrails would be spaced at a maximum distance (preferred is 300 feet or greater) with consideration given to terrain, and to RCA location (literature shows that a 100 foot skidtrail spacing has soil affects (DD or TSRC) on approximately 11% of an area). Random use of heavy equipment off of designated skidtrails would be allowed only under the following conditions:
1. snow covered or frozen soil conditions 2. for feller bunchers when soil moisture levels are below 20% 3. for excavator scalping operations when soil moisture levels are below 20%.
On slopes over 45% utilize cable, skyline, or helicopter harvest systems and limit equipment operations to roads (temporary or permanent) and landings.
Reclaim disturbed skyline/cable corridors by pulling soil berms back to original configuration and scattering slash (as available) on all areas of soil disturbance to provide for 35-50% effective cover.
Reclaim all detrimentally disturbed and totally committed skid trails and landing areas immediately following harvest. Take advantage of all opportunities to reclaim soil disturbances (compaction, displacement, etc.) from past management activities – a net reduction in detrimental soil disturbance is required in harvest units 1, 3, 4, 5, 7, 8, 13, 21, 26, 27, 31, 32, 33, 36, 38, 39, 41, 44, 45, 46, 48, 49, 53, 52, 58, 60, 64, 120, 121, 131, 139, 211. Reclamation would include sub-soiling to a depth of 16 inches to ameliorate compaction, re-contouring to the natural slope profile and replacing topsoil (if needed and as possible), scattering of organic matter (as available) to provide a minimum of 35-50% effective ground cover, and seeding with native seed and mulching to facilitate vegetation recovery where slash is not available.
Re-use existing well located skid trails and landings (as determined by a Soil Scientist or Hydrologist) and reclaim (as described above) following the completion of harvest activities.
Excavator scalping operations will occur on areas that are approved by a Soil Scientist and only when soil moistures are below 20%.
Crooked River Vegetation Management Project 3-71
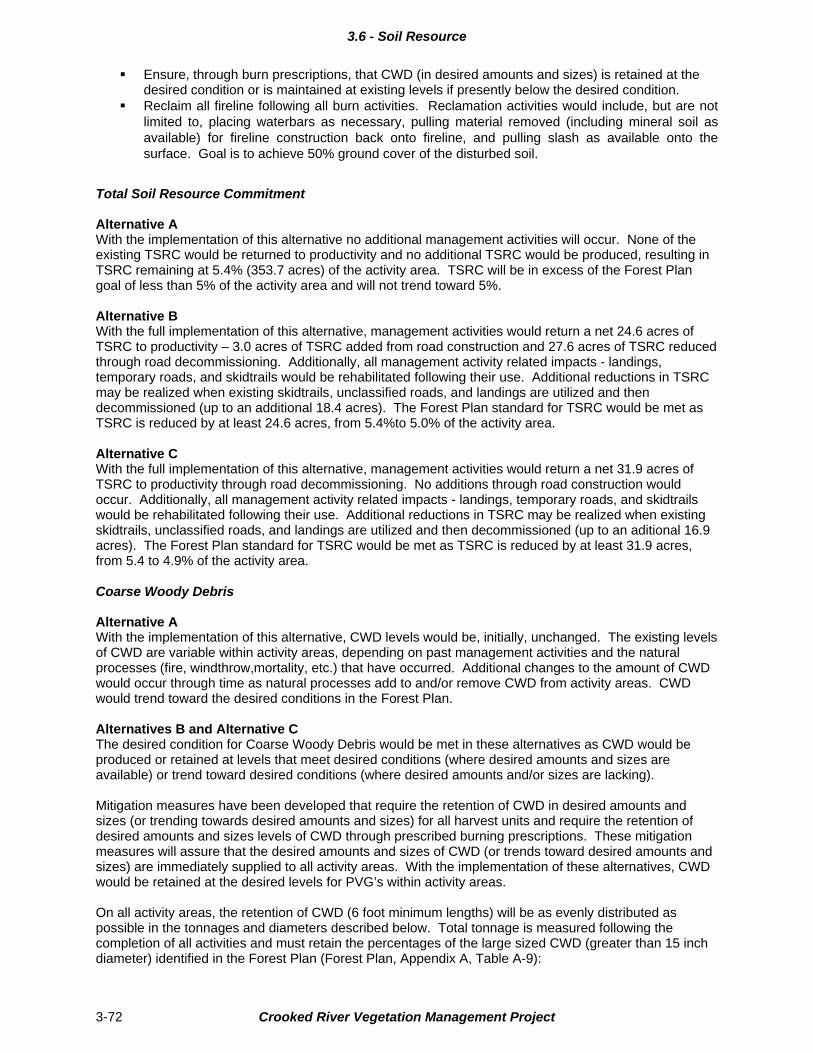
3.6 - Soil Resource
Ensure, through burn prescriptions, that CWD (in desired amounts and sizes) is retained at the desired condition or is maintained at existing levels if presently below the desired condition.
Reclaim all fireline following all burn activities. Reclamation activities would include, but are not limited to, placing waterbars as necessary, pulling material removed (including mineral soil as available) for fireline construction back onto fireline, and pulling slash as available onto the surface. Goal is to achieve 50% ground cover of the disturbed soil.
Total Soil Resource Commitment Alternative A With the implementation of this alternative no additional management activities will occur. None of the existing TSRC would be returned to productivity and no additional TSRC would be produced, resulting in TSRC remaining at 5.4% (353.7 acres) of the activity area. TSRC will be in excess of the Forest Plan goal of less than 5% of the activity area and will not trend toward 5%. Alternative B With the full implementation of this alternative, management activities would return a net 24.6 acres of TSRC to productivity – 3.0 acres of TSRC added from road construction and 27.6 acres of TSRC reduced through road decommissioning. Additionally, all management activity related impacts - landings, temporary roads, and skidtrails would be rehabilitated following their use. Additional reductions in TSRC may be realized when existing skidtrails, unclassified roads, and landings are utilized and then decommissioned (up to an additional 18.4 acres). The Forest Plan standard for TSRC would be met as TSRC is reduced by at least 24.6 acres, from 5.4%to 5.0% of the activity area. Alternative C With the full implementation of this alternative, management activities would return a net 31.9 acres of TSRC to productivity through road decommissioning. No additions through road construction would occur. Additionally, all management activity related impacts - landings, temporary roads, and skidtrails would be rehabilitated following their use. Additional reductions in TSRC may be realized when existing skidtrails, unclassified roads, and landings are utilized and then decommissioned (up to an aditional 16.9 acres). The Forest Plan standard for TSRC would be met as TSRC is reduced by at least 31.9 acres, from 5.4 to 4.9% of the activity area. Coarse Woody Debris Alternative A With the implementation of this alternative, CWD levels would be, initially, unchanged. The existing levels of CWD are variable within activity areas, depending on past management activities and the natural processes (fire, windthrow,mortality, etc.) that have occurred. Additional changes to the amount of CWD would occur through time as natural processes add to and/or remove CWD from activity areas. CWD would trend toward the desired conditions in the Forest Plan. Alternatives B and Alternative C The desired condition for Coarse Woody Debris would be met in these alternatives as CWD would be produced or retained at levels that meet desired conditions (where desired amounts and sizes are available) or trend toward desired conditions (where desired amounts and/or sizes are lacking). Mitigation measures have been developed that require the retention of CWD in desired amounts and sizes (or trending towards desired amounts and sizes) for all harvest units and require the retention of desired amounts and sizes levels of CWD through prescribed burning prescriptions. These mitigation measures will assure that the desired amounts and sizes of CWD (or trends toward desired amounts and sizes) are immediately supplied to all activity areas. With the implementation of these alternatives, CWD would be retained at the desired levels for PVG’s within activity areas. On all activity areas, the retention of CWD (6 foot minimum lengths) will be as evenly distributed as possible in the tonnages and diameters described below. Total tonnage is measured following the completion of all activities and must retain the percentages of the large sized CWD (greater than 15 inch diameter) identified in the Forest Plan (Forest Plan, Appendix A, Table A-9):
Crooked River Vegetation Management Project 3-72
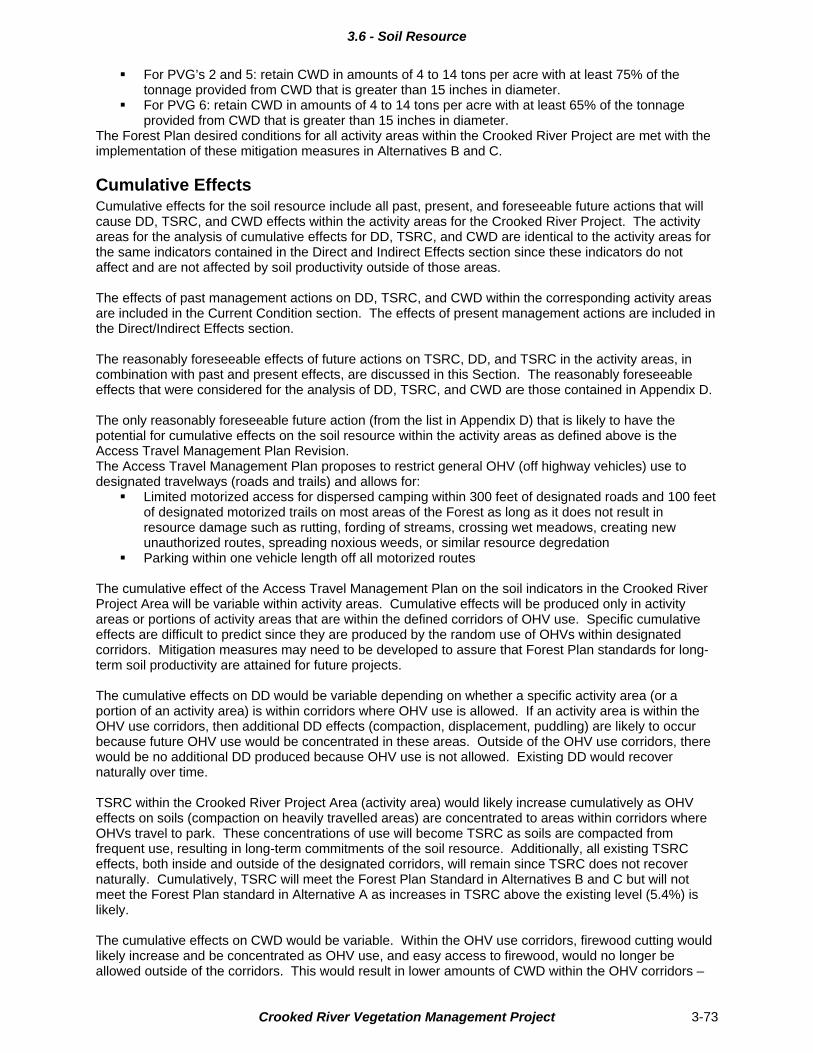
3.6 - Soil Resource
For PVG’s 2 and 5: retain CWD in amounts of 4 to 14 tons per acre with at least 75% of the tonnage provided from CWD that is greater than 15 inches in diameter.
For PVG 6: retain CWD in amounts of 4 to 14 tons per acre with at least 65% of the tonnage provided from CWD that is greater than 15 inches in diameter.
The Forest Plan desired conditions for all activity areas within the Crooked River Project are met with the implementation of these mitigation measures in Alternatives B and C.
Cumulative Effects Cumulative effects for the soil resource include all past, present, and foreseeable future actions that will cause DD, TSRC, and CWD effects within the activity areas for the Crooked River Project. The activity areas for the analysis of cumulative effects for DD, TSRC, and CWD are identical to the activity areas for the same indicators contained in the Direct and Indirect Effects section since these indicators do not affect and are not affected by soil productivity outside of those areas. The effects of past management actions on DD, TSRC, and CWD within the corresponding activity areas are included in the Current Condition section. The effects of present management actions are included in the Direct/Indirect Effects section. The reasonably foreseeable effects of future actions on TSRC, DD, and TSRC in the activity areas, in combination with past and present effects, are discussed in this Section. The reasonably foreseeable effects that were considered for the analysis of DD, TSRC, and CWD are those contained in Appendix D. The only reasonably foreseeable future action (from the list in Appendix D) that is likely to have the potential for cumulative effects on the soil resource within the activity areas as defined above is the Access Travel Management Plan Revision. The Access Travel Management Plan proposes to restrict general OHV (off highway vehicles) use to designated travelways (roads and trails) and allows for:
Limited motorized access for dispersed camping within 300 feet of designated roads and 100 feet of designated motorized trails on most areas of the Forest as long as it does not result in resource damage such as rutting, fording of streams, crossing wet meadows, creating new unauthorized routes, spreading noxious weeds, or similar resource degredation
Parking within one vehicle length off all motorized routes The cumulative effect of the Access Travel Management Plan on the soil indicators in the Crooked River Project Area will be variable within activity areas. Cumulative effects will be produced only in activity areas or portions of activity areas that are within the defined corridors of OHV use. Specific cumulative effects are difficult to predict since they are produced by the random use of OHVs within designated corridors. Mitigation measures may need to be developed to assure that Forest Plan standards for long-term soil productivity are attained for future projects. The cumulative effects on DD would be variable depending on whether a specific activity area (or a portion of an activity area) is within corridors where OHV use is allowed. If an activity area is within the OHV use corridors, then additional DD effects (compaction, displacement, puddling) are likely to occur because future OHV use would be concentrated in these areas. Outside of the OHV use corridors, there would be no additional DD produced because OHV use is not allowed. Existing DD would recover naturally over time. TSRC within the Crooked River Project Area (activity area) would likely increase cumulatively as OHV effects on soils (compaction on heavily travelled areas) are concentrated to areas within corridors where OHVs travel to park. These concentrations of use will become TSRC as soils are compacted from frequent use, resulting in long-term commitments of the soil resource. Additionally, all existing TSRC effects, both inside and outside of the designated corridors, will remain since TSRC does not recover naturally. Cumulatively, TSRC will meet the Forest Plan Standard in Alternatives B and C but will not meet the Forest Plan standard in Alternative A as increases in TSRC above the existing level (5.4%) is likely. The cumulative effects on CWD would be variable. Within the OHV use corridors, firewood cutting would likely increase and be concentrated as OHV use, and easy access to firewood, would no longer be allowed outside of the corridors. This would result in lower amounts of CWD within the OHV corridors –
Crooked River Vegetation Management Project 3-73
3.6 - Soil Resource
especially in the greater than 15 inch category – as downed logs and standing material that would become CWD is utilized for firewood. Outside of OHV corridors, the cumulative effect on CWD would be an increase in tonnage as less material – both downed and standing is utilized for firewwood.
Forest Plan Consistency The No Action alternative meets the Forest Plan standards for DD, CWD, and TSRC as trends toward the standard or desired condition are required only when management activities are implemented. Both action alternatives (Alternatives B and C) meet the Forest Plan standards and guidelines for DD, TSRC, and CWD as activity areas meet or trend toward the Forest Plan standard or the desired condition. Standards and guidelines are achieved through the combination of implementing Forest Plan direction, developing specific design features and prescriptions, and applying site specific mitigation measures. Detrimental Disturbance For the action alternatives, existing levels of DD will continue to recover naturally and DD standards will be met for all activity areas through the implementation of the mitigation measures described in Chapter 2. Reductions in DD would be achieved through the implementation of management requirements, BMPs, burning prescriptions, and specifically designed mitigation measures that restrict heavy equipment operations. These measures would result in very little chance for additional DD to be produced. Additionally, by obliterating all the of the skidtrails and landings utilized with the proposed activities as well as areas that are visually compacted or displaced from past activities, DD levels will be reduced from the current condition in all action alternatives. Total Soil Resource Commitment For the No Action Alternative, TSRC remains at 5.4%. For both of the action alternatives, the Forest Plan standard will be met through net reductions in the amount of TSRC. The existing level of 5.4% TSRC for the project area will be reduced to 5.0% through the net decrease of 24.6 acres in Alternative B, and will be reduced to 4.9% through the net decrease of 31.9 acres in Alternative C. Coarse Woody Debris The No Action alternative will retain existing quantities of CWD within activity areas in the short-term while fluctuations through natural events (tree mortality, blowdown, fires, etc.) are expected over the longer term. The action alternatives (B and C) will immediately place CWD within each activity area at (or trending toward) levels that are within the desired range for the activity area PVG(s). See Appendix D for Applicable Forest Plan Standards and Guidelines for this project.
Irreversible and Irretrievable Commitments None of the alternatives will create irreversible commitments of soil productivity. Total Soil Resource Commitments (TSRC) are considered to be irretrievable losses of soil productivity until the time when physical measures are taken to restore the productivity and hydrologic function of the soil. The obliteration and decommissioning of roads, landings, and skidtrails are examples of restoring soil productivity/hydrologic function and reducing the amount of irretrievable loss of soil productivity. The No Action Alternative maintains the existing condition of 353.7 acres of irretrievably committed soil productivity. No additional areas are added and no additional areas are restored. The action alternatives result in a net reduction in the acreage of irretrievably committed soil productivity (TSRC) – at least 24.6 acres in Alternative B and 31.9 acres in Alternatives C. These net reductions are the result of road decommissioning.
Crooked River Vegetation Management Project 3-74
3.6 - Soil Resource
Crooked River Vegetation Management Project 3-75
Project Record This Environmental Analysis hereby incorporates by reference the Soil Resources Specialist Report in the Project Record (40 CFR 1502.21). The Soil Resources Specialist Report contains the detailed data, methodologies, analysis, references, and other technical documentation used in the assessment.

3.7 - Other Disclosures
3.7 Other Disclosures
Forest Plan Consistency The proposed action and alternatives are consistent with Forest Plan direction. Compliance with Forest-wide direction (standards & guidelines) applicable to this project is documented in each resource effects section and in a Forest Plan Activity Table located in the project record.
Irreversible and Irretrievable Commitments Discussion of irreversible and irretrievable commitments is included in each resource effects section. The proposed action and alternatives are not anticipated to result in the irreversible commitment of any resource. Irretrievable resource commitments are limited to restoration of previously committed soil resources to a TSRC condition. All action alternatives would result in a reduction in the level of irretrievably committed soils through reclamation associated with road decommissioning and restoration of existing landings and skid trails. No other irretrievable commitments of resources are expected.
Conflicts with Other Agency Goals and Objectives Public involvement and consultation with other federal and state agencies indicate there are no conflicts between the proposed activities in the Crooked River Vegetation Management Project and the goals and objectives developed for other governmental entities.
Legal and Regulatory Requirements This EA adheres to the following applicable legal and regulatory requirements and coordination, and contains disclosures of effects that are required by federal law, regulation, policy, or precedent.
National Forest Management Act (NFMA) of 1976 This Act guides development and revision of National Forest Land Management Plans. NFMA has several provisions, including preparation requirements for timber sale contracts and maintenance of biodiversity. All action alternatives were developed to comply with NFMA and its implementing regulations. The Forest Plan complies with all resource integration and management requirements of NFMA (36 CFR 219). Application of Forest Plan direction for the Crooked River Vegetation Management Project ensures compliance at the project level. Each resource section in Chapter 3 addresses Forest Plan consistency.
The National Environmental Policy Act (NEPA) of 1969, as amended The purposes of this Act are “To declare a national policy which will encourage productive and enjoyable harmony between man and his environment, to promote efforts which will prevent or eliminate damage to the environment and biosphere and stimulate the health and welfare of man; to enrich the understanding of the ecological systems and natural resources important to the Nation; and to establish a Council on Environmental Quality” (42 U.S.C. Sec. 4321). The law further states “..it is the continuing policy of the Federal Government, in cooperation with State and local governments, and other concerned public and private organizations, to use all practicable means and measures, including financial and technical assistance, in a manner calculated to foster and promote the general welfare, to create and maintain conditions under which man and nature can exist in productive harmony, and fulfill the social, economic, and other requirements of present and future generations of Americans” [42 U.S.C. Sec 4331(a)]. NEPA establishes the format and content requirements of environmental analysis and documentation, such as this Crooked River Vegetation Management Project Environmental Assessment. The process used in developing the Crooked River Vegetation Management Project proposal, public involvement efforts and subsequent preparation of this environmental document fully complies with NEPA.
Executive Order 12875 Executive Order 12875 clarifies government-to-government relations with American Indian governments. In accordance with this order existing tribal involvement processes with the Shoshone-Paiute, Shoshone-Bannock and Nez Perce Tribes were followed. Chapter 4 provides a description of American Indian tribal involvement and consultation completed for the Crooked River Vegetation Management Project.
Crooked River Vegetation Management Project 3-76
3.7 - Other Disclosures
Executive Order 12898 – Environmental Justice Executive Order 12898 directs each federal agency to make achieving environmental justice part of its mission by identifying and addressing, as appropriate, disproportionately high and adverse human health or environmental effects of its programs, policies, and activities on minority and low-income populations. On March 24, 1995, the Department of Agriculture completed an implementation strategy for the executive order. Forest Service proposals with the potential to adversely affect minority or low-income populations disproportionately, must consider and disclose (and mitigated to the degree possible) these effects through NEPA analysis and documentation. None of the Crooked River Vegetation Management Project alternative proposals are expected to disproportionately effect minority or low income populations.
Effects on the Human Environment (Civil Rights and Environmental Justice) Counties within the Payette NF consist of 93% White, 5% Hispanic, 2% American Indian and less than 1% combined Black, Asian and Pacific Islander (Idaho Bureau of Census 2000). None of the alternatives in the Crooked River Vegetation Management Project are expected to have disparate impacts on ethnic minorities, disabled people or low income groups. Specific uses of the lands in the Crooked River Vegetation Management Project Area by these groups are unknown, but assumed to be similar to other Forest user groups. Refer to Chapter 1 of this document for discussion of effects on recreation. Traditional American Indian reserved hunting, gathering and fishing rights or existing treaty rights would not be affected. Refer to Chapter 4 of this document for a discussion of Tribal consultation. Forestry work associated with harvest and prescribed fire activities has the potential to provide economic benefit to Hispanic and low income groups often associated with this type of employment.
Executive Order 12962 - Recreational Fishing Executive Order 12962 mandates disclosure of effects to recreational fishing. The effects to fish habitat from the project are expected to be so small that direct effects on fish productivity and the quality of the recreational fishery would be negligible.
Energy Requirements and Conservation Potential Alternatives with the greatest roadwork and use of heavy equipment would have the least energy conservation potential. In this sense the no action alternative has the greatest energy conservation potential followed by Alternative C and B respectively. In terms of petroleum products, the energy required to implement any of the action alternatives is considered negligible when compared to national or global use and production.
Natural or Depletable Minerals The Crooked River Vegetation Management Project and connected activities would not affect natural or depletable minerals within or adjacent to the project area since no development or extraction of any natural or depletable minerals is proposed.
Prime Farm Land, Rangeland, and Forest Land All alternatives are in accordance with the Secretary of Agriculture Memorandum 1827 for prime farmland, rangeland, and forest land. The project area does not contain prime farmland or rangeland. “Prime” forest land is a term used only for non-federal land, which would not be affected by proposed activities. Whichever alternative is selected for implementation, National Forest System lands would be managed with sensitivity to adjacent private and public lands. Short-Term Uses of the Human Environment and the Maintenance of Long-Term Productivity Short-term uses are those that generally occur on a yearly basis, such as livestock grazing as a use of the forage resource or timber harvest as a use of the wood resource. Long-term productivity refers to the capability of the land to provide market outputs and amenity values for future decades. The quality of life for future generations is linked to the capability of the land to maintain its productivity. Rangeland within the project area would be affected by prescribed fire with decreased forage immediately following burning followed by improved conditions as grasses and forbs re-sprout. For this proposed project, project design, management requirement, and mitigation measures built into the action
Crooked River Vegetation Management Project 3-77
3.7 - Other Disclosures
alternatives ensure that long-term productivity would not be impaired by the application of short-term management practices.
The Endangered Species Act of 1973 This required disclosure involves wildlife, plant, fish, and habitat listed under the Endangered Species Act of 1973, as amended. Effects to species listed as threatened, endangered, proposed and regionally sensitive are disclosed in Chapter 1 for Botanical Resources and in this chapter Section 3.5 for Fisheries Resource and Section 3.3 for Wildlife Resource. Biological evaluations (BE) and biological assessments (BA) will be prepared and consultation with regulatory agencies has been completed as required. The BE and BA documents will be located in the project record. The Wildlife BA and BE and Columbia River bull trout BA and BE for this project will be prepared in accordance with Joint Counterpart Endangered Species (Section 7) Consultations Regulations, which established an Alternative Consultation Agreement between the Forest Service and both the National Marine Fisheries Service and the US Fish and Wildlife Service. Counterpart Regulations complement the general consultations regulations and specifically support projects conducted under the National Fire Plan.
Unavoidable Adverse Environmental Impacts Proposed activities would likely produce adverse effects on some components of the environment that cannot be avoided. Actions that benefit one component can have at least temporary adverse effects on another. Potential adverse effects are documented by resource in Chapter 3 and as part of specialist reports included in the project record. The alternatives meet Forest Plan direction and include mitigation measures to avoid or reduce adverse environmental effects. Monitoring Plans have been designed to measure effectiveness of the management requirements and mitigation measures in reducing adverse effects.
Wetlands and Floodplains No wetlands or floodplains would be permanently filled under any alternative. Protection of floodplains and wetlands would be provided through the application of RCA buffers and other incorporated design features and mitigation measures listed in Chapter 2. All alternative include improvements to existing stream crossings through surfacing of roads to reduce sediment inputs. Any culverts replaced would provide stream simulation and aquatic organism passage. Alternative B would include removing culverts on system roads slated to be put into storage. All alternatives include rehabilitation of RCA through road decommissioning resulting in reduced impacts to floodplains (See Fisheries Effects Section). These activities are permitted under the Army Corps of Engineers Nationwide Permits section 330.5(a). Because of the stated project design and mitigation no floodplains or wetlands would be permanently altered and the goal and intent if Executive Orders 11988 (Floodplain Management) and 11990 (Protection of Wetlands) would be fully met.
The Migratory Bird Treaty Act of 1918 The purposes of this Act are to establish an international framework for the protection and conservation of migratory birds (all wild species of ducks, geese, brants, coots, gallinules, rails, snipes, woodcocks, crows, and mourning and white-winged doves). The Act makes it illegal, unless permitted by regulations to “pursue, hunt, take, capture, purchase, deliver for shipment, ship, cause to be carried by any means whatever, receive for shipment, transportation or carriage, or export, at any time, or in any manner, any migratory bird, included in this Convention…for the protection of migratory birds…or any part, nest, or egg of any such bird” (16 USC 703). The original 1918 statute implemented the 1916 Convention between the United States and Great Britain (for Canada). Later amendments implemented treaties between the United States and Mexico, Japan, and the Soviet Union (now Russia). Proposed activities are not expected to effect migratory birds (Chapter 3, Wildlife Section and Wildlife Specialist Report). Responsibilities of Federal Agencies to Protect Migratory Birds [Executive Order 13186] The environmental analyses of federal actions are to evaluate the effects of actions and agency plans on migratory birds, with emphasis on species of concern. There are no interagency determination calls to be made for migratory birds as with federally listed species.
Crooked River Vegetation Management Project 3-78
3.7 - Other Disclosures
This information is reviewed with the U.S. Fish and Wildlife Service, but there is no mechanism in place for that agency to consult on project effects. The analysis of effects from this project on migratory birds is included in the Wildlife BA, BE, and Wildlife Specialist Report in the project record.
The Clean Water Act, as amended in 1977 and 1982 The primary objective of this Act is to restore and maintain the integrity of the nation’s waters. This objective translates into two fundamental national goals: 1. Eliminate the discharge of pollutants into the nation’s waters; and 2. Achieve water quality levels that are fishable and swimable. This Act establishes a non-degradation policy for all federally proposed projects. Proposed activities have been evaluated for consistency with the Clean Water Act and associated State of Idaho Anti-degradation policy and determined to be fully consistent (Water Specialist Report, Clean Water Act Federal Consistency Checklist) The Wildhorse River is a 303(d) listed stream (temperature impaired). While Crooked River, Bear Creek, and Lick Creek (its major tributaries) are not individually listed, the Wildhorse River Subbasin Assessment and Total Maximum Daily Load (SBA and TMDL) takes these streams into account as contributing to temperature loading in Wildhorse River (IDEQ 2007). Beneficial uses for Crooked River and other tributaries in the Wildhorse watershed have been designated by the state to include Cold Water Aquatic Life, Salmonid Spawning, and Primary Contact Recreation. Application of project design features, mitigation measures and best management practices is expected to maintain current levels of stream shade and designated beneficial uses within and downstream of the project area. These measures exceed practices required by the State of Idaho Forest Practices Act and related anti-degradation policy. Action alternatives of the proposed Crooked River Vegetation Management Project are expected to further degrade nutrients, or temperature, and are expected to reduce long term sediment inputs because of mitigations applied to the road network (road surface improvements, road decommissioning).
The Clean Air Act, as amended in 1990 The purposes of this Act are”…to protect and enhance the quality of the Nation’s air resources so as to promote the public health and welfare and the productive capacity of its population; to initiate and accelerate a national research and development program to achieve the prevention and control of air pollution; to provide technical and financial assistance to State and local governments in connection with the development and execution of their air pollution prevention and control programs; and to encourage and assist the development and operation of regional air pollution prevention and control programs.” Disclosure of compliance with the Clean Air Act is addressed in Chapter 1, Issues Not Analyzed in Detail, Air Quality.
Federal Noxious Weed Act of 1974 This act provides for the control and management of non-indigenous weeds that injure or have the potential to injure the interests of agriculture and commerce, wildlife resources, or the public health. Noxious weed treatment in the area is covered by the 1987 Payette National Forest Noxious Weed and Poisonous Plant Control Program Environmental Assessment and Decision Notice and any treatments would be conducted according to federal and state law. Noxious weeds are addressed in Chapter 1, Rangeland Resource, and Chapter 2, Table 2-5, Mitigation Measures.
The Idaho Forest Practices Act The Idaho Forest Practices Act states under Title and Scope: “These rules constitute the minimum standards for conduct of forest practices on forest land and describe administrative procedures necessary to implement those standards.” The Anti-degradation Policy at 40 CFR 131.12(a) stipulates, “The State shall develop and adopt a statewide anti-degradation policy and identify the methods for implementing such policy…” The Idaho Forest Practices Act is the primary method for implementing the anti-degradation policy. Site-specific design features, mitigation measures and Forest Plan standards and guidelines applicable to this project exceed the requirements of the Idaho Forest Practices Act.
Crooked River Vegetation Management Project 3-79
3.7 - Other Disclosures
Crooked River Vegetation Management Project 3-80
Natural or Depletable Resources Requirements and Conservation Potential The Crooked River Vegetation Management Project has been designed to conform to applicable laws and regulations pertaining to natural or depletable resources, including minerals and energy resources. The Crooked River Vegetation Management Project does not propose any activities related to mineral or energy resources. Regulations of mineral and energy activities on the National Forest, under the U.S. Mining Laws Act of 1872 and the Mineral Leasing Act of 1920, are shared with the Bureau of Land Management.