Embed Size (px)
Citation preview
3-5 Equations, Tables, and Graphs
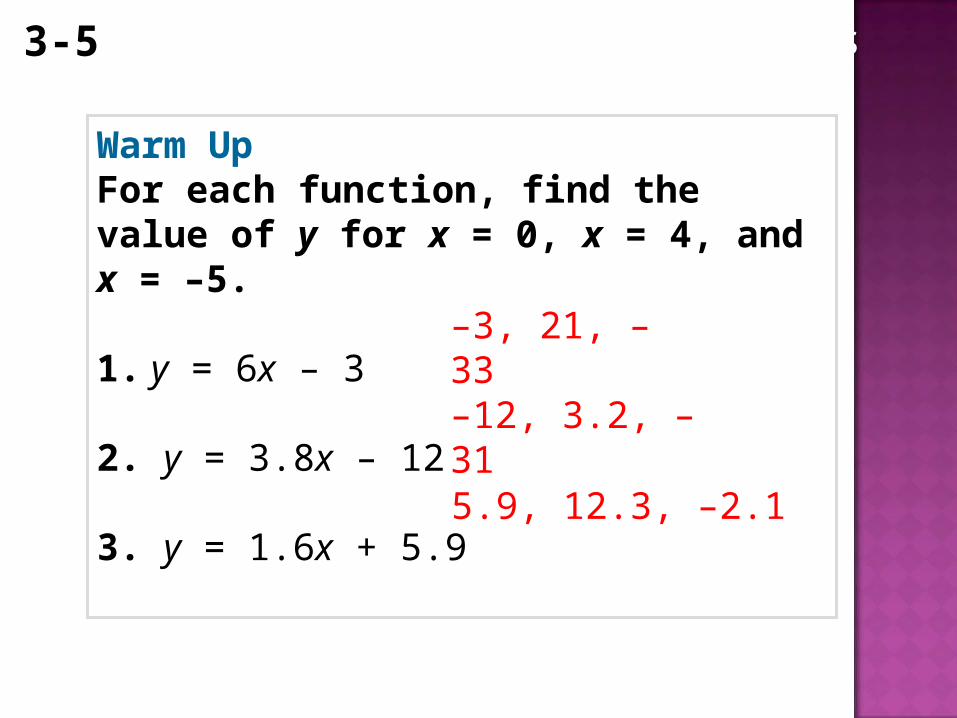
Warm UpFor each function, find the value of y for x = 0, x = 4, and x = –5.
1. y = 6x – 3
2. y = 3.8x – 12
3. y = 1.6x + 5.9
–3, 21, –33
–12, 3.2, –31
5.9, 12.3, –2.1

3-5 Equations, Tables, and Graphs
Learn to generate different representations of the same data.

3-5 Equations, Tables, and Graphs
An equation shows how the variables are related.
Additional Example 1: Using Equations to Generate Different Representations of Data
The height h of an airplane s seconds from take-off is h = 12s. Make a table and sketch a graph of the equation.
Equation
h = 12s
The number of seconds s is the input value. The depth d is the output value.
Helpful Hint

3-5 Equations, Tables, and Graphs
A table identifies values that make the function true.
Additional Example 1 Continued
242
363
121
00
hs
Table

3-5 Equations, Tables, and Graphs
Additional Example 1 Continued
h 50
40
30
20
10
0 1 2 3 4 5 s
A graph is a visual image of the values in the table. In this case, the graph is continuous, so draw a line through the points.
Graph

3-5 Equations, Tables, and Graphs
An equation shows how the variables are related.
Check It Out: Example 1
The height h of a helicopter s seconds from take-off is h = 15s. Make a table and sketch a graph of the equation.
Equation
h = 15s

3-5 Equations, Tables, and Graphs
A table identifies values that make the function true.
Check It Out: Example 1 Continued
453
302
604
151
00
hs
Table

3-5 Equations, Tables, and Graphs
Check It Out: Example 1 Continued
h 75
60
45
30
15
0 1 2 3 4 5 s
Graph
A graph is a visual image of the values in the table. In this case, the graph is continuous, so draw a line through the points.
3-5 Equations, Tables, and Graphs
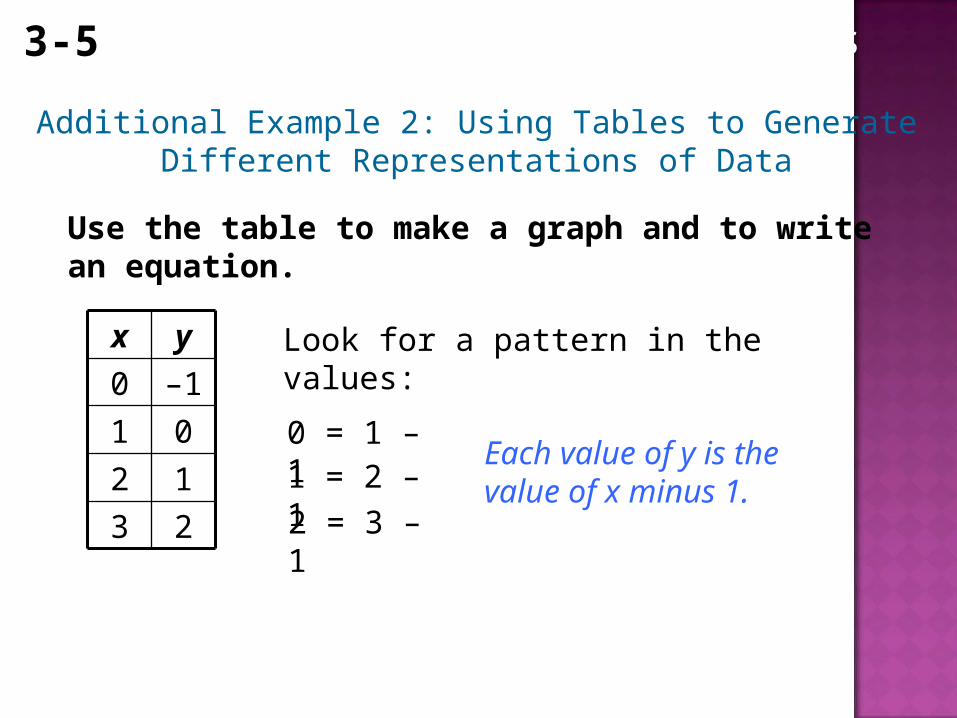
Use the table to make a graph and to write an equation.
Additional Example 2: Using Tables to Generate Different Representations of Data
Look for a pattern in the values:
12
23
01
–10
yx
Each value of y is the value of x minus 1.
0 = 1 – 11 = 2 – 12 = 3 – 1

3-5 Equations, Tables, and Graphs
Use the table to make a graph and to write an equation.
Additional Example 2 Continued
12
23
01
–10
yx
x
y
0–2–4 2 4
2
4
–2
–4
y = x – 1
3-5 Equations, Tables, and Graphs
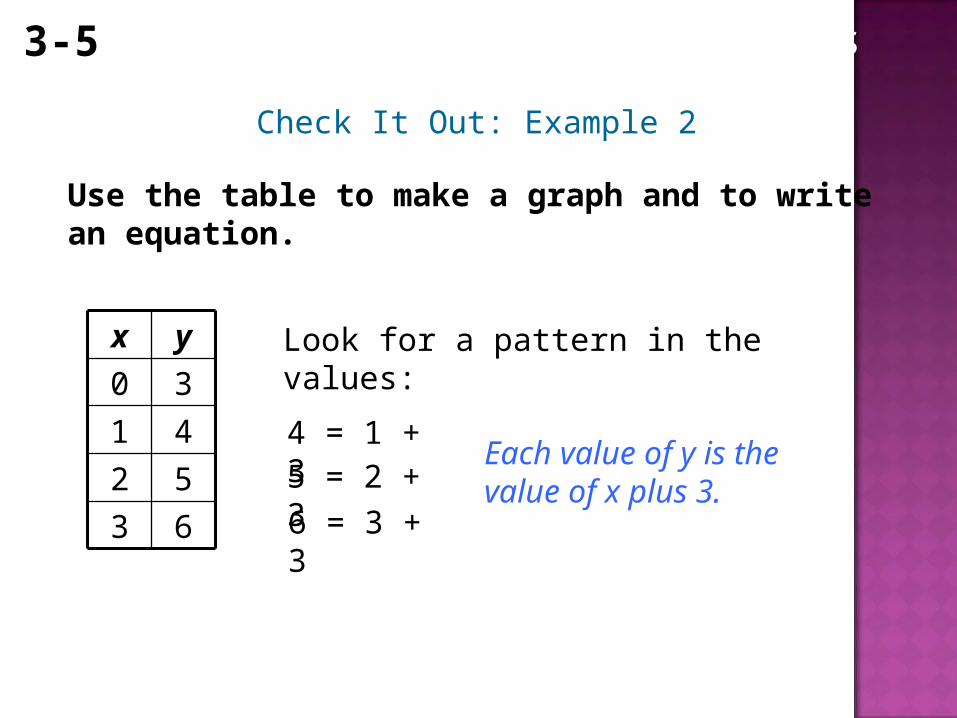
Use the table to make a graph and to write an equation.
Check It Out: Example 2
Look for a pattern in the values:
52
63
41
30
yx
Each value of y is the value of x plus 3.
4 = 1 + 35 = 2 + 36 = 3 + 3
3-5 Equations, Tables, and Graphs
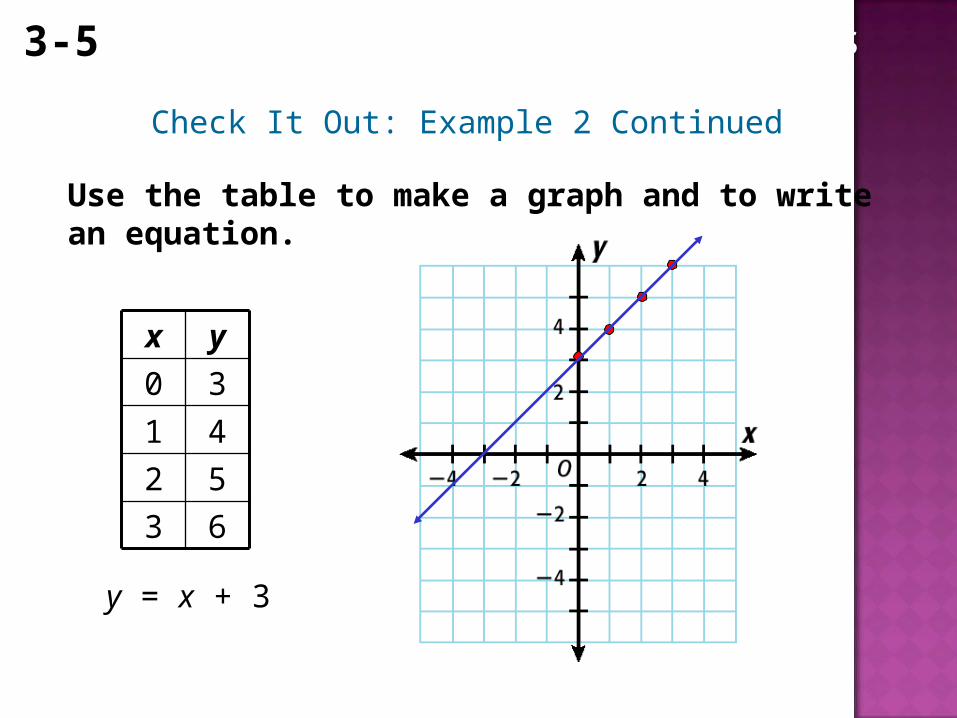
Use the table to make a graph and to write an equation.
Check It Out: Example 2 Continued
52
63
41
30
yx
y = x + 3
3-5 Equations, Tables, and Graphs
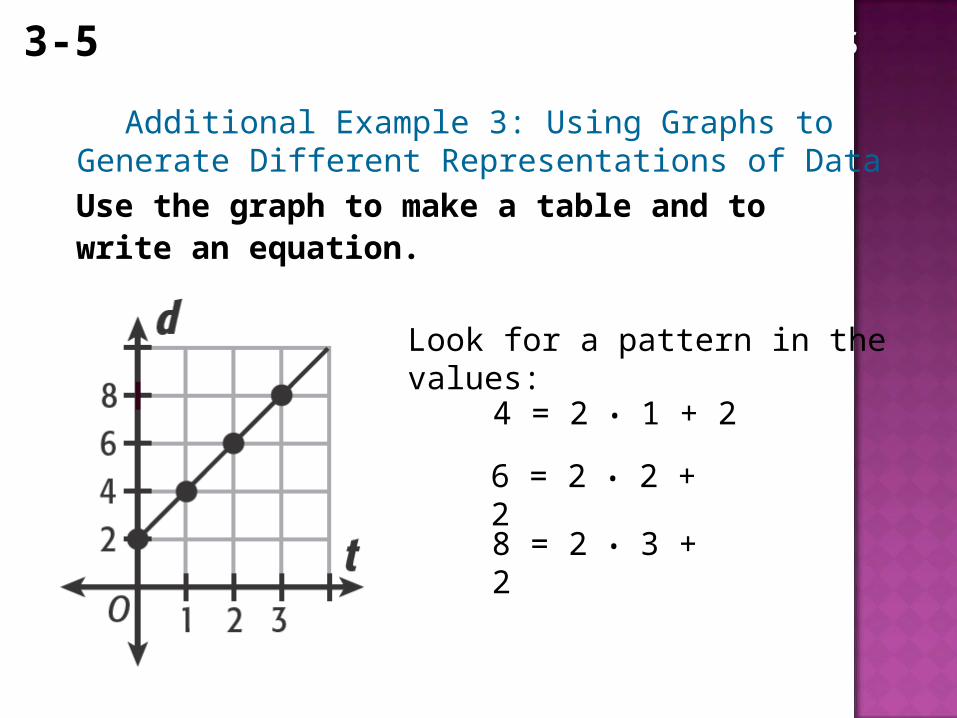
Additional Example 3: Using Graphs to Generate Different Representations of Data
Use the graph to make a table and to write an equation.
Look for a pattern in the values:
4 = 2 • 1 + 2
6 = 2 • 2 + 2
8 = 2 • 3 + 2
3-5 Equations, Tables, and Graphs
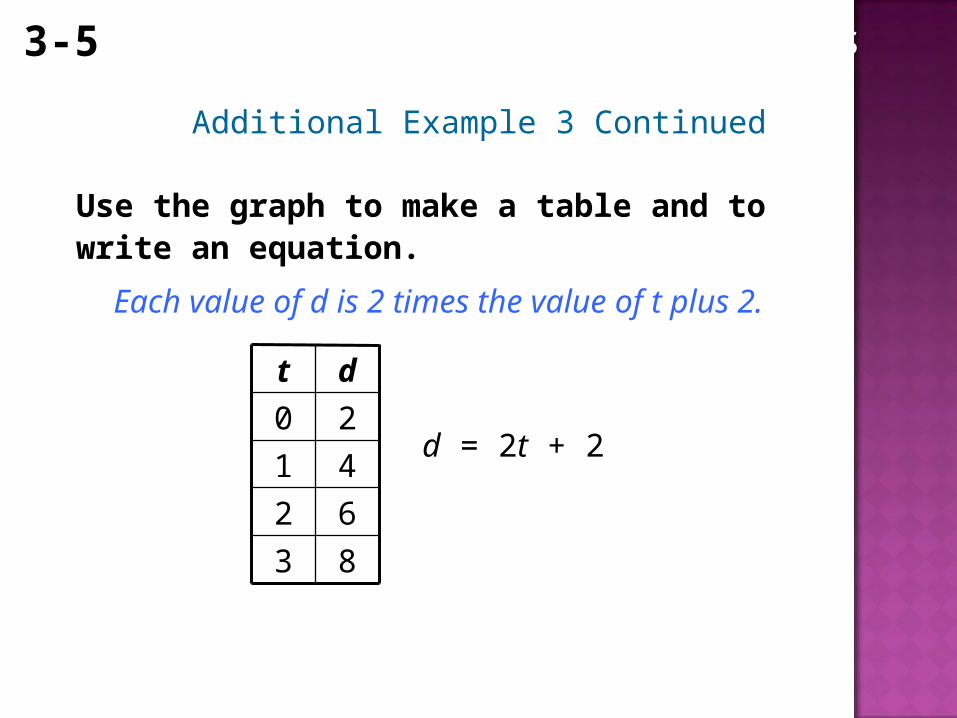
Additional Example 3 Continued
Use the graph to make a table and to write an equation.
62
83
41
20
dt
Each value of d is 2 times the value of t plus 2.
d = 2t + 2
3-5 Equations, Tables, and Graphs
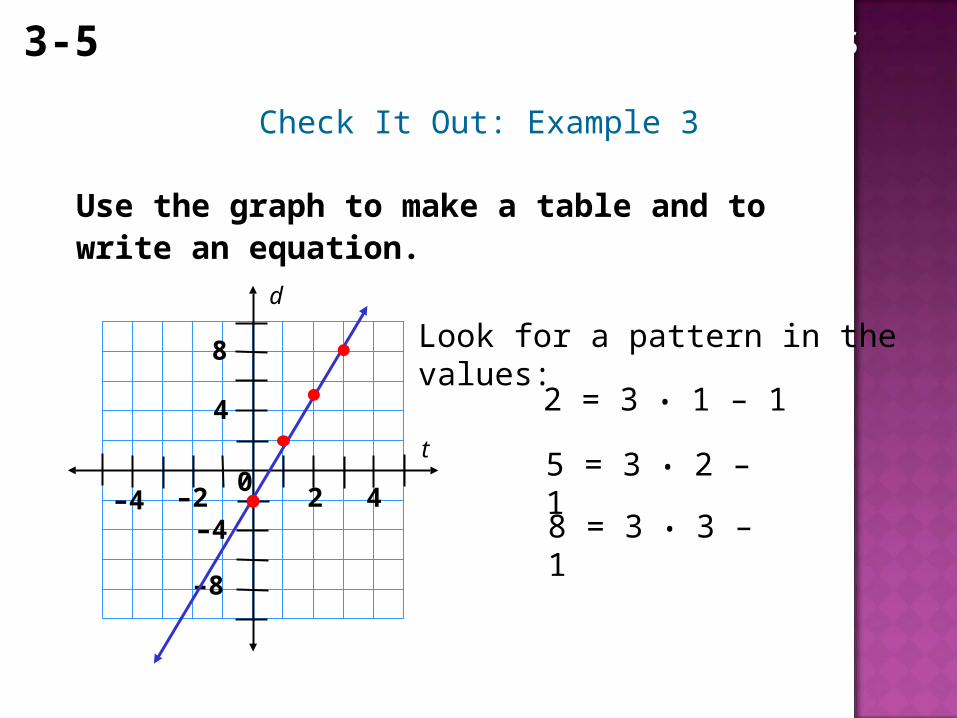
Check It Out: Example 3
Use the graph to make a table and to write an equation.
t
d
0–2–4 2 4
4
8
–4
–8
Look for a pattern in the values:
2 = 3 • 1 – 1
5 = 3 • 2 – 1
8 = 3 • 3 – 1
3-5 Equations, Tables, and Graphs
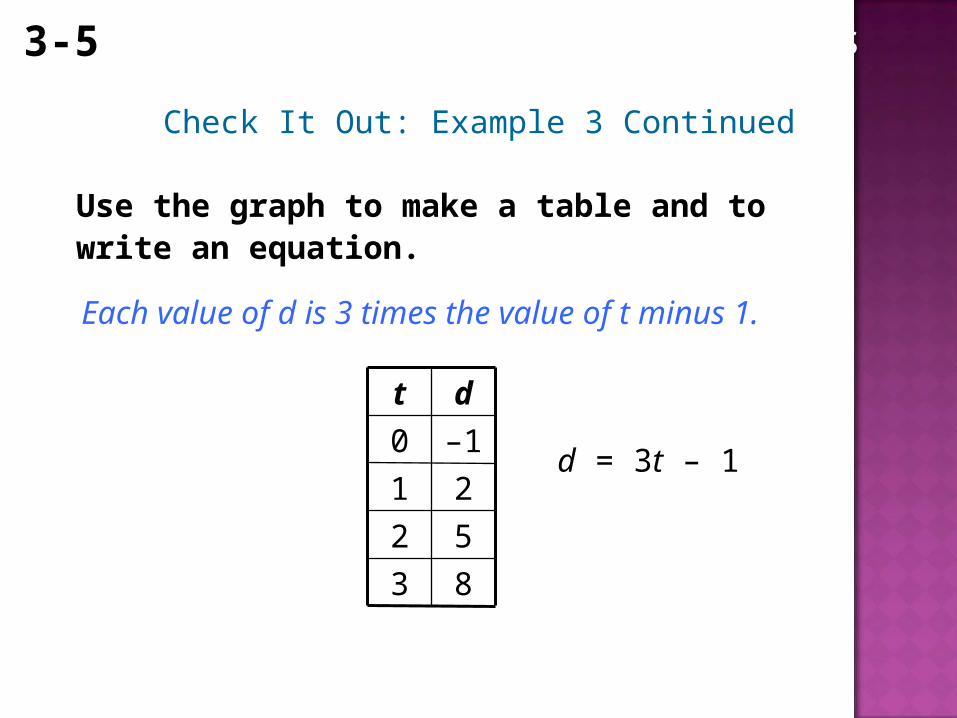
Check It Out: Example 3 Continued
Use the graph to make a table and to write an equation.
52
83
21
–10
dt
Each value of d is 3 times the value of t minus 1.
d = 3t – 1

3-5 Equations, Tables, and Graphs
Standard Lesson Quiz
Lesson Quizzes
Lesson Quiz for Student Response Systems
3-5 Equations, Tables, and Graphs
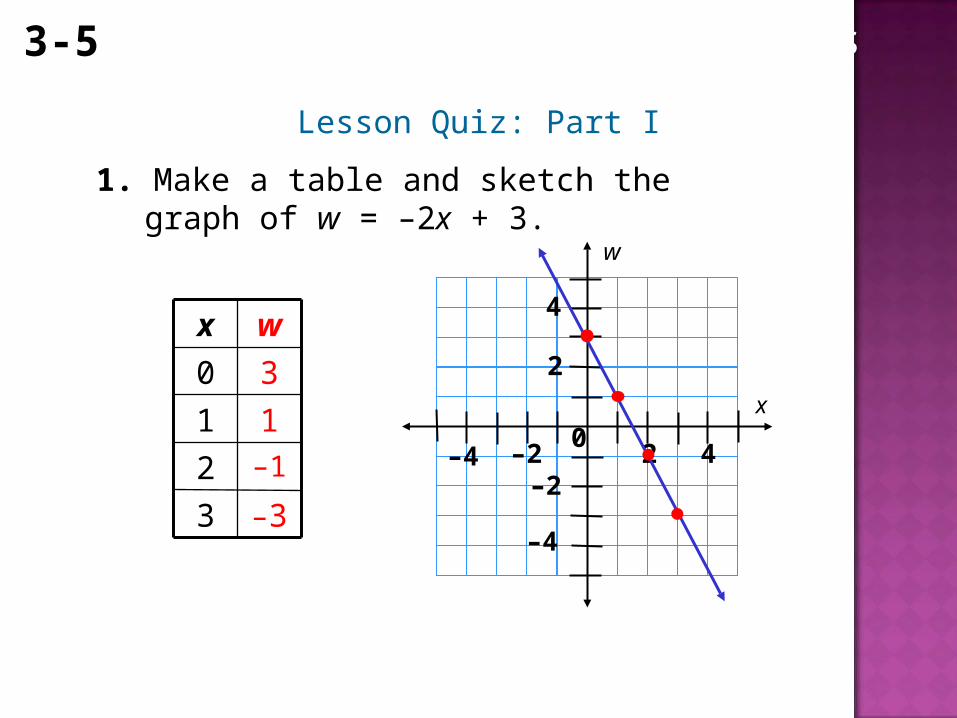
1. Make a table and sketch the graph of w = –2x + 3.
Lesson Quiz: Part I
–12
–33
11
30
wx
x
w
0–2–4 2 4
2
4
–2
–4
3-5 Equations, Tables, and Graphs
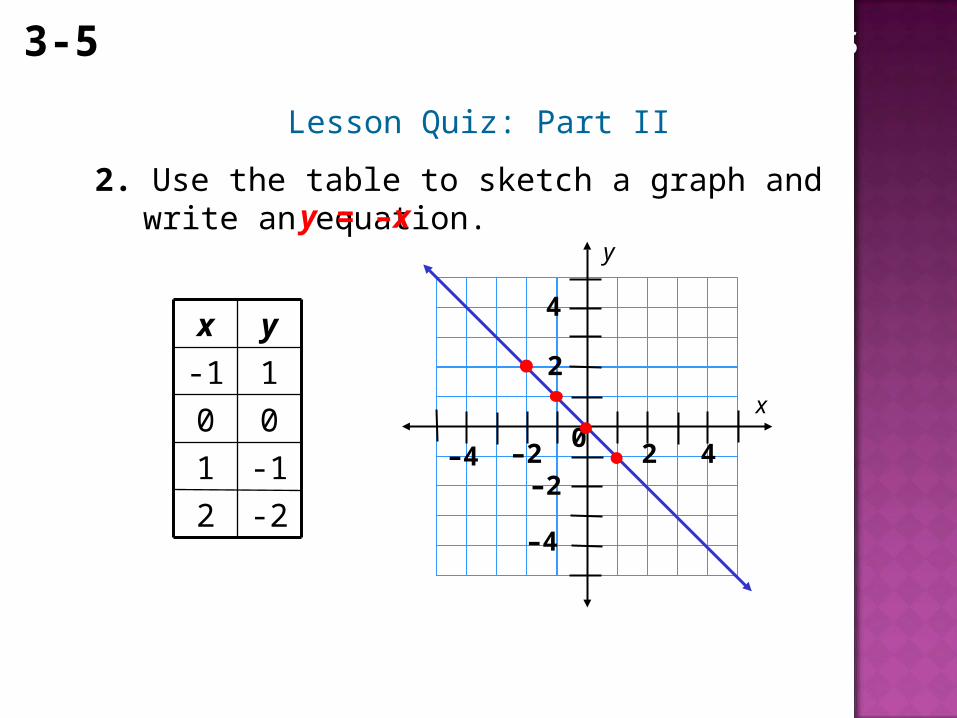
2. Use the table to sketch a graph and write an equation.
Lesson Quiz: Part II
-11
-22
00
1-1
yx
x
y
0–2–4 2 4
2
4
–2
–4
y = –x

3-5 Equations, Tables, and Graphs
3. Use the graph to make a table and to write an equation.
Lesson Quiz: Part III
52
73
31
10
yx
y = 2x + 1
3-5 Equations, Tables, and Graphs
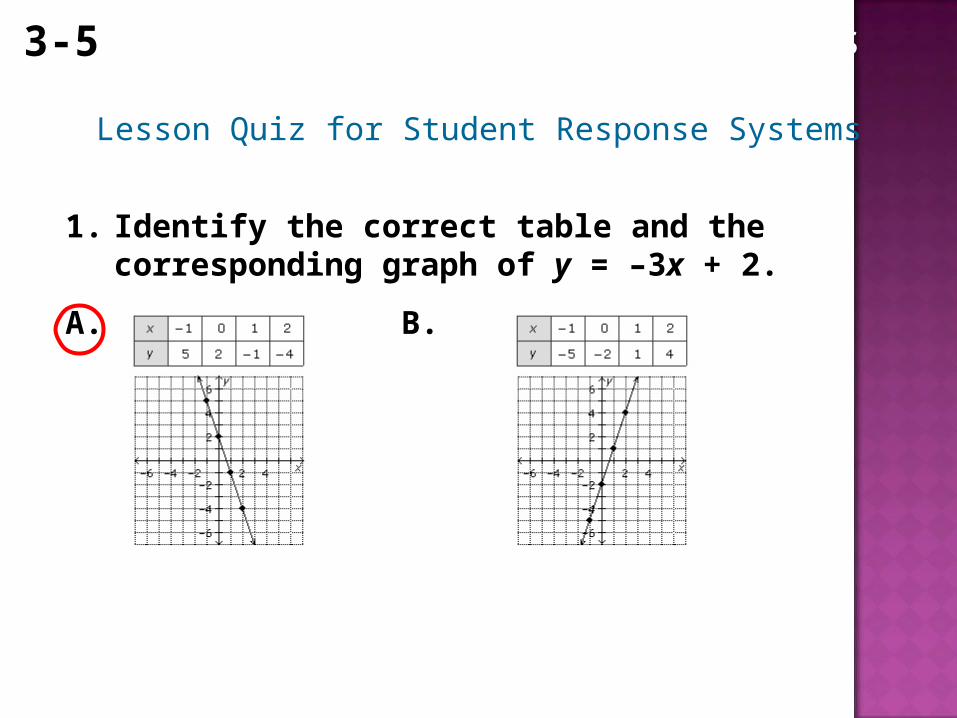
1. Identify the correct table and the corresponding graph of y = –3x + 2.
A. B.
Lesson Quiz for Student Response Systems

3-5 Equations, Tables, and Graphs
2. Use the table to identify the graph and the equation.
A. y = 2x B. y = –2x
Lesson Quiz for Student Response Systems

3-5 Equations, Tables, and Graphs
3. Use the graph to identify the table and the equation.
A. y = 2x + 1 B. y = 2x – 1
Lesson Quiz for Student Response Systems


![Aarneel Profile Updated as on13.09 · Á Á Á X v o X } u &203$1< 352),/( ,1'(; ä ¾ / v } µ ] } v } µ h Y Y X Y Y Y Y Y Y Y Y Y Y Y Y X X í r î](https://img.pdfslide.us/doc/110x75/5f063de37e708231d417018e/aarneel-profile-updated-as-on1309-x-v-o-x-u-2031-352-1.jpg)


![> plot(cos(x) + sin(x), x=0..Pi); plot(tan(x), x=-Pi..Pi ... · > plot3d({sin(x*y), x + 2*y},x=-Pi..Pi,y=-Pi..Pi); ↵ c1:= [cos(x)-2*cos(0.4*y),sin(x)-2*sin(0.4*y),y]: ↵ c2:= [cos(x)+2*cos(0.4*y),sin(x)+2*sin(0.4*y),y]:](https://img.pdfslide.us/doc/110x75/5e87f19cd4429b02985e2e8b/-plotcosx-sinx-x0pi-plottanx-x-pipi-plot3dsinxy.jpg)