Embed Size (px)
Citation preview

AD-AG'4 135 TRNIY COLL DUBLIN (IRELAND) SCHOOL OF ENGINEERING F/G 13/2ENVIRONMENTAL AND OTHER CRITERIA AND METHODS FOR PAVEM~ENT OES!G-ETC(U)UNCLASSIFIED FES 79 R A KIRAWAN, E R FARRELL, M L MAHER OA-ERO-76-G-065,2ffffffffffff

EN4VIRONMPENTAL AND, OTHER. j.WI NDTIDFOR
PAVEMENT DESIGN
by
R. W. Kirwan (Principat Investigator)
E. R. Farz'eZZ (Reaearch Graduate)
M. L. Maher (Research Graduate)
GRANTEE: University of Dublin,Engineering Schooll,Trinity College,Dublin.
EUROPEAN RESEARCH OFFICE &% LECTE
United States Army MAYB8
GRANT NO: DA-ERD-76-GO065
Approved for public relecesqI Distrib~ution unliriited
FINAL TECHNICAL DE&PORT
Octob~r 1976 -Decezber 1978
B-. 0 5 7 09 (
I - - .IMMENSE'

SECURITY CLASSIFICATION OF THIS PAGE (Vte, Date Entered)
REAID INMTUCTMOSREPORT DOCUMENTATION PAGE BEFORE COMPLETD1G FORM
I. REPORT NUMBER 2. GOVT ACCESSION NO RECIPIENT'S CATALOG NUMBER
4. TITLE (mid Si~tle) - - .---- **--
Environmental and Other Criteria and Methods for' Linal ,chnical eOW
LP Pavement Design* / 076 2DEC 078.
AUTH O~ wmm ujuj
W./Kirwa E. M.DI 76-Gd6 5
SPEFRIGOGNZTONAEAND ADDRESS 10. PROGRAM ELEMENT. PROJECT. TASKAREA & WORK UNIT NUMBERS
Engineering School I
Trinity College, Dublin 2lII. CONTROLLING OFFICE NAME AND ADDRESS 12. REPORT DATE
U. S. Army Research & Standardization Group (EUR eb 479 /
P. 0. Box 65 FPO --5. N FES
New York, New York 09510 15314. MONITORING AGENCY NAME & ADDRESS(if diferent frao Controlling Office) IS. SECURITY CLASS. (of the report)
Unclassified
Isa. DECL ASSI FICATION/DOWNGRADINGSCHEDULE
IS. DISTRIBUTION STATEMENT (o1 this Report)
Unrestricted ." - T:y7 A
17. DISTRIBUTION STATEMENT (of the abstract entered in Block 20, It different frogn Report)
IS. SUPPLEMENTARY NOTES
19. KEY WORDS (Continue an revereo aide #i necessary and identify by black number)
Flexible pavement, pavement design, soil mechanics, environmnetal factors,
)pavement simulation, rational design, cyclic loading, pavement deflection,
subgrade characterization, loading test apparatus, pore pressures, stress
dependence, resilent modulus.
ft AIr'AACT (Cmi an t,ewwa Ob If lmgeem and identi by block number)
Results of an extensive series of repeated load triaxial test on Dublin Brownglacial till are reported. Charts are presented relating the relevant parameters
of the till to dry density and moisture content. The effect of stress history is
studied. The results indicate that modifications are required to the Kirwan-
naith nomograph and suggest that the subgrade strain design criterion should
ary with the stiffness of the soil. A recently developed low cost pneumatic
repeated loading test apparatus is described. Skempton's A and B pore para-
meters have been used to interpret the response of samples under repeated loadinDO IM EDTON OF I NOV 6IlI OBSOLETE
ACUI Unclassified

SIrCURITY CLAIUIFICATION OF T1iS PAOG(1bh, Data Batetero
FA method of determining a stress-dependent resilient modulus by prepared charts
from in situ tests on a subgrade is described. Results of laboratory pavementsimulator tests on subgrade are compared with those obtained on undisturbedsamples and with these results of the repeated loading, testing program.Modifications to DEFPAV which are required in order to include horizontallylayered anisotropy are described. Initial results from a testing program toinvestigate the properties effecting the behaviour of natural gravels in roadpavements are presented. Two computer subroutines for optimisation of roadpavement design are described.
-'4
t
D i C,ICRT CLSIIAIO FTI PGrtf Dt ned

ENVIRONMENTAL AND OTHER CRITERIA AND METHODS
FOR
PAVEMENT DESIGN
by
R. W. Kirwan (Principal Investigator)
E. R. Farrell (Research Graduate)
M. L. Maher (Research Graduate)
GRANTEE: University of Dublin,Engineering School,Trinity College,Dublin.
EUROPEAN RESEARCH OFFICE
*United States Army
GRANT NO: DA-ERO-76-G-065
FINAL TECHNICAL REPORT
October 1976 - December 1978
The research reported in this document has been made
possible through the support and sponsorship of the
United States Army through its European Research
Office. This Report is intended only for the internal
management use of the Contractor and the United States
Army.
February 1979
ii
II1' ?

ABSTRACT
Results of an extensive series of repeated load triaxial
tests on Dublin Brown Glacial Till are reported. Charts
are presented relating the relevant parameters of the
till to dry density and moisture content. The effect of
stress history is studied. The results indicate that
the Kirwan Snaith nomograph should be modified and
suggest that the subgrade strain design criterion should
vary with the stiffness of the soil.
A recently developed low cost pneumatic repeated loading
test apparatus is described.
Skempton's A and B pore pressure parameters have been
used to interpret the response of samples under repeated
loading.
A method of determining a stress dependent resilient
modulus using charts prepared from insitu tests on a
subgrade is described.
Results of Laboratory Pavement Simulator tests on a
subgrade material are compared with those obtained from
undisturbed samples tested under repeated loading conditions,
and also with those obtained from a nomograph prepared from
the tria~cial testing program.
. The modifications that were made to the computer program
2 DEFPAV to include horizontally layered anisotropy are
described.
Initial results from a testing programme to investigate the
properties affecting the behaviour of natural gravels in
road pavements are presented.
i

Two computer subroutines for optimisation of road
pavement design are described.
I
ii

TABLE OF CONTENTS
CHAPTER 1 INTRODUCTION PAGE I
CHAPTER 2 REPEATED LOADING APPARATUS PAGE 4
2.1 Introduction
2.2 New repeated loading testing rig
2.3 Load and Deflection measurements
2.4 Lateral deflection measurements
CHAPTER 3 REPEATED LOAD TRIAXIAL TESTS ON PAGE 16
GLACIAL TILL
3.1 Introduction
3.2 Testing procedures
3.3 Modulus of resilience
3.4 Effect of incremental and decrementalloading on the modulus of resilience
3.5 Permanent strain
3.6 Creep compliance
3.7 Subgrade strain criterion
3.8 Permanent strain and stress history
3.9 Permanent strain - Resilient strains
CHAPTER 4 STUDY OF THE EFFECTS OF DEGREE OF PAGE 41SATURATION ON RESILIENT MODULUS ANDPOISSONS RATIO USING A AND B PORE
PRESSURE PARAMETERS
CHAPTER 5 METHOD OF DETERMINING RESILIENT MODULI PAGE 4?
FROM DEFLECTION MEASUREMENTS IN TEST TANK
5.1 Introduction
5.2 Basis of Nomograph
5.3 Boundary effects and influence of PoissonsRatio
5.4 Application of the method in theinterpretation of some previously publishedresearch
5.5 Interpretation method for multi-layeredsystems
5.6 Summary
iii

CHAPTER 6 COMPARISON OF RESILIENT MODULUS PAG' 62DETERMINED FROM LABORATORY PAVEMENTSIMULATOR TESTS WITH THOSE OBTAINEDFROM TRIAXIAL TESTS AND FROM NOMOGRAPH
6.1 Introduction
6.2 Testing methods
6.3 Resilience Response
6.4 Permanent Deformation
6.5 Summary
CHAPTER 7 ANISOTROPIC VERSION OF DEFPAV PAGE ?7.
CHAPTER 8 GRAVEL PAVEMENT TESTS PAGE 87
8.1 Introduction
8.2 Pavement Simulator tests8.3 Interpretation of resilience response
by back analysis
CHAPTER 9 OPTIMISATION IN PAVEMENT DESIGN PAGE 101
9.1 Introduction
9.2 Routine SELPAV
9.3 Routine OPTPAV
REFERENCES PAGE IL7
ACKNOWLEDGEMENTS PAGE 133
APPENDIY
iv

CHAPTER 1
INTRODUCTION
This Final Technical Report for the two-year grant (Grant No.
DAERO-76-6-065) covers the research carried out during the
period September 1976 to December 1978.
This is a continuation of the work carried out by the
Pavement Research Group at Trinity College, Dublin, Ireland
during the past twelve years. It has previously been funded
by E.R.O., with five separate annual contracts, followed by
one three year Grant (No. DA-ERO-591-73-60017). Three Annual
Reports were provided for the latter grant, the last being
dated April 1976.
The object of the recent research has been to work towards a
simple and rational method of design for flexible pavements
by means of a better understanding of the behaviour of the
constituent materials, with possible verification in the field.
'An extensive series of triaxial tests was carried out on
Dublin glacial till in order to study its behaviour under
repeated loading, with particular emphasis on the variation
of the relevant properties with dry density and moisture
content. The effect of stress history was also studied. The
results of this work indicate that the nomograph proposed in
the Report of April 1975 requires certain modification.
It is also suggested that the resilient subgrade strain
criterion, which is frequently used to limit permanent
deformation in the subgrade, be varied with the stiffness
of the soil. Limited test results indicate that the permanent
deformation behaviour of a soil depends on the degree of strain
of the samples.
1

In order to carry out this program of triaxial tests a
simple low cost pneumatic repeated loading test apparatus
has been developed, along with a ram load cell and lateral
strain indicator.
Skempton's A and B pore pressure parameters have been used
to interpret the resilient vertical and lateral response of
a sample under repeated loading.
A method of determining the variation of resilient modulus
with stress level from an insitu test on a subgrade using
prepared charts is given.
Good comparison was obtained between the stress dependent
resilient modulus determined from the back analysis of
tests on a glacial till subgrade in the Laboratory Pavement
Simulator with that recorded in triaxial tests on undisturbed
samples and also with that interpolated from the chart
prepared from the triaxial testing programme.
The T.C.D. Finite Element Program has been modified to
include horizontally layered anisotropy.
The initial results of a series of repeated loading tests
on gravel pavements in the Laboratory Pavement Simulator
are reported.
The computer subroutines, SELPAV and OPTPAV, are presented
for optimisation in road pavement design. The former is
incorporated into the proposed design system DEFPAV and is
a modification of that described in our previous report.
The latter is an independent package which considers the
cost implications of a wide range of design alternatives,
including stage construction.
Attempts made to verify our design methods by monitoring the
performance of a section of the Stillorgan Dual Carriageway
outside Dublin were frustrated by vandalism, construction
difficulties and unsuitable equipment for the field use. It
2

is considered impracticable to get successful field
verification of our work with the present resources of
the Pavement Research Group. A proposal for funds for
this work has been sent to the European Economic Community
but no reply has been received to date.
ti
3

CHAPTER 2
REPEATED LOADING APPARATUS
2.1 Introduction
The initial series of repeated loading triaxial tests were
carried out on the mechanically operated rig described by
Glynn (1) but with the method of applying cell pressure
altered to the pneumatic/hydraulic system shown in Fig. 2.1.
*This alteration allowed a cyclic cell pressure to be
superimposed on a constant initial confining pressure. The
system was designed to allow a back pressure in a sample,
if required. The mechanical section of the apparatus has
been in use in Trinity College since 1967 and was beginning
to show its age. Considerable skill was required by the
operator to get the correct axial load and the permanent
deformation compensator required regular inspection.
Furthermore, the maximum axial stress which could be applied
to a 100mm diameter sample was limited to approximately
l2OkN/m 2 . It was therefore decided to develop and construct
a new twin cell repeated loading rig for the series of tests
required for our material characterisation program.
Barksdale (2) and others have shown that a passing wheel
applied an approximately sinusoidal or triangular type load
pulse to a subgrade element under a road pavement of duration
of the order of 0.2 - 0.4 secs. Apart from the rotation of
the axis of the principal stresses which occurs under a
passing wheel, the insitu stresses on a soil element can be
modelled in a triaxial cell by an axial stress pulse and a
confining cell pressure pulse of similar waveform and
duration superimposed on a static confining pressure which
represents the insitu overburden pressure. The load in a
triaxial cell must be applied without impact and completely
removed between load applications to allow the sample recover
for simulated rest periods.
A servo-controlled electro-hydraulic system would give the
required loading but was ruled out because of its cost.
Pneumatic or pneumatic/hydraulic systems are considerably
4

cheaper and easier to construct. Several such apparatii
which have been reported in the technical literature, were
tried out but were eventually discarded either because they
did not meet our specific requirements or because they
included equipment not readily available in Ireland or the
British Isles.
2.2. New Repeated Loading Testing Rig
A pneumatic loading rig was therefore designed and built
at Trinity College, Dublin, to meet our specific requirements.
Details of this rig are given on Fig. 2.2 the particular
features of which are the following:-
(1) Air supply with normal working pressures of 700 kN/m2
(2) Axial load applied through a 70mm dia piston capable of
applying 300 kN/m 2 to a 102mm dia sample with an air2pressure of 700 kN/m
(3) Inlet air supply to piston taken from an air reservoir,
pressure of which is adjusted by an air regulator,
through an on/off solenoid which is controlled by a
timer unit, and through a needle valve which controls
the air supply.
(4) Exhaust air supply from piston taken through an on/off
solenoid which is controlled by a timer and interval
delay relay, and through a needle valve.
(5) Low pressure air supply taken through a non return valve
to the loading piston to bring loading ram in contact
with the sample before each load pulse.
(6) Water reservoir located above test rig. This gives a2hydrostatic cell pressure of 14 kN/m when the reservoir
is open to the atmosphere.
(7) Inlet air supply to reservoir taken through a timer
controlled solenoid and the exhaust also through a timer
controlled solenoid and through a pressure relief valve
if it is required to increase the constant cell pressureabove that mentioned in (6) above.
(8) Timing relay (Tl) Electromatic asymmetrical recycler withtime range of 0.15-3 secs on both on and off time.
5

(9) Interval timer (T2) which is reset by a relay
working from the "on time" of the times relay (TI).
Friction in the water time delays the cell pressure
pulse in the triaxial cell and consequently the load
pulse must be delayed to get both waveforms in phase.
(10) Delay on operation of timing relay (T3) worked from
(r2_) to control the duration of the axial load pulse.
(11) Interval times (T4)to delay closing the exhaust
solenoid of the loading piston. The circuit of this
unit which was designed and constructed at T.C.D. is
shown in Fig. 2.3.
The sequence of operation is as follows:
(a) Timer relay Tl closes solenoid A and opens B to
pulse the air pressure in the water reservoir for
the desired pulse duration which is set by Dial X.
The start of this load pulse also closes the relay
which in turn resets the interval times T2. At the
end of the desired period the solenoid A is opened
and B closed, thus relieving the air pressure.
(b) After the time interval set on timer T2, the circuit
to the delay timer T3 is opened which in turn closes
solenoid C and opens solenoid D, also triggering the
interval timer T4, which pulses the axial load for
the length of time set on T3.
(c) After the desired time set on T4, solenoid C, which
opens to relieve the axial load, is closed thus
- allowing the low cell pressure supply to bring the
ram into contact with the sample.
(d) The sequence is repeated after the period of time
set on dial Y of the timer unit.
The initial calculation and the development tests indicated
that the pneumatic system could be easily controlled to
6

give a triangular or approximately sinusoidal loading but
gave an unsatisfactory approximation of a reversed sine
waveform on the unloading phase which resulted in a
sawtooth waveform. An automatic system was designed to
overcome this and hopefully give an approximately sinusoidal
unloading phase. This has not been constructed to date as
the response of the system when the sample is included
appears to give a satisfactory waveform on both phases.
Typical axial and cell pressure loading pulses are shown
in Fig. 2.4
2.3 Load and Deflection Measurements
The methods for deflection and load measurements on the
old mechanically operated loading rig were as described
by Glynn (1), with the exception that the axial load was
measured on a load cell incorporated in the triaxial
loading ram inside the cell. Initially it was intended
to measure the load using strain gauges on the inside of
a hollowed out portion of the ram. This proved difficult
to construct and lacked sensitivity. The sensitivity was
increased and the construction simplified by using the
module sensor as shown in Fig. 2.5. This load cell
generally gave satisfactory performance but the following
points were noted:
(a) Sealing off the cell pressure from the sensor sometimes
gave problems, particularly at high pressure. The
sensor was insensitive to the normal range cyclic cell
pressure.
(b) The increase in sensitivity of the load cell was not
Kas great as was expected. This may have been caused
a by elasticity in the system and could probably be
eliminated by careful design and construction.
Load measurements in the new R.L.T. rig were measured on
a Proving Ring outside the cell which incorporated an
7

LVDT and also on a strain gauged miniature proving ring
constructed from the loading ram inside the cell. The
latter type of load cell was noted during a visit to
Nottingham University but in order to enable it to be
used under water the strain gauges and leads were
waterproofed. In Nottingham, it is used in a non-conductive
oil environment.
The resilient and permanent deflections of the sample were
measured by a twin LVDT located on top of the cell as
shown in Fig. 2.6. Permanent deflection was recorded by
the LVDT and checked by readings to the top of nut A by
micrometers.
2.4 Lateral Deflection Measurements
The initial series of triaxial tests carried out in the
old mechanical rig did not allow the lateral deflection of
*samples to be measured.
Problems were encountered in developing a simple reliable
system for the measuring to small lateral deflections of
samples surrounded by water. The strain band as described
by El-Ruwayih(3) when constructed at T.C.D. was not
sufficiently sensitive and was affected by the cycled cell
pressure. No miniature LVDT was readily available for use
under water.
Satisfactory results have recently been achieved with the
lateral strain indicator (LSI) shown in Fig. 2.7. This
apparatus is sensitive, appears to be unaffected by cell
pressure and to date has been reliable. The pressure exerted2by this L.S.I. is of the order of 0.04kN/m per O.Olmm
deflection. This means that for lateral deflection of 0.2mm
which would correspond to vertical strains of the order of
0.004 mm/mm the pressure on the side of a sample at the2supports would be approximately O.8kN/m 2 . This is not
therefore considered an important factor.
8

u HI
0 cz:
ra.a
U) >4
EA z H
00
c 0 0H >0 a xz w <
w:: H
L W~ 2: i
I .>I
u wI
040UIn
SIm
Fig. 2.1.
9

44 d
_____ 4 4
~ 0
-- 0 -7C3-- 4 4
~ U)n4) a
u U)
00
- -4 >-
U)E-
00
E-4' > A4
> EDH O
44U
00
o 0
4 01 E- 4 0U)a4 ~~~ H -
10 Fig. 2.

>E-
14 >4
H* HuH
E4 40
z H H0w
00
0C00
0 ~~ ~ Fg 2.3D S 0r ->1

IL:
~ E4I I HE-4
V6-060
-E-
UU
p 14In/
V. 12 1)Fig. 2.4

It
HOLLOWED-OUTLOAD PISTON 0.6 MM (0.024")24 MM 0. D. THICK APPROX.
/WATER HOLES
FULL BRIDGE FORMED WITH2 NO. STRAIN GAUGESLONGITUDINAL AND
SENSING UNIT CIRCUMFERENTIAL
0.4 MM(0.016")fRTHICK APPROX. O' RINGS
DEFLECTION PISTON
END PIECE
NEW TCD LOAD CELL FOR LARGE TRIAXIAL CELLS
IP STRAIN IN SENSOR, E3
, A1 ,AREA
I PL4 F L 2 1 tF+ A L
A1AE 1 iR CIPli(LE 3 32 * + A3
SENSORo L 2 = A22
= cross 3ectiona L 3 A21 A221area of wall ofsensor
PICPEOF LODCELL OPERATION Fig. 2.5
13

AXIALLOAD
! L. V.D. T.
1.22 mm DIA. ROD
TOP AND BOTTOM 1.25 mm INTERNAL DIA. SLEEVE
CAPS OF PTFE ANNULUS INJECTED WITHHEAVY GREASE USING SYRINGE
T I T OP rAP
SAMPLE
METHOD OF RESILIENT DEFLECTION MEASUREMENTS
|I L.V.D.T.
l : RAM
1.
m TOP OF
CELL '
t tr
I METHOD OF PERMANENT DEFLECTION MEASUREMENTS
Fig. 2.6
14

SPRING POLISHED HINGE PINi
CURVED PADS
MILD STEEL FOIL 0-15 MM. THICK
FULL BRIDGE - 4 No 120-r- RESISTORSmm WITH GAUGE FACTOR 2.1
INSULATED WITH MICROYAX
7
RECRDERREADING3(CL) 3
EXTREME FIBE STRAIN IN. FOIL.A t A IN COMPRESSION
LI, AN N0 0.01 0.02 0.03 00O1K
PRINCIPLE OF OPERATION DEFLECTION (MK)
T.C.D. LATERAL STRAIN INDICATOR FIG. 2.7

WW
C CHA PT ER 3
REPEATED LOAD TRIAXIAL TESTS ON A GLACIAL TILL
3.1 Introduction
The subgrade forms a major element in a road structure,
yet comparatively little research has been carried out on
the behaviour of subgrade materials. It is generally
agreed that methods for analysing road pavements have
reached a satisfactory level of development and that further
work should concentrate on the choice of suitable input
parameters and on verification by monitoring insitu
performance. It is therefore of prime importance to
develop a better understanding of the factors affecting the
behaviour of subgrade materials under repeated loading and
under various stress histories. Hopefully from the knowledgeobtained, parameters necessary for input into the design
systems can then be related to simple laboratory or insitu
tests.
Kirwan and Snaith (4) suggested that the resilient modulus
(Mr) of a soil could be related to its Relative Compaction
(R c ) and to its Relative Moisture Content (Rw), by means of
a nomograph where
Relative Compaction Insitu dry density
Modified AASHO maximum dry density
Relative Moisture content Insitu moisture contentModified AASHO optimum moisture
content
The nomograph that was produced to relate these parameters
was based on the limited results that were available tothem at the time. It was decided to initiate a program ofrepeated load triaxial testing of soils at a wide range of
dry densities and moisture contents in order to investigate
further the Kirwan Snaith nomograph, to study the effect of
16

stress history on these parameters and to see if the Rcand Rw concept could be extended to the creep behaviour.
3.2 Testing Procedures
A glacial till, commonly called Dublin Brown Boulder Clay,
was used throughout the testing program. This forms the
predominant subgrade in Ireland. A large quantity of the
soil was sieved through a 5mm sieve, thoroughly mixed and
stored in bins for testing at a later date. The properties
of this soil are given in Fig 3.1. Similar soil but
sometimes with different maximum stone size was used by
Snaith (5), Glynn (1) and Casey (6).
The old twin-cell repeated load triaxial test rig as
described by Glynn (1) with the modifications mentioned
in Chapter 2 of this report was used for the series of
tests carried out to date on the material characterisation
program. The new rig is now operational and the testing
program has been moved over to that equipment.
The soil was compacted by the method recommended by
Snaith (5). Electro-osmosis was sometimes used to bring
the samples close to saturation. The initial confining
stress (03 was held constant throughout the tests at
14 kN/m 2 with the cycled cell pressure ( a3 ) in phase with
the axial load at ( Aa1 - Aac3 ) unless specific tests weremade to study the effect of cycled cell pressure. The
sequence of loading was varied to study the effects of
various stress histories.
Every effort was made to duplicate each test. Nevertheless,
more often than not the inevitable small differences in the
dry density Yd and moisture content were sufficient to
significantly affect the results. An example of the effect
of a small variation of moisture content on the permanent
strain is shown in Fig. 3.2. Where samples were more or
less the same, the results from each were consistent, as
* shown in Fig. 3.3. The test results from the different
cells were also consistent.
17

3.3 Modulus of Resilience Versus Dry Density and Moisture Content
The variation of the modulus of resilience (M) with
and m/c for an applied axial stress of 2OkN/m is shown
in Fig. 3.4. These results form a consistent trend and
as can be seen, agree well with those recorded by Snaith (5)
which are also plotted for comparison.
One noticeable feature is the absence of any local peakvalue for Mr near mod ASSHO optimum density and moisture
content which would be predicted from the Kirwan and Snaith
nomograph. Contours of equal Mr interpreted from the present
tests are shown. Replotting the results of Seed et al (7) in
a similar form (Fig. 3.5) gives the same type of contour
diagram. It is therefore suggested that part of the Kirwan
Snaith nomograph requires modification. Contours of equal Mr
plotted against Rc and R for the brown glacial till are
shown in Fig. 3.6. The curves for Mod AASHO and Proctor
Compaction are superimposed on the tentative contour diagram
shown in Fig. 3.4. The maximum resilient modulus was not at
the optimum moisture and maximum dry density for these
compactive efforts. A similar finding can be interpreted
from the results of Seed et al (7). The resilient modulus
plotted against moisture content for given compactive efforts
for the T.C.D. and Seed et al tests shown in Fig 3.7
illustrate the point. This result is contrary to the findings
of Majedzadeh and Guirguis (8), who reported that for a given
compactive effort, the maximum resilient modulus occurred at
optimum conditions of dry density and moisture content.
3.4 Effect of Incremental and Decremental Loading on the
Modulus of Resilience.
The change in the resilient modulus with increases or
decreases in the applied axial load and cell pressure are
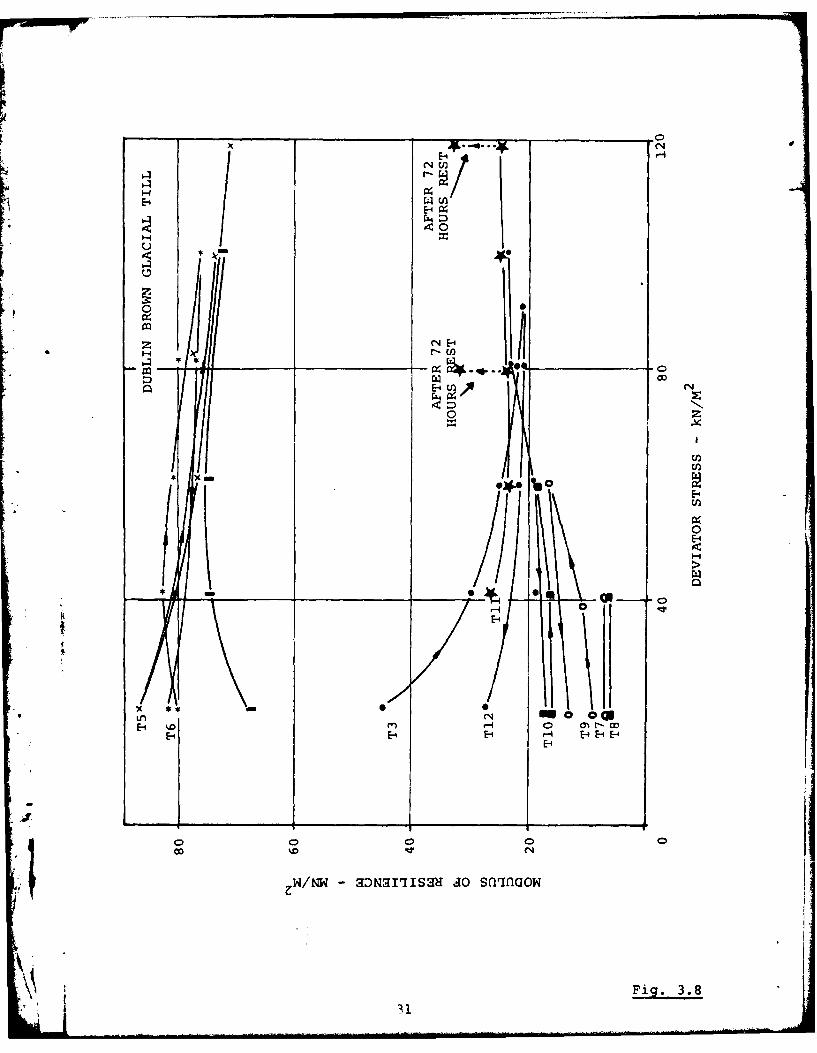
illustrated by some typical results shown in Fig 3.8. Soft
samples showed little change in Mr with increases in
deviator stress, medium stiffness samples decreased in
18

modulus with increasing stress level while the results of
the tests on stiff samples showed an initial increase in Mr,
followed by a decrease. The initial increase in Mr exhibited
by the stiff soils was not expected. It may have been caused
by the seating of the top cap. However, further tests are
being carried out to investigate this.
The behaviour of the soft and medium strength stiff soils can
be explained by considering the resilient deformation as beingdependent on the structure of the soil and on the orientation
of the particles.
The particles of a soft soil reorientate themselves under low
stresses and any decrease in modulus with increase in stress
is due solely to the non-linear elasticity of the soil system.
An increase in applied stress for a medium strength stiff soil
can gradually break down the orientation of particles and
possibly lead to an increase in compaction. Therefore the
change in Mr reflects the non-linear elasticity of the soil
structure as well as the work hardening due to compaction.
Subsequent unloading and loading at constant permanent strain
would be expected to give lower moduli values should the
former process predominate, as the structure would be broken
down to some extent. The test results shown in Fig. 3.9.
confirm this for the medium stiff soil (Mr= 50 to 80 MN/m2).
Some investigators have found an increase in modulus of
resilience for some soils at high deviator stresses. Under
these conditions the work hardening effect would predominate.
Soil compacted at optimum modified AASHO moisture content and
dry density would be classified as medium stiffness soils,
therefore the stress dependent modulus would be affected by
the stress history. It is suggested that the modulus-stress
relationship for the loading, unloading curve be used for
J:. design on the basis that it is the weaker condition and also
the condition which would exist after an initial settling-in
period of a subgrade. Expressing the stress depending
\19
a q19

dependent resilient modulus in the form:
M =C
r
the test results for the unloading, reloading curves gave
an approximate value of of 0.14.
The sine function relationship developed previously by
Kirwan and Snaith (4) did not fit these curves but most of
the present tests were incrementally loaded as opposed to
individual samples being tested under different loads.
3.5 Permanent Strain
In order to study the variation of permanent strain (ep)p
with dry density yd and moisture content (m/c) it was
necessary to model the behaviour of each sample by a creep
function to compare parameters. The permanent strain for
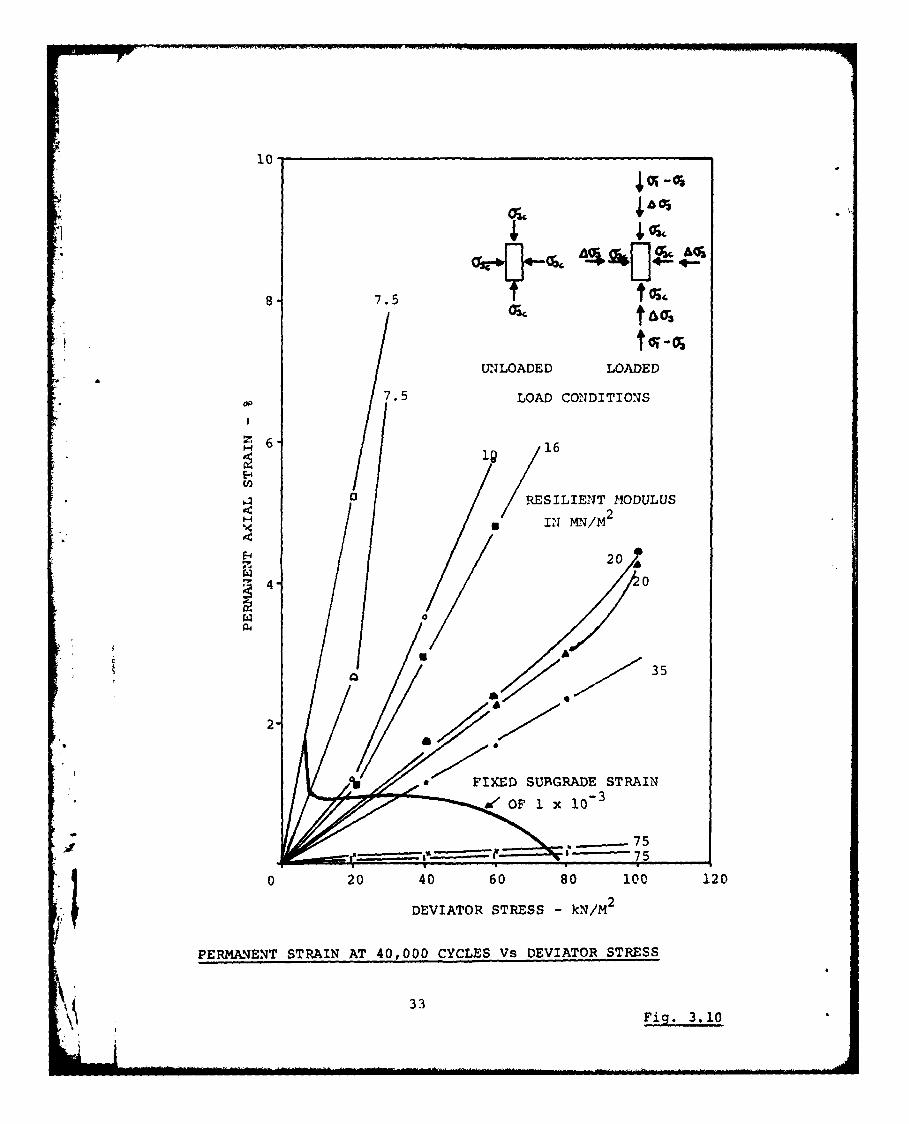
9 tests are plotted in Fig. 3.10 against deviator stress
for 40,000 cycles. Owing to the lack of adequate information
on the creep behaviour of soils, permanent deformation of
subgrade materials is generally controlled in road design by
ensuring that the maximum resilient subgrade strain does not
exceed values which have been determined from the back analyses
of existing road structures which have behaved satisfactorily.
The relationship suggested by Brown et al (9) for British
soils gives a limiting subgrade strain of 1.0 x 10- 3 for a
design life of 40,000 cycles. Working back from the measured
values of the resilient modulus from the test results the
resulting permanent strains are shown in Fig. 3.10. Thus
the working range is less than 1.0% permanent axial strain.
Below this value the permanent strain results can be
approximated to a straight line ,f n m
where N = number of cycles. This function fg(Nc, rm/c)
corresponds to the creep compliance used by Glynn (1) the
,l value of which (at a given number of cycles) can be used
to compare the permanent deformation of soils of different
20A~i
dry densities and moisture contents. Permanent strain is
generally expressed in the form = fn (N)a for
constant values of moisture content and dry density.
Glynn (1) on his tests on Dublin brown boulder clay (Fig.
3.11) used a value of b = 1 thus (assuming linear variation
with stress) but incorporated the concept of a threshold
stress. Applying the condition that the applied load must
result in strains below those allowed by the subgrade strain
criterion, Glynn's test results can be approximated by a
straight line if the threshold stress is ignored. Kirwan and
Snaith (10) argued that a value of b = 1.75 was more correct
but their results are more difficult to interpret as separate
samples were used at each stress level with corresponding
small differences in (d and m/c. Nevertheless the
assumption of linear behaviour appears to be reasonable within
the normal working range of stress and deformation.
3.6 Creep Compliance vs Dry Density and Moisture Content
The creep compliance at 40,000 load repetitions for the tests
to date are shown in Fig 3.12, plotted against dry density and
moisture content. The results form a consistent trend and
illustrate the dramatic increase in permanent deformation that
can occur with an increase in moisture content.
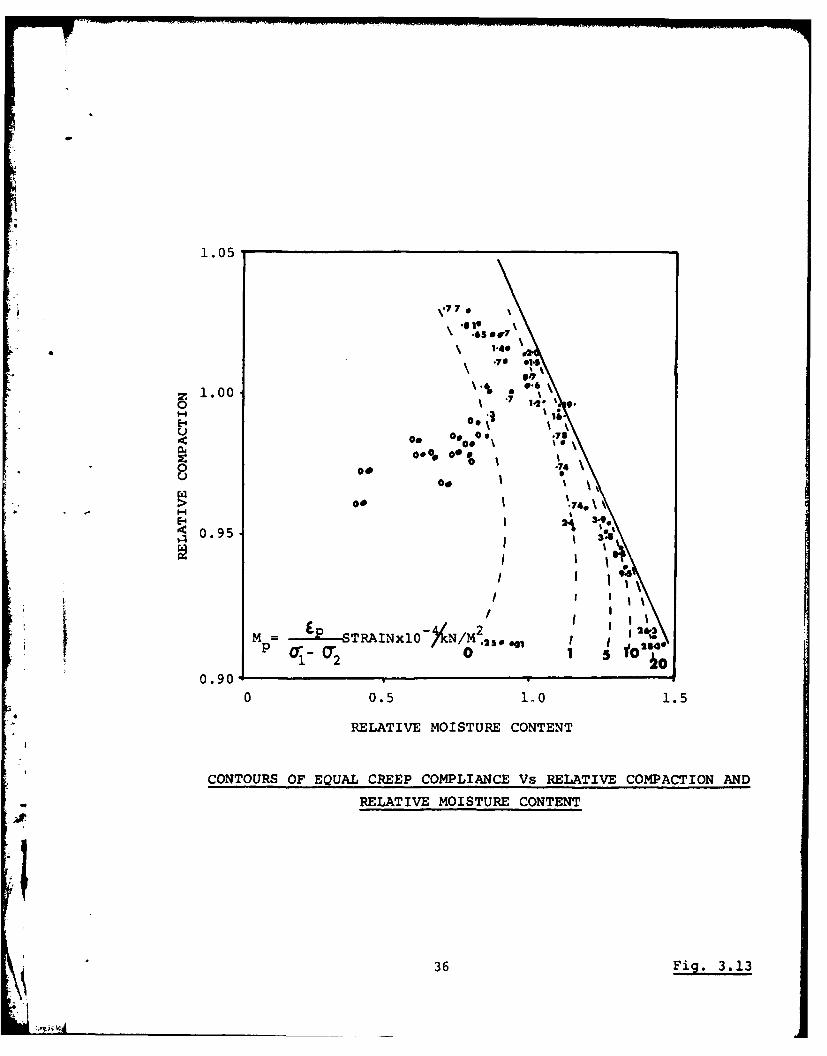
3.7 Subgrade Strain Criterion
The subgrade resilient strain criterion would be expected to
give a relatively constant permanent deformation if, as it is
generally assumnd, it controls the permanent deformation in
the subgrade. Most of these empirically derived relationships
depend solely on the number of load repetitions and therefore,
like that of Brown et al which is plotted on Fig. 3.13, would
give much less permanent deformation for the stiff samples
(0.2% for M = 75MN/m ) than for the softer samples (1% for
Mr = 2OMN/m ). Barker et al (11) from a back analysis of
- -21

airfield runways, suggested that the limiting design subgrade
strain be varied with the stiffness of the soil. Their
relationship would allow an increase in the resilient strain
for stiffer soils, which is in agreement with the test results.
The tests to date therefore suggest that the subgrade strain
criterion should be varied with the stiffness of the soil.
3.8 Permanent Strain and Stress History
The limited results to date suggest that the permanent strain
is strain dependant. This is shown in Fig. 3.14 where two
identical samples were incrementally loaded with different
initial stress levels. It can be seen that once the samples
reached the same permanent strain their behaviour was almost
identical. A sample unloaded from a stress level of 8OkN/m2
and subsequently unloaded and reloaded at various lower stress
levels suffered no measurable increase in permanent deformation
as can be seen in Fig. 3.15.
The test results indicate that when a certain strain is
reached as a result of a given number of repetitions of load,
at a particular stress, then additional repetitions of load
at a lower stress will not result in any further increase in
strain provided that the strain attained at the higher stress
level exceeds the maximum possible strain at the lower stress
level. This behaviour agrees with a "time-hardening model"
for permanent strain suggested by Monismith et al (12) but
here the term strain dependent is considered more suitable.
This point is illustrated in Fig. 3.16. The cumulative
permanent deformation of a spectrum of loads cannot therefore
be added together to give the total deformation, as the
sequence of loading would affect the result. This is a point
that is being investigated further at T.C.D.
3.9 Permanent Strain vs Resilient Strains
Barker (11A) found a relationship between the permanent and
resilient strains from published results of repeated load
22

tests from various investigators. The results of the present
series of tests plotted in Fig. 3.17 to both a natural and
log-log scale tend to confirm this finding. The results of
Snaith (5) fall within the same zone.
23
i2

2.2MOD. AASHO PROCTOR
MAX. DRY DENSITY(Mg/M ) 2.04 1.95
2.1 OPT. MOISTURE CONTENT(%) 10.5 13.7
LIQUID LIMIT 35%
PLASTIC LIMIT 21%
2.0- " SPECIFIC GRAVITY 2.6532.0>4 MOD. AASHO Hcjnz
100% SATURATIONc 1.9>4
PROCTOR
1.8
1.7 -
8 10 12 14 16 18 20MOISTURE CONTENT - %
DRY DENSITY Vs MOISTURE CONTENT
LOG VELOCITY CM/S BR. STD. SIEVE SIZE
100 i 4. 3 .. 75 212 610 2 3 29 50
CL 90
H" 80
< 70
S60
<- ,- -...
, 50 -
r 40- 00-,_ - __ -
20 - - /
0 -7-,0006 .002.006 .02 .06 .2 .6 2 6 20 60 200
CLAY I STT SAND IGRAVEL
PARTICLE SIZE - MM.1PARTICLE SIZE DISTRIBUTION CURVE
24 "ig. 3.124

C))
0. 0
-4 -40 M
- OZM8
CD C) 0 C
0N O0M0oo
/)OW 0
*>0 - O
10 00
>I0
00
0
.0 0o,
I 00
0-4E-4
7' 04
% NIVHIS rIVIXVu INHNWMEd
25 Fig. 3. 2

-44-
cz 0 %D
oX /
z z0
CD~ 0 07i~ j
*~Ov 0 4~:* omm
N4 X
% Iv! 7 IV HNWa
Fi . .

OSNAITH 1969 @ 40,000 CYCLES2.1 *.210 a FARRELL 1978 @ 40,000 CYCLES
227 * PRENDERGAST 1978 @ 15,000 CYCLES
2.00*2270
&1 6
2.0- 13511110
1.714 8 12 t1
27/ FSO. 3.410

124
'4 120
100% SATURATION116
41i
112
S108
13
104
69 46 RESILIENT MODULUS (MN/M2
100
96
10 12 14 16 18 20 22 24
MOISTURE CONTENT %
CONTOURS OF EQUAL RESILIENT MODULUS ON r'd, M/C PLOTISEED ET AL( )I
28 Fig. 3.5

1.05
K kSNAITH(1967)227.
210.a 227.
RESILIENT MODULUS
2 227.o 1.00 (MN/M A 5 2
E-4 200u 21
14136. 138.-7
O 122. 114.u 169 12*610
.93
10SS 4~
100 .2
0.95 2S
7;
So 820 .66 7
So 3 10U 0.90
0 0.5 1.0 1.5
RELATIVE MOISTURE CONTENT
RELATIVE COMPACTION /RELATIVE MOISTURE CONTENT RELATIONSHIP FOR
DUBLIN BROWN GLACIAL TILL
Fig. 3.6
'It 29

150
SEED ET AL(
(AASIIO ROAD TESTT.C.D. TESTS SOIL)
(MOD. AASHO COMPACTION)
C-)
T.C.D. TEST
(PROCTOR COMPACTION)
0
* - ~ 50
0
5 16 15 20
MOISTURE CONTENT-
MODULUS OF RESILIENCE AGAINST MOISTURE CONTENT FOR CONSTACNT DRY
D.;, IT30 Fig. 3.7
E-44
'E-4
'~0u10
z c-4 -4
0'0
- E-1
0
E-4 0
C) o
I L~W/W - DNaIIIS2aI JO SflFflCOW
Fig. 3.8

4 0-E-
H~00
0
Er, m
0
W 4
E-4 U
zz
0
0
ziihi aoairsau o snnUo
Fi . .
32U
8 7.5 Tto~
UNLOADED LOADED
dP7.5 LOAD CONDITIONS
16
I-,
20
00
2-
FIXED SUBGRADE STRAIN
0 20 40 60 80 100 120
DEVIATOR STRESS - kNl/M 2
PERMAONENT STRAIN AT 40,000 CYCLES Vs DEVIATOR STRESS
33Fig. 3.10

T7 T
8
x IO1
T12z0
* FROM GLYN N
0LINE ASSUMING THRESHOLD
2 STRESS
LINE ASSUMING LOWER PART OF* ..- CURVE IS A STRAIGHT LINE
0 40 80 120 160
DEVIATOR STRESS -kN/M 2
PERMANENT STRAIN Vs DEVIATOR STRESS AT 40,000_CYCLES
Fig. 3.11

2.1
2.0
m7
N7.03
>04
m . 11 10 2
1.79
4 84 121
7MOISTURE CONTENT -%DRY DENSITY -VS - M1OISTURE CONTENT SHOWING CREEP
COMPLIANCE
35 Fig. 3.12
1.05
\.77.
\ !.4 \
,- 1.00 \'% * '0.76
UIo °o.° 0. .78o.O, o . I
O0 oe .7e
1-44
70.95 000 0 . i 01 .
1 . 0 I. O N
M i-TAi-O W /'. 5
00 Of -'7S100 01
0.900 0.5 1,01.
i36 Fig. 3.13
,

C;0
00
0D0
__ __ _I. f I .,.o f L
o - I-o -o H
e rI U
oW
mt -0 01 - 9-=a:
r - _9
U) z
rz N N -U I I OTM
rz.. *T*I'409a H
0 -0 8M
0 0 II II 1±M0
14 c0 ..- 0Zm
C4 Z|0
E-1 0 0
0 ) Ci
0Z-E-
Yz
, , , o -o0 . . .
%- NIVHILS 7VIXV JNaNVWIad
Fig. 3.14
37

0F
o IN n 0
Ir H
IISt >I
j z
i-II~I .-4 *
1/N 1_ / 000 0
04 S
%_ __ NI I 7I: NN4Hc
Fi . .1
U 38

PA
N, NO. OF LOAD REPETITIONS
SEQUENCE: A) N1 of pN 2 of ~>N 3 of gives A
A' B) N3 of 073, N 1 of O N2 f~ gives %
INOTE EPA 'ItEPB
"TIME - HARDENING" BEHAVIOUR
A39 Fig. 3.16

RESILIENT STRAIN -3
0 41 6
- T5
z 20
T89'-
Tl\
201
T10
T 7
*T 940
P E IR A N E N V s PE S I L I E N T S T R A I N A T 4 , 0 0 C Y C L E S
10
A4*A4T9
60b
E-4
H A SNAITH 1967
0.1 1-0 0
PERM4AIJENT Vs RESILIENT STRAIN AT 40,000 CYCLES (LOG-LOG SCALE)
Fig. 3.17
40

CHAPTER 4
Study of effect of degree of saturation on Resilient
Modulus and Poisson's Ratio.
The lateral deflection of samples under repeated loading
in the triaxial apparatus was not measured in the initial
series of tests because of the difficulty in developing
measuring equipment of sufficient sensitivity. In order
to simulate the permanent deformation of the soil insitu,
the axial loads and lateral pressure were cycled in phase.
The measured vertical deformation was therefore a combination
of deformation under axial load and volume compressibility
under the cell pressure e.g.
C =(AG, - MA0) + A3 where Cv = Vertical StrainM 3Kr r Mr = Resilient Modulus
K = Bulk Modulusor r
V = Poissons Ratio
ev= (Mi - 2vA 3 )v Mr
assuming that the material behaved elastically.
Poisson's Ratio can be estimated by closing off the cycled
cell pressure for one cycle, measuring the Resilient Modulus,
and then substituting back into the equations above. Given
that Poisson's ratio varies between 0.1 and 0.5 normally,
r it is clear that the measured Mr and therefore the Mr com-
puted from tests in which the cell pressure is cycled, can be
in error by
Measured Modulus = A l 3 = Au1 - U 3
v A Ml VA 3Mr
if V = 0.5 i.e. the material is saturated, the Resilient
41

Modulus computed from the vertical deflection with the cycled
cell pressure would be similar to that computed without the
cycled cell pressure. The error between the measured value
of M and the computed value of M is of the order of 25% forr r4.v = 0.2 and a cycled cell pressure of h(Aal - Aa3 )
It is of interest to study the expected variation with y and
m/c. To do this, use is made of the Skempton's A and B pore
pressure parameters (13). The material is assumed to be
elastic (a staged approached where the permanent deformation
if negligible), linear, isotropic and that the degree of
saturation is sufficiently high such that surface tension can
be ignored.
With reference to Bishop and Henkel (14), the change in pore
pressure due to applied total stresses Aai and Aa 3 is
Au = B{A 3 + A(Aao - AO 3)}
for isotropic elastic behaviour A = 1/3
.'. Au = B{AG 3 + "(AG - a 3
The vertical strain is therefore:
Coi - A03 + (1-2v') {A - B(A(3 + (A - )}v E' + E' 3
where E' = Elastic modulus of soil skeleton in effective
stresses
V1 = Poisson's ratio of soil skeleton in effective
stresses.
Taking AC 3 = Y(ACI - AG)
1
ev = (AcI - Aq3) { 1 + (1-2v ) (Y - B(Y + ) )}EN4

The resilient modulus measured in a triaxial sample with no
cycled cell pressure is therefore:
M = . . (1)
r-
with the cell pressure cycles at (AGI - 3) as it was for
the initial tests. The deviator stress divided by vertical
strain is
AGI - AG 3 E'
{ 1 + (l-2v1 ) (0.5-0.833B) }V
The variation of the ratio, Aul - ac3 is shown in Fig. 4.1.
\
(M 2assuming that v' = 0.2 as got from Calladine (15) for a soil
with Plasticity Index of 14.
This again shows that the error in the estimation of Resilient
Modulus is negligible at 100% saturation but can be expected
to increase at lesser saturation levels. A knowledge of the
variation of the B pore pressure parameter with yd and m/c would
therefore give an indication of the degree of error.
Extending this analysis to study the measured resilient Poisson's
Ratio under repeated loading, the lateral strain is
= (V 1( 60 + tAC 3 )
1 E l
- W,{AG3 - Au - v1 (AGI + Aa3 - 2Au))
neglecting the cycles cell pressure
1Cr = 1 {-u-( A - 2Au) }
43
but Au = B AC
73 I
ACY B w 2B B 2B
E--{R + V(1- 7 ) + V(iS.....(2)
r {l-R (l-2v')} B -(l-2v)
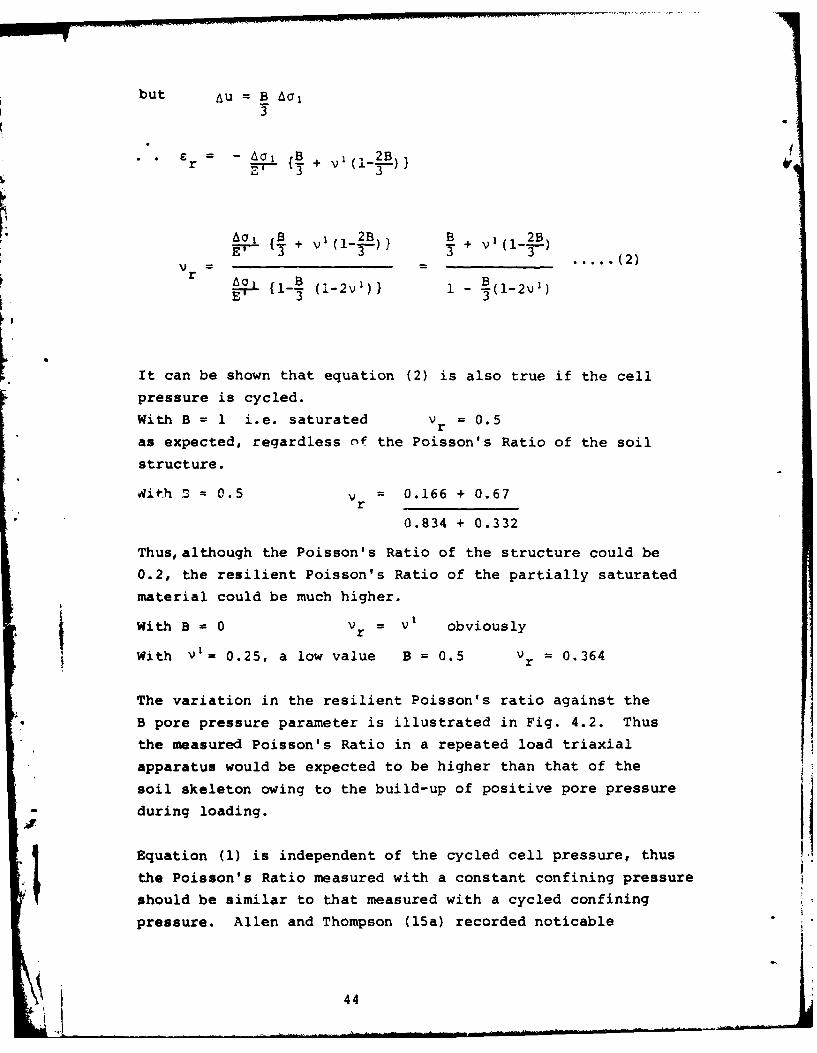
It can be shown that equation (2) is also true if the cell
pressure is cycled.
With B = 1 i.e. saturated V r = 0.5
as expected, regardless of the Poisson's Ratio of the soil
structure.
With 3 = 0.5 = 0.166 + 0.67r
0.834 + 0.332
Thus, although the Poisson's Ratio of the structure could be
0.2, the resilient Poisson's Ratio of the partially saturated
material could be much higher.
With B V 0 Vr = V1 obviously
With vl= 0.25, a low value B = 0.5 V = 0.364
The variation in the resilient Poisson's ratio against the
B pore pressure parameter is illustrated in Fig. 4.2. Thus
the measured Poisson's Ratio in a repeated load triaxial
apparatus would be expected to be higher than that of the
soil skeleton owing to the build-up of positive pore pressure
during loading.
Equation (1) is independent of the cycled cell pressure, thus
the Poisson's Ratio measured with a constant confining pressure
should be similar to that measured with a cycled confining
pressure. Allen and Thompson (15a) recorded noticable
44

different values for Poisson's Ratio for these two types of
tests which suggests that either the soil structure changed,
or that there were inaccuracies in the measuring equipment,
or possibly anisotropic behaviour of the samples.
Preliminary triaxial tests have confirmed that the resilient
vertical deflection is unaffected by cell pressure for
saturated sampled but that, for unsaturated samples, the cell
pressure had a slightly greater effect than predicted by pore
pressure parameter analysis. Previous investigations have
found tha.t the effective stress elastic modulus of some soils
is dependent on the confining pressure. Work is being carried
out to see if this is significant, particularly as high soil
suction or negative pore water pressures are involved in
partially saturated soils. Considering the modulus of
resilience in terms of a constant effective stress modulus
(Equation 1) implies that a reduction of the B pore pressure
parameter, i.e. drying out of the soil, reduces the resilient
modulus. This is not true in practice. Thus, while this
form of analysis can usefully study the behaviour of a single
sample under varying stress conditions, as yet it cannot be
extended to predict the effect of changing moisture content
or dry density. Information on soil suction variation may
bridge this gap. This is being investigated.
• 45a?
I

1.0
0.8 -
A - 03 0.6
v 0.4 ASSUMING V 0.2
M r 0.2
0 0.2 0.4 0.6 0.8 1.0
PORE PRESSURE PARAMETER (B)
COMPARISON OF VERTICAL RESILIENT MODULUS v AINT
AGAINST RESILIENT MODULUS OF SOIL
Fig. 4.1
0.5
0.4 -- 0.4
0.3- V'= 0.2r
0.2 -
0.1
0 0.2 0.4 0.6 0.8 1.0
PORE PRESSURE PARAMETER (B)
RESILIENT POISSON'S RATIO IN TOTAL STRESS (V AGAINST
POISSON'S RATIO OF SOIL SKELETON IN EFFECTIVE STRESS (J)
Fig. 4.2
46
CHAPTER 5
METHOD OF DETERMINING RESILIENT MODULI FROM DEFLECTION
MEASUREMENTS
5.1 Introduction
For pavement design procedures based on a computer analysis
of stresses, strains and deflections in a multi-layered system,
an estimate of the elastic moduli of each constituent material
is required as input to program. The most difficult material
to characterise in this way is the subgrade, since its modulus
depends on moisture content, dry density, stress level,
structure and stress history.
Subgrade material can be tested in repeated load triaxial
testing machines so as to determine the relative effects of
the above mentioned variables on the dynamic response of the
soil. While this test is necessary to determine the suscept-
ibility of a soil to creep deformation and to provide an
estimate of the variation in modulus with traffic loading and
changes in environmental conditions, it has its limitations
in yielding a suitable design modulus for a subgrade, since
it is impossible to model the true in-situ stresses and in-
situ soil structure in a triaxial type machine.
In recent years, the results from many full-scale instrumented
test tracks have been used to provide verification of the
predictive capabilities of the various theoretical analysis
procedures. In general, it has been found that the greatest
difficulty has arisen in selecting suitable characteristics
for the subgrade material.
A simple method has been devised to interpret the results of
an in-situ deflection test on the subgrade to obtain an
estimate of its stress dependent modulus. It is based on the
47

principle that the shape of the deflection bowl is a
function of the rate of variation of modulus with stress
right through the soil mass.
Other investigators (Leger (16), Grant and Walker (17), among
others) have used a radius of curvature as a measure of
deflection bowl profile, to obtain information on base and
subgrade moduli in roads with thin surfacings. Also, deflection
ratios have been used to obtain estimates of moduli in a multi-
layered elastic system. Valkering (18), by assuming a subgrade
with a constant modulus, overlain by a granular base course
having a constant modulus which is a fixed ratio of that of
the subgrade (Dormon and Metcalf (19) ) has produced a chart
relating the modulus of the surface layer to the deflection
ratio. This principle has been extended for use in the Shell
(Claessen and Ditmarsch (20) ) overlay design method.
Ullidtz (21) has also used deflection ratios in his overlay
design method and allowed the non-linear effect of the sub-
grade to be taken into account in their interpretation. Others
have used measured deflections at off-centre points to produce
a spreadability index which can be related to material moduli
values.
Here the use of deflection ratios is extended to allow the
stress dependent modulus of a subgrade to be determined with
the aid of a non-linear elastic computer analysis. From this,
nomographs have been produced which allow the stress dependent
modulus to be estimated without using the program. Also, the
method of obtaining the in-situ modulus values of the consituent
layers in a multi-layered system is explained.
7 5.2 Basis of Nomograph
P The principle behind the nomograph can best be understood by
considering the finite element modelling of a single layer
isotropic material with boundary conditions and loading area
constant.
' 48

{P) = EK] {u}
where {P} = load vector
[K] = stiffness matrix
{U} deflection vector
The stress dependent modulus of resilience can be modelled by
a function of the stress in an element e.g. Mr Cfn(ad)......(2)where C = constant ad = deviator stress
The individual terms in the stiffness matrix are multiplied by
the modulus of resilience appropriate to the stress condition
in the element. For a single layer the constant in equation
(2) above can be taken out of the stiffness matrix such that[K] = C [K
where [K] is the adjusted stiffness matrix.
Equation (1) therefore becomes
{P} c [K'] {U}
{u} = 1 IQe {P} (3)
C
Since each term on the right-hand side of equation (3) is
multiplied by I/C, the relative magnitude of the terms in {U}
remains independent of C. The stress dependent modulus of
resilience of soils is generally represented by an exponential
function e.g.
Mr = Ccd- where C and y are soil constants ....... (4)
ad is the deviator stress
The deviator stress is proportional to applied load for a
linear elastic system. Maher (22) has shown, using the finite
element program DEFPAV, that for a constant value of y a
similar relationship exists. Thus
ao P 0
For an increase in applied load from P to PI' each modulus of
resilience in the stiffness matrix is increased by (P1/Po) -Y
from equation (4) above. This has no effect on the ratio of
49

deflections but decreases each term by 1/(P 1 /P0 ).
Therefore (a) the relative magnitude of terms in the
deflection vector {Uj is determined solely
by the value of y
(b) the magnitude of the deflection is proportional
to
C(P) y
The nomograph is drawn up for C = 100 and P = 100.
Given two soils with modulus relationships.
I Ca an M C aMrl Cld and = C2d
under loads {P1 } and {P2 } respectively, the ratio of the
central deflections are from equation (5):
u1 CpC- C2 (T2) CI =C 2 U2__2
P 2 C1 ,PY . . ul -YU2 C2P2 - Y P2
The nomograph shown in Fig. 5.1 shows the relationship between
y and the deflection for a range of radial distances, computed
from DEFPAV.
Also plotted on the nomograph is the central deflection (U2)
computed by DEFPAV, for C2 = 100 and P2 = 100, for various
values of y. The value of C1 for the soil measured can there-
fore be calculated from
Pa
u2 100
C = 00 x - xUmn Pa -Y
1l00~
where u m is the measured central deflection and Pa is the
applied pressure.
5.3 Boundary Effects and Influence of Poisson's Ratio
Since the interpretation method is based on measured
deflections, it is essential that the computer model, from which
the nomograph is prepared, is an exact representation of the
50

measured system.
Particularly in the case of the simulator tank results,
boundary discontinuities must be placed in the approximate
positions in the computer model. Fig.5.2 shows the effect of
promixity of the vertical boundary (nodes free to move
vertically but fixed horizontially) on the values of Dr
Beyond 1.5 metres the effect is negligible.
Since the elastic behaviour of a subgrade is dependent on the
value of Poisson's Ratio as well as on that of the Resilient
Modulus, it is important to determine the effect of this
parameter on the values of the deflection ratios.
Fig.5.3 shows the variation in deflection ratios for Poisson's
Ratio varying from 0.22 to 0.47. It can be seen not to have
a marked effect, thus making the use of a constant value an
acceptable simplification.
To illustrate the use of the interpretation methos, suppose a
clay subgrade is loaded with a stress of 5OkN/m 2 over a circular
area of radius 100mm and a deflection of 0.27mm is measured at
the centre and 0.08mm at 120mm from the centre. Then
D 120 0.08 0120 = 0 0.296
Then, from Fig.5.1, for D1 20 = 0.296, y = 0.85 and
6 std = 2.7mm, Maher (22) suggests,
or 0stdx6 xpco = o std
6o0 p x 0(p) --
O~X100
2.7 x 50
0.27 x (50)
- 227.8
.r 277.8 Cd - 0 .85 MN/m 2
51

5.4 APPLICATION OF THE METHOD IN THE INTERPRETATION O SOME
PREVIOUSLY PUBLISHED RESEARCH
Tests were performed at the University of Nottingham to
measure the stresses and strains occurring in a typical
cohesive subgrade when subjected to dynamic loading. The
tests were performed in a test pit, 1.52m deep by 2.44m
square with the load being applied to the surface over a
circular area of radius 152mm using a pneumatic loading
system.
A series of tests were carried out (Sparrow & Tory(24) ) at2varying contact pressures (50-100kN/m ) and loading times.
Surface deflections were plotted in terms of normalised values
so that, for the purposes of this investigation, they have
been converted to actual deflections corresponding to an
applied stress of 69kN/m2 (Fig.5.4).
Assuming a semi-infinite elastic isotropic soil with a Poisson's
Ratio of 0.3 then a modulus of 12.4 MN/m 2 is required to produce
a similar centreline deflection to the measured value. However,
at off-centre points it can be seen that the deflection bowl
departs substantially from that measured.
By producing nomographs in the same form as that in Fig.5.1
but with radius of 152mm and boundaries similar to those in
the tests, then a stress dependent modulus can be determined
which results in deflections which more closely follow the
measured values. Exact coincidence is not obtained due to the
fact that, as reported by Sparrow and Tory, the resilient
modulus, calculated from in-situ measurements, increased
markedly with depth and also the exact influence of the
boundaries is unknown.
Approximate linear and exponential Mr/ad relationships for the
test material are shown in Fig. 5.5.
A further more thorough series of tests were performed byBrown and Pell (25) in the same test pit. The effect of appliedstress, loading area and loading frequency on the measured
52

response of the soil was investigated. It was found that,
to satisfactorily predict the subgrade strains and maximum
surface deflections, using linear elastic theory, a variety
of modulus values was required. It was found that strains
and deflections were also very dependant on local values of
the Resilient Modulus.
Fig 5.6 shows the measured deflection points for four of the
tests. A summary of the test conditions is given in Table 5.1.
Test Normal Time Estimated CpNo. Contact for load
Pressure pulse Y(kN/M2 ) (sec.)
S/A 117 2.0 0.38 67.64
S/B 117 0.1 0.44 93.15
S/C 52 0.1 0.435 78.10
* S/D 52 2.0 0.33 56.35
Table 5.1 Summary of Nottingham Tests
It can be seen from Fig. 5.6 that fitting the Boussinesq
equation to the centre-line deflection causes a large divergence
from the measured values with distance from the loading area.(25)
Assuming an exponential Mr/Od relationship and obtaining
average values for y and Cp (Table 5.1) which most closely fit
the deflection ratio at each of the measured points, Mr/ Od
curves as shown in Fig. 5.7 are obtained. It is seen that
these fall very closely together and give a more accurate repre-
sentation of the measured deflection values (Fig. 5.6) at off-
load points. It is also seen that, when a constant value of
modulus is chosen, the value required to yield the correct
centreline deflection in each case is very dependent on the1 magnitude of the test conditions.
53

5.5 INTERPRETATION METHOD FOR MULTI-LAYERED SYSTEMS
Two-Layer Systems
For a two-layer linear elastic system with fixed dimensions
and subjected to a constant stress over a fixed circular area,
the resilient moduli of the material can be determined from
the shape and magnitude of the deflection bowl. The shape of
the deflected profile is a function of the ratio of the two
moduli and the maximum centre-line deflection depends on the
absolute value of these moduli. Thus an interpretation
nomograph can be prepared giving the relationship between the
deflection ratio, the ratio of the moduli and the magnitude
of the centre-line deflection, for predetermined values of
layer thickness and the load radius. The applied stress can
be accounted for by plotting the deflection in terms of
deflection per unit stress or more conveniently as deflection
per 100 kN/M2 of applied stress.
In the case of a two-layer system in which the lower layer is
a clay subgrade with a marked non-linear modulus, the deflection
bowl shape as measured at the surface will be substantially
modified, particularly where the surface layer is thin and of a
comparable modulus to that of the subgrade. To allow for this,
the value of one of the parameters in the modulus/stress
relationship of the subgrade must be assumed. The nomograph
can then be prepared in terms of this known parameter and the
unknown one estimated from the nomograph using the measured
deflections.
Examples of both these nomographs and their use are given in
*Chapter 8.
The value of the vertical stress at either of the layer inter-
faces, if known, also provides information on the modular
ratios and, in conjunction with the deflection ratio, deflection
magnitudes and layer thicknesses would permit determination of
the layer moduli.
I54

5.6 SUMMARY
A simple method is derived and explained for back-analysing
measured deflection profiles from dynamic tests on a subgrade.
This provides the magnitude and non-linearity of the
resilient modulus as a function of deviator stress.
The technique is demonstrated for an assumed exponential
modulus stress relationship. However, the method is not
restricted to this. Nomographs can be constructed in terms
of any desired function and for any given loading conditions.
Examples are given which demonstrate the use of the analysis
procedure in providing consistent modulus values for a series
of test results.
I5
,8 55

44
zz
0 000
LU
CL
I
CN -1
0 00
~~0LLL
00
00
0
)0 4-
56 Fig. 5.1

_ _ _ _ _ _ _ _LA%
0I9-
ococ; -z7
15 0z /:
LIDi
C- CD -:3 -M 00,
CD C - C 1.0- Dr-I~~c u- C -4L
w
0z
LAU
LLJ
1-4-
LW -AbiVaNflO IVOII83A 01 30NVISIG Q
57 rig. 5.2

0n
C-4
II c z0
w
<0
II z0
C)-
LI-
C)4-'-I -o
- (I)
2 0
CD C= (N C) (N I(D C) - (=r-4 .1 CD r_ CD
1 11 t 11 11LL
CND
Y - OI1VH S ,NOSSIOd
58Fig. 5.3 6

SPARROW AND TORY TESTS0 P = 69 KN/M2. .~~a = 152 N24
0 0.4 ,/ oe
//0
~40.8
0 MASURED DATA POINTS 2J/ -- DEFLECTION FOR Ma=2. 4±MN/MU ____
< 1.2 =0.J- DEFLECTION FOR M =1 .05-.8i
D =0.46- -DEFLECTION FOR M*=20.2 a'
1.6
0 0.5 1.0 1.5 2.0 2.5 3.0
OFFSET, RADII
SURFACE DEFLECTION BASINS FOR SPARROW & TORY TESTS
Fia. 5.4
Z 12Mw 12.124I
z 44..= 20.2 -- ,
SILTIY ClAYSPARROWd AND TORY TESTS
C MOISTURE COWiTMT 14-15%,0
0 10 20 30 40 50
DEVIATOR STRESS KN/M 2
ESTIMATES OF RESILIENT MODULI FOR ASILTY CLAY SUBGRADE
Fig.55
59

OFFSET - RADII051.1.2.
KEUPEK MARLGAPPLIED STRESS 117 KN/H'
.4 LOAD RADIUS 152 MM _______
EXPERIMENTAL POINTS
.8 ' Fit LIOM06GAA'IH)__ _ _ _ __ _ _ _ _ _ _
1.2 -
KEUPER MARL
APPLIED STRESS 117 KN/Mt.42 LOAD RADIUS 152 MM _ _____
z1,01- .8 __ _ _ _
4
S1.2
E-4 T S
0 EUE MARLAPPLIED STRESS 52 KNI - -
LODRADIUS 152 MN M.4TES /
0 KEUPER MARL-APPLIED STRESS 52 KN/M%
LOAD RADIUS 152MM
DEFLECTION BASINS FROM NOTTINGHAM TESTS
*1~ Fig. 5.6

iH C/)-W U)Q 0 ~ t .0 0%
g:1 4 5-i I. U
I *0
E -I I0
> U)
IN W 0E-
NN
E-1
~W/NW - DN2IrIISaH JO Sfl'IfUOW
G1 Fig. 5.7

CHAPTER 6
Comparison of Resilient Modulus determined from Pavement
Simulaton tests to those from triaxial tests and from the
nomograph.
6.1 INTRODUCTION
In order to take the study of the behaviour of glacial till
under repeated loading a stage beyond triaxial testing and
nearer the insitu conditions, two series of tests were carried
out on glacial till subgrades in the Laboratory Pavement
Simulator. Undisturbed samples of these subgrades were also
recovered and tested in the repeated loading triaxial rig to
study the effects of sampling procedures on the relevant
parameters.
* The Laboratory Pavement Simulator (L.P.S.) has previously been
described by Kirwan et al (26). The resilient and permanent
deflections were measured at the centreline and at distances
of 120mm and 210mm from the centre on an extended diameter.
6.2 TESTING METHODS
The tests were carried out on the glacial till subgrade after
removal of the gravel sub-base used in the Gravel Road experim-ents of the Foras Forbartha which are described in Chapter 8
of this report. The surface was covered with wax immediately
after removal of the gravel. The glacial till was taken from
a different area of Dublin (Ballybrack) than that used in the
triaxial experiments and consequently exhibited slightly
different gradings and index properties as can be seen from
* Fig. 6.1.
The following is a summary of the testing program for the two
.62

series of tests carried out in the L.P.S. to date. In each
series, three of four areas of the subgrade surface were
loaded vertically under applied uniform pressure which varied
from 100kN/m2 to 300kN/M2 over a circular area of 204mm
diameter. The resilient and permanent deformations were
measured at the centre and at distances of 120mm and 210mm
from the centre.
L.P.S. Test Series A
Average m/c 11.1%
Average dry density 19.5mg/m 2
Insitu CBR 25 to 29%
Test No. Applied No. of stresspressure application
kN/m 2
C8 70-320
C9 73 1,600154 1,900
Clo 238 10,000303 10,000181 9,000
CIl 70-310
C12 130 2,000205 4,000
C13 40-330
' 6i~i 63

L.P.S. Test Series B
Average m/c 11.4%3
Average dry density 1.98Mg/m
CBR 15-18%
Test No. Applied No. of stressressure application
kN/m 2
1. a) 100 6,000
b) 200 67,000
2. a) 100 32,000
b) 200 44,000
C) 300 29,000
d) 100-300 Varied
3. a) 100 30,000
b) 200 21,450
C) 100-200 Varied
d) 300 28.000
e) 100-300 Varied
4. a) 200 26,000
b) 300 78,000
c) 100-300 Varied
Undisturbed sampled were taken following each test, both
adjacent to and from under the test areas. These samples
were obtained either by jacking U4 thin walled sample tubes
(100mm dia, 450mm in length) into the soil or by cutting
blocks of the soil.
64

6.3 RESILIENT RESPONSE
SERIES A
The results of this test series indicated much higher moduli
than anticipated. The recorded readings for Series A must
therefore be questioned. No reason can be found for such an
error other than that the tests were carried out under super-
vision as part of a final year project by students who were
not completely familiar with the equipment. Further tests
are in progress which hopefully will confirm that the Series A
results were in error. The report on this test series given
below should be read with this in mind.
Centreline deflections only were measured in tests C8 and C9.
The material was assumed linear and the modulus of resilience
determined by Boussinesq analysis. This gave values of:
C8 Mr = 34OMN/m2 at iOOkN/m 2 dropping to 283KN/m2 at 300kN/m2
C9 M r = 628MN/m2 at iOOkN/m 2 dropping to 5OIMN/m 2 at 300kN/m 2
The resilient moduli for tests C1O and C13 were determined
from the deflection bowl measurements using the nomograph
given in Fig. 6.2. This assumes a stress dependent modulus
of the form: M CMr = COd
where C and Y are material parameters and ad the deviator
stress. The results are shown in Fig. 6.3. Good agreement
was generally obtained for individual tests carried out at
different loading pressures but it was clear that the sub-
grades for the latter two tests C12 and C13 were considerably
softer than the previous tests.
The resilient modulus of the above test, which comprised the
Series A tests, were surprisingly high for brown glacial till
at the measured moisture content and dry density. This would
also explain the agreement between the empirical relationship,M = 10 x CBR MN/m2 and tIe reported insitu values.
r
. . . . ... . . . . . . . . . .. . . .. .. . . .. . . . .. . ..6 5.

Repeated load triaxial tests on undisturbed samples gave a
Resilient Modulus of 38 to 54MN/m 2 which was almost independent
of the deviator stress. The lower modulus values were on
samples taken from previously loaded areas. These results are
considerably lower than those recorded on the subgrade in the
L.P.S. The constand confining pressure in the triaxial tests
which was normally l4kN/m 2 to represent typical over-burden
pressure, was increased to 70kN/m 2 with no marked effect on the
measured resilient response. The samples were remoulded and
recompacted to their original moisture content and dry density
but again gave similar results. The relative densities were:
Sale Dry Moisture Relative RelativeNer Density Content Density Moisture
Mg/in Percentage Content
1 1.968 11.1% 0.95 1.11
2 1.918 11.0% 0.93 1.10
The resilient modulus determined from the nomograph given in
Fig. 3.6, Chapter 3 using the above Yd and m/c gave values of
approximately 60kN/m 2 for a deviator stress of 20kN/m 2 . This
compares favourably with the values measured in the triaxial
tests but not to those from insitu tests in the L.P.S. The
back analysis of the tests on the Gravel Pavements in the L.P.S.
(Chapter 8) showed a subgrade modulus of the order of280-11OMN/m 2 . Assuming that a stress dependent modulus for
the subgrade gave lower values as shown in Fig. 6.4. This
agrees favourably with the triaxial results and the nomograph
but not with those obtained from tests on the surface of the
subgrade or with the empirical relationship relating the
resilient modulus to the CBR. It would appear therefore that
there were recording errors in the results of those tests taken
on the subgrade surface.
SERIES B
The resilient moduli recorded from the second series of tests
66

on a subgrade, Series B, were considerably lower than those
reported for Series A.
The stress dependent moduli (assuming M = C - ) for testsr = C a
3 and 4 are shown in Fig. 6.5. Test 2, an area previously
loaded in the gravel experiments, gave an almost stress
independent modulus of between 163MN/m 2 with an applied2 2pressure of lOOkN/m , to 94MN/m at an applied pressure of
2300kN/m
Tests carried out at different applied pressures but on the
same test area of the subgrade surface gave consistent results.
A total of twelve undisturbed samples were taken from the
subgrade after the test, three from under the loaded area, six
from areas not previously loaded and three taken horizontally
to study anisotropy.
Two samples have been tested to date, all in the recently
developed Repeated Loading Testing Rig. The results of
these two tests, shown in Fig. 6.6, show similar type curves
for Mr Vs ad as that given by back analysis of the insitu tests.
Furthermore, the results of the two tests are compatible. The
triaxial results are slightly lower than the insitu values
which is to be expected from sampling disturbance. The dry
densities, moisture content, relative density and relative
moisture content of the samples were as follows:
Sample Dry Moisture Relative RelativeDensity Content Density Moisture
Mg/m 3 Percentage Content
6 1.974 11.5% 0.954 1.15
A 1.989 11.6% 0.96 1.16
The resilient moduli interpreted from the nomograph (Fig.3.6,
Chapter 3) are 55MN/m2 and 50MN/m 2 for the two samples. These
67

compare favourably with the measured insitu response. Further-
more, back analysis of the Gravel tests which were carried out
on this subgrade gave resilient moduli, approximately45-64 MN/m 2 , which again compares favourably.
6.4 PERMANENT DEFORMATION
The results of the Series A tests were discarded because of
possible recording errors which became apparent from the
analysis of the resilient response.
The permanent deformation against number of load repetitions
for tests 1, 2 and 3 are shown in Fig. 6.7 and for test 4, in
Fig. 6.8. The latter tests are shown separately as the applied
load reduced from 200kN/m 2 to zero when run overnight (from
6,000 to 19,000 repetitions). The general shape of the curves
is similar to those obtained from the triaxial tests reported
in Chapter 3.
The triaxial tests reported in Chapter 3 indicated that
within the normal working subgrade stress range, the permanent
deformation could be taken as an approximately linear function
of deviator stress for a given number of repetitions. This
implies that there is a straight line relationship between the
I permanent deformation in the L.P.S. tests and the applied
pressure. These parameters are plotted on Fig. 6.9. Test 2
did give a straight line plot but this area had been loaded
previously in Foras Forbartha gravel experiments. The tests
gave an almost linear response for applied pressure of up to
200kN/m 3 but diverged from a straight line when the applied2pressure was increased to 300kN/m 2 . The maximum resilient
strain in the subgrade under 300kN/m 2 pressure was of the orderAI of 3.5 x 10⁻³ The curve produced by Brown et al (9) implies
that the subgrade under this resilient strain should fail with
512 repetitions. This load is therefore outside the normal
level which would be applied to the subgrade.
68

The permanent deformation vs applied pressure can be
approximated to a straight line for the loads less than
200kN/m 2 as shown in Fig. 6.9. The slope of the permanent
deformation - deviator stress line obtained from the
triaxial tests was called the modulus of compliance (Mp) and
was used to compare the performance of Aifferent samples. The
line shown on Fig.6.9 implies a modulus of compliance of-5 22 x 10 /kN/m . This compares favourably with that obtained
from the triaxial tests for soils of similar stiffness.
The Relative Compaction vs Relative Moisture Content plot
shown on Fig.3.6, Chapter 3 indicated an Mp a 0.00009 kN/m
for the subgrade tested. This is greater than that recorded
by a factor of 4.5. The contours of equal MP change rapidly
for a small change in moisture content in the area of the
diagram in which the insitu soil tests are plotted. Never-
theless, the reasons for this descrepancy are being investigated.
6.5 SUMMARY
Two series of repeated load tests were carried out on
glacial till from Ballybrack, Co. Dublin in the Laboratory
Pavement Simulator. Analysis of the resilient response of
these tests indicated possible recording errors in the first
series of tests. The stress dependent resilient modulus
determined by the deflection bowl method described in Chapter 5
on the second series of tests compared favourably with those
recorded on triaxial tests on undisturbed samples and with
values interpolated from the chart given on Fig.3.6, Chapter 3.
The empirical relationship M r = 10CBR MN/im 2 gave unsatisfactory
results.
*While the general trends of the permanent deformation complied
with the behaviour recorded for the triaxial tests, the actual
deflection was approximately 4.5 times less than predicted
from the Rc , Rw chart given on Fig.3.13, Chapter 3.
69
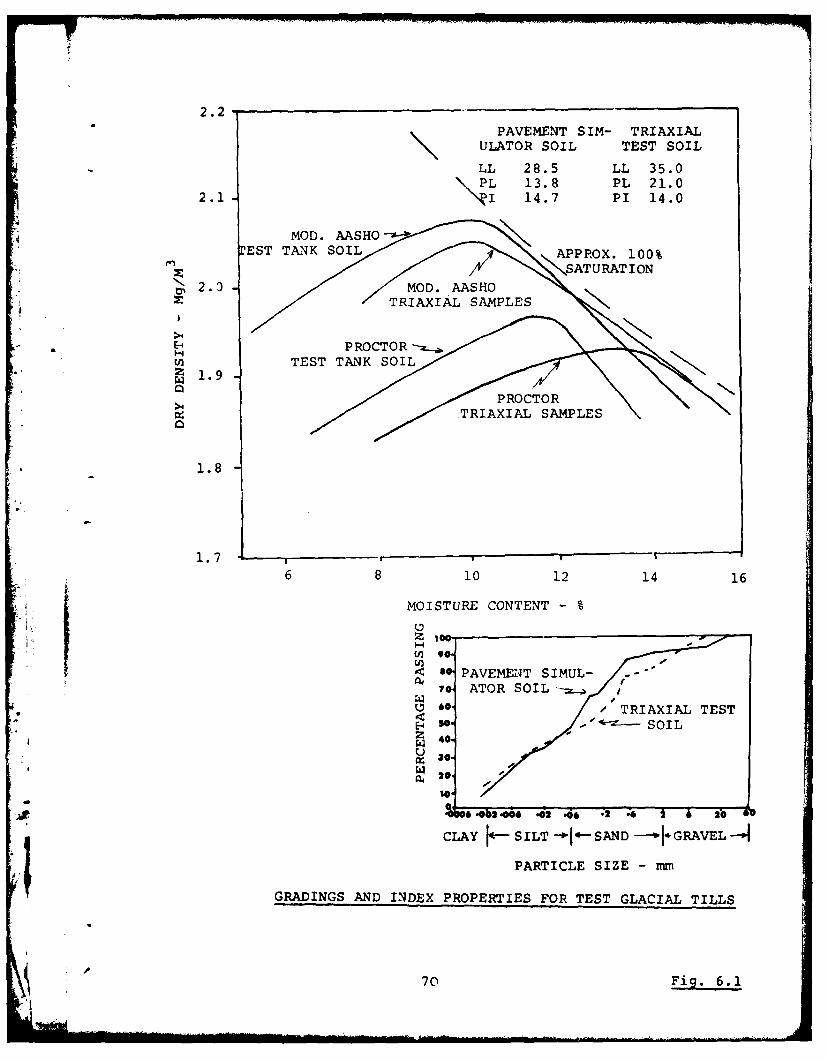
2.2PAVEMENT SIM- TRIAXIAL
ULATOR SOIL TEST SOIL
LL 28.5 LL 35.0L 13.8 PL 21.0
2.1 14.7 PI 14.0MOD. AASHO--
rEST TANK SOIL APPROX. 100%• 2.0 // MOD. AASHO,,
/ TRIAXIAL SAMPLES
E- PROCTORTEST TANK SOIL
Z 1.9PROCTOR
~~TRIAXIAL SAMPLES\
1.8
1.7 46 8 10 12 14 16
: L MOISTURE CONTENT - %
* 4 PAVEMENT SIMUL--O ATOR SOIL /
" 60 . TRIAXIAL TEST40 SOIL
C 30-
20- -
10.
% .0 .ob .6 .0o 2 .; , 9 "2 4 1 o 20
CLAY -SILT -- 10HSAND ----* GRAVEL -41PARTICLE SIZE - mm
GRADINGS AND INDEX PROPERTIES FOR TEST GLACIAL TILLS
70 Fig. 6.1

LrvJ
C:)D
z z m 0(N 0 o~
0
0
~ D w0
030 0 -
C:) LLJ
0Z
zCD 0
C=)C
)4InII
11 z
00
71Fi.6

C)
.J z
-(f KC -lr-ir -
< o , I r - H I - I
0 C0
.1J HL 0.
C=I)
W-~ w -i
0-0
LU)0 NJIu
- ~N31IS~ O sniaow
72 ?ig. 6.

b-LUrL4
040Uo
aL aJ .. 0
L L.
5oLU.
LLfJ
i~ en
C= cn
X U.)
-4
C= 0 0 U)LA 0 x.
-4 -4 E-4
toLLJ >73

0
0R
M 0
LLSC3 zCC (
-i V2 fn C
-m M. N - -:rNX
-L 0000 0 >
LU .
C02 Co
0
0 000 0 0 00 0 0 0
rw/Nw IAW aouariisau a0 Sfl'Iflow
74

A
* a'
C=.
- LU
2= Cc
'#7 I.
* - =
0 QE-4
LA. * 4-3 m -
n~E-4 E--
U2 00-JJ / w00
Z: > E-..: Vr.
LA u w IOH0L 0
-14
0 0; C
C14 00
LWINW 'aw ~DaI'iissH do sflrifcow
75

CN
00
rn /
o0 0 .
oZoc
0 zi x
I 00EA H49 E-
0~ ~~ 0/'/~
'II 0OIaqa / 'U~
76-

7-.-E U w00
z
(N 0
0ac
uJu C,
0C',,
0 LL_
E-4 0
E-4I
w C=
0 La
00
u-
2 5 , . ..
V (N 0 0 0 (N Im %D 00 0 (N %0 O
"'1 77

1.8
17PERMANENT DEFLECTION AT t VS APPLIED PRESSURE1_ _ _ _ _ _ _ __ _ _ _ _ __6._ _ _ _ _ _ __ _ _ _ _ _ _
*.6AFTER 40000 CYCLES
*1.4. LABORATORY PAVEMENT SIMULATOR TEST
1.3. ON GLACIAL TILL SUBORADE
1.2.
E-4 .
0 1.0 /
S0.9./
D4 ~TEST 3w 0.8.
TEST 4- / -z . TEST 1-..
0.6.0700 mpOO2 mmpe
0.5-
0.4.
TEST 2
0.3.
0.2.
0.1.
0
0 100 200 300
APPLIED SURFACE PRESSURE P KN/M 2
78
Fig. 6 .9

CH A P TER 7
*. ANISOTROPIC VERSION OF DEFPAV
Several investigators have reported different moduli of
resilience for samples taken vertically to those taken
horizontally from road pavement layers (Shackel (27) ). This
is not surprising considering that the method of construction
involves compaction in layers using a roller. It is therefore
important that methods of analysis are available to study the
effect of the layered anisotropy on the road response and
performance. Such methods may also allow more satisfactory
modelling of fabric layers than those which use transition
layers with isotropic properties. The Trinity College, Dublin
finite element program DEFPAV has been modified to include
horizontally layered anisotropic elastic material properties.
The formulation of the finite element program DEFPAV for
isotropic material properties has been described by Kirwan and
Glynn (28). Modification to layered anisotropic behaviour
involves altering the [D] matrix which relates stresses in
individual elements to strains
{a} = CD) {€}
This modification of stress-strain relationship effects the
element stiffness matrix
: = [Bj [D] [B] dv
where [B relates strains to nodal displacements in local co-
ordinates.
The stresses are computed from the relationship
{a} = [D] [B] [l {u)
where A relates nodal displacement in global co-ordinates
to nodal displacement in local co-ordinates.
79

The derivation of the ED] matrix for layered anisotropic
elastic materials assumes that the vertical direction will
be the axis of symmetry for any anisotropy which may exist.
This implies that the governing parameters are independent
of the horizontal direction. Some aspects of the behaviour
of anisotropic soils have been discussed by Pickering (1970)
DEFPAV used a rectangular annular element as shown in Fig.7.1.
The strains in a section of the element shown in Fig. 7.1 are
given by:
CZ Z rz -z
r - z h h _" Eh EhEz UZ r Ge
=-vhz - Vhh-_ + -
Yrz - I T rzG2
Where
Jz ,cz represent stress and strain in the vertical direction.
oz Ez represent stress and strain in the radial direction.
Oe,Ce represent stress and strain in the circumferential
direction.
Trz ,rz represent stress and strain in shear.
*zh represents the degree of vertical strain due to
horizontal strain.
\hz represents the degree of horizontal strain due to
vertical strain.
vhh represents the degree of horizontal strain due to
horizontal strain in the orthogonal direction.
G2 represents the shear modulus in the vertical plane.
The input requirements of the program are similar to those of
the isotropic version however they must be extended to include
the terms illustrated in APPENDIX 1.
80

From energy considerations zh Vhz
z
Eh G2Let E-- - = m and ordering the matrix in the same
z z
way as used by Kirwan and Glynn (28), a modified [D] matrix
which relates stresses to strains in a horizontally layered
* anisotropic material is then obtained. This ED] matrix is
illustrated in Fig. 7.2.
The CB] matrix remains unaltered thus the stiffness matrix
in local coordinates is given by:
[]= fff [Bt [DJ[B] dz. dr. r d0
Fig. 7.3 shows a simplified form of this stiffness matrix
where the following substitutions have been made;
Ml :- bn(l-nvh2 . Zn (r./r.)
M2 :- bn (1+hh) (r.j-r] d
hh 1
M4 :- (b 2/2)n(l-nv hz)Zn(rj/r.)
MS5: b~n (1+vhh) (r j- r d
M6 (bY3)n(l-nV2Qn(r./r.)+bm{ (l+vhh)(l-vhh-2nv2 ) (r 2.- r2 )/2}M7 (b12) n(1 +zhh) (r j-ir
M8 (b2 /2)n(1+vh) (r 2 .- ?.1
M9 :- {bY'3) n (1+1hh) (r r ) + b m { (l+vhh) (-vhJ-2n1 (r'.-r. /3)
M1O:- (bY3)n(l+ hh)(. -r2.)+b(l+vhh (l-vhh2nv (r-r )/4}
Mll:- mb(+v) -r)/2
M12:- mb(l+vhh) (1-vh-2n\ 2) (r 3.- r 3 )/3h hh hz j 1
M13:- mb(l+vhh) (1-vhh-2n 2) (r-r)/2
M14:- bn(l+hh) (r i-r )(r 2. - 2M15:- bn\)hz(l+VhhJ 1r-£
iM16:- (b '2) n\hz(l+vhh) (rj- r i )
M17:- bnv (l+v . (r -r ) /2
3 1h

M19: - bnvhz(l+vhh) (r. -r2 )/2
M20: - 2bnv (+ )(r3 -r . )/3hz hh 1
M21:- (bY2,b(l+h) (r2.-r.) /2+m(b2/2) { (l+hh) (l-hh-2n, (r3 -r2)/2}
,:M212:- bhh(l+hh) (r -r 3 m (b 2 lI(+vhh) 1-\)hh-2n\) (r -3)3
M23:- m(b/2) (1-vh-2nv ) (r2.-r2.)/2
"ii@ M24:- b(l-v, )W(3 -r 3.)/ 3
M25:- b(l-vhh ) /4+m(b3) (+hh) (-h-2nvh (j-r)/2
The individual terms of the matrix products [D] x [B] for the
anisotropic material are included in the subroutine FIN6EL in
DEFPAV and are illustrated in Fig. 7.4. This matrix is some-
what different to that used in the isotropic version of DEFPAV,
as a result modifications have been made to the subroutines
. DATAIN, FIN8EL, FIN2EL, FIN6EL and FINSTR in the program
as well as other minor alterations elsewhere.
It is clear from the [R] matrix given in Fig. 7.3 that the
lhnstiffness becomes indeterminate with
1-vhh -2nv' 0
Pickering (29) has carried out an interesting study on the
limiting values of elastic parameters of horizontally
layered anisotropic materials. In order to keep strain
energy positive the following conditions must hold:
a) E and Eh must be greater than zero.
b) Eh ,_hh 2V2h-){ Eh (1-v - h} { 1 + vhh } must be positive.z
This is similar toz 'h-2n" 2 0
c) G must be positive
d) 2 ( 1 + )hh ) must be positive i.e. vhh > - 1
Condition (b) can restrict what seem to be reasonableA values for the elastic parameters.

Ai
101
-el
ANNULAR RECTANGULAR ELEMENT: COMPONENTS OF STRESS AND DISPLACEMENT
IN CYLINDRICAL COORDINATES
83 F1"83 Fig. 7.1

N
.1)4
0 0 0 J I00
cn
+ H
PIZ
-~ I 0
-E 4
144
*E-4
NH4.4
0 C 0
N N I H
0 0 0
-44

0 (0
0 Nr, (N 0L
LO 00 0 0 N z
ON W
r- N A -0 r 0 0 .-I r-Hzzzu)
* H
zl
044
NI 04
85)

rd
C.IJr c
+ ++
N H 4 H
0
-4
4J
+ E- u
+Z u
NN
0
,j -4w 4J =
00
' 4
A 9 + H- a)+ + C49
-4P N V
'C4 >- -
A HC'd~In
zIl 0

CHAPTER 8
GRAVEL PAVEMENT TESTS
8.1 INTRODUCTION
In Ireland, it has been found that certain pit run glacial
gravels behave satisfactorily as pavement base course
materials while others give poor results. For gravels
without excessive fines passing the 75 B S Sieve, there is
often no obvious reason for poor performance. This is of
particular importance in this country where surface dressed
gravel often forms an initial part of the stage construction
of trunk roads. (The gravel base course with only a thin
surface dressing is open to traffic for periods of up to
several years before application of the bituminous layers).
It has been found that grading tests on gravel do not provide
an indication of future performance. Compaction tests and
C.B.R. tests are similarly inadequate. An Foras Forbartha
therefore decided to carry out a series of repeated load
tests in our laboratory pavement simulator. A base course of
pit run Kilpeddar gravel placed on a subgrade of brown glacial
till from Ballybrack, Dublin has been tested to date. The
laboratory construction was to simulate, as closely as possible,
the conditions at the road improvement scheme at Kilpeddar,
County Wicklow which is being monitored in the field. The
preliminary analysis of this work is reported in "The use of
gravels in road pavements in Ireland" by S.Davitt, Research
Officer, An Foras Forbartha. The tests are continuing with
C. gravels from other sources.
8.2 PAVEMENT SIMULATOR TESTS
While the problem of the behaviour of gravels is still unsolved8/
. . ... . ... .. -I ... I I I " .. . I | 8 7i

I A0O-A084 135 TRINITY COLL DUBLIN (IRELAND) SCHOOL OF ENGINEERING F/B 3/ENVIRONMENTAL AND OTHER CRITERIA AND METHODS FOR PAVEMENT DESIG--ETC(U)FEB 79 R W KIRWAN, E R FARRELL, M L MAHER DA-ERO-76-G.065
UNCLASSIFIED mI2 EE.EEEEEllEEllilmlhlhEElhlEEEEohEEEEEEEEmhE*fIIIffI[IIENII
lllllll 80f

at present, some interesting trends have been observed. A Sbrief outline of the laboratory tests is as follows:
Subgrade: Brown glacial till: 1 metre thick
Series A: Water Content 11.1% Dry Density: 1.95 Mg/m 3
C.B.R. : 25-29% thin bituminous coating on surface of subgrade
Base Course Gravel: Water Content 5% - 5.5%Thickness 250mm and 150mm
Insitu Density: 2.22Mg/m3
Grading, compaction characteristics and C.B.R. of gravel given
on Fig. 8.1.
Moisture content of gravel after test = 3%
Applied repeated load: 552 kN/m 2
Radius of load pulse: 102mm
Duration of load pulse: 0.4 sec.
Load frequency: 2 cycles / sec.
Stresses (Vertical)at gravel/subgrade interface were measured
using load cells.
Tests were normally carried out up to 100,000 repetitions of load
application. Surface deflections were measured on centre line
and at 120mm and 210mm each side of the centre on a diametral line.
Tests were carried out:
1) On the gravel at placement water content
2) After increasing the water content of the gravel by
soaking for various periods of time.
3) With ponding of water round the point of application
of load, to achieve saturation of the gravel.
The following trends were observed on the behaviour of the
*2 whole pavement:
1) 'Dry': After 10,000 loading cycles, the permanent deformation
of the pavement showed a very small increase with further
applications of load. The total permanent deformation for
150mm thickness of gravel was less than 3mm after 100,000
cycles.
88

2) After soaking: an increase was observed in the resilient
deflection, and also in the initial permanent deformation.
Again, after 10,000 cycles, when no further moisture
entered the system, very little further permanent defor-
mation occurred.
3) Ponding of load application area: The permanent defor-
mation as expected, increased rapidly due to the loading
pad punching into the gravel. Resilient modulus alsodecreased as expected.
It is concluded that the unsaturated gravel base had an
extremely high load carrying capacity under the vertical load
applied in the Laboratory Pavement Simulator. The extent to
which the confining effect of the walls influenced the results
has not been ascertained.
As expected, the increase in water content towards saturation
had an adverse effect which emphasised the importance of both
the free draining requirements of the gravel and the need toslope the formation to ensure rapid drainage between base and
subgrade. It may be advantageous to blind the surface of the
basecourse to limit ingress of water in the event of surface
dressing breakdown.
The subgrade has been tested insitu and in triaxial repeated
load tests as part of our materials characterisation, these
*. tests are reported and discussed in Chapter 6.
8.3 INTERPRETATION OF RESILIENT RESPONSE BY BACK ANALYSIS
A modulus interpretation system has been developed for the
two layer pavements used in the L.P.S. This method is based
on estimation of modulus of resilience from deflection basin
jj measurements assuming isotropic, homogeneous materials as
described in Chapter 5.
81-J 89

The stress dependence of the resilient modulus is therefore
ignored, which is certainly incorrect for this gravel.
Despite these assumptions, this method is helpful in
analysing the behaviour of the materials. This analysis
has enabled the behaviour of the gravel to be separated from
that of the subgrade and to compare the calculated stresses
with those recorded on the embedded stress cells.
Interpretation nomographs corresponding to the two pavement
thicknesses are shown in Figs. 8.2 and 8.3. A curve relating
the stress on the subgrade to the deflection ratio is included
for comparison with the measured values.
The results of this analysis are summarised on Tables 8.1 to
8.6. The main trends which can be observed from these are:
1) Dry (ref GCl to GC4) : The resilient modulus of the
gravel layer increased considerably during the tests.
That of the subgrade appears to increase slightly
although this is partly due to a reduction in the
subgrade stress level.
2) Soaked (ref GC5 to GC6) : The resilient modulus of the
soaked gravel decreased significantly with increase in the
number of cycles while that of the subgrade increased
slightly, probably as a result of compaction of the sub-
grade. The increase in resilient deflection therefore
took place in the gravel.
3) Ponded : The resilient modulus of the gravel beneath a
free water surface decreased by half during the test,
presumably due to pore pressure build-up. The increase
in modulus of the subgrade is unexplained.
4) Reduction in thickness of gravel from 250 to 150mm:
The modulus of the gravel increased during the first test
and reached values slightly lower than those obtained
from the thicker pavement. This is in keeping with the
trend noted by Klomp and Dorman (30).
90

5) The average ratio,between the modulus of the gravel
layer and that of the subgrade,was six for the thick
layers and three for the thinner layers. These are higher
ratios than those found by the Shell investigators.
61 Using the constant modulus for both subgrade and gravel,
the calculated stresses at the top of the subgrade do
not always compare favourably with those measured, Table 8.4.But taking a stress dependent modulus for the subgrade of
the form M = Cad -0.5, the comparison between measured and
calculated values of stresses compare favourably for the
two tests GC8 and GC9 which showed poor agreement using
the former method.
Using this stress dependent modulus for the subgrade, arevised nomograph was prepared and the layer moduli for the
tests were re-interpreted. The results of this, given in
Table 8.3, show an increase in gravel moduli of 10 - 12% and
a decrease in moduli of the subgrade.
While we emphasise that the gravel testing program is only
in the initial stage, we feel that the results to date are
useful. The series of tests would benefit from additional
instrumentation.
91
(I. . . . . .. .. . i . . . .. . , ,,r . r . . . . . . . .
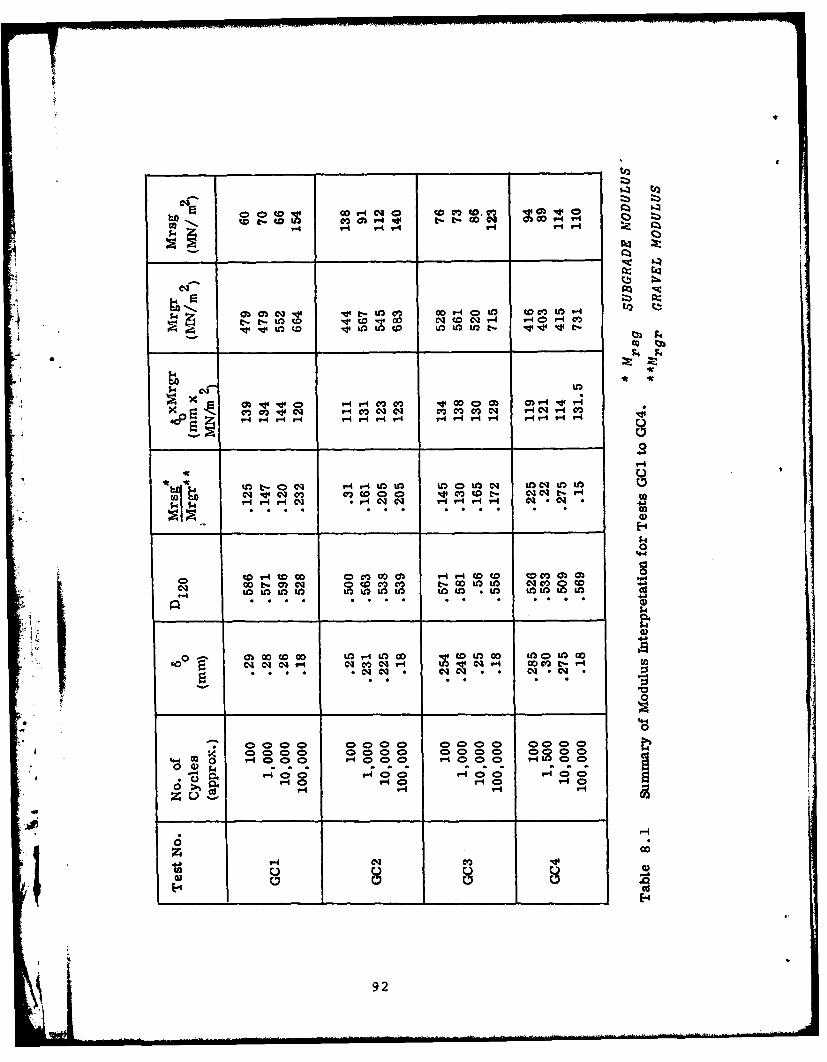
Ol c o 1-4 0 c t-t . V) 0
1-4 '.44 ,-4 - r
w0l
*l I ,
W
N.
~~,4r4~T- &y4- -4-w4-
S-4 -O
14 r-4.V
0
S-o,-40 c v4 UO 0 Ul) Q -4(D9( O OC'l O 001 f ocv)OQ0 V ut - l eqctoc
$4
40011 00 t- 0)C1 0wmm t 0 OL C)Qc
m: 0000 D Or- l 000 ol 0000 00LO00
.00)1 C4 C4 C40. ,-400 Cli DC- P-4
Q 0 0 ,40044 MCD 00 14 a 0 C a r-I Co4
V-4 W-17-4 --
z
E-4 C'
92

m lf - Oi 0 ' - C 0 O
r-4 C-3C%1C f4
cl cim o lq c)C') 14
T4
,..4r 4 r4
V-4 r44 o 5 3C m0 14 4v 4 0 0
u-I C1C
~400 0m L 0~t C 1 f 0 *o -4
C', t 00 cq 04 c c)N 4cvE4-4
14
uLa3 qd oco moCo'4 Cq 03 43W002=
04
-4
0
Q 000D0 000C 0 Q0000 Q 4Q 000 0 0000 0DQ00
0) r400) p400 ~0 0r- 4 r-4
z u
0z O~41 LO cc
02 8
E-4~(
,E-

VAN) C)V4G - M O C* r'q -I r-4
eq
S co tooeQ4Dt- 0wtm
eq
C>
0'-4'-'4 000
0
&40
eq V4r V3C41Y-I4 N CUMt to0
10 V t LO t w LO1 ) LO
0
000 0000 0CD000,
V r'-4eqC14 m
" 0C 40 P40
OD 0
94
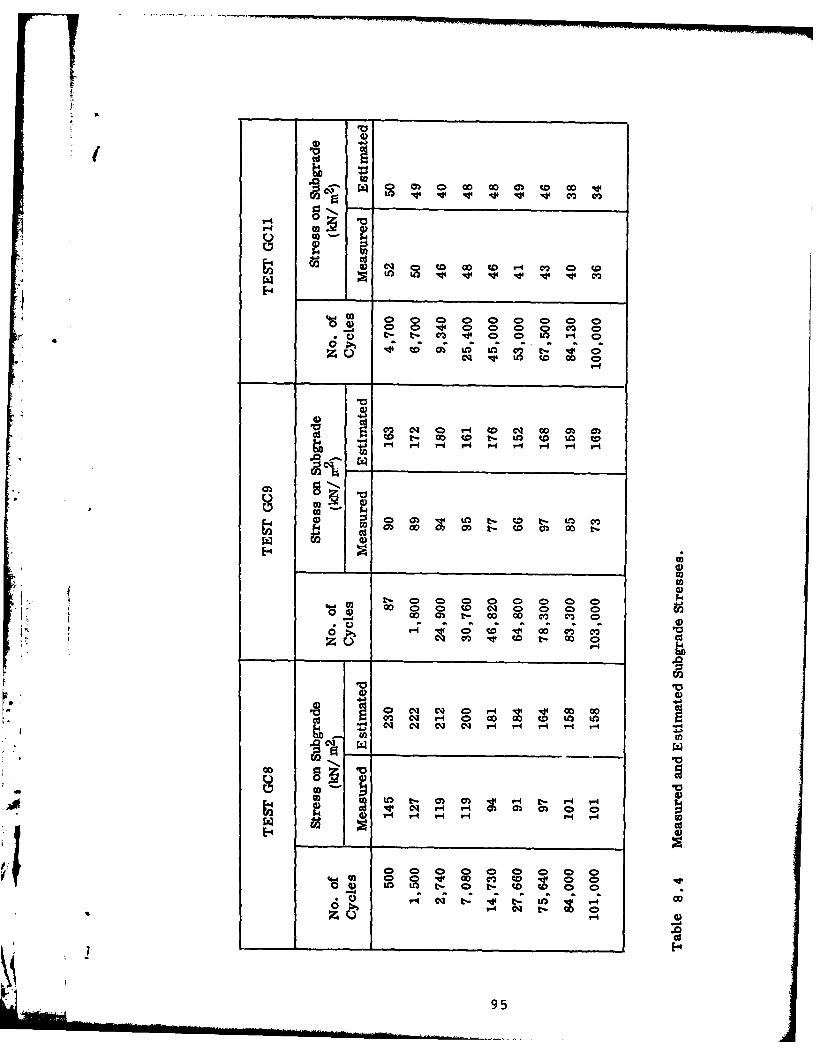
V~ C) 0 ckooe
r4
tO GO w 4 0 Gw
40 0d 0CO0 0 00 r
46 , 00 400 C , 0
.40)4 C) 0) C4 0 F- .44 0- 0Cd ~ ~ c t CVD N r G 0 U O0
000
w w v V-4 t- V-4 V-4)O 0) 0go vC - mD o= U) 0 C>
4) - - - - r",. 4 4 v-4
a))
%0
t: t: Cf__ _ __ _ __ _ __ _ __ _ __ __N_
z0
952

C) C'0O M
KdLW t
00 C
0) cd
lot
sk ~ m Co 0) 0to00 00
XC> 0 0 Co 0 0 00 C>
CC C2 4 Coo s- v CW % 0 .0
14
'0 Cd
0 ~ C Co d~ CE 4
t- 10~ -4 '- 096 c
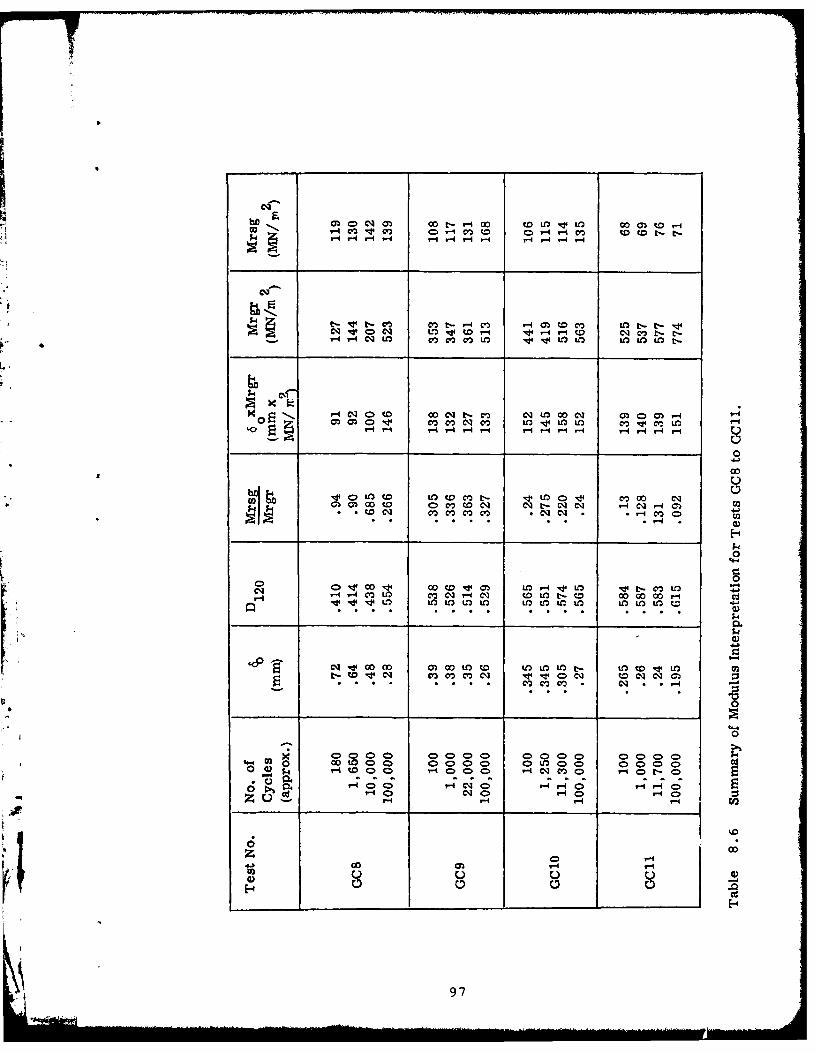
C9)
14e t- lt -c L . - q
C4 V to -4 - C v m -4r LI.-
0 U.)
o -4cq4'to Oo t- C13 Cqt 0 4
'0 ... 7-4 r4*I -4rq q -
0'4-
0
. . . . . . .
______CL
OLD "! t0lD t! Ca*C * . -
0
f*
0
C C) 0 000 000 0 0 00 0 0Q0Co000 La C 0 000 0 L ) 0 0 000 Q C
o4 C- 0 Q 0 ,- C0 C> - C 4 m 0 '40 - (D
z6; C; 0 C ,-0;-
0D N C
4 co4
97
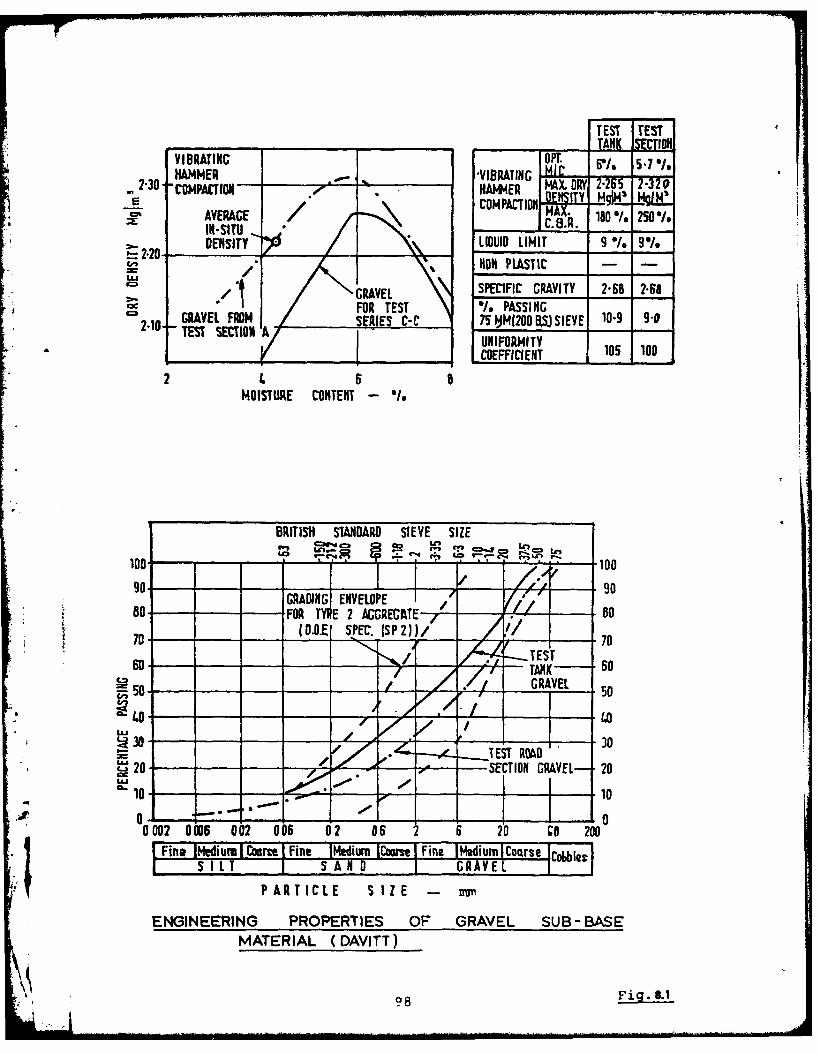
TEST TEST
VIBRATIV T/.HAMMER VIBRATIN.
2.30- COHPATION HAMMER MD 2 =sCOMPACTION VIRATI T 9/" HA44ER AX. 16"/ 501
AVERAGE / V 150 M5I.SITu IC.N.R.DENSITY LIOUID LIMIT 9 /. 9"/..2*20 ./ST ________
% NON PLASTIC - -
GRAVEL SPECIFIC GRAVITY 2-68 2-68FOR TEST '/. PASSING
b-0 RAVEL FROM SERIES C-C 75 YM(200ORSJ SIEVE 10-9 9-0TT SECTION A
i UNIFORMITY_ _ _COEFFICIENT 105 100
2 L 6 8MOISTURE CONTENT - "1s
BRITISH STANDARD SIEVE SIZE
100- -' 1009.AING ENVELOPE ,0
80 FORt TE AGGREGTE- T0
70- 70
60 - ",/ -TE'STAN0
950o -7Z GRAVEL 5
30 - -0TEST ROAD
'j 20 - . -SECTION GRAVEL- 20C. 10- --- 10
0002 0006 002 006 02 06 2 6 20 90 200
Fine IMediumIlCor I Fine IMedium [Coon Fine IMedium ICorse IColbbleiS si L T S A N D 1 GRAVEL I I
PARTICLE SIZE -
ENGINEERING PROPERTIES OF GRAVEL SUB-BASEMATERIAL (DAVITT)
98 Fig. 8.1

- 3vsoelS NO Ssa-d.Is
o 0 0 C C0 C C 0 0 0(N 4 0 C- cc, r- %D0 tn -W
z uvw Xx - snliflGow VIaAvuf x o
0 0 0 0 0 0 0%10 Ln - Fn 04 r-A 0 0 0 0 -W
04 wIn w
o 00 .
0
UUcico 0
X 04
U) CLx to
z0 Ln(N0 W(
(N .E-4
0 ii LA3 )
>00 r- 00 W0
E-4.ZZ
#.-A >4 0w 00
0
0
04 -T 01 0
Sfl'IAOW 7IaAVED
sn'rnaow acivunans
99 Fig._ 8.2

z w/N\. 3QY%-E)fl)S NO SSHILS
0 0 0 0 0 0o 0 0oo l l
U/NIW X -SflIflQ(01, 'ISAVHD X'9
o 0 0 0 0co wN 0 0 (
-4 1,4 .- 4 .
wco-
0 U,
0
0
10 C 0ZLA
00
U) 0 0 >N
rLI 0<
0 ) 0
U) ) -
wCL CL
z
0
000
SflIflcOW 'I3AVHDsn'inaow zavuounfs
110FiQ 6.3
.io -

CHAPTER 9
OPTIMISATION IN PAVEMENT DESIGN
9.1 INTRODUCTION
Maximum economy in road design can be achieved only when
information on the cost related performance of different
road structures is available.
A systems analysis approach must be taken towards the
problem of road design. This involves a consideration
not only of the set of possible initial designs, but also
the future maintenance requirements as well as the possible
stage construction alternatives. Because of the complexity
of this analysis and the extremely large range of alternatives
to be considered, some form of computer analysis is required.
Two computer subroutines, namely SELPAV and OPTPAV have been
prepared towards this end in Trinity College. The former
iG incorporated into the proposed design system based on
the finite element program DEFPAV, (and is a modified version
of that described in Kirwan and Maher(31)). The latter is
intended as an independent package which considers the cost
implications of a wide range of design alternatives.
9.2 ROUTINE SELPAV
A simplified flow chart for the routine is shown in Fig. 9.1.
It is based on the estimation of five critical parameters.
These are total construction thickness, subgrade strain,-4 tensile strain at the base of the asphalt layers, thevertical stress on the subgrade and the surface resilient
deflection.
101

The search routine is univariant. Only the thickness of asingle layer is varied at each stage. The user specifies the
range of layer thicknesses to be considered as well as the layer
thickness increment. The program is written for the analysisof a four-layer system. A three-layer pavement can be con-
sidered by specifying similar properties for the two top layers.
The initial trial section is the maximun possible, i.e. that
comprising the maximum thickness of each layer. This con-
figuration is then analysed to determine whether it lies within
the allowable constraints of the five specified design criteria.
If the cross-section is found to provide a workable solution,
it is costed and stored. The next section is then tested.
The possible configurations are obtained by first decrementing
the thickness of the surface layer, until its minimum thick-
ness is reached. Its thickness is then reset to its maximum
value and the second layer is reduced in thickness by the
specified decrement. The process of decrementing the surface
layer is then repeated, with each trial section being tested
in turn. By continuing this procedure every possible combination
of layer thickness can be tested. For a four-layer pavement
with each construction layer divided into ten increments, 1000
trial sections are generated.
To speed the search process, if a particular section fails, all
thinner sections on that cycle are not tested. To limit storage,only the first five hundred feasible solutions are stored and
sorted. Thus, if a greater number of feasible solutions are
found (as specified in the output), the program should be re-
run with larger layer increments.
Estimation of Design Criteria
Test 1: Minimum Pavement Thickness
In this country, a minimum thickness of 450mm of frost-
resistant material is recommended over frost-susceptible
102

soils. This can be incorporated, omitted or altered.
Test 2: Vertical Compressive Strain in the Subgrade
The method estimating stresses and strains within the layered
structure is based on the equivalent layer theory originally
devised by Odemark (32). Analysis of measured subgrade deflections,
carried out by Ontario Ministry of Transportation using a
deflection equation based on the theory, showed it to be very
accurate. It has been incorporated into overlay design procedures.
The multi-layered elastic syster is converted to a homogeneous
half-space with similar properties to the subgrade. Thus the re-
quired stresses and strains occurring in the original layered
system, now occur in the half-space at a depth related by the
layer equivalent thicknesses.
The principle behind the calculation of the equivalent thickness
he, of a layer with thickness hi , modulus E1 and Poisson's Ratio
vj, in relation to the material with modulus E2 and Poisson's
Ratio V2, is that the equivalent layer must have the same overall
stiffness as the original layer, so as to give the same pressure
distribution beneath it. The equations are based on the relation-
ship for the modulus of rigidity of flat plates in flexure.
E h3
D =
12 (1-v2 )
The basic relationship for a two-layer system takes the form:
3 2 3 3 E1he x = n x h1 x1-he 1 -V 1l 1 -'V
where n is a correction factor and varies depending on the
number of layers in the system. If Poisson's Ratio is similar
for both materials, the expression reduces to:
0.9Xh
e 1 E2
103

Based on the equivalent layer theory, Ullidtz (33) has formulated
simple equations for the estimation of stresses, strains and
deflections in multi-layered systems which have given results
comparable to those obtained using the computer program CHEVRON.
The equation for subgrade strain is given by:
he h eP (1+ V)-a
= E(+- (I-2V)- 11
Where he is the equivalent depth to the subgrade surface, P is
the applied stress, a is the load radius, E is the subgrade
modulus and v the subgrade Poisson's Ratio.
The subgrade strains for two, three and four-layer systems were
estimated using this simplified approach. The results were
compared with those obtained using DEFPAV. A range of values
of modulus, Poisson's Ratio, layer thicknesses and applied
stress were used. Fig. 9.2 illustrates the correlation. It
is considered satisfactory.
Test 3: Tensile Strain at the Base of the Bound Layers
The equivalent layer theory is again used here. In this case,
the subgrade is not taken into account and so the bound layers
are converted to an equivalent thickness of the sub-base
material.
The vertical strain at the surface of the sub-base layer is
then estimated using the equation for Test 2. The vertical
stress at the interface is found using Boussinesq's equation
• in terms of the equivalent height.
sb (+( )252 j
104
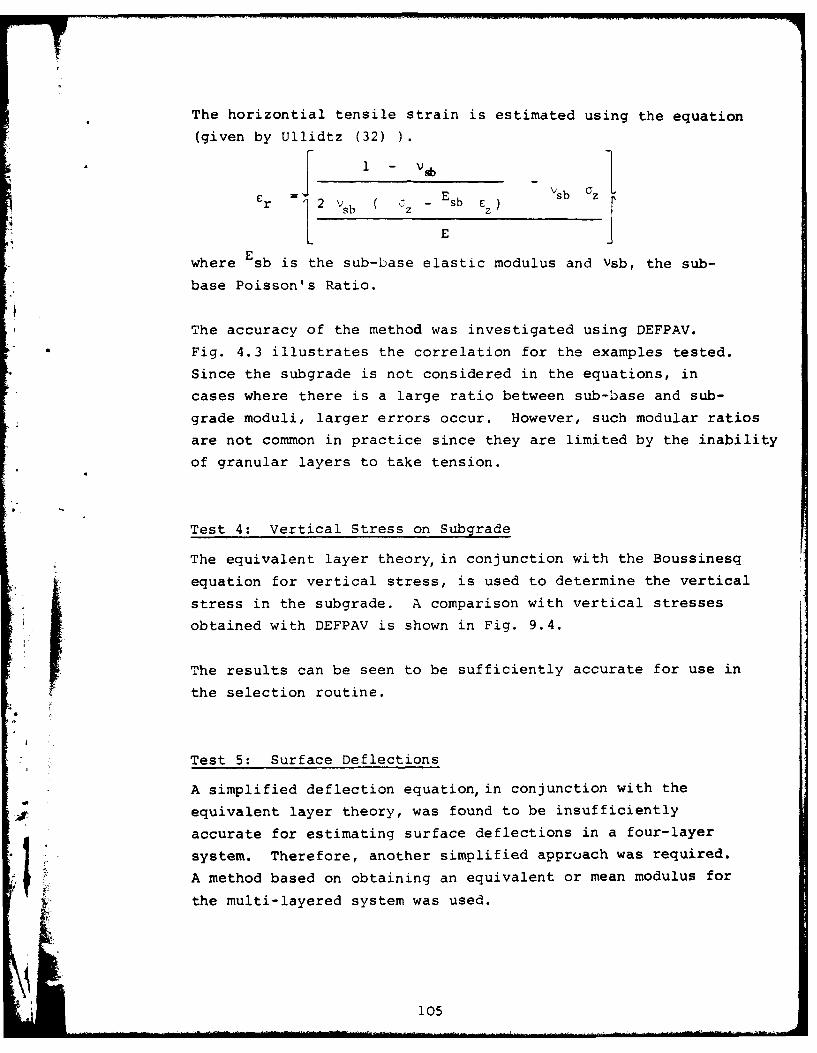
The horizontial tensile strain is estimated using the equation
(given by Ullidtz (32)
C 1 Esb Vsb a z
r 2 Vsb Jz z
E
where Esb is the sub-base elastic modulus and Vsb, the sub-
base Poisson's Ratio.
The accuracy of the method was investigated using DEFPAV.
Fig. 4.3 illustrates the correlation for the examples tested.
Since the subgrade is not considered in the equations, in
cases where there is a large ratio between sub-base and sub-
grade moduli, larger errors occur. However, such modular ratios
are not common in practice since they are limited by the inability
of granular layers to take tension.
Test 4: Vertical Stress on Subgrade
The equivalent layer theory, in conjunction with the Boussinesq
equation for vertical stress, is used to determine the vertical
stress in the subgrade. A comparison with vertical stresses
obtained with DEFPAV is shown in Fig. 9.4.
The results can be seen to be sufficiently accurate for use in
the selection routine.
*
Test 5: Surface Deflections
A simplified deflection equation, in conjunction with the
equivalent layer theory, was found to be insufficiently
accurate for estimating surface deflections in a four-layer
1 ~system. Therefore, another simplified approach was required.
i* A method based on obtaining an equivalent or mean modulus for
the multi-layered system was used.
105

The approach was suggested by Proksch (34) who used an
equation of the form:
E1 x h I + E2 x h 2 +. ..........E-mean 1 -h+me n11 - h 2 + ............
for converting a multi-layered system into a two-layer system
for the purposes of estimating flexural tensile stresses in
a design method. This basic equation has been extended to
convert a multi-layered system into a homogeneous half-space,
with an equivalent modulus which affords the same centre line
deflection as the original system.
However, a problem arises when dealing with a semi-infinite
subgrade. It then becomes necessary to know the depth of
pavement contributing to the the surface deflection. Obviously
this will depend on the thickness and elastic parameters of the
upper layers as well as on the magnitude of the applied stress.
From preliminary investigations, this influence depth was found
to be approximately the depth at which the vertical stress
reached a value of 1/5 of the applied stress. it was also found
that, for a system with a constant applied stress and constant
material properties, the influence depth was relatively constant,
irrespective of the thicknesses of the constituent layers. In
cases where the influence depth falls within the upper layers,
the term referring to the subgrade is omitted and the thickness
of the third layer is adjusted. Thus, the equation for the
equivalent modulus takes the form:
E 1 x h I + E 2 x h2 + E 3 x h 3 + EsgX h 4
E =eqINFLU
where El, Z and E are the successive layer moduli, E is
the subgrade modulus, and INFLU is the influence depth.
If h I + h2 + h 3 > INFLU, h= 0 and h is made equal to
INFLU - (h1 + h 2 ).
106

The centre-line deflection is found using Boussinesq's
equation.
6c 2 x P x a 2eq sg
The variation of Poisson's Ratio between the layers is ignored.
Fig.9.5 illustrates the accuracy of the results when compared
with those obtained with DEFPAV.
The program estimates the appropriate influence depth given
the centre-line deflection from one trial section. Therefore
a trial section must first be analysed using DEFPAV. That
consisting of the minimum layer thicknesses is chosen for
convenience. Since SELPAV is used in conjunction with DEFPAV
and although surface deflections may not be required, this
procedure is not considered to be a disadvantage.
It should be mentioned that the deflection estimated by theroutine is the maximum surface deflection under the specified
load. It is not therefore equivalent to the Benkelman Beam
daflection which is measured between two truck tyres. However,
it does permit a comparative assessment of the relative structural
capacity of the trial sections.
Example of SELPAV Output
The input requirements are illustrated on the user guide
reproduced in Fig.9.6. It can be seen that the user has complete
control over the system to be investigated and the values of the
criteria used for the final selection.
Since the analysis of a typical system only takes a matter ofseconds of computer time, the routine can be re-run many times
to investigate the economic viability of alternative materials
and to determine which is the critical parameter governing design.
An example of the SELPAV output for a typical design problem is
shown in Figs. 9.7 to 9.9. The subgrade strain and asphalt
107

strain limits are those recommended by Shell (35) for a road
designed to take a million standard axles.
IROUTINE OPTPAV
Introduction
The main concern of a road-making authority is to provide a
serviceable pavement network at the minimum longrun cost. Thiscost consists of the initial construction cost, maintenance
costs and the expenditure on future overlays. For any given
project, a large number of alternatives present themselves,
not only from'the point of view of choice of construction
materials and layer thicknesses, but also the initial design
life. In deciding on this, the following points should be
considered.
1) Expenditure on excessively long design life pre-empts
the use of money for more urgent present-day projects.
2) Pavements may become obsolete because of required changes
in alignment etc.
3) Pavements rarely deteriorate uniformly along their length.
Thus most efficient use can be made of the available
budget by allowing for regular rehabilitation on the basis
of actual performance.
4) The use of shorter design lives allows greater flexibility
of the road management system, since terminal service-
ability standards can be revised to reflect variations in
available resources or the relative importance of individual
roads.
Hence, planned stage construction should offer the most
economical solution to providing a serviceable road network.
An investigation at the T.R.R.L. concluded that two-stage con-struction offered considerable advantages over initial designperiods of greater than twenty years.
10
108

.An optimization procedure has been devised which incorporates
the philosophy of stage construction with maintenance.I
Basic Assumptions
Certain assumptions and simplifications must be made. In
order to estimate overlay requirements, the assumption is made
that the elastic properties of the paving materials remain
constant through the pavement life and that the effect of
cumulative damage can be taken into account simply by its
effect on the fatigue life of the bitum n-bound layers.
From the literature, this assumption seems acceptable, provided
that overlaying takes place before failure of any of the pave-
ment components has occurred.
Burt (36), in a review of progress in pavement design, concluded
that the properties of a pavement as a whole do not change much
during its life. From an analysis of the Alconbury Hill
experiment (37), it was found that the curve of permanent
deformation against cumulative standard axles, after an initial
sharp fall, remained approximately linear. While the rate of
deformation varied between summer and winter and between a good
and bad year for weather, the average rate over several years
was approximately constant, indicating that the material
properties were remaining constant.
Measured transient vertical deflections on the same test road
(38) showed little change with time and traffic until after
critical conditions developed. This effect is also evident
from an examination of overlay design curves based on deflect-
ion (39).
The road management strategy, based on the assumption of
constant material properties, requires that strengthening is
undertaken before the onset of marked visible signs of
deterioration. This condition is the prerequisite of any
economic design approach. The design philosophy embodied in
the program OPTPAV is an attempt to fulfil these requirements.
109

A simplified flow chart for the procedure is given in Fig.9.10.
The input requirements for the program are summarised in the
user guide shown in Fig.9.11.
Design of Surface-Dressed Granular Road
The program initially considers a surface-dressed granularroad to provide a pavement for the minimum life specified.
The cross-section is analysed using the equivalent layer
theory, described previously and the subgrade strain
estimated.
The two relationships which relate allowable subgrade strain
to pavement life in terms of standard axles used in the
program are those of Shell (35) and Brown et al (9). First,
using growth rate predictions, the number of standard axles
is estimated for the trial gravel section. The subgrade strain
is then checked for the initial gravel section; if the strain
is too large, the thickness is incremented until the subgrade
strain criterion is satisfied. The subgrade stress may also
be specified as a design criterion.
When an adequate granular road has been found, the cost of
construction, including that of surface dressing, is estimated.
It is also necessary to estimate the maintenance costs incurred
prior to the first overlay. This proves to be a complex
commodity to estimate as shown by studies carried out by the
Road Research Laboratory (40). It includes such items as
surface treatment to restore skid resistance, renewal of road
markings, resurfacing the hard shoulder, raising kerbs and
gulleys and local patching. Traffic delay costs, as a result
of maintenance works, should also be considered.
To combine this information in the form of a maintenance
function would form a major study in itself particularly in
view of the lack of documented material on maintenance costs
on Irish roads. As an interim solution, a simple linear
function increasing with time is assumed. There is some evidence
110

available (41) to indicate that this is a reasonable approxim-
ation.
In order to make valid economic comparisons between alternative
strategies, all future expenditure is discounted to present-day
cost using the equation:DRATE YEAR
present-day cost = future cost x (1 + DRT )
where DRATE is the discount rate and YEAR is the number of
years from present.
Using this relationship, each yearly maintenance expenditure,
as well as overlay costs, are discounted and summed to determine
total outlay.
Design of Asphalt Overlays
When the initial granular road has been designed, the first
asphalt overlay is considered. This is designed on the basis
of the allowable tensile strain in the asphalt layer, the
allowable %.ertical subgrade strain if desired and the vertical
stress on the subgrade, using the equivalent layer theory as
described previously.
Then, using the appropriate fatigue equation (four standard
equations at present included in OPTPAVN, the allowable number
of standard axles are found. Miner's Law for cumulative damage
is assumed to apply for fatigue failure. For the purpose of
the design method in OPTPAV, the pavement must undergo successive
overlays (up to a maximum of four in the present version) with-
out reaching a failure condition. Thus the concept of a
percentage of the remaining fatigue life to be used for each
overlay, is introduced.2If this percentage is denoted by F (in the form of a fraction
i.e. F <1), then if the first overlay has a fatigue life of
NfI repetitions, it is overlaid after reaching F x Nf1
repetitions. The overlaid pavement then has a remaining life
of (1 - F) x Nf 2.
i 111

This in turn is overlaid when F x (1 - F) x Nf 2 repetitions
have been reached and continued for the remaining overlays.
The value chosen for F is decided by the user. A range of
values can be tried to determine the one yielding the most
economic result.
It is possible that this theory of cumulative fatigue damage
may produce too conservative a design for future overlays.
In some existing design procedures, providing the facility of
stage construction, this damage theory is not taken into
account. Since, in this country, fatigue is not the predominant
failure mode and also, since fatigue laws, by being based on
back analysis of successful pavement designs, have a built-in
factor of safety, ignoring the cumulative fatigue damage might
be a legitimate assumption. Again, the option of doing this
is left to the user.
When the first overlay has been found, it is costed on the
basis of construction and maintenance costs to the end of the
design period. A maintenance function in the same form as
that for the granular road is used. All costs are reduced to
present-day costs. The second, third and fourth overlay (if
required) are then designed on a similar basis, until the
total design life specified in the input has been reached. Its
construction and cost are then stored.
Maintaining the initial granular road constant, the first
overlay thickness is increased from that found in the previous
solution and again the successive overlay requirements
estimated and costed. The process is continued until the
total design life can be reached by the application of one
asphalt overlay. Then the initial granular road life is incre-
mented and the range of possible overlays determined as before.
When either the initial granular road life or its thickness
reach the maximum values, its thickness is reduced to theminimum. This then forms the sub-base layer for the initial
three-layer design in which the surface layer consists of the
minimum asphalt thickness. The range of possible overlay
•I

strategies are investigated as before. Eventually, the sub-
base thickness is incremented and the process continued.
In this way every possible combination of initial road
construction and life and all possible overlay alternatives,
within the limits specified by the user, are found and costed.
On completion of the search routine, the feasible solutions
are sorted on order of lowest overall cost. The first twenty
solutions are printed out.
Figures 9.12 to 9.14 illustrate the input printout for a
typical design problem along with a specimen output.

INPUTMATERIAL CHARACTERISTICSLAYER THICKNESS LIMITSTHICKNESS INCREMENTS
DESIGN PARAMETERS
SELECT MAXIMUM LA YERCONFIGURATION
TEST 1SUBGRKES NO
LOWBL
YES
SUBGRADE N
STRIN
ALLOWABLE/
[STORE L YE HCS SS "
A A SELECT NEXT LAYER
FLOW DIAGRAM FOR ROUTINE SELPAV Fig. 9.1

z-~ 900
00
600
04
600-
.~~ TW LA.. ° YERIB0 THREE LAYER
/ " i& FOUR LA Y E R
") 0 300 600 900
SUBGRADE STRAIN (EQUIV. LAYER) - MICROSTRAIN
ABILITY OF EQUIVALENT LAYER THEORY TO-- ESTIMATE SUBGRADE STRAINS Fia. ?
500 . .,j
!U
05
z
TWO LAYER
toD THREE LAYER
FOUR LAYER
0 250 609
ASPHALT TENSILE STRAIN (EQUIV. LAYER) - MICROSTRAINABILITY OF EQUIVALENT LAYER THEORY TO
ESTIMATE TENSILE STRAINS
' Fig. 9.30115
.... i- II .. . . .. . . . . . . .1 l ... . .....

80
600
>
40
20
G TWO LAYER
M THREE LAYER[/l A FOUR LAYER
20 40 6 80
SUBGRADE STRESS (EQUIV. LAYER) - KNi'm 2
'"ABIUTY OF EOUIVALENT LAYER THEORY TO ESTIMATE SUBGRADE STRESS, 0. 5'/ Fig. 9.4
z 0.25
E-4
A0,
0& FOUR LAYER
0 0.25 0.5
SURFACE DEFLECTION (EQUIV. MOD.) - mM
ABILITY OF EUPLENT MODULUS THEORY TO ESTIMATE SURFAC SDEFLECTIONS Fig. 9.
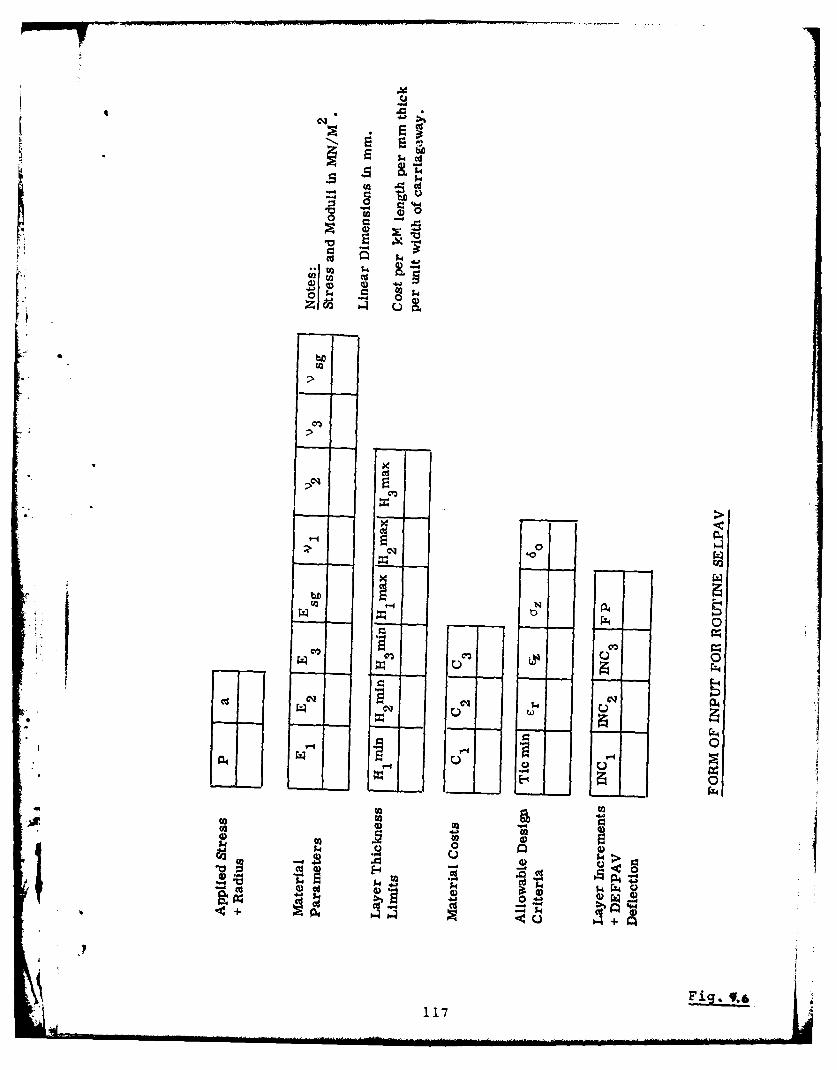
.~a b-4 U0
C.'d
2>
020
02J 02C.0
cis1- C 0
'-I .1 . 0
0
:32 C.):8 m- -% *.
T: k
Fig. .117

LOADING CHARACTERISTICS:
APPLIED LOAD:- 0.498 MN/SQ. T
LOADED RADIUS:- 150.0 mm
DESIGN CRITERIA:
MINIMUM PAVEMENT THICKNESS:- 350 mm
MAXIMUM TENSILE STRAIN IN BASE OF ASPHALT:- .000150
MAXIMUM VERTICAL STRAIN IN SUBGRADE:- .000650
MAXIMUM SUBGRADE STRESS:- .0080 MN/SQ.m
MAXIMUM RESILIENT DEFORMATION:- 0.40 m
LOADING AND DESIGN INPUT FOR ROUTINE SFLPAV
,11
118 ll Fig. 9.7
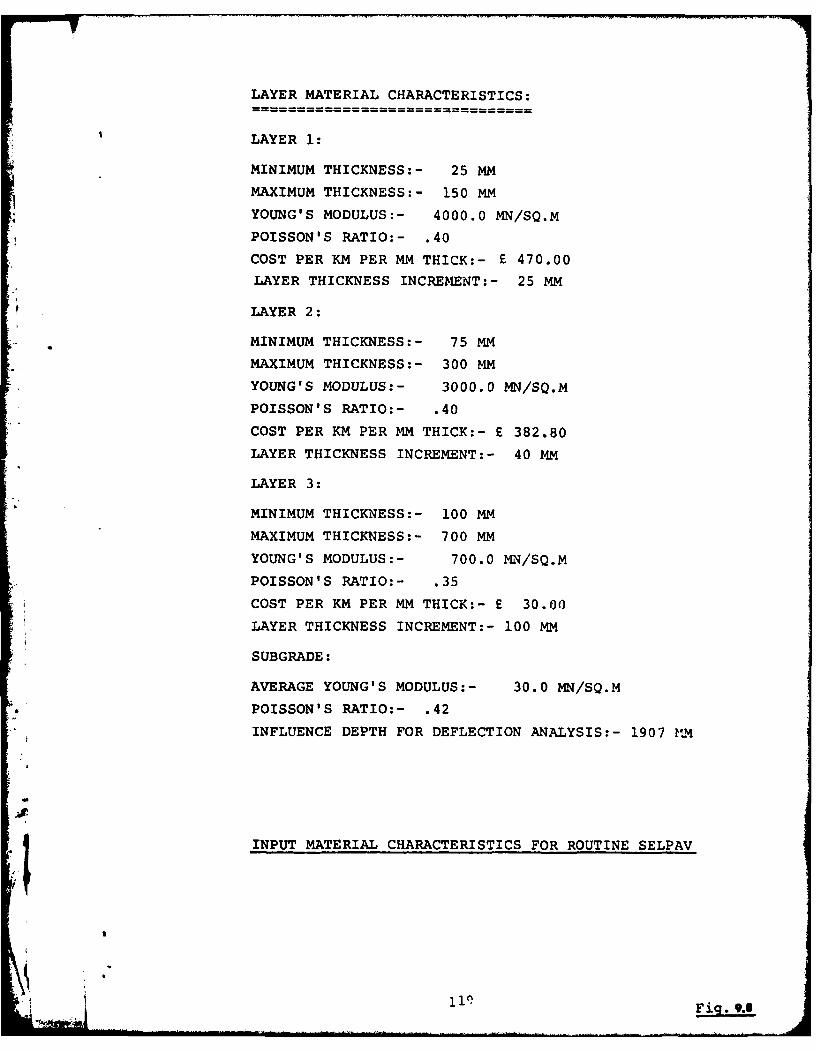
LAYER MATERIAL CHARACTERISTICS:
LAYER 1:
MINIMUM THICKNESS:- 25 MM
MAXIMUM THICKNESS:- 150 MM
YOUNG'S MODULUS:- 4000.0 MN/SQ.M
POISSON'S RATIO:- .40
COST PER KM PER MM THICK:- £ 470.00
LAYER THICKNESS INCREMENT:- 25 MM
LAYER 2:
MINIMUM THICKNESS:- 75 MM
MAXIMUM THICKNESS:- 300 MM
YOUNG'S MODULUS:- 3000.0 MN/SQ.M
POISSON'S RATIO:- .40
COST PER KM PER MM THICK:- £ 382.80
LAYER THICKNESS INCREMENT:- 40 MM
LAYER 3:
MINIMUM THICKNESS:- 100 MM
MAXIMUM THICKNESS:- 700 MM
YOUNG'S MODULUS:- 700.0 MN/SQ.M
POISSON'S RATIO:- .35
COST PER KM PER MM THICK:- £ 30.00
* LAYER THICKNESS INCREMENT:- 100 MM
SUBGRADE:
AVERAGE YOUNG'S MODULUS:- 30.0 MN/SQ.M
POISSON'S RATIO:- .42
INFLUENCE DEPTH FOR DEFLECTION ANALYSIS:- 1907 14M
t
INPUT MATERIAL CHARACTERISTICS FOR ROUTINE SELPAV
1
ii1" Fig. 9.3

M r-4 O M - 0 to M or4 N NN m 0L O O A m LOM i> Hz wH m W w w v Om r N HO 0 0 0r%0 0w
> HD LA4 W HI N % N r- N N O L ALFA 4 eq H N 0q N U 1 L N C cl C4
wz
z H
N N C4 N N N N NNN NN
00 ( 0 0000 0 0C)0 00 ( 0 0 000 0 0 0 0
(n H c H N r-4 H- c4 o " I HH - N a O N -4 O Ni0000a ) a000000c o0 0 0o0 0000000o a0 00000a0a 0g g 0 gggg g 0
11 4 a C C 0 0 a 0 0 0 0 0 0 (D(z ) . . . . . . . . ..o
H u IA LA LA LA N4 LA H- N4 H N4 H- M N H- 0% N% C% r- 0% ON -H W H
9 -PI rq r- -4 r4ZE . a r4 0 0 0 00 0 0 0 0H 0 0r40 0 0 0 C
iE-4 .*
0
w 0 00 LAOOLA C aa CU 0 DA A OLA0 0 0
0 LA LA LA LA r- LA O'n N- 0, rN CN ON 0% ON H-r4 3 0~ O -4 M ME-4 H v m w r, v. w m 0 w w L ,w o w v r
E- 000O O
E-4 ~ ~ 9 C;( C 41 4C 4 C C C wul ~ ~ Na No LA NO ODO LA No LA ON C% rnMc na o 0 ON 0
OrZ- r-.O~ NM LAL c HH o N4N c ncoa c cN N N Nm m m m~ 0% CIO0I hO O 0% ' 1
.H 0000000000 a0 000000 000 00 ~m v LA w. mN(1 N v mI q. N wLL mNr N w. v mNr N
at
0000 00 0 000 0v 0 0000
C;LA 0 LA4 0H L LAL oA LA L- m I ON IA oN LA ON oLAI-oA -
:4 P-1 ___
Fig. 9.9120

INPUTMATERIAL PROPERTIES
TRAFFIC DATATOTAL DESIGN LIFE
MATERIALS AND MAINTENANCE COSTSLAYER THICKNESS LIMITS
MINIPUM OVERLAY LIFE
CHOOSE INITIAL GRAVEL ROAD LIFE INCREMENT
IDETERMINE REQ UIRED THIC KS GRAVEL
ESTIMATE CAPITAL & ROAD LIFE
MAINTENANCE COSTS.- . IADD MIN. ASPHALT OVERLAY I
DETERMINE LIFE OF PAVEME
O ERLYTENICKNSE NOGRVE
STORE IRUNCREIENTSIN O DERS ASPHALT
OVERLAY P lo "-,THICKNESS1 DETERMINE FURTHER I YES
VERLAO THICNESSES THICKNE:" ISET GRAVEL I ROAD LIFE
COTTHICKNESS CON SIDERED< STORE R VLITO MIN
SSORT IN ORDER SET ASP17ALT
OF LOWEST OVERALL THICKNESS
COST TO MIN.
J°UTPUT
FLOW DIAGRAM FOR OPTPAV
121 Fig. 9.10

SM SP Stress JSC
SM: subgrade modulusSP: subgrade Poisson's RatioStress: allowable subgrade stressJSC: subgrade strain code 1. SheLl 2. Nottingham
Default: 1.
GGM GP GC GD R Gmin] Gmax Ginc GRLF LMGI LIFINC
GM: granular modulusGP: granular Poisson's RatioGC: cost per km length per mm thick as LayedGD: cost of surface dressing per km length
Q,R: maintenance function, Q + R (AGE)G min: minimum granular thickness Default: 150 mm
G max: maximum granular thickness DefauLt: 3000 mmG inc: granular Layer increment Default: 150 mm
GRL: minimum granular road life Default: 1 yearLMG: maximum granular road life Default: 15 yearsLIFINC: granular road life increment Default: 1 year
AM -AP AC IW I X ASmin ASmax ASincI MINLIF I KFC
AM: asphalt modulusAP: asphalt Poisson's RatioAC: cost per km Length per mm thick as layedW,X: maintenance function, W + X (AGE)AS min: minimum overlay thickness Default: 50 mmAS max: maximum total asphalt thickness Default: 1000 mm
AS inc: asphalt overlay increment Default: 25 mm
MINLIF: minimum life for asphalt overlay Default: 5 years
KFC: fatigue law code 1. Shell 2. HRA3. DBM (100 pen) 4. DBM (200 pen)
NSD Grate TDL FP JDF Drate
NSD: number of standard axles per dayGRATE: percentage traffic growth rateTDL: total design life
FP: fatigue life percentage Default: no cumulative fatigue
DF: minimum thickness to prevent frost damage damage considered.DRATE: discount rate
INPUT USER GUIDE FOR PROGRAM OPTPAV
12 p'ig. 9.11

SUBGRADE CHARACTERISTICS
RESILIENT MODULUS:- 70.0 MN/SQ.M
POISSON'S RATIO:- .42
MAXIMUM ALLOWABLE SUBGRADE STRESS:- .010 MN/SQ.M
NOTTINGHAM CRITERION FOR ALLOWABLE SUBGRADE STRAIN
GRANULAR LAYER CHARACTERISTICS
RESILIENT MODULUS:- 400.0 MN/SQ.M
POISSON'S RATIO:- .35
COST PER KM LENGTH PER MM THICK AS LAYED:-£ 30.00
COST OF SURFACE DRESSING PER KM LENGTH:- £ 600.00
MAINTENANCE FUNCTION:- £ 75.0 + 40.00 (AGE)
GRANULAR LAYER VARIES FROM 120.0 MM TO 1200.0 MM IN
INCREMENTS OF 50.0 MM
SURFACE DRESSED GRANULAR ROAD LIFE VARIES FROM 3 YEARS
TO 8 YEARS IN INCREMENTS OF 1 YEAR(S)
SUBGRADE AND GRANULAR INPUT CHARACTERISTICS FOR PROGRAM OPTPAV
123 Fig. 9.12
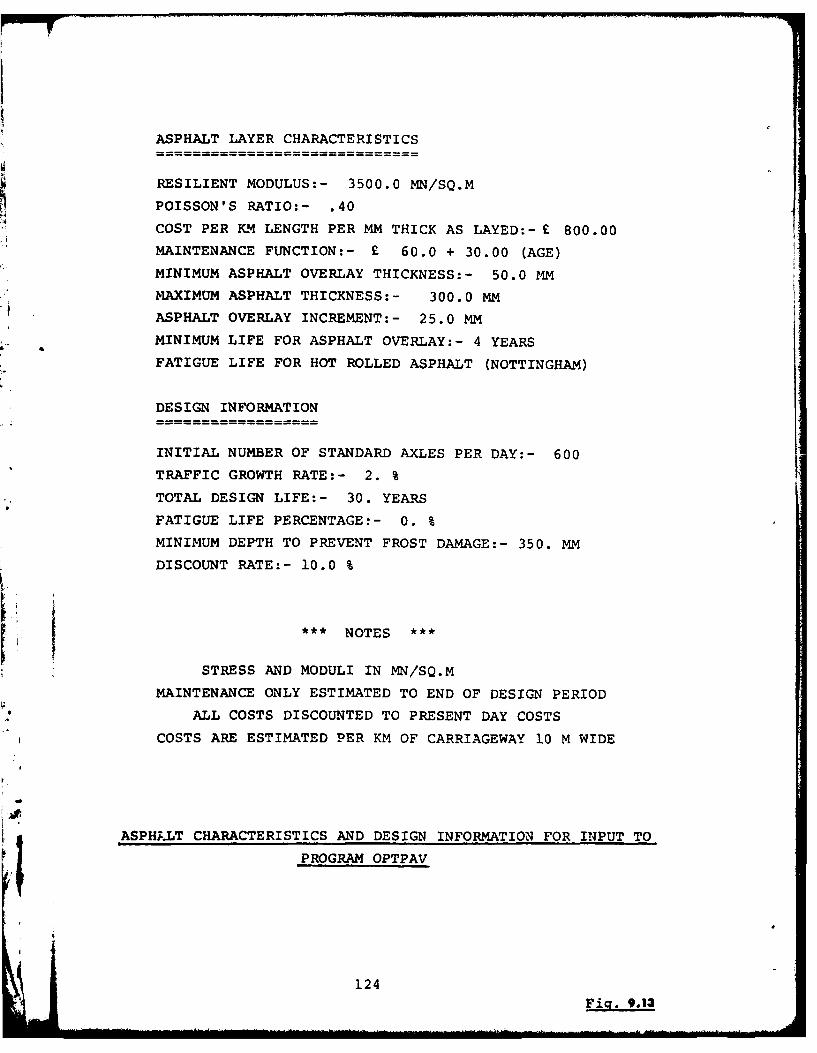
ASPHALT LAYER CHARACTERISTICS
RESILIENT MODULUS:- 3500.0 MN/SQ.M
POISSON'S RATIO:- .40
COST PER KM LENGTH PER MM THICK AS LAYED:- £ 800.00
MAINTENANCE FUNCTION:- £ 60.0 + 30.00 (AGE)
MINIMUM ASPHALT OVERLAY THICKNESS:- 50.0 MM
MAXIMUM ASPHALT THICKNESS:- 300.0 MM
ASPHALT OVERLAY INCREMENT:- 25.0 MM
MINIMUM LIFE FOR ASPHALT OVERLAY:- 4 YEARS
FATIGUE LIFE FOR HOT ROLLED ASPHALT (NOTTINGHAM)
DESIGN INFORMATION
INITIAL NUMBER OF STANDARD AXLES PER DAY:- 600
TRAFFIC GROWTH RATE:- 2. %
TOTAL DESIGN LIFE:- 30. YEARS
FATIGUE LIFE PERCENTAGE:- 0. %
MINIMUM DEPTH TO PREVENT FROST DAMAGE:- 350. MM
DISCOUNT RATE:- 10.0 %
*** NOTES ***
STRESS AND MODULI IN MN/SQ.M
MAINTENANCE ONLY ESTIMATED TO END OF DESIGN PERIOD
ALL COSTS DISCOUNTED TO PRESENT DAY COSTS
COSTS ARE ESTIMATED PER KM OF CARRIAGEWAY 10 M WIDE
ASPHALT CHARACTERISTICS AND DESIGN INFORMATION FOR INPUT TO
PROGRAM OPTPAV
124
Fig. 9.13
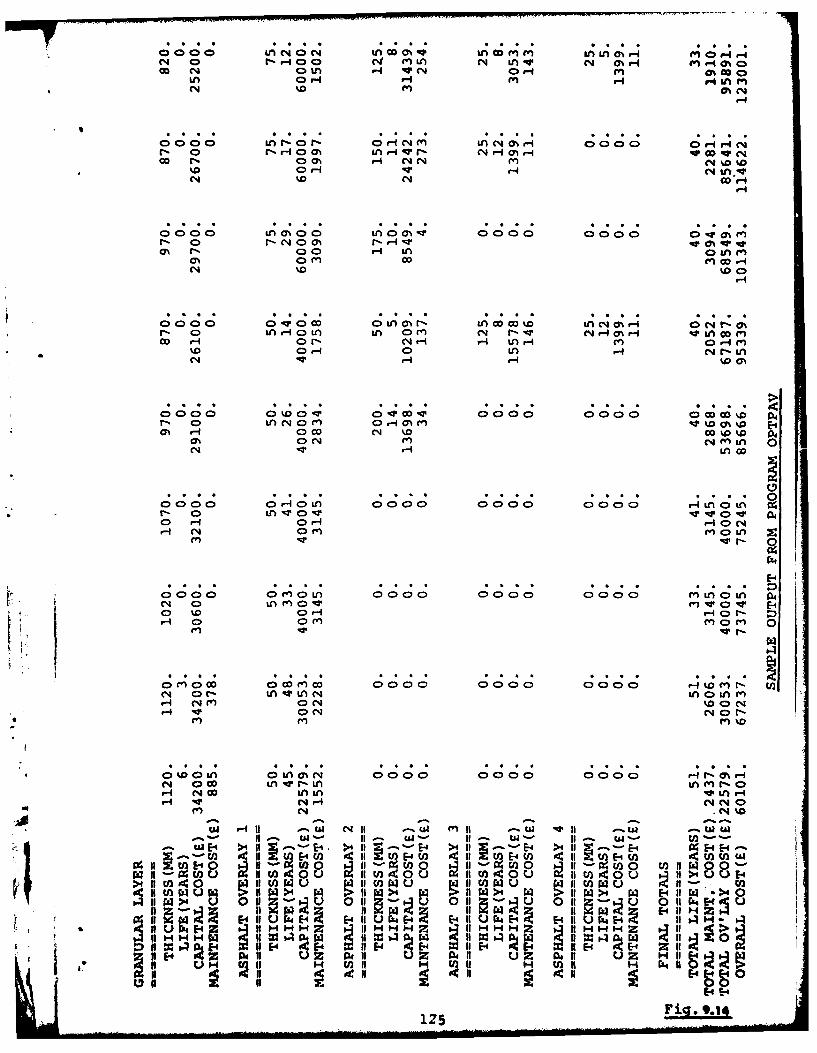
0000 r- qO FLA N c n 1 n wN ONHe H0co 0 c~-oO int F-4 N mA at Ocv- ai4
CN mL N INO ~
co OH oe% HH C4%
%0 0NH O Lre-4 lw-4 NLi IN 0W H 4 0NN
N N oMG -
H
co H 0 N HO r-i - n )%.0 ~0 H DL rlC LA O L
t-% 0 LnH L LA m0 - OM N m 10%03%% E-40
ON '0 OD 01 LA HD %D %0as CH HN( 4 nL
r- 0 LAN O -wa
O H N '0 m m CopLON Nlur 0
N1 H) LAr K n w 0I
C4* 0 r- t 0~ q*LOn C4v od0- H OH HON% C
H N (N MOL r
N 0 w t 0 ~0 r-int mr-
H- -0 NM NO 0
cm -4tm c it 11 .4411 t Us
*f to ' 4 1t QV1 o4 )I wu1 )rluI
MN4L 4 w I 4 4 W I 4 r -OI WAtL 0 > 0
H- NW U AL 4Er ,411l WE r0- U NH@ E- NH Z 1O
(1 N HN 1- 3W A w0 W 1 o
W Hj u. Ni 13W If Z H'f ifHl- to If- HJ NI 1 8l -4~~~~, 0 iceou0 co
~~4li~~~flt'~~~* E-4i I~)zL ICr~ lfl~z~4 r ~ ii fj~I4~ (Fig.z

REFERENCES
1. GLYNN,T.E."Deformation characteristics of boulder claysubjected to repeated stress applications",Ph.D. Thesis, University of Dublin, 1968.
2. BARKSDALE,R.D."Compressive stress pulse times in flexiblepavements for use in dynamic testing." HighwayResearch Board No. 345, Washington D.C., 1971.
3. EL-RUWAYIL,A.A."Design manufacture and performance of a lateralstrain device" Geotechnique, Vol. XXVI, No.1March 1976 pp 215-216.
4. KIRWAY,R.W. and SNAITH,M.S."A simple chart for the prediction of resilientmodulus". Geotechnique, Vol. XXVI, No.11976, pp 212-215.
5. SNAITH,M.S.
"Repeated load testing of boulder clay subgrades".M.Sc., Thesis University of Dublin, 1968.
6. CASEY,T.L."A Laboratory pavement simulator and aninvestigation to relate dynamic and ordinarysoil properties", M.Sc. Thesis, University of Dublin,1973.
7. SEED,:i.B., CHAN,C.K., and LEE,C.E."Resilient characteristics of subgrade soils andtheir relation to fatigue failures in asphaltpavements" Int. Conf. Structural Design of AsphaltPavements, pp 611-636, 1962.I
126. . . . . . . . ° . . . . . . . . . . . . -. . . .

8. AIAJIDZADEH,K. and GUIRGUIS,H.R."Fundamentals of soil compaction and performance".Highway Research Board H.R.R. No.438, 1973 pp 1-15.
9. 3ROWN,S.F., PELL,P.S., and STOCK,A.F."The application of simplified, fundamental designprocedures for flexible pavements". 4th Int. Conf.Struct. Design of Asphalt Pavements pp 327-341,Ann Arbor, 1977.
10. KIRWAN,R.W., SNAITH,M.S."Further investigations towards a rational method
of Design for Flexible Pavements" Part II, FinalTechnical Report, E.R.O. April, 1975.
11. 3ARKER,W.R., 3RABSTON,W.N. and CHOU,Y.T."A general system for the structural design offlexible pavements". Fourth Int. Conf.Structural Design of Asphalt Pavementspp 209-248, Ann Arbor, 1977.
lla. BARKER,W.R."The relationship between resilient and permanentstrain in the design of asphalt pavements".Symposium on Rutting in Asphalt Concrete Pavements.
12. MONISMITH,C.L., OGAWA,N. and GREENE,C.R."Permanent Deformation characteristics ofsubgrade soils due to repeated loading".Transp-rtation Record 537, 1975.
13. SKEMPTON,A.W."The pore-pressure coefficients A and B".Geotechnique 4, 143-47, 1954.
14. BISHOP,A.W. and HENKEL,D.J."The measurement of soil properties in theTriaxial Test". 2nd Ed. 1962
15. CALLADINE,C.R.I "Overconsolidated Clay: a microstructural
view" Symposium on Plasticity and SoilMechanics, Cambridge, 1973.
127
15a. ALLEN,J.J. and THOMSON,M.R."Resilient response of granular materialssubjected to time-dependent lateral stresses".T.R.R. 510, 1974, p 1-13.
16. LEGER,P."Le Deflectographe Lacroix, evaluation duematerial et procedes d'exploitation" RevueGenerale des Routes et des Aerodromes,June 1969.
17. GRANT,M.C. and WALKER,R.N."The developmpnt of overlay design proceduresbased on the application ef elastic theory" Proc.3rd Int. Conf. Structural Design of AsphaltPavement, London 1972, pp 1155-1166.
18. VALKERING,C.P.:'Pavement Evaluation by measuring deflectionand shape of deflection bowl". Proc. 3rd Int.Conf. Structural Design of Asphalt Pavements,Vol. 2 London, 1972 pp 353-356.
19. DORMON,G.M. and METCALF,C.T."Design curves for flexible pavements based onlayered system theory". Highway Research Board,Vol. 17 No. 71, pp 69-84.
20. CLAESSEN,A.I.M. and DITMARSH,R."Pavement evaluation and overlay design".Proc. 4th Int. Conf. Structural Design ofAsphalt Pavements, Ann Arbor, 1977, pp 649-662.
21. ULLIDTZ,P."Overlay and stage by stage design". Proc. 4thInt. Conf. Structural Design of Asphalt Pavements,Ann Arbor 1977, pp 722-735.
22. MAHER,M.L."Optimisation and in-situ materials character-isation in the rational structural design ofFlexible Pavements" Thesis to be submitted tothe University of Dublin for the Degree ofDoctor of Philosophy.
128

23. ULLIDTZ,P."Laboratory testing of a full scale pavement"Report No. 19, The Technical University ofDenmark 1978.
24. SPARROW,R.W. and TORYA.C."3ehaviour of a soil mass under dynamic loading".
-, Journal of the Soil Mechanics and FoundationDivision., Proc. A.S.C.E. 4825, No. SM3,pp 59-83, May 1966.
25. BROWN,S.F. and PELL,P.S."An experimental investigation of the stresses,strains and deflections in a layered pavementstructure subjected to dynamic loads". Proc. 2ndInt. Conf. Structural Design of Asphalt Pavements,Ann Arbor, 1967 pp 487-504.
26. KIRWAN,R.W. and GLYNN,T.E. and BONNER,G.A."The significance of material properties in flexiblepavement analysis". Final Tech. Report E.R.O.,U.S. Army, University of Dublin, April 1973.
27. SHACKEL,B."Repeated loading of soils - a review".
* Australian Road Research Vol. 5, N~o.3,* October 1973.
28. KIRWAN,R.S. and GLYNN,T.E."Experimental and theoretical investigation ofpavement deflections". Final Technical ReportE.R.O. DAJA37-68-C-1490, 1969.
29. PICKERING,D.J."Anisotropic Elastic Parameters for Soil"Geotechnique 20, pp 271-276, 1970.
30. KLOMP,A.G.J. and DORMON,G.M."Stress distribution and dynamic testing inrelation to road design". Proc. AustralianRoad Research Board, Vol.2, Part 2, 1964.
129

31. KIRWAN,R.W. and MAHER,M.L."Further investigations towards a rationalmethod of design for flexible pavements".Final Technical Report E.R.O. DA-ERO-591-73-60017, 1976.
32. ODEMARKN."Investigations as to the elastic properties ofsoils and design of pavements according to thetheory of elasticity".Statens Vaginstitut, Maddelande, 77, 1949.
33. ULLIDTZ,P."The use of dynamic plate loading tests indesign of overlays". Res. Report No. 22,Tech., University of Denmark, 1973.
34. PROKSCH,H."Thickness design methods for asphalt roads inthe USSR, GDR, Poland and the CSSR Bitumen, 34,No.6, 1972.
35. DORMON,G.M. and METCALF,C.T."Design curves for flexible pavements basedon layered system theory".Highway Research Record, Vol. 17, -'4o. 71,pp 69-84, 1965.
36. BURT,M.E."Progress in pavement design".T.R.R.L. Report LR 508,1972.
37. THOMPSON,P.D., CRONEY,D. and CURRER,E.Iq.H."The Alconbury Hill experiment and its relationto flexible pavement design".Proc. 3rd Int. Conf. on the Structural Design
- of Asphalt Pavements, Vol. 1. pp 920-937.London, 1972.
38. LISTER,N.W."Deflection criteria for flexible pavements".T.R.R.L. Report LR 375, 1972.
lio
39. NORMAN,P.J., SNOWDON,R.A. and JACOBS,J.C."Pavement deflection measurements and theirapplication to structural maintenance and overlaydesign". T.R.R.L. Laboratory Report 571, 1973.
40. ROAD RESEARCH LABORATORYThe cost of constructing and maintaining flexibleand concrete pavements over 50 yearsRoad Research Laboratory, Report LR 256, 1969.
41. DONOVAN,T.J. and DAVITT,S.Performance of gravel in road pavements.Paper presented at Symposium on "Road Improvementin Ireland", Dublin. March 1978.
13
Si
Ii
13

ACKNOWLEDGEMENTS
The research work described in the Report has been
carried out with the financial support of
1. European Research Office of the United States Army.
2. An Foras Forbartha - The National Institute for
Physical Planning and Construction Research in
Ireland.
3. National Board for Science and Technology, Ireland.
We are very grateful for the support of these three
organisations.
We wish to show our appreciation for the encouragement and
help given to us by Mr. R. G. Alvin (U.S. Army Waterways
Experiment Station), Dr. H. Lemons (Chief Scientist,
European Research Office U.S. Army) and Mr. P. O'Keefe
(An Foras Forbartha)
We would like to thank Mr. S. Davitt, Mr. D. Hartford,
Dr. T. Orr and Mr. L. Prendergast for their assistance
with certain facets of this report.
132

4
-4
APPE&D Ix
I
K
a
IS

PI
APPENDIX 1
ADDITIONAL INPUT PARAMETERS FOR
ANISOTROPIC VERSION OF DEFPAV
E Vertical Resilient Modulusz
n The ratio of the Horizontal Resilient Modulus
to the Vertical Resilient Modulus, EC-)Ez
v : The ratio of horizontal strains resulting from
vertical strains
V hh : The ratio of horizontal strains resulting from
horizontal strains in the orthogonal direction
m The ratio of Shear Modulus in the vertical plane
to Vertical Resilient Modulus, G
\I '
(f