Embed Size (px)
Citation preview
20/04/23 Page 1 © Institute of Transport Economics
The importance of better data on traffic injury – state of the art
European Road Safety Day, October 13, 2010
Rune Elvik, Institute of Transport Economics, Oslo, Norway ([email protected])
20/04/23 © Institute of Transport EconomicsPage 2
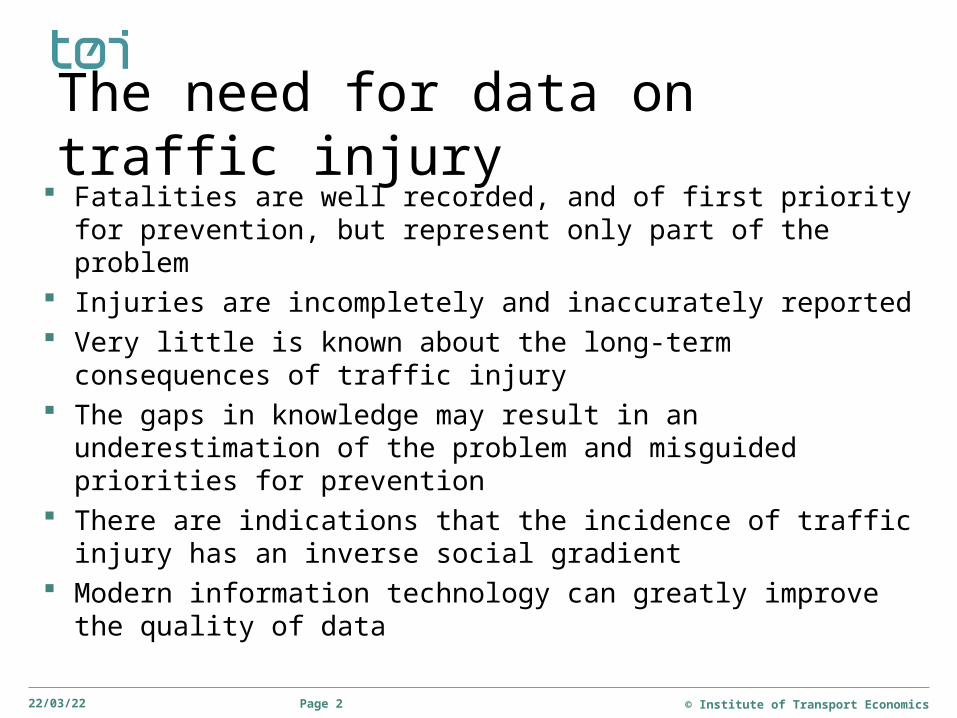
The need for data on traffic injury Fatalities are well recorded, and of first priority for
prevention, but represent only part of the problem Injuries are incompletely and inaccurately reported Very little is known about the long-term consequences of
traffic injury The gaps in knowledge may result in an underestimation of
the problem and misguided priorities for prevention There are indications that the incidence of traffic injury has
an inverse social gradient Modern information technology can greatly improve the
quality of data
20/04/23 © Institute of Transport EconomicsPage 3
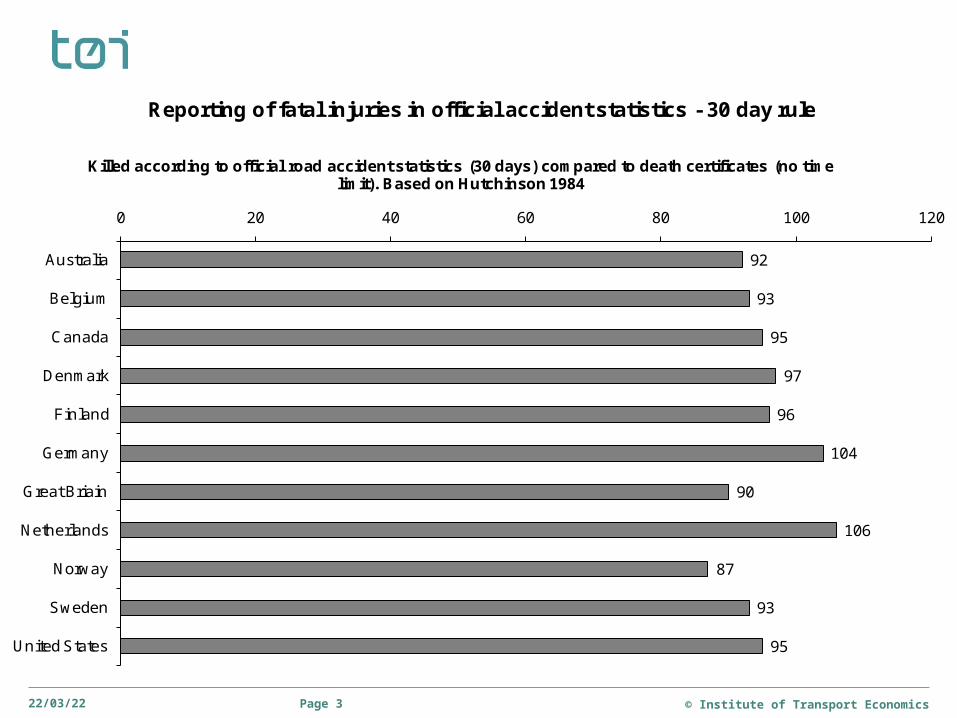
92
93
95
97
96
104
90
106
87
93
95
0 20 40 60 80 100 120
Australia
Belgium
Canada
Denmark
Finland
Germany
Great Briain
Netherlands
Norway
Sweden
United States
Killed according to official road accident statistics (30 days) compared to death certificates (no time limit). Based on Hutchinson 1984
Reporting of fatal injuries in official accident statistics - 30 day rule
20/04/23 © Institute of Transport EconomicsPage 4
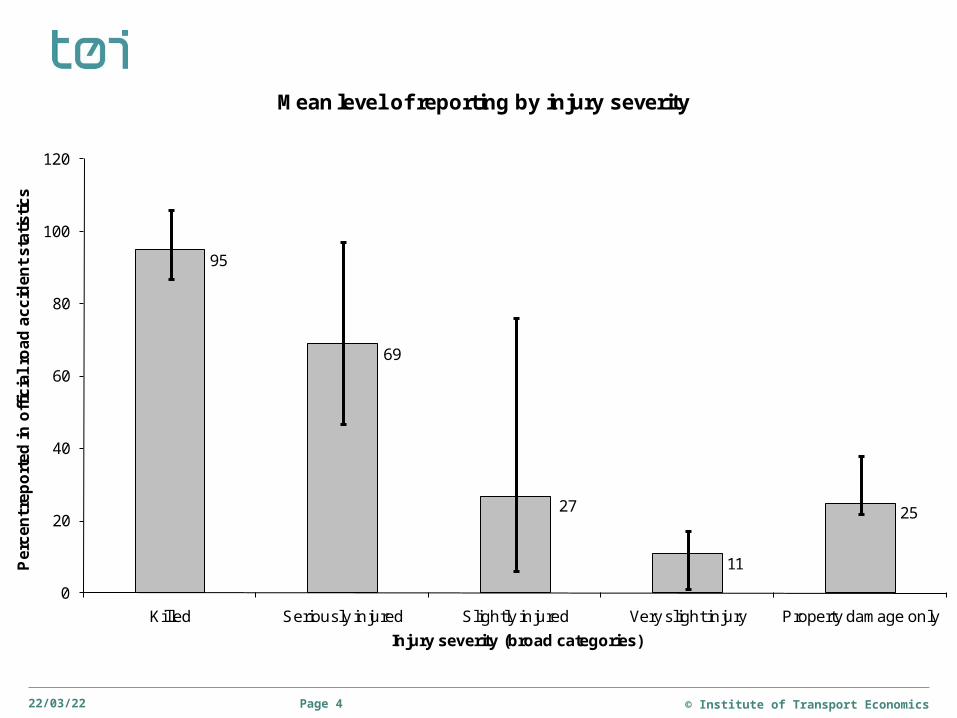
95
69
27
11
25
0
20
40
60
80
100
120
Killed Seriously injured Slightly injured Very slight injury Property damage only
Pe
rce
nt r
ep
ort
ed
in o
ffic
ial
roa
d a
cc
ide
nt
sta
tis
tic
s
Injury severity (broad categories)
Mean level of reporting by injury severity
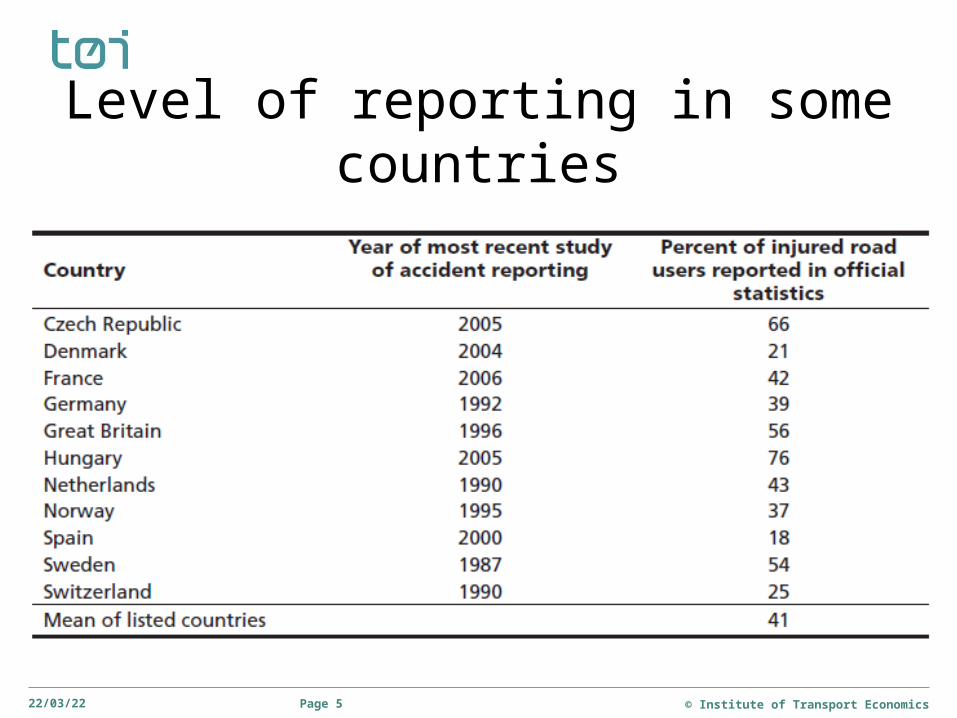
Level of reporting in some countries
20/04/23 © Institute of Transport EconomicsPage 5
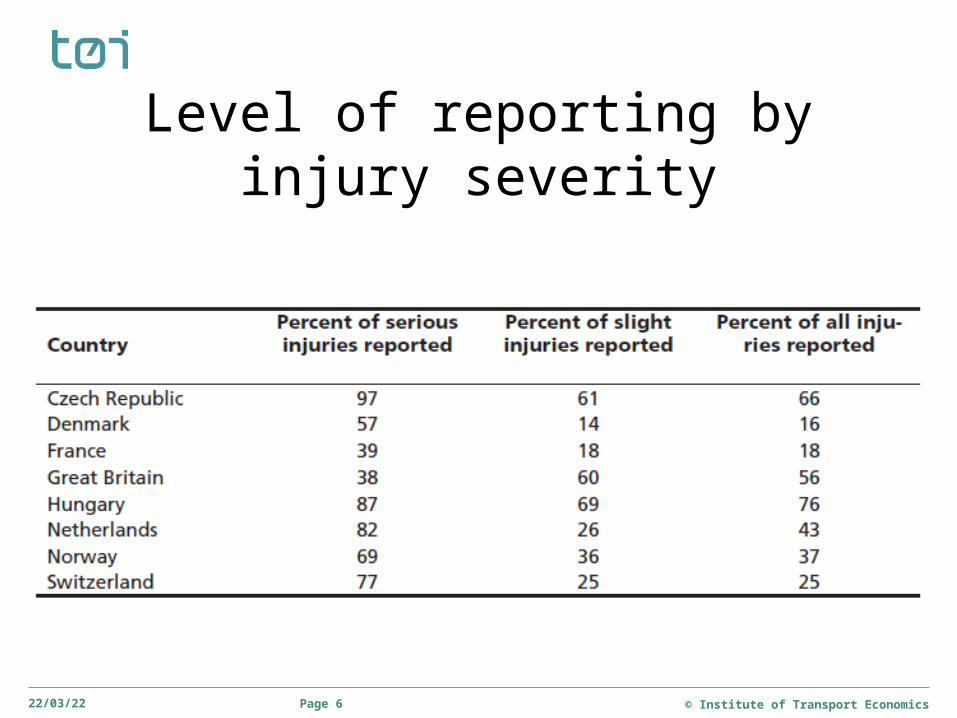
Level of reporting by injury severity
20/04/23 © Institute of Transport EconomicsPage 6
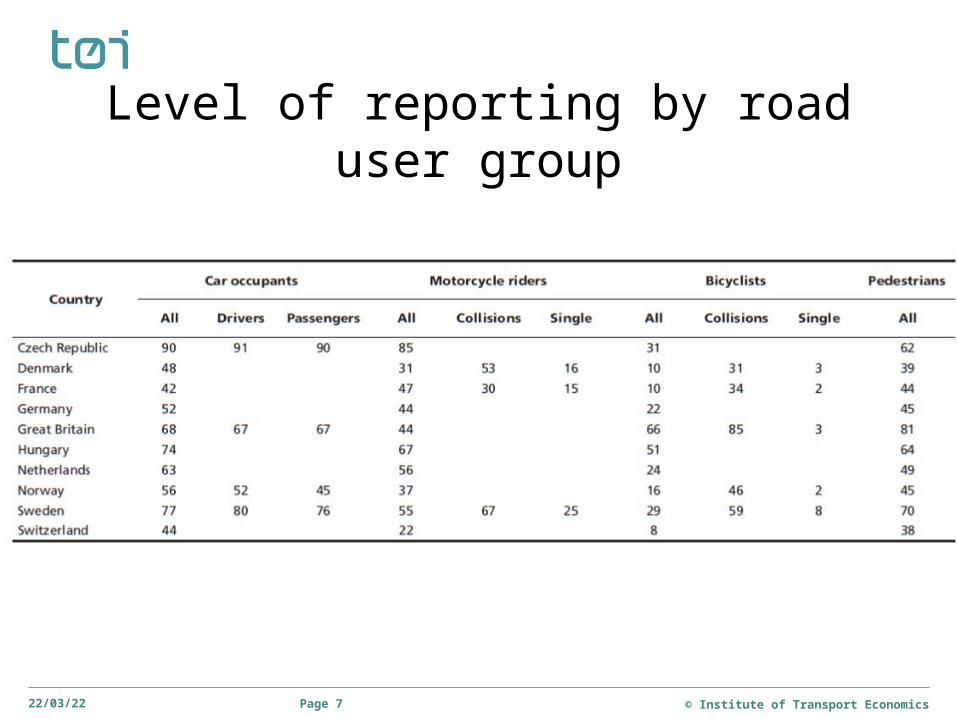
Level of reporting by road user group
20/04/23 © Institute of Transport EconomicsPage 7
20/04/23 © Institute of Transport EconomicsPage 8
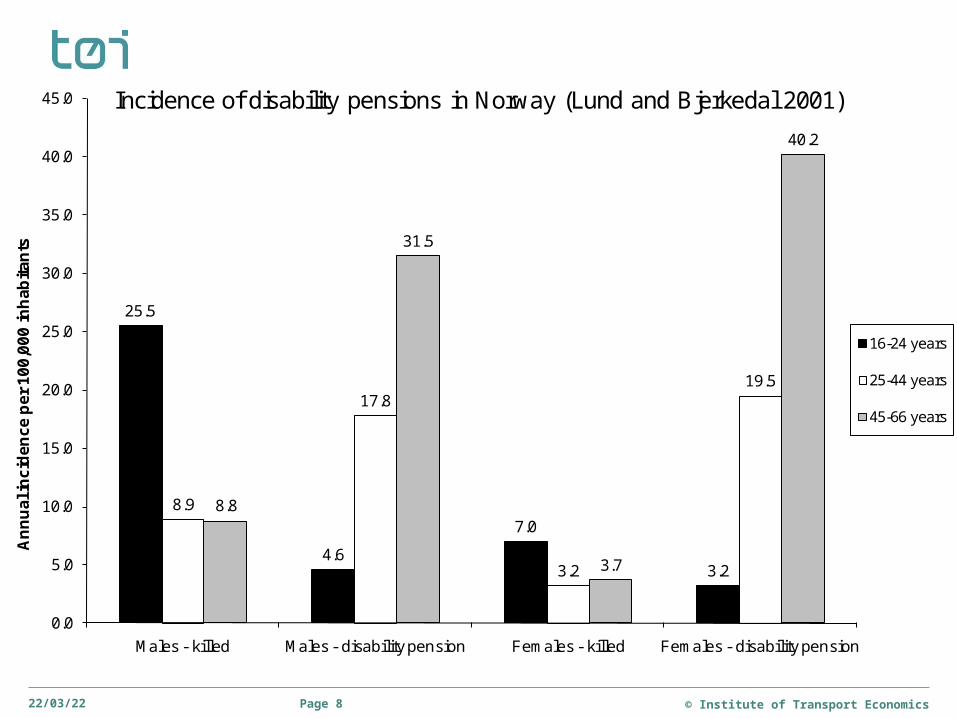
25.5
4.6
7.0
3.2
8.9
17.8
3.2
19.5
8.8
31.5
3.7
40.2
0.0
5.0
10.0
15.0
20.0
25.0
30.0
35.0
40.0
45.0
Males - killed Males - disability pension Females - killed Females - disability pension
An
nu
al i
nc
ide
nc
e p
er
10
0,0
00
in
ha
bit
an
ts
Incidence of disability pensions in Norway (Lund and Bjerkedal 2001)
16-24 years
25-44 years
45-66 years
20/04/23 © Institute of Transport EconomicsPage 9
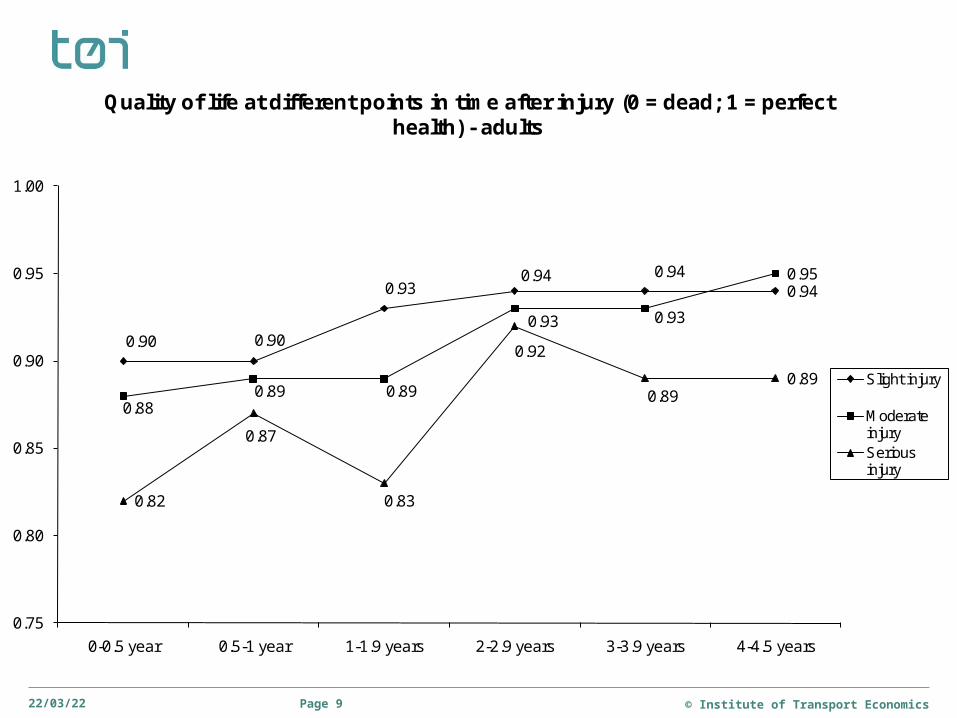
0.90 0.90
0.930.94 0.94
0.94
0.880.89 0.89
0.93 0.93
0.95
0.82
0.87
0.83
0.92
0.890.89
0.75
0.80
0.85
0.90
0.95
1.00
0-0.5 year 0.5-1 year 1-1.9 years 2-2.9 years 3-3.9 years 4-4.5 years
Quality of life at different points in time after injury (0 = dead; 1 = perfect health) - adults
Slight injury
Moderate injurySerious injury
20/04/23 © Institute of Transport EconomicsPage 10
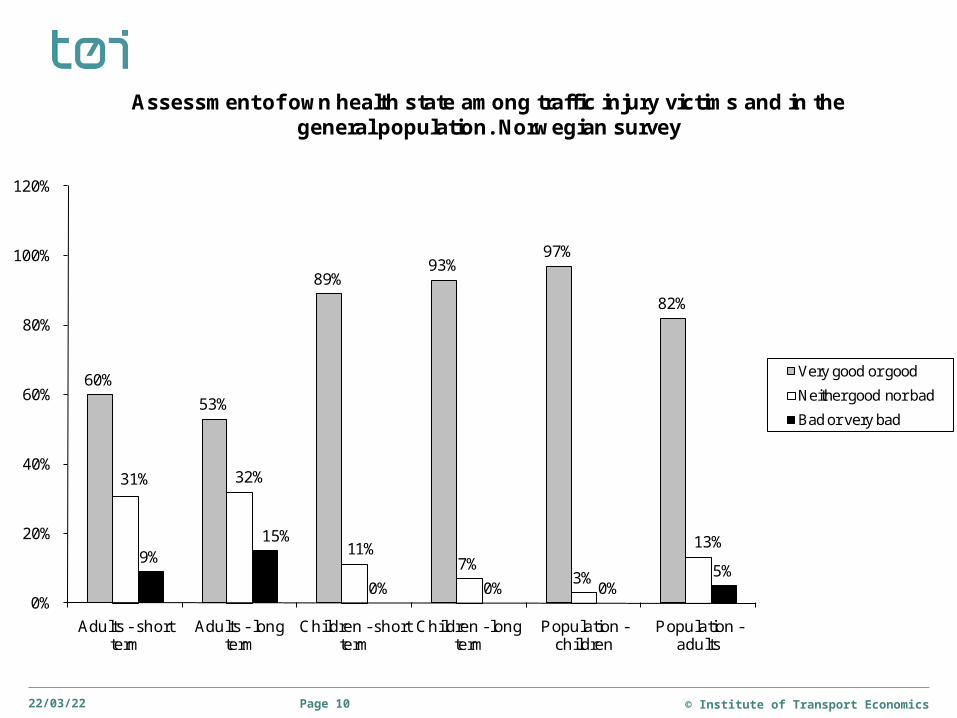
60%
53%
89%93%
97%
82%
31% 32%
11%7%
3%
13%9%
15%
0% 0% 0%5%
0%
20%
40%
60%
80%
100%
120%
Adults - short term
Adults - long term
Children - short term
Children - long term
Population -children
Population -adults
Assessment of own health state among traffic injury victims and in the general population. Norwegian survey
Very good or good
Neither good nor bad
Bad or very bad
20/04/23 © Institute of Transport EconomicsPage 11
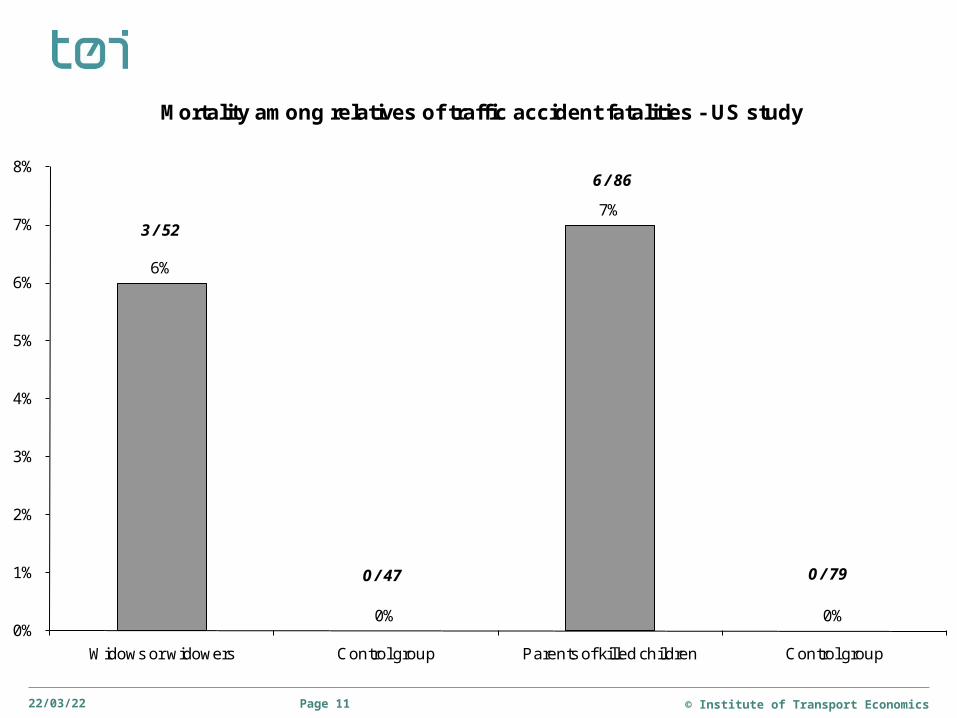
6%
0%
7%
0%0%
1%
2%
3%
4%
5%
6%
7%
8%
Widows or widowers Control group Parents of killed children Control group
Mortality among relatives of traffic accident fatalities - US study
3 / 52
0 / 47
6 / 86
0 / 79
20/04/23 © Institute of Transport EconomicsPage 12
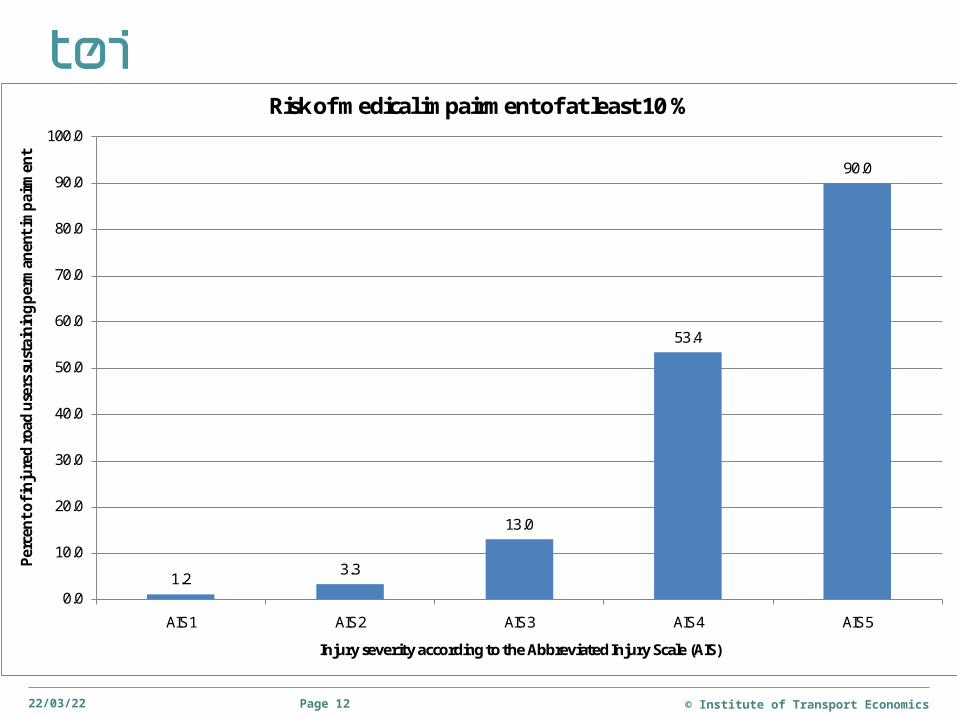
1.23.3
13.0
53.4
90.0
0.0
10.0
20.0
30.0
40.0
50.0
60.0
70.0
80.0
90.0
100.0
AIS 1 AIS 2 AIS 3 AIS 4 AIS 5
Perc
ent o
f inj
ured
road
use
rs su
stai
ning
per
man
ent i
mpa
irmen
t
Injury severity according to the Abbreviated Injury Scale (AIS)
Risk of medical impairment of at least 10 %
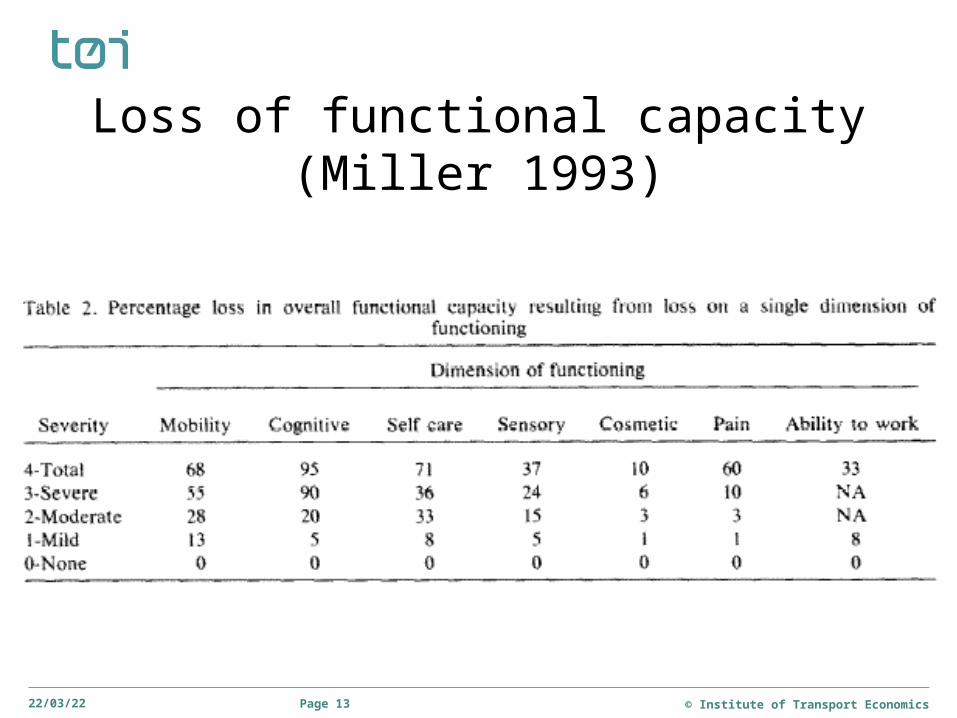
Loss of functional capacity (Miller 1993)
20/04/23 © Institute of Transport EconomicsPage 13
Some opportunities offered by modern technology
Automatic accident notification (e-Call) to shorten response time by emergency services
Installing GPS and crash pulse recorders in all cars to locate all accidents accurately and determine their severity
Systematic recording of injuries at all hospitals and outpatient clinics – accurate information on injury severity
Most injury victims will be able to indicate the location of the accident by studying computerised maps and clicking to indicate the location
20/04/23 © Institute of Transport EconomicsPage 14