Embed Size (px)
Citation preview
NOT PROTECTIVELY MARKED
Police Service of Northern Ireland
Police Recorded Injury Road Traffic Collision Statistics 2014 Key Statistics Report
Covering the reporting period 1st January 2014 – 31st December 2014
Published 27th March 2015
Contact: Traffic Statistician, Statistics Branch, Operational Support Department
Lisnasharragh, 42 Montgomery Road, Belfast, Northern Ireland, BT6 9LD
Web: www.psni.police.uk
Tel: 02890 650222 Ext: 24135 Email: [email protected]
Police Recorded Injury Road Traffic Collision Statistics 2015 Key Statistics Report
Covering the reporting period 1st January 2015 – 31st December 2015
Published 24th March 2016
Contact: Traffic Statistician, Statistics Branch, Operational Support Department
Lisnasharragh, 42 Montgomery Road, Belfast, Northern Ireland, BT6 9LD
Web: www.psni.police.uk
Tel: 02890 650222 Ext: 24135 Email: [email protected]
NOT PROTECTIVELY MARKED
2
Key Results 2015 Published 24th March 2016
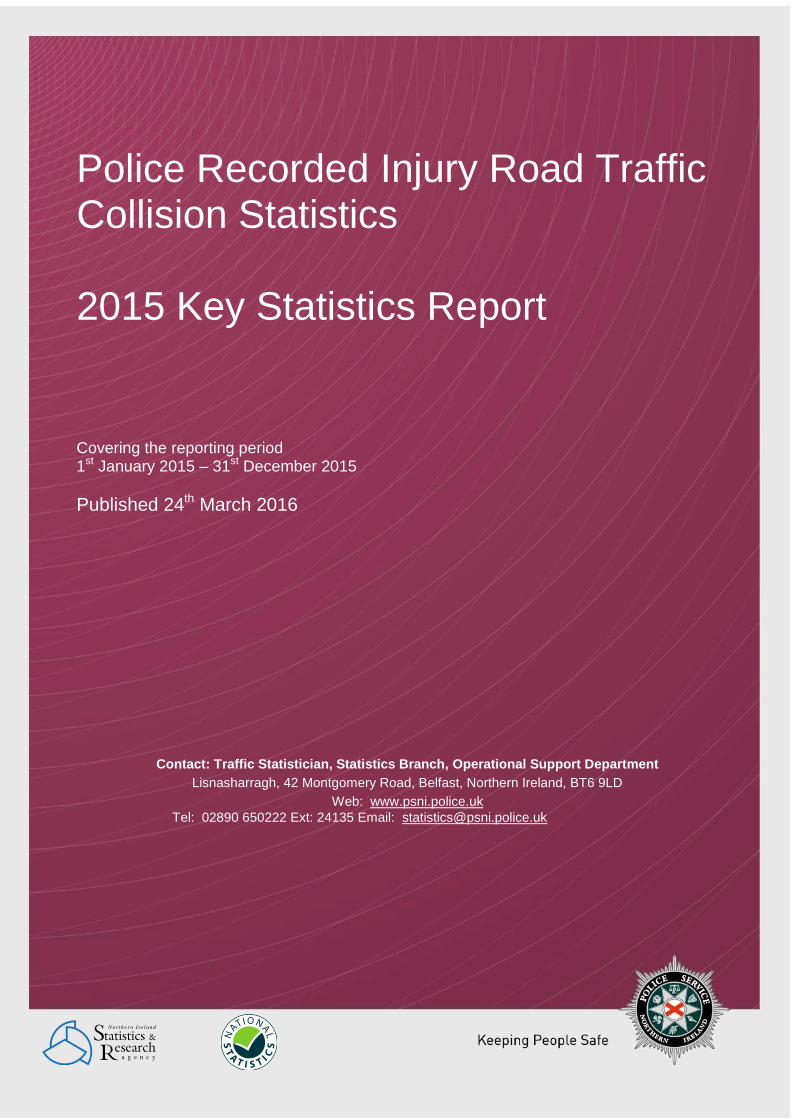
There were 6,147 injury collisions recorded by PSNI between January to December 2015 resulting in a total of 9,737 casualties.
74 people were killed, 711 people were seriously injured and a further 8,952 people were slightly
injured.
The 9,737 casualties and 6,147 injury road traffic collisions is the highest number observed for each since 2009, continuing the upward casualty trend from previous years.
The 74 deaths recorded in 2015 is five fewer deaths than 2014, 52 fewer than 2006 and 298 fewer
than 1972 which had the highest annual total of deaths with 372.
The number of deaths among pedestrians, drivers and passengers recorded in 2015 is the highest for each of these categories in a calendar year since 2009.
No pedal cyclists were killed in 2015 which is the first time there have been no deaths in this category
since 2010.
The 98 KSI casualties of older people (aged 65 and over) recorded in 2015 is along with 2012 the fewest recorded for this age category in a calendar year since this level of detail began being recorded in 1986.
There were 82 motorcyclists killed or seriously injured in 2015. This is the fewest number of KSI
casualties among motorcyclists since 1996. See Appendix 2.
Figure One
5,628 5,990
6,223 6,251
5,666 5,594 5,775 5,820 6,085 6,147
9,182 9,436 9,551
9,767
8,957 8,760 9,010 9,187 9,388
9,737
0
2,000
4,000
6,000
8,000
10,000
2006 2007 2008 2009 2010 2011 2012 2013 2014 2015
Year
Reported Injury Road Traffic Collisions in Northern Ireland 2006 to 2015
Collisions Casualties
NOT PROTECTIVELY MARKED
3
Fatalities Figure Two
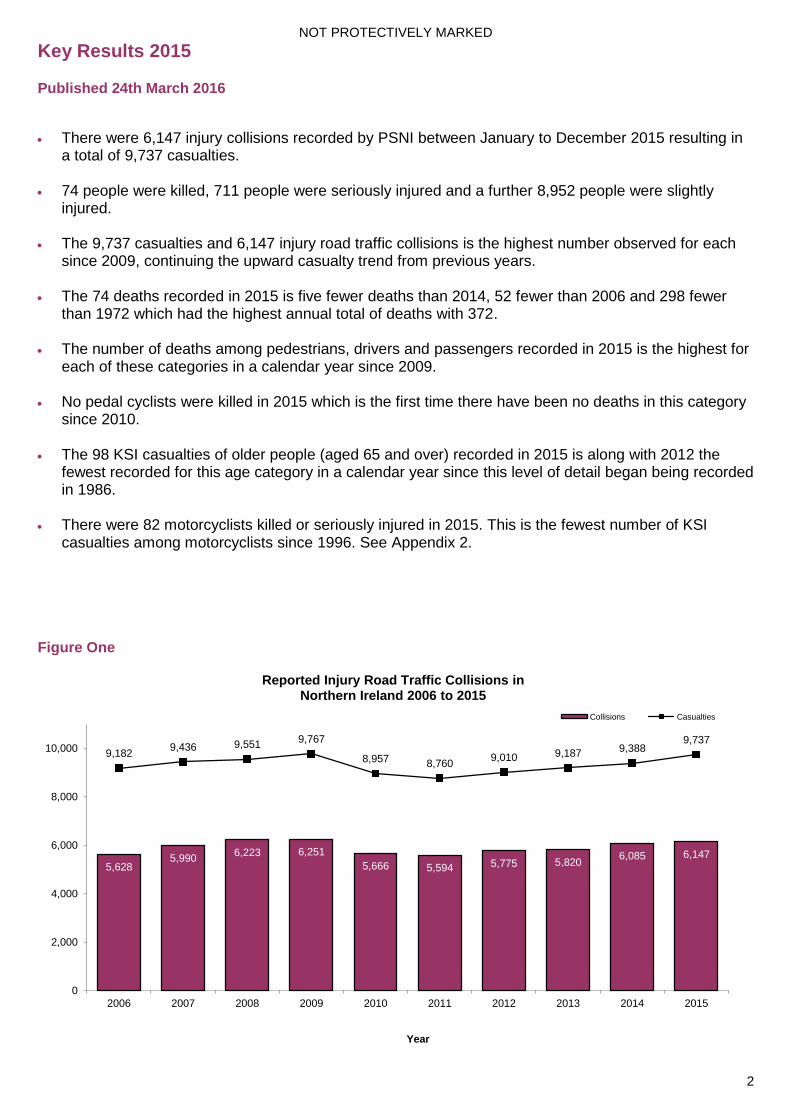
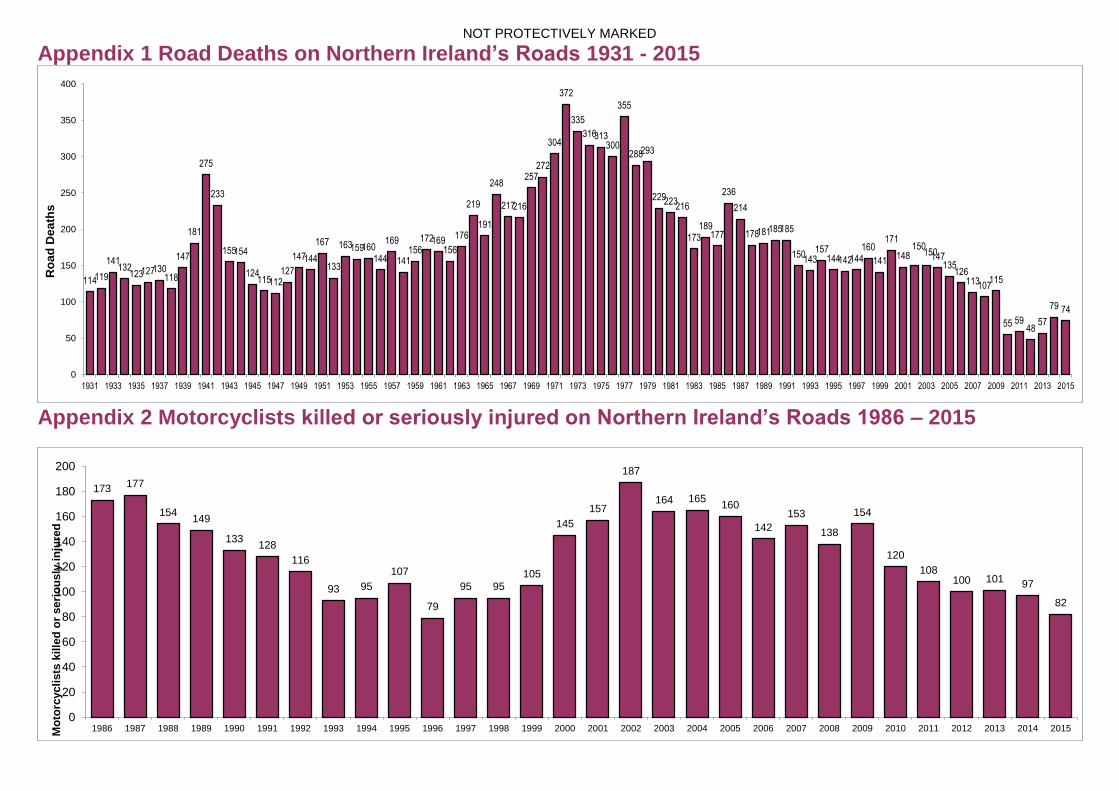
The 74 people killed on Northern Ireland’s roads during 2015 is 5 fewer deaths than the 79 recorded in 2014 but 17 higher than that of 2013. This represents 52 fewer deaths than that recorded ten years ago in 2006 and 298 fewer than the high of 372 deaths recorded in 1972. See Appendix 1 for fatalities by year dating back to 1931.
Drivers of motor vehicles were the largest casualty class for fatalities in 2015, accounting for 31
people killed. Pedestrians were the next highest category with 19 fatalities while there were also 17 passengers, 4 motorcyclists and 3 other road users killed.
There were no pedal cyclists killed in 2015 which is the first time this category has had no deaths in a
calendar year since 2010. In contrast there were 19 pedestrians killed, which is the highest number of deaths recorded amongst this group in a calendar year since 24 were killed in 2009.
There were 5 fatalities of children (under the age of 16) and 18 deaths of young people (aged 16 to
24) recorded in 2015 compared with 4 child and 21 young people deaths in 2014. Of the 74 people killed on Northern Ireland’s roads in 2015, 53 were male and 21 female. Over half
the fatalities came from the 16 to 24 and 65 and over age groups combined (with 18 and 20 deaths respectively).
The worst period for fatalities was in June 2015 when 6 people lost their lives in 8 days from the 3
rd to
the 10th June. In contrast there was a period of 26 days between January and February 2015 in which
no deaths occurred. Of the new 11 police Districts, Armagh City, Banbridge and Craigavon along with Mid Ulster had the
highest number of road deaths in 2015 with 9 fatalities recorded in each of these Districts.
There were 165 deaths recorded in the Republic of Ireland in 2015 which is a 15% reduction from the 193 deaths which took place in 2014. In contrast to this, the latest figures recorded for Great Britain has shown a 3% increase in the number of deaths recorded from 1,780 to the year ending September 2015 in comparison with 1,731 recorded in the previous year. The comparative 2015 figure for Northern Ireland is a 6% reduction in fatalities from 2014.
126
113 107
115
55 59
48
57
79 74
0
40
80
120
160
2006 2007 2008 2009 2010 2011 2012 2013 2014 2015
Pe
op
le k
ille
d
Year
Fatalities resulting from road traffic collisions in Northern Ireland 2006 to 2015
NOT PROTECTIVELY MARKED
4
Number of people killed or seriously injured (KSI Casualties) Figure Three
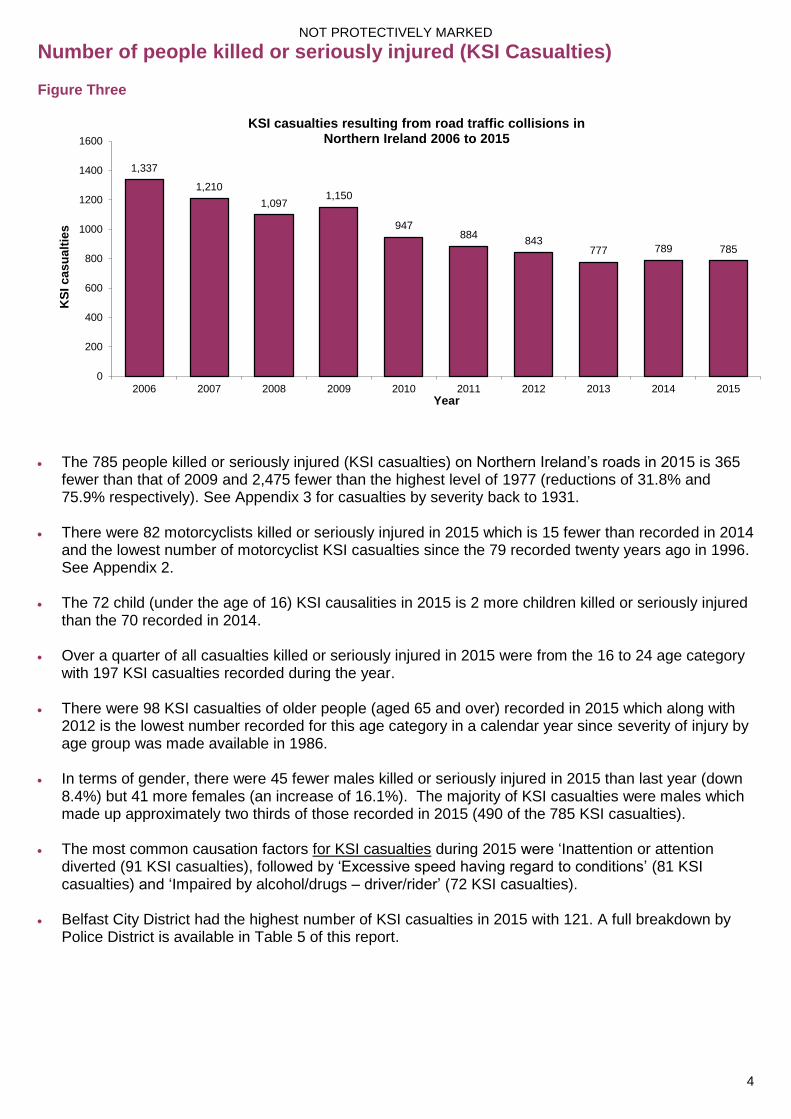
The 785 people killed or seriously injured (KSI casualties) on Northern Ireland’s roads in 2015 is 365 fewer than that of 2009 and 2,475 fewer than the highest level of 1977 (reductions of 31.8% and 75.9% respectively). See Appendix 3 for casualties by severity back to 1931.
There were 82 motorcyclists killed or seriously injured in 2015 which is 15 fewer than recorded in 2014
and the lowest number of motorcyclist KSI casualties since the 79 recorded twenty years ago in 1996. See Appendix 2.
The 72 child (under the age of 16) KSI causalities in 2015 is 2 more children killed or seriously injured
than the 70 recorded in 2014.
Over a quarter of all casualties killed or seriously injured in 2015 were from the 16 to 24 age category with 197 KSI casualties recorded during the year.
There were 98 KSI casualties of older people (aged 65 and over) recorded in 2015 which along with
2012 is the lowest number recorded for this age category in a calendar year since severity of injury by age group was made available in 1986.
In terms of gender, there were 45 fewer males killed or seriously injured in 2015 than last year (down
8.4%) but 41 more females (an increase of 16.1%). The majority of KSI casualties were males which made up approximately two thirds of those recorded in 2015 (490 of the 785 KSI casualties).
The most common causation factors for KSI casualties during 2015 were ‘Inattention or attention
diverted (91 KSI casualties), followed by ‘Excessive speed having regard to conditions’ (81 KSI casualties) and ‘Impaired by alcohol/drugs – driver/rider’ (72 KSI casualties).
Belfast City District had the highest number of KSI casualties in 2015 with 121. A full breakdown by
Police District is available in Table 5 of this report.
1,337
1,210
1,097 1,150
947 884
843 777 789 785
0
200
400
600
800
1000
1200
1400
1600
2006 2007 2008 2009 2010 2011 2012 2013 2014 2015
KS
I c
as
ua
ltie
s
Year
KSI casualties resulting from road traffic collisions in Northern Ireland 2006 to 2015
NOT PROTECTIVELY MARKED
5
Figure Four
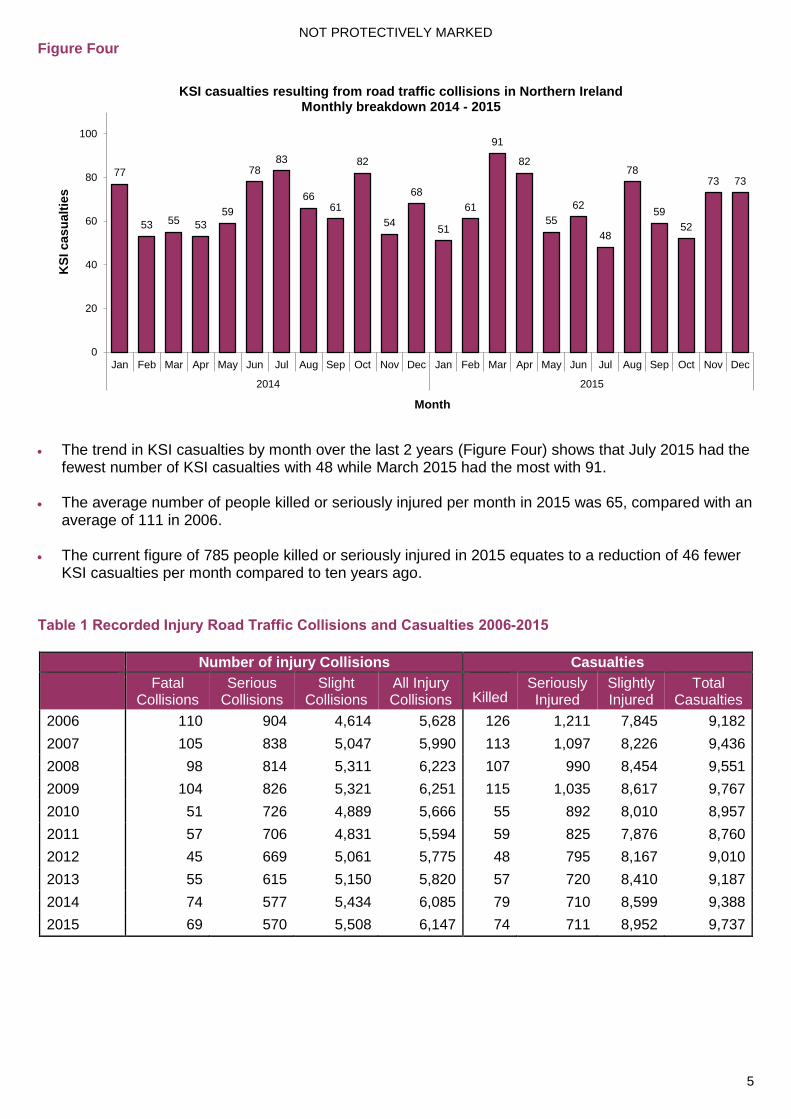
The trend in KSI casualties by month over the last 2 years (Figure Four) shows that July 2015 had the fewest number of KSI casualties with 48 while March 2015 had the most with 91.
The average number of people killed or seriously injured per month in 2015 was 65, compared with an
average of 111 in 2006. The current figure of 785 people killed or seriously injured in 2015 equates to a reduction of 46 fewer
KSI casualties per month compared to ten years ago. Table 1 Recorded Injury Road Traffic Collisions and Casualties 2006-2015
Number of injury Collisions Casualties
Fatal Collisions
Serious Collisions
Slight Collisions
All Injury Collisions Killed
Seriously Injured
Slightly Injured
Total Casualties
2006 110 904 4,614 5,628 126 1,211 7,845 9,182
2007 105 838 5,047 5,990 113 1,097 8,226 9,436
2008 98 814 5,311 6,223 107 990 8,454 9,551
2009 104 826 5,321 6,251 115 1,035 8,617 9,767
2010 51 726 4,889 5,666 55 892 8,010 8,957
2011 57 706 4,831 5,594 59 825 7,876 8,760
2012 45 669 5,061 5,775 48 795 8,167 9,010
2013 55 615 5,150 5,820 57 720 8,410 9,187
2014 74 577 5,434 6,085 79 710 8,599 9,388
2015 69 570 5,508 6,147 74 711 8,952 9,737
77
53 55 53
59
78 83
66 61
82
54
68
51
61
91
82
55
62
48
78
59
52
73 73
0
20
40
60
80
100
Jan Feb Mar Apr May Jun Jul Aug Sep Oct Nov Dec Jan Feb Mar Apr May Jun Jul Aug Sep Oct Nov Dec
2014 2015
KS
I cas
ualt
ies
Month
KSI casualties resulting from road traffic collisions in Northern Ireland Monthly breakdown 2014 - 2015
NOT PROTECTIVELY MARKED
6
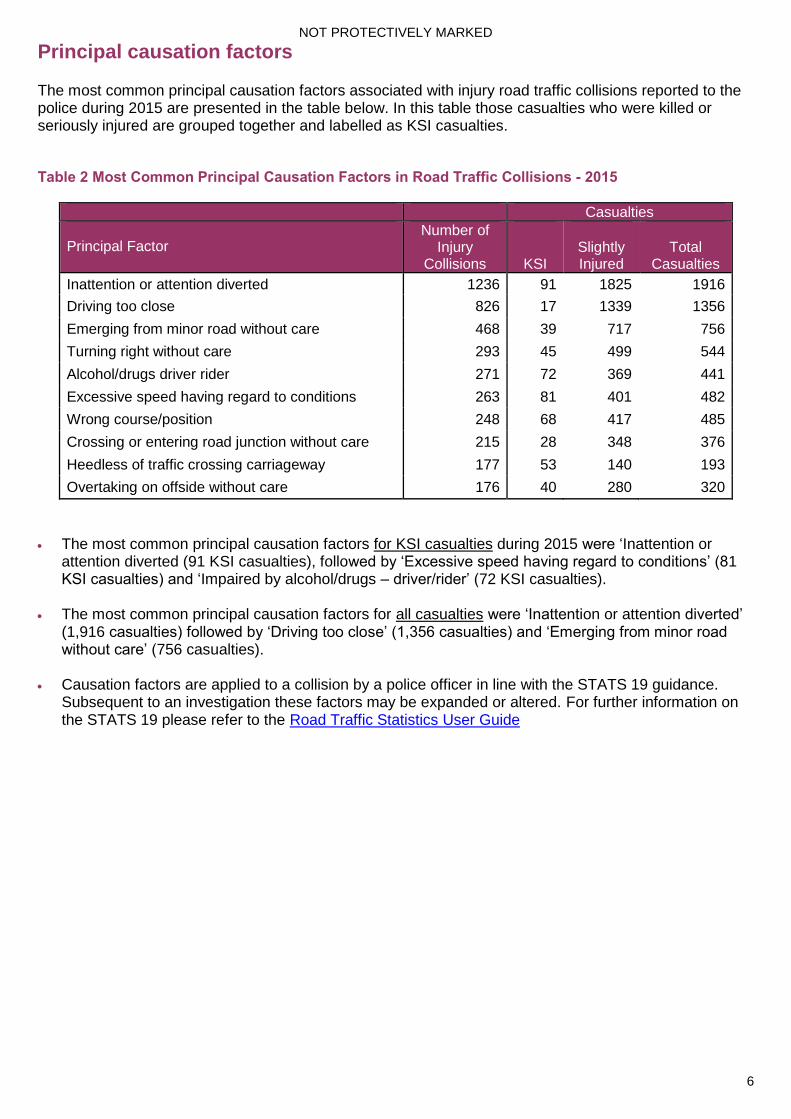
Principal causation factors The most common principal causation factors associated with injury road traffic collisions reported to the police during 2015 are presented in the table below. In this table those casualties who were killed or seriously injured are grouped together and labelled as KSI casualties. Table 2 Most Common Principal Causation Factors in Road Traffic Collisions - 2015
Casualties
Principal Factor Number of
Injury Collisions
KSI
Slightly Injured
Total
Casualties
Inattention or attention diverted 1236 91 1825 1916
Driving too close 826 17 1339 1356
Emerging from minor road without care 468 39 717 756
Turning right without care 293 45 499 544
Alcohol/drugs driver rider 271 72 369 441
Excessive speed having regard to conditions 263 81 401 482
Wrong course/position 248 68 417 485
Crossing or entering road junction without care 215 28 348 376
Heedless of traffic crossing carriageway 177 53 140 193
Overtaking on offside without care 176 40 280 320
The most common principal causation factors for KSI casualties during 2015 were ‘Inattention or
attention diverted (91 KSI casualties), followed by ‘Excessive speed having regard to conditions’ (81 KSI casualties) and ‘Impaired by alcohol/drugs – driver/rider’ (72 KSI casualties).
The most common principal causation factors for all casualties were ‘Inattention or attention diverted’
(1,916 casualties) followed by ‘Driving too close’ (1,356 casualties) and ‘Emerging from minor road without care’ (756 casualties).
Causation factors are applied to a collision by a police officer in line with the STATS 19 guidance.
Subsequent to an investigation these factors may be expanded or altered. For further information on the STATS 19 please refer to the Road Traffic Statistics User Guide
NOT PROTECTIVELY MARKED
7
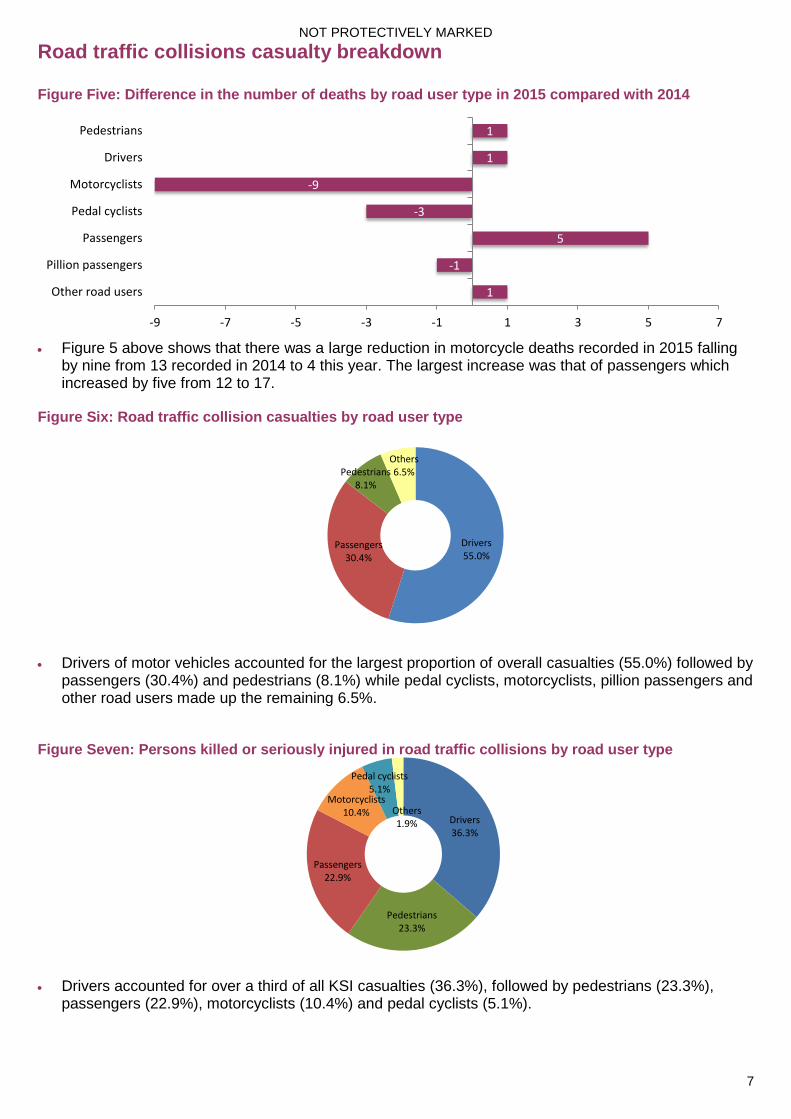
Road traffic collisions casualty breakdown Figure Five: Difference in the number of deaths by road user type in 2015 compared with 2014
Figure 5 above shows that there was a large reduction in motorcycle deaths recorded in 2015 falling
by nine from 13 recorded in 2014 to 4 this year. The largest increase was that of passengers which increased by five from 12 to 17.
Figure Six: Road traffic collision casualties by road user type
Drivers of motor vehicles accounted for the largest proportion of overall casualties (55.0%) followed by
passengers (30.4%) and pedestrians (8.1%) while pedal cyclists, motorcyclists, pillion passengers and other road users made up the remaining 6.5%.
Figure Seven: Persons killed or seriously injured in road traffic collisions by road user type
Drivers accounted for over a third of all KSI casualties (36.3%), followed by pedestrians (23.3%), passengers (22.9%), motorcyclists (10.4%) and pedal cyclists (5.1%).
1
-1
5
-3
-9
1
1
-9 -7 -5 -3 -1 1 3 5 7
Other road users
Pillion passengers
Passengers
Pedal cyclists
Motorcyclists
Drivers
Pedestrians
Drivers 55.0%
Passengers 30.4%
Pedestrians 8.1%
Others 6.5%
Drivers 36.3%
Pedestrians 23.3%
Passengers 22.9%
Motorcyclists 10.4%
Pedal cyclists 5.1%
Others 1.9%
NOT PROTECTIVELY MARKED
8
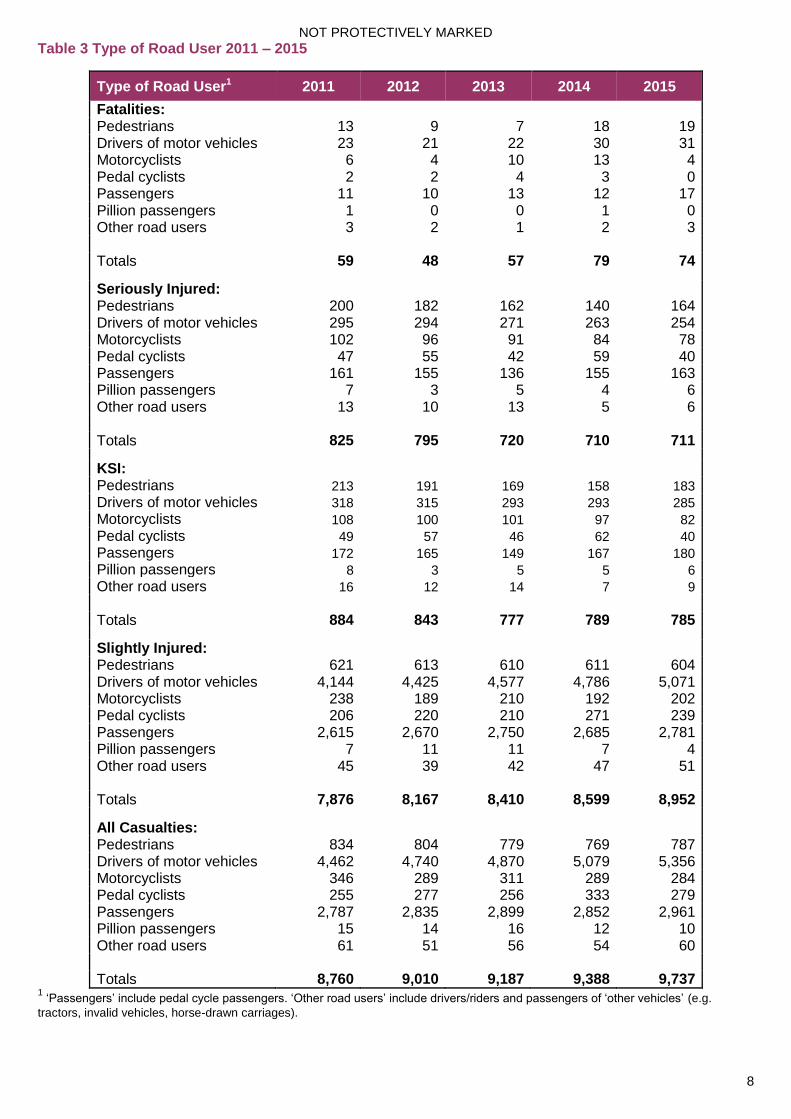
Table 3 Type of Road User 2011 – 2015
Type of Road User1 2011 2012 2013 2014 2015
Fatalities: Pedestrians 13 9 7 18 19 Drivers of motor vehicles 23 21 22 30 31 Motorcyclists 6 4 10 13 4 Pedal cyclists 2 2 4 3 0 Passengers 11 10 13 12 17 Pillion passengers 1 0 0 1 0 Other road users 3 2 1 2 3 Totals 59 48 57 79 74 Seriously Injured: Pedestrians 200 182 162 140 164 Drivers of motor vehicles 295 294 271 263 254 Motorcyclists 102 96 91 84 78 Pedal cyclists 47 55 42 59 40 Passengers 161 155 136 155 163 Pillion passengers 7 3 5 4 6 Other road users 13 10 13 5 6 Totals 825 795 720 710 711 KSI: Pedestrians 213 191 169 158 183
Drivers of motor vehicles 318 315 293 293 285
Motorcyclists 108 100 101 97 82
Pedal cyclists 49 57 46 62 40
Passengers 172 165 149 167 180
Pillion passengers 8 3 5 5 6
Other road users 16 12 14 7 9
Totals 884 843 777 789 785 Slightly Injured: Pedestrians 621 613 610 611 604 Drivers of motor vehicles 4,144 4,425 4,577 4,786 5,071 Motorcyclists 238 189 210 192 202 Pedal cyclists 206 220 210 271 239 Passengers 2,615 2,670 2,750 2,685 2,781 Pillion passengers 7 11 11 7 4 Other road users 45 39 42 47 51 Totals 7,876 8,167 8,410 8,599 8,952 All Casualties: Pedestrians 834 804 779 769 787 Drivers of motor vehicles 4,462 4,740 4,870 5,079 5,356 Motorcyclists 346 289 311 289 284 Pedal cyclists 255 277 256 333 279 Passengers 2,787 2,835 2,899 2,852 2,961 Pillion passengers 15 14 16 12 10 Other road users 61 51 56 54 60 Totals 8,760 9,010 9,187 9,388 9,737
1 ‘Passengers’ include pedal cycle passengers. ‘Other road users’ include drivers/riders and passengers of ‘other vehicles’ (e.g.
tractors, invalid vehicles, horse-drawn carriages).
NOT PROTECTIVELY MARKED
9
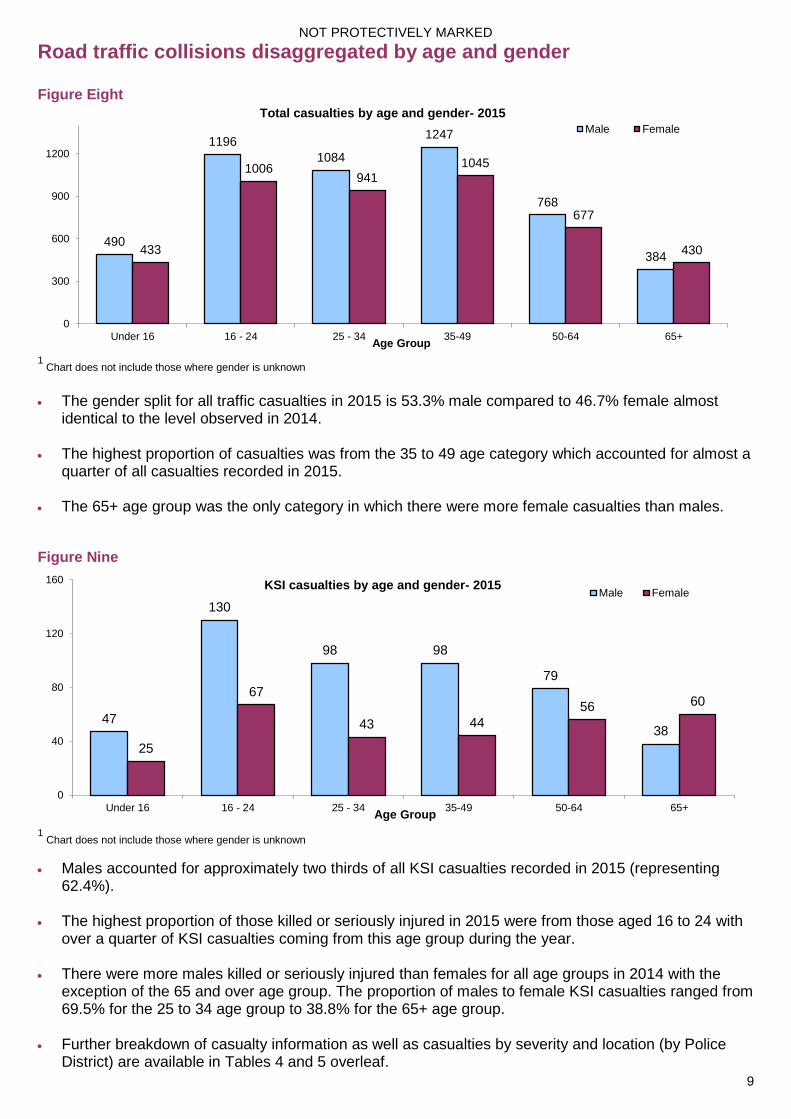
Road traffic collisions disaggregated by age and gender Figure Eight
1
Chart does not include those where gender is unknown
The gender split for all traffic casualties in 2015 is 53.3% male compared to 46.7% female almost
identical to the level observed in 2014. The highest proportion of casualties was from the 35 to 49 age category which accounted for almost a
quarter of all casualties recorded in 2015. The 65+ age group was the only category in which there were more female casualties than males. Figure Nine
1 Chart does not include those where gender is unknown
Males accounted for approximately two thirds of all KSI casualties recorded in 2015 (representing 62.4%).
The highest proportion of those killed or seriously injured in 2015 were from those aged 16 to 24 with over a quarter of KSI casualties coming from this age group during the year.
There were more males killed or seriously injured than females for all age groups in 2014 with the
exception of the 65 and over age group. The proportion of males to female KSI casualties ranged from 69.5% for the 25 to 34 age group to 38.8% for the 65+ age group.
Further breakdown of casualty information as well as casualties by severity and location (by Police
District) are available in Tables 4 and 5 overleaf.
490
1196
1084
1247
768
384 433
1006 941
1045
677
430
0
300
600
900
1200
Under 16 16 - 24 25 - 34 35-49 50-64 65+Age Group
Total casualties by age and gender- 2015
Male Female
47
130
98 98
79
38
25
67
43 44
56 60
0
40
80
120
160
Under 16 16 - 24 25 - 34 35-49 50-64 65+Age Group
KSI casualties by age and gender- 2015 Male Female
NOT PROTECTIVELY MARKED
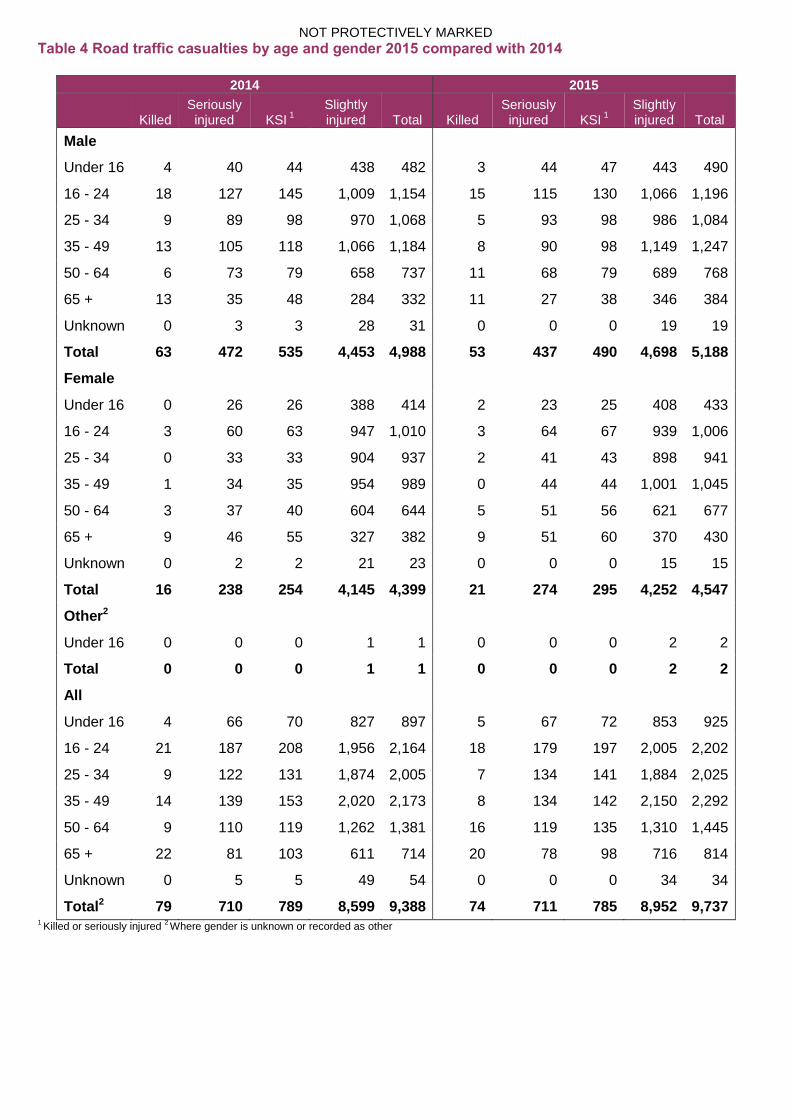
Table 4 Road traffic casualties by age and gender 2015 compared with 2014
2014 2015
Killed Seriously injured KSI
1
Slightly injured Total Killed
Seriously injured KSI
1
Slightly injured Total
Male
Under 16 4 40 44 438 482 3 44 47 443 490
16 - 24 18 127 145 1,009 1,154 15 115 130 1,066 1,196
25 - 34 9 89 98 970 1,068 5 93 98 986 1,084
35 - 49 13 105 118 1,066 1,184 8 90 98 1,149 1,247
50 - 64 6 73 79 658 737 11 68 79 689 768
65 + 13 35 48 284 332 11 27 38 346 384
Unknown 0 3 3 28 31 0 0 0 19 19
Total 63 472 535 4,453 4,988 53 437 490 4,698 5,188
Female
Under 16 0 26 26 388 414 2 23 25 408 433
16 - 24 3 60 63 947 1,010 3 64 67 939 1,006
25 - 34 0 33 33 904 937 2 41 43 898 941
35 - 49 1 34 35 954 989 0 44 44 1,001 1,045
50 - 64 3 37 40 604 644 5 51 56 621 677
65 + 9 46 55 327 382 9 51 60 370 430
Unknown 0 2 2 21 23 0 0 0 15 15
Total 16 238 254 4,145 4,399 21 274 295 4,252 4,547
Other2
Under 16 0 0 0 1 1 0 0 0 2 2
Total 0 0 0 1 1 0 0 0 2 2
All
Under 16 4 66 70 827 897 5 67 72 853 925
16 - 24 21 187 208 1,956 2,164 18 179 197 2,005 2,202
25 - 34 9 122 131 1,874 2,005 7 134 141 1,884 2,025
35 - 49 14 139 153 2,020 2,173 8 134 142 2,150 2,292
50 - 64 9 110 119 1,262 1,381 16 119 135 1,310 1,445
65 + 22 81 103 611 714 20 78 98 716 814
Unknown 0 5 5 49 54 0 0 0 34 34
Total2 79 710 789 8,599 9,388 74 711 785 8,952 9,737 1 Killed or seriously injured
2 Where gender is unknown or recorded as other
NOT PROTECTIVELY MARKED
11
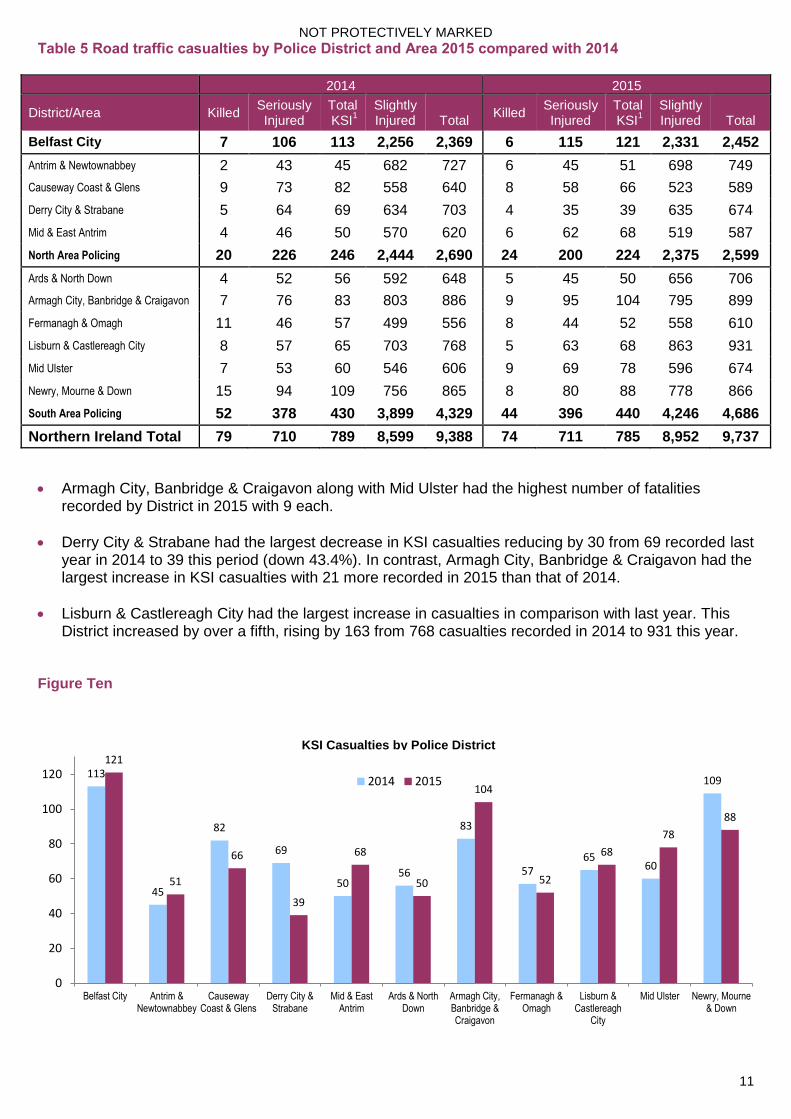
Table 5 Road traffic casualties by Police District and Area 2015 compared with 2014
2014 2015
District/Area Killed Seriously Injured
Total KSI
1
Slightly Injured
Total
Killed Seriously Injured
Total KSI
1 Slightly Injured
Total
Belfast City 7 106 113 2,256 2,369 6 115 121 2,331 2,452
Antrim & Newtownabbey 2 43 45 682 727 6 45 51 698 749
Causeway Coast & Glens 9 73 82 558 640 8 58 66 523 589
Derry City & Strabane 5 64 69 634 703 4 35 39 635 674
Mid & East Antrim 4 46 50 570 620 6 62 68 519 587
North Area Policing 20 226 246 2,444 2,690 24 200 224 2,375 2,599
Ards & North Down 4 52 56 592 648 5 45 50 656 706
Armagh City, Banbridge & Craigavon 7 76 83 803 886 9 95 104 795 899
Fermanagh & Omagh 11 46 57 499 556 8 44 52 558 610
Lisburn & Castlereagh City 8 57 65 703 768 5 63 68 863 931
Mid Ulster 7 53 60 546 606 9 69 78 596 674
Newry, Mourne & Down 15 94 109 756 865 8 80 88 778 866
South Area Policing 52 378 430 3,899 4,329 44 396 440 4,246 4,686
Northern Ireland Total 79 710 789 8,599 9,388 74 711 785 8,952 9,737
Armagh City, Banbridge & Craigavon along with Mid Ulster had the highest number of fatalities recorded by District in 2015 with 9 each.
Derry City & Strabane had the largest decrease in KSI casualties reducing by 30 from 69 recorded last year in 2014 to 39 this period (down 43.4%). In contrast, Armagh City, Banbridge & Craigavon had the largest increase in KSI casualties with 21 more recorded in 2015 than that of 2014.
Lisburn & Castlereagh City had the largest increase in casualties in comparison with last year. This District increased by over a fifth, rising by 163 from 768 casualties recorded in 2014 to 931 this year.
Figure Ten
113
45
82
69
50 56
83
57 65
60
109
121
51
66
39
68
50
104
52
68
78
88
0
20
40
60
80
100
120
Belfast City Antrim &Newtownabbey
CausewayCoast & Glens
Derry City &Strabane
Mid & EastAntrim
Ards & NorthDown
Armagh City,Banbridge &Craigavon
Fermanagh &Omagh
Lisburn &Castlereagh
City
Mid Ulster Newry, Mourne& Down
2014 2015
KSI Casualties by Police District
NOT PROTECTIVELY MARKED
12
Update on Northern Ireland’s Road Safety Strategy
Figure Eleven
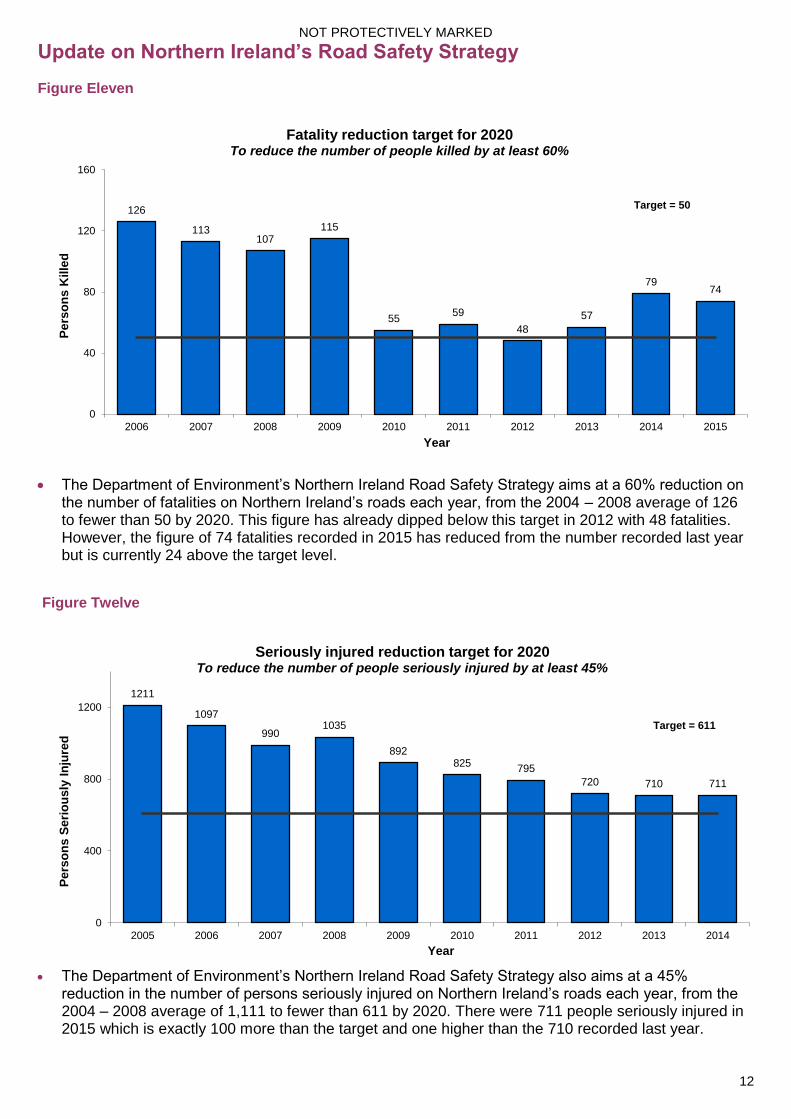
The Department of Environment’s Northern Ireland Road Safety Strategy aims at a 60% reduction on the number of fatalities on Northern Ireland’s roads each year, from the 2004 – 2008 average of 126 to fewer than 50 by 2020. This figure has already dipped below this target in 2012 with 48 fatalities. However, the figure of 74 fatalities recorded in 2015 has reduced from the number recorded last year but is currently 24 above the target level.
Figure Twelve
The Department of Environment’s Northern Ireland Road Safety Strategy also aims at a 45%
reduction in the number of persons seriously injured on Northern Ireland’s roads each year, from the 2004 – 2008 average of 1,111 to fewer than 611 by 2020. There were 711 people seriously injured in 2015 which is exactly 100 more than the target and one higher than the 710 recorded last year.
126
113 107
115
55 59
48
57
79 74
0
40
80
120
160
2006 2007 2008 2009 2010 2011 2012 2013 2014 2015
Pe
rso
ns
Kille
d
Year
Fatality reduction target for 2020 To reduce the number of people killed by at least 60%
1211
1097
990 1035
892 825
795
720 710 711
0
400
800
1200
2005 2006 2007 2008 2009 2010 2011 2012 2013 2014
Pe
rso
ns
Se
rio
us
ly I
nju
red
Year
Seriously injured reduction target for 2020 To reduce the number of people seriously injured by at least 45%
Target = 50
Target = 611
NOT PROTECTIVELY MARKED
13
Figure Thirteen
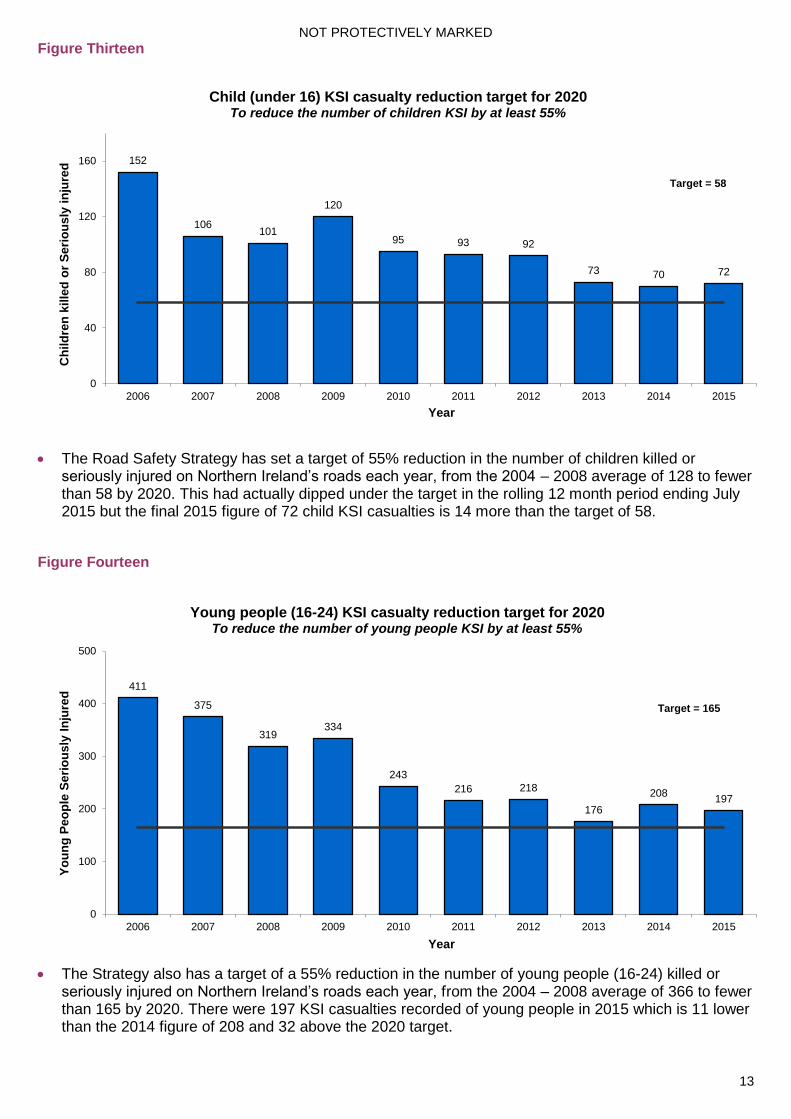
The Road Safety Strategy has set a target of 55% reduction in the number of children killed or seriously injured on Northern Ireland’s roads each year, from the 2004 – 2008 average of 128 to fewer than 58 by 2020. This had actually dipped under the target in the rolling 12 month period ending July 2015 but the final 2015 figure of 72 child KSI casualties is 14 more than the target of 58.
Figure Fourteen
The Strategy also has a target of a 55% reduction in the number of young people (16-24) killed or
seriously injured on Northern Ireland’s roads each year, from the 2004 – 2008 average of 366 to fewer than 165 by 2020. There were 197 KSI casualties recorded of young people in 2015 which is 11 lower than the 2014 figure of 208 and 32 above the 2020 target.
152
106 101
120
95 93 92
73 70 72
0
40
80
120
160
2006 2007 2008 2009 2010 2011 2012 2013 2014 2015
Ch
ild
ren
kille
d o
r S
eri
ou
sly
in
jure
d
Year
Child (under 16) KSI casualty reduction target for 2020 To reduce the number of children KSI by at least 55%
411
375
319 334
243
216 218
176
208 197
0
100
200
300
400
500
2006 2007 2008 2009 2010 2011 2012 2013 2014 2015
Yo
un
g P
eo
ple
Se
rio
us
ly I
nju
red
Year
Young people (16-24) KSI casualty reduction target for 2020 To reduce the number of young people KSI by at least 55%
Target = 165
Target = 58
NOT PROTECTIVELY MARKED
Appendix 1 Road Deaths on Northern Ireland’s Roads 1931 - 2015
Appendix 2 Motorcyclists killed or seriously injured on Northern Ireland’s Roads 1986 – 2015
114 119
141 132
123 127 130 118
147
181
275
233
155 154
124 115 112
127
147 144
167
133
163 159 160 144
169
141 156
172 169 156
176
219
191
248
217 216
257 272
304
372
335
316 313 300
355
288 293
229 223 216
173 189
177
236
214
178 181 185 185
150 143
157 144 142 144
160
141
171
148 150
150 147 135
126 113 107
115
55 59 48
57
79 74
0
50
100
150
200
250
300
350
400
1931 1933 1935 1937 1939 1941 1943 1945 1947 1949 1951 1953 1955 1957 1959 1961 1963 1965 1967 1969 1971 1973 1975 1977 1979 1981 1983 1985 1987 1989 1991 1993 1995 1997 1999 2001 2003 2005 2007 2009 2011 2013 2015
Ro
ad
Dea
ths
173 177
154 149
133 128
116
93 95
107
79
95 95
105
145
157
187
164 165 160
142
153
138
154
120
108 100 101
97
82
0
20
40
60
80
100
120
140
160
180
200
1986 1987 1988 1989 1990 1991 1992 1993 1994 1995 1996 1997 1998 1999 2000 2001 2002 2003 2004 2005 2006 2007 2008 2009 2010 2011 2012 2013 2014 2015Mo
torc
ycli
sts
kil
led
or
seri
ou
sly
in
jure
d
NOT PROTECTIVELY MARKED
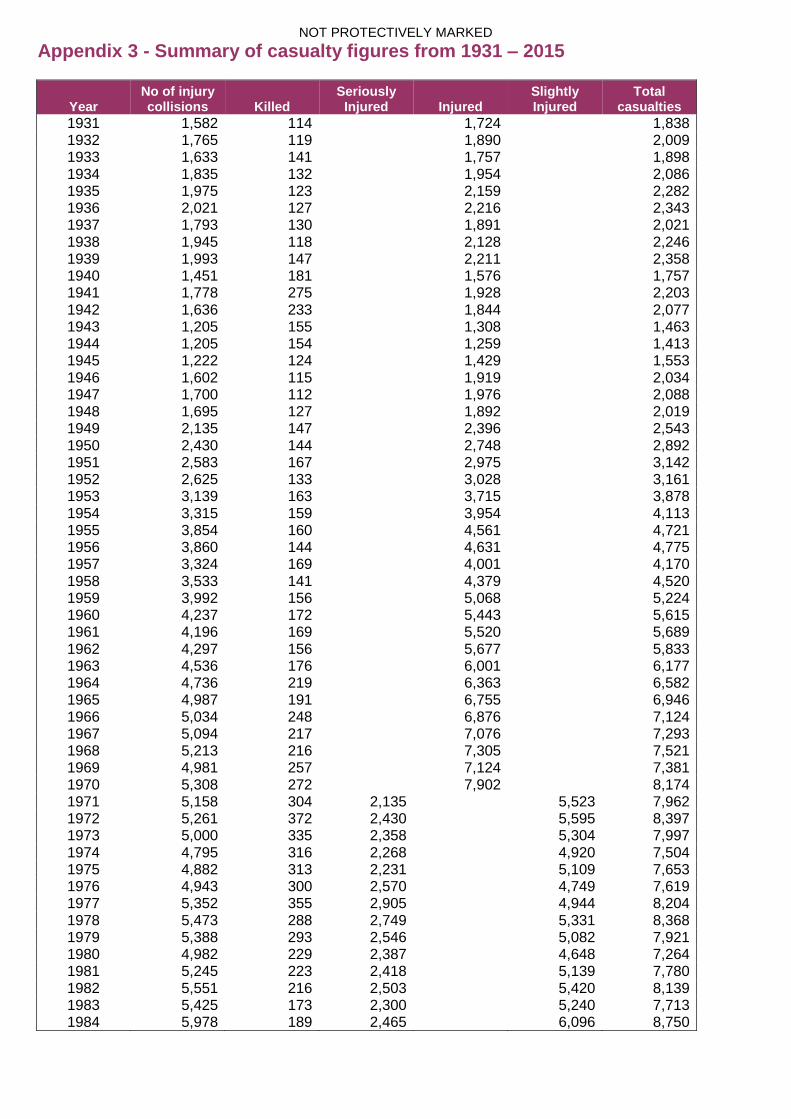
Appendix 3 - Summary of casualty figures from 1931 – 2015
Year No of injury collisions Killed
Seriously Injured Injured
Slightly Injured
Total casualties
1931 1,582 114 1,724 1,838 1932 1,765 119 1,890 2,009 1933 1,633 141 1,757 1,898 1934 1,835 132 1,954 2,086 1935 1,975 123 2,159 2,282 1936 2,021 127 2,216 2,343 1937 1,793 130 1,891 2,021 1938 1,945 118 2,128 2,246 1939 1,993 147 2,211 2,358 1940 1,451 181 1,576 1,757 1941 1,778 275 1,928 2,203 1942 1,636 233 1,844 2,077 1943 1,205 155 1,308 1,463 1944 1,205 154 1,259 1,413 1945 1,222 124 1,429 1,553 1946 1,602 115 1,919 2,034 1947 1,700 112 1,976 2,088 1948 1,695 127 1,892 2,019 1949 2,135 147 2,396 2,543 1950 2,430 144 2,748 2,892 1951 2,583 167 2,975 3,142 1952 2,625 133 3,028 3,161 1953 3,139 163 3,715 3,878 1954 3,315 159 3,954 4,113 1955 3,854 160 4,561 4,721 1956 3,860 144 4,631 4,775 1957 3,324 169 4,001 4,170 1958 3,533 141 4,379 4,520 1959 3,992 156 5,068 5,224 1960 4,237 172 5,443 5,615 1961 4,196 169 5,520 5,689 1962 4,297 156 5,677 5,833 1963 4,536 176 6,001 6,177 1964 4,736 219 6,363 6,582 1965 4,987 191 6,755 6,946 1966 5,034 248 6,876 7,124 1967 5,094 217 7,076 7,293 1968 5,213 216 7,305 7,521 1969 4,981 257 7,124 7,381 1970 5,308 272 7,902 8,174 1971 5,158 304 2,135 5,523 7,962 1972 5,261 372 2,430 5,595 8,397 1973 5,000 335 2,358 5,304 7,997 1974 4,795 316 2,268 4,920 7,504 1975 4,882 313 2,231 5,109 7,653 1976 4,943 300 2,570 4,749 7,619 1977 5,352 355 2,905 4,944 8,204 1978 5,473 288 2,749 5,331 8,368 1979 5,388 293 2,546 5,082 7,921 1980 4,982 229 2,387 4,648 7,264 1981 5,245 223 2,418 5,139 7,780 1982 5,551 216 2,503 5,420 8,139 1983 5,425 173 2,300 5,240 7,713 1984 5,978 189 2,465 6,096 8,750
NOT PROTECTIVELY MARKED
16
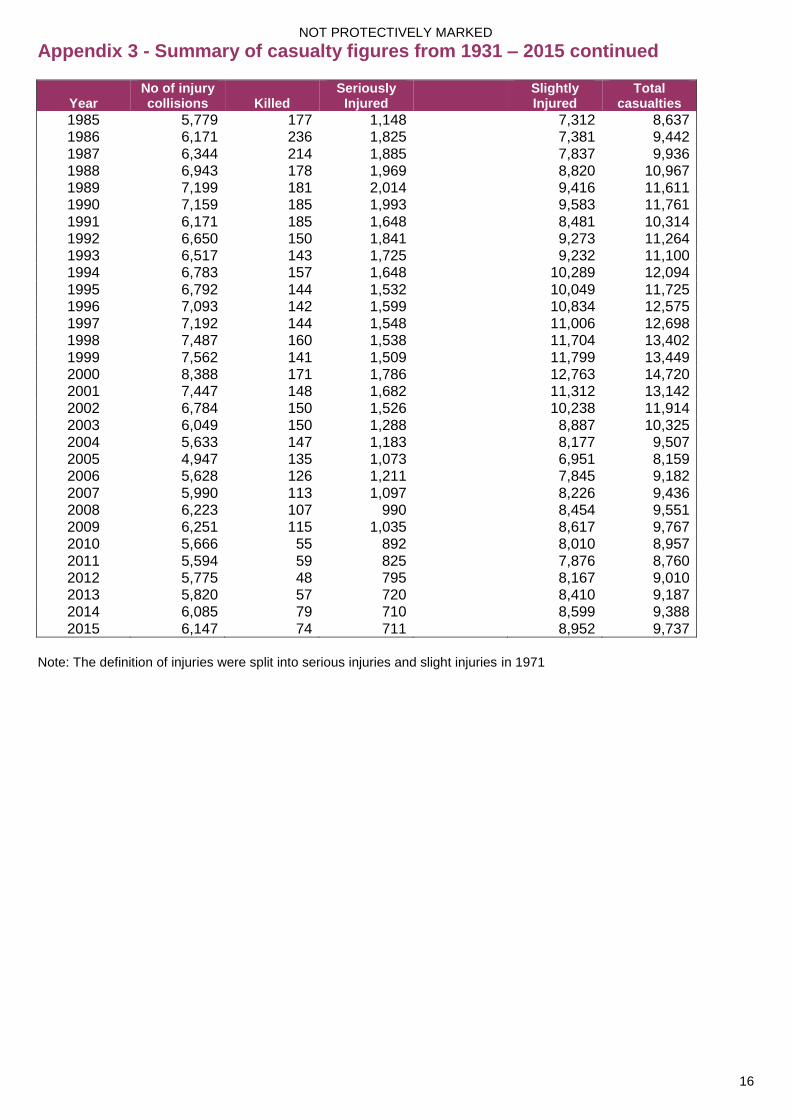
Appendix 3 - Summary of casualty figures from 1931 – 2015 continued
Year No of injury collisions Killed
Seriously Injured
Slightly Injured
Total casualties
1985 5,779 177 1,148 7,312 8,637 1986 6,171 236 1,825 7,381 9,442 1987 6,344 214 1,885 7,837 9,936 1988 6,943 178 1,969 8,820 10,967 1989 7,199 181 2,014 9,416 11,611 1990 7,159 185 1,993 9,583 11,761 1991 6,171 185 1,648 8,481 10,314 1992 6,650 150 1,841 9,273 11,264 1993 6,517 143 1,725 9,232 11,100 1994 6,783 157 1,648 10,289 12,094 1995 6,792 144 1,532 10,049 11,725 1996 7,093 142 1,599 10,834 12,575 1997 7,192 144 1,548 11,006 12,698 1998 7,487 160 1,538 11,704 13,402 1999 7,562 141 1,509 11,799 13,449 2000 8,388 171 1,786 12,763 14,720 2001 7,447 148 1,682 11,312 13,142 2002 6,784 150 1,526 10,238 11,914 2003 6,049 150 1,288 8,887 10,325 2004 5,633 147 1,183 8,177 9,507 2005 4,947 135 1,073 6,951 8,159 2006 5,628 126 1,211 7,845 9,182 2007 5,990 113 1,097 8,226 9,436 2008 6,223 107 990 8,454 9,551 2009 6,251 115 1,035 8,617 9,767 2010 5,666 55 892 8,010 8,957 2011 5,594 59 825 7,876 8,760 2012 5,775 48 795 8,167 9,010 2013 5,820 57 720 8,410 9,187 2014 6,085 79 710 8,599 9,388 2015 6,147 74 711 8,952 9,737
Note: The definition of injuries were split into serious injuries and slight injuries in 1971
NOT PROTECTIVELY MARKED
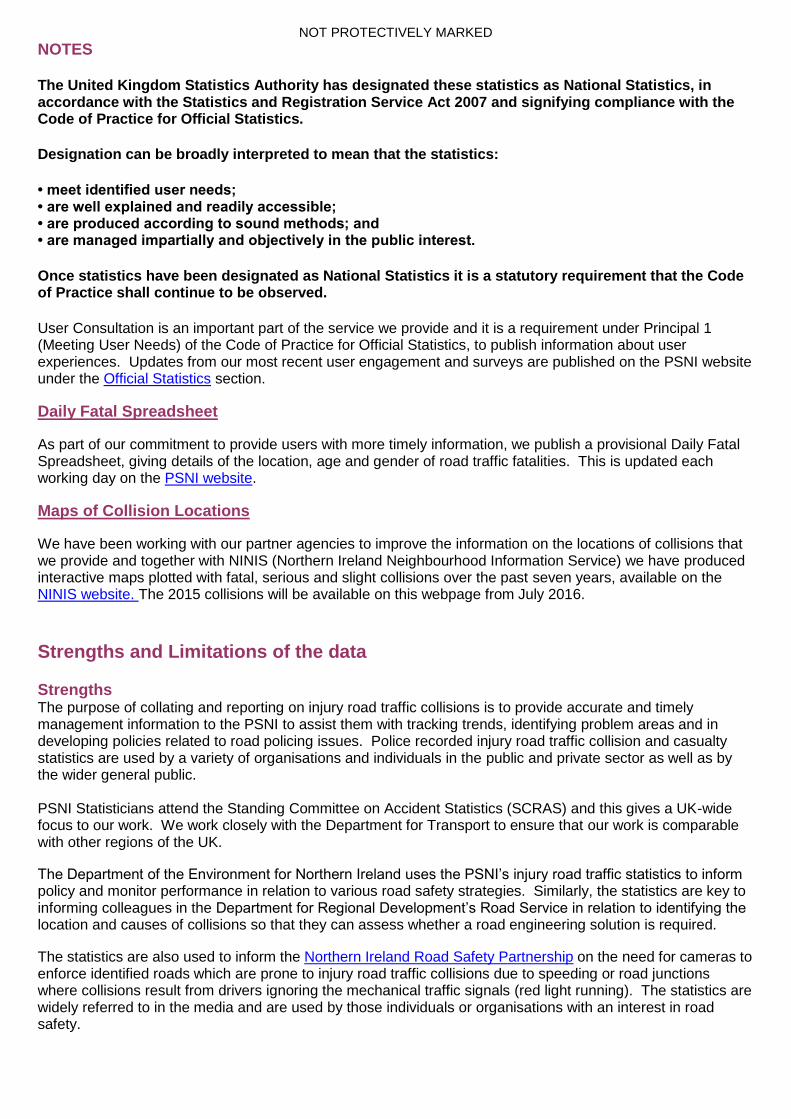
NOTES The United Kingdom Statistics Authority has designated these statistics as National Statistics, in accordance with the Statistics and Registration Service Act 2007 and signifying compliance with the Code of Practice for Official Statistics.
Designation can be broadly interpreted to mean that the statistics:
• meet identified user needs; • are well explained and readily accessible; • are produced according to sound methods; and • are managed impartially and objectively in the public interest.
Once statistics have been designated as National Statistics it is a statutory requirement that the Code of Practice shall continue to be observed.
User Consultation is an important part of the service we provide and it is a requirement under Principal 1 (Meeting User Needs) of the Code of Practice for Official Statistics, to publish information about user experiences. Updates from our most recent user engagement and surveys are published on the PSNI website under the Official Statistics section.
Daily Fatal Spreadsheet
As part of our commitment to provide users with more timely information, we publish a provisional Daily Fatal Spreadsheet, giving details of the location, age and gender of road traffic fatalities. This is updated each working day on the PSNI website.
Maps of Collision Locations
We have been working with our partner agencies to improve the information on the locations of collisions that we provide and together with NINIS (Northern Ireland Neighbourhood Information Service) we have produced interactive maps plotted with fatal, serious and slight collisions over the past seven years, available on the NINIS website. The 2015 collisions will be available on this webpage from July 2016.
Strengths and Limitations of the data Strengths The purpose of collating and reporting on injury road traffic collisions is to provide accurate and timely management information to the PSNI to assist them with tracking trends, identifying problem areas and in developing policies related to road policing issues. Police recorded injury road traffic collision and casualty statistics are used by a variety of organisations and individuals in the public and private sector as well as by the wider general public. PSNI Statisticians attend the Standing Committee on Accident Statistics (SCRAS) and this gives a UK-wide focus to our work. We work closely with the Department for Transport to ensure that our work is comparable with other regions of the UK.
The Department of the Environment for Northern Ireland uses the PSNI’s injury road traffic statistics to inform policy and monitor performance in relation to various road safety strategies. Similarly, the statistics are key to informing colleagues in the Department for Regional Development’s Road Service in relation to identifying the location and causes of collisions so that they can assess whether a road engineering solution is required.
The statistics are also used to inform the Northern Ireland Road Safety Partnership on the need for cameras to enforce identified roads which are prone to injury road traffic collisions due to speeding or road junctions where collisions result from drivers ignoring the mechanical traffic signals (red light running). The statistics are widely referred to in the media and are used by those individuals or organisations with an interest in road safety.
NOT PROTECTIVELY MARKED
18
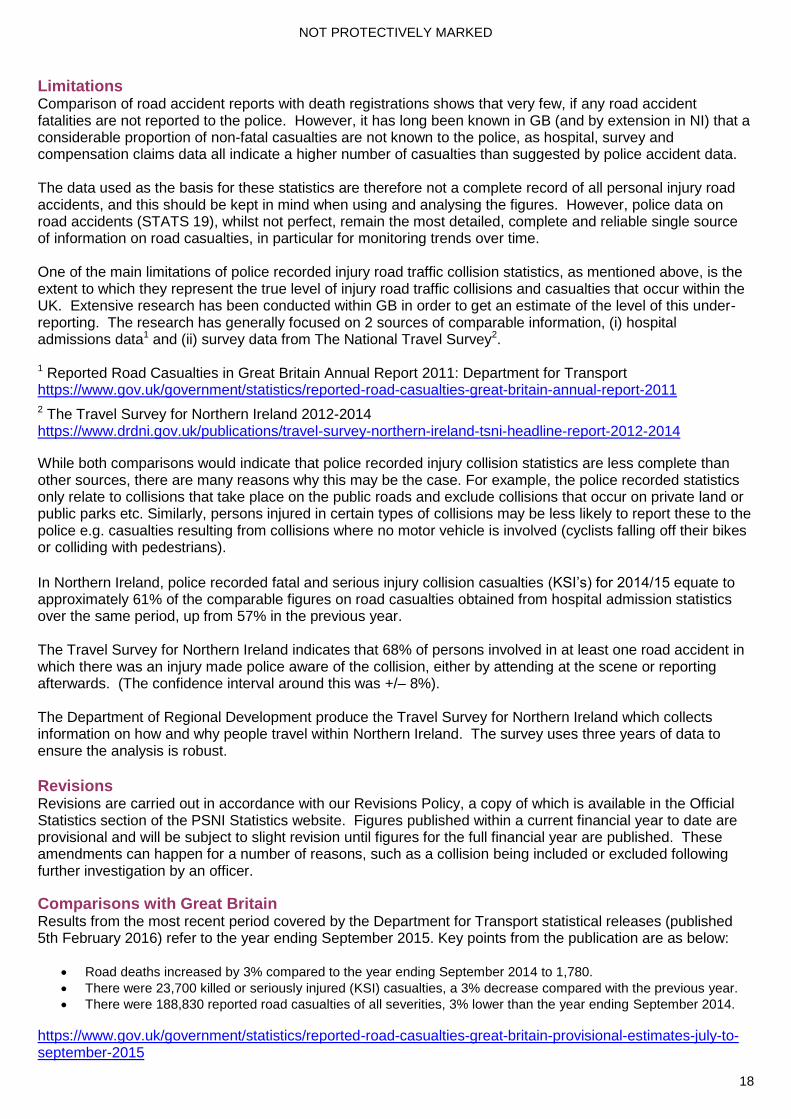
Limitations Comparison of road accident reports with death registrations shows that very few, if any road accident fatalities are not reported to the police. However, it has long been known in GB (and by extension in NI) that a considerable proportion of non-fatal casualties are not known to the police, as hospital, survey and compensation claims data all indicate a higher number of casualties than suggested by police accident data. The data used as the basis for these statistics are therefore not a complete record of all personal injury road accidents, and this should be kept in mind when using and analysing the figures. However, police data on road accidents (STATS 19), whilst not perfect, remain the most detailed, complete and reliable single source of information on road casualties, in particular for monitoring trends over time. One of the main limitations of police recorded injury road traffic collision statistics, as mentioned above, is the extent to which they represent the true level of injury road traffic collisions and casualties that occur within the UK. Extensive research has been conducted within GB in order to get an estimate of the level of this under-reporting. The research has generally focused on 2 sources of comparable information, (i) hospital admissions data1 and (ii) survey data from The National Travel Survey2. 1 Reported Road Casualties in Great Britain Annual Report 2011: Department for Transport https://www.gov.uk/government/statistics/reported-road-casualties-great-britain-annual-report-2011 2 The Travel Survey for Northern Ireland 2012-2014 https://www.drdni.gov.uk/publications/travel-survey-northern-ireland-tsni-headline-report-2012-2014
While both comparisons would indicate that police recorded injury collision statistics are less complete than other sources, there are many reasons why this may be the case. For example, the police recorded statistics only relate to collisions that take place on the public roads and exclude collisions that occur on private land or public parks etc. Similarly, persons injured in certain types of collisions may be less likely to report these to the police e.g. casualties resulting from collisions where no motor vehicle is involved (cyclists falling off their bikes or colliding with pedestrians).
In Northern Ireland, police recorded fatal and serious injury collision casualties (KSI’s) for 2014/15 equate to approximately 61% of the comparable figures on road casualties obtained from hospital admission statistics over the same period, up from 57% in the previous year. The Travel Survey for Northern Ireland indicates that 68% of persons involved in at least one road accident in which there was an injury made police aware of the collision, either by attending at the scene or reporting afterwards. (The confidence interval around this was +/– 8%). The Department of Regional Development produce the Travel Survey for Northern Ireland which collects information on how and why people travel within Northern Ireland. The survey uses three years of data to ensure the analysis is robust.
Revisions Revisions are carried out in accordance with our Revisions Policy, a copy of which is available in the Official Statistics section of the PSNI Statistics website. Figures published within a current financial year to date are provisional and will be subject to slight revision until figures for the full financial year are published. These amendments can happen for a number of reasons, such as a collision being included or excluded following further investigation by an officer.
Comparisons with Great Britain Results from the most recent period covered by the Department for Transport statistical releases (published 5th February 2016) refer to the year ending September 2015. Key points from the publication are as below:
Road deaths increased by 3% compared to the year ending September 2014 to 1,780.
There were 23,700 killed or seriously injured (KSI) casualties, a 3% decrease compared with the previous year.
There were 188,830 reported road casualties of all severities, 3% lower than the year ending September 2014.
https://www.gov.uk/government/statistics/reported-road-casualties-great-britain-provisional-estimates-july-to-september-2015

NOT PROTECTIVELY MARKED
19
Additional Data More detailed statistical tables on injury road traffic collisions in Northern Ireland are available on the Police Recorded Injury Road Traffic Statistics section of the PSNI website.
Further Information Further information is available in the User Guide on the PSNI website. Also note that PSNI Statistics Branch will publish a more detailed 2015 annual report in June 2016. This report will provide detailed information on casualties, causation, location, conditions and comparisons with other areas. If you have anything that you would like to see included in this report, please feel free to contact us, details are provided on the cover page.
Further Research Research into road traffic collisions and casualties can be directed by visiting any of the following: www.roadsafetyobservatory.com www.dft.gov.uk www.pacts.org.uk www.trl.co.uk www.doeni.gov.uk
NOT PROTECTIVELY MARKED
20
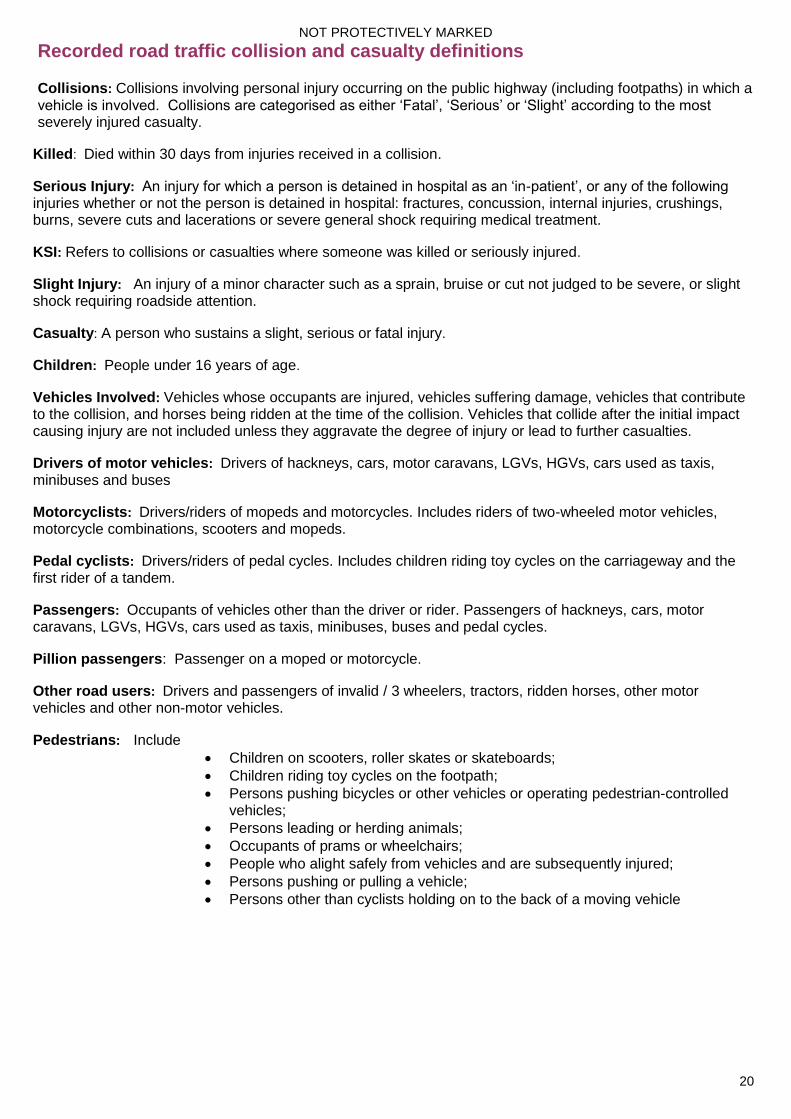
Recorded road traffic collision and casualty definitions Collisions: Collisions involving personal injury occurring on the public highway (including footpaths) in which a vehicle is involved. Collisions are categorised as either ‘Fatal’, ‘Serious’ or ‘Slight’ according to the most severely injured casualty.
Killed: Died within 30 days from injuries received in a collision.
Serious Injury: An injury for which a person is detained in hospital as an ‘in-patient’, or any of the following injuries whether or not the person is detained in hospital: fractures, concussion, internal injuries, crushings, burns, severe cuts and lacerations or severe general shock requiring medical treatment.
KSI: Refers to collisions or casualties where someone was killed or seriously injured.
Slight Injury: An injury of a minor character such as a sprain, bruise or cut not judged to be severe, or slight shock requiring roadside attention.
Casualty: A person who sustains a slight, serious or fatal injury.
Children: People under 16 years of age.
Vehicles Involved: Vehicles whose occupants are injured, vehicles suffering damage, vehicles that contribute to the collision, and horses being ridden at the time of the collision. Vehicles that collide after the initial impact causing injury are not included unless they aggravate the degree of injury or lead to further casualties.
Drivers of motor vehicles: Drivers of hackneys, cars, motor caravans, LGVs, HGVs, cars used as taxis, minibuses and buses
Motorcyclists: Drivers/riders of mopeds and motorcycles. Includes riders of two-wheeled motor vehicles, motorcycle combinations, scooters and mopeds.
Pedal cyclists: Drivers/riders of pedal cycles. Includes children riding toy cycles on the carriageway and the first rider of a tandem.
Passengers: Occupants of vehicles other than the driver or rider. Passengers of hackneys, cars, motor caravans, LGVs, HGVs, cars used as taxis, minibuses, buses and pedal cycles.
Pillion passengers: Passenger on a moped or motorcycle.
Other road users: Drivers and passengers of invalid / 3 wheelers, tractors, ridden horses, other motor vehicles and other non-motor vehicles.
Pedestrians: Include
Children on scooters, roller skates or skateboards;
Children riding toy cycles on the footpath;
Persons pushing bicycles or other vehicles or operating pedestrian-controlled vehicles;
Persons leading or herding animals;
Occupants of prams or wheelchairs;
People who alight safely from vehicles and are subsequently injured;
Persons pushing or pulling a vehicle;
Persons other than cyclists holding on to the back of a moving vehicle