Embed Size (px)
Citation preview

21st-23rd February 2007 NZSSES Conference, Auckland 2007 1
Sustainable choices for Sustainable choices for residential water supply in residential water supply in
AucklandAuckland
Nalanie Mithraratne & Robert Vale
Centre for Urban Ecosystem SustainabilityCentre for Urban Ecosystem Sustainability
Landcare ResearchLandcare Research

21st-23rd February 2007 NZSSES Conference, Auckland 2007 2
OutlineOutline
Mains supply vs. rain tanksMains supply vs. rain tanks
Impact of settlement patternsImpact of settlement patterns
Water system in average houseWater system in average house
ConclusionsConclusions

21st-23rd February 2007 NZSSES Conference, Auckland 2007 3
LCA of mains supply LCA of mains supply
System boundarySystem boundary
Initial constructionInitial construction
Maintenance/ replacements - 1% of the Maintenance/ replacements - 1% of the total length of pipes/year total length of pipes/year
replacedreplaced
Operational requirementsOperational requirements
Analysis period – 100 yearsAnalysis period – 100 years

21st-23rd February 2007 NZSSES Conference, Auckland 2007 4
Bulk supply system - constructionBulk supply system - constructionLIFE CYCLE ENERGYLIFE CYCLE ENERGY
Dams 46%
Raw water mains7%
Valve towers, spillways, etc.
2%
Treated water mains45%

21st-23rd February 2007 NZSSES Conference, Auckland 2007 5
Bulk supply systemBulk supply system
Construction
50%
Operation
27%
Maintenance
23%
Maintenance
12%Operation
65%
Construction
23%
LCELCE
LCCOLCCO22

21st-23rd February 2007 NZSSES Conference, Auckland 2007 6
Local supply network - 2005Local supply network - 2005
Unknown 37%
AC19%
CI21%
PE9%
other4%
PVC9%
Steel0% CLS
1%
CLS - cement lined steelCLS - cement lined steel
CI - cast ironCI - cast iron
PE - polyethylenePE - polyethylene
AC - asbestos cementAC - asbestos cement

21st-23rd February 2007 NZSSES Conference, Auckland 2007 7
Mains supply performanceMains supply performance
Energy intensity = 2.11MJ/mEnergy intensity = 2.11MJ/m33 (Range 2.08 - 2.27MJ/m(Range 2.08 - 2.27MJ/m33))
COCO22 emissions factor = 0.128kgCO emissions factor = 0.128kgCO22/m/m33 (Range 0.126 – (Range 0.126 –
0.146kgCO0.146kgCO22/m/m33))
Mains water supply contribution,Mains water supply contribution,
Life cycle energy = 86GJ/houseLife cycle energy = 86GJ/house
COCO22 emissions = 4.9 tonnes CO emissions = 4.9 tonnes CO22/house/house

21st-23rd February 2007 NZSSES Conference, Auckland 2007 8
Impact of Settlement Pattern Impact of Settlement Pattern
Roberton siteRoberton site
Residential density 14units/haResidential density 14units/ha
Parallelogram bounded by roadsParallelogram bounded by roads

21st-23rd February 2007 NZSSES Conference, Auckland 2007 9
Impact of Settlement Pattern Impact of Settlement Pattern
Sandringham siteSandringham site
Residential density 17units/haResidential density 17units/ha
Road across the siteRoad across the site

21st-23rd February 2007 NZSSES Conference, Auckland 2007 10
Impact of Settlement Pattern Impact of Settlement Pattern
Freeman’s Bay siteFreeman’s Bay site
Residential density 23units/haResidential density 23units/ha
Trapezoid, open spaces withinTrapezoid, open spaces within
21st-23rd February 2007 NZSSES Conference, Auckland 2007 11
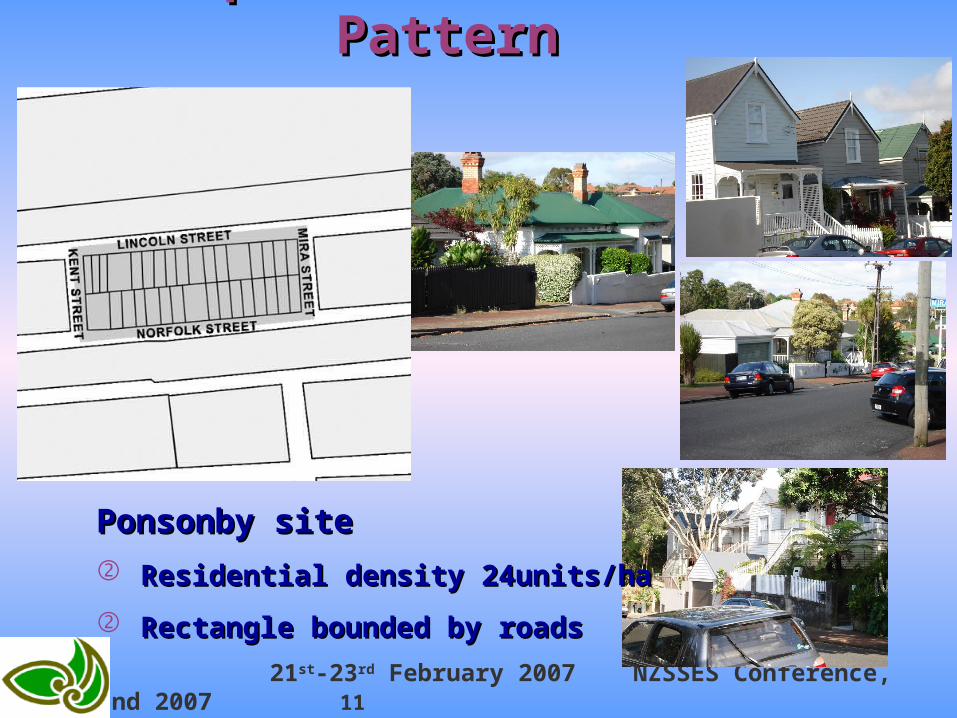
Impact of Settlement Pattern Impact of Settlement Pattern
Ponsonby sitePonsonby site
Residential density 24units/haResidential density 24units/ha
Rectangle bounded by roadsRectangle bounded by roads

21st-23rd February 2007 NZSSES Conference, Auckland 2007 12
Life Cycle Energy and LCCOLife Cycle Energy and LCCO22 (actual) (actual)
Name of siteName of siteEnergy intensity Energy intensity
(GJ/unit)(GJ/unit)COCO22 emissions emissions
factor (kg/unit)factor (kg/unit)AverageAverage RangeRange AverageAverage RangeRange
RobertonRoberton 10.310.3 4.8 - 15.84.8 - 15.8 3.43.4 0.6 - 6.30.6 - 6.3
SandringhamSandringham 4.94.9 4.94.9 0.30.3 0.30.3
Freeman’s BayFreeman’s Bay 6.86.8 6.6 - 6.96.6 - 6.9 0.40.4 0.3 - 0.40.3 - 0.4
PonsonbyPonsonby 13.513.5 4.9 - 2.24.9 - 2.2 2.12.1 1.2 - 2.91.2 - 2.9

21st-23rd February 2007 NZSSES Conference, Auckland 2007 13
Life Cycle Energy compositionLife Cycle Energy composition
Name of siteName of site ConstructionConstruction MaintenanceMaintenance OperationOperation
RobertonRoberton 25%25% 25%25% 50%50%
SandringhamSandringham 13%13% 13%13% 74%74%
Freeman’s BayFreeman’s Bay 23%23% 23%23% 54%54%
PonsonbyPonsonby 27%27% 27%27% 46%46%

21st-23rd February 2007 NZSSES Conference, Auckland 2007 14
Life Cycle COLife Cycle CO22 composition composition
Name of siteName of site ConstructionConstruction MaintenanceMaintenance OperationOperation
RobertonRoberton 26%26% 26%26% 48%48%
SandringhamSandringham 25%25% 25%25% 50%50%
Freeman’s BayFreeman’s Bay 23%23% 23%23% 54%54%
PonsonbyPonsonby 27%27% 27%27% 46%46%

21st-23rd February 2007 NZSSES Conference, Auckland 2007 15
Mains supply vs. Rain tanksMains supply vs. Rain tanks
Wastewater and stormwaterWastewater and stormwater
Mains - more, rain tanks - reducedMains - more, rain tanks - reduced
Water quality Water quality
Mains - Grade A, rain tanks – untreatedMains - Grade A, rain tanks – untreated
Water supply volume Water supply volume
Mains - 370mMains - 370m33, rain tanks - varies, rain tanks - varies
21st-23rd February 2007 NZSSES Conference, Auckland 2007 16
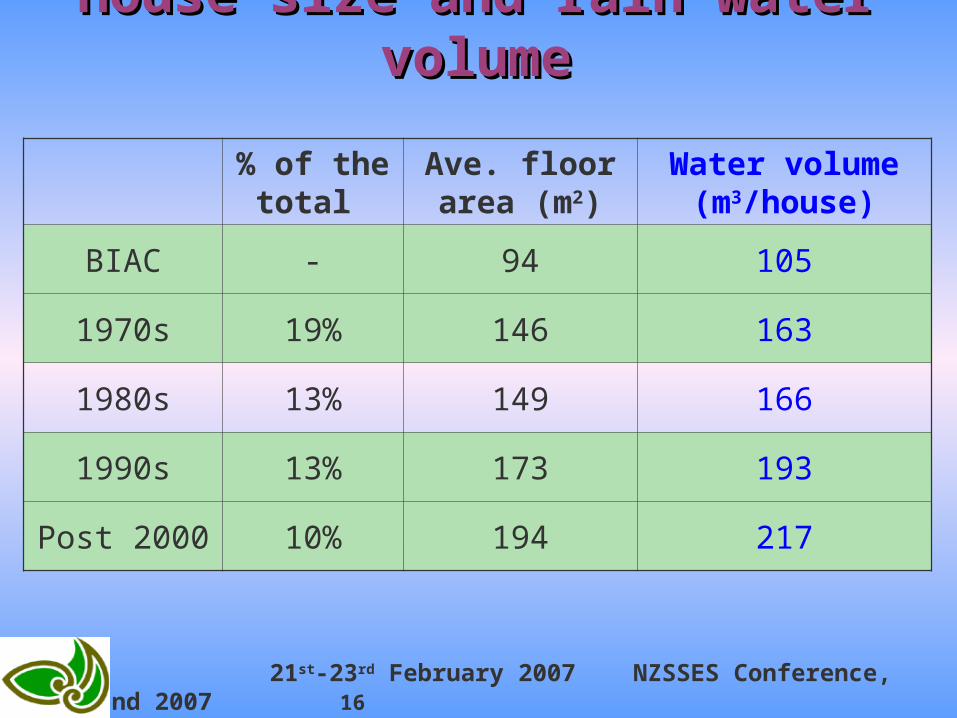
House size and rain water volumeHouse size and rain water volume
% of the total
Ave. floor area (m2)
Water volume (m3/house)
BIAC - 94 105
1970s 19% 146 163
1980s 13% 149 166
1990s 13% 173 193
Post 2000 10% 194 217

21st-23rd February 2007 NZSSES Conference, Auckland 2007 17
[Source: Marley 2005]]
Rain harvesting systemRain harvesting system

21st-23rd February 2007 NZSSES Conference, Auckland 2007 18
Water supply systems - LCEWater supply systems - LCELIFE CYCLE ENERGY (GJ)LIFE CYCLE ENERGY (GJ)
0
10
20
30
40
50
0 25 50 75 100
USEFUL LIFE (YEARS)
LIF
E C
YC
LE
EN
ER
GY
(G
J)
BIAC - reticulated 1970s - reticulated 1990 - reticulated 2000 - reticulated
BIAC - rain tank 1970 - rain tank 1990 - rain tank 2000 - rain tank

21st-23rd February 2007 NZSSES Conference, Auckland 2007 19
Water supply systems – LCCOWater supply systems – LCCO22LIFE CYCLE CO2 (kg)LIFE CYCLE CO2 (kg)
0
500
1000
1500
2000
2500
3000
3500
4000
0 25 50 75 100
USEFUL LIFE (YEARS)
LIF
E C
YC
LE
CO
2 (k
g)
BIAC - reticulated 1970s - reticulated 1990s - reticulated 2000 - reticulated
BIAC - rain tank 1970 rain tank 1990 rain tank 2000 rain tank

21st-23rd February 2007 NZSSES Conference, Auckland 2007 20
Water supply systems – LCCWater supply systems – LCCLIFE CYCLE COST (NZ$)LIFE CYCLE COST (NZ$)
2500
3000
3500
4000
4500
5000
5500
6000
6500
7000
7500
8000
8500
0 25 50 75 100
USEFUL LIFE (YEARS)
LIF
E C
YC
LE
CO
ST
(N
Z$
)
BIAC - reticulated 1970s - reticulated 1990s - reticulated 2000 - reticulated
BIAC - rain tank 1970s - rain tank 1990s rain tank 2000 - rain tank

21st-23rd February 2007 NZSSES Conference, Auckland 2007 21
Building Industry Advisory Building Industry Advisory Council House (BIAC)Council House (BIAC)
PlanPlan[Source: Baird and Chan (1983)]

21st-23rd February 2007 NZSSES Conference, Auckland 2007 22
Section & Front ElevationSection & Front Elevation[Source: Baird and Chan (1983)]
Building Industry Advisory Building Industry Advisory Council House (BIAC)Council House (BIAC)

21st-23rd February 2007 NZSSES Conference, Auckland 2007 23
ASSUMPTIONSASSUMPTIONS
Useful life of NZ houses is 100 years.Useful life of NZ houses is 100 years. Living room faces north.Living room faces north. Space heating: Whole house, temp Space heating: Whole house, temp
1818ooC, 2 schedulesC, 2 schedules Water heating: varies with water Water heating: varies with water
volume.volume.

21st-23rd February 2007 NZSSES Conference, Auckland 2007 24
Life cycle energy by end useLife cycle energy by end use
BIAC 1970s 1990sPost 2000
House construction
15-17% 14-15% 16-17% 16-17%
Space heating
39-44% 43-47% 44-47% 44-48%
Water heating
40-43% 37-40% 36-38% 35-37%
Water supply 1% 1% 1% 1%

21st-23rd February 2007 NZSSES Conference, Auckland 2007 25
Life cycle COLife cycle CO22 by end use by end use
BIAC 1970s 1990sPost 2000
House construction
57-61% 56-60% 39-43% 39-43%
Space heating
18-21% 20-23% 29-33% 29-34%
Water heating
19-20% 18-19% 24-26% 24-26%
Water supply 0.2 -3% 0.3 -4% 0.4 -5% 0.4 -5%

21st-23rd February 2007 NZSSES Conference, Auckland 2007 26
Life cycle cost by end useLife cycle cost by end use
BIAC 1970s 1990sPost 2000
House construction
81-84% 82-84% 82-85% 82-85%
Space heating
5-6% 6-7% 6-7% 6-7%
Water heating
6% 5% 5% 5%
Water supply 5-7% 4-6% 4-6% 4-5%

21st-23rd February 2007 NZSSES Conference, Auckland 2007 27
ConclusionsConclusions Consumption significantly impacts the Consumption significantly impacts the
system choice.system choice.
Use of mains supply in smaller houses Use of mains supply in smaller houses (>150m2) and rain harvesting in larger (>150m2) and rain harvesting in larger houses is better for the environment.houses is better for the environment.
Mains supply is cheaper initially but Mains supply is cheaper initially but costly in life cycle terms.costly in life cycle terms.
Water supply is negligible in terms of Water supply is negligible in terms of total environmental performance of total environmental performance of house.house.