Embed Size (px)
Citation preview
1 Auckland Cycling: An Investment Programme
AUCKLAND CYCLING An Investment Programme
School
Supermarket
Proposed 2018-2028
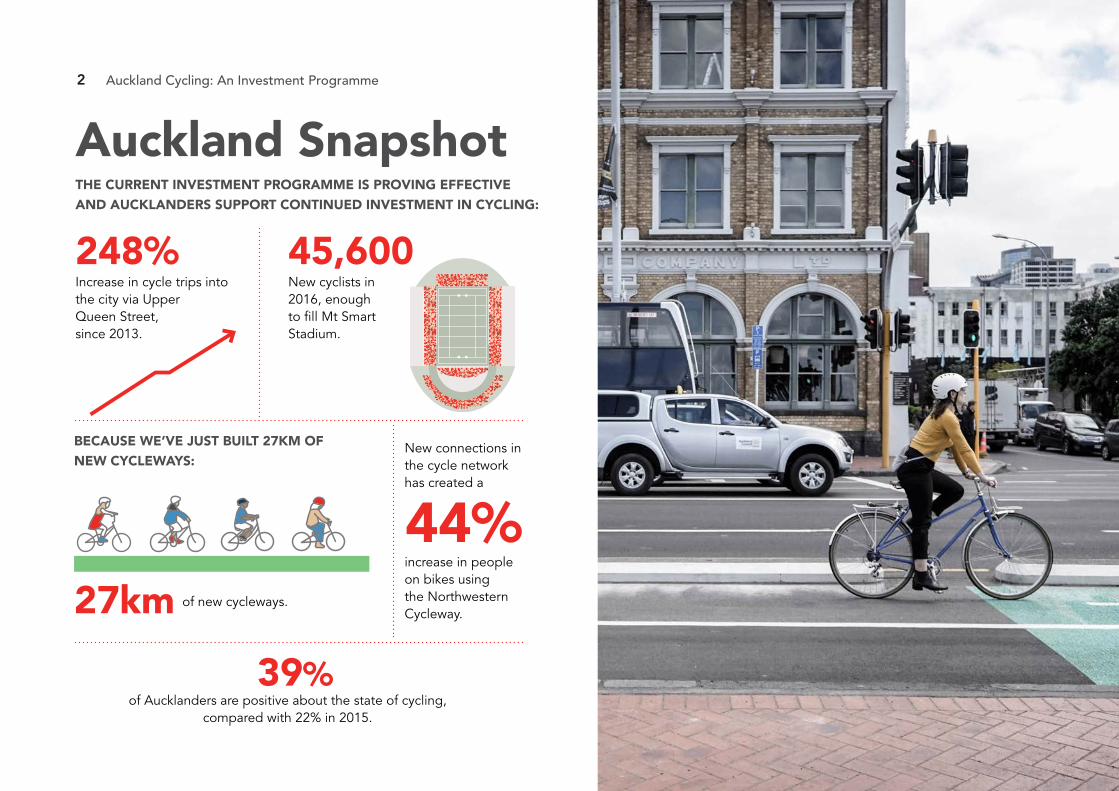
2 Auckland Cycling: An Investment Programme
Increase in cycle trips into the city via UpperQueen Street, since 2013.
248%
BECAUSE WE’VE JUST BUILT 27KM OF NEW CYCLEWAYS:
27km of new cycleways.
of Aucklanders are positive about the state of cycling, compared with 22% in 2015.
39%
Auckland Snapshot
New cyclists in 2016, enough to fill Mt Smart Stadium.
45,600
THE CURRENT INVESTMENT PROGRAMME IS PROVING EFFECTIVE AND AUCKLANDERS SUPPORT CONTINUED INVESTMENT IN CYCLING:
New connections in the cycle network has created a
44%increase in people on bikes using the Northwestern Cycleway.
3 Auckland Cycling: An Investment Programme
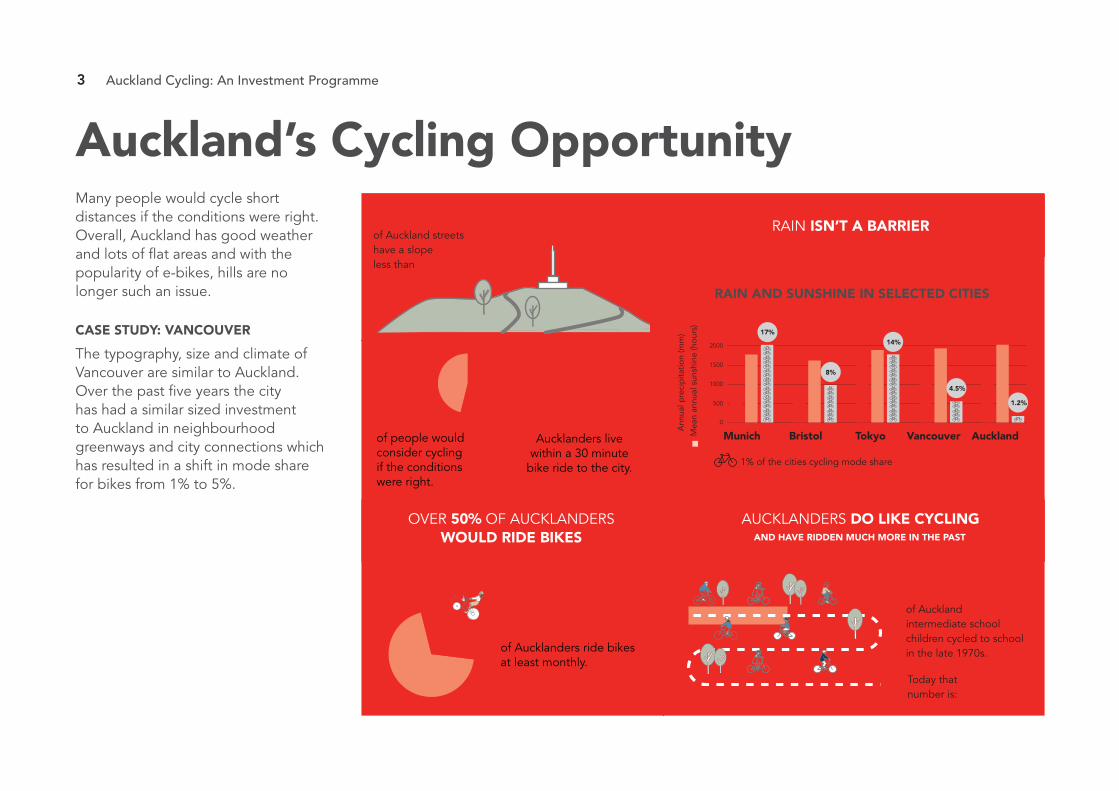
Auckland’s Cycling OpportunityMany people would cycle short distances if the conditions were right. Overall, Auckland has good weather and lots of flat areas and with the popularity of e-bikes, hills are no longer such an issue.
CASE STUDY: VANCOUVER
The typography, size and climate of Vancouver are similar to Auckland. Over the past five years the city has had a similar sized investment to Auckland in neighbourhood greenways and city connections which has resulted in a shift in mode share for bikes from 1% to 5%.
0
500
1000
1500
2000
AucklandVancouverTokyoBristolMunich
1% of the cities cycling mode share
Rain and Sunshine in Selected Cities
17%
8%
14%
4.5%
1.2%
Ann
ual p
reci
pita
tion
(mm
)M
ean
annu
al s
unsh
ine
(hou
rs)
73%
31%of Aucklanders ride bikesat least monthly.
of Auckland intermediate school children cycled to school in the late 1970s.
20%
of people would consider cycling if the conditions were right.
of Auckland streets have a slope less than
54%230,000
Aucklanders live within a 30 minute
bike ride to the city.
AUCKLANDERS DO LIKE CYCLINGAND HAVE RIDDEN MUCH MORE IN THE PAST
RAIN ISN’T A BARRIER
OVER 50% OF AUCKLANDERS WOULD RIDE BIKES
3% RAIN AND SUNSHINE IN SELECTED CITIES
3.9%Today thatnumber is:
4 Auckland Cycling: An Investment Programme
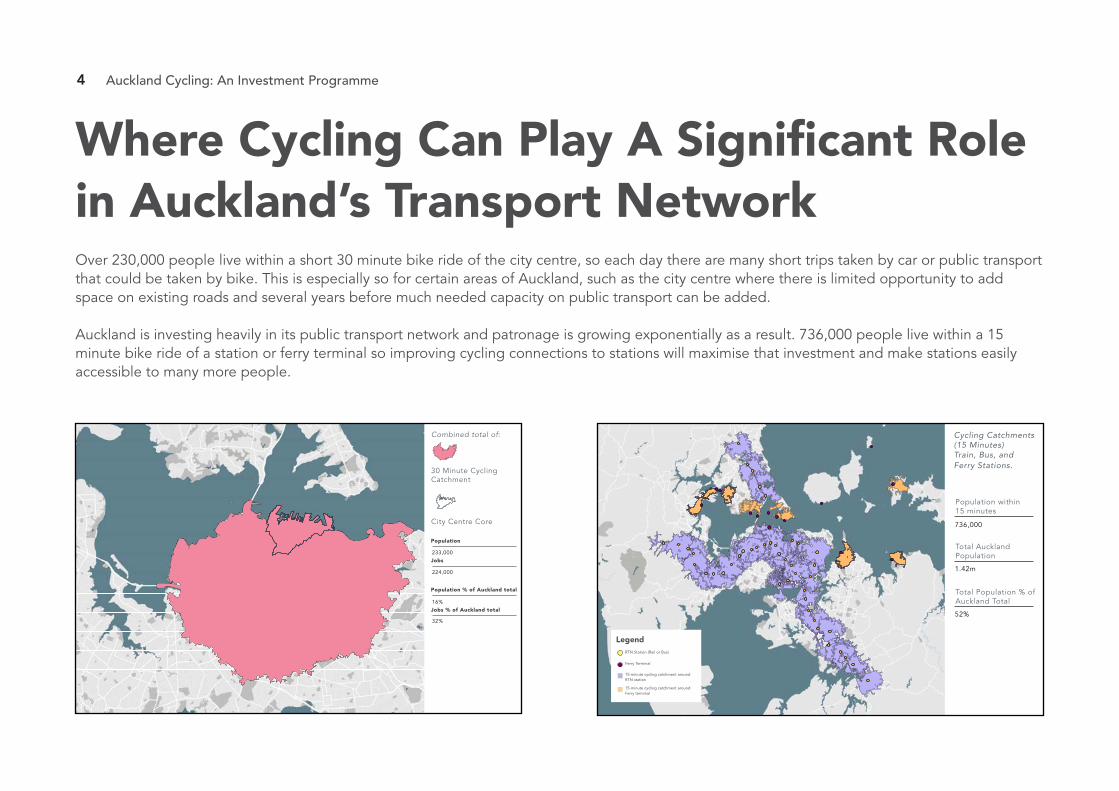
Population within15 minutes
Total Auckland Population
736,000
1.42m
Total Population % of Auckland Total
52%
Cycling Catchments (15 Minutes) Train, Bus, and Ferry Stations.
233,000
Population
Jobs
224,000
16%
Population % of Auckland total
Jobs % of Auckland total
32%
30 Minute Cycling Catchment
Combined total of:
City Centre Core
Where Cycling Can Play A Significant Role in Auckland’s Transport NetworkOver 230,000 people live within a short 30 minute bike ride of the city centre, so each day there are many short trips taken by car or public transport that could be taken by bike. This is especially so for certain areas of Auckland, such as the city centre where there is limited opportunity to add space on existing roads and several years before much needed capacity on public transport can be added. Auckland is investing heavily in its public transport network and patronage is growing exponentially as a result. 736,000 people live within a 15 minute bike ride of a station or ferry terminal so improving cycling connections to stations will maximise that investment and make stations easily accessible to many more people.
LegendRTN Station (Rail or Bus)
Ferry Terminal
15-minute cycling catchment around RTN station
15-minute cycling catchment around Ferry terminal
5 Auckland Cycling: An Investment Programme
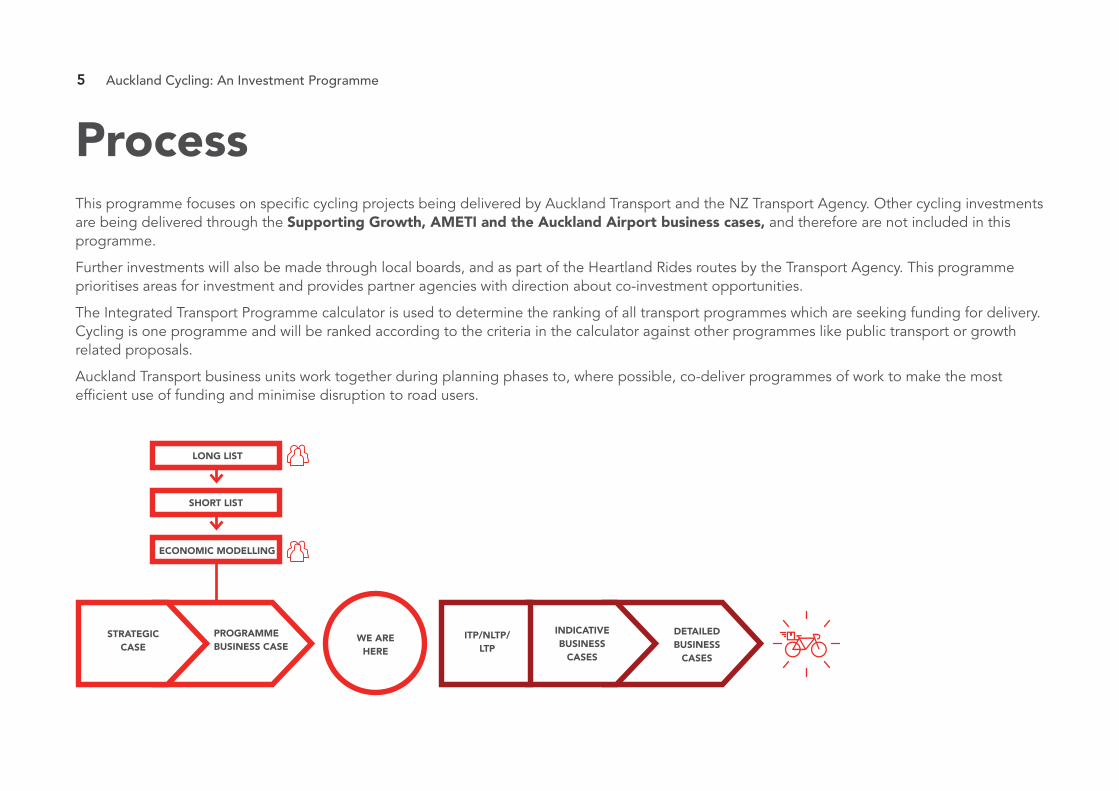
ProcessThis programme focuses on specific cycling projects being delivered by Auckland Transport and the NZ Transport Agency. Other cycling investments are being delivered through the Supporting Growth, AMETI and the Auckland Airport business cases, and therefore are not included in this programme.
Further investments will also be made through local boards, and as part of the Heartland Rides routes by the Transport Agency. This programme prioritises areas for investment and provides partner agencies with direction about co-investment opportunities.
The Integrated Transport Programme calculator is used to determine the ranking of all transport programmes which are seeking funding for delivery. Cycling is one programme and will be ranked according to the criteria in the calculator against other programmes like public transport or growth related proposals.
Auckland Transport business units work together during planning phases to, where possible, co-deliver programmes of work to make the most efficient use of funding and minimise disruption to road users.
STRATEGICCASE
PROGRAMME BUSINESS CASE
WE AREHERE
INDICATIVE BUSINESS
CASES
DETAILEDBUSINESS
CASES
LONG LIST
SHORT LIST
ECONOMIC MODELLING
ITP/NLTP/ LTP
6 Auckland Cycling: An Investment Programme
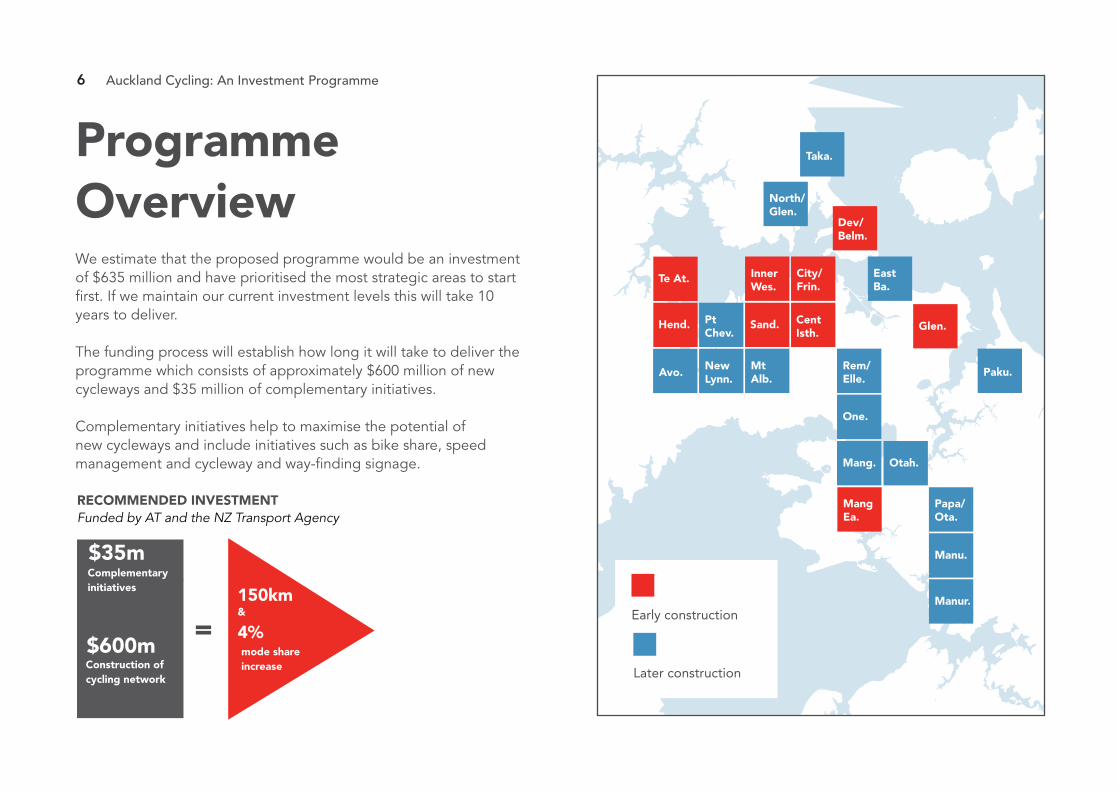
We estimate that the proposed programme would be an investment of $635 million and have prioritised the most strategic areas to start first. If we maintain our current investment levels this will take 10 years to deliver.
The funding process will establish how long it will take to deliver the programme which consists of approximately $600 million of new cycleways and $35 million of complementary initiatives.
Complementary initiatives help to maximise the potential of new cycleways and include initiatives such as bike share, speed management and cycleway and way-finding signage.
Dev/Belm.
City/Frin.
EastBa.
Glen.CentIsth.
Sand.Hend.
Te At.
Taka.
Inner Wes.
Mt Alb.
Rem/Elle.
One.
Mang.
MangEa.
Otah.
Papa/Ota.
Manu.
Manur.
Paku.
Pt Chev.
NewLynn.
Avo.
North/Glen.
ProgrammeOverview
Early construction
Later construction
$35m
$600m
RECOMMENDED INVESTMENTFunded by AT and the NZ Transport Agency
Complementary initiatives
Construction of cycling network
=150km&
4%mode shareincrease
7 Auckland Cycling: An Investment Programme
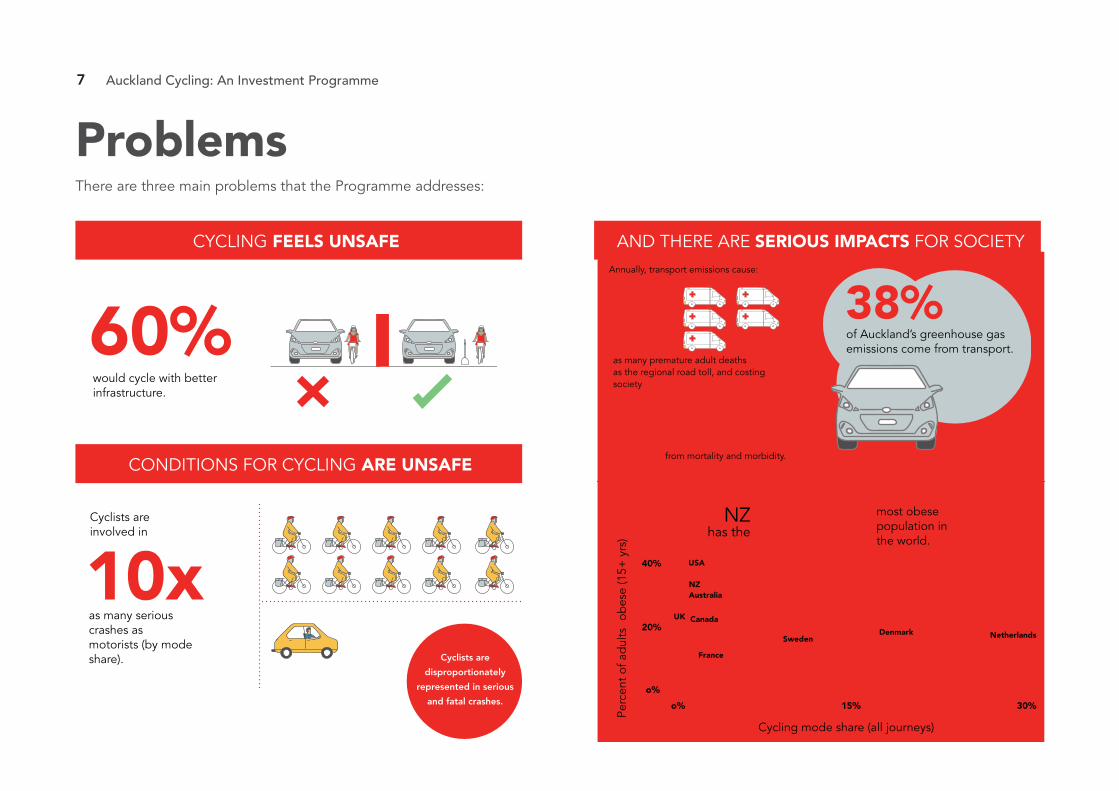
Problems
CYCLING FEELS UNSAFE
CONDITIONS FOR CYCLING ARE UNSAFE
60%would cycle with better infrastructure.
3rd most obese population inthe world.
Cycling mode share (all journeys)
Perc
ent
of a
dul
ts
38%
NZhas the
of Auckland’s greenhouse gas emissions come from transport.
Annually, transport emissions cause:
5xas many premature adult deathsas the regional road toll, and costing society
$466mfrom mortality and morbidity.
as many serious crashes as motorists (by mode share).
10xCyclists are involved in
Cyclists are
disproportionately
represented in serious
and fatal crashes.
AND THERE ARE SERIOUS IMPACTS FOR SOCIETY
There are three main problems that the Programme addresses:
obes
e (1
5+ y
rs)
o%
40%
20%
o% 30%15%
USA
AustraliaNZ
CanadaUK
France
SwedenDenmark Netherlands
8 Auckland Cycling: An Investment Programme
Cycling Network Potential
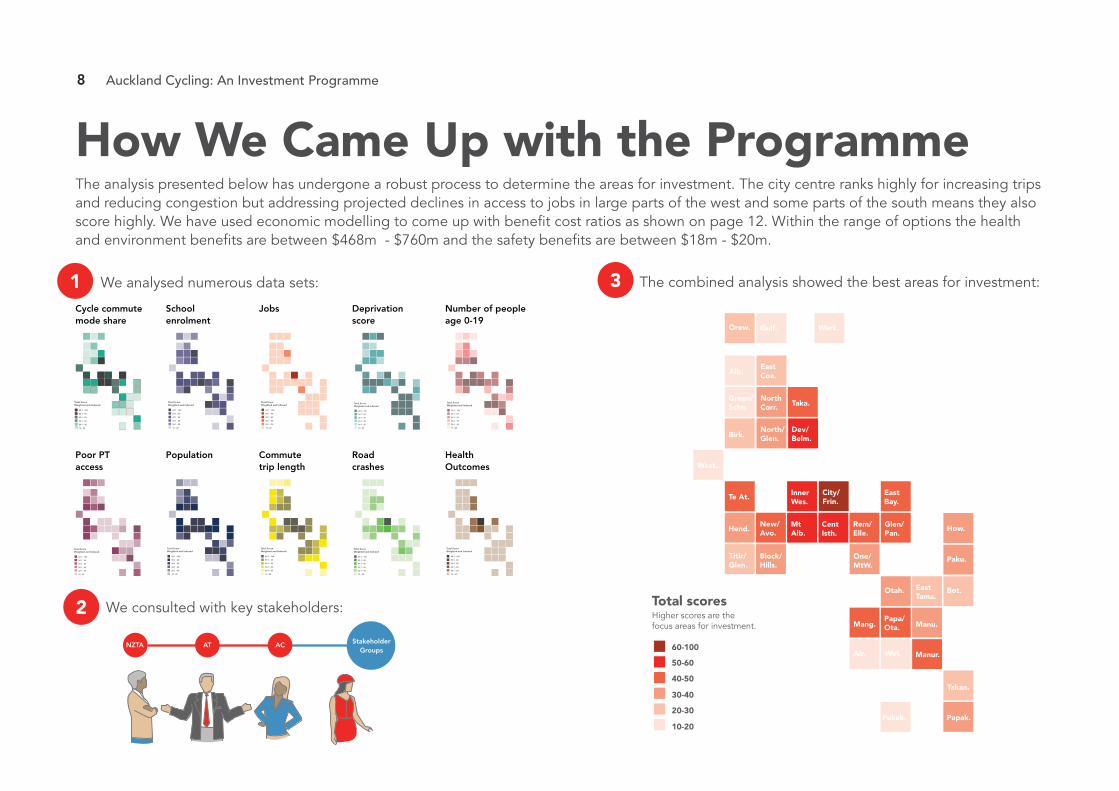
Total scores Higher scores are thefocus areas for investment.
60-100
50-60
40-50
30-40
20-30
10-20
EastCoa.
Dev/Belm.
City/Frin.
EastBay.
How.
Paku.
Bot.EastTama.
Glen/Pan.
CentIsth.
Rem/Elle.
Otah.
One/MtW.
Mang.
Wiri.Air.
Papa/Ota. Manu.
Manur.
Takan.
Papak.Pukek.
Block/Hills.
Taka.
Inner Wes.
Mt Alb.
NorthCorr.
Alb.
Gulf. Wark.Orew.
North/Glen.
Green/Schn.
Birk.
Te At.
Hend.New/Avo.
Titir/Glen.
West.
How We Came Up with the Programme
We analysed numerous data sets:
Total Score Weighted and Indexed
60.1 - 100
50.1 - 60
40.1 - 50
30.1 - 40
20.1 - 30
10 - 20
School Enrolment
Total Score Weighted and Indexed
60.1 - 100
50.1 - 60
40.1 - 50
30.1 - 40
20.1 - 30
10 - 20
Jobs
Total Score Weighted and Indexed
60.1 - 100
50.1 - 60
40.1 - 50
30.1 - 40
20.1 - 30
10 - 20
Cycle commute mode share
School enrolment
Jobs
Total Score Weighted and Indexed
60.1 - 100
50.1 - 60
40.1 - 50
30.1 - 40
20.1 - 30
10 - 20
Deprivationscore
Total Score Weighted and Indexed
60.1 - 100
50.1 - 60
40.1 - 50
30.1 - 40
20.1 - 30
10 - 20
Number of people age 0-19
Total Score Weighted and Indexed
60.1 - 100
50.1 - 60
40.1 - 50
30.1 - 40
20.1 - 30
10 - 20
Total Score Weighted and Indexed
60.1 - 100
50.1 - 60
40.1 - 50
30.1 - 40
20.1 - 30
10 - 20
Total Score Weighted and Indexed
60.1 - 100
50.1 - 60
40.1 - 50
30.1 - 40
20.1 - 30
10 - 20
Poor PTaccess
Population Commute trip length
Total Score Weighted and Indexed
60.1 - 100
50.1 - 60
40.1 - 50
30.1 - 40
20.1 - 30
10 - 20
Road crashes
Total Score Weighted and Indexed
60.1 - 100
50.1 - 60
40.1 - 50
30.1 - 40
20.1 - 30
10 - 20
HealthOutcomes
We consulted with key stakeholders:
ATNZTA AC StakeholderGroups
1
2
3 The combined analysis showed the best areas for investment:
The analysis presented below has undergone a robust process to determine the areas for investment. The city centre ranks highly for increasing trips and reducing congestion but addressing projected declines in access to jobs in large parts of the west and some parts of the south means they also score highly. We have used economic modelling to come up with benefit cost ratios as shown on page 12. Within the range of options the health and environment benefits are between $468m - $760m and the safety benefits are between $18m - $20m.
9 Auckland Cycling: An Investment Programme
School
Supermarket
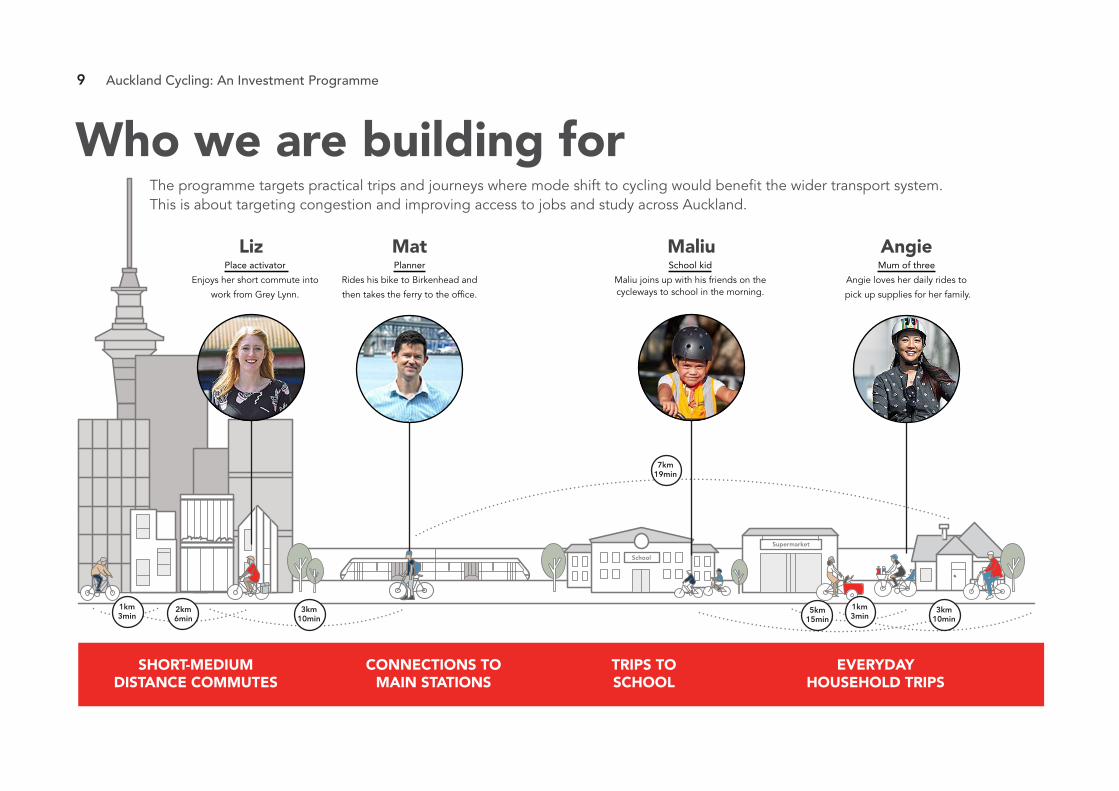
The programme targets practical trips and journeys where mode shift to cycling would benefit the wider transport system.This is about targeting congestion and improving access to jobs and study across Auckland.
Who we are building for
3km10min
5km15min
3km10min
2km6min
1km3min
1km3min
7km19min
SHORT-MEDIUM DISTANCE COMMUTES
LizPlace activator
Enjoys her short commute into
work from Grey Lynn.
MatPlanner
Rides his bike to Birkenhead and
then takes the ferry to the office.
MaliuSchool kid
Maliu joins up with his friends on the cycleways to school in the morning.
AngieMum of three
Angie loves her daily rides to
pick up supplies for her family.
CONNECTIONS TO MAIN STATIONS
TRIPS TO SCHOOL
EVERYDAY HOUSEHOLD TRIPS
10 Auckland Cycling: An Investment Programme
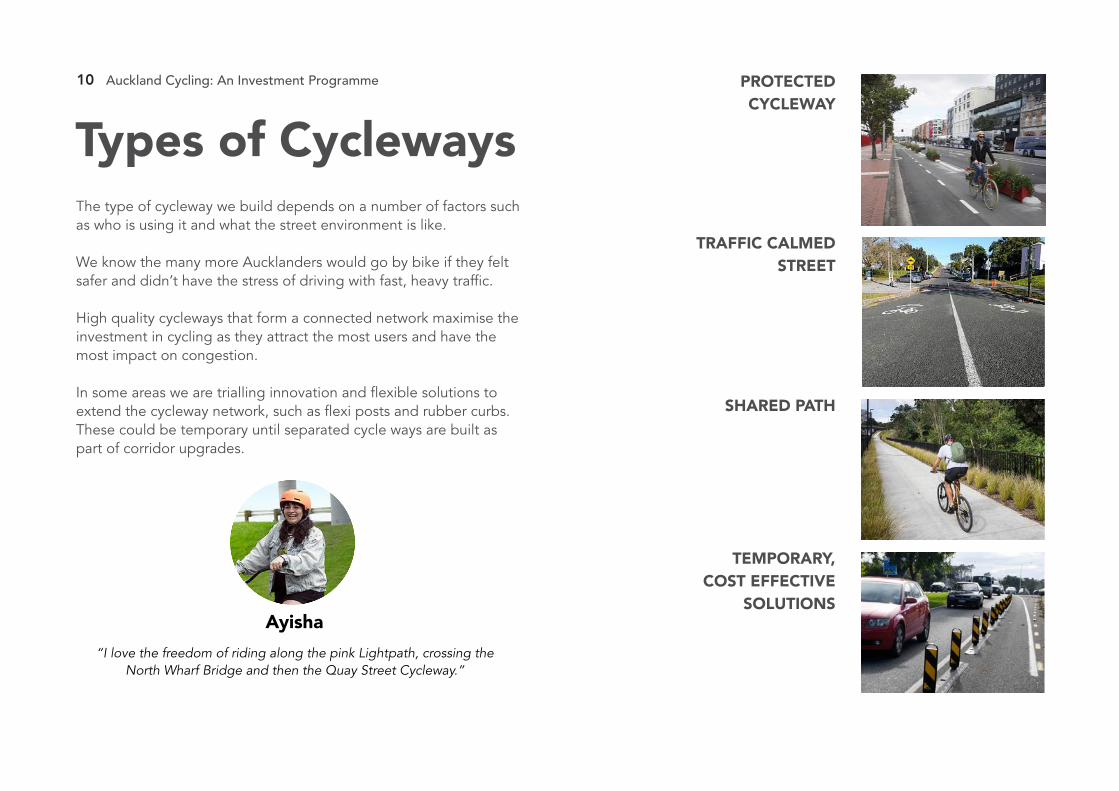
Types of CyclewaysPROTECTED CYCLEWAY
SHARED PATH
TRAFFIC CALMED STREET
The type of cycleway we build depends on a number of factors such as who is using it and what the street environment is like.
We know the many more Aucklanders would go by bike if they felt safer and didn’t have the stress of driving with fast, heavy traffic.
High quality cycleways that form a connected network maximise the investment in cycling as they attract the most users and have the most impact on congestion.
In some areas we are trialling innovation and flexible solutions to extend the cycleway network, such as flexi posts and rubber curbs. These could be temporary until separated cycle ways are built as part of corridor upgrades.
“I love the freedom of riding along the pink Lightpath, crossing the North Wharf Bridge and then the Quay Street Cycleway.”
Ayisha
TEMPORARY, COST EFFECTIVE
SOLUTIONS
11 Auckland Cycling: An Investment Programme
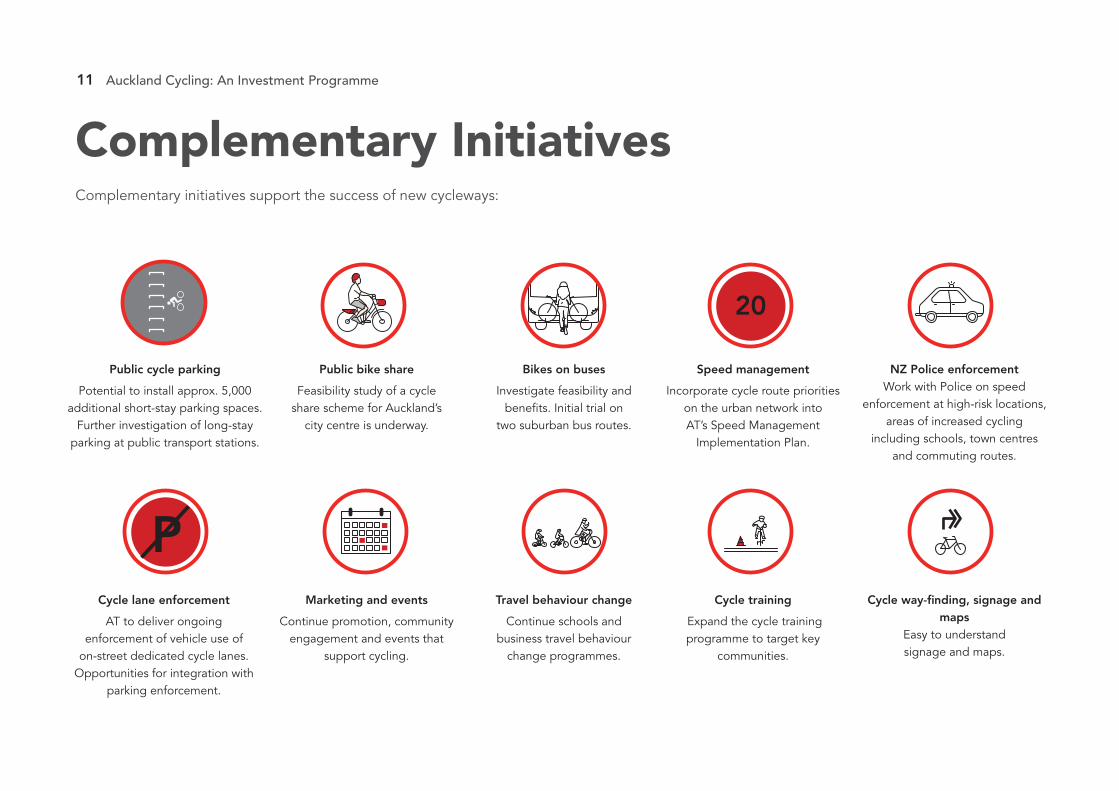
Complementary Initiatives
Public cycle parking
Potential to install approx. 5,000 additional short-stay parking spaces.
Further investigation of long-stay parking at public transport stations.
Public bike share
Feasibility study of a cycle share scheme for Auckland’s
city centre is underway.
Bikes on buses
Investigate feasibility and benefits. Initial trial on
two suburban bus routes.
Speed management
Incorporate cycle route priorities on the urban network into AT’s Speed Management
Implementation Plan.
NZ Police enforcement Work with Police on speed
enforcement at high-risk locations, areas of increased cycling
including schools, town centres and commuting routes.
Cycle lane enforcement
AT to deliver ongoing enforcement of vehicle use of
on-street dedicated cycle lanes. Opportunities for integration with
parking enforcement.
Marketing and events
Continue promotion, community engagement and events that
support cycling.
Travel behaviour change
Continue schools and business travel behaviour
change programmes.
Cycle training
Expand the cycle training programme to target key
communities.
Cycle way-finding, signage and maps
Easy to understand signage and maps.
20
P
Complementary initiatives support the success of new cycleways:
12 Auckland Cycling: An Investment Programme
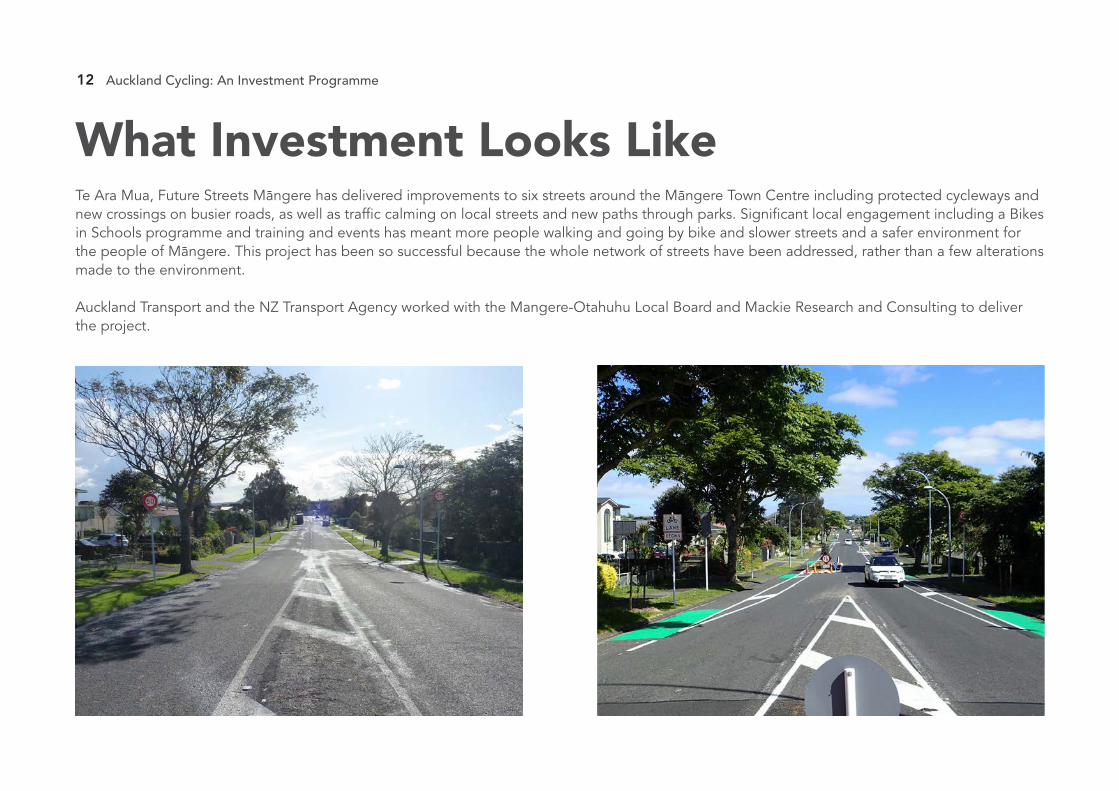
What Investment Looks Like Te Ara Mua, Future Streets Mangere has delivered improvements to six streets around the Mangere Town Centre including protected cycleways and new crossings on busier roads, as well as traffic calming on local streets and new paths through parks. Significant local engagement including a Bikes in Schools programme and training and events has meant more people walking and going by bike and slower streets and a safer environment for the people of Mangere. This project has been so successful because the whole network of streets have been addressed, rather than a few alterations made to the environment.
Auckland Transport and the NZ Transport Agency worked with the Mangere-Otahuhu Local Board and Mackie Research and Consulting to deliver the project.
13 Auckland Cycling: An Investment Programme
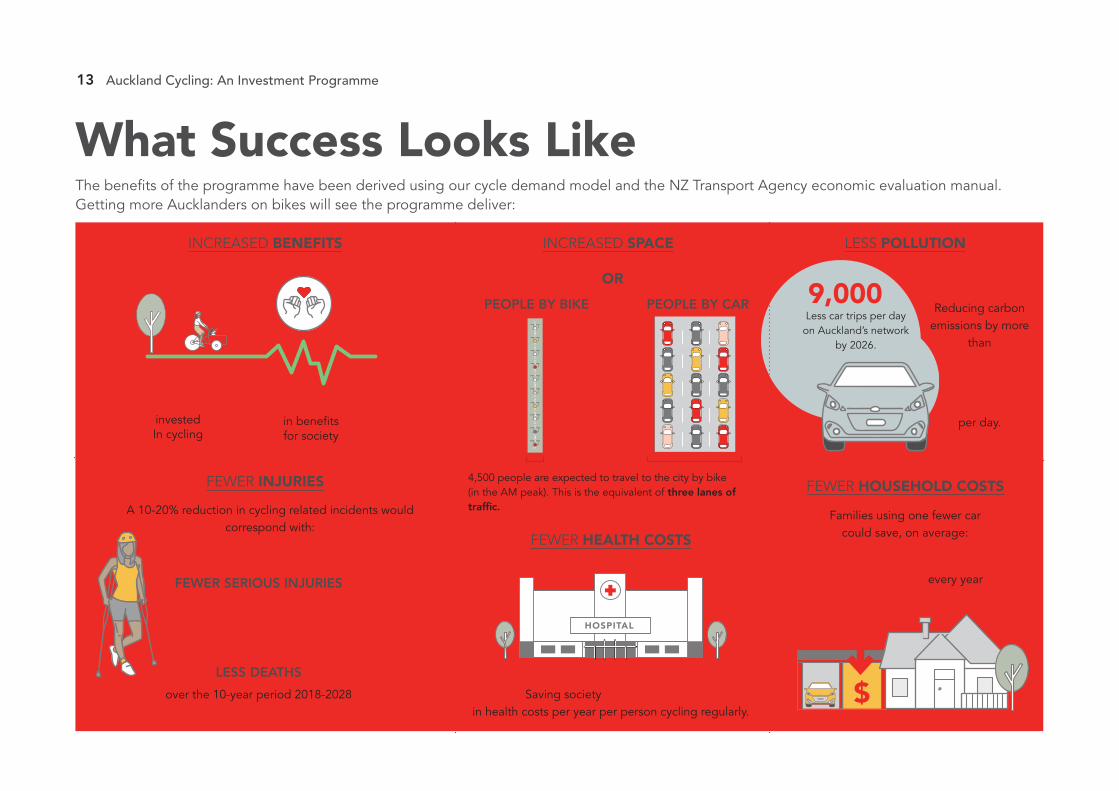
What Success Looks Like
4,500 people are expected to travel to the city by bike (in the AM peak). This is the equivalent of three lanes of traffic.
Families using one fewer carcould save, on average:
A 10-20% reduction in cycling related incidents would correspond with:
9,000
$1invested In cycling
$2-4in benefitsfor society
Saving society $1,410 in health costs per year per person cycling regularly.
The benefits of the programme have been derived using our cycle demand model and the NZ Transport Agency economic evaluation manual. Getting more Aucklanders on bikes will see the programme deliver:
4,500 PEOPLE BY CAR
4,500 PEOPLE BY BIKE
Occassional
OR
HOSPITAL
40-80
over the 10-year period 2018-2028
FEWER SERIOUS INJURIES
1-2
LESS DEATHS
$
$10,200 every year
INCREASED BENEFITS
FEWER INJURIES
INCREASED SPACE LESS POLLUTION
FEWER HEALTH COSTS
FEWER HOUSEHOLD COSTS
Less car trips per day on Auckland’s network
by 2026.
Reducing carbon emissions by more
than
13 tonnesper day.
14 Auckland Cycling: An Investment Programme
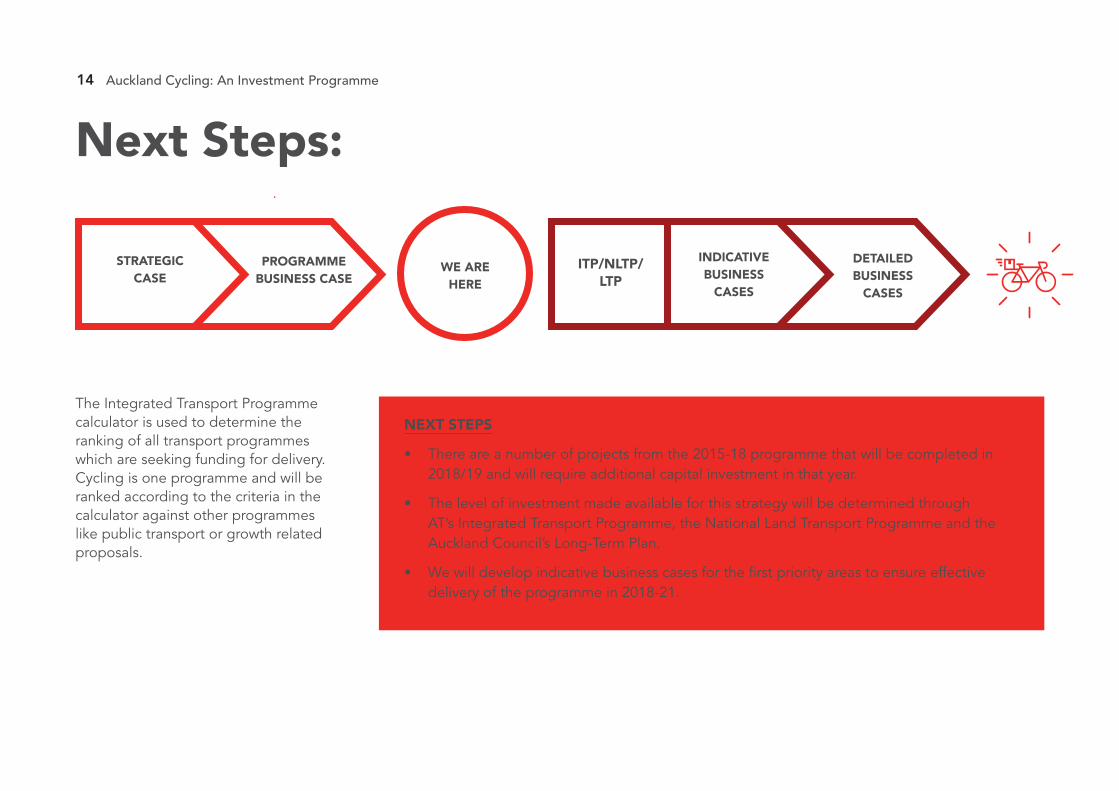
Next Steps:
NEXT STEPS
• There are a number of projects from the 2015-18 programme that will be completed in 2018/19 and will require additional capital investment in that year.
• The level of investment made available for this strategy will be determined through AT’s Integrated Transport Programme, the National Land Transport Programme and the Auckland Council’s Long-Term Plan.
• We will develop indicative business cases for the first priority areas to ensure effective delivery of the programme in 2018-21.
STRATEGICCASE
WE AREHERE
INDICATIVE BUSINESS
CASES
DETAILEDBUSINESS
CASES
ITP/NLTP/ LTP
PROGRAMME BUSINESS CASE
PROGRAMME BUSINESS CASE
The Integrated Transport Programme calculator is used to determine the ranking of all transport programmes which are seeking funding for delivery. Cycling is one programme and will be ranked according to the criteria in the calculator against other programmes like public transport or growth related proposals.