Embed Size (px)
Citation preview

©2020 Major, Lindsey & Africa LLC.All rights reserved.An Allegis Group Company.
W W W. M L AG LO B A L .CO M
2020In-House Counsel CompensationSurvey

©2020 Major, Lindsey & Africa LLC. All rights reserved. An Allegis Group Company. 2 0 2 0 I N - H O U S E CO U N S E L CO M P E N SAT I O N S U RV E Y | i
Table of Contents3 E X E C U T I V E S U M M A RY
3 Introduction
3 Methodology
5 K E Y F I N D I N G S
5 Total Actual Annual Cash
5 United States5 Outside the United States
6 Bonus as Part of Compensation
6 United States7 Outside the United States
7 Gender
7 United States8 Outside the United States9 Global
11 APAC12 EMEA
13 Industry
13 United States14 Global
15 Company Revenue
15 United States15 Global
16 Compensation by Geographic Regions
16 United States18 APAC20 EMEA21 Comparison US APAC EMEA GC/CLO
23 Legal as Member of Senior Leadership
24 Chief Compliance Officer
25 A P P E N D I X : AV E R AG E SA L A RY B R E A KO U T
26 United States
26 Chief Legal Officer/General Counsel32 Regional General Counsel/
Country General Counsel35 Deputy/Assistant General Counsel
40 Senior Counsel/Associate General Counsel45 Counsel48 Chief Compliance Officer
51 APAC
51 Chief Legal Officer/General Counsel53 Regional General Counsel/
Country General Counsel55 Deputy/Assistant General Counsel56 Senior Counsel/Associate General Counsel
57 EMEA
57 Chief Legal Officer/General Counsel
59 Regional General Counsel/Country General Counsel
61 Deputy/Assistant General Counsel63 Senior Counsel/Associate General Counsel65 Counsel
66 Is Member of Legal Department Member of Senior Management?

2 0 2 0 I N - H O U S E CO U N S E L CO M P E N SAT I O N S U RV E Y | 3 ©2020 Major, Lindsey & Africa LLC. All rights reserved. An Allegis Group Company.
Executive SummaryI N T R O D U C T I O NIn the fall of 2019 Major, Lindsey & Africa (MLA) launched the 2020 In-House Counsel Compensation Survey in partnership with Western Management Group (WMG), an independent global leader in the design, development and conduct of compensation and benefit surveys. The survey received 3,900 responses from 36 countries. This report reviews the detailed compensation data collected for a variety of legal department positions, from the Chief Legal Officer/General Counsel to the In-House Counsel.
In the survey, we included the position of Chief Compliance Officer in our outreach. This role has grown more prevalent in recent years as the regulatory environment has become increasingly stringent. Organizations across the most regulated industries, such as financial services, healthcare and life sciences, have come to require a dedicated leader to ensure compliance with both internal and external policies and regulations.
M E T H O D O LO GYData for this survey was collected using an online questionnaire hosted by WMG. Approximately 26,000 In-House Counsel were invited to participate via email. The responses were anonymous and held in strict confidence by WMG. Only aggregated data, with no identifying information, was shared with MLA.
Compensation Data Collected
> Annual Base Pay as of September 1, 2019 (i.e., salary)
> Annual Variable Pay, Current Year Target 2019 (i.e., bonus/commission, etc.)
> Annual Variable Pay, Actual Paid for Fiscal Year 2018 (i.e., bonus/commission, etc.)
Positions for Which Data Was Collected
Respondents were asked to self-identify their position based on the position to which they report as defined below.
> Chief Legal Officer (CLO)/General Counsel (GC): Chief/senior lawyer of the corporation, reporting to a member of the C-suite or president of the company
> Chief Compliance Officer (CCO): Corporate official in charge of overseeing and managing compliance issues within an organization
> Regional General Counsel (RGC)/Country General Counsel (CGC): Chief/senior lawyer of the corporation in a geographic region, reporting to the company’s GC or CLO
> Deputy (DGC)/Assistant General Counsel (AGC): In-house lawyer with some managerial duties, reporting to the CLO or GC
> Senior Counsel (SC)/Associate General Counsel (ASTGC): In-house lawyer in non-entry-level role but with no managerial duties
> Counsel: In-house lawyer at the most junior level within the department

2 0 2 0 I N - H O U S E CO U N S E L CO M P E N SAT I O N S U RV E Y | 4 ©2020 Major, Lindsey & Africa LLC. All rights reserved. An Allegis Group Company.
Additional Data Collected
> Company size by revenue
> Company size by employee head count
> Company industry (self-identified by respondent)
> Practice area of respondent
> Respondent demographic details, including:
• Geographic work location• Gender• Ethnicity• Years of legal experience• Years in current position
Calculated Values Used in This Report
> Mean/Average: Total value of all observations divided by the number of observations
> Total Annual Actual Cash (TAC): Calculated by adding the current 2019 base salary to the actual variable cash pay from fiscal 2018
> Total Target Cash (TTC): Calculated by adding the current 2019 base salary to the variable pay target of current year, 2019
Data Is Presented in the Following Divisions
> US: United States of America
> Outside the US: All countries in the survey pool not including the US
> Global: All countries represented in the survey pool
> APAC: China, Hong Kong, India, Singapore
> EMEA: France, Germany, Netherlands, Switzerland, United Kingdom
Data is reported in categories where more than five responses were collected—the minimum number recommended count by the US Department of Commerce when reporting on compensation.
A summary of collected data by job position and country is available in the appendices. Numbers in the appendices and graphs depicted in this report vary slightly due to rounding.
Questions and comments regarding the survey are welcomed by MLA, and may be directed to:
Eliza StokerExecutive Director, In-House Counsel Recruiting – East [email protected]+1.212.421.2276
Chad MarlowExecutive Director, In-House Counsel Recruiting – West [email protected]+1.213.225.0629
Naveen TuliManaging Partner, In-House Counsel Practice – Europe, Middle-East and Africa (EMEA) & Asia-Pacific (APAC)[email protected]+91.9599.27.4444

2 0 2 0 I N - H O U S E CO U N S E L CO M P E N SAT I O N S U RV E Y | 5 ©2020 Major, Lindsey & Africa LLC. All rights reserved. An Allegis Group Company.
Key FindingsTOTA L A N N UA L AC T UA L C AS H
United States
Average TAC for each of the surveyed roles in the United States ranged from $201,277 for Counsel to $503,078 for the CLO/GC.
The data shows significant increases in TAC when attorneys are promoted to roles with managerial duties such as DGC, or when they are elevated to GC. Increases in compensation for obtaining other roles is more modest.
US Average Total Actual Cash by RoleUS AVERAGE TOTAL ACTUAL CASH BY ROLE
Outside the US
Outside the US, TAC for each of the surveyed jobs ranged from $348,152 for CLO/GC to $118,108 for Counsel positions.
TAC for the surveyed jobs including GC is significantly higher in the US than outside the US. For example, TAC for US GC is $503,078 vs $348,152 for non-US GC.
We believe that some of the difference in compensation is attributable to an increase in responsibility that the role of GC has assumed in the US, and its prominence in the C-suite. The GC is now viewed as a key member of the CEO’s cabinet, and as a viable potential successor to the CEO. In that regard, there were several instances in the US in 2019 when the GC was named as Interim CEO, the most notable of which was at Wells Fargo.
GRAPH ON NEXT PAGE >

2 0 2 0 I N - H O U S E CO U N S E L CO M P E N SAT I O N S U RV E Y | 6 ©2020 Major, Lindsey & Africa LLC. All rights reserved. An Allegis Group Company.
Outside the US Average Total Actual Cash by Role
US Average Pay Components by Position
US Average Pay Components by Position
OUTSIDE THE US AVERAGE TOTAL ACTUAL CASH BY ROLE
US AVERAGE PAY COMPONENTS BY POSITION
B O N U S AS PA R T O F CO M P E N SAT I O N
United States
Of the roles covered in the survey, the CLO/GC position received the highest proportion of total target cash compensation in the form of bonus payments. Those in the US received an average of about $250,000 in fiscal 2018 and were targeted to receive over $210,000 in 2019.
The position receiving the lowest proportion of bonus pay in 2018 was the SC/ASTGC, at a little over one-quarter of total cash. In the 2019 fiscal year the smallest targeted bonus was for the Counsel, at less than one-fifth of total cash.
Bonus, or variable compensation, is a significant component of pay for GC. In the US, bonus can equate to 40%–50% of GC compensation. Variable compensation for a GC is attributable to roughly one-half of her or his base salary—in line with other members of the C-suite whose variable compensation is tied to company performance. This is further recognition of the GC’s rise in the leadership ranks.
$328.2K
$271.3K $270.8K$251.3K
$207.6K
$158.9K
$255.8K
$190.8K$179.5K
$120.8K
$75.7K $69.2K
$211.3K
$147.9K $154.7K
$101.0K
$55.5K$34.2K

2 0 2 0 I N - H O U S E CO U N S E L CO M P E N SAT I O N S U RV E Y | 7 ©2020 Major, Lindsey & Africa LLC. All rights reserved. An Allegis Group Company.
Outside the US Average Pay Components by Position
US Average Pay Components by Position
OUTSIDE THE US AVERAGE PAY COMPONENTS BY POSITION
Outside the US
Outside the United States, the pattern of compensation is similar, but the amount of compensation itself—standardized to be expressed in US dollars, using the exchange rates effective on November 1, 2019—is lower across the board.
G E N D E R
United States
Within the Unites States, males made more than females in TAC compensation in most positions:
For RGC/CGC and SC/ASTGC positions, female TAC exceeded male TAC at $430,675 vs $406,975 and $271,446 vs $251,504, respectively.
GRAPH ON NEXT PAGE >
$248.2K
$217.7K
$194.1K $193.5K
$147.3K
$111.1K
$137.3K
$103.3K
$70.7K$89.2K
$33.7K$18.7K
$114.4K
$81.3K
$58.6K $62.3K
$31.6K$16.6K
CLO/GC CCO DAGC Counsel
Male $519,528 $401,426 $356,382 $211,679
Female $455,796 $389,121 $329,455 $192,328

2 0 2 0 I N - H O U S E CO U N S E L CO M P E N SAT I O N S U RV E Y | 8 ©2020 Major, Lindsey & Africa LLC. All rights reserved. An Allegis Group Company.
US Average Total Actual Cash by Gender
US CLO/GC Average Total Actual Cash by Gender
US Average Total Actual Cash by Gender
US Average Total Actual Cash by Gender
US AVERAGE TOTAL ACTUAL CASH BY GENDER
US CLO/GC AVERAGE TOTAL ACTUAL CASH BY COMPANY REVENUE
We also found that while men and women are proportionately represented in GC and CLO positions at high-revenue companies, women earn less than men in these roles, with the exception of companies with revenue <$1 million. At the highest revenues, the gap is the greatest. For instance, at companies with revenue over $10 billion, men’s average total annual cash compensation is $1.1 million as compared to their female counterparts who earn $739,436 on average.
Outside the US
Outside the US, TAC compensation for males exceeded that for females in all positions except for the DGC/AGC, for which female pay exceeded male pay, $263,760 vs $245,430. For the positions of CCO and Counsel, only males responded from locations outside the US.
GRAPH ON NEXT PAGE >

2 0 2 0 I N - H O U S E CO U N S E L CO M P E N SAT I O N S U RV E Y | 9 ©2020 Major, Lindsey & Africa LLC. All rights reserved. An Allegis Group Company.
Non-US Average Total Actual Cash by Gender
US Average Total Actual Cash by Gender
OUTSIDE THE US AVERAGE TOTAL ACTUAL CASH BY GENDER
Global
On a global basis, almost two-thirds of the 1,419 CLO/GC respondents answering the gender question reported as male. Although the past couple of years have highlighted the pay inequity that exists between men and women in the same role, and steps have been taken to make changes, there nevertheless continues to be pay inequity globally between male and female GC.
When combined and averaged globally, male CLOs/GCs report higher average compensation than their female counterparts. Men report a higher average base salary of $326,000 (in US dollars), compared with $307,000 for women.
> Higher average actual variable pay: $245,000 vs $213,000
> Higher average targeted variable pay: $213,000 vs $163,000
> Higher average TAC: $501,000 vs $444,000
> Higher average TTC: $511,000 vs $435,000
The data shows that the gender disparity in Global CLO/GC average pay comes primarily from actual bonus and target bonus, and not nearly as much from base salary.
> The pay differential in base salary for males and females is 6%.
> The pay differential in actual paid bonus for 2018 is 13%.
> The pay differential in target bonus for 2019 is 23%.
In other words, the greater part of the disparity is bonus-related and not salary-related. The reason for this phenomenon is not known to us, nor are we able to speculate at this time.
GRAPH ON NEXT PAGE >

2 0 2 0 I N - H O U S E CO U N S E L CO M P E N SAT I O N S U RV E Y | 1 0 ©2020 Major, Lindsey & Africa LLC. All rights reserved. An Allegis Group Company.
Global CLO/GC Average Pay Components by Gender
US Average Total Actual Cash by Gender
GLOBAL CLO/GC AVERAGE PAY COMPONENTS BY GENDER
The large number of data elements collected in the survey, in addition to compensation, allows for a markedly detailed breakdown of information. When we take a deeper look into compensation by gender some interesting data points show up.
For example, this pattern of greater male compensation when compared to female, does not hold true for all other positions in the survey. On a worldwide basis, female RGCs/CGCs—40% of the responding sample (312)—reported higher average pay than males at every point of measurement.
Global RGC/CGC Average Pay Components by GenderGLOBAL RGC/CGC AVERAGE PAY COMPONENTS BY GENDER
US Average Total Actual Cash by Gender
2 0 2 0 I N - H O U S E CO U N S E L CO M P E N SAT I O N S U RV E Y | 1 1 ©2020 Major, Lindsey & Africa LLC. All rights reserved. An Allegis Group Company.
APAC GC/CLO AVERAGE BASE AND BONUS ‘18 AND BONUS ‘19 BY GENDER
APAC
We also found in our APAC data that the average TAC salary for a female GC/CLO outpaces the male average, $437,428 vs $385,884. When TAC is broken out, the average variable bonus pay for 2018 is higher for females, $240,258 vs $128,493. 2019 target bonuses are also larger for females, $171,887 vs $122,751.
From our experience, female GCs getting paid higher than males is an anomaly. Generally, in the market, compensations of genders within APAC are on par for multinational corporations. In Asia, many households have helpers who look after children so women can return to work sooner than they do in other countries. They do not have long interruptions in their professional work and are therefore on a more equal playing field with their male counterparts when compared with women in western countries.APAC CLO/GC Average Total Actual Cash by Gender
APAC GC/CLO Average Base and Bonus '18 and Bonus '19 by Gender
APAC CLO/GC AVERAGE TOTAL ACTUAL CASH BY GENDER US Average Total Actual Cash by Gender
2 0 2 0 I N - H O U S E CO U N S E L CO M P E N SAT I O N S U RV E Y | 1 2 ©2020 Major, Lindsey & Africa LLC. All rights reserved. An Allegis Group Company.
EMEA GC/CLO TAC BY GENDER
EMEA GC/CLO TAC by Gender
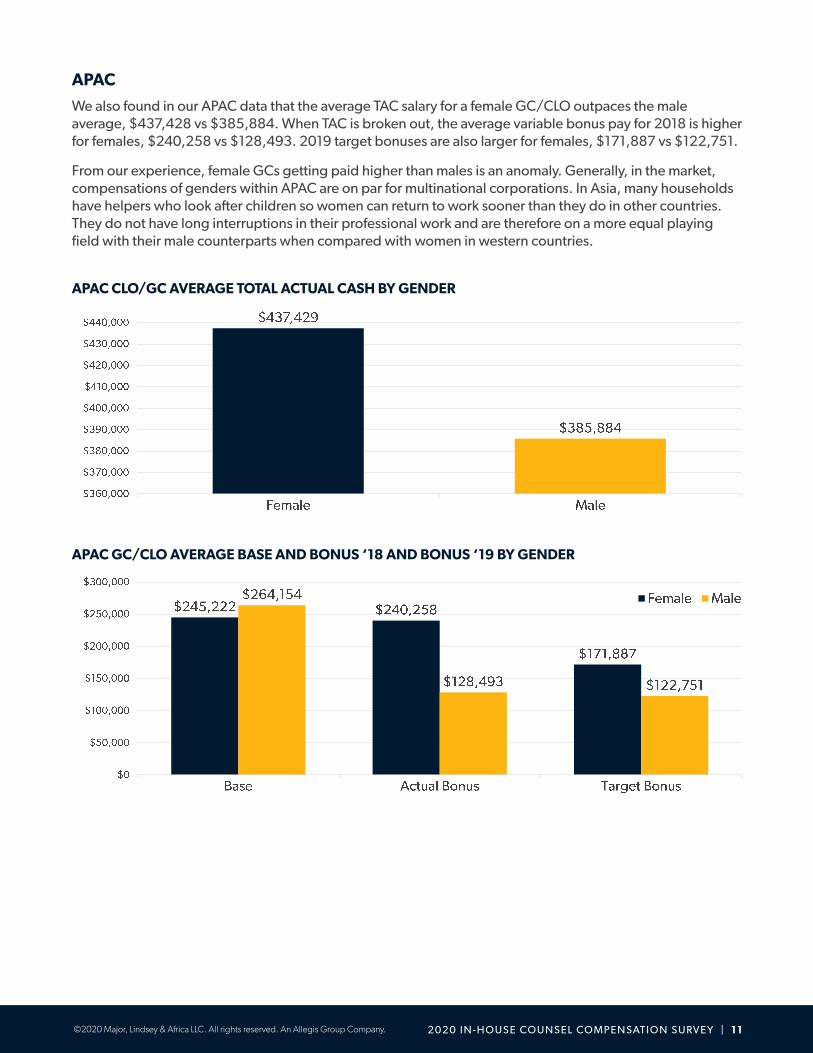
EMEA
Average total actual cash paid to male GCs in EMEA (in US dollars) is $356,422 vs $289,481 for female GCs—a difference of 18%. This difference in pay by gender is again consistent with what we see in the market.
When data is broken down by pay elements, average base pay, average bonus pay for 2018, and average bonus projected pay for 2019, males report higher values than females. The differences are 17% for 2019 base pay, 30% for the actual paid bonus in 2018, and 10% for the projected bonus pay of 2019.
EMEA GC/CLO AVERAGE BASE AND AVE BONUS ‘18 AND AVE BONUS ‘19 BY GENDER
EMEA GC/CLO Average Base and Ave Bonus '18 and Ave Bonus '19 by Gender
US Average Total Actual Cash by Gender

2 0 2 0 I N - H O U S E CO U N S E L CO M P E N SAT I O N S U RV E Y | 1 3 ©2020 Major, Lindsey & Africa LLC. All rights reserved. An Allegis Group Company.
US CLO/GC Average Total Actual Cash by IndustryUS CLO/GC AVERAGE TOTAL ACTUAL CASH BY INDUSTRY
I N D U ST RY
United States
CLOs/GCs in the Banking industry, $785,231, followed by Agriculture, $668,531, Financial/Professional Services, $665,121, and Energy/Public Utility, $603,072, earned the highest TAC. On the other end of the spectrum, Education and Government had the lowest TAC at $345,199 and $229,731, respectively.
Agriculture seems an unusual industry to appear in the top tier of CLO/GC compensation. Respondents self-selected industry, so it is possible multinational agrochemical and agricultural biotechnology companies selected agriculture, resulting in the large TAC reported.
Adv/Pub/Media $516,652
Aerospace/Defense $491,563
Agriculture $668,531
Automotive $573,895
Banking $785,231
Bio-Technology $447,607
Consumer Products $545,560
Education $345,199
Energy/Public Utility $603,072
Entertainment $368,114
Financial/Professional Services $665,121
Food/Beverage $533,091
Government $229,731
Healthcare/Hospital $472,514
Insurance $515,717
Medical Devices/Pharmaceuticals $505,927
Real Estate $566,131
Restaurant/Food Service $454,059
Retail Sales Operations $525,707
Technology $420,880
Telecommunications $458,762
Travel/Leisure/Hospitality $381,270

2 0 2 0 I N - H O U S E CO U N S E L CO M P E N SAT I O N S U RV E Y | 1 4 ©2020 Major, Lindsey & Africa LLC. All rights reserved. An Allegis Group Company.
Global
When looking at CLO/GC TAC compensation globally, Banking, $725,970, Financial/Professional Services $617,018, and Agriculture, $609,720, are again in the top three. Education and Government compose the bottom two positions, $350,018 and $218,980, respectively.
Global CLO/GC Average Total Actual Cash by IndustryGLOBAL CLO/GC AVERAGE TOTAL ACTUAL CASH BY INDUSTRY
Adv/Pub/Media $481,688
Aerospace/Defense $480,260
Agriculture $609,720
Automotive $514,548
Banking $725,970
Bio-Technology $439,697
Consumer Products $507,184
Education $350,018
Energy/Public Utility $548,530
Entertainment $396,836
Financial/Professional Services $617,018
Food/Beverage $510,208
Government $218,980
Healthcare/Hospital $468,314
Insurance $534,717
Medical Devices/Pharmaceuticals $487,275
Real Estate $559,526
Restaurant/Food Service $429,430
Retail Sales Operations $518,951
Technology $412,498
Telecommunications $476,309
Travel/Leisure/Hospitality $352,729
Not surprisingly, compensation for GC in complex, highly regulated industries is higher than in nonregulated industries. For example, GC compensation in the Banking industry is approximately 18% higher than compensation in the Professional Services industry, which ranked second for industries globally. Surprisingly, TAC for GC in the Technology industry ranked in the bottom quarter of our survey, both in the US and globally, perhaps because equity—as compared to cash—is such a significant component of pay for these growth-oriented companies.

2 0 2 0 I N - H O U S E CO U N S E L CO M P E N SAT I O N S U RV E Y | 1 5 ©2020 Major, Lindsey & Africa LLC. All rights reserved. An Allegis Group Company.
CO M PA N Y R E V E N U E
United States
Average TAC compensation for CLOs/GCs in the United States ranges from $368,768 for companies with revenue <$1M to $989,313 for companies of revenue >$10B.
In terms of TAC for GCs/CLOs, there does not seem to be a very significant number if the organization makes less than $1B in revenue. Once the company reaches the size of $1B and above, there appears to be a significant financial reward that grows as the company’s revenues increase.
US CLO/GC Average Total Actual Cash by RevenueUS CLO/GC AVERAGE TOTAL ACTUAL CASH BY REVENUE
Global
As expected, there is a clear correlation globally between compensation and size of company in terms of revenue. GCs at companies with revenue greater than $10B earn approximately 25% more than their peers at companies with revenue between $1B and $10B. Globally, average total actual cash earned by CLOs/GCs closely follows US compensation trends until the highest revenue companies at >$10B. Globally, the TAC at >$10B is $850,939, while the average TAC for GCs of US companies greater than $10B is just shy of $1M, at $989,313.
GRAPH ON NEXT PAGE >

2 0 2 0 I N - H O U S E CO U N S E L CO M P E N SAT I O N S U RV E Y | 1 6 ©2020 Major, Lindsey & Africa LLC. All rights reserved. An Allegis Group Company.
Global CLO/CG Average Total Actual Cash by RevenueGLOBAL CLO/CG AVERAGE TOTAL ACTUAL CASH BY REVENUE
CO M P E N SAT I O N BY G E O G R A P H I C A R E AS
United States
Global survey data can be broken down by country and, within the United States, by regions, states, and metropolitan areas of the largest cities.
Within the US, 49 distinct metropolitan areas provided CLO/GC information. The national average TAC is $503,078, but local averages diverge widely, from a low of $318,429 from the Austin, Texas, metro area to a high of $736,461 from Manhattan.
The highest TAC in the survey was reported by a CLO/GC in the Los Angeles, California, metro area at $4.8M, and the lowest figure for this position was $73,000 in the Rochester/Buffalo metro area of New York.
There is a clear correlation between compensation and geographic area. GC working in metropolitan areas of the largest cities (New York, Los Angeles) earn higher TAC than GC working in metropolitan areas of smaller cities (Denver, Miami). Appearing as somewhat outliers here are San Francisco and Silicon Valley. We think this may be due to the fact that they are home to many technology and start-up companies where equity, not reported here, forms a large part of the compensation package.
GRAPH ON NEXT PAGE >

2 0 2 0 I N - H O U S E CO U N S E L CO M P E N SAT I O N S U RV E Y | 1 7 ©2020 Major, Lindsey & Africa LLC. All rights reserved. An Allegis Group Company.
For the DGC/AGC, the highest average base pay was reported—interestingly, from a sample of just five—from Cincinnati, Ohio, at $324,600. The lowest average base was $187,414, calculated from a sample of seven from Salt Lake City, Utah. The metro providing the largest sample on this statistic, at 85, was greater Chicago, reporting an average base pay of $235,398.
US CLO/GC Average Total Actual Cash by MetroUS CLO/GC AVERAGE TOTAL ACTUAL CASH BY METRO
Atlanta $483,854
Boston $402,180
Chicago $473,468
Dallas $626,670
Denver $438,797
Houston $546,310
Los Angeles $495,707
Miami $495,111
Minneapolis $458,959
New York $736,461
Philadelphia $444,522
San Francisco $397,701
Seattle $566,858
Silicon Valley $467,363
Washington, DC $424,289
GRAPH ON NEXT PAGE >

2 0 2 0 I N - H O U S E CO U N S E L CO M P E N SAT I O N S U RV E Y | 1 8 ©2020 Major, Lindsey & Africa LLC. All rights reserved. An Allegis Group Company.
US Dep/Asst GC Average Base Salary by MetroUS DGC/AGC AVERAGE BASE SALARY BY METRO
Atlanta $223,417
Boston $252,285
Chicago $235,398
Dallas $238,783
Denver $214,154
Houston $226,718
Los Angeles $277,316
Miami $219,000
Minneapolis $226,528
New York $322,083
Philadelphia $232,000
San Francisco $289,507
Seattle $230,857
Silicon Valley $294,134
Washington, DC $238,579
APACData collected from China, Hong Kong, India, SingaporeAPAC GC/CLO Average Salary Elements
APAC GC/CLO AVERAGE SALARY ELEMENTS
2 0 2 0 I N - H O U S E CO U N S E L CO M P E N SAT I O N S U RV E Y | 1 9 ©2020 Major, Lindsey & Africa LLC. All rights reserved. An Allegis Group Company.
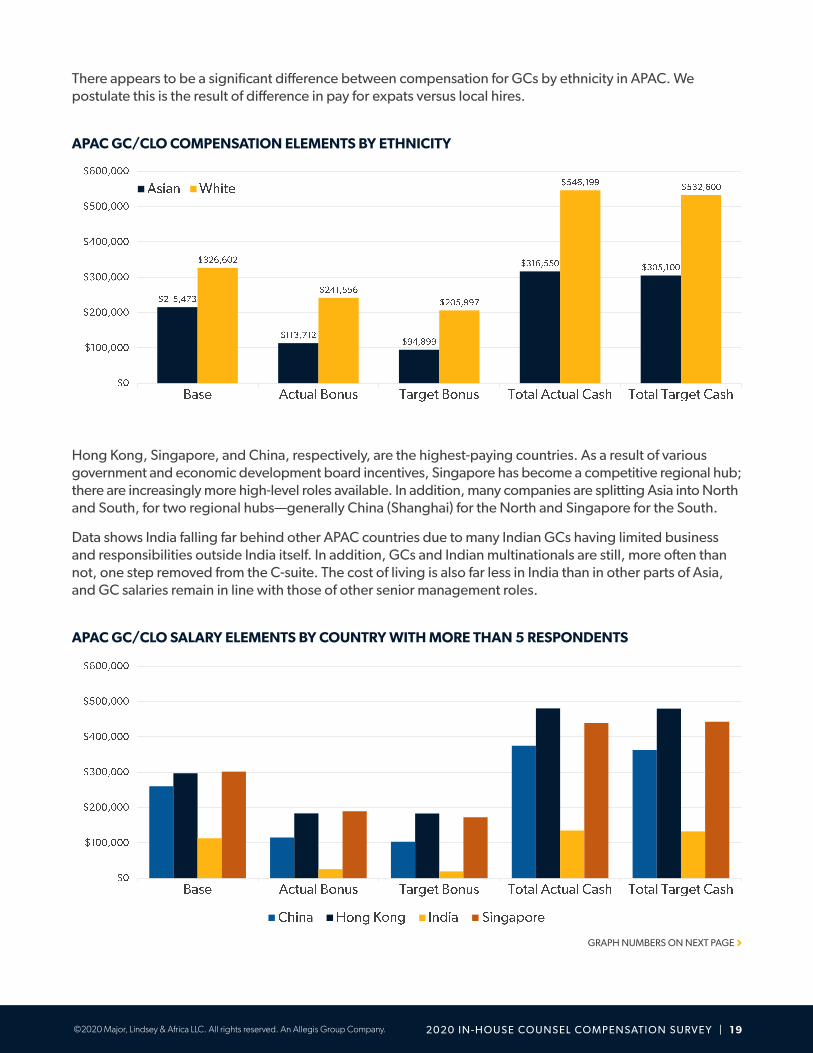
There appears to be a significant difference between compensation for GCs by ethnicity in APAC. We postulate this is the result of difference in pay for expats versus local hires.
Hong Kong, Singapore, and China, respectively, are the highest-paying countries. As a result of various government and economic development board incentives, Singapore has become a competitive regional hub; there are increasingly more high-level roles available. In addition, many companies are splitting Asia into North and South, for two regional hubs—generally China (Shanghai) for the North and Singapore for the South.
Data shows India falling far behind other APAC countries due to many Indian GCs having limited business and responsibilities outside India itself. In addition, GCs and Indian multinationals are still, more often than not, one step removed from the C-suite. The cost of living is also far less in India than in other parts of Asia, and GC salaries remain in line with those of other senior management roles.
APAC GC/CLO Compensation Elements by Ethnicity
APAC GC/CLO Salary Elements by Country with more than 5 respondents
APAC GC/CLO Salary Elements by Country with more than 5 respondents
APAC GC/CLO Compensation Elements by EthnicityAPAC GC/CLO COMPENSATION ELEMENTS BY ETHNICITY
APAC GC/CLO SALARY ELEMENTS BY COUNTRY WITH MORE THAN 5 RESPONDENTS
GRAPH NUMBERS ON NEXT PAGE >

2 0 2 0 I N - H O U S E CO U N S E L CO M P E N SAT I O N S U RV E Y | 2 0 ©2020 Major, Lindsey & Africa LLC. All rights reserved. An Allegis Group Company.
Base Actual Bonus Target Bonus TAC TTC
China $259,984 $114,909 $102,896 $374,894 $362,881
Hong Kong $296,890 $183,520 $183,012 $480,411 $479,902
India $113,046 $25,646 $19,355 $135,028 $132,401
Singapore $301,515 $189,467 $172,531 $439,309 $442,677
EMEAData collected from France, Germany, Netherlands, Switzerland, United Kingdom
EMEA GC/CLO AVERAGE SALARY ELEMENTS
EMEA GC/CLO Average Salary Elements
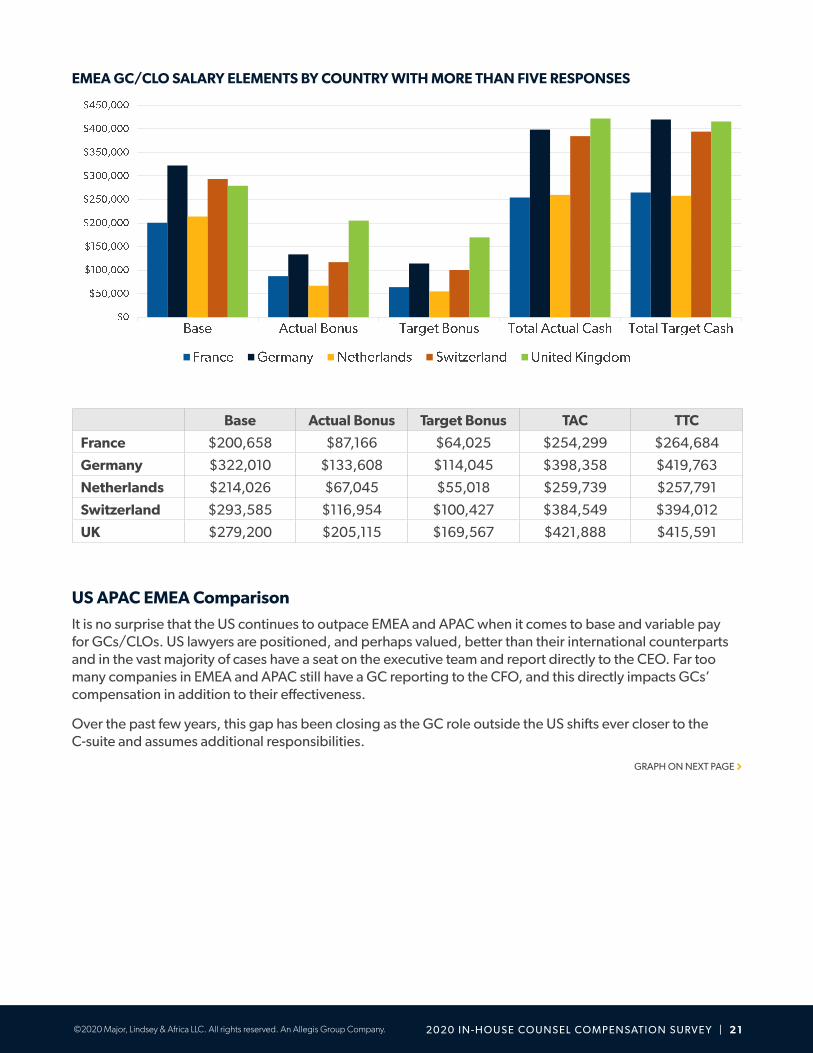
The numbers above are in line with what we see in the market.
Germany payed the highest base salary to their GCs, at $322,010. The lowest base pay was in France, at $200,658. When it comes to total actual cash paid, the UK shows the highest GC pay, at $421,888, followed by Germany and Switzerland, virtually on par at $398,358 and $384,549, respectively.
We feel these numbers are somewhat skewed by the respective response rates in the various countries. What we see in the market is that the UK and Switzerland are almost on par, followed by Germany.
GRAPH ON NEXT PAGE >
2 0 2 0 I N - H O U S E CO U N S E L CO M P E N SAT I O N S U RV E Y | 2 1 ©2020 Major, Lindsey & Africa LLC. All rights reserved. An Allegis Group Company.
EMEA GC/CLO SALARY ELEMENTS BY COUNTRY WITH MORE THAN FIVE RESPONSES
EMEA GC/CLO Salary Elements by Country with more than Five responses
EMEA GC/CLO Salary Elements by Country with more than Five responses
Base Actual Bonus Target Bonus TAC TTC
France $200,658 $87,166 $64,025 $254,299 $264,684
Germany $322,010 $133,608 $114,045 $398,358 $419,763
Netherlands $214,026 $67,045 $55,018 $259,739 $257,791
Switzerland $293,585 $116,954 $100,427 $384,549 $394,012
UK $279,200 $205,115 $169,567 $421,888 $415,591
US APAC EMEA Comparison
It is no surprise that the US continues to outpace EMEA and APAC when it comes to base and variable pay for GCs/CLOs. US lawyers are positioned, and perhaps valued, better than their international counterparts and in the vast majority of cases have a seat on the executive team and report directly to the CEO. Far too many companies in EMEA and APAC still have a GC reporting to the CFO, and this directly impacts GCs’ compensation in addition to their effectiveness.
Over the past few years, this gap has been closing as the GC role outside the US shifts ever closer to the C-suite and assumes additional responsibilities.
GRAPH ON NEXT PAGE >

2 0 2 0 I N - H O U S E CO U N S E L CO M P E N SAT I O N S U RV E Y | 2 2 ©2020 Major, Lindsey & Africa LLC. All rights reserved. An Allegis Group Company.
GC/CLO COMPENSATION ELEMENTS - EMEA, APAC, US
GC/CLO BASE PAY 2019 - EMEA, APAC, US
GC/CLO Compensation Elements - EMEA, APAC, US
GC/CLO Base Pay 2019 EMEA APAC US
GC/CLO Compensation Elements - EMEA, APAC, USGC/CLO Compensation Elements - EMEA, APAC, USGC/CLO Compensation Elements - EMEA, APAC, US
GC/CLO Compensation Elements - EMEA, APAC, USGC/CLO Compensation Elements - EMEA, APAC, USGC/CLO Compensation Elements - EMEA, APAC, US
Base Actual Bonus Target Bonus TAC TTC
EMEA $248,733 $130,295 $105,849 $338,376 $338,493
APAC $248,368 $154,758 $131,712 $383,782 $371,849
US $328,243 $255,760 $211,285 $503,078 $505,138
It is somewhat surprising that APAC GCs are earning more than those in EMEA. Economic growth in APAC—while not at the levels that countries such as China or India would like—is still relatively strong, whereas the European economy is slowing down.
GRAPH ON NEXT PAGE >

2 0 2 0 I N - H O U S E CO U N S E L CO M P E N SAT I O N S U RV E Y | 2 3 ©2020 Major, Lindsey & Africa LLC. All rights reserved. An Allegis Group Company.
GC/CLO TOTAL ACTUAL CASH AND TOTAL TARGET CASH - EMEA APAC US
GC/CLO Total Pay 2018 and 2019 EMEA APAC US
GC/CLO Compensation Elements - EMEA, APAC, USGC/CLO Compensation Elements - EMEA, APAC, USGC/CLO Compensation Elements - EMEA, APAC, US
Member of the Legal Department is a Member of Senior Leadership
MEMBER OF THE LEGAL DEPARTMENT IS A MEMBER OF SENIOR LEADERSHIP
A M E M B E R O F T H E L E G A L D E PA R T M E N T I S A M E M B E R O F S E N I O R L E A D E R S H I P
Interestingly, there is a correlation between company size (in terms of revenue) and whether the CLO/GC is a member of the senior leadership team. The data shows that the larger the company (up to approximately $10B), the more likely the CLO/GC will be a member of the leadership team. For example, for companies <$1M, less than 5% of the GCs are members of the leadership team. Conversely, for companies between $1B and $10B, 30% of the GCs are part of the leadership team. It is noteworthy, however, that this trend falls off for companies >$10B, where the percentage of GCs on the leadership team is less than 20. This could be attributable to the fact that at large, diversified multinational conglomerates the CEO’s inner cabinet is confined to business unit heads who are responsible for running a profit & loss statement. Otherwise, the size of the cabinet would be unwieldy.
This question was asked of US respondents only.

2 0 2 0 I N - H O U S E CO U N S E L CO M P E N SAT I O N S U RV E Y | 24 ©2020 Major, Lindsey & Africa LLC. All rights reserved. An Allegis Group Company.
C H I E F CO M P L I A N C E O F F I C E R
United States
Especially in the US—where companies are more highly regulated and the prospect of litigation is greater than on other continents—the role of CCO has grown in importance. As a result, CCOs can expect to earn upwards of $400,000 in TAC, with a median base salary of almost $275,000. While the CCO is viewed as a functional subject matter expert (SME) whose compensation is in line with that of other SMEs in the legal department (e.g., Chief IP Counsel and Chief Litigation Counsel), we expect an upward trend in compensation for this role given its importance in protecting against significant regulatory fines that have both financial and reputational implications for companies.
US Chief Compliance Officer Average PayUS CHIEF COMPLIANCE OFFICER AVERAGE PAY

2 0 2 0 I N - H O U S E CO U N S E L CO M P E N SAT I O N S U RV E Y | 2 5 ©2020 Major, Lindsey & Africa LLC. All rights reserved. An Allegis Group Company.
Appendix

2 0 2 0 I N - H O U S E CO U N S E L CO M P E N SAT I O N S U RV E Y | 2 6 ©2020 Major, Lindsey & Africa LLC. All rights reserved. An Allegis Group Company.
United StatesC H I E F L E G A L O F F I C E R / G E N E R A L CO U N S E L
N=Number of respondents.No data is recorded where less than 5 respondents provided information.
US CLO/GC
Average Annual Base Pay as of
9/1/2019(i.e., salary)
Annual Variable Pay, Actual Paid
for Fiscal Year 2018 (i.e., bonus/commission, etc.)
Annual Variable Pay, Current
Year Target 2019 (i.e., bonus/
commission, etc.)
Total Annual Actual Cash
(Base + Annual Variable Pay for
Fiscal Year 2018)
Total Target Cash (Base + Annual
Variable Pay Target 2019)
N
Gender
Female $314,648 $224,269 $168,468 $455,796 $446,987 429
Male $333,514 $260,744 $225,617 $519,538 $530,049 822
Prefer not to say $377,857 $376,700 $290,187 $646,929 $571,315 21
Ethnicity
Asian $297,177 $163,425 $141,631 $408,886 $415,502 79
Black or African American
$301,444 $258,664 $197,416 $462,641 $453,083 69
Hispanic or Latino $323,769 $276,068 $204,063 $526,595 $498,681 49
White $329,711 $253,134 $210,332 $504,939 $508,542 992
Prefer not to say $334,343 $293,083 $263,663 $527,775 $537,593 71
Years in Current Position
5 Years or Less $318,294 $220,639 $186,569 $467,075 $478,182 958
6 to 10 Years $356,725 $340,196 $274,918 $615,323 $575,522 217
11 to 15 Years $352,738 $270,562 $286,349 $570,432 $589,716 87
16 to 20 Years $389,778 $389,965 $320,850 $657,879 $650,469 32
21 to 30 Years $305,636 $444,429 $301,250 $588,455 $524,727 11
Years with Current Company
5 Years or Less $308,383 $197,345 $168,262 $437,321 $451,469 802
6 to 10 Years $338,011 $304,555 $248,667 $569,518 $548,140 271
11 to 15 Years $369,096 $354,143 $324,903 $658,029 $638,726 136
16 to 20 Years $402,953 $309,603 $267,451 $624,835 $616,914 60
21 to 30 Years $403,615 $361,590 $363,019 $683,555 $684,662 31
31+ Years $492,400 $346,667 $285,000 $583,667 $600,333 6
Years of Relevant Legal Work Experience
6 to 10 Years $218,148 $104,336 $99,424 $276,302 $293,123 61
11 to 15 Years $281,535 $165,465 $154,705 $377,757 $401,768 184
16 to 20 Years $316,556 $242,082 $198,245 $488,240 $487,152 337
21 to 30 Years $347,697 $265,897 $225,450 $538,681 $543,612 569
31+ Years $385,551 $343,474 $277,067 $621,570 $607,538 173
Industry
Advertising/ Publishing/Media
$358,571 $201,193 $194,948 $516,652 $539,594 28
Aerospace/Defense $320,179 $262,116 $220,371 $491,563 $498,171 26
Agriculture $344,554 $503,965 $279,834 $668,531 $584,412 14

2 0 2 0 I N - H O U S E CO U N S E L CO M P E N SAT I O N S U RV E Y | 27 ©2020 Major, Lindsey & Africa LLC. All rights reserved. An Allegis Group Company.
Industry, continued...
Automotive $357,632 $273,933 $224,335 $573,895 $581,967 19
Banking $422,385 $471,700 $335,923 $785,231 $758,308 13
Bio-Technology $344,499 $163,729 $158,150 $447,607 $482,732 57
Consumer Products $337,494 $312,099 $218,786 $545,560 $536,391 66
Education $314,872 $107,829 $63,666 $345,199 $328,799 64
Energy/Public Utility $350,839 $307,067 $272,928 $603,072 $618,893 56
Entertainment $301,128 $86,688 $80,419 $368,114 $359,614 22
Financial/Professional Services
$336,442 $430,239 $399,845 $665,121 $675,652 177
Food/Beverage $347,379 $256,460 $229,198 $533,091 $576,578 29
Government $199,115 $79,600 $64,750 $229,731 $219,038 13
Healthcare/Hospital $350,597 $182,190 $137,485 $472,514 $472,576 133
Insurance $303,883 $267,580 $211,643 $515,717 $489,071 24
Medical Devices/ Pharmaceuticals
$343,345 $211,938 $167,278 $505,927 $503,748 73
Real Estate $310,465 $339,150 $252,927 $566,131 $524,480 65
Restaurant/ Food Service
$337,500 $174,838 $203,500 $454,059 $524,042 12
Retail Sales Operations $351,288 $230,482 $233,264 $525,707 $571,944 37
Technology $303,821 $184,953 $144,087 $420,880 $422,981 237
Telecommunications $319,613 $191,330 $192,368 $458,762 $494,492 22
Travel/Leisure/ Hospitality
$277,650 $129,525 $127,400 $381,270 $405,050 10
Area of Practice
Commercial $255,460 $142,992 $137,995 $346,207 $369,899 87
Contracts $307,984 $171,670 $84,676 $428,788 $378,547 54
Corporate, Securities & Governance
$364,471 $323,786 $274,162 $616,174 $623,624 274
Employment & Labor $233,000 $62,500 $76,250 $253,833 $283,833 6
Finance $319,222 $409,253 $386,321 $683,002 $679,789 45
Generalist $315,965 $219,333 $186,181 $458,975 $465,171 569
Government/ Regulatory
$313,046 $401,169 $256,564 $508,738 $488,260 41
Insurance $279,836 $190,629 $180,556 $418,476 $427,564 11
Intellectual Property $328,417 $143,250 $104,806 $423,917 $407,021 24
Law Department Management
$361,769 $270,902 $224,949 $543,301 $551,932 97
Litigation $340,538 $146,750 $173,778 $385,692 $460,846 13
Real Estate $301,647 $272,853 $217,145 $494,249 $499,632 34
Technology $398,400 $276,132 $175,765 $585,775 $542,779 28
US CLO/GC,continued...
Average Annual Base Pay as of
9/1/2019(i.e., salary)
Annual Variable Pay, Actual Paid
for Fiscal Year 2018 (i.e., bonus/commission, etc.)
Annual Variable Pay, Current
Year Target 2019 (i.e., bonus/
commission, etc.)
Total Annual Actual Cash
(Base + Annual Variable Pay for
Fiscal Year 2018)
Total Target Cash (Base + Annual
Variable Pay Target 2019)
N

2 0 2 0 I N - H O U S E CO U N S E L CO M P E N SAT I O N S U RV E Y | 2 8 ©2020 Major, Lindsey & Africa LLC. All rights reserved. An Allegis Group Company.
Number of Employees Supervised
Less than 5 Employees $284,300 $187,264 $166,218 $404,935 $422,705 572
5 to 10 Employees $368,166 $293,441 $259,616 $593,710 $598,783 376
11 to 20 Employees $443,102 $345,677 $283,954 $708,761 $679,730 108
Over 20 Employees $411,206 $392,854 $358,627 $717,401 $711,820 68
Company Headcount
Less than 50 Employees $281,629 $300,676 $230,444 $460,023 $460,680 140
50 to 249 Employees $287,561 $198,089 $178,125 $415,038 $429,723 317
250 to 999 Employees $302,386 $215,259 $171,283 $442,052 $438,782 307
1,000 to 4,999 Employees
$332,554 $222,690 $195,069 $499,395 $510,284 315
5,000 to 14,999 Employees
$393,781 $326,350 $265,304 $633,356 $622,279 173
15,000 to 49,999 Employees
$481,819 $456,893 $371,958 $823,112 $817,926 83
50,000 to 99,999 Employees
$435,231 $377,813 $295,864 $667,731 $685,577 13
100,000 or more Employees
$403,286 $454,429 $281,000 $857,714 $684,286 7
Company Revenue
Less than $1 Million USD
$300,986 $132,088 $120,438 $368,768 $394,484 76
$1 Million to $9.9 Million USD
$274,105 $182,467 $147,533 $368,018 $381,344 102
$10 Million to $99.9 Million USD
$267,394 $223,269 $188,465 $405,181 $410,663 327
$100 Million to $999.9 Million USD
$315,599 $202,290 $172,563 $464,529 $468,648 476
$1 Billion to $9.9 Billion USD
$409,857 $342,209 $284,016 $670,536 $665,382 319
$10 Billion USD and above
$498,276 $641,076 $519,524 $989,313 $951,478 47
Country
United States $328,243 $255,760 $211,285 $503,078 $505,138 1,368
Region
MA - Mid-Atlantic: DC, DE, MD, NC, SC, VA, WV
$312,448 $203,533 $176,252 $440,155 $452,988 153
MT - Mountain: CO, MT, UT, WY
$340,052 $176,920 $214,297 $469,340 $521,380 26
MW - Midwest: IA, IL, IN, KS, KY, MI, MN, MO, ND, NE, OH, SD, WI
$319,522 $241,402 $194,467 $490,426 $489,036 226
NE - Northeast: CT, MA, ME, NH, NJ, NY, PA, RI, VT
$351,219 $351,235 $287,992 $594,463 $591,551 335
NW - Northwest: ID, OR, WA
$377,013 $294,553 $153,941 $555,849 $470,478 28
US CLO/GC,continued...
Average Annual Base Pay as of
9/1/2019(i.e., salary)
Annual Variable Pay, Actual Paid
for Fiscal Year 2018 (i.e., bonus/commission, etc.)
Annual Variable Pay, Current
Year Target 2019 (i.e., bonus/
commission, etc.)
Total Annual Actual Cash
(Base + Annual Variable Pay for
Fiscal Year 2018)
Total Target Cash (Base + Annual
Variable Pay Target 2019)
N

2 0 2 0 I N - H O U S E CO U N S E L CO M P E N SAT I O N S U RV E Y | 2 9 ©2020 Major, Lindsey & Africa LLC. All rights reserved. An Allegis Group Company.
Region, continued...
PA - California/Nevada: CA, NV
$314,480 $208,160 $175,839 $450,486 $456,338 326
SE - Southeast: AL, AR, FL, GA, LA, MS, TN
$310,937 $212,191 $166,043 $459,222 $455,933 141
SW - Southwest: AZ, NM, OK, TX
$342,158 $252,977 $238,410 $525,899 $563,001 95
State
AZ - Arizona $309,350 $98,185 $142,913 $391,171 $416,535 12
CA - California $315,660 $210,279 $176,492 $454,071 $458,083 316
CO - Colorado $323,853 $172,415 $194,752 $438,797 $475,327 18
CT - Connecticut $364,341 $413,029 $373,409 $645,201 $692,941 25
DC - District Of Columbia
$307,198 $199,304 $141,017 $424,289 $412,961 80
DE - Delaware $373,909 $267,889 $370,455 $593,091 $744,364 11
FL - Florida $321,822 $193,168 $166,322 $466,698 $475,350 52
GA - Georgia $307,266 $236,803 $180,533 $469,156 $459,086 61
IL - Illinois $310,933 $235,222 $202,748 $473,019 $483,013 119
IN - Indiana $269,778 $253,750 $117,679 $382,556 $361,306 9
KY - Kentucky $351,148 $162,540 $243,800 $452,736 $564,473 8
MA - Massachusetts $310,593 $142,114 $121,630 $405,335 $416,006 75
MD - Maryland $282,929 $205,788 $156,575 $429,920 $394,768 14
MI - Michigan $341,550 $239,675 $197,211 $485,355 $519,040 20
MN - Minnesota $306,381 $231,621 $181,635 $458,133 $469,226 29
MO - Missouri $319,834 $337,232 $156,269 $608,890 $464,941 14
NC - North Carolina $288,898 $118,725 $133,100 $356,741 $398,230 28
NH - New Hampshire $315,000 $120,000 $99,250 $387,000 $394,400 5
NJ - New Jersey $337,486 $318,583 $229,272 $588,502 $533,743 38
NV - Nevada $277,200 $120,000 $155,000 $337,200 $401,200 10
NY - New York $378,278 $476,534 $397,929 $717,097 $709,584 155
OH - Ohio $342,885 $221,097 $228,958 $546,975 $554,231 26
PA - Pennsylvania $333,033 $183,706 $134,337 $437,133 $436,025 30
RI - Rhode Island $311,278 $428,125 $661,667 $653,778 $708,278 5
TN - Tennessee $317,097 $206,173 $148,107 $454,546 $432,292 18
TX - Texas $348,580 $285,554 $250,451 $550,998 $586,350 79
UT - Utah $376,500 $184,643 $248,500 $538,063 $625,000 8
VA - Virginia $382,471 $383,452 $285,098 $711,145 $626,841 7
WA - Washington $380,342 $297,923 $107,385 $548,733 $441,038 23
WI - Wisconsin $428,757 $278,499 $161,141 $667,470 $589,899 7
Metro
AZ Phoenix Metro $317,018 $106,872 $157,653 $404,459 $431,675 11
CA Central Coast $298,333 $144,500 $121,700 $418,750 $399,750 6
CA East Bay Metro $332,477 $209,231 $167,366 $462,000 $452,023 21
US CLO/GC,continued...
Average Annual Base Pay as of
9/1/2019(i.e., salary)
Annual Variable Pay, Actual Paid
for Fiscal Year 2018 (i.e., bonus/commission, etc.)
Annual Variable Pay, Current
Year Target 2019 (i.e., bonus/
commission, etc.)
Total Annual Actual Cash
(Base + Annual Variable Pay for
Fiscal Year 2018)
Total Target Cash (Base + Annual
Variable Pay Target 2019)
N

2 0 2 0 I N - H O U S E CO U N S E L CO M P E N SAT I O N S U RV E Y | 3 0 ©2020 Major, Lindsey & Africa LLC. All rights reserved. An Allegis Group Company.
Metro, continued...
CA Los Angeles Metro $300,224 $295,219 $229,701 $495,707 $486,468 74
CA Orange County $305,875 $138,500 $143,345 $401,094 $435,781 32
CA San Diego Metro $299,769 $181,857 $117,496 $446,654 $408,227 26
CA San Francisco Metro $310,476 $174,451 $165,968 $397,701 $407,768 58
CA Silicon Valley $335,401 $189,145 $167,212 $467,363 $483,170 86
CO Denver/Boulder $323,853 $172,415 $194,752 $438,797 $475,327 18
CT Connecticut-Other $334,306 $125,000 $200,250 $434,306 $494,506 5
CT Stamford Metro $380,313 $496,150 $398,933 $690,406 $754,313 16
DC Washington DC Metro
$307,198 $199,304 $141,017 $424,289 $412,961 80
DE Wilmington Metro $373,909 $267,889 $370,455 $593,091 $744,364 11
FL Miami/Ft.Lauderdale
$321,111 $223,714 $187,882 $495,111 $498,556 18
FL Northern Florida $389,107 $242,937 $199,552 $632,044 $588,659 7
FL Orlando/Central $304,852 $150,056 $141,358 $404,889 $430,503 27
GA Atlanta Metro $313,701 $236,803 $183,505 $483,854 $472,814 58
IL Chicago Metro $309,637 $236,645 $203,075 $473,468 $483,205 117
IN Indianapolis Metro $282,143 $315,000 $125,625 $417,143 $389,821 7
KY Kentucky $351,148 $162,540 $243,800 $452,736 $564,473 8
MA Boston Metro $317,541 $137,930 $105,414 $402,180 $406,185 44
MA Route 128/495 $296,881 $153,671 $145,025 $412,134 $426,368 28
MD Baltimore $287,417 $242,234 $178,219 $448,906 $406,229 12
MI Detroit Metro $356,733 $299,875 $213,643 $516,667 $556,133 15
MI Michigan-Other $296,000 $119,275 $139,701 $391,420 $407,760 5
MN Minneapolis/St. Paul
$301,788 $231,621 $183,180 $458,959 $465,341 28
MO St. Louis Metro $326,500 $249,018 $146,000 $525,714 $472,500 10
NC North Carolina-Other
$298,625 $109,889 $115,511 $381,042 $406,917 16
NC Raleigh/Durham/RTP
$275,929 $145,233 $166,078 $324,340 $386,648 12
NH New Hampshire $315,000 $120,000 $99,250 $387,000 $394,400 5
NJ Northern New Jersey $370,593 $384,821 $302,667 $659,717 $616,786 28
NJ Southern New Jersey $248,100 $156,667 $53,125 $389,100 $301,225 10
NV Southern Nevada $249,250 $121,250 $162,857 $309,875 $391,750 8
NY Manhattan Metro $383,370 $497,978 $414,506 $736,461 $730,413 147
NY Rochester/Buffalo $274,000 $112,250 $45,125 $363,800 $310,100 5
OH Cincinnati/Dayton $332,714 $314,620 $244,160 $647,334 $576,874 7
OH Cleveland/Akron $350,167 $145,000 $263,200 $446,833 $569,500 6
OH Columbus $345,000 $204,083 $212,773 $549,083 $540,042 12
PA Philadelphia Metro $317,870 $191,643 $133,250 $434,522 $422,152 23
US CLO/GC,continued...
Average Annual Base Pay as of
9/1/2019(i.e., salary)
Annual Variable Pay, Actual Paid
for Fiscal Year 2018 (i.e., bonus/commission, etc.)
Annual Variable Pay, Current
Year Target 2019 (i.e., bonus/
commission, etc.)
Total Annual Actual Cash
(Base + Annual Variable Pay for
Fiscal Year 2018)
Total Target Cash (Base + Annual
Variable Pay Target 2019)
N

2 0 2 0 I N - H O U S E CO U N S E L CO M P E N SAT I O N S U RV E Y | 3 1 ©2020 Major, Lindsey & Africa LLC. All rights reserved. An Allegis Group Company.
Metro, continued...
RI Rhode Island $311,278 $428,125 $661,667 $653,778 $708,278 5
TN Central Tennessee $308,896 $208,208 $143,850 $482,402 $428,771 12
TN Tennessee Other $333,500 $196,000 $158,750 $398,833 $439,333 6
TX Austin Metro $259,286 $103,500 $94,857 $318,429 $354,143 7
TX Dallas/Fort Worth Metro
$350,586 $402,623 $307,982 $626,670 $649,768 35
TX Houston Metro $371,088 $224,283 $236,079 $546,310 $599,790 32
UT Salt Lake Metro $376,500 $184,643 $248,500 $538,063 $625,000 8
VA Virginia $382,471 $383,452 $285,098 $711,145 $626,841 7
WA Seattle/Tacoma Metro
$390,812 $297,923 $107,385 $566,858 $454,267 22
WI Milwaukee/Madison
$429,260 $247,748 $185,198 $627,458 $614,458 5
OTHER $350,267 $276,838 $200,972 $580,965 $528,908 36
US CLO/GC,continued...
Average Annual Base Pay as of
9/1/2019(i.e., salary)
Annual Variable Pay, Actual Paid
for Fiscal Year 2018 (i.e., bonus/commission, etc.)
Annual Variable Pay, Current
Year Target 2019 (i.e., bonus/
commission, etc.)
Total Annual Actual Cash
(Base + Annual Variable Pay for
Fiscal Year 2018)
Total Target Cash (Base + Annual
Variable Pay Target 2019)
N
2 0 2 0 I N - H O U S E CO U N S E L CO M P E N SAT I O N S U RV E Y | 3 2 ©2020 Major, Lindsey & Africa LLC. All rights reserved. An Allegis Group Company.
REGIONAL GENERAL COUNSEL/COUNTRY GENERAL COUNSEL
US RGC/CGC
Average Annual Base Pay as of
9/1/2019(i.e., salary)
Annual Variable Pay, Actual Paid
for Fiscal Year 2018 (i.e., bonus/commission, etc.)
Annual Variable Pay, Current
Year Target 2019 (i.e., bonus/
commission, etc.)
Total Annual Actual Cash
(Base + Annual Variable Pay for
Fiscal Year 2018)
Total Target Cash (Base + Annual
Variable Pay Target 2019)
N
Gender
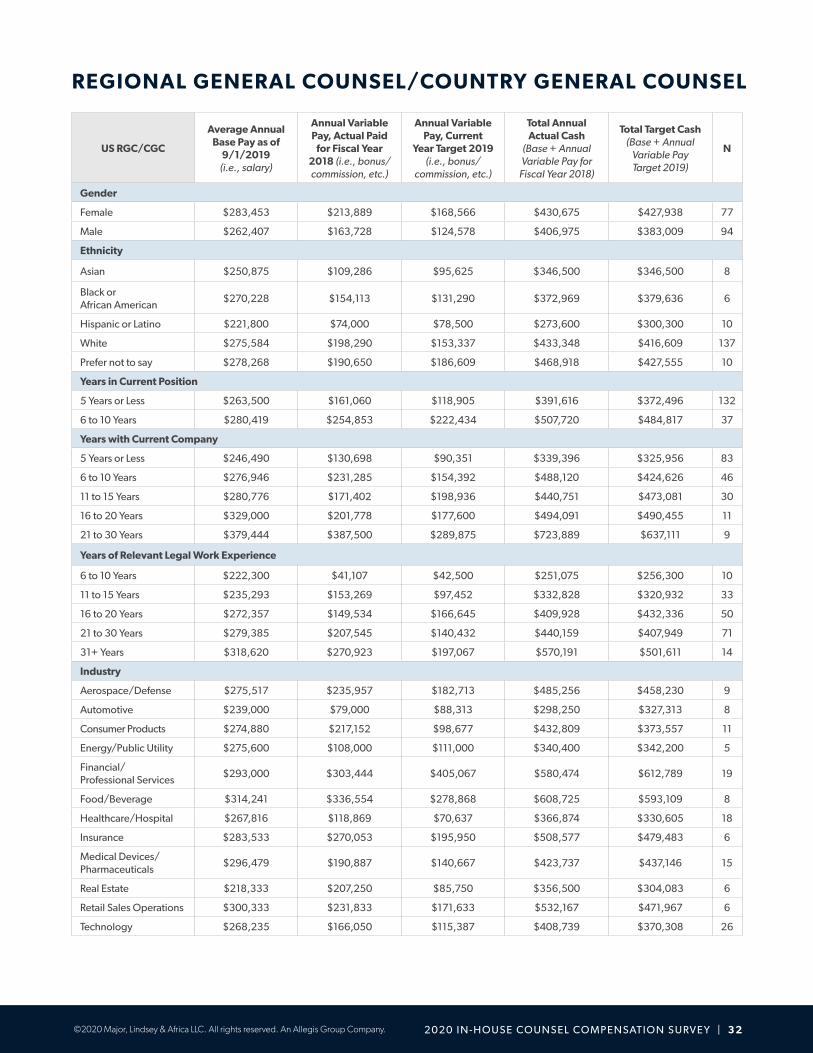
Female $283,453 $213,889 $168,566 $430,675 $427,938 77
Male $262,407 $163,728 $124,578 $406,975 $383,009 94
Ethnicity
Asian $250,875 $109,286 $95,625 $346,500 $346,500 8
Black or African American
$270,228 $154,113 $131,290 $372,969 $379,636 6
Hispanic or Latino $221,800 $74,000 $78,500 $273,600 $300,300 10
White $275,584 $198,290 $153,337 $433,348 $416,609 137
Prefer not to say $278,268 $190,650 $186,609 $468,918 $427,555 10
Years in Current Position
5 Years or Less $263,500 $161,060 $118,905 $391,616 $372,496 132
6 to 10 Years $280,419 $254,853 $222,434 $507,720 $484,817 37
Years with Current Company
5 Years or Less $246,490 $130,698 $90,351 $339,396 $325,956 83
6 to 10 Years $276,946 $231,285 $154,392 $488,120 $424,626 46
11 to 15 Years $280,776 $171,402 $198,936 $440,751 $473,081 30
16 to 20 Years $329,000 $201,778 $177,600 $494,091 $490,455 11
21 to 30 Years $379,444 $387,500 $289,875 $723,889 $637,111 9
Years of Relevant Legal Work Experience
6 to 10 Years $222,300 $41,107 $42,500 $251,075 $256,300 10
11 to 15 Years $235,293 $153,269 $97,452 $332,828 $320,932 33
16 to 20 Years $272,357 $149,534 $166,645 $409,928 $432,336 50
21 to 30 Years $279,385 $207,545 $140,432 $440,159 $407,949 71
31+ Years $318,620 $270,923 $197,067 $570,191 $501,611 14
Industry
Aerospace/Defense $275,517 $235,957 $182,713 $485,256 $458,230 9
Automotive $239,000 $79,000 $88,313 $298,250 $327,313 8
Consumer Products $274,880 $217,152 $98,677 $432,809 $373,557 11
Energy/Public Utility $275,600 $108,000 $111,000 $340,400 $342,200 5
Financial/Professional Services
$293,000 $303,444 $405,067 $580,474 $612,789 19
Food/Beverage $314,241 $336,554 $278,868 $608,725 $593,109 8
Healthcare/Hospital $267,816 $118,869 $70,637 $366,874 $330,605 18
Insurance $283,533 $270,053 $195,950 $508,577 $479,483 6
Medical Devices/ Pharmaceuticals
$296,479 $190,887 $140,667 $423,737 $437,146 15
Real Estate $218,333 $207,250 $85,750 $356,500 $304,083 6
Retail Sales Operations $300,333 $231,833 $171,633 $532,167 $471,967 6
Technology $268,235 $166,050 $115,387 $408,739 $370,308 26
2 0 2 0 I N - H O U S E CO U N S E L CO M P E N SAT I O N S U RV E Y | 3 3 ©2020 Major, Lindsey & Africa LLC. All rights reserved. An Allegis Group Company.
Area of Practice
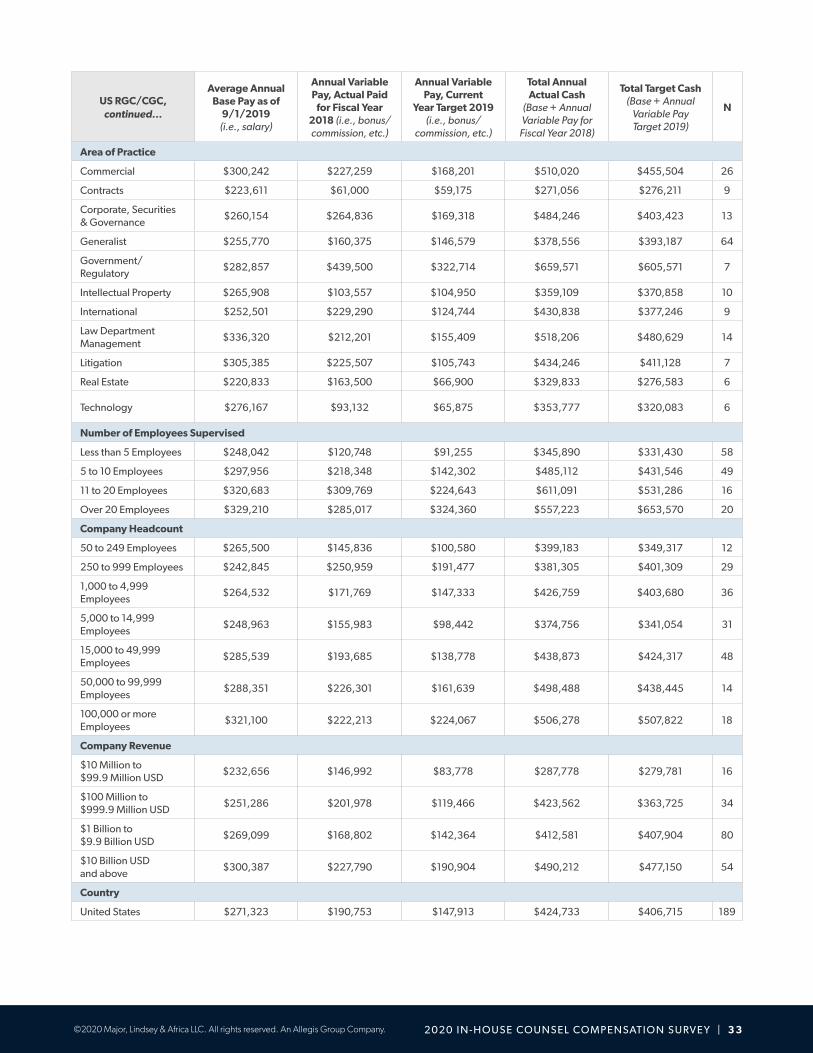
Commercial $300,242 $227,259 $168,201 $510,020 $455,504 26
Contracts $223,611 $61,000 $59,175 $271,056 $276,211 9
Corporate, Securities & Governance
$260,154 $264,836 $169,318 $484,246 $403,423 13
Generalist $255,770 $160,375 $146,579 $378,556 $393,187 64
Government/ Regulatory
$282,857 $439,500 $322,714 $659,571 $605,571 7
Intellectual Property $265,908 $103,557 $104,950 $359,109 $370,858 10
International $252,501 $229,290 $124,744 $430,838 $377,246 9
Law Department Management
$336,320 $212,201 $155,409 $518,206 $480,629 14
Litigation $305,385 $225,507 $105,743 $434,246 $411,128 7
Real Estate $220,833 $163,500 $66,900 $329,833 $276,583 6
Technology $276,167 $93,132 $65,875 $353,777 $320,083 6
Number of Employees Supervised
Less than 5 Employees $248,042 $120,748 $91,255 $345,890 $331,430 58
5 to 10 Employees $297,956 $218,348 $142,302 $485,112 $431,546 49
11 to 20 Employees $320,683 $309,769 $224,643 $611,091 $531,286 16
Over 20 Employees $329,210 $285,017 $324,360 $557,223 $653,570 20
Company Headcount
50 to 249 Employees $265,500 $145,836 $100,580 $399,183 $349,317 12
250 to 999 Employees $242,845 $250,959 $191,477 $381,305 $401,309 29
1,000 to 4,999 Employees
$264,532 $171,769 $147,333 $426,759 $403,680 36
5,000 to 14,999 Employees
$248,963 $155,983 $98,442 $374,756 $341,054 31
15,000 to 49,999 Employees
$285,539 $193,685 $138,778 $438,873 $424,317 48
50,000 to 99,999 Employees
$288,351 $226,301 $161,639 $498,488 $438,445 14
100,000 or more Employees
$321,100 $222,213 $224,067 $506,278 $507,822 18
Company Revenue
$10 Million to $99.9 Million USD
$232,656 $146,992 $83,778 $287,778 $279,781 16
$100 Million to $999.9 Million USD
$251,286 $201,978 $119,466 $423,562 $363,725 34
$1 Billion to $9.9 Billion USD
$269,099 $168,802 $142,364 $412,581 $407,904 80
$10 Billion USD and above
$300,387 $227,790 $190,904 $490,212 $477,150 54
Country
United States $271,323 $190,753 $147,913 $424,733 $406,715 189
US RGC/CGC,continued...
Average Annual Base Pay as of
9/1/2019(i.e., salary)
Annual Variable Pay, Actual Paid
for Fiscal Year 2018 (i.e., bonus/commission, etc.)
Annual Variable Pay, Current
Year Target 2019 (i.e., bonus/
commission, etc.)
Total Annual Actual Cash
(Base + Annual Variable Pay for
Fiscal Year 2018)
Total Target Cash (Base + Annual
Variable Pay Target 2019)
N

2 0 2 0 I N - H O U S E CO U N S E L CO M P E N SAT I O N S U RV E Y | 3 4 ©2020 Major, Lindsey & Africa LLC. All rights reserved. An Allegis Group Company.
US RGC/CGC,continued...
Average Annual Base Pay as of
9/1/2019(i.e., salary)
Annual Variable Pay, Actual Paid
for Fiscal Year 2018 (i.e., bonus/commission, etc.)
Annual Variable Pay, Current
Year Target 2019 (i.e., bonus/
commission, etc.)
Total Annual Actual Cash
(Base + Annual Variable Pay for
Fiscal Year 2018)
Total Target Cash (Base + Annual
Variable Pay Target 2019)
N
Region
MA - Mid-Atlantic: DC, DE, MD, NC, SC, VA, WV
$258,700 $178,473 $118,800 $389,580 $377,500 15
MW - Midwest: IA, IL, IN, KS, KY, MI, MN, MO, ND, NE, OH, SD, WI
$256,307 $162,285 $111,881 $397,786 $362,450 39
NE - Northeast: CT, MA, ME, NH, NJ, NY, PA, RI, VT
$275,857 $230,451 $200,507 $465,641 $452,775 51
NW - Northwest: ID, OR, WA
$265,430 $180,417 $104,796 $445,847 $352,760 6
PA - California/Nevada: CA, NV
$300,226 $233,811 $162,342 $464,760 $444,530 27
SE - Southeast: AL, AR, FL, GA, LA, MS, TN
$255,556 $152,075 $109,933 $368,205 $357,346 27
SW - Southwest: AZ, NM, OK, TX
$254,625 $99,167 $96,571 $329,000 $339,125 8
State
CA - California $305,235 $233,811 $167,183 $476,097 $453,127 26
CT - Connecticut $257,473 $79,363 $67,813 $320,963 $311,723 5
DC - District Of Columbia
$243,917 $141,250 $77,717 $338,083 $321,633 6
FL - Florida $230,500 $138,000 $106,457 $299,500 $323,650 8
GA - Georgia $256,144 $134,208 $105,240 $371,180 $353,867 14
IL - Illinois $265,343 $205,511 $139,053 $441,495 $391,152 21
MA - Massachusetts $279,112 $223,017 $127,628 $481,855 $406,740 11
MI - Michigan $218,600 $53,333 $78,140 $250,600 $296,740 5
NJ - New Jersey $298,100 $175,125 $132,000 $438,200 $416,900 10
NY - New York $273,101 $330,148 $344,330 $516,369 $544,941 19
PA - Pennsylvania $256,866 $184,711 $165,783 $441,577 $422,649 6
TX - Texas $252,429 $99,167 $101,500 $337,429 $339,429 7
Metro
CA Los Angeles Metro $335,909 $294,889 $241,155 $577,182 $577,064 11
CA Silicon Valley $307,000 $134,720 $119,625 $387,832 $402,700 5
DC Washington DC Metro
$243,917 $141,250 $77,717 $338,083 $321,633 6
GA Atlanta Metro $256,144 $134,208 $105,240 $371,180 $353,867 14
IL Chicago Metro $265,343 $205,511 $139,053 $441,495 $391,152 21
MA Boston Metro $313,116 $248,503 $207,800 $561,619 $520,916 5
MA Route 128/495 $250,776 $197,531 $60,819 $415,385 $311,595 6
MI Detroit Metro $218,600 $53,333 $78,140 $250,600 $296,740 5
NJ Northern New Jersey $298,100 $175,125 $132,000 $438,200 $416,900 10
NY Manhattan Metro $273,101 $330,148 $344,330 $516,369 $544,941 19
OTHER $301,434 $221,286 $226,192 $504,280 $508,776 12

2 0 2 0 I N - H O U S E CO U N S E L CO M P E N SAT I O N S U RV E Y | 3 5 ©2020 Major, Lindsey & Africa LLC. All rights reserved. An Allegis Group Company.
D E P U T Y/ ASS I STA N T G E N E R A L CO U N S E L
US DGC/AGC
Average Annual Base Pay as of
9/1/2019(i.e., salary)
Annual Variable Pay, Actual Paid
for Fiscal Year 2018 (i.e., bonus/commission, etc.)
Annual Variable Pay, Current
Year Target 2019 (i.e., bonus/
commission, etc.)
Total Annual Actual Cash
(Base + Annual Variable Pay for
Fiscal Year 2018)
Total Target Cash (Base + Annual
Variable Pay Target 2019)
N
Gender
Female $241,351 $116,646 $89,336 $329,455 $320,707 376
Male $258,557 $123,414 $111,288 $356,382 $360,230 463
Prefer not to say $245,980 $91,725 $89,990 $319,360 $325,171 25
Ethnicity
Asian $253,544 $130,944 $129,875 $343,851 $368,492 87
Black or African American
$241,182 $139,178 $109,671 $360,478 $345,631 63
Hispanic or Latino $230,801 $113,486 $81,083 $323,381 $303,349 38
White $250,841 $115,930 $97,482 $340,629 $338,606 612
Prefer not to say $252,746 $104,043 $90,396 $334,885 $333,626 57
Years in Current Position
5 Years or Less $246,615 $117,287 $97,966 $337,562 $335,448 708
6 to 10 Years $261,328 $135,761 $107,971 $375,463 $356,877 113
11 to 15 Years $247,796 $129,888 $152,163 $353,330 $376,183 32
16 to 20 Years $274,000 $114,571 $60,367 $388,571 $325,743 7
Years with Current Company
5 Years or Less $244,017 $105,769 $89,897 $319,567 $324,236 483
6 to 10 Years $250,417 $133,043 $108,550 $364,453 $349,876 203
11 to 15 Years $251,588 $127,382 $118,042 $368,443 $359,874 121
16 to 20 Years $271,094 $159,484 $110,389 $409,776 $371,884 46
21 to 30 Years $281,854 $131,033 $137,517 $385,301 $390,420 19
Years of Relevant Legal Work Experience
5 Years or Less $191,571 $101,382 $56,817 $263,987 $240,271 7
6 to 10 Years $214,902 $96,013 $76,741 $288,148 $283,732 97
11 to 15 Years $241,026 $104,481 $85,166 $318,705 $316,564 230
16 to 20 Years $255,460 $128,131 $110,208 $356,997 $358,181 265
21 to 30 Years $271,233 $132,928 $117,658 $377,064 $374,411 260
31+ Years $265,500 $132,171 $91,246 $372,254 $349,727 26
Industry
Advertising/Publishing/Media
$262,333 $114,833 $102,138 $331,233 $350,853 15
Aerospace/Defense $265,933 $157,388 $123,904 $400,176 $375,261 34
Agriculture $200,545 $75,357 $58,036 $255,350 $258,582 11
Automotive $233,516 $108,629 $100,085 $322,394 $324,503 22
Banking $249,667 $126,902 $138,159 $368,108 $383,220 30
Bio-Technology $289,854 $99,857 $92,327 $361,973 $382,181 36
Consumer Products $235,242 $119,030 $88,158 $323,555 $313,447 62
Education $219,775 $119,859 $81,176 $271,887 $255,069 23

2 0 2 0 I N - H O U S E CO U N S E L CO M P E N SAT I O N S U RV E Y | 3 6 ©2020 Major, Lindsey & Africa LLC. All rights reserved. An Allegis Group Company.
Industry, continued...
Energy/Public Utility $236,244 $128,508 $92,381 $335,096 $323,887 39
Entertainment $324,655 $141,257 $126,993 $447,487 $429,562 23
Financial/Professional Services
$289,723 $158,913 $146,838 $426,181 $423,793 92
Food/Beverage $236,210 $96,291 $77,998 $300,404 $303,065 21
Government $171,602 $35,970 $20,708 $192,585 $181,957 12
Healthcare/Hospital $237,509 $85,507 $67,795 $296,609 $297,328 68
Insurance $231,814 $119,014 $94,478 $332,518 $322,659 26
Medical Devices/ Pharmaceuticals
$261,506 $122,702 $87,354 $361,898 $346,591 77
Real Estate $249,184 $207,181 $148,250 $404,570 $389,198 36
Retail Sales Operations $243,558 $102,441 $95,889 $335,023 $336,023 28
Technology $252,231 $106,616 $98,213 $331,491 $340,752 152
Telecommunications $238,282 $99,625 $88,500 $323,674 $314,139 14
Travel/Leisure / Hospitality
$235,389 $153,393 $106,912 $354,694 $336,361 18
Area of Practice
Commercial $244,964 $121,260 $99,237 $342,862 $338,738 109
Contracts $219,302 $85,606 $65,983 $286,145 $275,343 73
Corporate, Securities & Governance
$289,196 $133,068 $134,947 $396,433 $418,586 170
Employment & Labor $223,325 $85,441 $69,480 $291,033 $284,939 53
Finance $247,943 $200,836 $141,600 $435,390 $365,943 30
Generalist $233,706 $92,464 $77,385 $298,133 $298,610 155
Government/ Regulatory
$242,559 $121,011 $87,877 $331,605 $317,172 53
Insurance $219,400 $148,500 $90,000 $338,200 $309,400 5
Intellectual Property $257,787 $128,046 $101,916 $364,192 $356,832 71
International $207,147 $83,326 $53,563 $262,698 $260,710 6
Law Department Management
$280,729 $144,928 $120,897 $391,556 $387,403 17
Litigation $266,041 $116,186 $108,951 $359,445 $366,447 51
Media/Publishing $270,500 $144,892 $54,327 $386,413 $324,827 5
Real Estate $243,684 $190,121 $146,760 $392,216 $381,272 32
Technology $276,380 $121,995 $89,829 $364,721 $356,917 29
Number of Employees Supervised
Less than 5 Employees $237,472 $102,659 $94,079 $319,275 $323,694 443
5 to 10 Employees $273,935 $151,747 $128,713 $396,736 $392,976 173
11 to 20 Employees $320,744 $150,387 $128,961 $453,644 $440,708 43
Over 20 Employees $313,944 $200,687 $169,398 $486,950 $465,817 29
US DGC/AGC,continued...
Average Annual Base Pay as of
9/1/2019(i.e., salary)
Annual Variable Pay, Actual Paid
for Fiscal Year 2018 (i.e., bonus/commission, etc.)
Annual Variable Pay, Current
Year Target 2019 (i.e., bonus/
commission, etc.)
Total Annual Actual Cash
(Base + Annual Variable Pay for
Fiscal Year 2018)
Total Target Cash (Base + Annual
Variable Pay Target 2019)
N

2 0 2 0 I N - H O U S E CO U N S E L CO M P E N SAT I O N S U RV E Y | 37 ©2020 Major, Lindsey & Africa LLC. All rights reserved. An Allegis Group Company.
US DGC/AGC,continued...
Average Annual Base Pay as of
9/1/2019(i.e., salary)
Annual Variable Pay, Actual Paid
for Fiscal Year 2018 (i.e., bonus/commission, etc.)
Annual Variable Pay, Current
Year Target 2019 (i.e., bonus/
commission, etc.)
Total Annual Actual Cash
(Base + Annual Variable Pay for
Fiscal Year 2018)
Total Target Cash (Base + Annual
Variable Pay Target 2019)
N
Company Headcount
Less than 50 Employees $221,909 $65,143 $41,750 $263,364 $259,864 11
50 to 249 Employees $258,038 $143,078 $132,461 $362,281 $375,360 70
250 to 999 Employees $249,919 $128,500 $95,831 $331,692 $331,494 121
1,000 to 4,999 Employees
$236,695 $93,387 $79,582 $306,330 $306,617 173
5,000 to 14,999 Employees
$256,673 $101,862 $91,133 $339,250 $340,285 206
15,000 to 49,999 Employees
$260,166 $149,211 $113,386 $383,962 $366,076 182
50,000 to 99,999 Employees
$250,402 $120,060 $105,129 $351,751 $348,705 77
100,000 or more Employees
$250,063 $142,427 $131,311 $370,855 $368,076 79
Company Revenue
Less than$1 Million USD
$277,596 $104,540 $84,352 $356,001 $357,730 20
$1 Million to $9.9 Million USD
$205,916 $59,901 $52,585 $250,054 $250,198 19
$10 Million to $99.9 Million USD
$227,955 $99,224 $73,737 $287,804 $292,328 63
$100 Million to $999.9 Million USD
$229,088 $106,932 $87,645 $297,013 $301,849 159
$1 Billion to $9.9 Billion USD
$251,079 $111,310 $97,546 $342,325 $341,641 405
$10 Billion USD and above
$265,603 $152,913 $121,498 $397,515 $378,237 233
Country
United States $251,302 $120,848 $100,955 $345,005 $342,336 926
Region
MA - Mid-Atlantic: DC, DE, MD, NC, SC, VA, WV
$231,153 $98,309 $77,640 $309,648 $297,358 129
MT - Mountain: CO, MT, UT, WY
$199,992 $74,247 $44,613 $249,490 $239,648 18
MW - Midwest: IA, IL, IN, KS, KY, MI, MN, MO, ND, NE, OH, SD, WI
$234,003 $116,371 $94,198 $330,979 $321,164 174
NE - Northeast: CT, MA, ME, NH, NJ, NY, PA, RI, VT
$272,388 $146,561 $125,370 $384,463 $386,081 204
NW - Northwest: ID, OR, WA
$218,350 $113,127 $85,991 $308,851 $291,442 20
PA - California/Nevada: CA, NV
$279,059 $121,998 $105,220 $367,952 $375,290 199
SE - Southeast: AL, AR, FL, GA, LA, MS, TN
$226,039 $107,513 $82,787 $315,162 $300,112 76
SW - Southwest: AZ, NM, OK, TX
$233,495 $113,271 $116,218 $324,112 $338,092 60

2 0 2 0 I N - H O U S E CO U N S E L CO M P E N SAT I O N S U RV E Y | 3 8 ©2020 Major, Lindsey & Africa LLC. All rights reserved. An Allegis Group Company.
US DGC/AGC,continued...
Average Annual Base Pay as of
9/1/2019(i.e., salary)
Annual Variable Pay, Actual Paid
for Fiscal Year 2018 (i.e., bonus/commission, etc.)
Annual Variable Pay, Current
Year Target 2019 (i.e., bonus/
commission, etc.)
Total Annual Actual Cash
(Base + Annual Variable Pay for
Fiscal Year 2018)
Total Target Cash (Base + Annual
Variable Pay Target 2019)
N
State
AZ - Arizona $211,800 $72,500 $70,000 $240,800 $239,800 5
CA - California $278,874 $123,359 $105,865 $368,997 $375,963 193
CO - Colorado $207,996 $55,708 $45,200 $243,447 $249,087 11
CT - Connecticut $236,438 $162,068 $182,080 $388,376 $395,758 16
DC - District Of Columbia
$238,579 $121,495 $85,561 $327,289 $305,126 63
DE - Delaware $249,020 $90,281 $85,226 $339,301 $334,246 8
FL - Florida $223,400 $101,390 $83,289 $304,512 $298,360 20
GA - Georgia $224,212 $109,542 $80,298 $318,469 $295,173 43
IL - Illinois $234,412 $113,886 $95,857 $328,662 $322,556 87
IN - Indiana $207,038 $77,961 $64,624 $277,202 $265,199 10
KY - Kentucky $214,000 $73,000 $77,800 $272,400 $291,800 5
MA - Massachusetts $252,539 $170,671 $116,167 $368,905 $360,785 44
MD - Maryland $198,308 $40,100 $44,417 $229,154 $239,308 13
MI - Michigan $240,528 $134,397 $99,815 $337,592 $334,797 18
MN - Minnesota $224,259 $85,463 $88,612 $297,512 $308,651 21
MO - Missouri $238,322 $202,375 $122,969 $418,211 $361,292 9
NC - North Carolina $236,440 $92,124 $80,290 $319,649 $314,140 31
NJ - New Jersey $254,364 $142,708 $97,053 $362,476 $348,476 33
NV - Nevada $285,000 $74,000 $82,400 $334,333 $353,667 6
NY - New York $317,364 $159,355 $154,348 $444,031 $453,903 78
OH - Ohio $263,023 $139,248 $107,126 $374,421 $359,436 20
PA - Pennsylvania $226,106 $79,330 $77,375 $291,269 $297,954 28
TN - Tennessee $214,533 $109,800 $93,545 $314,351 $308,079 11
TX - Texas $237,474 $114,774 $118,506 $333,884 $351,240 50
UT - Utah $187,414 $100,200 $43,633 $258,986 $224,814 7
VA - Virginia $201,421 $66,863 $53,591 $257,140 $246,080 6
WA - Washington $230,857 $154,092 $107,768 $340,923 $315,532 14
WI - Wisconsin $198,500 $52,830 $54,620 $251,330 $253,120 5
Metro
CA East Bay Metro $252,750 $63,625 $63,750 $284,563 $316,500 8
CA Los Angeles Metro $277,316 $107,360 $93,322 $355,396 $360,458 55
CA Orange County $260,700 $130,742 $99,874 $349,604 $360,574 25
CA San Diego Metro $244,800 $71,670 $73,611 $297,358 $313,503 15
CA San Francisco Metro
$289,507 $162,816 $137,348 $408,905 $408,541 30
CA Silicon Valley $294,134 $133,746 $120,135 $397,377 $403,731 57
CO Denver/Boulder $214,154 $41,582 $45,200 $239,103 $259,354 10
CT Stamford Metro $248,909 $209,340 $244,556 $439,218 $449,000 11
DC Washington DC Metro
$238,579 $121,495 $85,561 $327,289 $305,126 63

2 0 2 0 I N - H O U S E CO U N S E L CO M P E N SAT I O N S U RV E Y | 3 9 ©2020 Major, Lindsey & Africa LLC. All rights reserved. An Allegis Group Company.
US DGC/AGC,continued...
Average Annual Base Pay as of
9/1/2019(i.e., salary)
Annual Variable Pay, Actual Paid
for Fiscal Year 2018 (i.e., bonus/commission, etc.)
Annual Variable Pay, Current
Year Target 2019 (i.e., bonus/
commission, etc.)
Total Annual Actual Cash
(Base + Annual Variable Pay for
Fiscal Year 2018)
Total Target Cash (Base + Annual
Variable Pay Target 2019)
N
Metro, continued...
DE Wilmington Metro $249,020 $90,281 $85,226 $339,301 $334,246 8
FL Miami/Ft.Lauderdale $219,000 $53,607 $59,471 $264,949 $278,471 7
FL Orlando/Central $233,818 $118,013 $97,489 $319,645 $313,582 11
GA Atlanta Metro $223,417 $112,973 $80,968 $319,858 $294,511 41
IL Chicago Metro $235,398 $115,419 $97,853 $331,807 $325,193 85
IN Indianapolis Metro $207,482 $67,941 $41,102 $265,718 $242,713 7
KY Kentucky $214,000 $73,000 $77,800 $272,400 $291,800 5
MA Boston Metro $252,285 $163,342 $133,803 $367,230 $376,177 27
MA Route 128/495 $252,438 $191,464 $85,650 $372,102 $332,734 16
MD Baltimore $199,636 $43,778 $46,500 $235,455 $241,909 11
MI Detroit Metro $233,700 $115,170 $91,704 $318,158 $319,290 15
MN Minneapolis/St. Paul
$226,528 $87,943 $91,403 $301,279 $313,361 20
MO Kansas City (MO&KS)
$223,180 $172,500 $98,745 $361,180 $321,925 5
NC North Carolina-Other
$232,667 $102,195 $84,824 $329,995 $317,490 21
NC Raleigh/Durham/RTP
$244,363 $66,948 $69,710 $297,922 $307,103 10
NJ Northern New Jersey $255,567 $139,987 $101,317 $362,890 $353,507 30
NV Southern Nevada $285,000 $74,000 $82,400 $334,333 $353,667 6
NY Manhattan Metro $322,083 $160,902 $157,712 $454,719 $462,746 74
OH Cincinnati/Dayton $324,600 $197,800 $135,780 $522,400 $460,380 5
OH Cleveland/Akron $267,606 $142,567 $111,421 $378,492 $366,647 9
OH Columbus $201,800 $57,000 $62,000 $236,000 $251,400 5
PA Philadelphia Metro $232,000 $68,538 $76,033 $287,688 $303,281 16
PA Pittsburgh Metro $216,371 $101,432 $82,972 $307,659 $291,046 10
TN Central Tennessee $217,694 $66,333 $71,571 $274,551 $289,266 7
TX Austin Metro $257,786 $159,750 $133,786 $394,714 $391,571 7
TX Dallas/Fort Worth Metro
$238,783 $112,630 $137,345 $336,722 $364,185 23
TX Houston Metro $226,718 $102,031 $95,955 $304,741 $322,673 17
UT Salt Lake Metro $187,414 $100,200 $43,633 $258,986 $224,814 7
VA Virginia $201,421 $66,863 $53,591 $257,140 $246,080 6
WA Seattle/Tacoma Metro
$230,857 $154,092 $107,768 $340,923 $315,532 14
OTHER $259,017 $143,499 $99,211 $352,603 $349,601 46

2 0 2 0 I N - H O U S E CO U N S E L CO M P E N SAT I O N S U RV E Y | 4 0 ©2020 Major, Lindsey & Africa LLC. All rights reserved. An Allegis Group Company.
S E N I O R CO U N S E L / ASS O C I AT E G E N E R A L CO U N S E L
US SC/ASTGC
Average Annual Base Pay as of
9/1/2019(i.e., salary)
Annual Variable Pay, Actual Paid
for Fiscal Year 2018 (i.e., bonus/commission, etc.)
Annual Variable Pay, Current
Year Target 2019 (i.e., bonus/
commission, etc.)
Total Annual Actual Cash
(Base + Annual Variable Pay for
Fiscal Year 2018)
Total Target Cash (Base + Annual
Variable Pay Target 2019)
N
Gender
Female $216,533 $78,576 $53,588 $271,446 $259,153 308
Male $198,526 $74,432 $57,121 $251,504 $246,744 340
Prefer not to say $218,994 $97,853 $51,154 $298,499 $266,951 16
Ethnicity
Asian $200,130 $61,699 $46,754 $242,845 $239,691 78
Black or African American
$197,951 $83,817 $56,871 $258,486 $245,344 54
Hispanic or Latino $192,154 $98,184 $57,533 $258,573 $237,842 34
White $211,078 $73,527 $57,696 $264,208 $258,964 447
Prefer not to say $204,151 $77,216 $49,797 $258,023 $245,842 43
Years in Current Position
5 Years or Less $203,174 $73,283 $53,013 $256,058 $247,431 556
6 to 10 Years $205,414 $77,261 $59,502 $265,071 $253,618 79
11 to 15 Years $230,042 $81,200 $56,614 $302,695 $271,758 19
16 to 20 Years $207,591 $61,105 $50,183 $246,476 $234,964 11
Years with Current Company
5 Years or Less $201,291 $70,996 $51,999 $251,318 $245,172 474
6 to 10 Years $206,118 $80,299 $56,246 $271,920 $252,165 125
11 to 15 Years $222,469 $77,311 $61,455 $284,912 $269,742 52
16 to 20 Years $207,179 $56,174 $48,657 $247,303 $231,507 14
Years of Relevant Legal Work Experience
5 Years or Less $151,183 $44,805 $32,397 $184,787 $179,530 16
6 to 10 Years $191,608 $66,126 $49,357 $236,011 $231,904 207
11 to 15 Years $214,370 $75,873 $53,377 $270,244 $259,274 208
16 to 20 Years $206,424 $79,120 $57,555 $268,219 $256,837 137
21 to 30 Years $234,981 $82,913 $63,288 $293,415 $282,598 105
31+ Years $228,786 $115,167 $62,625 $302,821 $264,571 14
Industry
Advertising/ Publishing/Media
$475,000 $163,180 $64,714 $568,246 $539,714 7
Aerospace/Defense $223,038 $79,053 $62,667 $279,505 $273,769 21
Automotive $185,929 $51,205 $58,390 $230,307 $232,641 15
Banking $193,231 $90,199 $58,675 $268,397 $240,730 42
Bio-Technology $242,821 $104,099 $57,597 $291,809 $297,031 17
Consumer Products $188,343 $77,892 $61,009 $257,580 $247,092 27
Education $187,544 $122,700 $24,625 $223,633 $193,339 17
Energy/Public Utility $253,035 $69,002 $58,286 $314,578 $309,746 37
Entertainment $233,000 $79,525 $74,125 $289,804 $285,946 14

2 0 2 0 I N - H O U S E CO U N S E L CO M P E N SAT I O N S U RV E Y | 4 1 ©2020 Major, Lindsey & Africa LLC. All rights reserved. An Allegis Group Company.
Industry, continued...
Financial/Professional Services
$233,483 $90,547 $64,295 $298,375 $288,135 60
Food/Beverage $207,405 $86,505 $71,548 $260,639 $262,442 13
Government $170,214 $4,000 $12,133 $171,929 $175,414 7
Healthcare/Hospital $199,777 $78,925 $81,079 $255,163 $260,941 57
Insurance $183,204 $66,917 $43,039 $233,392 $220,863 24
Medical Devices/ Pharmaceuticals
$219,011 $69,308 $53,506 $269,617 $267,422 63
Real Estate $204,327 $83,227 $59,706 $274,750 $259,440 13
Restaurant/ Food Service
$172,109 $27,850 $30,175 $189,515 $202,284 8
Retail Sales Operations $189,848 $50,902 $46,585 $219,790 $228,212 17
Technology $199,124 $75,985 $47,667 $250,627 $237,141 154
Telecommunications $196,012 $81,465 $54,650 $259,374 $244,589 18
Travel/Leisure/ Hospitality
$177,324 $59,131 $45,036 $211,818 $211,102 12
Area of Practice
Commercial $201,825 $63,350 $50,429 $247,496 $245,218 129
Contracts $186,361 $68,519 $47,707 $233,882 $227,912 124
Corporate, Securities & Governance
$209,896 $79,326 $70,857 $271,594 $265,007 72
Employment & Labor $203,018 $47,828 $50,258 $235,194 $245,052 55
Finance $202,692 $77,100 $67,609 $259,035 $262,500 26
Generalist $229,873 $86,068 $55,387 $284,162 $272,478 65
Government/ Regulatory
$199,764 $100,964 $49,771 $272,251 $246,983 39
Insurance $174,479 $32,631 $40,648 $201,176 $207,736 11
Intellectual Property $214,920 $87,299 $46,525 $281,978 $251,209 71
Litigation $243,742 $116,420 $65,447 $323,781 $290,783 32
Real Estate $199,733 $77,313 $80,818 $240,967 $253,612 15
Technology $271,617 $70,458 $31,882 $306,846 $295,528 24
Number of Employees Supervised
Less than 5 Employees $207,306 $84,628 $65,191 $274,592 $266,085 122
5 to 10 Employees $193,750 $115,485 $69,532 $280,364 $257,488 12
Company Headcount
Less than 50 Employees $199,000 $14,500 $55,000 $204,800 $232,000 5
50 to 249 Employees $259,768 $95,251 $58,407 $304,748 $303,574 36
250 to 999 Employees $198,640 $66,525 $39,978 $242,990 $230,903 57
1,000 to 4,999 Employees
$207,750 $65,275 $53,506 $253,534 $250,110 144
5,000 to 14,999 Employees
$198,151 $69,563 $52,551 $243,999 $242,341 132
15,000 to 49,999 Employees
$201,850 $78,317 $60,357 $262,692 $252,231 121
US SC/ASTGC,continued...
Average Annual Base Pay as of
9/1/2019(i.e., salary)
Annual Variable Pay, Actual Paid
for Fiscal Year 2018 (i.e., bonus/commission, etc.)
Annual Variable Pay, Current
Year Target 2019 (i.e., bonus/
commission, etc.)
Total Annual Actual Cash
(Base + Annual Variable Pay for
Fiscal Year 2018)
Total Target Cash (Base + Annual
Variable Pay Target 2019)
N

2 0 2 0 I N - H O U S E CO U N S E L CO M P E N SAT I O N S U RV E Y | 4 2 ©2020 Major, Lindsey & Africa LLC. All rights reserved. An Allegis Group Company.
Company Headcount, continued...
50,000 to 99,999 Employees
$217,247 $79,646 $52,120 $285,515 $265,112 98
100,000 or more Employees
$206,593 $87,747 $65,068 $270,976 $259,004 114
Company Revenue
Less than $1 Million USD
$222,429 $74,667 $49,200 $254,429 $257,571 7
$1 Million to $9.9 Million USD
$195,392 $70,105 $59,513 $242,129 $244,987 24
$10 Million to $99.9 Million USD
$183,171 $59,256 $34,254 $208,566 $206,007 42
$100 Million to $999.9 Million USD
$210,180 $72,332 $51,483 $262,518 $251,199 123
$1 Billion to $9.9 Billion USD
$206,173 $66,561 $48,013 $251,042 $246,041 224
$10 Billion USD and above
$212,496 $83,926 $64,755 $281,001 $268,944 275
Country
United States $208,832 $75,738 $55,538 $261,296 $253,174 717
Region
MA - Mid-Atlantic: DC, DE, MD, NC, SC, VA, WV
$191,027 $66,247 $53,310 $233,937 $230,404 88
MT - Mountain: CO, MT, UT, WY
$180,444 $68,375 $39,500 $241,222 $215,556 9
MW - Midwest: IA, IL, IN, KS, KY, MI, MN, MO, ND, NE, OH, SD, WI
$185,898 $61,810 $46,234 $232,947 $225,576 134
NE - Northeast: CT, MA, ME, NH, NJ, NY, PA, RI, VT
$232,300 $80,116 $61,574 $291,084 $284,037 169
NW - Northwest: ID, OR, WA
$181,954 $114,289 $64,290 $263,589 $230,937 21
PA - California/Nevada: CA, NV
$233,678 $80,526 $57,630 $284,922 $280,024 143
SE - Southeast: AL, AR, FL, GA, LA, MS, TN
$175,613 $61,413 $57,066 $221,428 $225,433 63
SW - Southwest: AZ, NM, OK, TX
$193,235 $63,899 $45,856 $240,521 $230,837 50
State
CA - California $234,842 $81,067 $58,314 $285,582 $281,410 139
CO - Colorado $184,143 $81,000 $43,500 $253,571 $221,429 7
CT - Connecticut $237,000 $73,200 $55,572 $303,545 $292,572 11
DC - District Of Columbia
$205,358 $78,328 $56,033 $258,144 $249,210 46
DE - Delaware $207,600 $62,500 $60,250 $232,600 $231,700 5
FL - Florida $160,947 $83,912 $109,491 $213,392 $243,066 16
US SC/ASTGC,continued...
Average Annual Base Pay as of
9/1/2019(i.e., salary)
Annual Variable Pay, Actual Paid
for Fiscal Year 2018 (i.e., bonus/commission, etc.)
Annual Variable Pay, Current
Year Target 2019 (i.e., bonus/
commission, etc.)
Total Annual Actual Cash
(Base + Annual Variable Pay for
Fiscal Year 2018)
Total Target Cash (Base + Annual
Variable Pay Target 2019)
N

2 0 2 0 I N - H O U S E CO U N S E L CO M P E N SAT I O N S U RV E Y | 4 3 ©2020 Major, Lindsey & Africa LLC. All rights reserved. An Allegis Group Company.
State, continued...
GA - Georgia $184,498 $55,299 $40,139 $228,454 $222,579 39
IL - Illinois $187,776 $60,989 $44,473 $230,548 $226,473 77
MA - Massachusetts $203,338 $66,292 $51,613 $249,884 $249,460 47
MD - Maryland $169,400 $64,271 $43,000 $207,963 $199,500 10
MI - Michigan $194,492 $45,656 $54,944 $236,343 $244,857 12
MN - Minnesota $189,750 $64,583 $47,200 $254,333 $229,083 6
MO - Missouri $182,550 $85,456 $56,919 $233,824 $228,085 10
NC - North Carolina $173,200 $45,102 $50,383 $203,952 $212,133 22
NJ - New Jersey $212,812 $88,741 $57,667 $276,199 $260,181 28
NY - New York $280,916 $104,034 $80,105 $357,084 $343,856 56
OH - Ohio $179,994 $91,267 $44,908 $271,261 $224,901 9
PA - Pennsylvania $195,701 $47,813 $50,136 $228,301 $234,442 22
TN - Tennessee $172,700 $57,500 $59,156 $218,700 $220,025 5
TX - Texas $193,948 $59,917 $45,769 $239,931 $232,266 43
WA - Washington $178,579 $119,065 $69,867 $260,045 $230,060 19
WI - Wisconsin $181,644 $75,560 $55,333 $240,413 $218,533 9
Metro
CA East Bay Metro $217,697 $49,545 $49,605 $256,626 $263,759 14
CA Los Angeles Metro $273,303 $96,835 $67,355 $331,404 $323,338 35
CA Orange County $215,069 $64,429 $44,511 $271,444 $254,016 8
CA San Diego Metro $187,300 $36,600 $35,313 $207,633 $218,689 9
CA San Francisco Metro $223,919 $71,173 $62,937 $258,081 $271,751 25
CA Silicon Valley $231,214 $96,375 $55,701 $291,122 $276,377 37
CO Denver/Boulder $184,143 $81,000 $43,500 $253,571 $221,429 7
CT Stamford Metro $254,000 $97,667 $70,375 $351,667 $324,375 6
DC Washington DC Metro
$205,358 $78,328 $56,033 $258,144 $249,210 46
DE Wilmington Metro $207,600 $62,500 $60,250 $232,600 $231,700 5
FL Miami/Ft.Lauderdale
$154,940 $111,000 $58,600 $243,740 $190,100 5
FL Orlando/Central $160,046 $65,853 $126,455 $199,557 $273,855 10
GA Atlanta Metro $184,748 $55,809 $40,038 $228,808 $222,680 38
IL Chicago Metro $188,010 $61,933 $44,237 $231,200 $226,427 76
MA Boston Metro $206,603 $82,593 $48,066 $258,224 $250,664 24
MA Route 128/495 $199,931 $52,709 $55,514 $241,181 $248,204 23
MD Baltimore $169,400 $64,271 $43,000 $207,963 $199,500 10
MI Detroit Metro $201,490 $49,691 $59,320 $246,212 $254,878 10
MN Minneapolis/St. Paul
$189,750 $64,583 $47,200 $254,333 $229,083 6
MO St. Louis Metro $189,389 $85,456 $56,919 $246,360 $239,983 9
NC North Carolina-Other
$162,029 $49,504 $59,702 $193,853 $204,673 14
NC Raleigh/Durham/RTP
$192,750 $38,500 $37,071 $221,625 $225,188 8
NJ Northern New Jersey $213,221 $88,741 $57,667 $281,483 $264,233 26
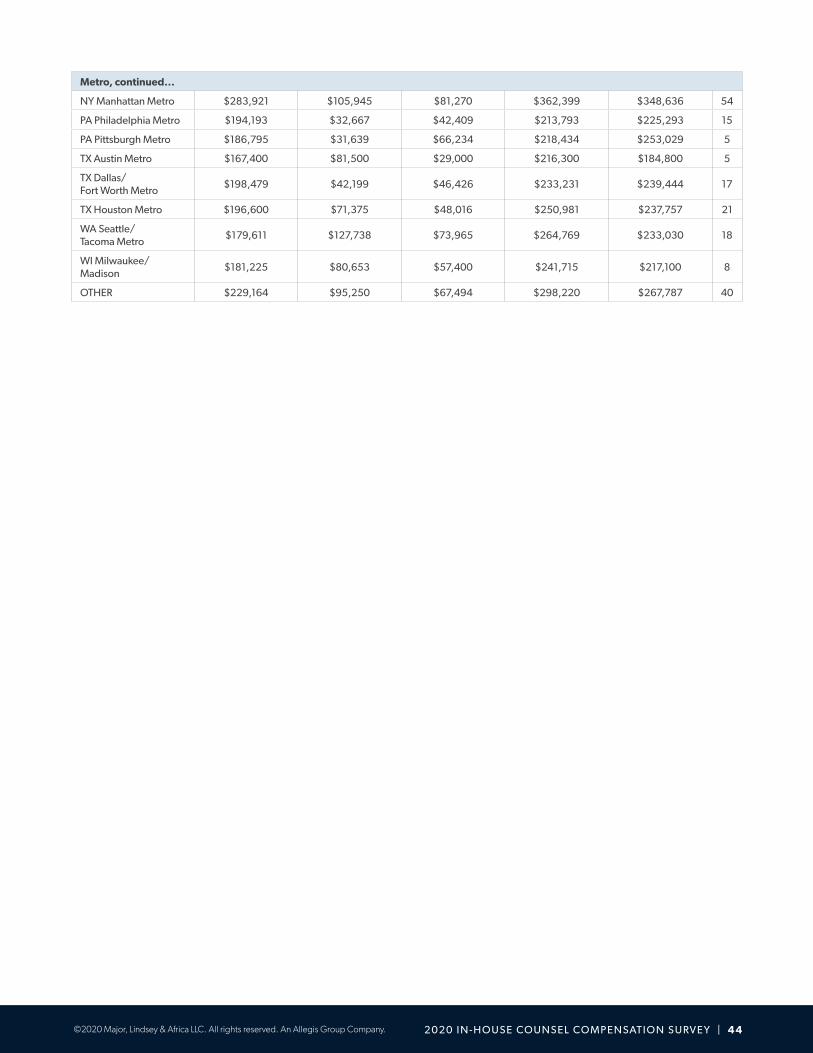
2 0 2 0 I N - H O U S E CO U N S E L CO M P E N SAT I O N S U RV E Y | 4 4 ©2020 Major, Lindsey & Africa LLC. All rights reserved. An Allegis Group Company.
Metro, continued...
NY Manhattan Metro $283,921 $105,945 $81,270 $362,399 $348,636 54
PA Philadelphia Metro $194,193 $32,667 $42,409 $213,793 $225,293 15
PA Pittsburgh Metro $186,795 $31,639 $66,234 $218,434 $253,029 5
TX Austin Metro $167,400 $81,500 $29,000 $216,300 $184,800 5
TX Dallas/Fort Worth Metro
$198,479 $42,199 $46,426 $233,231 $239,444 17
TX Houston Metro $196,600 $71,375 $48,016 $250,981 $237,757 21
WA Seattle/Tacoma Metro
$179,611 $127,738 $73,965 $264,769 $233,030 18
WI Milwaukee/Madison
$181,225 $80,653 $57,400 $241,715 $217,100 8
OTHER $229,164 $95,250 $67,494 $298,220 $267,787 40

2 0 2 0 I N - H O U S E CO U N S E L CO M P E N SAT I O N S U RV E Y | 4 5 ©2020 Major, Lindsey & Africa LLC. All rights reserved. An Allegis Group Company.
CO U N S E L
US Counsel
Average Annual Base Pay as of
9/1/2019(i.e., salary)
Annual Variable Pay, Actual Paid
for Fiscal Year 2018 (i.e., bonus/commission, etc.)
Annual Variable Pay, Current
Year Target 2019 (i.e., bonus/
commission, etc.)
Total Annual Actual Cash
(Base + Annual Variable Pay for
Fiscal Year 2018)
Total Target Cash (Base + Annual
Variable Pay Target 2019)
N
Gender
Female $150,640 $72,152 $35,315 $192,328 $175,753 45
Male $162,445 $71,662 $33,932 $211,679 $189,037 36
Ethnicity
Asian $166,290 $49,859 $33,795 $197,780 $189,413 19
Black or African American
$145,747 $64,956 $29,172 $191,216 $169,084 10
Hispanic or Latino $132,800 $97,435 $52,967 $191,261 $164,580 5
White $158,103 $77,304 $34,763 $203,703 $183,742 44
Years in Current Position
5 Years or Less $158,742 $72,067 $35,427 $205,716 $186,086 81
Years with Current Company
5 Years or Less $157,840 $72,290 $35,194 $204,662 $184,462 80
Years of Relevant Legal Work Experience
5 Years or Less $127,878 $25,519 $24,205 $142,301 $148,926 23
6 to 10 Years $171,004 $83,318 $39,739 $236,307 $207,521 37
11 to 15 Years $170,605 $83,351 $41,068 $202,802 $188,505 18
Industry
Advertising/ Publishing/Media
$192,185 $166,850 $43,521 $325,665 $235,706 5
Banking $148,389 $57,351 $31,722 $199,367 $180,111 9
Consumer Products $157,100 $171,000 $119,375 $191,300 $204,850 5
Energy/Public Utility $174,500 $30,125 $30,800 $198,600 $205,300 5
Financial/Professional Services
$145,500 $34,333 $55,167 $154,143 $172,000 7
Healthcare/Hospital $143,080 $12,968 $9,417 $149,564 $147,789 8
Medical Devices/ Pharmaceuticals
$164,920 $113,678 $36,294 $255,862 $201,214 5
Technology $153,962 $54,700 $26,814 $186,138 $176,044 17
Area of Practice
Commercial $156,412 $64,070 $30,875 $202,177 $178,466 7
Contracts $155,535 $83,969 $32,928 $201,862 $177,108 29
Corporate, Securities & Governance
$155,417 $63,278 $30,021 $218,695 $185,438 12
Generalist $170,265 $85,812 $48,067 $213,171 $208,719 10
Intellectual Property $171,263 $89,267 $35,257 $185,054 $182,054 7
Technology $150,333 $93,500 $20,950 $228,250 $167,792 6
Number of Employees Supervised
Less than 5 Employees $165,786 $99,953 $28,580 $249,080 $189,602 12

2 0 2 0 I N - H O U S E CO U N S E L CO M P E N SAT I O N S U RV E Y | 4 6 ©2020 Major, Lindsey & Africa LLC. All rights reserved. An Allegis Group Company.
Company Headcount
50 to 249 Employees $152,000 $25,333 $24,700 $164,667 $172,583 6
250 to 999 Employees $153,030 $16,167 $20,566 $157,880 $167,426 10
1,000 to 4,999 Employees
$151,932 $37,816 $22,625 $169,940 $167,016 21
5,000 to 14,999 Employees
$162,216 $107,649 $22,061 $240,506 $178,261 11
15,000 to 49,999 Employees
$163,577 $91,635 $50,697 $229,030 $203,410 14
50,000 to 99,999 Employees
$174,549 $64,802 $28,293 $224,950 $202,842 9
100,000 or more Employees
$159,673 $77,701 $48,299 $224,424 $202,605 18
Company Revenue
$1 Million to $9.9 Million USD
$140,696 $48,500 $39,667 $133,413 $137,080 6
$10 Million to $99.9 Million USD
$154,438 $76,333 $23,000 $183,063 $171,688 8
$100 Million to $999.9 Million USD
$148,877 $34,173 $22,635 $172,535 $168,030 13
$1 Billion to $9.9 Billion USD
$163,858 $105,387 $39,830 $222,002 $191,326 29
$10 Billion USD and above
$162,472 $63,783 $37,507 $213,910 $196,350 31
Country
United States $158,943 $69,161 $34,219 $201,277 $184,271 91
Region
MA - Mid-Atlantic: DC, DE, MD, NC, SC, VA, WV
$168,008 $53,882 $34,688 $217,400 $196,914 12
MW - Midwest: IA, IL, IN, KS, KY, MI, MN, MO, ND, NE, OH, SD, WI
$144,003 $34,888 $48,978 $169,588 $179,920 15
NE - Northeast: CT, MA, ME, NH, NJ, NY, PA, RI, VT
$170,447 $114,050 $33,332 $246,480 $198,224 24
PA - California/Nevada: CA, NV
$175,217 $53,506 $29,342 $197,249 $194,203 17
SE - Southeast: AL, AR, FL, GA, LA, MS, TN
$127,011 $8,750 $17,750 $129,511 $137,154 7
SW - Southwest: AZ, NM, OK, TX
$151,875 $74,625 $39,464 $172,821 $169,643 7
State
CA - California $173,356 $53,506 $29,342 $196,765 $193,528 16
DC - District Of Columbia
$176,177 $54,967 $30,625 $231,144 $199,996 9
IL - Illinois $158,375 $57,390 $73,933 $194,244 $213,824 8
MA - Massachusetts $156,148 $133,076 $20,005 $204,539 $170,697 11
US Counsel,continued...
Average Annual Base Pay as of
9/1/2019(i.e., salary)
Annual Variable Pay, Actual Paid
for Fiscal Year 2018 (i.e., bonus/commission, etc.)
Annual Variable Pay, Current
Year Target 2019 (i.e., bonus/
commission, etc.)
Total Annual Actual Cash
(Base + Annual Variable Pay for
Fiscal Year 2018)
Total Target Cash (Base + Annual
Variable Pay Target 2019)
N
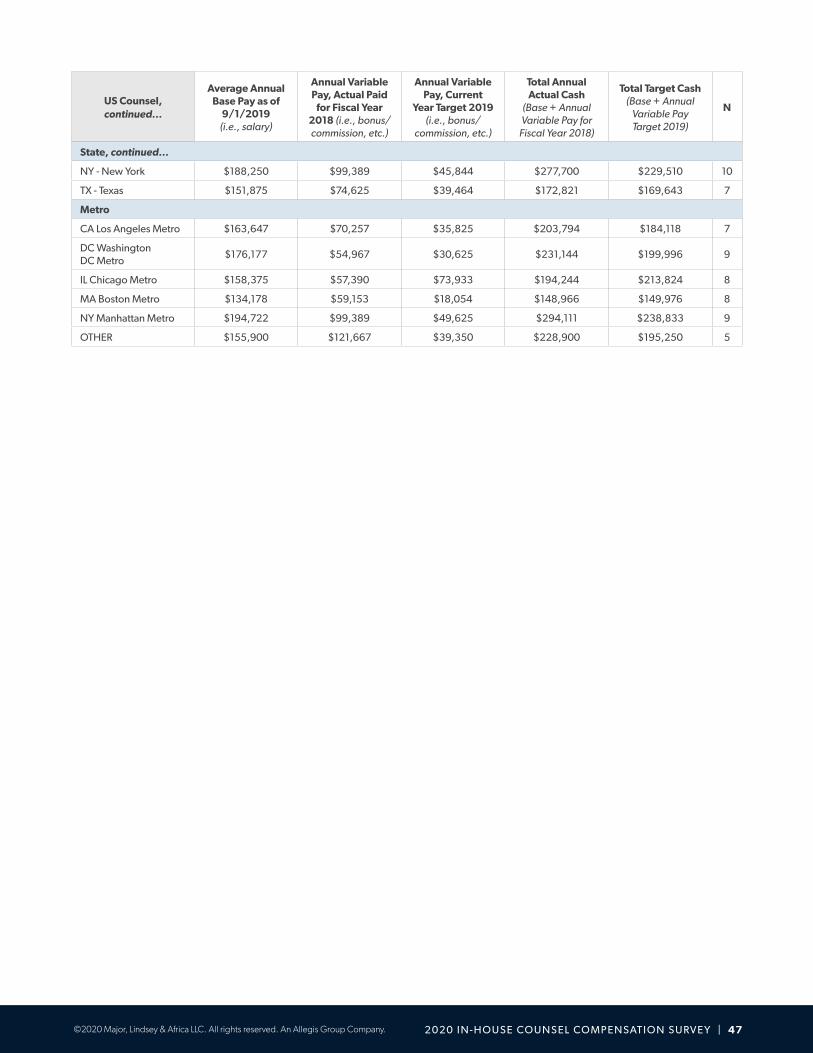
2 0 2 0 I N - H O U S E CO U N S E L CO M P E N SAT I O N S U RV E Y | 47 ©2020 Major, Lindsey & Africa LLC. All rights reserved. An Allegis Group Company.
US Counsel,continued...
Average Annual Base Pay as of
9/1/2019(i.e., salary)
Annual Variable Pay, Actual Paid
for Fiscal Year 2018 (i.e., bonus/commission, etc.)
Annual Variable Pay, Current
Year Target 2019 (i.e., bonus/
commission, etc.)
Total Annual Actual Cash
(Base + Annual Variable Pay for
Fiscal Year 2018)
Total Target Cash (Base + Annual
Variable Pay Target 2019)
N
State, continued...
NY - New York $188,250 $99,389 $45,844 $277,700 $229,510 10
TX - Texas $151,875 $74,625 $39,464 $172,821 $169,643 7
Metro
CA Los Angeles Metro $163,647 $70,257 $35,825 $203,794 $184,118 7
DC Washington DC Metro
$176,177 $54,967 $30,625 $231,144 $199,996 9
IL Chicago Metro $158,375 $57,390 $73,933 $194,244 $213,824 8
MA Boston Metro $134,178 $59,153 $18,054 $148,966 $149,976 8
NY Manhattan Metro $194,722 $99,389 $49,625 $294,111 $238,833 9
OTHER $155,900 $121,667 $39,350 $228,900 $195,250 5

2 0 2 0 I N - H O U S E CO U N S E L CO M P E N SAT I O N S U RV E Y | 4 8 ©2020 Major, Lindsey & Africa LLC. All rights reserved. An Allegis Group Company.
C H I E F CO M P L I A N C E O F F I C E R
US CCO
Average Annual Base Pay as of
9/1/2019(i.e., salary)
Annual Variable Pay, Actual Paid
for Fiscal Year 2018 (i.e., bonus/commission, etc.)
Annual Variable Pay, Current
Year Target 2019 (i.e., bonus/
commission, etc.)
Total Annual Actual Cash
(Base + Annual Variable Pay for
Fiscal Year 2018)
Total Target Cash (Base + Annual
Variable Pay Target 2019)
N
Gender
Female $261,210 $233,250 $162,820 $389,121 $382,011 31
Male $271,506 $151,070 $152,627 $401,426 $414,976 50
Ethnicity
Asian $270,000 $94,200 $119,500 $337,286 $372,429 7
Black orAfrican American
$310,833 $552,800 $465,625 $771,500 $621,250 6
White $271,763 $139,933 $138,697 $373,327 $399,275 62
Years in Current Position
5 Years or Less $264,877 $133,165 $121,646 $358,656 $374,530 71
6 to 10 Years $297,567 $336,286 $318,846 $611,433 $573,900 15
Years with Current Company
5 Years or Less $268,164 $129,201 $125,521 $359,496 $382,864 58
6 to 10 Years $246,192 $230,545 $221,518 $441,269 $433,631 13
11 to 15 Years $312,057 $291,636 $246,682 $541,200 $505,879 14
Years of Relevant Legal Work Experience
6 to 10 Years $243,400 $60,500 $61,250 $291,800 $304,650 5
11 to 15 Years $253,719 $133,646 $111,273 $353,953 $358,038 16
16 to 20 Years $260,339 $153,786 $142,475 $364,516 $384,430 31
21 to 30 Years $267,741 $168,947 $148,615 $386,630 $394,339 27
31+ Years $383,143 $450,200 $405,600 $704,714 $672,857 7
Industry
Education $247,500 $38,000 $45,000 $253,833 $255,000 6
Energy/Public Utility $314,667 $142,417 $151,500 $457,083 $466,167 6
Financial/Professional Services
$271,643 $231,063 $212,335 $432,383 $474,747 23
Medical Devices/ Pharmaceuticals
$311,688 $254,950 $173,606 $471,031 $485,294 16
Technology $244,417 $111,600 $74,500 $337,417 $318,917 6
Area of Practice
Corporate, Securities & Governance
$303,667 $177,033 $184,806 $451,194 $488,472 18
Generalist $272,444 $71,875 $90,594 $304,389 $352,972 9
Government/Regulatory
$253,095 $145,173 $118,923 $352,424 $346,982 19
Number of Employees Supervised
Less than 5 Employees $264,929 $144,100 $124,301 $347,271 $371,472 35
5 to 10 Employees $275,723 $226,825 $178,207 $450,204 $433,367 26
11 to 20 Employees $272,500 $150,778 $153,689 $408,200 $410,820 10
Over 20 Employees $346,400 $185,200 $175,200 $531,600 $521,600 5
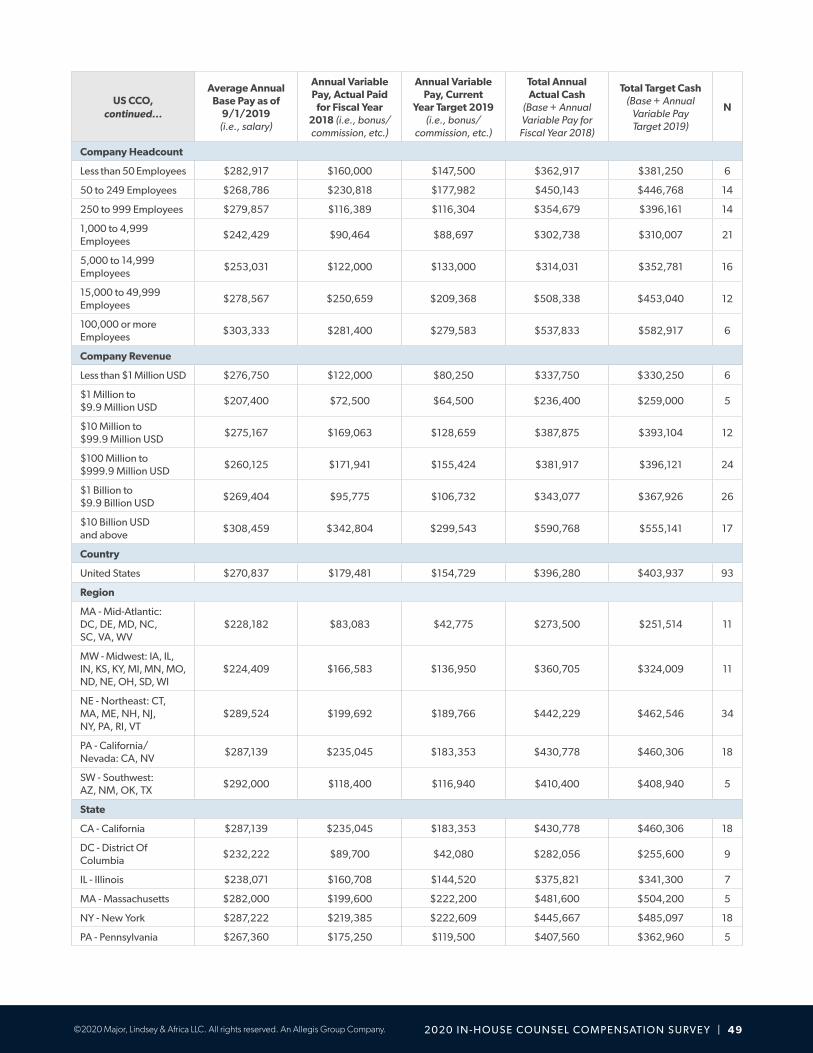
2 0 2 0 I N - H O U S E CO U N S E L CO M P E N SAT I O N S U RV E Y | 4 9 ©2020 Major, Lindsey & Africa LLC. All rights reserved. An Allegis Group Company.
Company Headcount
Less than 50 Employees $282,917 $160,000 $147,500 $362,917 $381,250 6
50 to 249 Employees $268,786 $230,818 $177,982 $450,143 $446,768 14
250 to 999 Employees $279,857 $116,389 $116,304 $354,679 $396,161 14
1,000 to 4,999 Employees
$242,429 $90,464 $88,697 $302,738 $310,007 21
5,000 to 14,999 Employees
$253,031 $122,000 $133,000 $314,031 $352,781 16
15,000 to 49,999 Employees
$278,567 $250,659 $209,368 $508,338 $453,040 12
100,000 or more Employees
$303,333 $281,400 $279,583 $537,833 $582,917 6
Company Revenue
Less than $1 Million USD $276,750 $122,000 $80,250 $337,750 $330,250 6
$1 Million to $9.9 Million USD
$207,400 $72,500 $64,500 $236,400 $259,000 5
$10 Million to $99.9 Million USD
$275,167 $169,063 $128,659 $387,875 $393,104 12
$100 Million to $999.9 Million USD
$260,125 $171,941 $155,424 $381,917 $396,121 24
$1 Billion to $9.9 Billion USD
$269,404 $95,775 $106,732 $343,077 $367,926 26
$10 Billion USD and above
$308,459 $342,804 $299,543 $590,768 $555,141 17
Country
United States $270,837 $179,481 $154,729 $396,280 $403,937 93
Region
MA - Mid-Atlantic: DC, DE, MD, NC, SC, VA, WV
$228,182 $83,083 $42,775 $273,500 $251,514 11
MW - Midwest: IA, IL, IN, KS, KY, MI, MN, MO, ND, NE, OH, SD, WI
$224,409 $166,583 $136,950 $360,705 $324,009 11
NE - Northeast: CT, MA, ME, NH, NJ, NY, PA, RI, VT
$289,524 $199,692 $189,766 $442,229 $462,546 34
PA - California/Nevada: CA, NV
$287,139 $235,045 $183,353 $430,778 $460,306 18
SW - Southwest: AZ, NM, OK, TX
$292,000 $118,400 $116,940 $410,400 $408,940 5
State
CA - California $287,139 $235,045 $183,353 $430,778 $460,306 18
DC - District Of Columbia
$232,222 $89,700 $42,080 $282,056 $255,600 9
IL - Illinois $238,071 $160,708 $144,520 $375,821 $341,300 7
MA - Massachusetts $282,000 $199,600 $222,200 $481,600 $504,200 5
NY - New York $287,222 $219,385 $222,609 $445,667 $485,097 18
PA - Pennsylvania $267,360 $175,250 $119,500 $407,560 $362,960 5
US CCO,continued...
Average Annual Base Pay as of
9/1/2019(i.e., salary)
Annual Variable Pay, Actual Paid
for Fiscal Year 2018 (i.e., bonus/commission, etc.)
Annual Variable Pay, Current
Year Target 2019 (i.e., bonus/
commission, etc.)
Total Annual Actual Cash
(Base + Annual Variable Pay for
Fiscal Year 2018)
Total Target Cash (Base + Annual
Variable Pay Target 2019)
N

2 0 2 0 I N - H O U S E CO U N S E L CO M P E N SAT I O N S U RV E Y | 5 0 ©2020 Major, Lindsey & Africa LLC. All rights reserved. An Allegis Group Company.
US CCO,continued...
Average Annual Base Pay as of
9/1/2019(i.e., salary)
Annual Variable Pay, Actual Paid
for Fiscal Year 2018 (i.e., bonus/commission, etc.)
Annual Variable Pay, Current
Year Target 2019 (i.e., bonus/
commission, etc.)
Total Annual Actual Cash
(Base + Annual Variable Pay for
Fiscal Year 2018)
Total Target Cash (Base + Annual
Variable Pay Target 2019)
N
Metro
CA Silicon Valley $257,000 $75,667 $68,250 $302,400 $311,600 5
DC Washington DC Metro
$232,222 $89,700 $42,080 $282,056 $255,600 9
IL Chicago Metro $238,071 $160,708 $144,520 $375,821 $341,300 7
NY Manhattan Metro $292,647 $235,167 $234,200 $458,647 $499,294 17
OTHER $306,667 $291,333 $124,583 $452,333 $431,250 6

2 0 2 0 I N - H O U S E CO U N S E L CO M P E N SAT I O N S U RV E Y | 5 1 ©2020 Major, Lindsey & Africa LLC. All rights reserved. An Allegis Group Company.
APACC H I E F L E G A L O F F I C E R / G E N E R A L CO U N S E L
N=Number of respondents.No data is recorded where less than 5 respondents provided information.
APAC CLO/GC
Average Annual Base Pay as of
9/1/2019(i.e., salary)
Annual Variable Pay, Actual Paid
for Fiscal Year 2018 (i.e., bonus/commission, etc.)
Annual Variable Pay, Current
Year Target 2019 (i.e., bonus/
commission, etc.)
Total Annual Actual Cash
(Base + Annual Variable Pay for
Fiscal Year 2018)
Total Target Cash (Base + Annual
Variable Pay Target 2019)
N
Gender
Female $245,222 $240,258 $171,887 $437,429 $399,920 10
Male $264,154 $128,493 $122,751 $385,884 $386,905 19
Ethnicity
Asian $215,473 $113,712 $94,899 $316,550 $305,100 18
White $326,602 $241,556 $205,997 $546,199 $532,600 11
Years in Current Position
5 Years or Less $247,647 $191,128 $160,065 $410,106 $391,706 20
6 to 10 Years $290,071 $129,262 $121,193 $419,333 $411,264 6
Years with Current Company
5 Years or Less $227,212 $186,374 $150,383 $384,158 $361,765 19
6 to 10 Years $325,358 $109,660 $111,341 $435,018 $436,699 5
Years of Relevant Legal Work Experience
16 to 20 Years $172,834 $93,644 $81,922 $247,749 $246,564 10
21 to 30 Years $296,957 $153,577 $141,314 $450,534 $438,271 14
Area of Practice
Commercial $193,712 $115,903 $79,393 $270,981 $273,105 6
Generalist $311,412 $192,139 $192,165 $482,202 $482,225 9
Law Department Management
$229,605 $228,753 $170,373 $458,358 $399,978 5
Number of Employees Supervised
Less than 5 Employees $186,777 $84,211 $82,798 $260,462 $259,225 8
5 to 10 Employees $276,004 $129,134 $118,918 $392,225 $394,922 10
Company Headcount
50 to 249 Employees $261,756 $133,309 $124,179 $356,976 $350,455 7
1,000 to 4,999 Employees
$179,769 $64,164 $61,695 $243,933 $241,464 9
Company Revenue
$10 Million to $99.9 Million USD
$241,153 $161,160 $140,835 $375,454 $358,516 6
$100 Million to $999.9 Million USD
$258,040 $90,770 $80,099 $330,656 $330,129 10
$1 Billion to $9.9 Billion USD
$289,160 $157,583 $154,414 $446,743 $443,575 8
$10 Billion USD and above
$202,801 $253,528 $160,913 $414,074 $363,714 6

2 0 2 0 I N - H O U S E CO U N S E L CO M P E N SAT I O N S U RV E Y | 5 2 ©2020 Major, Lindsey & Africa LLC. All rights reserved. An Allegis Group Company.
APAC CLO/GC,continued...
Average Annual Base Pay as of
9/1/2019(i.e., salary)
Annual Variable Pay, Actual Paid
for Fiscal Year 2018 (i.e., bonus/commission, etc.)
Annual Variable Pay, Current
Year Target 2019 (i.e., bonus/
commission, etc.)
Total Annual Actual Cash
(Base + Annual Variable Pay for
Fiscal Year 2018)
Total Target Cash (Base + Annual
Variable Pay Target 2019)
N
Country
China $259,984 $114,909 $102,896 $374,894 $362,881 7
Hong Kong $296,890 $183,520 $183,012 $480,411 $479,902 5
India $113,046 $25,646 $19,355 $135,028 $132,401 7
Singapore $301,515 $189,467 $172,531 $439,309 $442,677 11

2 0 2 0 I N - H O U S E CO U N S E L CO M P E N SAT I O N S U RV E Y | 5 3 ©2020 Major, Lindsey & Africa LLC. All rights reserved. An Allegis Group Company.
REGIONAL GENERAL COUNSEL/COUNTRY GENERAL COUNSEL
APAC RGC/CGC
Average Annual Base Pay as of
9/1/2019(i.e., salary)
Annual Variable Pay, Actual Paid
for Fiscal Year 2018 (i.e., bonus/commission, etc.)
Annual Variable Pay, Current
Year Target 2019 (i.e., bonus/
commission, etc.)
Total Annual Actual Cash
(Base + Annual Variable Pay for
Fiscal Year 2018)
Total Target Cash (Base + Annual
Variable Pay Target 2019)
N
Gender
Female $212,663 $140,364 $62,999 $326,709 $275,662 16
Male $250,152 $96,001 $82,448 $326,954 $323,440 45
Ethnicity
Asian $220,465 $96,970 $67,065 $296,655 $282,740 42
White $293,390 $138,658 $110,337 $413,560 $389,015 15
Prefer not to say $195,144 $81,579 $56,536 $249,530 $242,257 6
Years in Current Position
5 Years or Less $223,039 $103,086 $63,735 $306,385 $282,705 47
6 to 10 Years $307,003 $109,109 $126,417 $416,112 $433,420 13
Years with Current Company
5 Years or Less $219,729 $86,297 $58,545 $280,456 $271,769 27
6 to 10 Years $258,888 $122,965 $90,943 $376,730 $349,831 24
11 to 15 Years $249,755 $118,960 $83,265 $368,714 $333,020 10
Years of Relevant Legal Work Experience
6 to 10 Years $195,676 $92,943 $47,825 $270,030 $243,501 5
11 to 15 Years $194,000 $90,126 $47,616 $266,101 $238,442 15
16 to 20 Years $233,170 $120,155 $74,018 $333,299 $304,103 24
21 to 30 Years $313,934 $93,309 $115,857 $401,754 $422,976 17
Industry
Consumer Products $247,479 $97,485 $95,047 $344,964 $342,527 7
Energy/Public Utility $298,607 $194,691 $79,157 $493,298 $377,764 5
Medical Devices/ Pharmaceuticals
$223,312 $56,533 $59,225 $261,001 $282,538 6
Technology $202,654 $80,726 $48,102 $254,549 $243,884 14
Area of Practice
Commercial $222,694 $128,678 $60,476 $322,127 $277,672 22
Generalist $231,215 $97,892 $78,486 $317,360 $303,421 25
Law Department Management
$243,110 $90,760 $92,210 $323,786 $325,074 9
Number of Employees Supervised
Less than 5 Employees $229,862 $95,182 $64,160 $310,401 $291,555 26
5 to 10 Employees $281,186 $142,568 $107,274 $404,745 $381,309 15
11 to 20 Employees $270,144 $128,359 $88,620 $377,109 $343,994 6
Over 20 Employees $333,986 $129,111 $125,022 $463,098 $459,009 6
Company Headcount
1,000 to 4,999 Employees
$241,795 $119,569 $85,673 $342,969 $320,877 13
5,000 to 14,999 Employees
$187,022 $63,903 $45,637 $233,497 $228,510 11

2 0 2 0 I N - H O U S E CO U N S E L CO M P E N SAT I O N S U RV E Y | 5 4 ©2020 Major, Lindsey & Africa LLC. All rights reserved. An Allegis Group Company.
Company Headcount, continued...
15,000 to 49,999 Employees
$235,027 $89,632 $72,246 $286,246 $291,792 14
50,000 to 99,999 Employees
$266,764 $108,052 $90,741 $367,613 $351,456 15
100,000 or more Employees
$264,029 $162,342 $86,742 $411,612 $350,770 11
Company Revenue
$100 Million to $999.9 Million USD
$229,498 $132,738 $39,995 $309,141 $261,494 5
$1 Billion to $9.9 Billion USD
$243,543 $101,885 $78,937 $324,348 $314,314 29
$10 Billion USD and above
$244,749 $120,812 $82,570 $345,425 $321,814 30
Country
China $261,537 $121,894 $80,520 $350,926 $336,689 15
Hong Kong $308,064 $218,703 $135,311 $490,317 $420,824 6
India $139,111 $88,675 $39,107 $210,051 $178,218 10
Singapore $244,973 $84,417 $75,765 $319,742 $314,244 35
APAC RGC/CGC,continued...
Average Annual Base Pay as of
9/1/2019(i.e., salary)
Annual Variable Pay, Actual Paid
for Fiscal Year 2018 (i.e., bonus/commission, etc.)
Annual Variable Pay, Current
Year Target 2019 (i.e., bonus/
commission, etc.)
Total Annual Actual Cash
(Base + Annual Variable Pay for
Fiscal Year 2018)
Total Target Cash (Base + Annual
Variable Pay Target 2019)
N

2 0 2 0 I N - H O U S E CO U N S E L CO M P E N SAT I O N S U RV E Y | 5 5 ©2020 Major, Lindsey & Africa LLC. All rights reserved. An Allegis Group Company.
D E P U T Y/ ASS I STA N T G E N E R A L CO U N S E L
APAC DGC/AGC
Average Annual Base Pay as of
9/1/2019(i.e., salary)
Annual Variable Pay, Actual Paid
for Fiscal Year 2018 (i.e., bonus/commission, etc.)
Annual Variable Pay, Current
Year Target 2019 (i.e., bonus/
commission, etc.)
Total Annual Actual Cash
(Base + Annual Variable Pay for
Fiscal Year 2018)
Total Target Cash (Base + Annual
Variable Pay Target 2019)
N
Gender
Female $163,028 $60,968 $58,877 $223,996 $212,092 6
Male $198,963 $83,186 $73,785 $265,511 $257,991 15
Ethnicity
Asian $172,228 $67,268 $61,683 $235,758 $223,630 18
Years in Current Position
5 Years or Less $213,045 $60,045 $72,280 $265,084 $275,688 15
Years with Current Company
5 Years or Less $210,856 $62,494 $75,085 $262,934 $273,426 12
6 to 10 Years $192,820 $90,086 $60,485 $282,907 $253,306 6
Years of Relevant Legal Work Experience
11 to 15 Years $176,810 $31,874 $51,989 $199,122 $213,203 10
21 to 30 Years $273,974 $141,040 $107,580 $415,014 $381,554 6
Area of Practice
Commercial $206,955 $106,959 $75,998 $292,522 $275,353 10
Generalist $149,164 $38,188 $51,822 $187,352 $190,622 5
Number of Employees Supervised
Less than 5 Employees $164,409 $36,271 $48,263 $194,635 $196,585 12
5 to 10 Employees $171,713 $91,565 $57,934 $248,017 $229,647 6
Company Headcount
5,000 to 14,999 Employees
$125,006 $111,285 $47,626 $191,778 $153,582 5
100,000 or more Employees
$259,116 $70,207 $82,351 $315,282 $341,467 5
Company Revenue
$1 Billion to $9.9 Billion USD
$151,640 $89,689 $54,964 $211,433 $188,282 6
$10 Billion USD and above
$209,025 $66,017 $70,171 $269,964 $273,798 13
Country
China $175,839 $66,841 $68,409 $242,680 $230,566 5
Hong Kong $272,629 $75,428 $89,548 $335,486 $362,177 6
India $97,893 $82,332 $41,308 $180,225 $139,201 5
Singapore $224,145 $94,318 $93,583 $280,736 $280,295 5

2 0 2 0 I N - H O U S E CO U N S E L CO M P E N SAT I O N S U RV E Y | 5 6 ©2020 Major, Lindsey & Africa LLC. All rights reserved. An Allegis Group Company.
S E N I O R CO U N S E L / ASS O C I AT E G E N E R A L CO U N S E L
APAC SC/ASTGC
Average Annual Base Pay as of
9/1/2019(i.e., salary)
Annual Variable Pay, Actual Paid
for Fiscal Year 2018 (i.e., bonus/commission, etc.)
Annual Variable Pay, Current
Year Target 2019 (i.e., bonus/
commission, etc.)
Total Annual Actual Cash
(Base + Annual Variable Pay for
Fiscal Year 2018)
Total Target Cash (Base + Annual
Variable Pay Target 2019)
N
Gender
Male $188,272 $60,269 $73,911 $236,488 $247,401 5
Ethnicity
Asian $192,265 $61,010 $78,015 $241,072 $239,074 5
Years in Current Position
5 Years or Less $227,421 $57,134 $60,951 $274,168 $271,750 11
Years with Current Company
5 Years or Less $195,449 $72,143 $67,054 $249,556 $245,739 8
Years of Relevant Legal Work Experience
11 to 15 Years $259,299 $33,294 $36,250 $292,593 $288,299 5
Industry
Technology $272,713 $74,478 $46,872 $347,191 $310,211 5
Area of Practice
Generalist $205,456 $83,769 $59,143 $261,302 $254,742 6
Company Headcount
15,000 to 49,999 Employees
$155,227 $48,927 $37,849 $187,845 $180,460 6
Company Revenue
$10 Billion USD and above
$175,172 $55,141 $43,418 $230,313 $212,388 7
Country
Singapore $191,777 $55,480 $56,355 $236,161 $236,861 5

2 0 2 0 I N - H O U S E CO U N S E L CO M P E N SAT I O N S U RV E Y | 57 ©2020 Major, Lindsey & Africa LLC. All rights reserved. An Allegis Group Company.
EMEAC H I E F L E G A L O F F I C E R / G E N E R A L CO U N S E L
N=Number of respondents.No data is recorded where less than 5 respondents provided information.
EMEA CLO/GC
Average Annual Base Pay as of
9/1/2019(i.e., salary)
Annual Variable Pay, Actual Paid
for Fiscal Year 2018 (i.e., bonus/commission, etc.)
Annual Variable Pay, Current
Year Target 2019 (i.e., bonus/
commission, etc.)
Total Annual Actual Cash
(Base + Annual Variable Pay for
Fiscal Year 2018)
Total Target Cash (Base + Annual
Variable Pay Target 2019)
N
Gender
Female $217,022 $97,661 $96,706 $289,481 $295,011 31
Male $259,987 $139,665 $107,131 $356,422 $351,813 84
Ethnicity
Asian $269,120 $316,252 $172,987 $427,246 $413,275 6
White $238,201 $115,589 $96,132 $323,998 $321,449 97
Prefer not to say $339,797 $116,929 $108,090 $414,206 $428,235 11
Years in Current Position
5 Years or Less $229,262 $123,414 $100,956 $307,372 $313,605 79
6 to 10 Years $247,362 $145,358 $105,157 $364,766 $340,385 26
11 to 15 Years $477,007 $202,109 $252,280 $645,431 $729,287 6
Years with Current Company
5 Years or Less $232,676 $122,798 $95,851 $307,046 $312,326 71
6 to 10 Years $222,741 $152,159 $106,307 $345,639 $316,783 26
11 to 15 Years $404,380 $199,010 $204,911 $578,514 $583,677 8
16 to 20 Years $244,333 $122,285 $112,277 $366,618 $344,135 9
Years of Relevant Legal Work Experience
11 to 15 Years $163,501 $54,494 $54,672 $200,786 $209,541 19
16 to 20 Years $203,992 $130,069 $85,354 $292,103 $275,579 31
21 to 30 Years $309,386 $148,293 $125,670 $408,248 $420,272 51
31+ Years $274,013 $177,100 $124,860 $438,463 $381,036 14
Industry
Advertising/ Publishing/Media
$202,311 $139,299 $232,236 $285,890 $295,206 5
Energy/Public Utility $209,573 $154,369 $60,428 $261,029 $256,573 9
Financial/Professional Services
$228,416 $170,556 $144,344 $346,493 $350,553 26
Food/Beverage $284,390 $156,080 $139,701 $440,470 $424,091 8
Insurance $507,704 $147,764 $148,285 $625,915 $626,332 5
Technology $214,699 $149,741 $93,854 $311,590 $291,991 17
Area of Practice
Commercial $245,111 $155,583 $124,413 $315,830 $346,903 11
Contracts $188,977 $21,939 $40,024 $202,141 $229,002 5
Corporate, Securities & Governance
$270,072 $103,390 $98,052 $343,922 $354,117 21
Finance $255,357 $279,836 $227,492 $500,213 $425,976 8

2 0 2 0 I N - H O U S E CO U N S E L CO M P E N SAT I O N S U RV E Y | 5 8 ©2020 Major, Lindsey & Africa LLC. All rights reserved. An Allegis Group Company.
EMEA CLO/GC,continued...
Average Annual Base Pay as of
9/1/2019(i.e., salary)
Annual Variable Pay, Actual Paid
for Fiscal Year 2018 (i.e., bonus/commission, etc.)
Annual Variable Pay, Current
Year Target 2019 (i.e., bonus/
commission, etc.)
Total Annual Actual Cash
(Base + Annual Variable Pay for
Fiscal Year 2018)
Total Target Cash (Base + Annual
Variable Pay Target 2019)
N
Area of Practice, continued...
Generalist $256,215 $126,073 $102,862 $346,606 $343,550 53
International $236,620 $104,860 $97,943 $324,003 $318,239 6
Law Department Management
$232,710 $64,286 $66,798 $277,710 $299,507 10
Number of Employees Supervised
Less than 5 Employees $242,568 $136,191 $74,144 $343,612 $304,753 31
5 to 10 Employees $238,614 $148,976 $136,690 $329,921 $344,438 31
11 to 20 Employees $242,952 $173,594 $143,961 $375,700 $378,445 17
Over 20 Employees $338,939 $181,925 $184,436 $484,480 $523,375 10
Company Headcount
Less than 50 Employees $204,478 $108,655 $99,219 $255,183 $277,239 15
50 to 249 Employees $204,089 $110,002 $72,147 $270,091 $252,188 15
250 to 999 Employees $279,603 $195,570 $134,104 $413,414 $392,533 19
1,000 to 4,999 Employees
$220,636 $113,876 $94,556 $308,233 $310,343 39
5,000 to 14,999 Employees
$260,794 $99,106 $111,481 $332,871 $362,141 11
15,000 to 49,999 Employees
$365,355 $152,428 $125,638 $490,069 $468,150 11
50,000 to 99,999 Employees
$313,564 $171,828 $107,549 $411,751 $421,113 7
Company Revenue
Less than $1 Million USD
$176,485 $25,104 $44,099 $186,526 $202,944 5
$1 Million to $9.9 Million USD
$170,678 $24,055 $30,530 $182,705 $188,996 10
$10 Million to $99.9 Million USD
$186,873 $105,704 $57,644 $252,938 $230,106 24
$100 Million to $999.9 Million USD
$246,826 $168,197 $122,202 $374,248 $354,215 33
$1 Billion to $9.9 Billion USD
$309,106 $132,998 $116,109 $398,970 $418,939 37
$10 Billion USD and above
$316,236 $171,559 $164,783 $487,795 $481,018 10
Country
France $200,658 $87,166 $64,025 $254,299 $264,684 13
Germany $322,010 $133,608 $114,045 $398,358 $419,763 7
Netherlands $214,026 $67,045 $55,018 $259,739 $257,791 44
Switzerland $293,585 $116,954 $100,427 $384,549 $394,012 9
United Kingdom $279,200 $205,115 $169,567 $421,888 $415,591 46

2 0 2 0 I N - H O U S E CO U N S E L CO M P E N SAT I O N S U RV E Y | 5 9 ©2020 Major, Lindsey & Africa LLC. All rights reserved. An Allegis Group Company.
REGIONAL GENERAL COUNSEL/COUNTRY GENERAL COUNSEL
EMEA RGC/CGC
Average Annual Base Pay as of
9/1/2019(i.e., salary)
Annual Variable Pay, Actual Paid
for Fiscal Year 2018 (i.e., bonus/commission, etc.)
Annual Variable Pay, Current
Year Target 2019 (i.e., bonus/
commission, etc.)
Total Annual Actual Cash
(Base + Annual Variable Pay for
Fiscal Year 2018)
Total Target Cash (Base + Annual
Variable Pay Target 2019)
N
Gender
Female $193,926 $87,171 $93,055 $257,851 $268,369 30
Male $207,613 $94,252 $77,901 $277,698 $277,524 39
Ethnicity
Asian $277,243 $220,776 $165,535 $424,427 $415,188 6
White $186,935 $81,340 $81,549 $248,324 $257,714 53
Years in Current Position
5 Years or Less $205,046 $96,997 $77,859 $271,412 $274,709 57
6 to 10 Years $199,252 $108,344 $112,900 $307,596 $296,023 14
Years with Current Company
5 Years or Less $207,691 $117,067 $74,573 $287,639 $276,807 41
6 to 10 Years $175,848 $66,250 $109,443 $235,124 $273,771 19
11 to 15 Years $239,200 $151,068 $125,381 $368,687 $346,669 7
Years of Relevant Legal Work Experience
6 to 10 Years $149,622 $115,487 $64,912 $200,950 $200,110 9
11 to 15 Years $187,846 $60,008 $56,248 $234,519 $237,844 18
16 to 20 Years $204,378 $93,106 $80,924 $285,846 $278,558 24
21 to 30 Years $240,700 $156,041 $126,080 $349,251 $355,817 23
Industry
Consumer Products $194,720 $59,113 $63,883 $242,010 $258,603 5
Energy/Public Utility $241,077 $199,214 $86,677 $373,887 $298,862 6
Financial/Professional Services
$216,960 $190,190 $178,400 $388,132 $359,680 10
Food/Beverage $152,520 $34,079 $37,515 $172,967 $182,533 5
Medical Devices/ Pharmaceuticals
$232,309 $97,617 $59,745 $297,387 $292,054 9
Technology $207,483 $101,908 $61,417 $282,216 $260,711 15
Area of Practice
Commercial $208,726 $110,012 $75,341 $284,359 $274,650 16
Corporate, Securities & Governance
$319,519 $331,166 $279,916 $540,296 $506,129 6
Generalist $179,749 $78,407 $103,326 $241,111 $269,598 23
International $200,830 $36,286 $39,413 $231,933 $240,244 7
Law Department Management
$182,525 $94,435 $57,918 $253,351 $240,443 12
Number of Employees Supervised
Less than 5 Employees $183,154 $88,858 $96,383 $250,564 $272,890 29
5 to 10 Employees $220,362 $120,860 $121,073 $311,007 $311,167 12
11 to 20 Employees $210,613 $45,970 $59,628 $245,090 $270,241 12
Over 20 Employees $306,187 $301,644 $119,542 $607,831 $425,729 5

2 0 2 0 I N - H O U S E CO U N S E L CO M P E N SAT I O N S U RV E Y | 6 0 ©2020 Major, Lindsey & Africa LLC. All rights reserved. An Allegis Group Company.
Company Headcount
250 to 999 Employees $201,401 $74,686 $84,247 $257,415 $254,055 8
1,000 to 4,999 Employees
$200,871 $78,026 $66,283 $264,267 $258,868 16
5,000 to 14,999 Employees
$185,178 $72,409 $67,436 $240,877 $252,615 13
15,000 to 49,999 Employees
$193,798 $136,779 $62,852 $271,958 $243,182 14
50,000 to 99,999 Employees
$273,224 $123,046 $77,432 $378,692 $339,594 7
100,000 or more Employees
$208,005 $128,430 $141,417 $312,354 $349,422 16
Company Revenue
$10 Million to $99.9 Million USD
$177,365 $107,326 $67,143 $223,361 $234,916 7
$100 Million to $999.9 Million USD
$158,061 $24,811 $32,615 $174,602 $181,979 15
$1 Billion to $9.9 Billion USD
$206,784 $107,335 $70,659 $295,613 $270,134 29
$10 Billion USD and above
$238,985 $133,376 $133,726 $345,686 $367,362 25
Country
France $194,136 $86,469 $45,968 $263,311 $240,104 5
Germany $191,656 $66,014 $59,257 $235,665 $250,914 9
Italy $204,581 $45,567 $85,875 $250,148 $256,106 5
Netherlands $181,470 $39,962 $51,010 $203,671 $218,310 18
Switzerland $290,418 $120,004 $81,229 $398,421 $371,647 10
United Kingdom $210,239 $171,612 $146,706 $342,249 $340,018 26
EMEA RGC/CGC,continued...
Average Annual Base Pay as of
9/1/2019(i.e., salary)
Annual Variable Pay, Actual Paid
for Fiscal Year 2018 (i.e., bonus/commission, etc.)
Annual Variable Pay, Current
Year Target 2019 (i.e., bonus/
commission, etc.)
Total Annual Actual Cash
(Base + Annual Variable Pay for
Fiscal Year 2018)
Total Target Cash (Base + Annual
Variable Pay Target 2019)
N

2 0 2 0 I N - H O U S E CO U N S E L CO M P E N SAT I O N S U RV E Y | 6 1 ©2020 Major, Lindsey & Africa LLC. All rights reserved. An Allegis Group Company.
D E P U T Y/ ASS I STA N T G E N E R A L CO U N S E L
EMEA DGC/AGC
Average Annual Base Pay as of
9/1/2019(i.e., salary)
Annual Variable Pay, Actual Paid
for Fiscal Year 2018 (i.e., bonus/commission, etc.)
Annual Variable Pay, Current
Year Target 2019 (i.e., bonus/
commission, etc.)
Total Annual Actual Cash
(Base + Annual Variable Pay for
Fiscal Year 2018)
Total Target Cash (Base + Annual
Variable Pay Target 2019)
N
Gender
Female $212,291 $122,317 $82,552 $283,642 $274,205 12
Male $187,249 $81,029 $47,975 $244,754 $224,392 31
Ethnicity
White $198,908 $98,487 $58,443 $264,566 $242,740 36
Prefer not to say $189,794 $25,280 $30,083 $215,073 $213,860 5
Years in Current Position
5 Years or Less $201,231 $102,715 $58,398 $276,915 $247,335 38
6 to 10 Years $198,145 $104,581 $88,322 $267,866 $271,747 6
Years with Current Company
5 Years or Less $158,854 $103,129 $34,523 $223,787 $185,705 27
6 to 10 Years $271,110 $124,279 $115,493 $372,792 $365,604 11
11 to 15 Years $185,776 $75,110 $64,066 $260,886 $228,487 6
Years of Relevant Legal Work Experience
6 to 10 Years $136,100 $131,250 $23,819 $188,600 $150,392 5
11 to 15 Years $145,575 $16,252 $26,490 $152,962 $164,840 11
16 to 20 Years $230,905 $119,216 $82,867 $342,173 $297,198 15
21 to 30 Years $223,305 $99,005 $80,921 $301,094 $286,886 14
Industry
Energy/Public Utility $231,582 $58,315 $62,519 $289,897 $294,101 5
Medical Devices/ Pharmaceuticals
$166,982 $103,829 $25,745 $218,896 $192,727 8
Technology $227,865 $96,279 $85,915 $308,097 $285,141 6
Area of Practice
Commercial $211,085 $115,997 $54,971 $298,082 $259,184 8
Contracts $105,340 $39,096 $10,700 $136,617 $113,900 5
Finance $228,096 $223,503 $146,630 $406,899 $316,074 5
Generalist $174,315 $78,541 $41,491 $223,404 $205,434 16
Number of Employees Supervised
Less than 5 Employees $205,454 $108,897 $76,065 $285,312 $261,235 15
5 to 10 Employees $242,404 $175,946 $85,371 $398,801 $318,290 9
11 to 20 Employees $315,708 $108,474 $98,423 $402,487 $414,131 5
Company Headcount
250 to 999 Employees $135,352 $64,694 $44,296 $185,670 $174,726 9
1,000 to 4,999 Employees
$116,793 $30,964 $15,313 $140,016 $126,363 8
5,000 to 14,999 Employees
$219,118 $167,516 $59,410 $358,715 $278,528 6
15,000 to 49,999 Employees
$168,318 $36,977 $40,324 $179,411 $192,512 10

2 0 2 0 I N - H O U S E CO U N S E L CO M P E N SAT I O N S U RV E Y | 6 2 ©2020 Major, Lindsey & Africa LLC. All rights reserved. An Allegis Group Company.
Company Headcount, continued...
50,000 to 99,999 Employees
$285,948 $148,383 $104,408 $434,331 $375,441 7
100,000 or more Employees
$337,458 $121,576 $148,178 $438,771 $436,243 6
Company Revenue
$10 Million to $99.9 Million USD
$109,615 $46,864 $23,864 $137,733 $128,706 5
$100 Million to $999.9 Million USD
$132,265 $41,253 $19,700 $162,267 $146,592 11
$1 Billion to $9.9 Billion USD
$198,379 $106,716 $61,361 $276,637 $247,468 15
$10 Billion USD and above
$270,152 $129,420 $108,451 $359,128 $351,490 16
Country
Netherlands $144,566 $37,205 $30,356 $168,640 $167,780 17
United Kingdom $248,168 $128,490 $96,790 $346,066 $321,913 21
EMEA DGC/AGC,continued...
Average Annual Base Pay as of
9/1/2019(i.e., salary)
Annual Variable Pay, Actual Paid
for Fiscal Year 2018 (i.e., bonus/commission, etc.)
Annual Variable Pay, Current
Year Target 2019 (i.e., bonus/
commission, etc.)
Total Annual Actual Cash
(Base + Annual Variable Pay for
Fiscal Year 2018)
Total Target Cash (Base + Annual
Variable Pay Target 2019)
N

2 0 2 0 I N - H O U S E CO U N S E L CO M P E N SAT I O N S U RV E Y | 63 ©2020 Major, Lindsey & Africa LLC. All rights reserved. An Allegis Group Company.
S E N I O R CO U N S E L / ASS O C I AT E G E N E R A L CO U N S E L
EMEA SC/ASTGC
Average Annual Base Pay as of
9/1/2019(i.e., salary)
Annual Variable Pay, Actual Paid
for Fiscal Year 2018 (i.e., bonus/commission, etc.)
Annual Variable Pay, Current
Year Target 2019 (i.e., bonus/
commission, etc.)
Total Annual Actual Cash
(Base + Annual Variable Pay for
Fiscal Year 2018)
Total Target Cash (Base + Annual
Variable Pay Target 2019)
N
Gender
Female $124,091 $21,212 $20,979 $133,518 $138,077 18
Male $133,899 $22,838 $26,376 $146,587 $151,482 27
Ethnicity
White $126,980 $22,809 $23,939 $138,385 $142,099 38
Prefer not to say $148,880 $24,140 $28,776 $160,949 $168,064 6
Years in Current Position
5 Years or Less $130,521 $21,911 $23,282 $141,998 $146,043 42
Years with Current Company
5 Years or Less $131,165 $20,946 $24,003 $141,370 $147,783 39
6 to 10 Years $113,357 $20,455 $17,480 $125,630 $123,845 5
Years of Relevant Legal Work Experience
6 to 10 Years $117,369 $24,232 $24,918 $131,216 $135,168 14
11 to 15 Years $113,226 $16,665 $14,340 $122,947 $122,786 12
16 to 20 Years $144,571 $31,664 $19,861 $154,070 $152,516 10
21 to 30 Years $145,158 $13,053 $26,319 $150,380 $163,582 10
Industry
Financial/ Professional Services
$129,251 $38,387 $31,637 $151,187 $156,368 7
Medical Devices/ Pharmaceuticals
$156,966 $12,237 $17,479 $164,615 $170,076 8
Technology $143,523 $23,592 $31,004 $156,391 $160,434 11
Area of Practice
Commercial $142,262 $13,625 $13,684 $151,994 $152,036 7
Contracts $114,266 $16,825 $14,400 $119,874 $119,066 9
Generalist $140,232 $33,720 $33,667 $162,712 $169,410 15
Number of Employees Supervised
Less than 5 Employees $155,084 $35,139 $40,284 $185,202 $189,612 7
Company Headcount
250 to 999 Employees $149,031 $17,037 $20,887 $153,899 $157,983 7
1,000 to 4,999 Employees
$120,177 $19,348 $19,842 $126,626 $135,610 9
5,000 to 14,999 Employees
$145,695 $15,942 $21,688 $153,666 $156,539 8
15,000 to 49,999 Employees
$129,249 $25,294 $30,280 $144,003 $151,958 12
100,000 or more Employees
$122,536 $17,320 $16,067 $139,856 $135,926 6

2 0 2 0 I N - H O U S E CO U N S E L CO M P E N SAT I O N S U RV E Y | 6 4 ©2020 Major, Lindsey & Africa LLC. All rights reserved. An Allegis Group Company.
Company Revenue
$10 Million to $99.9 Million USD
$105,895 $69,491 $74,957 $133,691 $135,877 5
$100 Million to $999.9 Million USD
$154,900 $20,264 $21,999 $157,433 $163,150 8
$1 Billion to $9.9 Billion USD
$141,240 $25,256 $28,456 $153,026 $160,211 15
$10 Billion USD and above
$133,534 $19,238 $20,883 $149,376 $150,732 17
Country
Germany $116,705 $17,628 $17,182 $134,333 $133,887 5
Netherlands $118,737 $22,043 $21,249 $126,452 $130,424 20
Switzerland $187,242 $19,656 $26,850 $206,898 $214,092 5
United Kingdom $158,259 $35,579 $44,151 $176,049 $180,334 14
EMEA SC/ASTGC,continued...
Average Annual Base Pay as of
9/1/2019(i.e., salary)
Annual Variable Pay, Actual Paid
for Fiscal Year 2018 (i.e., bonus/commission, etc.)
Annual Variable Pay, Current
Year Target 2019 (i.e., bonus/
commission, etc.)
Total Annual Actual Cash
(Base + Annual Variable Pay for
Fiscal Year 2018)
Total Target Cash (Base + Annual
Variable Pay Target 2019)
N

2 0 2 0 I N - H O U S E CO U N S E L CO M P E N SAT I O N S U RV E Y | 6 5 ©2020 Major, Lindsey & Africa LLC. All rights reserved. An Allegis Group Company.
CO U N S E L
EMEA Counsel
Average Annual Base Pay as of
9/1/2019(i.e., salary)
Annual Variable Pay, Actual Paid
for Fiscal Year 2018 (i.e., bonus/commission, etc.)
Annual Variable Pay, Current
Year Target 2019 (i.e., bonus/
commission, etc.)
Total Annual Actual Cash
(Base + Annual Variable Pay for
Fiscal Year 2018)
Total Target Cash (Base + Annual
Variable Pay Target 2019)
N
Years in Current Position
5 Years or Less 110,916 8,700 4,462 112,657 112,701 5
Years with Current Company
5 Years or Less 110,916 8,700 4,462 112,657 112,701 5

2 0 2 0 I N - H O U S E CO U N S E L CO M P E N SAT I O N S U RV E Y | 6 6 ©2020 Major, Lindsey & Africa LLC. All rights reserved. An Allegis Group Company.
Is Member of Legal Department Member of Senior Management?
Company Headcount Yes Perecent
Less than 50 Employees 170 4.4%
50 to 249 Employees 432 11.1%
250 to 999 Employees 518 13.3%
1,000 to 4,999 Employees 734 18.8%
5,000 to 14,999 Employees 597 15.3%
15,000 to 49,999 Employees 494 12.7%
50,000 to 99,999 Employees 238 6.1%
100,000 or more Employees 267 6.9%
Company Revenue Yes Percent
Less than $1 Million USD 109 2.8%
$1 Million to $9.9 Million USD 167 4.3%
$10 Million to $99.9 Million USD 449 11.5%
$100 Million to $999.9 Million USD 817 21.0%
$1 Billion to $9.9 Billion USD 1,147 29.4%
$10 Billion USD and above 715 18.3%

©2020 Major, Lindsey & Africa LLC.All rights reserved.
An Allegis Group Company.
W W W. M L AG LO B A L .CO M