Embed Size (px)
Citation preview
2020 ANNUAL REPORT
A.B.N. 87 008 108 218
30 JUNE 2020 BENTLEY CAPITAL LIMITED A.B.N. 87 008 108 218
ANNUAL REPORT | 1
CONTENTS CORPORATE DIRECTORY Company Profile 2 BOARD Farooq Khan Executive Chairman Overview of Performance 3 William M. Johnson Executive Director Simon K. Cato Non-Executive Director Directors’ Statutory Report 4 COMPANY SECRETARY Remuneration Report 13 Victor P.H. Ho Auditor’s Independence Declaration 20 REGISTERED AND PRINCIPAL OFFICE Consolidated Statement of Profit or Loss 21 Level 2
and Comprehensive Income 31 Ventnor Avenue West Perth, Western Australia 6005 Consolidated Statement of 22 Telephone: (08) 9214 9757
Financial Position Facsimile: (08) 9214 9701 Email: [email protected] Consolidated Statement of 23 Website: www.bel.com.au
Changes in Equity Consolidated Statement of Cash Flows 24 AUDITORS Rothsay Auditing Notes to the Consolidated 25 Chartered Accountants
Financial Statements Level 1, Lincoln House 4 Ventnor Avenue Directors’ Declaration 47 West Perth, Western Australia 6005
Telephone: (08) 9486 7094 Independent Auditor’s Report 48 Website: www.rothsayresources.com.au Investment Mandate 52 STOCK EXCHANGE List of Share Investments 53 Australian Securities Exchange Perth, Western Australia Additional ASX Information 54 Website: www.asx.com.au ASX CODE BEL The 2020 Corporate Governance Statement can be found at the following URL on the Company’s website: http://bel.com.au/corporate-governance
SHARE REGISTRY Advanced Share Registry Main Office 110 Stirling Highway Nedlands, Western Australia 6009 Local Telephone: 1300 113 258 Telephone: (08) 9389 8033
Facsimile: (08) 6370 4203 Email: [email protected] Website: www.advancedshare.com.au Visit www.bel.com.au for: • Market Announcements Sydney Office • Financial Reports Suite 8H, 325 Pitt Street • Corporate Governance Sydney, New South Wales 2000 • NTA Backing History Telephone: (02) 8096 3502 • Distribution History • Forms Investor Portal: • Email subscription https://www.advancedshare.com.au/Investor-Login
30 JUNE 2020 BENTLEY CAPITAL LIMITED A.B.N. 87 008 108 218
COMPANY PROFILE
ANNUAL REPORT | 2
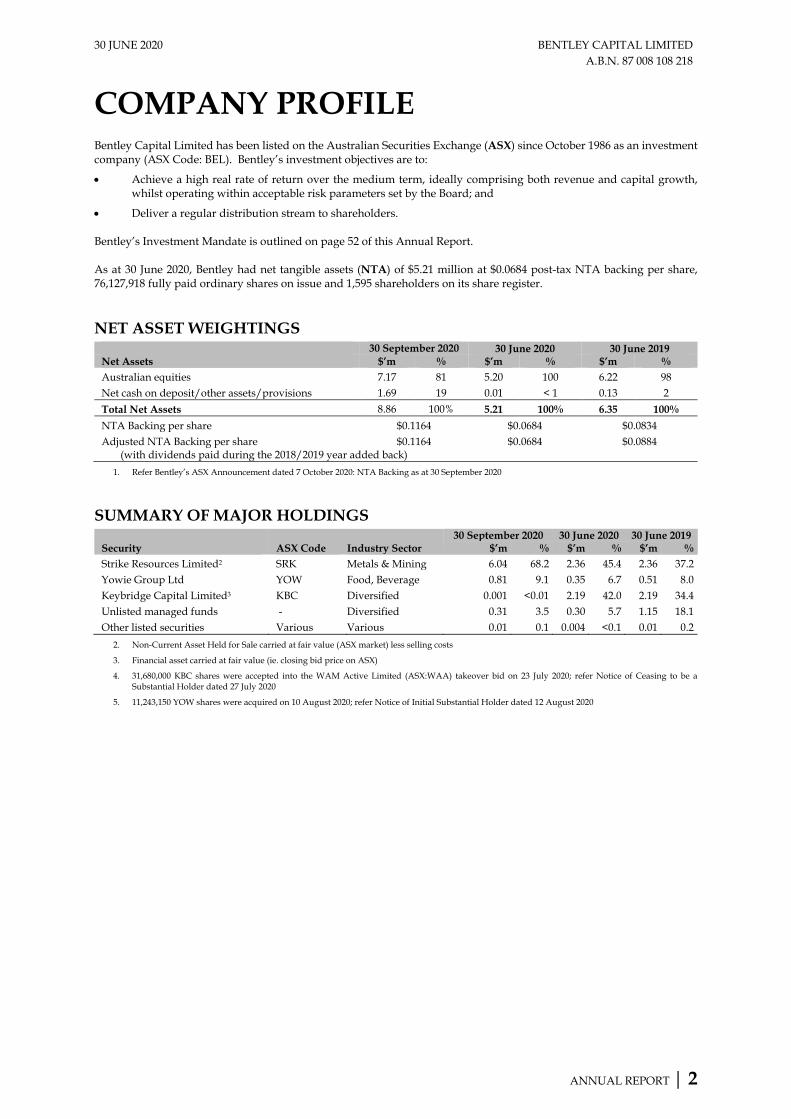
Bentley Capital Limited has been listed on the Australian Securities Exchange (ASX) since October 1986 as an investment company (ASX Code: BEL). Bentley’s investment objectives are to:
• Achieve a high real rate of return over the medium term, ideally comprising both revenue and capital growth, whilst operating within acceptable risk parameters set by the Board; and
• Deliver a regular distribution stream to shareholders. Bentley’s Investment Mandate is outlined on page 52 of this Annual Report. As at 30 June 2020, Bentley had net tangible assets (NTA) of $5.21 million at $0.0684 post-tax NTA backing per share, 76,127,918 fully paid ordinary shares on issue and 1,595 shareholders on its share register. NET ASSET WEIGHTINGS
30 September 2020 30 June 2020 30 June 2019 Net Assets $’m % $’m % $’m % Australian equities 7.17 81 5.20 100 6.22 98 Net cash on deposit/other assets/provisions 1.69 19 0.01 < 1 0.13 2 Total Net Assets 8.86 100% 5.21 100% 6.35 100% NTA Backing per share $0.1164 $0.0684 $0.0834 Adjusted NTA Backing per share $0.1164 $0.0684 $0.0884 (with dividends paid during the 2018/2019 year added back)
1. Refer Bentley’s ASX Announcement dated 7 October 2020: NTA Backing as at 30 September 2020 SUMMARY OF MAJOR HOLDINGS
Security ASX Code Industry Sector 30 September 2020 30 June 2020 30 June 2019
$’m % $’m % $’m % Strike Resources Limited2 SRK Metals & Mining 6.04 68.2 2.36 45.4 2.36 37.2 Yowie Group Ltd YOW Food, Beverage 0.81 9.1 0.35 6.7 0.51 8.0 Keybridge Capital Limited3 KBC Diversified 0.001 <0.01 2.19 42.0 2.19 34.4 Unlisted managed funds - Diversified 0.31 3.5 0.30 5.7 1.15 18.1 Other listed securities Various Various 0.01 0.1 0.004 <0.1 0.01 0.2
2. Non-Current Asset Held for Sale carried at fair value (ASX market) less selling costs
3. Financial asset carried at fair value (ie. closing bid price on ASX)
4. 31,680,000 KBC shares were accepted into the WAM Active Limited (ASX:WAA) takeover bid on 23 July 2020; refer Notice of Ceasing to be a Substantial Holder dated 27 July 2020
5. 11,243,150 YOW shares were acquired on 10 August 2020; refer Notice of Initial Substantial Holder dated 12 August 2020
30 JUNE 2020 BENTLEY CAPITAL LIMITED A.B.N. 87 008 108 218
OVERVIEW OF PERFORMANCE
ANNUAL REPORT | 3
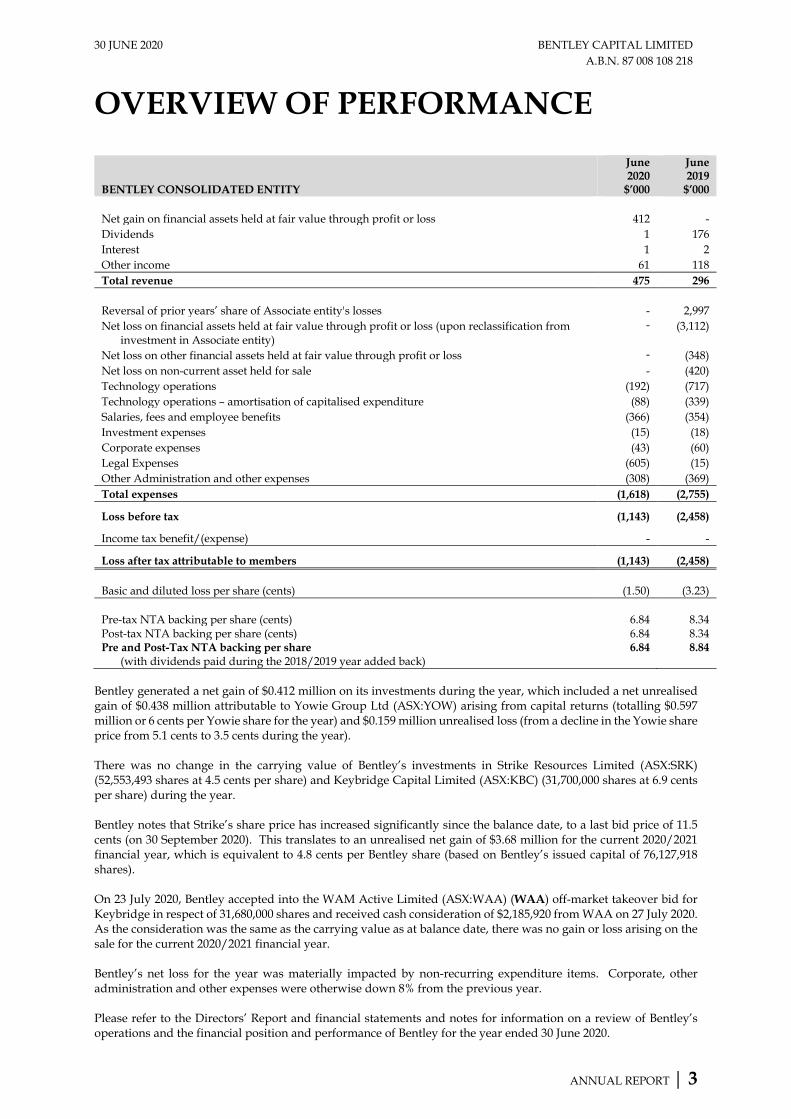
BENTLEY CONSOLIDATED ENTITY
June 2020
$’000
June 2019
$’000 Net gain on financial assets held at fair value through profit or loss 412 - Dividends 1 176 Interest 1 2 Other income 61 118 Total revenue 475 296 Reversal of prior years’ share of Associate entity's losses - 2,997 Net loss on financial assets held at fair value through profit or loss (upon reclassification from
investment in Associate entity) - (3,112)
Net loss on other financial assets held at fair value through profit or loss - (348) Net loss on non-current asset held for sale - (420) Technology operations (192) (717) Technology operations – amortisation of capitalised expenditure (88) (339) Salaries, fees and employee benefits (366) (354) Investment expenses (15) (18) Corporate expenses (43) (60) Legal Expenses (605) (15) Other Administration and other expenses (308) (369) Total expenses (1,618) (2,755)
Loss before tax (1,143) (2,458)
Income tax benefit/(expense) - -
Loss after tax attributable to members (1,143) (2,458) Basic and diluted loss per share (cents) (1.50) (3.23) Pre-tax NTA backing per share (cents) 6.84 8.34 Post-tax NTA backing per share (cents) 6.84 8.34 Pre and Post-Tax NTA backing per share 6.84 8.84
(with dividends paid during the 2018/2019 year added back) Bentley generated a net gain of $0.412 million on its investments during the year, which included a net unrealised gain of $0.438 million attributable to Yowie Group Ltd (ASX:YOW) arising from capital returns (totalling $0.597 million or 6 cents per Yowie share for the year) and $0.159 million unrealised loss (from a decline in the Yowie share price from 5.1 cents to 3.5 cents during the year). There was no change in the carrying value of Bentley’s investments in Strike Resources Limited (ASX:SRK) (52,553,493 shares at 4.5 cents per share) and Keybridge Capital Limited (ASX:KBC) (31,700,000 shares at 6.9 cents per share) during the year. Bentley notes that Strike’s share price has increased significantly since the balance date, to a last bid price of 11.5 cents (on 30 September 2020). This translates to an unrealised net gain of $3.68 million for the current 2020/2021 financial year, which is equivalent to 4.8 cents per Bentley share (based on Bentley’s issued capital of 76,127,918 shares). On 23 July 2020, Bentley accepted into the WAM Active Limited (ASX:WAA) (WAA) off-market takeover bid for Keybridge in respect of 31,680,000 shares and received cash consideration of $2,185,920 from WAA on 27 July 2020. As the consideration was the same as the carrying value as at balance date, there was no gain or loss arising on the sale for the current 2020/2021 financial year. Bentley’s net loss for the year was materially impacted by non-recurring expenditure items. Corporate, other administration and other expenses were otherwise down 8% from the previous year. Please refer to the Directors’ Report and financial statements and notes for information on a review of Bentley’s operations and the financial position and performance of Bentley for the year ended 30 June 2020.
30 JUNE 2020 BENTLEY CAPITAL LIMITED A.B.N. 87 008 108 218
DIRECTORS’ STATUTORY REPORT
ANNUAL REPORT | 4
The Directors present their Directors’ Report on Bentley Capital Limited ABN 87 008 108 218 (BEL or Company) and its controlled entities (Bentley or the Consolidated Entity) for the financial year ended 30 June 2020 (Balance Date). BEL is a company limited by shares that was incorporated in South Australia in June 1986 and has been listed on the Australian Securities Exchange (ASX) since October 1986 (ASX Code: BEL). PRINCIPAL ACTIVITIES BEL is a listed investment company (LIC). Bentley’s investment objectives are to: • Achieve a high real rate of return over the medium term, ideally comprising both revenue and capital
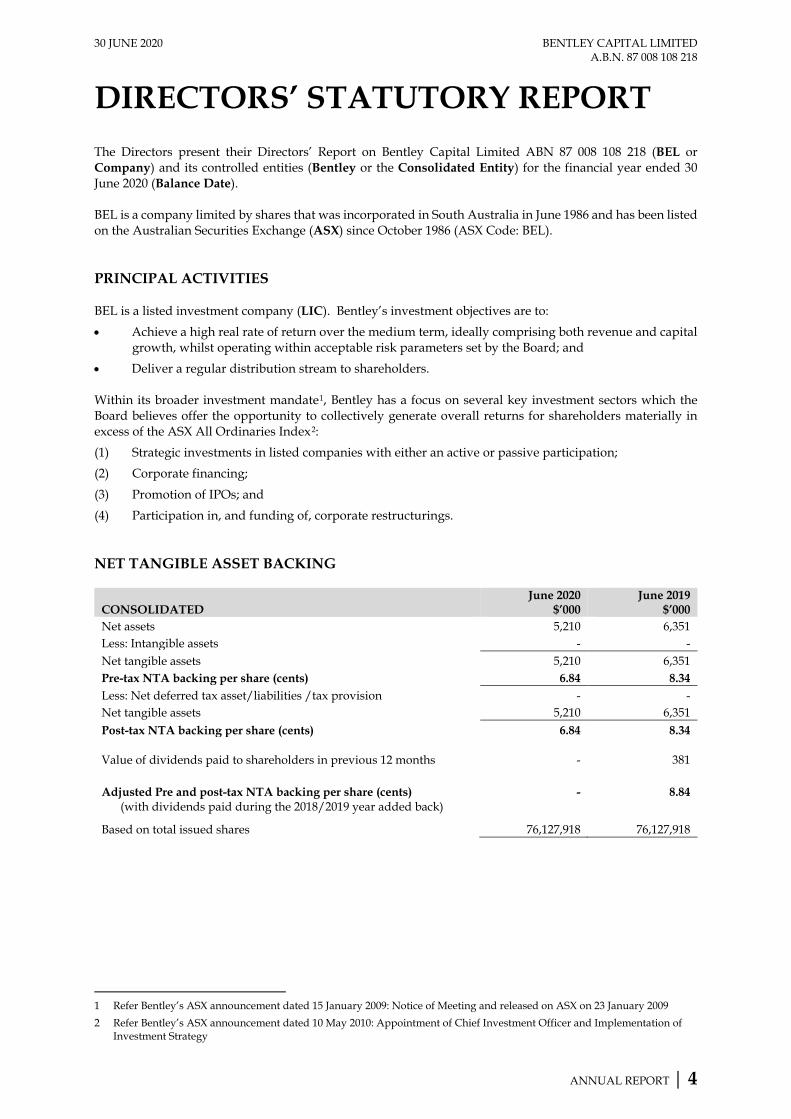
growth, whilst operating within acceptable risk parameters set by the Board; and • Deliver a regular distribution stream to shareholders. Within its broader investment mandate1, Bentley has a focus on several key investment sectors which the Board believes offer the opportunity to collectively generate overall returns for shareholders materially in excess of the ASX All Ordinaries Index2: (1) Strategic investments in listed companies with either an active or passive participation; (2) Corporate financing; (3) Promotion of IPOs; and (4) Participation in, and funding of, corporate restructurings. NET TANGIBLE ASSET BACKING
CONSOLIDATED June 2020
$’000 June 2019
$’000 Net assets 5,210 6,351 Less: Intangible assets - - Net tangible assets 5,210 6,351 Pre-tax NTA backing per share (cents) 6.84 8.34 Less: Net deferred tax asset/liabilities /tax provision - - Net tangible assets 5,210 6,351 Post-tax NTA backing per share (cents) 6.84 8.34 Value of dividends paid to shareholders in previous 12 months - 381 Adjusted Pre and post-tax NTA backing per share (cents) - 8.84
(with dividends paid during the 2018/2019 year added back)
Based on total issued shares 76,127,918 76,127,918
1 Refer Bentley’s ASX announcement dated 15 January 2009: Notice of Meeting and released on ASX on 23 January 2009 2 Refer Bentley’s ASX announcement dated 10 May 2010: Appointment of Chief Investment Officer and Implementation of
Investment Strategy
30 JUNE 2020 BENTLEY CAPITAL LIMITED A.B.N. 87 008 108 218
DIRECTORS’ STATUTORY REPORT
ANNUAL REPORT | 5
OPERATING RESULTS
CONSOLIDATED June 2020
$'000 June 2019
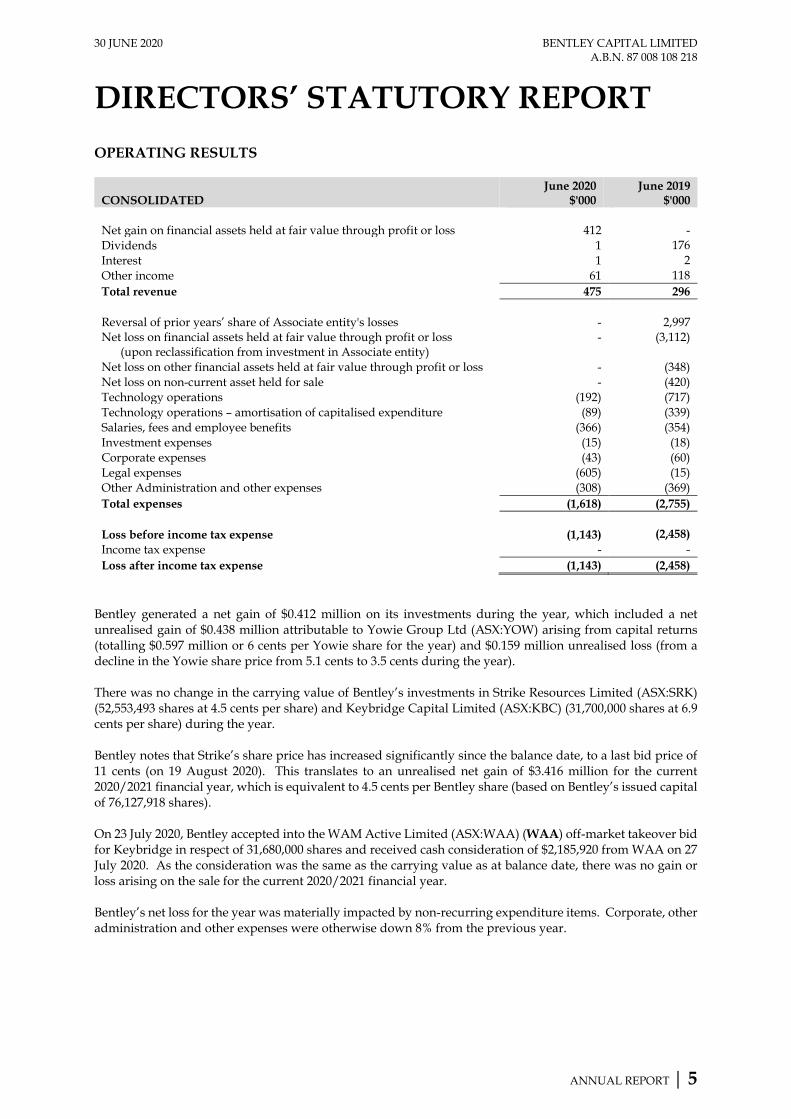
$'000 Net gain on financial assets held at fair value through profit or loss 412 - Dividends 1 176 Interest 1 2 Other income 61 118 Total revenue 475 296 Reversal of prior years’ share of Associate entity's losses - 2,997 Net loss on financial assets held at fair value through profit or loss
(upon reclassification from investment in Associate entity) - (3,112)
Net loss on other financial assets held at fair value through profit or loss - (348) Net loss on non-current asset held for sale - (420) Technology operations (192) (717) Technology operations – amortisation of capitalised expenditure (89) (339) Salaries, fees and employee benefits (366) (354) Investment expenses (15) (18) Corporate expenses (43) (60) Legal expenses (605) (15) Other Administration and other expenses (308) (369) Total expenses (1,618) (2,755) Loss before income tax expense (1,143) (2,458) Income tax expense - - Loss after income tax expense (1,143) (2,458)
Bentley generated a net gain of $0.412 million on its investments during the year, which included a net unrealised gain of $0.438 million attributable to Yowie Group Ltd (ASX:YOW) arising from capital returns (totalling $0.597 million or 6 cents per Yowie share for the year) and $0.159 million unrealised loss (from a decline in the Yowie share price from 5.1 cents to 3.5 cents during the year). There was no change in the carrying value of Bentley’s investments in Strike Resources Limited (ASX:SRK) (52,553,493 shares at 4.5 cents per share) and Keybridge Capital Limited (ASX:KBC) (31,700,000 shares at 6.9 cents per share) during the year. Bentley notes that Strike’s share price has increased significantly since the balance date, to a last bid price of 11 cents (on 19 August 2020). This translates to an unrealised net gain of $3.416 million for the current 2020/2021 financial year, which is equivalent to 4.5 cents per Bentley share (based on Bentley’s issued capital of 76,127,918 shares). On 23 July 2020, Bentley accepted into the WAM Active Limited (ASX:WAA) (WAA) off-market takeover bid for Keybridge in respect of 31,680,000 shares and received cash consideration of $2,185,920 from WAA on 27 July 2020. As the consideration was the same as the carrying value as at balance date, there was no gain or loss arising on the sale for the current 2020/2021 financial year. Bentley’s net loss for the year was materially impacted by non-recurring expenditure items. Corporate, other administration and other expenses were otherwise down 8% from the previous year.
30 JUNE 2020 BENTLEY CAPITAL LIMITED A.B.N. 87 008 108 218
DIRECTORS’ STATUTORY REPORT
ANNUAL REPORT | 6
EARNINGS PER SHARE
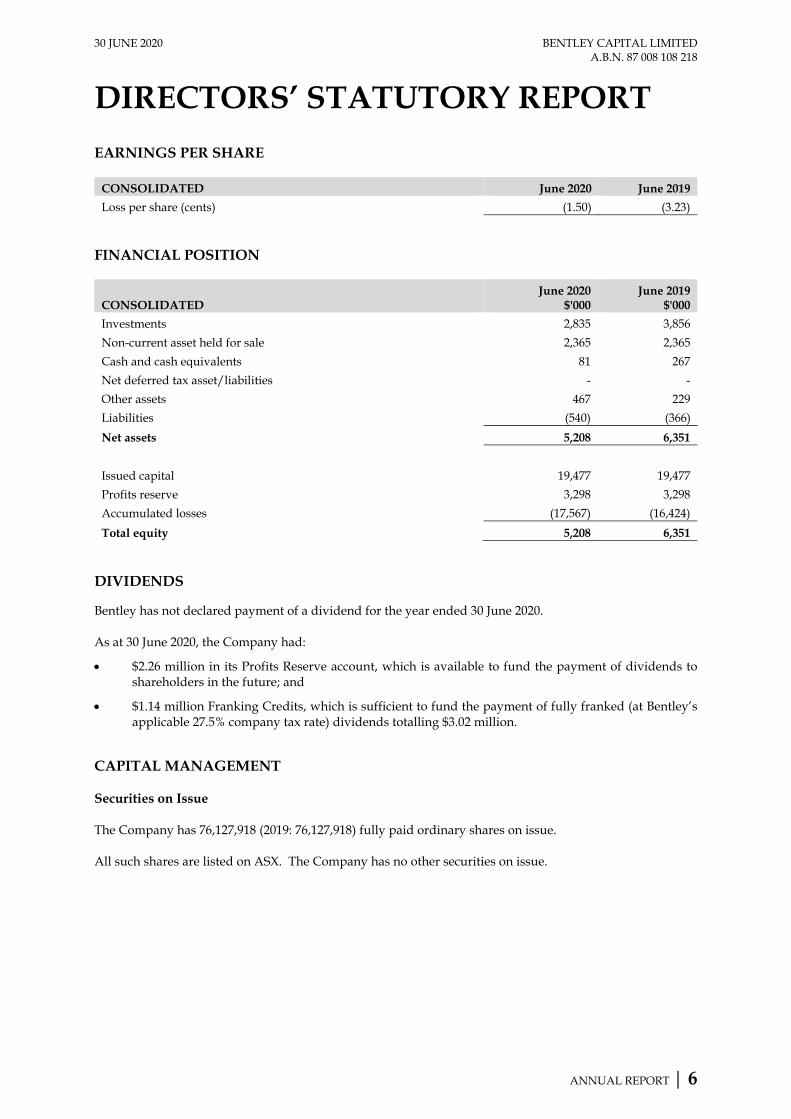
CONSOLIDATED June 2020 June 2019 Loss per share (cents) (1.50) (3.23)
FINANCIAL POSITION
CONSOLIDATED June 2020
$'000 June 2019
$'000 Investments 2,835 3,856 Non-current asset held for sale 2,365 2,365 Cash and cash equivalents 81 267 Net deferred tax asset/liabilities - - Other assets 467 229 Liabilities (540) (366) Net assets 5,208 6,351 Issued capital 19,477 19,477 Profits reserve 3,298 3,298 Accumulated losses (17,567) (16,424) Total equity 5,208 6,351
DIVIDENDS Bentley has not declared payment of a dividend for the year ended 30 June 2020. As at 30 June 2020, the Company had:
• $2.26 million in its Profits Reserve account, which is available to fund the payment of dividends to shareholders in the future; and
• $1.14 million Franking Credits, which is sufficient to fund the payment of fully franked (at Bentley’s applicable 27.5% company tax rate) dividends totalling $3.02 million.
CAPITAL MANAGEMENT Securities on Issue The Company has 76,127,918 (2019: 76,127,918) fully paid ordinary shares on issue. All such shares are listed on ASX. The Company has no other securities on issue.
30 JUNE 2020 BENTLEY CAPITAL LIMITED A.B.N. 87 008 108 218
DIRECTORS’ STATUTORY REPORT
ANNUAL REPORT | 7
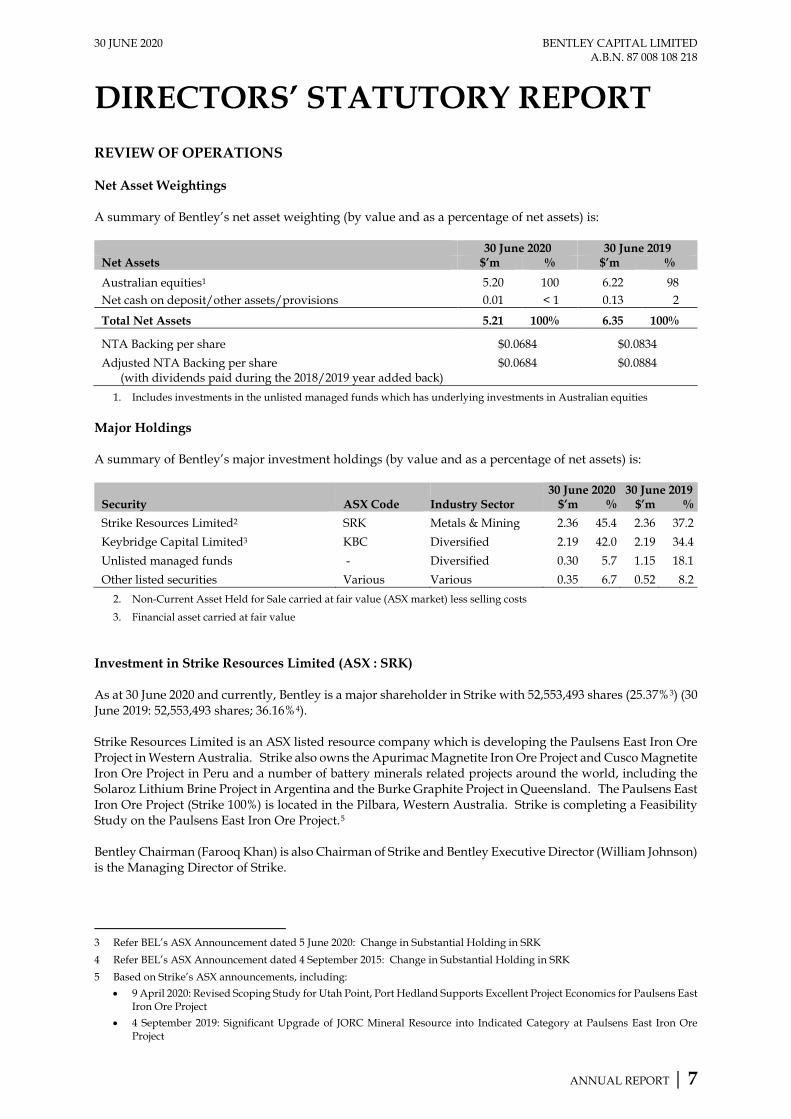
REVIEW OF OPERATIONS Net Asset Weightings A summary of Bentley’s net asset weighting (by value and as a percentage of net assets) is:
30 June 2020 30 June 2019 Net Assets $’m % $’m % Australian equities1 5.20 100 6.22 98 Net cash on deposit/other assets/provisions 0.01 < 1 0.13 2
Total Net Assets 5.21 100% 6.35 100%
NTA Backing per share $0.0684 $0.0834 Adjusted NTA Backing per share $0.0684 $0.0884
(with dividends paid during the 2018/2019 year added back) 1. Includes investments in the unlisted managed funds which has underlying investments in Australian equities
Major Holdings A summary of Bentley’s major investment holdings (by value and as a percentage of net assets) is:
Security ASX Code Industry Sector 30 June 2020 30 June 2019
$’m % $’m % Strike Resources Limited2 SRK Metals & Mining 2.36 45.4 2.36 37.2 Keybridge Capital Limited3 KBC Diversified 2.19 42.0 2.19 34.4 Unlisted managed funds - Diversified 0.30 5.7 1.15 18.1 Other listed securities Various Various 0.35 6.7 0.52 8.2
2. Non-Current Asset Held for Sale carried at fair value (ASX market) less selling costs
3. Financial asset carried at fair value Investment in Strike Resources Limited (ASX : SRK) As at 30 June 2020 and currently, Bentley is a major shareholder in Strike with 52,553,493 shares (25.37%3) (30 June 2019: 52,553,493 shares; 36.16%4). Strike Resources Limited is an ASX listed resource company which is developing the Paulsens East Iron Ore Project in Western Australia. Strike also owns the Apurimac Magnetite Iron Ore Project and Cusco Magnetite Iron Ore Project in Peru and a number of battery minerals related projects around the world, including the Solaroz Lithium Brine Project in Argentina and the Burke Graphite Project in Queensland. The Paulsens East Iron Ore Project (Strike 100%) is located in the Pilbara, Western Australia. Strike is completing a Feasibility Study on the Paulsens East Iron Ore Project.5 Bentley Chairman (Farooq Khan) is also Chairman of Strike and Bentley Executive Director (William Johnson) is the Managing Director of Strike.
3 Refer BEL’s ASX Announcement dated 5 June 2020: Change in Substantial Holding in SRK 4 Refer BEL’s ASX Announcement dated 4 September 2015: Change in Substantial Holding in SRK 5 Based on Strike’s ASX announcements, including:
• 9 April 2020: Revised Scoping Study for Utah Point, Port Hedland Supports Excellent Project Economics for Paulsens East Iron Ore Project
• 4 September 2019: Significant Upgrade of JORC Mineral Resource into Indicated Category at Paulsens East Iron Ore Project
30 JUNE 2020 BENTLEY CAPITAL LIMITED A.B.N. 87 008 108 218
DIRECTORS’ STATUTORY REPORT
ANNUAL REPORT | 8
Bentley’s interest in Strike has diluted during the year as a consequence of equity capital raisings undertaken by Strike:
• On 18 July 2019, Strike raised $0.981 million through a placement of 21.8 million shares.
• On 5 June 2020, Strike raised $1.8 million through a placement of 40 million shares. Further information about Strike’s resource projects and activities are contained in their ASX releases, including as follows:
• 17 July 2020: June 2020 Quarterly Reports;
• 13 March 2020: December 2019 Half Year Report; and
• 30 October 2019: 2019 Annual Report. Information concerning Strike may be viewed from its website: www.strikeresources.com.au Strike’s market announcements may also be viewed from the ASX website (www.asx.com.au) under ASX code “SRK”. Investment in Yowie Group Ltd (ASX:YOW) As at 30 June 2020, Bentley held 9,956,110 Yowie shares (4.57%) (30 June 2019: 9,956,110 shares; 4.57%). On 10 August 2020, Bentley acquired a further 11,243,150 Yowie shares (at a cost of $0.035 per share), increasing its total interest to 21,199,260 shares (9.71%).6 During the year, Yowie distributed capital returns totaling 6 cents per share (after receiving shareholder approvals):
• On or about 26 November 2019, Yowie returned capital of 2 cents per share - Bentley received $199,122;
• On or about 14 July 2019, Yowie returned capital of 4 cents per share (shareholder approval was obtained on 24 June with a 30 June record date for determining entitlements to the capital return; Yowie shares traded on an ex-return of capital basis on 29 June) - Bentley received $398,245.
The Yowie capital returns have the effect of reducing the cost base of Bentley’s investment in Yowie – this has led to a reversal of previous years’ provision for impairment ($597,367), which has translated to Bentley generating a net gain on the Yowie investment of $0.438 million. Yowie employs its intellectual property rights in the outsourcing of the manufacturing and distribution of the Yowie chocolate confectionery product and in the development of a Yowie digital platform and Yowie branded licensed consumer products.7 Information concerning Yowie may be viewed on its website: www.yowiegroup.com Yowie’s market announcements may also be viewed from the ASX website (www.asx.com.au) under ASX code “YOW”.
6 Refer BEL’s ASX Announcement dated 12 August 2020: Notice of Initial Substantial Holder in YOW 7 Refer YOW’s ASX Announcement dated 29 July 2020: FY20 June Quarter Update and Cash Commentary
30 JUNE 2020 BENTLEY CAPITAL LIMITED A.B.N. 87 008 108 218
DIRECTORS’ STATUTORY REPORT
ANNUAL REPORT | 9
Investment in Keybridge Capital Limited (ASX:KBC) As at 30 June 2020, Bentley was a major shareholder in Keybridge with 31,700,000 shares (30 June 2019: 31,700,000 shares). Keybridge has a portfolio of listed and unlisted investments/loan assets in the private equity (USA), life insurance (New Zealand), property and funds management sectors and major holdings in HHY Fund (ASX:HHY), Molopo Energy Limited (ASX:MPO), Metgasco Limited (ASX:MEL) and Yowie Group Ltd (ASX:YOW).8 Bentley Executive Director, William Johnson, served on the Board of Keybridge between July 2016 and 17 April 2020. Bentley’s Non-Executive Director, Simon Cato, also served on the Board of Keybridge between July 2016 and 17 January 2020. Keybridge has been suspended from trading on ASX since 16 July 2019.9 Keybridge's last published net asset backing was $0.0582 per share as at 31 December 2019, as disclosed in Keybridge’s 31 December 2019 Half Year Report released on ASX on 2 March 2020 (unaudited) and 8 May 2020 (auditor reviewed). On 28 April 2020, WAM Active Limited (ASX:WAA) (WAA) launched an off-market takeover bid for Keybridge at $0.069 cash per share (Offer). The Offer is unconditional and opened on 21 July 2020.10 As at 30 June 2020, Bentley adopted a carrying value of $0.069 per Keybridge share, based on the Board’s judgement of Keybridge's value having regard to the existence of a cash, unconditional takeover bid for Keybridge as at balance date. On 23 July 2020, Bentley accepted into the WAA Offer in respect of 31,680,000 shares in Keybridge and received cash consideration of $2,185,920 from WAA on 27 July 2020. Keybridge’s market announcements may be viewed from the ASX website (www.asx.com.au) under ASX code “KBC”. Technology Operations
During the year, Bentley closed down its technology operations (previously involved in software, Internet and applications development) as it had not provided sufficient commercial returns to justify its continuation. SIGNIFICANT CHANGES IN THE STATE OF AFFAIRS There were no significant changes in the state of affairs of Bentley that occurred during the financial year not otherwise disclosed in this Directors’ Report or the financial statements.
8 Based on Keybridge’s ASX announcements 9 Refer KBC’s ASX Announcements dated 16 July 2019: Suspension from Official Quotation and 2 June 2020: Suspension from
Official Quotation - Continuation 10 Refer WAA’s replacement Bidder’s Statement (dated 6 July 2020) despatched to Keybridge shareholders on 21 July 2020 (and
released on ASX on 21 July 2020)
30 JUNE 2020 BENTLEY CAPITAL LIMITED A.B.N. 87 008 108 218
DIRECTORS’ STATUTORY REPORT
ANNUAL REPORT | 10
FUTURE DEVELOPMENTS Bentley intends to continue its investment activities in future years. The results of these investment activities depend upon the performance of the underlying companies and securities in which Bentley invests. The investments’ performances depend on many economic factors and also industry and company- specific issues. In the opinion of the Directors, it is not possible or appropriate to make a prediction on the future course of markets, the performance of Bentley’s investments or forecast the likely results of Bentley’s activities. ENVIRONMENTAL REGULATION Bentley is not subject to any particular or significant environmental regulation under Australian Commonwealth or State legislation. DIRECTORS Directors in office during or since the financial year are as follows: FAROOQ KHAN Chairman
Appointed Director since 2 December 2003; Chairman since 10 February 2004
Qualifications BJuris, LLB (Western Australia)
Experience Mr Khan is a qualified lawyer having previously practised principally in the field of corporate law. Mr Khan has extensive experience in the securities industry, capital markets and the executive management of ASX-listed companies. In particular, Mr Khan has guided the establishment and growth of a number of public listed companies in the investment, mining and financial services sector. He has considerable experience in the fields of capital raisings, mergers and acquisitions and investments.
Relevant interest in shares 11,717,58611
Special Responsibilities Chairman of the Board and Investment Committee
Other current directorships in listed entities
Executive Chairman and Managing Director of Queste Communications Ltd (ASX:QUE) (since 10 March 1998) Executive Chairman of Orion Equities Limited (ASX:OEQ) (since 23 October 2006) Chairman (appointed 18 December 2015) of Strike Resources Limited (ASX:SRK) (Director since 1 October 2015)
Former directorships in other listed entities in past 3 years
Alternate Director (for Simon Cato) of Keybridge Capital Limited (ASX:KBC) (26 June to 18 July 2019)
11 Refer BEL’s ASX Announcements dated 19 July 2019: Change of Director’s Interest Notice – F Khan, 6 June 2019: Change of
Director’s Interest Notice – F Khan and dated 22 March 2017: Notice of Initial Substantial Holder in BEL
30 JUNE 2020 BENTLEY CAPITAL LIMITED A.B.N. 87 008 108 218
DIRECTORS’ STATUTORY REPORT
ANNUAL REPORT | 11
WILLIAM M. JOHNSON Executive Director
Appointed Director since 13 March 2009; Executive Director since 1 January 2016
Qualifications MA (Oxon), MBA, MAICD
Experience William Johnson holds a Masters degree in engineering science from Oxford University, England and an MBA from Victoria University, New Zealand. His 30-year business career spans multiple industries and countries, with executive/CEO experience in mineral exploration and investment (Australia, Peru, Chile, Saudi Arabia, Oman, North Africa and Indonesia), telecommunications infrastructure investment (New Zealand, India, Thailand and Malaysia) and information technology and Internet ventures (New Zealand, Philippines and Australia). Mr Johnson is a highly-experienced public company director and has considerable depth of experience in corporate governance, business strategy and operations, investment analysis, finance and execution.
Relevant interest in shares None
Special Responsibilities Member of the Investment, Audit and Remuneration Committees.
Other current directorships in listed entities
Managing Director of Strike Resources Limited (ASX:SRK) (since 25 March 2013; Director since 14 July 2006) Director of Molopo Energy Limited (ASX:MPO) (since 31 May 2018)
Former directorships in other listed entities in past 3 years
Director of Keybridge Capital Limited (ASX:KBC) (29 July 2016 to 17 April 2020) Non-Executive Director of Yowie Group Ltd (ASX:YOW) (10 April 2018 to 8 October 2018)
SIMON K. CATO Non-Executive Director
Appointed 7 January 2015
Qualifications B.A. (Sydney)
Experience Simon Cato has had over 30 years’ capital markets experience in broking, regulatory roles (with ASX in Sydney and Perth) and as a director of listed companies. From 1991 until 2006, he was an executive director and/or responsible executive of three stockbroking firms. During that time, Mr Cato was involved in the formation of a number of companies, including writing prospectuses and managing the listing process and has been through the process of IPO listing in the dual role of broker and director. Since 2006, Mr Cato has been an executive and non-executive director of a number of public listed companies with a range of different business activities and was a founding director of Greenland Minerals Limited.
Relevant interest in shares None
Special Responsibilities Chairman of the Audit and Remuneration Committees
Other current directorships in listed entities
Non-Executive Chairman of Advanced Share Registry Limited (ASX:ASW) (since 22 August 2007) Non-Executive Director of Greenland Minerals Limited (ASX:GGG) (since 21 February 2006)
Former directorships in other listed entities in past 3 years
Non-Executive Director of Keybridge Capital Limited (ASX:KBC) (since 29 July 2016)
30 JUNE 2020 BENTLEY CAPITAL LIMITED A.B.N. 87 008 108 218
DIRECTORS’ STATUTORY REPORT
ANNUAL REPORT | 12
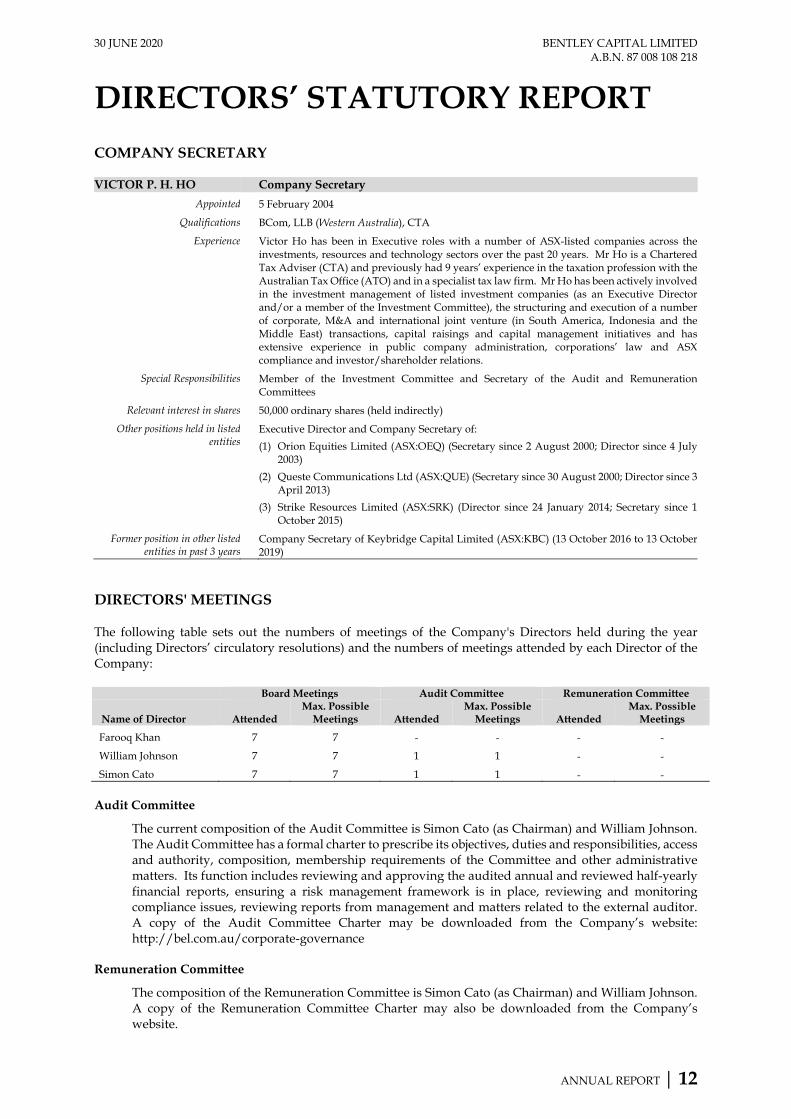
COMPANY SECRETARY VICTOR P. H. HO Company Secretary
Appointed 5 February 2004
Qualifications BCom, LLB (Western Australia), CTA
Experience Victor Ho has been in Executive roles with a number of ASX-listed companies across the investments, resources and technology sectors over the past 20 years. Mr Ho is a Chartered Tax Adviser (CTA) and previously had 9 years’ experience in the taxation profession with the Australian Tax Office (ATO) and in a specialist tax law firm. Mr Ho has been actively involved in the investment management of listed investment companies (as an Executive Director and/or a member of the Investment Committee), the structuring and execution of a number of corporate, M&A and international joint venture (in South America, Indonesia and the Middle East) transactions, capital raisings and capital management initiatives and has extensive experience in public company administration, corporations’ law and ASX compliance and investor/shareholder relations.
Special Responsibilities Member of the Investment Committee and Secretary of the Audit and Remuneration Committees
Relevant interest in shares 50,000 ordinary shares (held indirectly)
Other positions held in listed entities
Executive Director and Company Secretary of: (1) Orion Equities Limited (ASX:OEQ) (Secretary since 2 August 2000; Director since 4 July
2003) (2) Queste Communications Ltd (ASX:QUE) (Secretary since 30 August 2000; Director since 3
April 2013) (3) Strike Resources Limited (ASX:SRK) (Director since 24 January 2014; Secretary since 1
October 2015)
Former position in other listed entities in past 3 years
Company Secretary of Keybridge Capital Limited (ASX:KBC) (13 October 2016 to 13 October 2019)
DIRECTORS' MEETINGS The following table sets out the numbers of meetings of the Company's Directors held during the year (including Directors’ circulatory resolutions) and the numbers of meetings attended by each Director of the Company:
Board Meetings Audit Committee Remuneration Committee
Name of Director Attended Max. Possible
Meetings Attended Max. Possible
Meetings Attended Max. Possible
Meetings
Farooq Khan 7 7 - - - -
William Johnson 7 7 1 1 - -
Simon Cato 7 7 1 1 - - Audit Committee
The current composition of the Audit Committee is Simon Cato (as Chairman) and William Johnson. The Audit Committee has a formal charter to prescribe its objectives, duties and responsibilities, access and authority, composition, membership requirements of the Committee and other administrative matters. Its function includes reviewing and approving the audited annual and reviewed half-yearly financial reports, ensuring a risk management framework is in place, reviewing and monitoring compliance issues, reviewing reports from management and matters related to the external auditor. A copy of the Audit Committee Charter may be downloaded from the Company’s website: http://bel.com.au/corporate-governance
Remuneration Committee
The composition of the Remuneration Committee is Simon Cato (as Chairman) and William Johnson. A copy of the Remuneration Committee Charter may also be downloaded from the Company’s website.
30 JUNE 2020 BENTLEY CAPITAL LIMITED A.B.N. 87 008 108 218
REMUNERATION REPORT
ANNUAL REPORT | 13
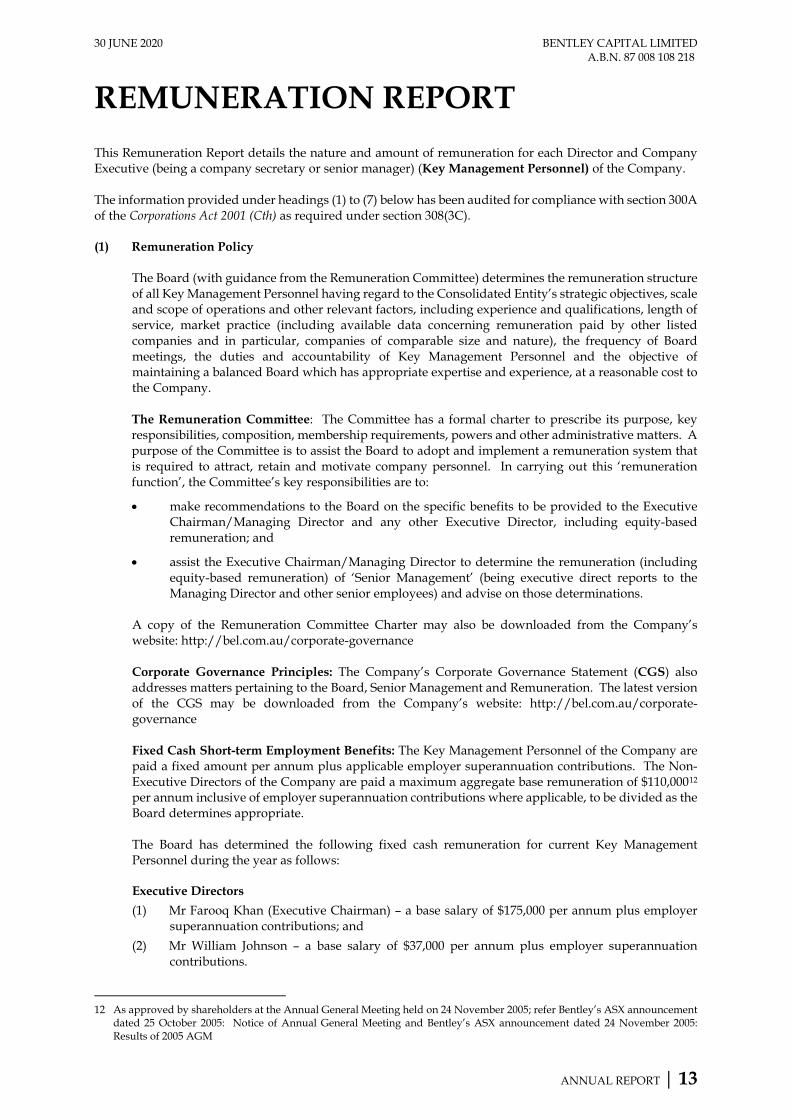
This Remuneration Report details the nature and amount of remuneration for each Director and Company Executive (being a company secretary or senior manager) (Key Management Personnel) of the Company. The information provided under headings (1) to (7) below has been audited for compliance with section 300A of the Corporations Act 2001 (Cth) as required under section 308(3C). (1) Remuneration Policy
The Board (with guidance from the Remuneration Committee) determines the remuneration structure of all Key Management Personnel having regard to the Consolidated Entity’s strategic objectives, scale and scope of operations and other relevant factors, including experience and qualifications, length of service, market practice (including available data concerning remuneration paid by other listed companies and in particular, companies of comparable size and nature), the frequency of Board meetings, the duties and accountability of Key Management Personnel and the objective of maintaining a balanced Board which has appropriate expertise and experience, at a reasonable cost to the Company. The Remuneration Committee: The Committee has a formal charter to prescribe its purpose, key responsibilities, composition, membership requirements, powers and other administrative matters. A purpose of the Committee is to assist the Board to adopt and implement a remuneration system that is required to attract, retain and motivate company personnel. In carrying out this ‘remuneration function’, the Committee’s key responsibilities are to:
• make recommendations to the Board on the specific benefits to be provided to the Executive Chairman/Managing Director and any other Executive Director, including equity-based remuneration; and
• assist the Executive Chairman/Managing Director to determine the remuneration (including equity-based remuneration) of ‘Senior Management’ (being executive direct reports to the Managing Director and other senior employees) and advise on those determinations.
A copy of the Remuneration Committee Charter may also be downloaded from the Company’s website: http://bel.com.au/corporate-governance Corporate Governance Principles: The Company’s Corporate Governance Statement (CGS) also addresses matters pertaining to the Board, Senior Management and Remuneration. The latest version of the CGS may be downloaded from the Company’s website: http://bel.com.au/corporate-governance Fixed Cash Short-term Employment Benefits: The Key Management Personnel of the Company are paid a fixed amount per annum plus applicable employer superannuation contributions. The Non-Executive Directors of the Company are paid a maximum aggregate base remuneration of $110,00012 per annum inclusive of employer superannuation contributions where applicable, to be divided as the Board determines appropriate. The Board has determined the following fixed cash remuneration for current Key Management Personnel during the year as follows: Executive Directors (1) Mr Farooq Khan (Executive Chairman) – a base salary of $175,000 per annum plus employer
superannuation contributions; and (2) Mr William Johnson – a base salary of $37,000 per annum plus employer superannuation
contributions.
12 As approved by shareholders at the Annual General Meeting held on 24 November 2005; refer Bentley’s ASX announcement
dated 25 October 2005: Notice of Annual General Meeting and Bentley’s ASX announcement dated 24 November 2005: Results of 2005 AGM
30 JUNE 2020 BENTLEY CAPITAL LIMITED A.B.N. 87 008 108 218
REMUNERATION REPORT
ANNUAL REPORT | 14
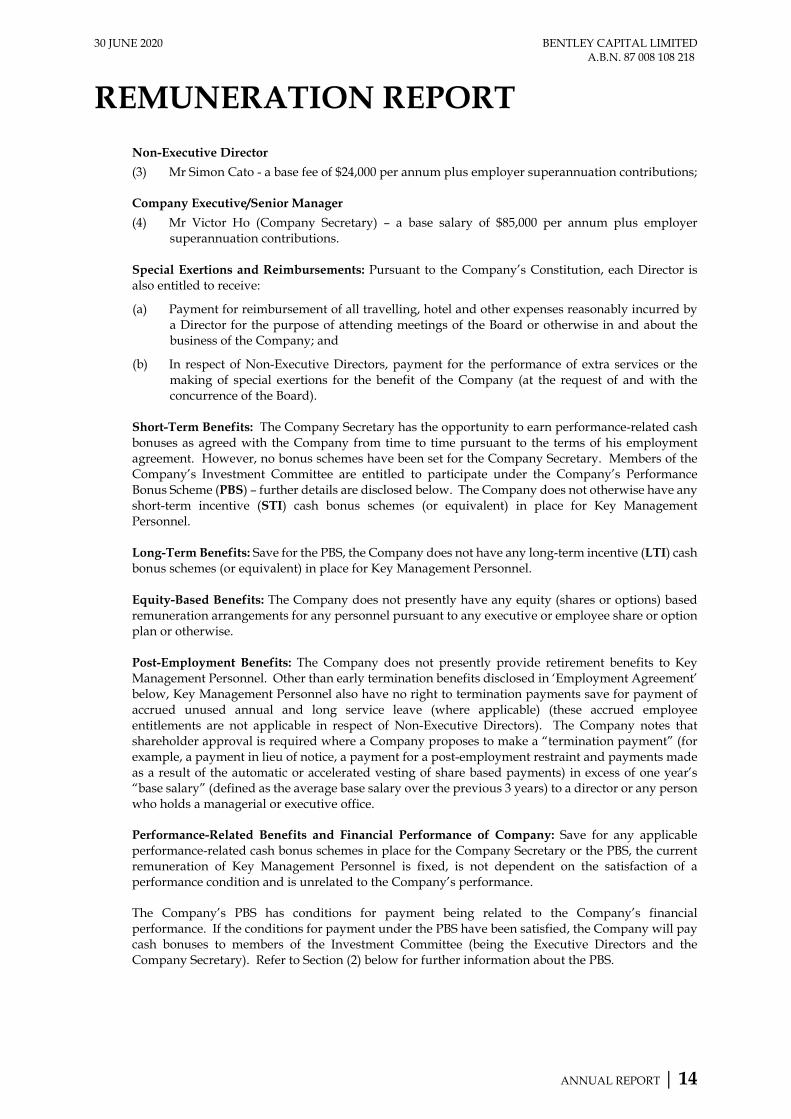
Non-Executive Director (3) Mr Simon Cato - a base fee of $24,000 per annum plus employer superannuation contributions; Company Executive/Senior Manager (4) Mr Victor Ho (Company Secretary) – a base salary of $85,000 per annum plus employer
superannuation contributions. Special Exertions and Reimbursements: Pursuant to the Company’s Constitution, each Director is also entitled to receive:
(a) Payment for reimbursement of all travelling, hotel and other expenses reasonably incurred by a Director for the purpose of attending meetings of the Board or otherwise in and about the business of the Company; and
(b) In respect of Non-Executive Directors, payment for the performance of extra services or the making of special exertions for the benefit of the Company (at the request of and with the concurrence of the Board).
Short-Term Benefits: The Company Secretary has the opportunity to earn performance-related cash bonuses as agreed with the Company from time to time pursuant to the terms of his employment agreement. However, no bonus schemes have been set for the Company Secretary. Members of the Company’s Investment Committee are entitled to participate under the Company’s Performance Bonus Scheme (PBS) – further details are disclosed below. The Company does not otherwise have any short-term incentive (STI) cash bonus schemes (or equivalent) in place for Key Management Personnel. Long-Term Benefits: Save for the PBS, the Company does not have any long-term incentive (LTI) cash bonus schemes (or equivalent) in place for Key Management Personnel. Equity-Based Benefits: The Company does not presently have any equity (shares or options) based remuneration arrangements for any personnel pursuant to any executive or employee share or option plan or otherwise. Post-Employment Benefits: The Company does not presently provide retirement benefits to Key Management Personnel. Other than early termination benefits disclosed in ‘Employment Agreement’ below, Key Management Personnel also have no right to termination payments save for payment of accrued unused annual and long service leave (where applicable) (these accrued employee entitlements are not applicable in respect of Non-Executive Directors). The Company notes that shareholder approval is required where a Company proposes to make a “termination payment” (for example, a payment in lieu of notice, a payment for a post-employment restraint and payments made as a result of the automatic or accelerated vesting of share based payments) in excess of one year’s “base salary” (defined as the average base salary over the previous 3 years) to a director or any person who holds a managerial or executive office. Performance-Related Benefits and Financial Performance of Company: Save for any applicable performance-related cash bonus schemes in place for the Company Secretary or the PBS, the current remuneration of Key Management Personnel is fixed, is not dependent on the satisfaction of a performance condition and is unrelated to the Company’s performance. The Company’s PBS has conditions for payment being related to the Company’s financial performance. If the conditions for payment under the PBS have been satisfied, the Company will pay cash bonuses to members of the Investment Committee (being the Executive Directors and the Company Secretary). Refer to Section (2) below for further information about the PBS.
30 JUNE 2020 BENTLEY CAPITAL LIMITED A.B.N. 87 008 108 218
REMUNERATION REPORT
ANNUAL REPORT | 15
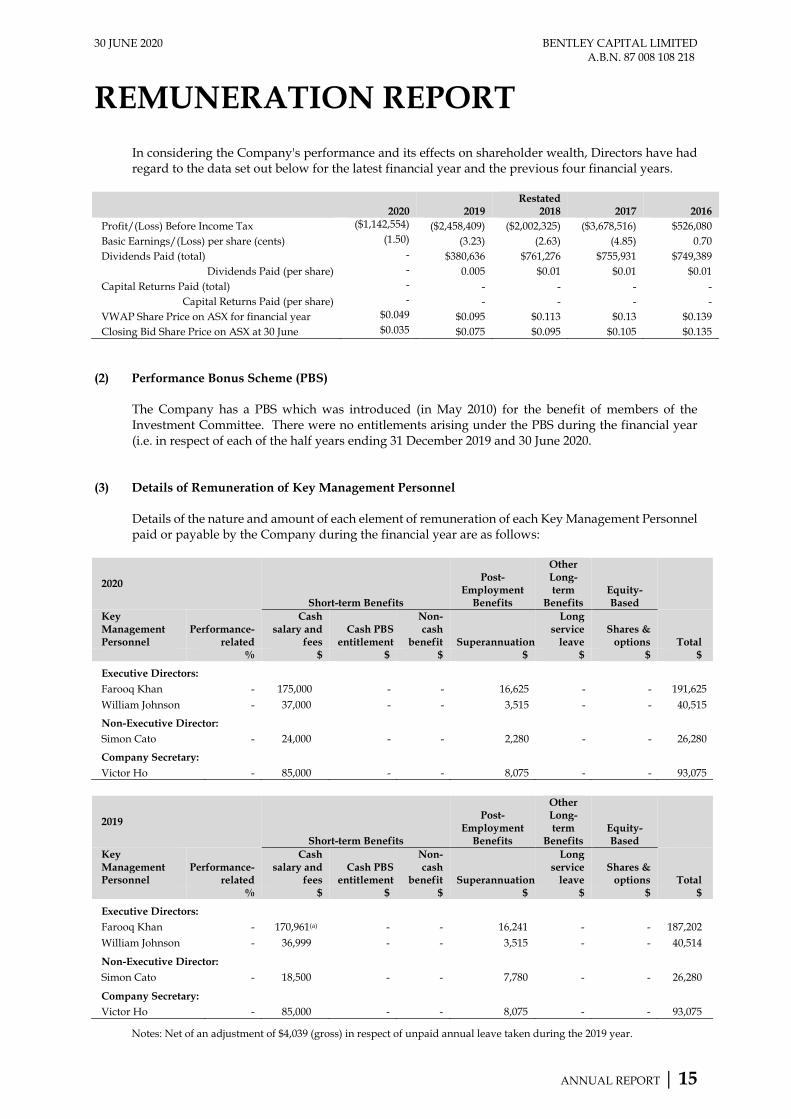
In considering the Company's performance and its effects on shareholder wealth, Directors have had regard to the data set out below for the latest financial year and the previous four financial years.
2020 2019 Restated
2018 2017 2016 Profit/(Loss) Before Income Tax ($1,142,554) ($2,458,409) ($2,002,325) ($3,678,516) $526,080 Basic Earnings/(Loss) per share (cents) (1.50) (3.23) (2.63) (4.85) 0.70 Dividends Paid (total) - $380,636 $761,276 $755,931 $749,389
Dividends Paid (per share) - 0.005 $0.01 $0.01 $0.01 Capital Returns Paid (total) - - - - -
Capital Returns Paid (per share) - - - - - VWAP Share Price on ASX for financial year $0.049 $0.095 $0.113 $0.13 $0.139 Closing Bid Share Price on ASX at 30 June $0.035 $0.075 $0.095 $0.105 $0.135
(2) Performance Bonus Scheme (PBS) The Company has a PBS which was introduced (in May 2010) for the benefit of members of the Investment Committee. There were no entitlements arising under the PBS during the financial year (i.e. in respect of each of the half years ending 31 December 2019 and 30 June 2020.
(3) Details of Remuneration of Key Management Personnel
Details of the nature and amount of each element of remuneration of each Key Management Personnel paid or payable by the Company during the financial year are as follows:
2020
Short-term Benefits
Post- Employment
Benefits
Other Long-term
Benefits Equity- Based
Key Management Personnel
Performance- related
Cash salary and
fees Cash PBS
entitlement
Non-cash
benefit Superannuation
Long service
leave Shares &
options Total % $ $ $ $ $ $ $
Executive Directors: Farooq Khan - 175,000 - - 16,625 - - 191,625 William Johnson - 37,000 - - 3,515 - - 40,515
Non-Executive Director: Simon Cato - 24,000 - - 2,280 - - 26,280
Company Secretary: Victor Ho - 85,000 - - 8,075 - - 93,075
2019
Short-term Benefits
Post- Employment
Benefits
Other Long-term
Benefits Equity- Based
Key Management Personnel
Performance- related
Cash salary and
fees Cash PBS
entitlement
Non-cash
benefit Superannuation
Long service
leave Shares &
options Total % $ $ $ $ $ $ $
Executive Directors: Farooq Khan - 170,961(a) - - 16,241 - - 187,202 William Johnson - 36,999 - - 3,515 - - 40,514
Non-Executive Director: Simon Cato - 18,500 - - 7,780 - - 26,280
Company Secretary: Victor Ho - 85,000 - - 8,075 - - 93,075
Notes: Net of an adjustment of $4,039 (gross) in respect of unpaid annual leave taken during the 2019 year.
30 JUNE 2020 BENTLEY CAPITAL LIMITED A.B.N. 87 008 108 218
REMUNERATION REPORT
ANNUAL REPORT | 16
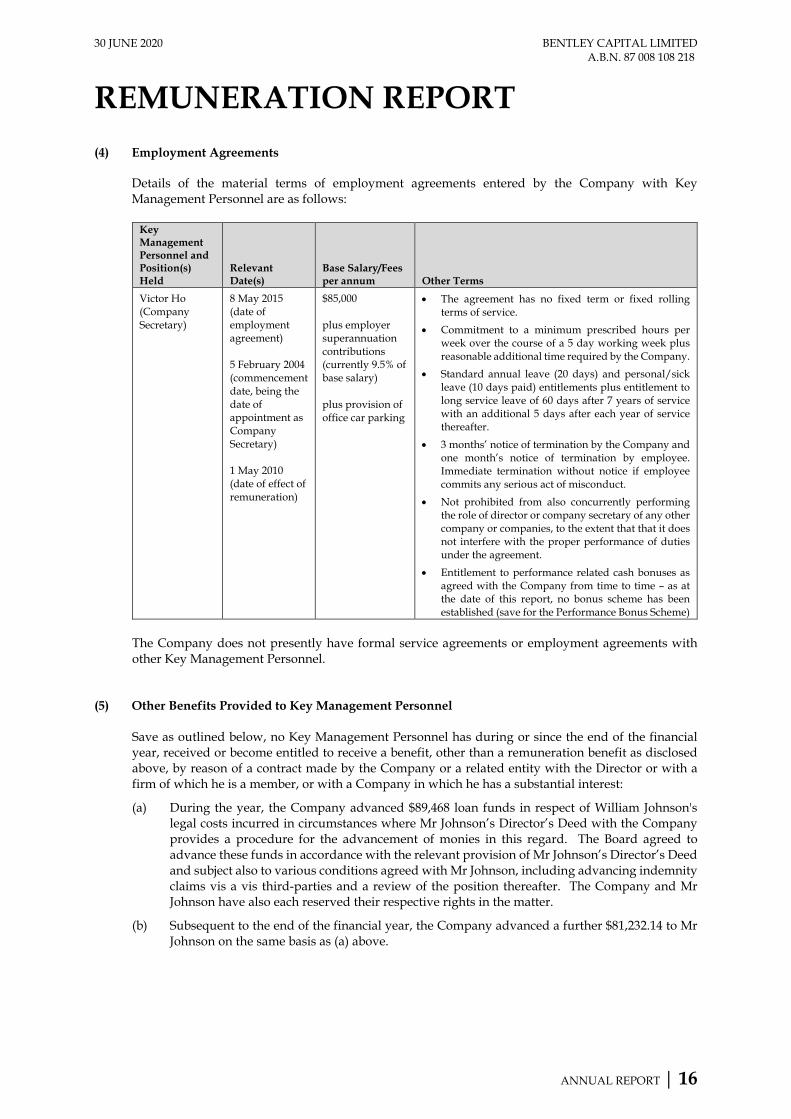
(4) Employment Agreements
Details of the material terms of employment agreements entered by the Company with Key Management Personnel are as follows:
Key Management Personnel and Position(s) Held
Relevant Date(s)
Base Salary/Fees per annum Other Terms
Victor Ho (Company Secretary)
8 May 2015 (date of employment agreement)
5 February 2004 (commencement date, being the date of appointment as Company Secretary)
1 May 2010 (date of effect of remuneration)
$85,000
plus employer superannuation contributions (currently 9.5% of base salary)
plus provision of office car parking
• The agreement has no fixed term or fixed rolling terms of service.
• Commitment to a minimum prescribed hours per week over the course of a 5 day working week plus reasonable additional time required by the Company.
• Standard annual leave (20 days) and personal/sick leave (10 days paid) entitlements plus entitlement to long service leave of 60 days after 7 years of service with an additional 5 days after each year of service thereafter.
• 3 months’ notice of termination by the Company and one month’s notice of termination by employee. Immediate termination without notice if employee commits any serious act of misconduct.
• Not prohibited from also concurrently performing the role of director or company secretary of any other company or companies, to the extent that that it does not interfere with the proper performance of duties under the agreement.
• Entitlement to performance related cash bonuses as agreed with the Company from time to time – as at the date of this report, no bonus scheme has been established (save for the Performance Bonus Scheme)
The Company does not presently have formal service agreements or employment agreements with other Key Management Personnel.
(5) Other Benefits Provided to Key Management Personnel
Save as outlined below, no Key Management Personnel has during or since the end of the financial year, received or become entitled to receive a benefit, other than a remuneration benefit as disclosed above, by reason of a contract made by the Company or a related entity with the Director or with a firm of which he is a member, or with a Company in which he has a substantial interest:
(a) During the year, the Company advanced $89,468 loan funds in respect of William Johnson's legal costs incurred in circumstances where Mr Johnson’s Director’s Deed with the Company provides a procedure for the advancement of monies in this regard. The Board agreed to advance these funds in accordance with the relevant provision of Mr Johnson’s Director’s Deed and subject also to various conditions agreed with Mr Johnson, including advancing indemnity claims vis a vis third-parties and a review of the position thereafter. The Company and Mr Johnson have also each reserved their respective rights in the matter.
(b) Subsequent to the end of the financial year, the Company advanced a further $81,232.14 to Mr Johnson on the same basis as (a) above.
30 JUNE 2020 BENTLEY CAPITAL LIMITED A.B.N. 87 008 108 218
REMUNERATION REPORT
ANNUAL REPORT | 17
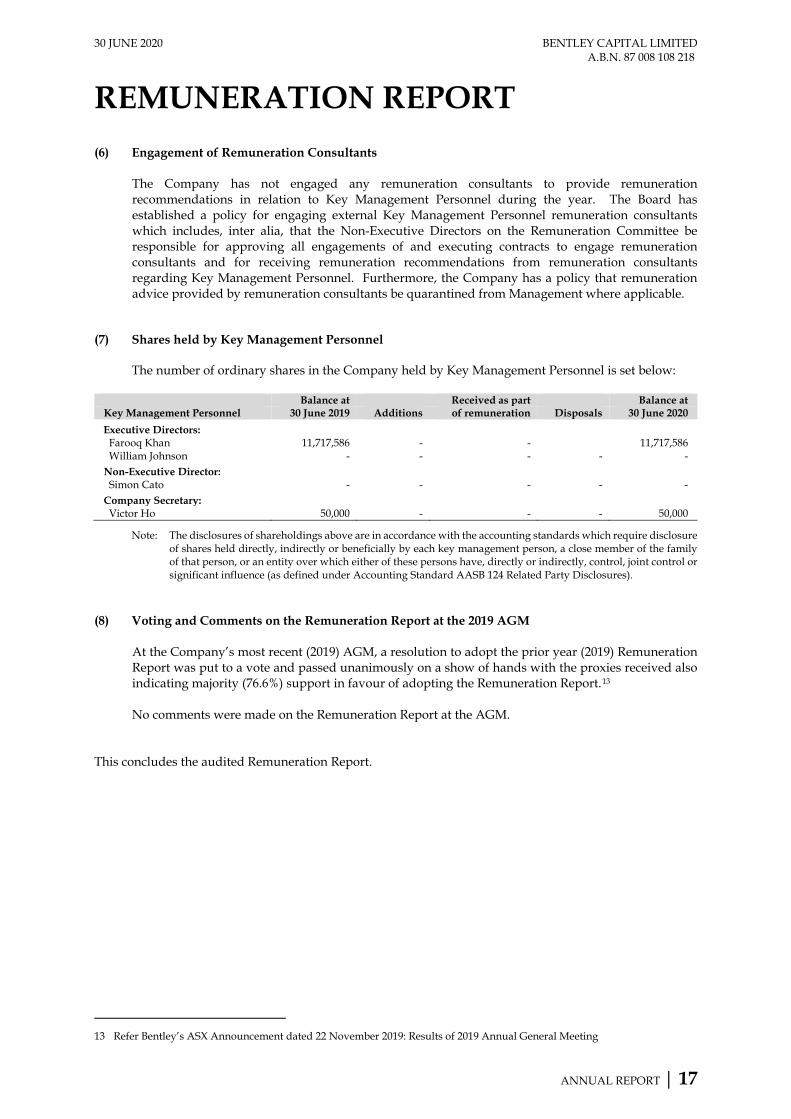
(6) Engagement of Remuneration Consultants The Company has not engaged any remuneration consultants to provide remuneration recommendations in relation to Key Management Personnel during the year. The Board has established a policy for engaging external Key Management Personnel remuneration consultants which includes, inter alia, that the Non-Executive Directors on the Remuneration Committee be responsible for approving all engagements of and executing contracts to engage remuneration consultants and for receiving remuneration recommendations from remuneration consultants regarding Key Management Personnel. Furthermore, the Company has a policy that remuneration advice provided by remuneration consultants be quarantined from Management where applicable.
(7) Shares held by Key Management Personnel
The number of ordinary shares in the Company held by Key Management Personnel is set below:
Balance at Received as part Balance at Key Management Personnel 30 June 2019 Additions of remuneration Disposals 30 June 2020 Executive Directors:
Farooq Khan 11,717,586 - - 11,717,586 William Johnson - - - - -
Non-Executive Director: Simon Cato - - - - -
Company Secretary: Victor Ho 50,000 - - - 50,000
Note: The disclosures of shareholdings above are in accordance with the accounting standards which require disclosure of shares held directly, indirectly or beneficially by each key management person, a close member of the family of that person, or an entity over which either of these persons have, directly or indirectly, control, joint control or significant influence (as defined under Accounting Standard AASB 124 Related Party Disclosures).
(8) Voting and Comments on the Remuneration Report at the 2019 AGM
At the Company’s most recent (2019) AGM, a resolution to adopt the prior year (2019) Remuneration Report was put to a vote and passed unanimously on a show of hands with the proxies received also indicating majority (76.6%) support in favour of adopting the Remuneration Report.13 No comments were made on the Remuneration Report at the AGM.
This concludes the audited Remuneration Report.
13 Refer Bentley’s ASX Announcement dated 22 November 2019: Results of 2019 Annual General Meeting
30 JUNE 2020 BENTLEY CAPITAL LIMITED A.B.N. 87 008 108 218
DIRECTORS’ STATUTORY REPORT
ANNUAL REPORT | 18
DIRECTORS’ AND OFFICERS’ INSURANCE The Company insures Directors and Officers against liability they may incur in respect of any wrongful acts or omissions made by them in such capacity (to the extent permitted by the Corporations Act 2001 (Cth)) (D&O Policy). Details of the amount of the premium paid in respect of the insurance policy is not disclosed as such disclosure is prohibited under the terms of the contract. DIRECTORS’ AND OFFICERS’ DEEDS In addition to the rights of indemnity provided under the Company’s Constitution (to the extent permitted by the Corporations Act 2001 (Cth)), the Company has also entered into a deed with each of the Directors and the Company Secretary (Officer) to regulate certain matters between the Company and each Officer, both during the time the Officer holds office and after the Officer ceases to be an officer of the Company, including the following matters:
(a) The Company’s obligation to indemnify an Officer for liabilities or legal costs incurred as an officer of the Company (to the extent permitted by the Corporations Act 2001 (Cth)); and
(b) Subject to the terms of the deed and the Corporations Act 2001 (Cth), the Company may advance monies to the Officer to meet any costs or expenses of the Officer incurred in circumstances relating to the indemnities provided under the deed and prior to the outcome of any legal proceedings brought against the Officer.
Refer also to Section 5(a) and (b) of the Remuneration Report for details of the Company’s advance of loan funds in respect of a Director’s legal costs incurred in circumstances where the Director’s Deed with the Company provides a procedure for the advancement of monies in this regard. LEGAL PROCEEDINGS ON BEHALF OF COMPANY No person has applied for leave of a court to bring proceedings on behalf of the Company or intervene in any proceedings to which the Company is a party for the purpose of taking responsibility on behalf of the Company for all or any part of such proceedings. The Company was not a party to any such proceedings during and since the financial year. AUDITORS Details of the amounts paid or payable to the Auditors for audit and non-audit services provided during the financial year are set out below:
Audit & Review Fees Non-Audit Services Total Auditor $ $ $ Rothsay Auditing $22,000 - $22,000
The Board is satisfied that the provision of non-audit services by the auditor during the year is compatible with the general standard of independence for auditors imposed by the Corporations Act 2001 (Cth). The Board is satisfied that the nature of the non-audit services disclosed above did not compromise the general principles relating to auditor independence as set out in the Institute of Chartered Accountants in Australia and APES 110 Code of Ethics for Professional Accountants: Professional Independence, including reviewing or auditing the auditor’s own work, acting in a management or decision making capacity for the Company, acting as advocate for the Company or jointly sharing economic risk and rewards. Rothsay Auditing continues in office in accordance with section 327 of the Corporations Act 2001 (Cth).
30 JUNE 2020 BENTLEY CAPITAL LIMITED A.B.N. 87 008 108 218
DIRECTORS’ STATUTORY REPORT
ANNUAL REPORT | 19
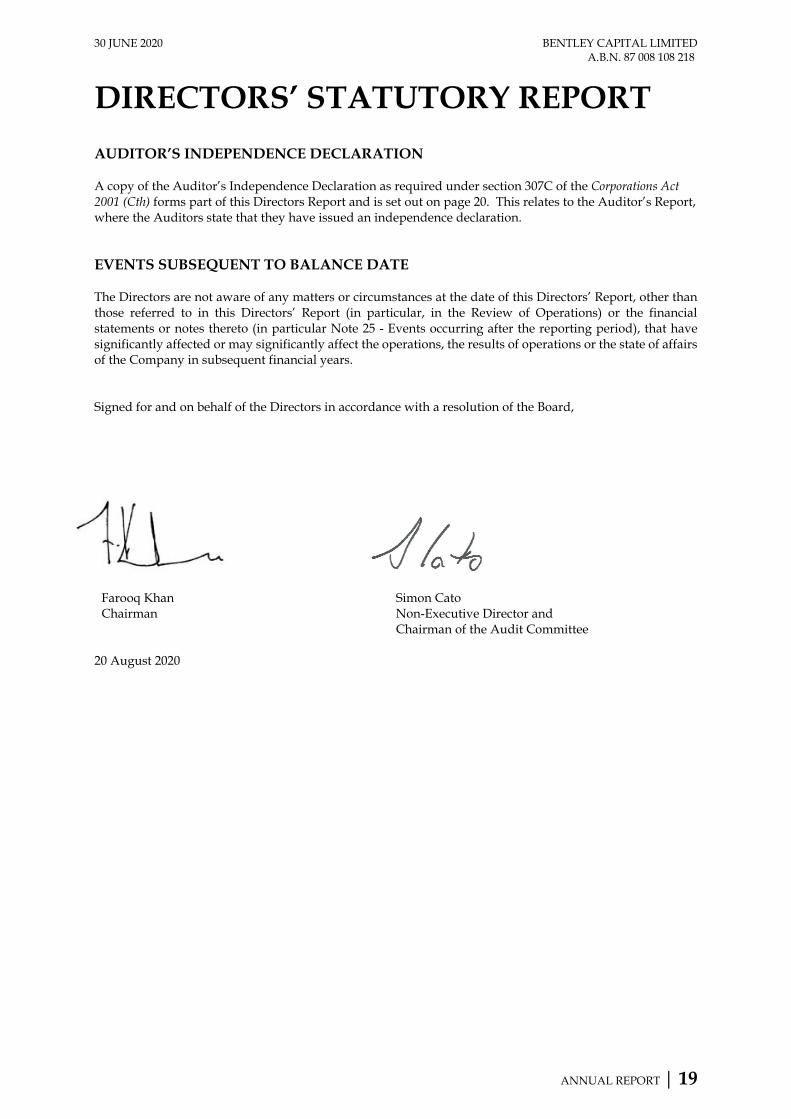
AUDITOR’S INDEPENDENCE DECLARATION A copy of the Auditor’s Independence Declaration as required under section 307C of the Corporations Act 2001 (Cth) forms part of this Directors Report and is set out on page 20. This relates to the Auditor’s Report, where the Auditors state that they have issued an independence declaration. EVENTS SUBSEQUENT TO BALANCE DATE The Directors are not aware of any matters or circumstances at the date of this Directors’ Report, other than those referred to in this Directors’ Report (in particular, in the Review of Operations) or the financial statements or notes thereto (in particular Note 25 - Events occurring after the reporting period), that have significantly affected or may significantly affect the operations, the results of operations or the state of affairs of the Company in subsequent financial years. Signed for and on behalf of the Directors in accordance with a resolution of the Board,
Farooq Khan Simon Cato Chairman Non-Executive Director and
Chairman of the Audit Committee 20 August 2020
The Directors
Bentley Capital Limited
Level 2
31 Ventnor Avenue
West Perth WA 6005
Dear Directors
In accordance with Section 307C of the Corporations Act 2001 (the "Act") I hereby declare that to the best
of my knowledge and belief there have been:
(i) no contraventions of the auditor independence requirements of the Act in relation to the audit of
the 30 June 2020 financial statements; and
(ii) no contraventions of any applicable code of professional conduct in relation to the review.
This declaration is in respect of Bentley Capital Limited and the entities it controlled during the year.
Daniel Dalla CA (Lead auditor)
Partner
Rothsay Auditing
Dated 20 August 2020
30 JUNE 2020 BENTLEY CAPITAL LIMITEDA.B.N. 87 008 108 218
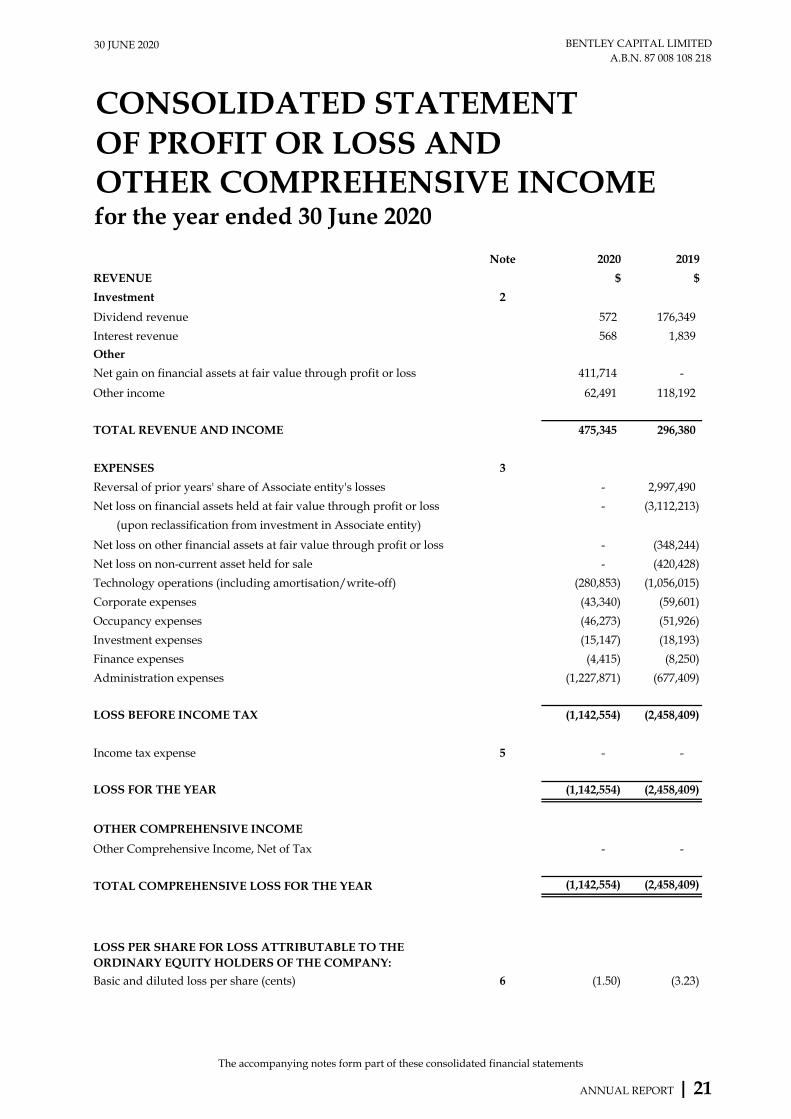
CONSOLIDATED STATEMENTOF PROFIT OR LOSS ANDOTHER COMPREHENSIVE INCOMEfor the year ended 30 June 2020
Note 2020 2019
REVENUE $ $
Investment 2
Dividend revenue 572 176,349
Interest revenue 568 1,839
Other
Net gain on financial assets at fair value through profit or loss 411,714 -
Other income 62,491 118,192
TOTAL REVENUE AND INCOME 475,345 296,380
EXPENSES 3
Reversal of prior years' share of Associate entity's losses - 2,997,490
Net loss on financial assets held at fair value through profit or loss - (3,112,213)
(upon reclassification from investment in Associate entity)
Net loss on other financial assets at fair value through profit or loss - (348,244)
Net loss on non-current asset held for sale - (420,428)
Technology operations (including amortisation/write-off) (280,853) (1,056,015)
Corporate expenses (43,340) (59,601)
Occupancy expenses (46,273) (51,926)
Investment expenses (15,147) (18,193)
Finance expenses (4,415) (8,250)
Administration expenses (1,227,871) (677,409)
LOSS BEFORE INCOME TAX (1,142,554) (2,458,409)
Income tax expense 5 - -
LOSS FOR THE YEAR (1,142,554) (2,458,409)
OTHER COMPREHENSIVE INCOME
Other Comprehensive Income, Net of Tax - -
TOTAL COMPREHENSIVE LOSS FOR THE YEAR (1,142,554) (2,458,409)
Basic and diluted loss per share (cents) 6 (1.50) (3.23)
LOSS PER SHARE FOR LOSS ATTRIBUTABLE TO THE ORDINARY EQUITY HOLDERS OF THE COMPANY:
The accompanying notes form part of these consolidated financial statements
ANNUAL REPORT | 21
30 JUNE 2020 BENTLEY CAPITAL LIMITEDA.B.N. 87 008 108 218
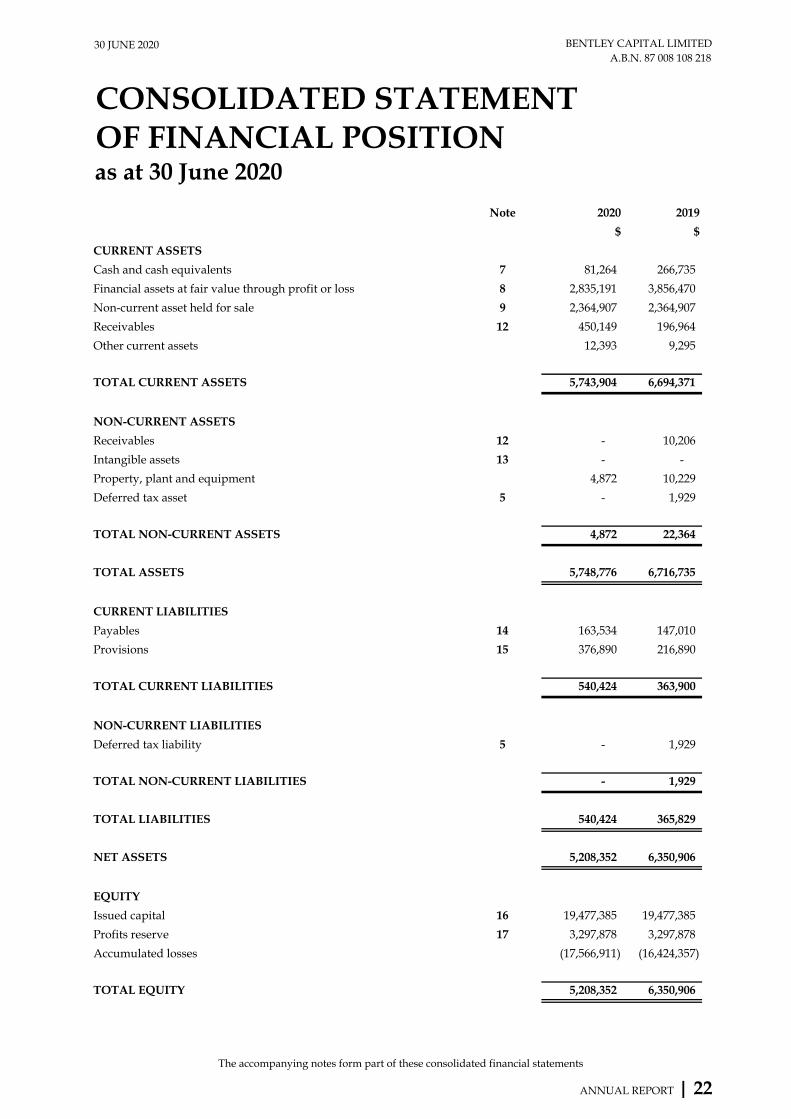
as at 30 June 2020
Note 2020 2019
$ $
CURRENT ASSETS
Cash and cash equivalents 7 81,264 266,735
Financial assets at fair value through profit or loss 8 2,835,191 3,856,470
Non-current asset held for sale 9 2,364,907 2,364,907
Receivables 12 450,149 196,964
Other current assets 12,393 9,295
TOTAL CURRENT ASSETS 5,743,904 6,694,371
NON-CURRENT ASSETS
Receivables 12 - 10,206
Intangible assets 13 - -
Property, plant and equipment 4,872 10,229
Deferred tax asset 5 - 1,929
TOTAL NON-CURRENT ASSETS 4,872 22,364
TOTAL ASSETS 5,748,776 6,716,735
CURRENT LIABILITIES
Payables 14 163,534 147,010
Provisions 15 376,890 216,890
TOTAL CURRENT LIABILITIES 540,424 363,900
NON-CURRENT LIABILITIES
Deferred tax liability 5 - 1,929
TOTAL NON-CURRENT LIABILITIES - 1,929
TOTAL LIABILITIES 540,424 365,829
NET ASSETS 5,208,352 6,350,906
EQUITY
Issued capital 16 19,477,385 19,477,385
Profits reserve 17 3,297,878 3,297,878
Accumulated losses (17,566,911) (16,424,357)
TOTAL EQUITY 5,208,352 6,350,906
OF FINANCIAL POSITIONCONSOLIDATED STATEMENT
The accompanying notes form part of these consolidated financial statements
ANNUAL REPORT | 22
30 JUNE 2020 BENTLEY CAPITAL LIMITEDA.B.N. 87 008 108 218
Note
$ $ $ $
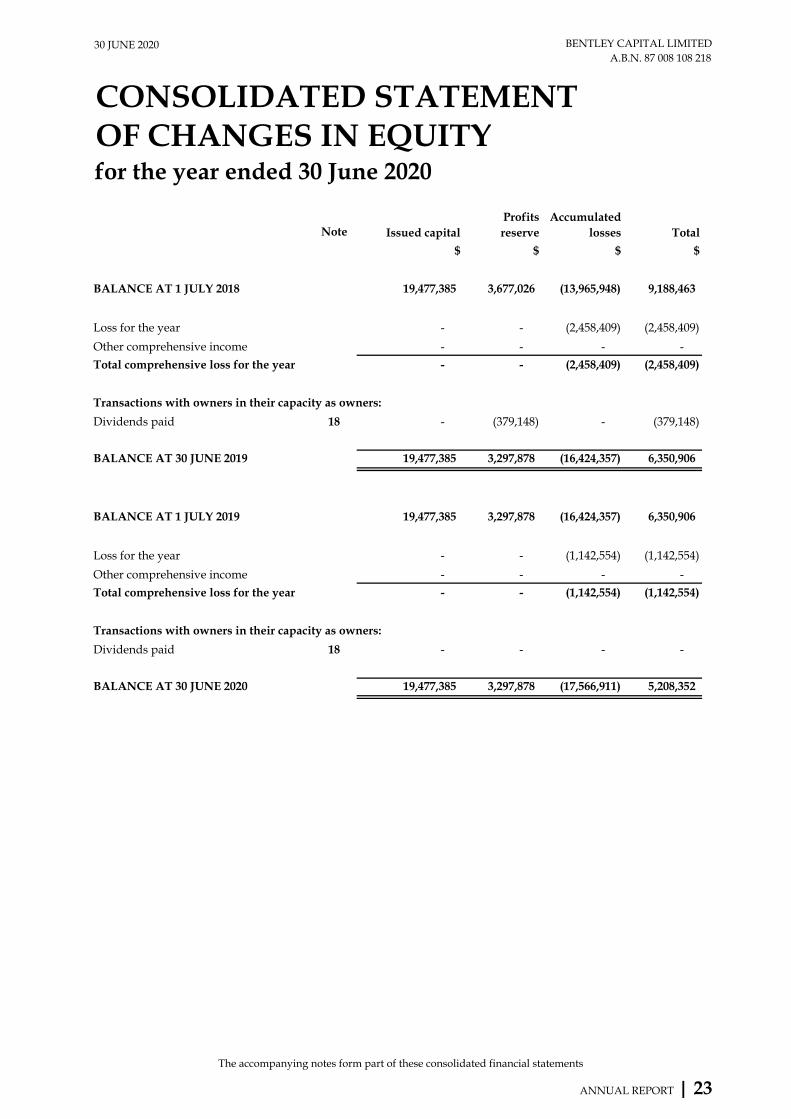
BALANCE AT 1 JULY 2018 19,477,385 3,677,026 (13,965,948) 9,188,463
Loss for the year - - (2,458,409) (2,458,409)
Other comprehensive income - - - -
Total comprehensive loss for the year - - (2,458,409) (2,458,409)
Transactions with owners in their capacity as owners:
Dividends paid 18 - (379,148) - (379,148)
BALANCE AT 30 JUNE 2019 19,477,385 3,297,878 (16,424,357) 6,350,906
BALANCE AT 1 JULY 2019 19,477,385 3,297,878 (16,424,357) 6,350,906
Loss for the year - - (1,142,554) (1,142,554)
Other comprehensive income - - - -
Total comprehensive loss for the year - - (1,142,554) (1,142,554)
Transactions with owners in their capacity as owners:
Dividends paid 18 - - - -
BALANCE AT 30 JUNE 2020 19,477,385 3,297,878 (17,566,911) 5,208,352
CONSOLIDATED STATEMENTOF CHANGES IN EQUITYfor the year ended 30 June 2020
Profits reserve
Accumulated losses TotalIssued capital
The accompanying notes form part of these consolidated financial statements
ANNUAL REPORT | 23
30 JUNE 2020 BENTLEY CAPITAL LIMITEDA.B.N. 87 008 108 218
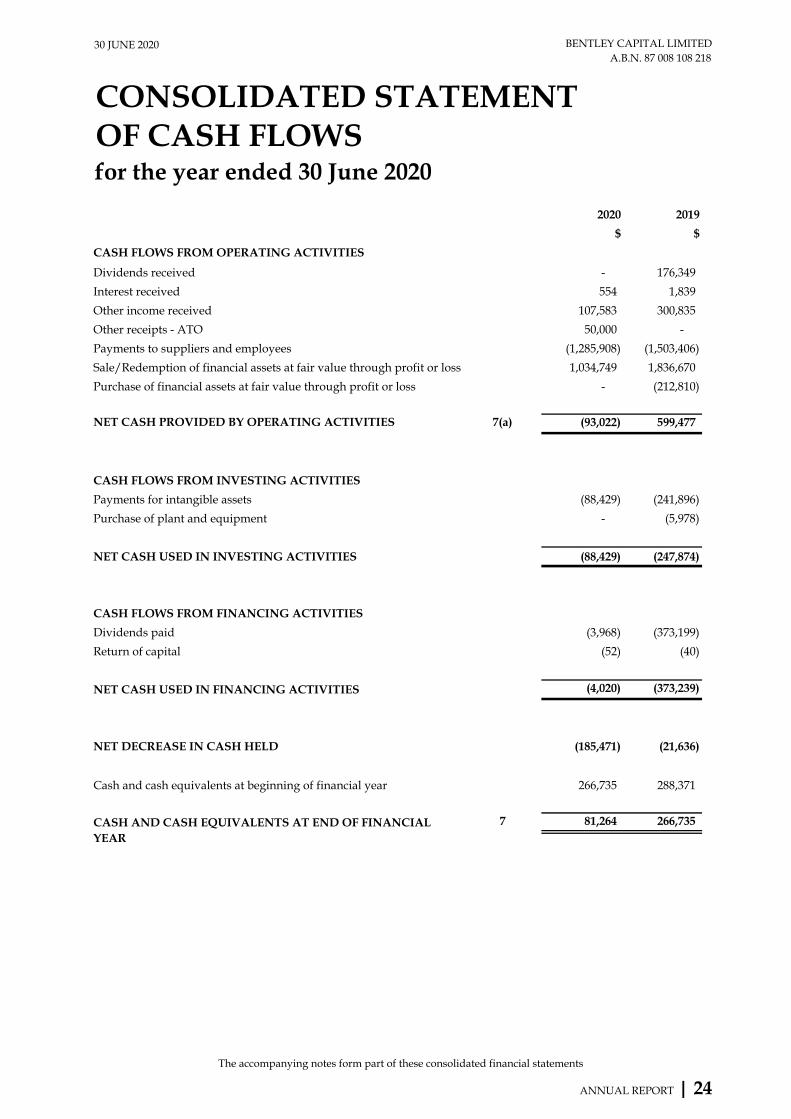
CONSOLIDATED STATEMENTOF CASH FLOWSfor the year ended 30 June 2020
2020 2019
$ $
Dividends received - 176,349
Interest received 554 1,839
Other income received 107,583 300,835
Other receipts - ATO 50,000 -
Payments to suppliers and employees (1,285,908) (1,503,406)
Sale/Redemption of financial assets at fair value through profit or loss 1,034,749 1,836,670
Purchase of financial assets at fair value through profit or loss - (212,810)
7(a) (93,022) 599,477
CASH FLOWS FROM INVESTING ACTIVITIES
Payments for intangible assets (88,429) (241,896)
Purchase of plant and equipment - (5,978)
NET CASH USED IN INVESTING ACTIVITIES (88,429) (247,874)
CASH FLOWS FROM FINANCING ACTIVITIES
Dividends paid (3,968) (373,199)
Return of capital (52) (40)
NET CASH USED IN FINANCING ACTIVITIES (4,020) (373,239)
NET DECREASE IN CASH HELD (185,471) (21,636)
Cash and cash equivalents at beginning of financial year 266,735 288,371
7 81,264 266,735
CASH FLOWS FROM OPERATING ACTIVITIES
NET CASH PROVIDED BY OPERATING ACTIVITIES
CASH AND CASH EQUIVALENTS AT END OF FINANCIAL YEAR
The accompanying notes form part of these consolidated financial statements
ANNUAL REPORT | 24
30 JUNE 2020 BENTLEY CAPITAL LIMITED A.B.N. 87 008 108 218
NOTES TO THE CONSOLIDATED FINANCIAL STATEMENTS for the year ended 30 June 2020
ANNUAL REPORT | 25
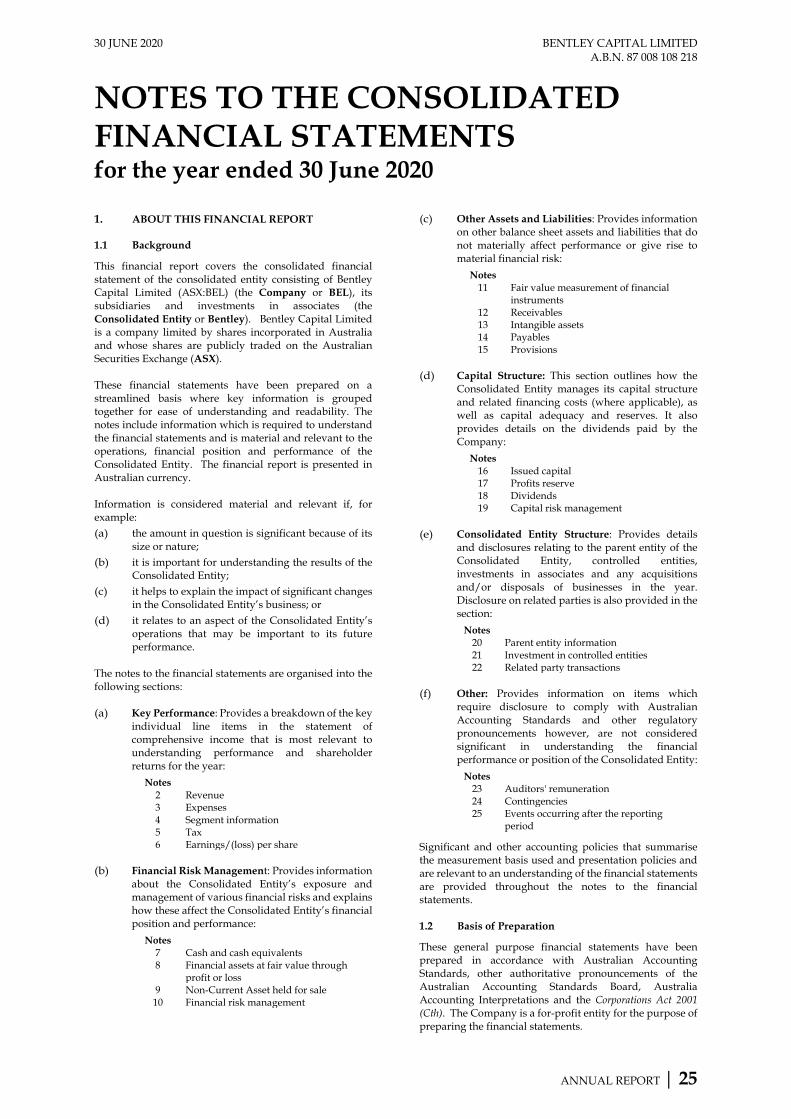
1. ABOUT THIS FINANCIAL REPORT 1.1 Background
This financial report covers the consolidated financial statement of the consolidated entity consisting of Bentley Capital Limited (ASX:BEL) (the Company or BEL), its subsidiaries and investments in associates (the Consolidated Entity or Bentley). Bentley Capital Limited is a company limited by shares incorporated in Australia and whose shares are publicly traded on the Australian Securities Exchange (ASX).
These financial statements have been prepared on a streamlined basis where key information is grouped together for ease of understanding and readability. The notes include information which is required to understand the financial statements and is material and relevant to the operations, financial position and performance of the Consolidated Entity. The financial report is presented in Australian currency. Information is considered material and relevant if, for example: (a) the amount in question is significant because of its
size or nature; (b) it is important for understanding the results of the
Consolidated Entity; (c) it helps to explain the impact of significant changes
in the Consolidated Entity’s business; or (d) it relates to an aspect of the Consolidated Entity’s
operations that may be important to its future performance.
The notes to the financial statements are organised into the following sections: (a) Key Performance: Provides a breakdown of the key
individual line items in the statement of comprehensive income that is most relevant to understanding performance and shareholder returns for the year:
Notes 2 Revenue 3 Expenses 4 Segment information 5 Tax 6 Earnings/(loss) per share
(b) Financial Risk Management: Provides information
about the Consolidated Entity’s exposure and management of various financial risks and explains how these affect the Consolidated Entity’s financial position and performance:
Notes 7 Cash and cash equivalents 8 Financial assets at fair value through
profit or loss 9 Non-Current Asset held for sale 10 Financial risk management
(c) Other Assets and Liabilities: Provides information on other balance sheet assets and liabilities that do not materially affect performance or give rise to material financial risk:
Notes 11 Fair value measurement of financial
instruments 12 Receivables 13 Intangible assets 14 Payables 15 Provisions
(d) Capital Structure: This section outlines how the
Consolidated Entity manages its capital structure and related financing costs (where applicable), as well as capital adequacy and reserves. It also provides details on the dividends paid by the Company:
Notes 16 Issued capital 17 Profits reserve 18 Dividends 19 Capital risk management
(e) Consolidated Entity Structure: Provides details
and disclosures relating to the parent entity of the Consolidated Entity, controlled entities, investments in associates and any acquisitions and/or disposals of businesses in the year. Disclosure on related parties is also provided in the section:
Notes 20 Parent entity information 21 Investment in controlled entities 22 Related party transactions
(f) Other: Provides information on items which
require disclosure to comply with Australian Accounting Standards and other regulatory pronouncements however, are not considered significant in understanding the financial performance or position of the Consolidated Entity:
Notes 23 Auditors' remuneration 24 Contingencies 25 Events occurring after the reporting
period
Significant and other accounting policies that summarise the measurement basis used and presentation policies and are relevant to an understanding of the financial statements are provided throughout the notes to the financial statements. 1.2 Basis of Preparation
These general purpose financial statements have been prepared in accordance with Australian Accounting Standards, other authoritative pronouncements of the Australian Accounting Standards Board, Australia Accounting Interpretations and the Corporations Act 2001 (Cth). The Company is a for-profit entity for the purpose of preparing the financial statements.
30 JUNE 2020 BENTLEY CAPITAL LIMITED A.B.N. 87 008 108 218
NOTES TO THE CONSOLIDATED FINANCIAL STATEMENTS for the year ended 30 June 2020
ANNUAL REPORT | 26
Compliance with International Financial Reporting Standards (IFRS)
The consolidated financial statements of the Consolidated Entity comply with International Financial Reporting Standards (IFRS) as issued by the International Accounting Standards Board (IASB). Reporting Basis and Financial Statement Presentation
The financial report has been prepared on a going concern basis and is based on historical costs modified by the revaluation of financial assets and financial liabilities for which the fair value basis of accounting has been applied. The principal accounting policies adopted in the preparation of these financial statements have been consistently applied to all the years presented, unless otherwise stated. 1.3 Principles of Consolidation
The consolidated financial statements incorporate the assets and liabilities of the Company as at 30 June 2020 and the results of its subsidiaries for the year then ended. The Company and its subsidiaries are referred to in this financial report as Bentley or the Consolidated Entity. All inter-company balances and transactions between entities in the Consolidated Entity, including any unrealised profits or losses, have been eliminated on consolidation.
1.4 Comparative Figures
Where required by the Accounting Standards, comparative figures have been adjusted to conform to changes in presentation for the current financial period. 1.5 Goods and Services Tax (GST)
Revenues, expenses and assets are recognised net of the amount of GST, except where the amount of GST incurred is not recoverable from the Australian Tax Office. In these circumstances the GST is recognised as part of the cost of acquisition of the asset or as part of an item of the expense. Receivables and payables in the balance sheet are shown inclusive of GST. Cash flows are presented in the Statement of Cash Flows on a gross basis, except for the GST component of investing and financing activities, which are disclosed as operating cash flows. 1.6 Leases
At the lease commencement, the Consolidated Entity recognises a right-of-use asset and associated lease liability for the lease term. The lease term includes extension periods where the Consolidated Entity believes it is reasonably certain that the option will be exercised. The right-of-use asset is measured using the cost model where cost on initial recognition comprises of the lease liability, initial direct costs, prepaid lease payments,
estimated cost of removal and restoration less any lease incentives received. The right-of-use asset is depreciated over the lease term on a straight-line basis and assessed for impairment in accordance with the impairment of assets accounting policy. The lease liability is initially measured at the present value of the remaining lease payments at the commencement of the lease. The discount rate is the rate implicit in the lease, however where this cannot be readily determined then the Consolidated Entity’s incremental borrowing rate is used. Subsequent to initial recognition, the lease liability is measured at amortised cost using the effective interest rate method. The lease liability is remeasured whether there is a lease modification, change in estimate of the lease term or index upon which the lease payments are based (e.g. CPI) or a change in the Consolidated Entity’s assessment of lease term. Where the lease liability is remeasured, the right-of-use asset is adjusted to reflect the re-measurement or is recorded in profit or loss if the carrying amount of the right-of-use asset has been reduced to zero. Exceptions to lease accounting
The Consolidated Entity has elected to apply the exceptions to lease accounting for both short-term leases (i.e. leases with a term of less than or equal to 12 months) and leases of low-value assets. The Consolidated Entity recognises the payments associated with these leases as an expense on a straight-line basis over the lease term. 1.7 New, revised or amending Accounting Standards
and Interpretations adopted
The Consolidated Entity has adopted all of the new, revised or amending Accounting Standards and Interpretations issued by the AASB that are mandatory for the current reporting period. Any new, revised or amending Accounting Standards or Interpretations that are not mandatory have not been early adopted. These are not expected to have a material impact on the Consolidated Entity’s financial statements.
30 JUNE 2020 BENTLEY CAPITAL LIMITEDA.B.N. 87 008 108 218
NOTES TO THE CONSOLIDATEDFINANCIAL STATEMENTSfor the year ended 30 June 2020
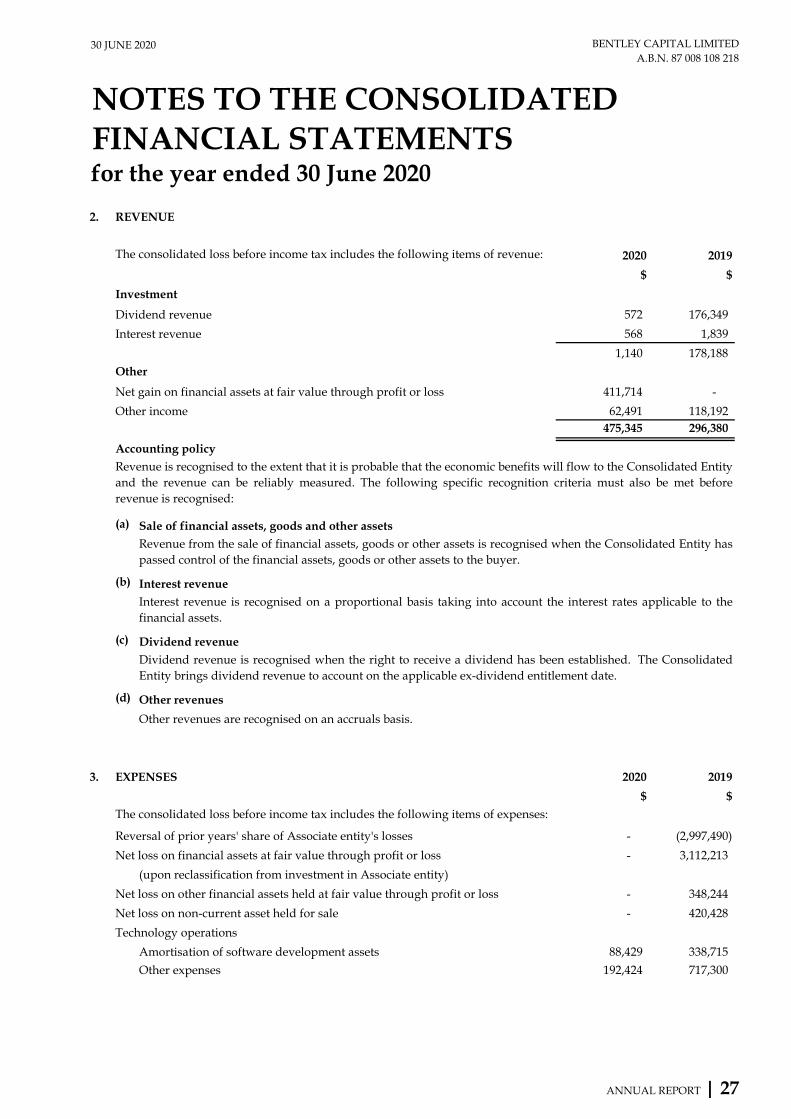
2. REVENUE
2020 2019
$ $
Investment
Dividend revenue 572 176,349
Interest revenue 568 1,839
1,140 178,188
Other
Net gain on financial assets at fair value through profit or loss 411,714 -
Other income 62,491 118,192 475,345 296,380
Accounting policy
(a) Sale of financial assets, goods and other assets
(b) Interest revenue
(c) Dividend revenue
(d) Other revenues
Other revenues are recognised on an accruals basis.
3. EXPENSES 2020 2019
$ $The consolidated loss before income tax includes the following items of expenses:
Reversal of prior years' share of Associate entity's losses - (2,997,490)
Net loss on financial assets at fair value through profit or loss - 3,112,213
(upon reclassification from investment in Associate entity)
Net loss on other financial assets held at fair value through profit or loss - 348,244
Net loss on non-current asset held for sale - 420,428
Technology operations
Amortisation of software development assets 88,429 338,715
Other expenses 192,424 717,300
Revenue is recognised to the extent that it is probable that the economic benefits will flow to the Consolidated Entity and the revenue can be reliably measured. The following specific recognition criteria must also be met beforerevenue is recognised:
Revenue from the sale of financial assets, goods or other assets is recognised when the Consolidated Entity haspassed control of the financial assets, goods or other assets to the buyer.
Interest revenue is recognised on a proportional basis taking into account the interest rates applicable to thefinancial assets.
Dividend revenue is recognised when the right to receive a dividend has been established. The ConsolidatedEntity brings dividend revenue to account on the applicable ex-dividend entitlement date.
The consolidated loss before income tax includes the following items of revenue:
ANNUAL REPORT | 27
30 JUNE 2020 BENTLEY CAPITAL LIMITEDA.B.N. 87 008 108 218
NOTES TO THE CONSOLIDATEDFINANCIAL STATEMENTSfor the year ended 30 June 2020
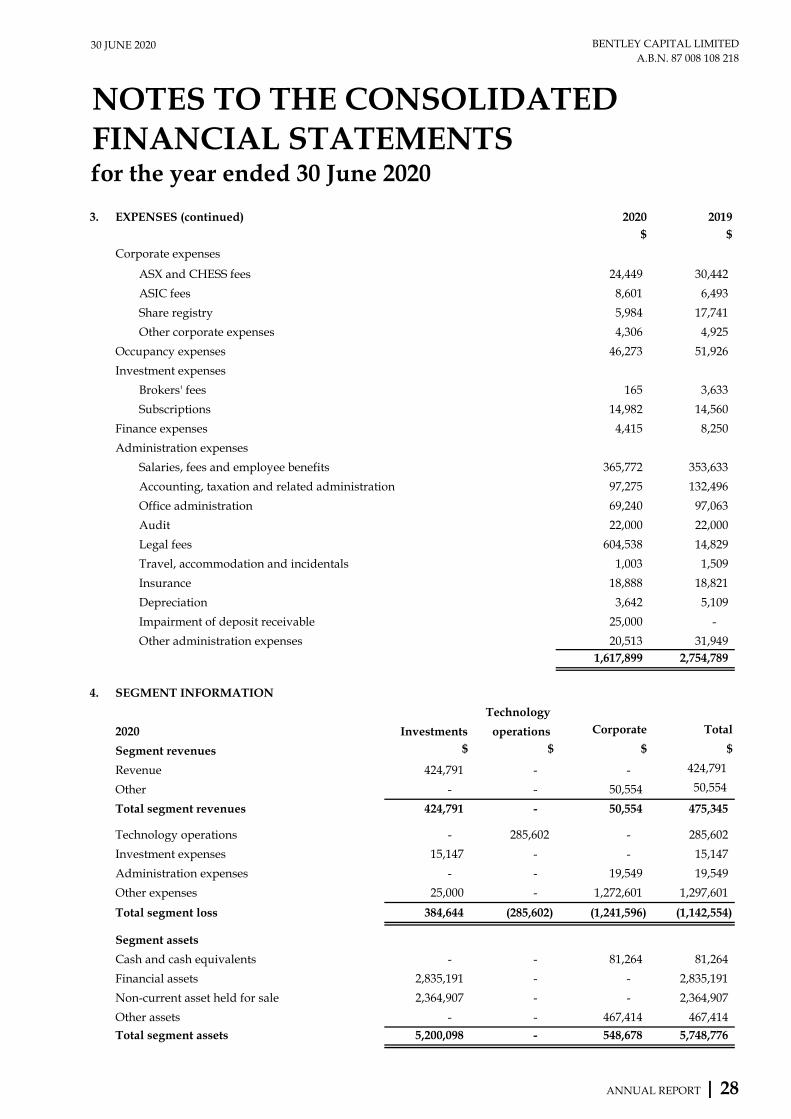
3. EXPENSES (continued) 2020 2019$ $
Corporate expenses
ASX and CHESS fees 24,449 30,442
ASIC fees 8,601 6,493
Share registry 5,984 17,741
Other corporate expenses 4,306 4,925
Occupancy expenses 46,273 51,926
Investment expenses
Brokers' fees 165 3,633
Subscriptions 14,982 14,560
Finance expenses 4,415 8,250
Administration expenses
Salaries, fees and employee benefits 365,772 353,633
Accounting, taxation and related administration 97,275 132,496
Office administration 69,240 97,063
Audit 22,000 22,000
Legal fees 604,538 14,829
Travel, accommodation and incidentals 1,003 1,509
Insurance 18,888 18,821
Depreciation 3,642 5,109
Impairment of deposit receivable 25,000 -
Other administration expenses 20,513 31,949 1,617,899 2,754,789
4. SEGMENT INFORMATION
Technology
2020 Investments operations Corporate Total
Segment revenues $ $ $ $
Revenue 424,791 - - 424,791
Other - - 50,554 50,554
Total segment revenues 424,791 - 50,554 475,345
Technology operations - 285,602 - 285,602
Investment expenses 15,147 - - 15,147
Administration expenses - - 19,549 19,549
Other expenses 25,000 - 1,272,601 1,297,601
Total segment loss 384,644 (285,602) (1,241,596) (1,142,554)
Segment assets
Cash and cash equivalents - - 81,264 81,264
Financial assets 2,835,191 - - 2,835,191
Non-current asset held for sale 2,364,907 - - 2,364,907
Other assets - - 467,414 467,414
Total segment assets 5,200,098 - 548,678 5,748,776
ANNUAL REPORT | 28
30 JUNE 2020 BENTLEY CAPITAL LIMITEDA.B.N. 87 008 108 218
NOTES TO THE CONSOLIDATEDFINANCIAL STATEMENTSfor the year ended 30 June 2020
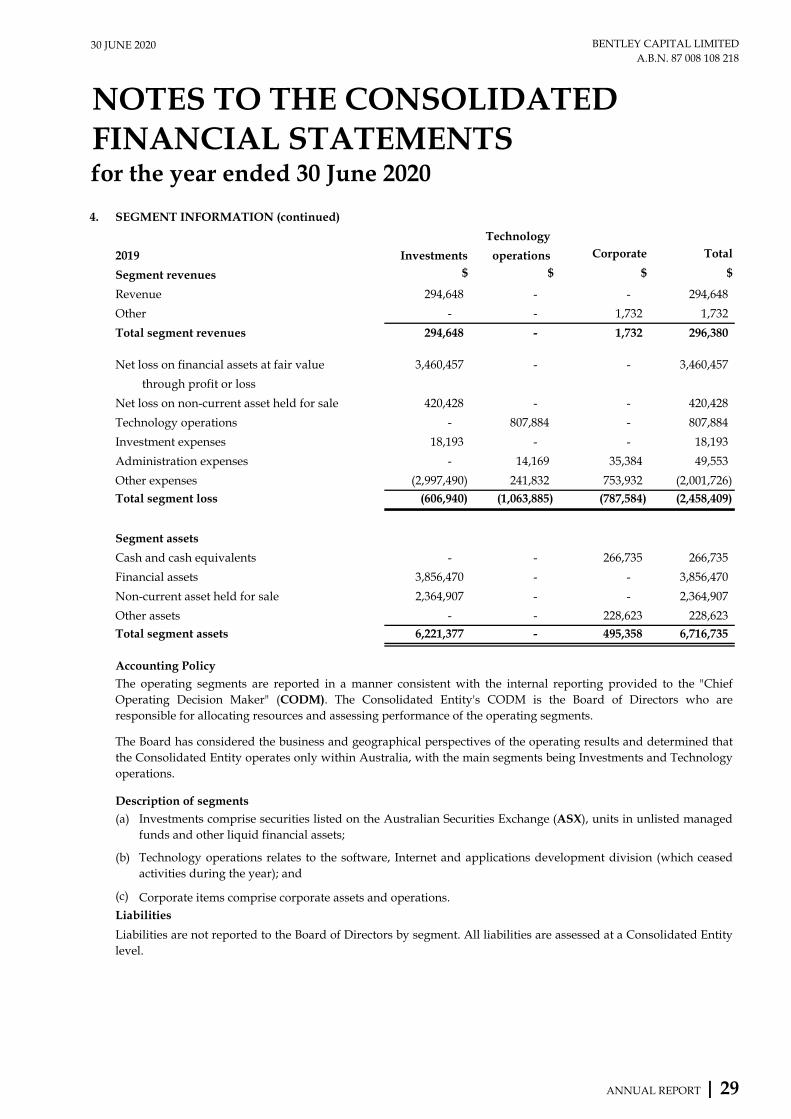
4. SEGMENT INFORMATION (continued)
Technology
2019 Investments operations Corporate Total
Segment revenues $ $ $ $
Revenue 294,648 - - 294,648
Other - - 1,732 1,732
Total segment revenues 294,648 - 1,732 296,380
Net loss on financial assets at fair value 3,460,457 - - 3,460,457
through profit or loss
Net loss on non-current asset held for sale 420,428 - - 420,428
Technology operations - 807,884 - 807,884
Investment expenses 18,193 - - 18,193
Administration expenses - 14,169 35,384 49,553
Other expenses (2,997,490) 241,832 753,932 (2,001,726)
Total segment loss (606,940) (1,063,885) (787,584) (2,458,409)
Segment assets
Cash and cash equivalents - - 266,735 266,735
Financial assets 3,856,470 - - 3,856,470
Non-current asset held for sale 2,364,907 - - 2,364,907
Other assets - - 228,623 228,623
Total segment assets 6,221,377 - 495,358 6,716,735
Accounting Policy
Description of segments(a)
(b)
(c) Corporate items comprise corporate assets and operations.Liabilities
The operating segments are reported in a manner consistent with the internal reporting provided to the "ChiefOperating Decision Maker" (CODM). The Consolidated Entity's CODM is the Board of Directors who areresponsible for allocating resources and assessing performance of the operating segments.
The Board has considered the business and geographical perspectives of the operating results and determined thatthe Consolidated Entity operates only within Australia, with the main segments being Investments and Technologyoperations.
Investments comprise securities listed on the Australian Securities Exchange (ASX), units in unlisted managedfunds and other liquid financial assets;
Liabilities are not reported to the Board of Directors by segment. All liabilities are assessed at a Consolidated Entitylevel.
Technology operations relates to the software, Internet and applications development division (which ceasedactivities during the year); and
ANNUAL REPORT | 29
30 JUNE 2020 BENTLEY CAPITAL LIMITEDA.B.N. 87 008 108 218
NOTES TO THE CONSOLIDATEDFINANCIAL STATEMENTSfor the year ended 30 June 2020
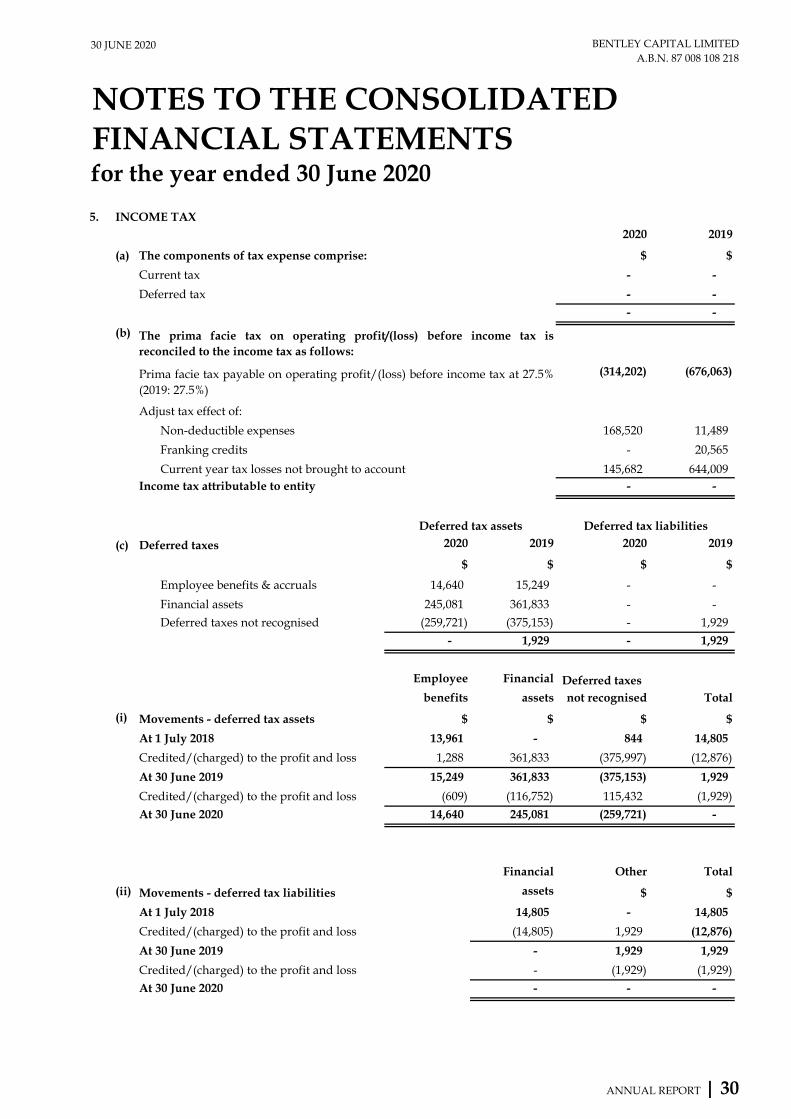
5. INCOME TAX 2020 2019
(a) The components of tax expense comprise: $ $
Current tax - -
Deferred tax - -
- -
(b)
(314,202) (676,063)
Adjust tax effect of:
Non-deductible expenses 168,520 11,489
Franking credits - 20,565
Current year tax losses not brought to account 145,682 644,009 Income tax attributable to entity - -
(c) Deferred taxes 2020 2019 2020 2019
$ $ $ $
Employee benefits & accruals 14,640 15,249 - -
Financial assets 245,081 361,833 - -
Deferred taxes not recognised (259,721) (375,153) - 1,929
- 1,929 - 1,929
Employee Financial Deferred taxesbenefits assets not recognised Total
(i) Movements - deferred tax assets $ $ $ $
At 1 July 2018 13,961 - 844 14,805
Credited/(charged) to the profit and loss 1,288 361,833 (375,997) (12,876)
At 30 June 2019 15,249 361,833 (375,153) 1,929
Credited/(charged) to the profit and loss (609) (116,752) 115,432 (1,929)
At 30 June 2020 14,640 245,081 (259,721) -
Financial Other Total
(ii) Movements - deferred tax liabilities assets $ $
At 1 July 2018 14,805 - 14,805
Credited/(charged) to the profit and loss (14,805) 1,929 (12,876)
At 30 June 2019 - 1,929 1,929
Credited/(charged) to the profit and loss - (1,929) (1,929)
At 30 June 2020 - - -
The prima facie tax on operating profit/(loss) before income tax isreconciled to the income tax as follows:
Prima facie tax payable on operating profit/(loss) before income tax at 27.5%(2019: 27.5%)
Deferred tax liabilitiesDeferred tax assets
ANNUAL REPORT | 30
30 JUNE 2020 BENTLEY CAPITAL LIMITEDA.B.N. 87 008 108 218
NOTES TO THE CONSOLIDATEDFINANCIAL STATEMENTSfor the year ended 30 June 2020
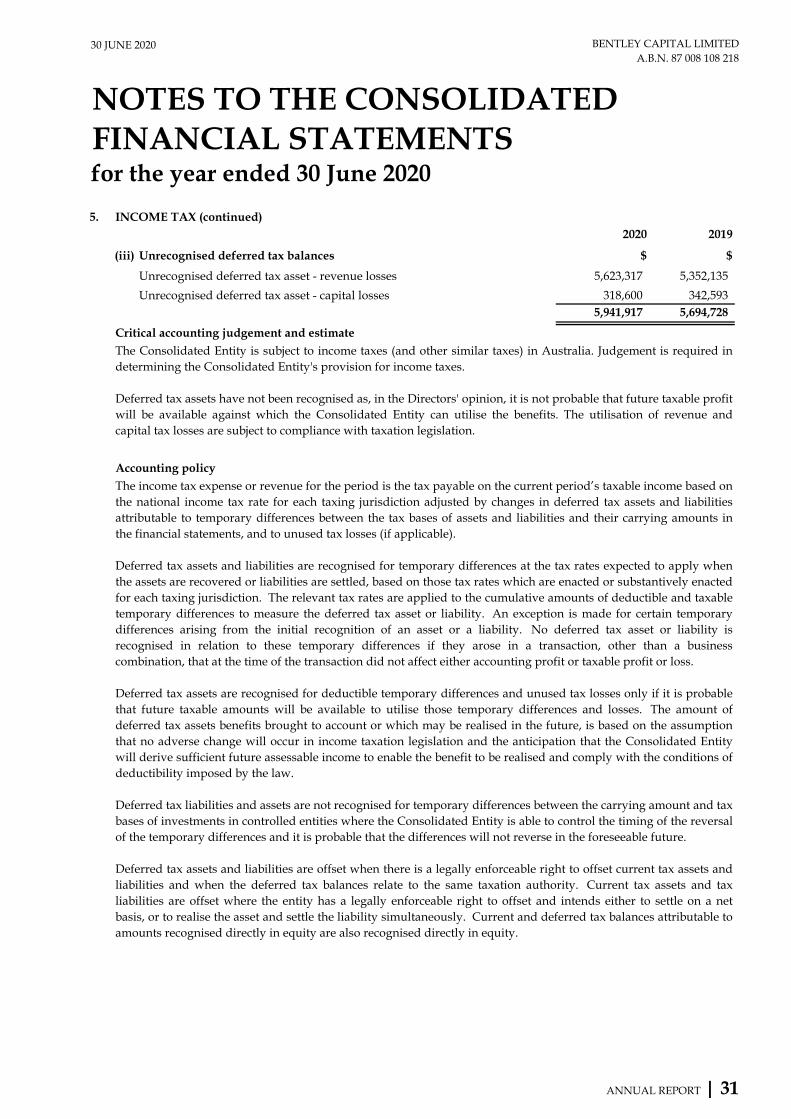
5. INCOME TAX (continued)2020 2019
(iii) Unrecognised deferred tax balances $ $
Unrecognised deferred tax asset - revenue losses 5,623,317 5,352,135
Unrecognised deferred tax asset - capital losses 318,600 342,593 5,941,917 5,694,728
Critical accounting judgement and estimate
Accounting policy
The Consolidated Entity is subject to income taxes (and other similar taxes) in Australia. Judgement is required indetermining the Consolidated Entity's provision for income taxes.
Deferred tax assets have not been recognised as, in the Directors' opinion, it is not probable that future taxable profitwill be available against which the Consolidated Entity can utilise the benefits. The utilisation of revenue andcapital tax losses are subject to compliance with taxation legislation.
The income tax expense or revenue for the period is the tax payable on the current period’s taxable income based onthe national income tax rate for each taxing jurisdiction adjusted by changes in deferred tax assets and liabilitiesattributable to temporary differences between the tax bases of assets and liabilities and their carrying amounts inthe financial statements, and to unused tax losses (if applicable).
Deferred tax assets and liabilities are recognised for temporary differences at the tax rates expected to apply whenthe assets are recovered or liabilities are settled, based on those tax rates which are enacted or substantively enactedfor each taxing jurisdiction. The relevant tax rates are applied to the cumulative amounts of deductible and taxabletemporary differences to measure the deferred tax asset or liability. An exception is made for certain temporarydifferences arising from the initial recognition of an asset or a liability. No deferred tax asset or liability isrecognised in relation to these temporary differences if they arose in a transaction, other than a businesscombination, that at the time of the transaction did not affect either accounting profit or taxable profit or loss.
Deferred tax assets are recognised for deductible temporary differences and unused tax losses only if it is probablethat future taxable amounts will be available to utilise those temporary differences and losses. The amount ofdeferred tax assets benefits brought to account or which may be realised in the future, is based on the assumptionthat no adverse change will occur in income taxation legislation and the anticipation that the Consolidated Entitywill derive sufficient future assessable income to enable the benefit to be realised and comply with the conditions ofdeductibility imposed by the law.
Deferred tax liabilities and assets are not recognised for temporary differences between the carrying amount and taxbases of investments in controlled entities where the Consolidated Entity is able to control the timing of the reversalof the temporary differences and it is probable that the differences will not reverse in the foreseeable future.
Deferred tax assets and liabilities are offset when there is a legally enforceable right to offset current tax assets andliabilities and when the deferred tax balances relate to the same taxation authority. Current tax assets and taxliabilities are offset where the entity has a legally enforceable right to offset and intends either to settle on a netbasis, or to realise the asset and settle the liability simultaneously. Current and deferred tax balances attributable toamounts recognised directly in equity are also recognised directly in equity.
ANNUAL REPORT | 31
30 JUNE 2020 BENTLEY CAPITAL LIMITEDA.B.N. 87 008 108 218
NOTES TO THE CONSOLIDATEDFINANCIAL STATEMENTSfor the year ended 30 June 2020
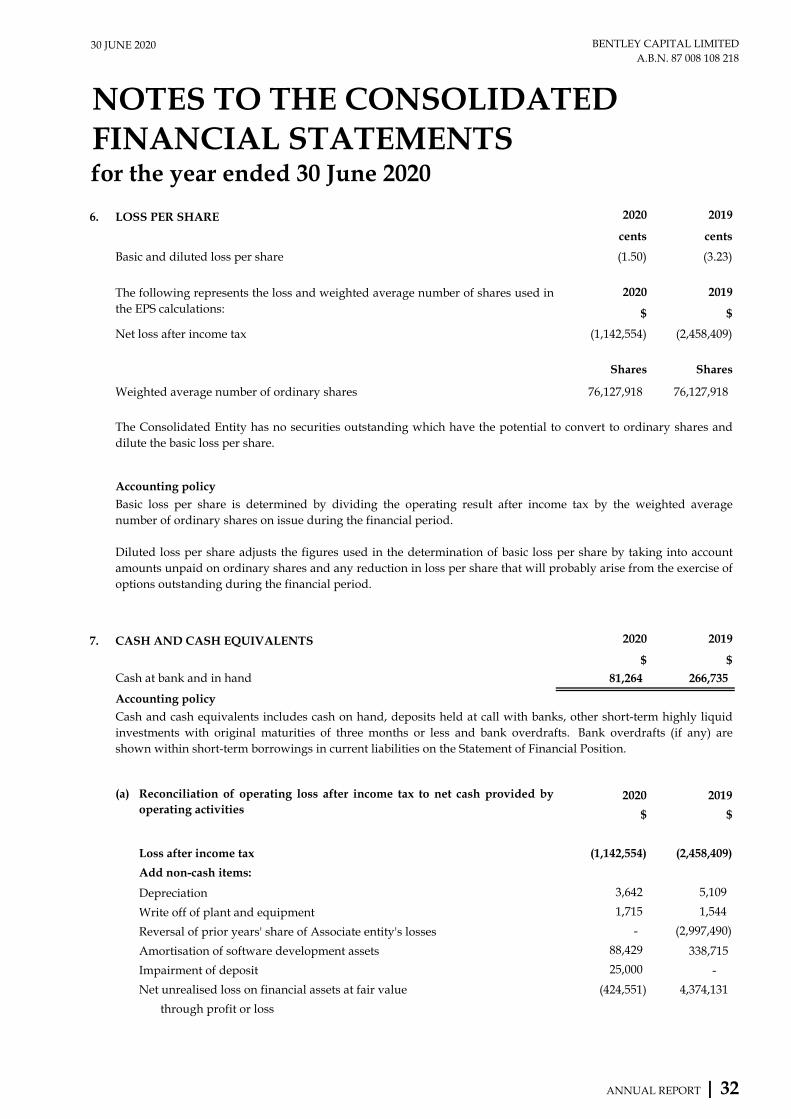
6. LOSS PER SHARE 2020 2019
cents cents
Basic and diluted loss per share (1.50) (3.23)
2020 2019
$ $
Net loss after income tax (1,142,554) (2,458,409)
Shares Shares
Weighted average number of ordinary shares 76,127,918 76,127,918
Accounting policy
7. CASH AND CASH EQUIVALENTS 2020 2019
$ $Cash at bank and in hand 81,264 266,735
Accounting policy
(a) 2020 2019
$ $
Loss after income tax (1,142,554) (2,458,409)
Add non-cash items:
Depreciation 3,642 5,109
Write off of plant and equipment 1,715 1,544
Reversal of prior years' share of Associate entity's losses - (2,997,490)
Amortisation of software development assets 88,429 338,715
Impairment of deposit 25,000 -
Net unrealised loss on financial assets at fair value (424,551) 4,374,131
through profit or loss
The following represents the loss and weighted average number of shares used inthe EPS calculations:
Reconciliation of operating loss after income tax to net cash provided byoperating activities
Basic loss per share is determined by dividing the operating result after income tax by the weighted averagenumber of ordinary shares on issue during the financial period.
Diluted loss per share adjusts the figures used in the determination of basic loss per share by taking into accountamounts unpaid on ordinary shares and any reduction in loss per share that will probably arise from the exercise ofoptions outstanding during the financial period.
Cash and cash equivalents includes cash on hand, deposits held at call with banks, other short-term highly liquidinvestments with original maturities of three months or less and bank overdrafts. Bank overdrafts (if any) areshown within short-term borrowings in current liabilities on the Statement of Financial Position.
The Consolidated Entity has no securities outstanding which have the potential to convert to ordinary shares anddilute the basic loss per share.
ANNUAL REPORT | 32
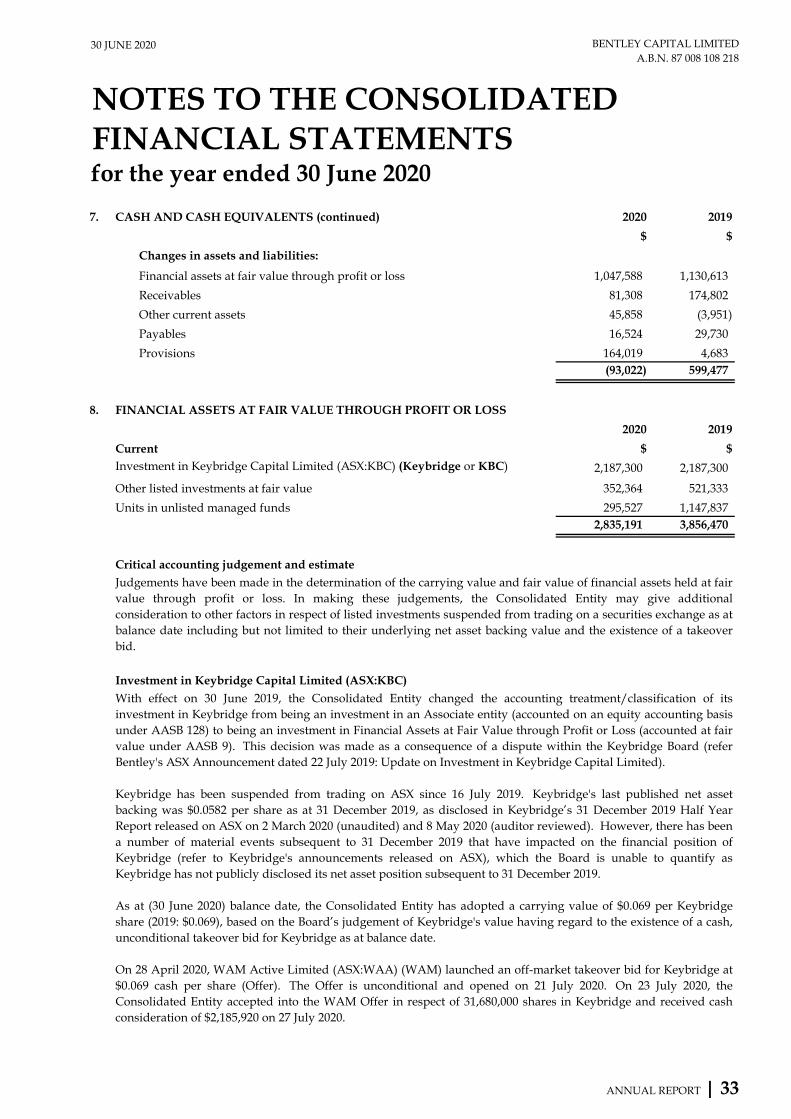
30 JUNE 2020 BENTLEY CAPITAL LIMITEDA.B.N. 87 008 108 218
NOTES TO THE CONSOLIDATEDFINANCIAL STATEMENTSfor the year ended 30 June 2020
7. CASH AND CASH EQUIVALENTS (continued) 2020 2019
$ $
Changes in assets and liabilities:
Financial assets at fair value through profit or loss 1,047,588 1,130,613
Receivables 81,308 174,802
Other current assets 45,858 (3,951)
Payables 16,524 29,730
Provisions 164,019 4,683 (93,022) 599,477
8. FINANCIAL ASSETS AT FAIR VALUE THROUGH PROFIT OR LOSS
2020 2019
$ $Investment in Keybridge Capital Limited (ASX:KBC) (Keybridge or KBC) 2,187,300 2,187,300
Other listed investments at fair value 352,364 521,333
Units in unlisted managed funds 295,527 1,147,837 2,835,191 3,856,470
Critical accounting judgement and estimate
Investment in Keybridge Capital Limited (ASX:KBC)
Current
Judgements have been made in the determination of the carrying value and fair value of financial assets held at fairvalue through profit or loss. In making these judgements, the Consolidated Entity may give additionalconsideration to other factors in respect of listed investments suspended from trading on a securities exchange as atbalance date including but not limited to their underlying net asset backing value and the existence of a takeoverbid.
With effect on 30 June 2019, the Consolidated Entity changed the accounting treatment/classification of itsinvestment in Keybridge from being an investment in an Associate entity (accounted on an equity accounting basisunder AASB 128) to being an investment in Financial Assets at Fair Value through Profit or Loss (accounted at fairvalue under AASB 9). This decision was made as a consequence of a dispute within the Keybridge Board (referBentley's ASX Announcement dated 22 July 2019: Update on Investment in Keybridge Capital Limited).
Keybridge has been suspended from trading on ASX since 16 July 2019. Keybridge's last published net assetbacking was $0.0582 per share as at 31 December 2019, as disclosed in Keybridge’s 31 December 2019 Half YearReport released on ASX on 2 March 2020 (unaudited) and 8 May 2020 (auditor reviewed). However, there has beena number of material events subsequent to 31 December 2019 that have impacted on the financial position ofKeybridge (refer to Keybridge's announcements released on ASX), which the Board is unable to quantify asKeybridge has not publicly disclosed its net asset position subsequent to 31 December 2019.
As at (30 June 2020) balance date, the Consolidated Entity has adopted a carrying value of $0.069 per Keybridgeshare (2019: $0.069), based on the Board’s judgement of Keybridge's value having regard to the existence of a cash,unconditional takeover bid for Keybridge as at balance date.
On 28 April 2020, WAM Active Limited (ASX:WAA) (WAM) launched an off-market takeover bid for Keybridge at$0.069 cash per share (Offer). The Offer is unconditional and opened on 21 July 2020. On 23 July 2020, theConsolidated Entity accepted into the WAM Offer in respect of 31,680,000 shares in Keybridge and received cashconsideration of $2,185,920 on 27 July 2020.
ANNUAL REPORT | 33
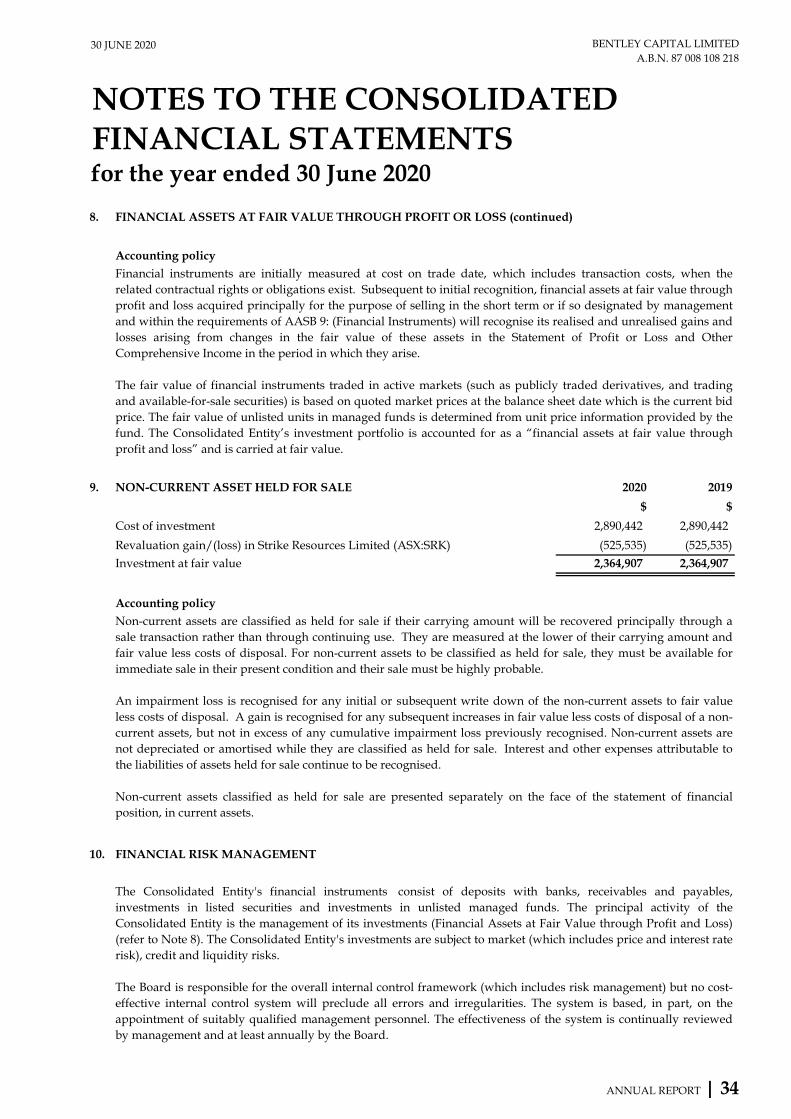
30 JUNE 2020 BENTLEY CAPITAL LIMITEDA.B.N. 87 008 108 218
NOTES TO THE CONSOLIDATEDFINANCIAL STATEMENTSfor the year ended 30 June 2020
8. FINANCIAL ASSETS AT FAIR VALUE THROUGH PROFIT OR LOSS (continued)
Accounting policy
9. NON-CURRENT ASSET HELD FOR SALE 2020 2019
$ $
Cost of investment 2,890,442 2,890,442
Revaluation gain/(loss) in Strike Resources Limited (ASX:SRK) (525,535) (525,535)
Investment at fair value 2,364,907 2,364,907
Accounting policy
10. FINANCIAL RISK MANAGEMENT
The Consolidated Entity's financial instruments consist of deposits with banks, receivables and payables,investments in listed securities and investments in unlisted managed funds. The principal activity of theConsolidated Entity is the management of its investments (Financial Assets at Fair Value through Profit and Loss)(refer to Note 8). The Consolidated Entity's investments are subject to market (which includes price and interest raterisk), credit and liquidity risks.
The Board is responsible for the overall internal control framework (which includes risk management) but no cost-effective internal control system will preclude all errors and irregularities. The system is based, in part, on theappointment of suitably qualified management personnel. The effectiveness of the system is continually reviewedby management and at least annually by the Board.
Non-current assets are classified as held for sale if their carrying amount will be recovered principally through asale transaction rather than through continuing use. They are measured at the lower of their carrying amount andfair value less costs of disposal. For non-current assets to be classified as held for sale, they must be available forimmediate sale in their present condition and their sale must be highly probable.
An impairment loss is recognised for any initial or subsequent write down of the non-current assets to fair valueless costs of disposal. A gain is recognised for any subsequent increases in fair value less costs of disposal of a non-current assets, but not in excess of any cumulative impairment loss previously recognised. Non-current assets arenot depreciated or amortised while they are classified as held for sale. Interest and other expenses attributable tothe liabilities of assets held for sale continue to be recognised.
Non-current assets classified as held for sale are presented separately on the face of the statement of financialposition, in current assets.
Financial instruments are initially measured at cost on trade date, which includes transaction costs, when therelated contractual rights or obligations exist. Subsequent to initial recognition, financial assets at fair value throughprofit and loss acquired principally for the purpose of selling in the short term or if so designated by managementand within the requirements of AASB 9: (Financial Instruments) will recognise its realised and unrealised gains andlosses arising from changes in the fair value of these assets in the Statement of Profit or Loss and OtherComprehensive Income in the period in which they arise.
The fair value of financial instruments traded in active markets (such as publicly traded derivatives, and tradingand available-for-sale securities) is based on quoted market prices at the balance sheet date which is the current bidprice. The fair value of unlisted units in managed funds is determined from unit price information provided by thefund. The Consolidated Entity’s investment portfolio is accounted for as a “financial assets at fair value throughprofit and loss” and is carried at fair value.
ANNUAL REPORT | 34
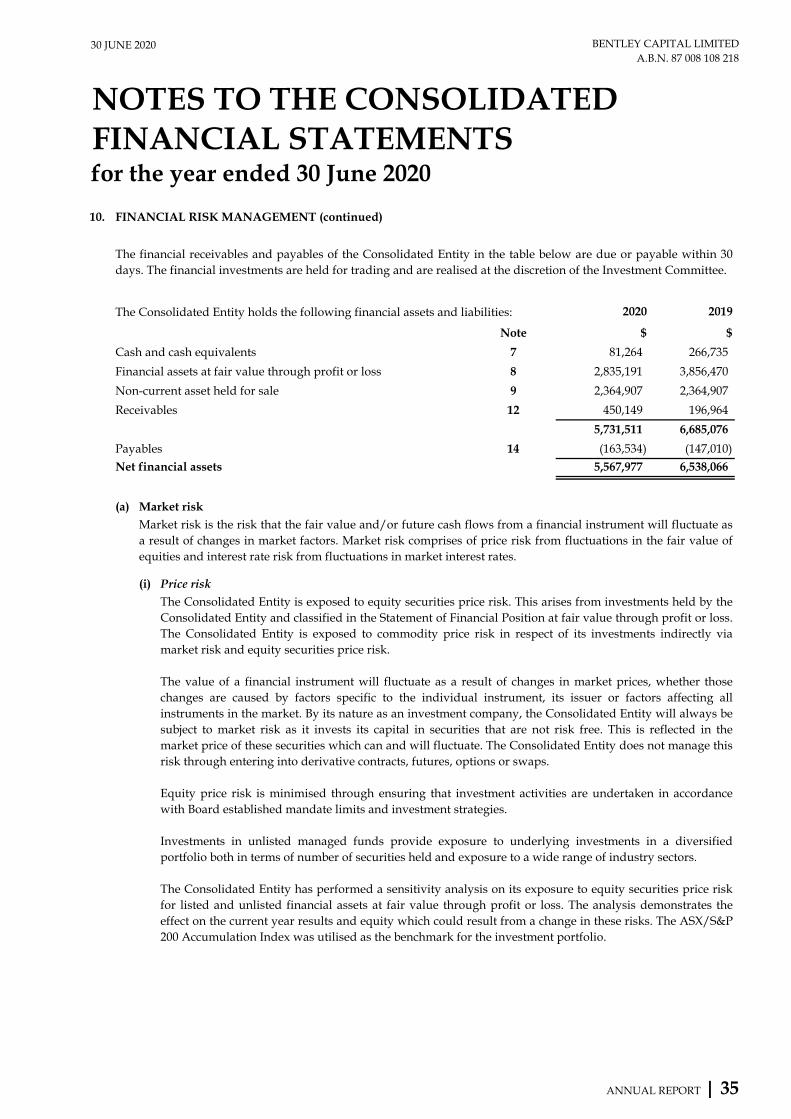
30 JUNE 2020 BENTLEY CAPITAL LIMITEDA.B.N. 87 008 108 218
NOTES TO THE CONSOLIDATEDFINANCIAL STATEMENTSfor the year ended 30 June 2020
10. FINANCIAL RISK MANAGEMENT (continued)
The Consolidated Entity holds the following financial assets and liabilities: 2020 2019
Note $ $
Cash and cash equivalents 7 81,264 266,735
Financial assets at fair value through profit or loss 8 2,835,191 3,856,470
Non-current asset held for sale 9 2,364,907 2,364,907
Receivables 12 450,149 196,964
5,731,511 6,685,076
Payables 14 (163,534) (147,010)
Net financial assets 5,567,977 6,538,066
(a) Market risk
(i) Price risk
Market risk is the risk that the fair value and/or future cash flows from a financial instrument will fluctuate asa result of changes in market factors. Market risk comprises of price risk from fluctuations in the fair value ofequities and interest rate risk from fluctuations in market interest rates.
The financial receivables and payables of the Consolidated Entity in the table below are due or payable within 30days. The financial investments are held for trading and are realised at the discretion of the Investment Committee.
The Consolidated Entity is exposed to equity securities price risk. This arises from investments held by theConsolidated Entity and classified in the Statement of Financial Position at fair value through profit or loss.The Consolidated Entity is exposed to commodity price risk in respect of its investments indirectly viamarket risk and equity securities price risk.
The value of a financial instrument will fluctuate as a result of changes in market prices, whether thosechanges are caused by factors specific to the individual instrument, its issuer or factors affecting allinstruments in the market. By its nature as an investment company, the Consolidated Entity will always besubject to market risk as it invests its capital in securities that are not risk free. This is reflected in themarket price of these securities which can and will fluctuate. The Consolidated Entity does not manage thisrisk through entering into derivative contracts, futures, options or swaps.
Equity price risk is minimised through ensuring that investment activities are undertaken in accordancewith Board established mandate limits and investment strategies.
Investments in unlisted managed funds provide exposure to underlying investments in a diversifiedportfolio both in terms of number of securities held and exposure to a wide range of industry sectors.
The Consolidated Entity has performed a sensitivity analysis on its exposure to equity securities price riskfor listed and unlisted financial assets at fair value through profit or loss. The analysis demonstrates theeffect on the current year results and equity which could result from a change in these risks. The ASX/S&P200 Accumulation Index was utilised as the benchmark for the investment portfolio.
ANNUAL REPORT | 35
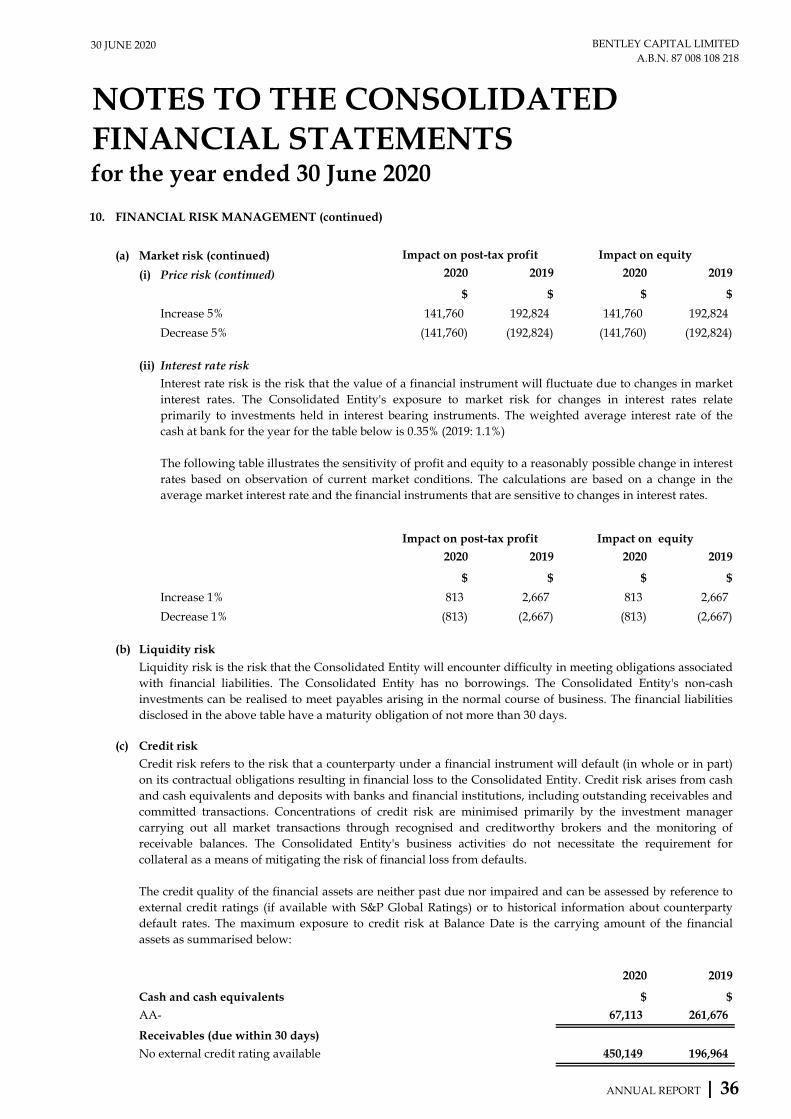
30 JUNE 2020 BENTLEY CAPITAL LIMITEDA.B.N. 87 008 108 218
NOTES TO THE CONSOLIDATEDFINANCIAL STATEMENTSfor the year ended 30 June 2020
10. FINANCIAL RISK MANAGEMENT (continued)
(a) Market risk (continued)
(i) Price risk (continued) 2020 2019 2020 2019
$ $ $ $
Increase 5% 141,760 192,824 141,760 192,824
Decrease 5% (141,760) (192,824) (141,760) (192,824)
(ii) Interest rate risk
2020 2019 2020 2019
$ $ $ $
Increase 1% 813 2,667 813 2,667
Decrease 1% (813) (2,667) (813) (2,667)
(b)
(c) Credit risk
2020 2019
Cash and cash equivalents $ $
AA- 67,113 261,676
Receivables (due within 30 days)
No external credit rating available 450,149 196,964
Interest rate risk is the risk that the value of a financial instrument will fluctuate due to changes in marketinterest rates. The Consolidated Entity's exposure to market risk for changes in interest rates relateprimarily to investments held in interest bearing instruments. The weighted average interest rate of thecash at bank for the year for the table below is 0.35% (2019: 1.1%)
The following table illustrates the sensitivity of profit and equity to a reasonably possible change in interestrates based on observation of current market conditions. The calculations are based on a change in theaverage market interest rate and the financial instruments that are sensitive to changes in interest rates.
Impact on post-tax profit Impact on equity
Credit risk refers to the risk that a counterparty under a financial instrument will default (in whole or in part)on its contractual obligations resulting in financial loss to the Consolidated Entity. Credit risk arises from cashand cash equivalents and deposits with banks and financial institutions, including outstanding receivables andcommitted transactions. Concentrations of credit risk are minimised primarily by the investment managercarrying out all market transactions through recognised and creditworthy brokers and the monitoring ofreceivable balances. The Consolidated Entity's business activities do not necessitate the requirement forcollateral as a means of mitigating the risk of financial loss from defaults.
The credit quality of the financial assets are neither past due nor impaired and can be assessed by reference toexternal credit ratings (if available with S&P Global Ratings) or to historical information about counterpartydefault rates. The maximum exposure to credit risk at Balance Date is the carrying amount of the financialassets as summarised below:
Liquidity risk is the risk that the Consolidated Entity will encounter difficulty in meeting obligations associatedwith financial liabilities. The Consolidated Entity has no borrowings. The Consolidated Entity's non-cashinvestments can be realised to meet payables arising in the normal course of business. The financial liabilitiesdisclosed in the above table have a maturity obligation of not more than 30 days.
Impact on post-tax profit Impact on equity
Liquidity risk
ANNUAL REPORT | 36
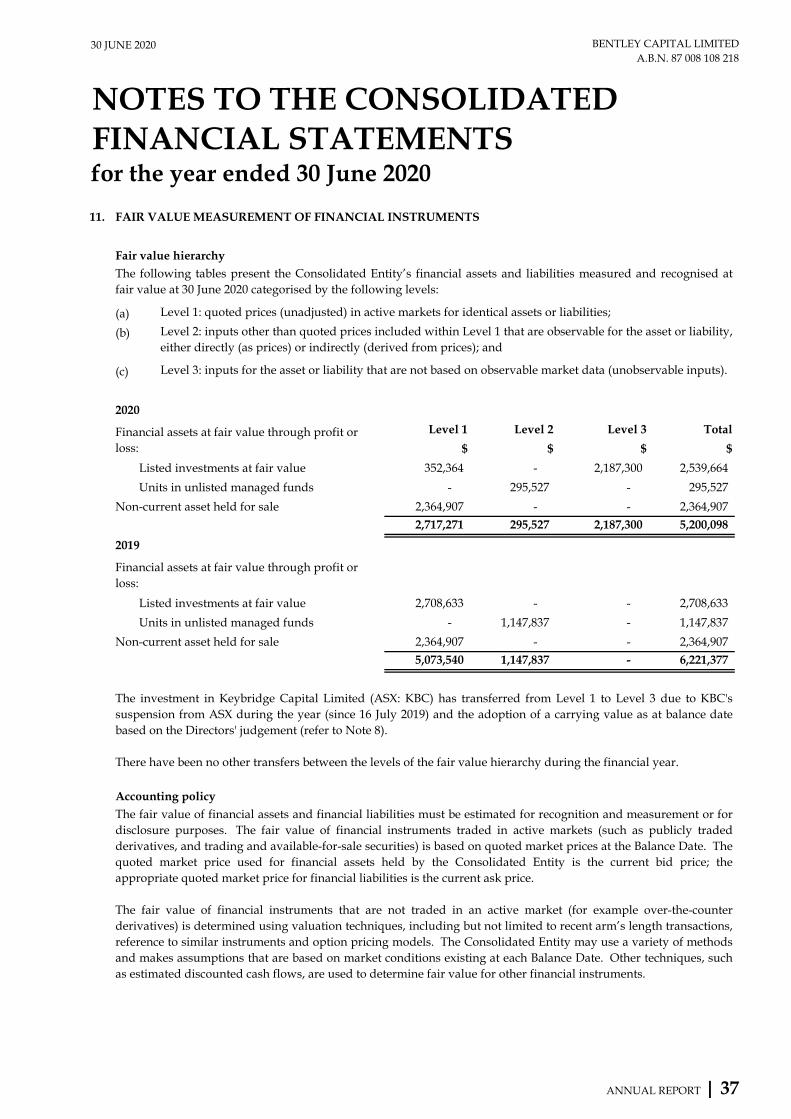
30 JUNE 2020 BENTLEY CAPITAL LIMITEDA.B.N. 87 008 108 218
NOTES TO THE CONSOLIDATEDFINANCIAL STATEMENTSfor the year ended 30 June 2020
11. FAIR VALUE MEASUREMENT OF FINANCIAL INSTRUMENTS
Fair value hierarchy
(a)
(b)
(c)
2020
Level 1 Level 2 Level 3 Total
$ $ $ $
Listed investments at fair value 352,364 - 2,187,300 2,539,664
Units in unlisted managed funds - 295,527 - 295,527
Non-current asset held for sale 2,364,907 - - 2,364,907
2,717,271 295,527 2,187,300 5,200,098
2019
Listed investments at fair value 2,708,633 - - 2,708,633
Units in unlisted managed funds - 1,147,837 - 1,147,837
Non-current asset held for sale 2,364,907 - - 2,364,907
5,073,540 1,147,837 - 6,221,377
Accounting policy
Financial assets at fair value through profit or loss:
The following tables present the Consolidated Entity’s financial assets and liabilities measured and recognised atfair value at 30 June 2020 categorised by the following levels:
Level 1: quoted prices (unadjusted) in active markets for identical assets or liabilities;
Level 3: inputs for the asset or liability that are not based on observable market data (unobservable inputs).
Level 2: inputs other than quoted prices included within Level 1 that are observable for the asset or liability,either directly (as prices) or indirectly (derived from prices); and
The fair value of financial assets and financial liabilities must be estimated for recognition and measurement or fordisclosure purposes. The fair value of financial instruments traded in active markets (such as publicly tradedderivatives, and trading and available-for-sale securities) is based on quoted market prices at the Balance Date. Thequoted market price used for financial assets held by the Consolidated Entity is the current bid price; theappropriate quoted market price for financial liabilities is the current ask price.
The fair value of financial instruments that are not traded in an active market (for example over-the-counterderivatives) is determined using valuation techniques, including but not limited to recent arm’s length transactions,reference to similar instruments and option pricing models. The Consolidated Entity may use a variety of methodsand makes assumptions that are based on market conditions existing at each Balance Date. Other techniques, suchas estimated discounted cash flows, are used to determine fair value for other financial instruments.
The investment in Keybridge Capital Limited (ASX: KBC) has transferred from Level 1 to Level 3 due to KBC'ssuspension from ASX during the year (since 16 July 2019) and the adoption of a carrying value as at balance datebased on the Directors' judgement (refer to Note 8).
There have been no other transfers between the levels of the fair value hierarchy during the financial year.
Financial assets at fair value through profit or loss:
ANNUAL REPORT | 37
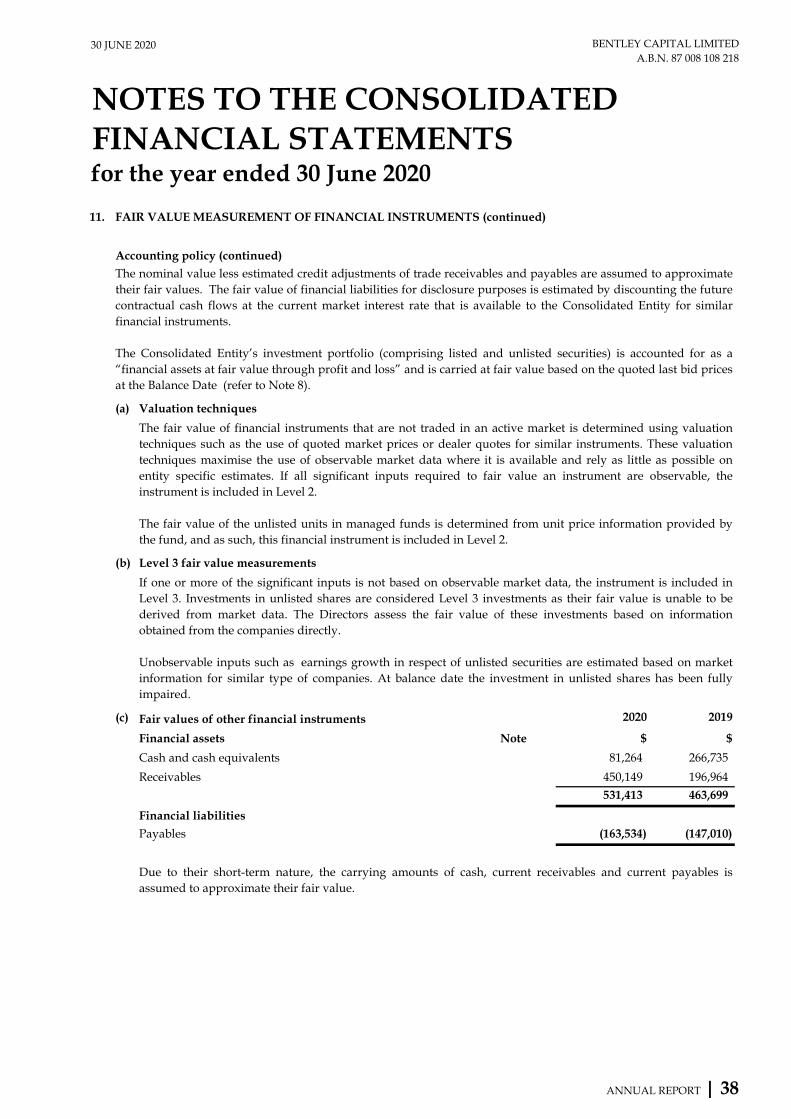
30 JUNE 2020 BENTLEY CAPITAL LIMITEDA.B.N. 87 008 108 218
NOTES TO THE CONSOLIDATEDFINANCIAL STATEMENTSfor the year ended 30 June 2020
11. FAIR VALUE MEASUREMENT OF FINANCIAL INSTRUMENTS (continued)
Accounting policy (continued)
(a) Valuation techniques
(b) Level 3 fair value measurements
(c) Fair values of other financial instruments 2020 2019
Financial assets Note $ $
Cash and cash equivalents 81,264 266,735
Receivables 450,149 196,964
531,413 463,699
Financial liabilities
Payables (163,534) (147,010)
If one or more of the significant inputs is not based on observable market data, the instrument is included inLevel 3. Investments in unlisted shares are considered Level 3 investments as their fair value is unable to bederived from market data. The Directors assess the fair value of these investments based on informationobtained from the companies directly.
Unobservable inputs such as earnings growth in respect of unlisted securities are estimated based on marketinformation for similar type of companies. At balance date the investment in unlisted shares has been fullyimpaired.
Due to their short-term nature, the carrying amounts of cash, current receivables and current payables isassumed to approximate their fair value.
The fair value of financial instruments that are not traded in an active market is determined using valuationtechniques such as the use of quoted market prices or dealer quotes for similar instruments. These valuationtechniques maximise the use of observable market data where it is available and rely as little as possible onentity specific estimates. If all significant inputs required to fair value an instrument are observable, theinstrument is included in Level 2.
The fair value of the unlisted units in managed funds is determined from unit price information provided bythe fund, and as such, this financial instrument is included in Level 2.
The nominal value less estimated credit adjustments of trade receivables and payables are assumed to approximatetheir fair values. The fair value of financial liabilities for disclosure purposes is estimated by discounting the futurecontractual cash flows at the current market interest rate that is available to the Consolidated Entity for similarfinancial instruments.
The Consolidated Entity’s investment portfolio (comprising listed and unlisted securities) is accounted for as a“financial assets at fair value through profit and loss” and is carried at fair value based on the quoted last bid pricesat the Balance Date (refer to Note 8).
ANNUAL REPORT | 38
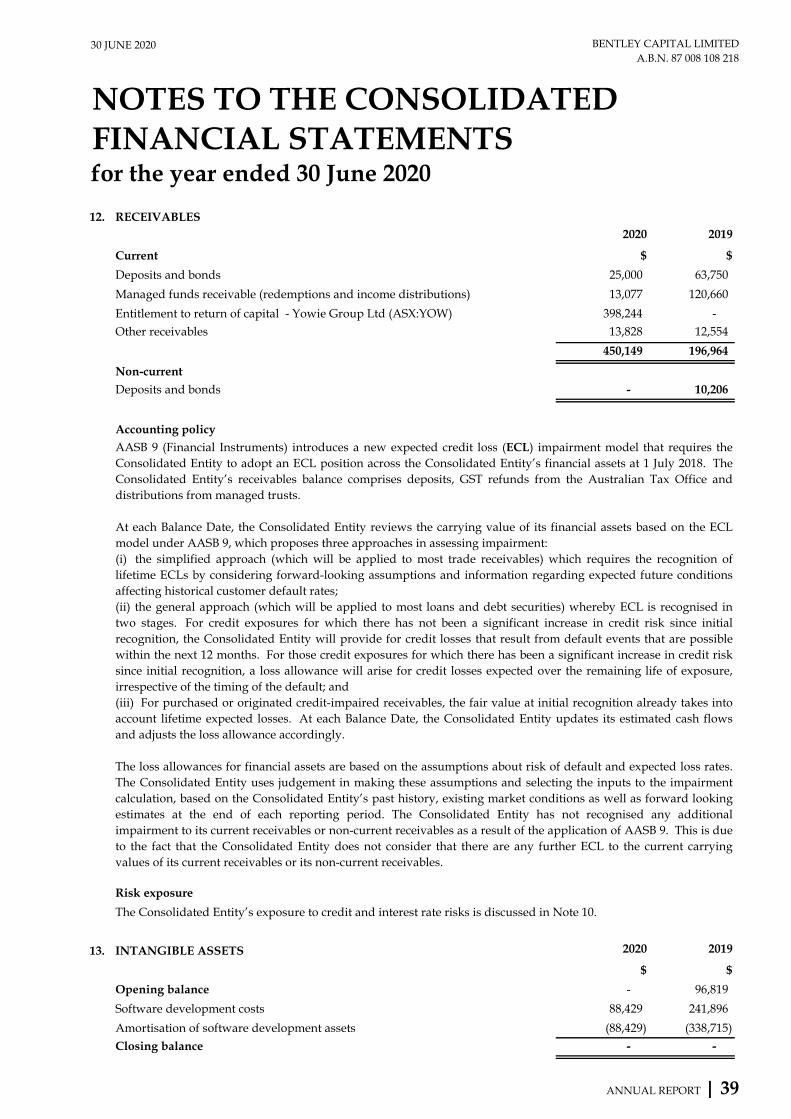
30 JUNE 2020 BENTLEY CAPITAL LIMITEDA.B.N. 87 008 108 218
NOTES TO THE CONSOLIDATEDFINANCIAL STATEMENTSfor the year ended 30 June 2020
12. RECEIVABLES2020 2019
Current $ $
Deposits and bonds 25,000 63,750
Managed funds receivable (redemptions and income distributions) 13,077 120,660
Entitlement to return of capital - Yowie Group Ltd (ASX:YOW) 398,244 -
Other receivables 13,828 12,554
450,149 196,964
Non-current
Deposits and bonds - 10,206
Accounting policy
Risk exposure
The Consolidated Entity’s exposure to credit and interest rate risks is discussed in Note 10.
13. INTANGIBLE ASSETS 2020 2019
$ $
Opening balance - 96,819
Software development costs 88,429 241,896
Amortisation of software development assets (88,429) (338,715)
Closing balance - -
AASB 9 (Financial Instruments) introduces a new expected credit loss (ECL) impairment model that requires theConsolidated Entity to adopt an ECL position across the Consolidated Entity’s financial assets at 1 July 2018. TheConsolidated Entity’s receivables balance comprises deposits, GST refunds from the Australian Tax Office anddistributions from managed trusts.
At each Balance Date, the Consolidated Entity reviews the carrying value of its financial assets based on the ECLmodel under AASB 9, which proposes three approaches in assessing impairment:(i) the simplified approach (which will be applied to most trade receivables) which requires the recognition oflifetime ECLs by considering forward-looking assumptions and information regarding expected future conditionsaffecting historical customer default rates;(ii) the general approach (which will be applied to most loans and debt securities) whereby ECL is recognised intwo stages. For credit exposures for which there has not been a significant increase in credit risk since initialrecognition, the Consolidated Entity will provide for credit losses that result from default events that are possiblewithin the next 12 months. For those credit exposures for which there has been a significant increase in credit risksince initial recognition, a loss allowance will arise for credit losses expected over the remaining life of exposure,irrespective of the timing of the default; and (iii) For purchased or originated credit-impaired receivables, the fair value at initial recognition already takes intoaccount lifetime expected losses. At each Balance Date, the Consolidated Entity updates its estimated cash flowsand adjusts the loss allowance accordingly.
The loss allowances for financial assets are based on the assumptions about risk of default and expected loss rates.The Consolidated Entity uses judgement in making these assumptions and selecting the inputs to the impairmentcalculation, based on the Consolidated Entity’s past history, existing market conditions as well as forward lookingestimates at the end of each reporting period. The Consolidated Entity has not recognised any additionalimpairment to its current receivables or non-current receivables as a result of the application of AASB 9. This is dueto the fact that the Consolidated Entity does not consider that there are any further ECL to the current carryingvalues of its current receivables or its non-current receivables.
ANNUAL REPORT | 39
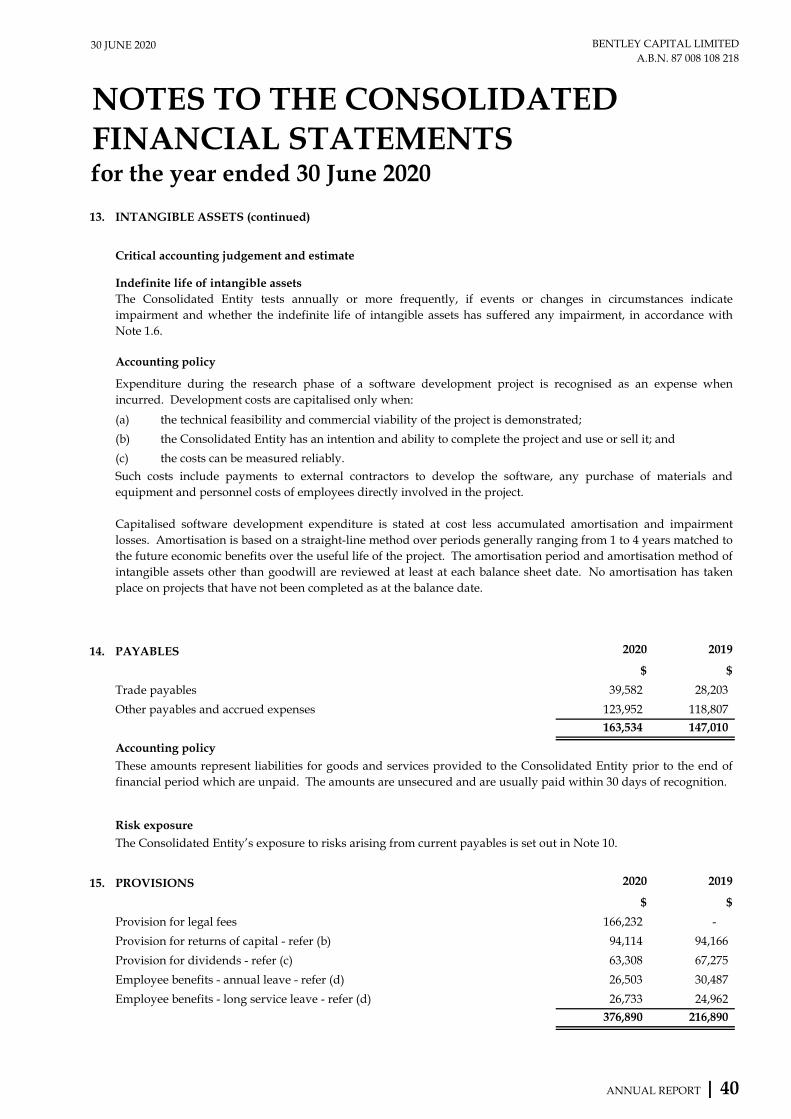
30 JUNE 2020 BENTLEY CAPITAL LIMITEDA.B.N. 87 008 108 218
NOTES TO THE CONSOLIDATEDFINANCIAL STATEMENTSfor the year ended 30 June 2020
13. INTANGIBLE ASSETS (continued)
Critical accounting judgement and estimate
Accounting policy
(a) the technical feasibility and commercial viability of the project is demonstrated;
(b) the Consolidated Entity has an intention and ability to complete the project and use or sell it; and
(c) the costs can be measured reliably.
14. PAYABLES 2020 2019
$ $
Trade payables 39,582 28,203
Other payables and accrued expenses 123,952 118,807
163,534 147,010
Accounting policy
Risk exposureThe Consolidated Entity’s exposure to risks arising from current payables is set out in Note 10.
15. PROVISIONS 2020 2019
$ $
Provision for legal fees 166,232 -
Provision for returns of capital - refer (b) 94,114 94,166
Provision for dividends - refer (c) 63,308 67,275
Employee benefits - annual leave - refer (d) 26,503 30,487
Employee benefits - long service leave - refer (d) 26,733 24,962
376,890 216,890
Such costs include payments to external contractors to develop the software, any purchase of materials andequipment and personnel costs of employees directly involved in the project.
Capitalised software development expenditure is stated at cost less accumulated amortisation and impairmentlosses. Amortisation is based on a straight-line method over periods generally ranging from 1 to 4 years matched tothe future economic benefits over the useful life of the project. The amortisation period and amortisation method ofintangible assets other than goodwill are reviewed at least at each balance sheet date. No amortisation has takenplace on projects that have not been completed as at the balance date.
Expenditure during the research phase of a software development project is recognised as an expense whenincurred. Development costs are capitalised only when:
These amounts represent liabilities for goods and services provided to the Consolidated Entity prior to the end offinancial period which are unpaid. The amounts are unsecured and are usually paid within 30 days of recognition.
Indefinite life of intangible assetsThe Consolidated Entity tests annually or more frequently, if events or changes in circumstances indicateimpairment and whether the indefinite life of intangible assets has suffered any impairment, in accordance withNote 1.6.
ANNUAL REPORT | 40
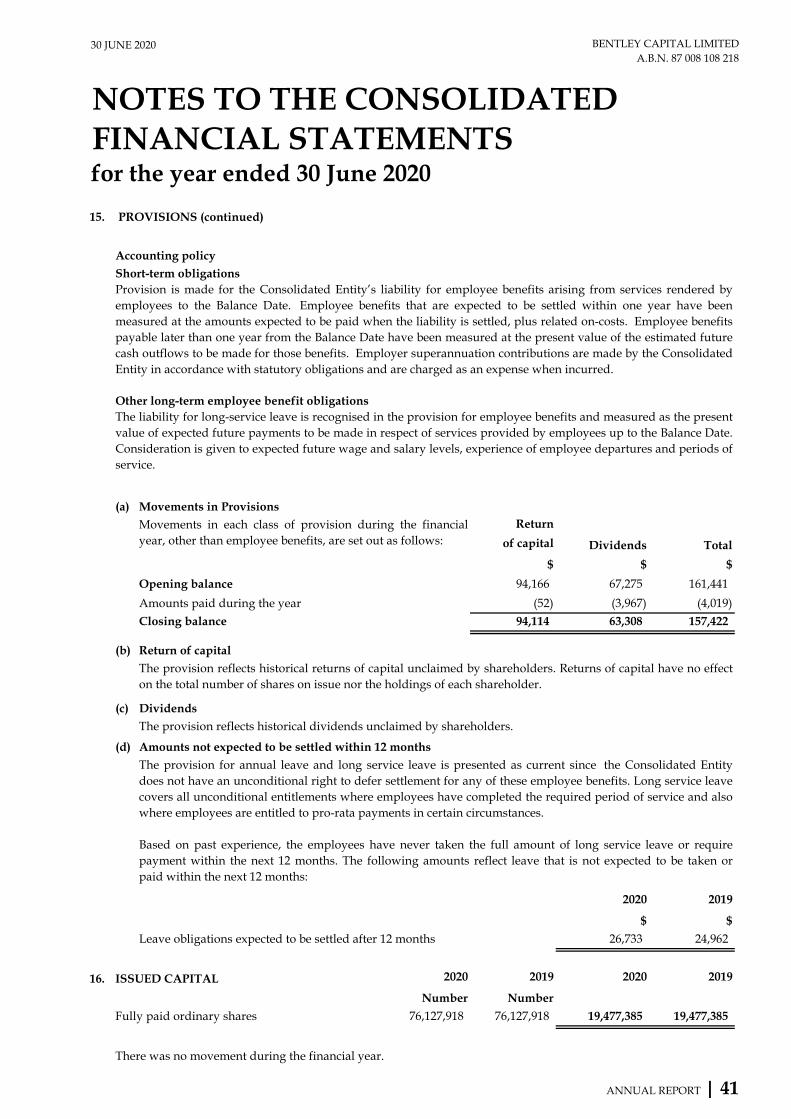
30 JUNE 2020 BENTLEY CAPITAL LIMITEDA.B.N. 87 008 108 218
NOTES TO THE CONSOLIDATEDFINANCIAL STATEMENTSfor the year ended 30 June 2020
15. PROVISIONS (continued)
Accounting policy
(a) Movements in ProvisionsReturn
of capital Dividends Total
$ $ $
Opening balance 94,166 67,275 161,441
Amounts paid during the year (52) (3,967) (4,019)
Closing balance 94,114 63,308 157,422
(b)
(c) Dividends
(d)
2020 2019
$ $
Leave obligations expected to be settled after 12 months 26,733 24,962
16. ISSUED CAPITAL 2020 2019 2020 2019
Number Number
Fully paid ordinary shares 76,127,918 76,127,918 19,477,385 19,477,385
There was no movement during the financial year.
Short-term obligationsProvision is made for the Consolidated Entity’s liability for employee benefits arising from services rendered byemployees to the Balance Date. Employee benefits that are expected to be settled within one year have beenmeasured at the amounts expected to be paid when the liability is settled, plus related on-costs. Employee benefitspayable later than one year from the Balance Date have been measured at the present value of the estimated futurecash outflows to be made for those benefits. Employer superannuation contributions are made by the ConsolidatedEntity in accordance with statutory obligations and are charged as an expense when incurred.
Other long-term employee benefit obligationsThe liability for long-service leave is recognised in the provision for employee benefits and measured as the presentvalue of expected future payments to be made in respect of services provided by employees up to the Balance Date.Consideration is given to expected future wage and salary levels, experience of employee departures and periods ofservice.
Amounts not expected to be settled within 12 months
The provision reflects historical dividends unclaimed by shareholders.
The provision for annual leave and long service leave is presented as current since the Consolidated Entitydoes not have an unconditional right to defer settlement for any of these employee benefits. Long service leavecovers all unconditional entitlements where employees have completed the required period of service and alsowhere employees are entitled to pro-rata payments in certain circumstances.
Based on past experience, the employees have never taken the full amount of long service leave or requirepayment within the next 12 months. The following amounts reflect leave that is not expected to be taken orpaid within the next 12 months:
Return of capitalThe provision reflects historical returns of capital unclaimed by shareholders. Returns of capital have no effecton the total number of shares on issue nor the holdings of each shareholder.
Movements in each class of provision during the financialyear, other than employee benefits, are set out as follows:
ANNUAL REPORT | 41
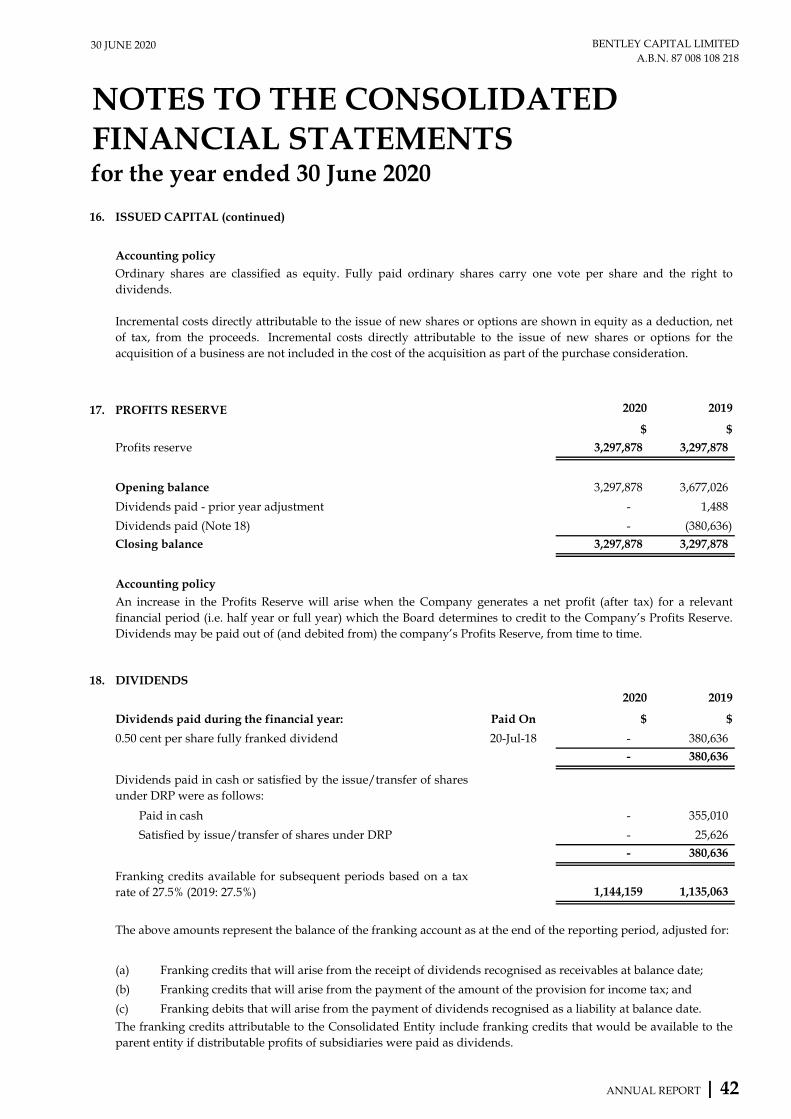
30 JUNE 2020 BENTLEY CAPITAL LIMITEDA.B.N. 87 008 108 218
NOTES TO THE CONSOLIDATEDFINANCIAL STATEMENTSfor the year ended 30 June 2020
16. ISSUED CAPITAL (continued)
Accounting policy
17. PROFITS RESERVE 2020 2019
$ $
Profits reserve 3,297,878 3,297,878
Opening balance 3,297,878 3,677,026
Dividends paid - prior year adjustment - 1,488
Dividends paid (Note 18) - (380,636)
Closing balance 3,297,878 3,297,878
Accounting policy
18. DIVIDENDS2020 2019
Dividends paid during the financial year: Paid On $ $
0.50 cent per share fully franked dividend 20-Jul-18 - 380,636
- 380,636
Paid in cash - 355,010
Satisfied by issue/transfer of shares under DRP - 25,626
- 380,636
1,144,159 1,135,063
(a) Franking credits that will arise from the receipt of dividends recognised as receivables at balance date;
(b) Franking credits that will arise from the payment of the amount of the provision for income tax; and
(c) Franking debits that will arise from the payment of dividends recognised as a liability at balance date.
Franking credits available for subsequent periods based on a taxrate of 27.5% (2019: 27.5%)
The franking credits attributable to the Consolidated Entity include franking credits that would be available to theparent entity if distributable profits of subsidiaries were paid as dividends.
An increase in the Profits Reserve will arise when the Company generates a net profit (after tax) for a relevantfinancial period (i.e. half year or full year) which the Board determines to credit to the Company’s Profits Reserve.Dividends may be paid out of (and debited from) the company’s Profits Reserve, from time to time.
Ordinary shares are classified as equity. Fully paid ordinary shares carry one vote per share and the right todividends.
Incremental costs directly attributable to the issue of new shares or options are shown in equity as a deduction, netof tax, from the proceeds. Incremental costs directly attributable to the issue of new shares or options for theacquisition of a business are not included in the cost of the acquisition as part of the purchase consideration.
Dividends paid in cash or satisfied by the issue/transfer of sharesunder DRP were as follows:
The above amounts represent the balance of the franking account as at the end of the reporting period, adjusted for:
ANNUAL REPORT | 42
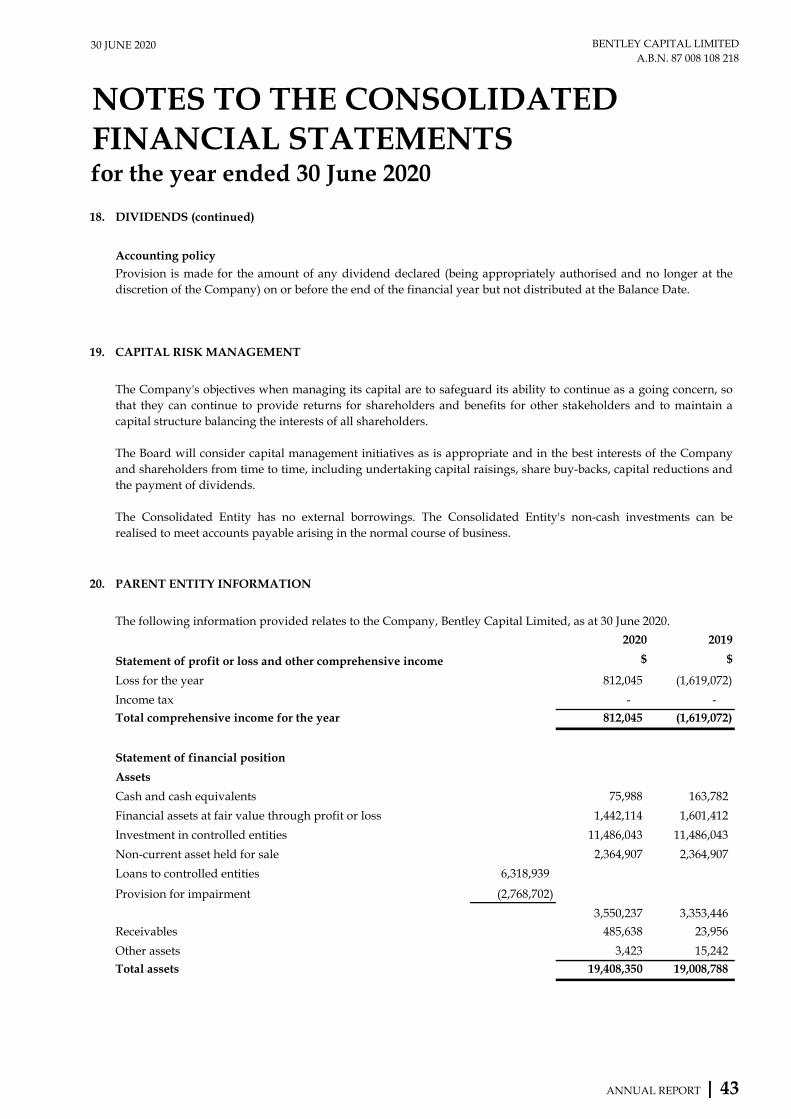
30 JUNE 2020 BENTLEY CAPITAL LIMITEDA.B.N. 87 008 108 218
NOTES TO THE CONSOLIDATEDFINANCIAL STATEMENTSfor the year ended 30 June 2020
18. DIVIDENDS (continued)
Accounting policy
19. CAPITAL RISK MANAGEMENT
20. PARENT ENTITY INFORMATION
2020 2019
Statement of profit or loss and other comprehensive income $ $
Loss for the year 812,045 (1,619,072)
Income tax - -
Total comprehensive income for the year 812,045 (1,619,072)
Statement of financial position
Assets
Cash and cash equivalents 75,988 163,782
Financial assets at fair value through profit or loss 1,442,114 1,601,412
Investment in controlled entities 11,486,043 11,486,043
Non-current asset held for sale 2,364,907 2,364,907
Loans to controlled entities 6,318,939
Provision for impairment (2,768,702)
3,550,237 3,353,446
Receivables 485,638 23,956
Other assets 3,423 15,242
Total assets 19,408,350 19,008,788
The following information provided relates to the Company, Bentley Capital Limited, as at 30 June 2020.
The Company's objectives when managing its capital are to safeguard its ability to continue as a going concern, sothat they can continue to provide returns for shareholders and benefits for other stakeholders and to maintain acapital structure balancing the interests of all shareholders.
The Board will consider capital management initiatives as is appropriate and in the best interests of the Companyand shareholders from time to time, including undertaking capital raisings, share buy-backs, capital reductions andthe payment of dividends.
The Consolidated Entity has no external borrowings. The Consolidated Entity's non-cash investments can berealised to meet accounts payable arising in the normal course of business.
Provision is made for the amount of any dividend declared (being appropriately authorised and no longer at thediscretion of the Company) on or before the end of the financial year but not distributed at the Balance Date.
ANNUAL REPORT | 43
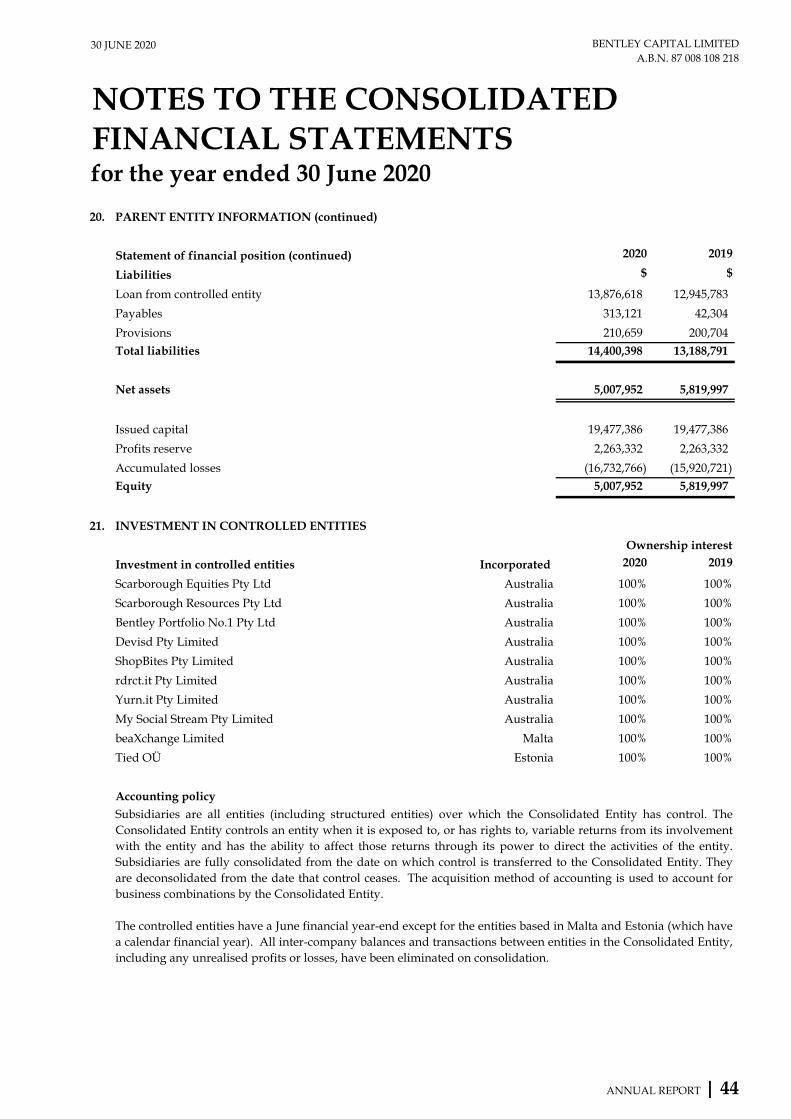
30 JUNE 2020 BENTLEY CAPITAL LIMITEDA.B.N. 87 008 108 218
NOTES TO THE CONSOLIDATEDFINANCIAL STATEMENTSfor the year ended 30 June 2020
20. PARENT ENTITY INFORMATION (continued)
Statement of financial position (continued) 2020 2019
Liabilities $ $
Loan from controlled entity 13,876,618 12,945,783
Payables 313,121 42,304
Provisions 210,659 200,704
Total liabilities 14,400,398 13,188,791
Net assets 5,007,952 5,819,997
Issued capital 19,477,386 19,477,386
Profits reserve 2,263,332 2,263,332
Accumulated losses (16,732,766) (15,920,721)
Equity 5,007,952 5,819,997
21. INVESTMENT IN CONTROLLED ENTITIES
Investment in controlled entities Incorporated 2020 2019
Scarborough Equities Pty Ltd Australia 100% 100%
Scarborough Resources Pty Ltd Australia 100% 100%
Bentley Portfolio No.1 Pty Ltd Australia 100% 100%
Devisd Pty Limited Australia 100% 100%
ShopBites Pty Limited Australia 100% 100%
rdrct.it Pty Limited Australia 100% 100%
Yurn.it Pty Limited Australia 100% 100%
My Social Stream Pty Limited Australia 100% 100%
beaXchange Limited Malta 100% 100%
Tied OÜ Estonia 100% 100%
Accounting policySubsidiaries are all entities (including structured entities) over which the Consolidated Entity has control. TheConsolidated Entity controls an entity when it is exposed to, or has rights to, variable returns from its involvementwith the entity and has the ability to affect those returns through its power to direct the activities of the entity.Subsidiaries are fully consolidated from the date on which control is transferred to the Consolidated Entity. Theyare deconsolidated from the date that control ceases. The acquisition method of accounting is used to account forbusiness combinations by the Consolidated Entity.
The controlled entities have a June financial year-end except for the entities based in Malta and Estonia (which havea calendar financial year). All inter-company balances and transactions between entities in the Consolidated Entity,including any unrealised profits or losses, have been eliminated on consolidation.
Ownership interest
ANNUAL REPORT | 44
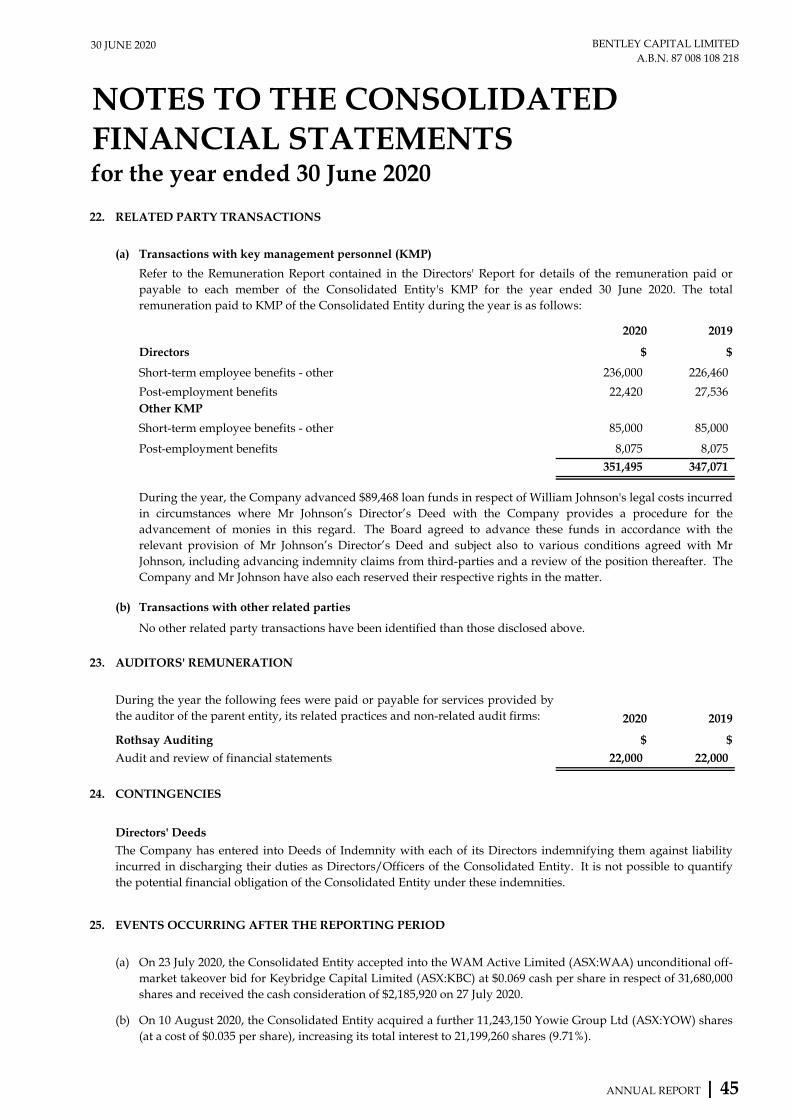
30 JUNE 2020 BENTLEY CAPITAL LIMITEDA.B.N. 87 008 108 218
NOTES TO THE CONSOLIDATEDFINANCIAL STATEMENTSfor the year ended 30 June 2020
22. RELATED PARTY TRANSACTIONS
(a) Transactions with key management personnel (KMP)
2020 2019
Directors $ $
Short-term employee benefits - other 236,000 226,460
Post-employment benefits 22,420 27,536 Other KMP
Short-term employee benefits - other 85,000 85,000
Post-employment benefits 8,075 8,075
351,495 347,071
(b) Transactions with other related parties
No other related party transactions have been identified than those disclosed above.
23. AUDITORS' REMUNERATION
2020 2019
Rothsay Auditing $ $
Audit and review of financial statements 22,000 22,000
24. CONTINGENCIES
Directors' Deeds
25. EVENTS OCCURRING AFTER THE REPORTING PERIOD
(a)
(b)
During the year the following fees were paid or payable for services provided bythe auditor of the parent entity, its related practices and non-related audit firms:
During the year, the Company advanced $89,468 loan funds in respect of William Johnson's legal costs incurredin circumstances where Mr Johnson’s Director’s Deed with the Company provides a procedure for theadvancement of monies in this regard. The Board agreed to advance these funds in accordance with therelevant provision of Mr Johnson’s Director’s Deed and subject also to various conditions agreed with MrJohnson, including advancing indemnity claims from third-parties and a review of the position thereafter. TheCompany and Mr Johnson have also each reserved their respective rights in the matter.
The Company has entered into Deeds of Indemnity with each of its Directors indemnifying them against liabilityincurred in discharging their duties as Directors/Officers of the Consolidated Entity. It is not possible to quantifythe potential financial obligation of the Consolidated Entity under these indemnities.
Refer to the Remuneration Report contained in the Directors' Report for details of the remuneration paid orpayable to each member of the Consolidated Entity's KMP for the year ended 30 June 2020. The totalremuneration paid to KMP of the Consolidated Entity during the year is as follows:
On 23 July 2020, the Consolidated Entity accepted into the WAM Active Limited (ASX:WAA) unconditional off-market takeover bid for Keybridge Capital Limited (ASX:KBC) at $0.069 cash per share in respect of 31,680,000shares and received the cash consideration of $2,185,920 on 27 July 2020.
On 10 August 2020, the Consolidated Entity acquired a further 11,243,150 Yowie Group Ltd (ASX:YOW) shares(at a cost of $0.035 per share), increasing its total interest to 21,199,260 shares (9.71%).
ANNUAL REPORT | 45

30 JUNE 2020 BENTLEY CAPITAL LIMITEDA.B.N. 87 008 108 218
NOTES TO THE CONSOLIDATEDFINANCIAL STATEMENTSfor the year ended 30 June 2020
25. EVENTS OCCURRING AFTER THE REPORTING PERIOD (continued)
(c) The share price of Strike Resources Limited (ASX:SRK) has increased significantly since the balance date, from4.5 cents to a last bid price of 11 cents (on 19 August 2020). This translates to an unrealised net gain of $3.416million (in respect of 52,553,493 shares) for the current 2020/2021 financial year, which is equivalent to 4.5 cents(pre and post tax) per Bentley share (based on the Company's issued capital of 76,127,918 shares).
No other matter or circumstance has arisen since the end of the financial year that significantly affected, or maysignificantly affect, the operations of the Consolidated Entity, the results of those operations, or the state of affairs ofthe Consolidated Entity in future financial years.
ANNUAL REPORT | 46
30 JUNE 2020 BENTLEY CAPITAL LIMITED A.B.N. 87 008 108 218
DIRECTORS’ DECLARATION
ANNUAL REPORT | 47
The Directors of the Company declare that: (1) The financial statements, comprising the Consolidated Statement of Profit or Loss and Other
Comprehensive Income, Consolidated Statement of Financial Position, Consolidated Statement of Cash Flows, Consolidated Statement of Changes in Equity, and accompanying notes as set out on pages 21 to 46 are in accordance with the Corporations Act 2001 (Cth) and:
(a) comply with Australian Accounting Standards, the Corporations Regulations 2001 and other mandatory professional reporting; and
(b) give a true and fair view of the Consolidated Entity’s financial position as at 30 June 2020 and of their performance for the year ended on that date;
(2) In the Directors’ opinion, there are reasonable grounds to believe that the Company will be able to pay
its debts as and when they become due and payable;
(3) The Directors have been given the declarations required by section 295A of the Corporations Act 2001 (Cth) by the Executive Chairman (the person who, in the opinion of the Directors, performs the Chief Executive Officer function) and Company Secretary (the person who, in the opinion of the Directors, performs the Chief Financial Officer function); and
(4) The Company has included in the notes to the Financial Statements an explicit and unreserved
statement of compliance with the International Financial Reporting Standards.
This declaration is made in accordance with a resolution of the Directors made pursuant to section 295(5) of the Corporations Act 2001 (Cth).
Farooq Khan Simon Cato Chairman Non-Executive Director
and Chairman of Audit Committee 20 August 2020
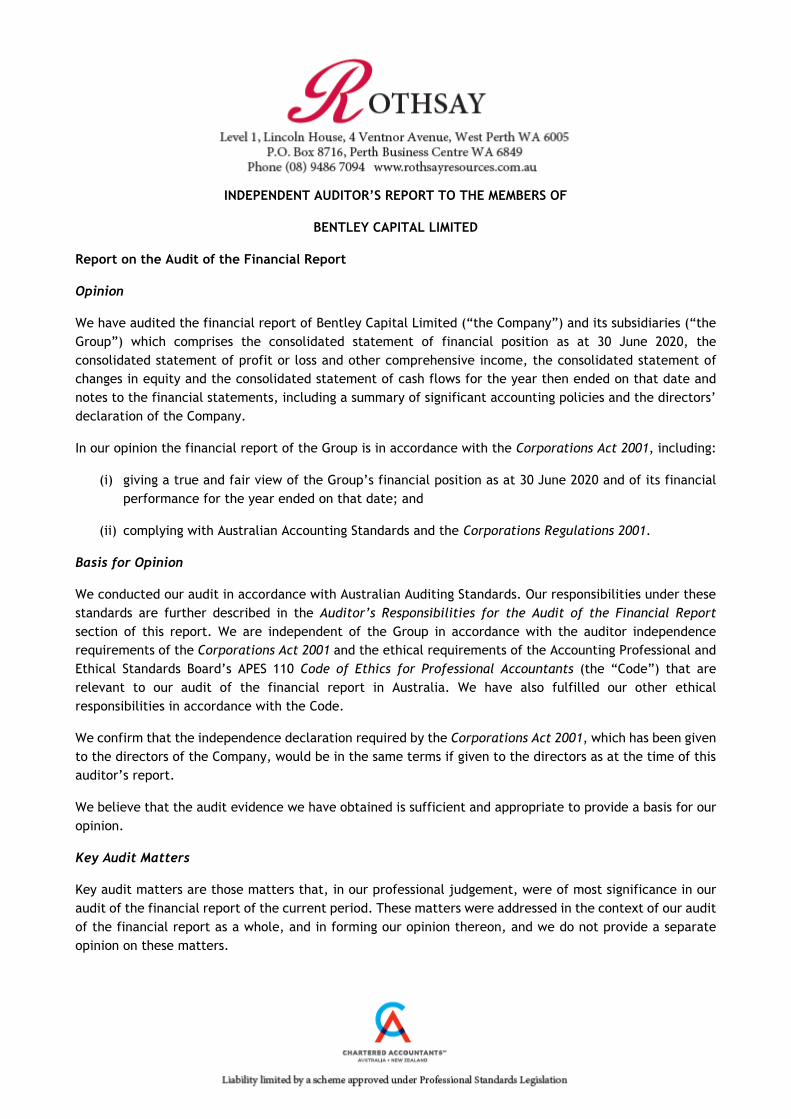
INDEPENDENT AUDITOR’S REPORT TO THE MEMBERS OF
BENTLEY CAPITAL LIMITED
Report on the Audit of the Financial Report
Opinion
We have audited the financial report of Bentley Capital Limited (“the Company”) and its subsidiaries (“the
Group”) which comprises the consolidated statement of financial position as at 30 June 2020, the
consolidated statement of profit or loss and other comprehensive income, the consolidated statement of
changes in equity and the consolidated statement of cash flows for the year then ended on that date and
notes to the financial statements, including a summary of significant accounting policies and the directors’
declaration of the Company.
In our opinion the financial report of the Group is in accordance with the Corporations Act 2001, including:
(i) giving a true and fair view of the Group’s financial position as at 30 June 2020 and of its financial
performance for the year ended on that date; and
(ii) complying with Australian Accounting Standards and the Corporations Regulations 2001.
Basis for Opinion
We conducted our audit in accordance with Australian Auditing Standards. Our responsibilities under these
standards are further described in the Auditor’s Responsibilities for the Audit of the Financial Report
section of this report. We are independent of the Group in accordance with the auditor independence
requirements of the Corporations Act 2001 and the ethical requirements of the Accounting Professional and
Ethical Standards Board’s APES 110 Code of Ethics for Professional Accountants (the “Code”) that are
relevant to our audit of the financial report in Australia. We have also fulfilled our other ethical
responsibilities in accordance with the Code.
We confirm that the independence declaration required by the Corporations Act 2001, which has been given
to the directors of the Company, would be in the same terms if given to the directors as at the time of this
auditor’s report.
We believe that the audit evidence we have obtained is sufficient and appropriate to provide a basis for our
opinion.
Key Audit Matters
Key audit matters are those matters that, in our professional judgement, were of most significance in our
audit of the financial report of the current period. These matters were addressed in the context of our audit
of the financial report as a whole, and in forming our opinion thereon, and we do not provide a separate
opinion on these matters.
INDEPENDENT AUDITOR’S REPORT TO THE MEMBERS OF
BENTLEY CAPITAL LIMITED (continued)
Key Audit Matter – Financial Assets at Fair Value
Through Profit or Loss and Non-Current Assets Held for
Sale
How our Audit Addressed the Key Audit
Matter
The Group’s portfolio of financial assets at fair value
through profit or loss and non-current asset held for sale
make up 90% of total assets by value and are considered
to be the key driver of the Group’s operations.
We do not consider financial assets at fair value and non-
current asset held for sale to be at a high risk of
significant misstatement or to be subject to a significant
level of judgement.
However due to their materiality in the context of the
financial statements as a whole, they are considered to be
the area which had the greatest effect on our overall
strategy and allocation of resources in planning and
completing our audit.
We assessed the reasonableness of the fair
value attributed to financial assets at fair
value through profit or loss and non-current
asset held for sale with reference to relevant
supporting documentation.
We agreed holdings in financial assets at fair
value and the non-current asset held for sale to
independent third-party documentation
We agreed the fair value of the unlisted units
to the unit price information provided by the
investment manager.
We assessed whether the disclosures included
in the financial report meet the requirements
of Australian Accounting Standards.
Other Information
The directors are responsible for the other information. The other information comprises the information
included in the Group’s annual report for the year ended 30 June 2020, but does not include the financial
report and our auditor’s report thereon.
Our opinion on the financial report does not cover the other information and accordingly we do not express
any form of assurance conclusion thereon.
In connection with our audit of the financial report, our responsibility is to read the other information and,
in doing so, consider whether the other information is materially inconsistent with the financial report or
our knowledge obtained in the audit or otherwise appears to be materially misstated.
If based on the work we have performed we conclude there is a material misstatement of this other
information, we are required to report that fact. We have nothing to report in this regard.
Directors’ Responsibility for the Financial Report
The directors of the Company are responsible for the preparation of the financial report that gives a true
and fair view in accordance with the Australian Accounting Standards and the Corporations Act 2001 and for
such internal control as the directors determine is necessary to enable the preparation of the financial
report that gives a true and fair view and is free from material misstatement whether due to fraud or error.
INDEPENDENT AUDITOR’S REPORT TO THE MEMBERS OF
BENTLEY CAPITAL LIMITED (continued)
In preparing the financial report, the directors are responsible for assessing the ability of the Group to
continue as a going concern, disclosing, as applicable, matters related to going concern and using the going
concern basis of accounting unless the directors either intend to liquidate the Group or cease operations,
or have no realistic alternative but to do so.
Auditor’s Responsibility for the Audit of the Financial Report
Our objectives are to obtain reasonable assurance about whether the financial report as a whole is free
from material misstatement, whether due to fraud or error, and to issue an auditor’s report that includes
our opinion. Reasonable assurance is a high level of assurance, but is not a guarantee that an audit
conducted in accordance with Australian Auditing Standards will always detect a material misstatement
when it exists. Misstatements can arise from fraud or error and are considered material if individually or in
the aggregate, they could reasonably be expected to influence the economic decisions of users taken on the
basis of this financial report.
A further description of our responsibilities for the audit of the financial report is located at the Auditing
and Assurance Standards Board website at: www.auasb.gov.au/Home.aspx.
We communicate with the directors regarding, amongst other matters, the planned scope and timing of the
audit and significant audit findings, including any significant deficiencies in internal control that we identify
during our audit.
We also provide the directors with a statement that we have complied with relevant ethical requirements
regarding independence, and to communicate with them all relationships and other matters that may
reasonably be thought to bear on our independence and where applicable, related safeguards.
From the matters communicated with the directors, we determine those matters that were of most
significance in the audit of the financial report of the current period and are therefore the key audit matters.
We describe those matters in our auditor’s report unless law or regulation precludes public disclosure about
the matter or when, in extremely rare circumstances, we determine that a matter should not be
communicated in our report because the adverse consequences of doing so would reasonably be expected
to outweigh the public interest benefits of such communications.
Report on the Remuneration Report
Opinion on the Remuneration Report
We have audited the remuneration report included in the directors’ report for the year ended 30 June 2020.
In our opinion the remuneration report of Bentley Capital Limited for the year ended 30 June 2020 complies
with section 300A of the Corporations Act 2001.
INDEPENDENT AUDITOR’S REPORT TO THE MEMBERS OF
BENTLEY CAPITAL LIMITED (continued)
Responsibilities
The directors of the Company are responsible for the preparation and presentation of the Remuneration
Report in accordance with section 300A of the Corporations Act 2001. Our responsibility is to express an
opinion on the Remuneration Report, based on our audit conducted in accordance with Australian Auditing
Standards.
Rothsay Auditing Daniel DallaPartner
Dated 20 August 2020
30 JUNE 2020 BENTLEY CAPITAL LIMITED A.B.N. 87 008 108 218
INVESTMENT MANDATE
ANNUAL REPORT |52
The Investment Objectives of Bentley are to: • Achieve a high real rate of return over the
medium term, ideally comprising both income and capital growth, whilst operating within acceptable risk parameters set by the Board; and
• Deliver a regular income stream for shareholders.
1. INVESTMENT STRATEGY
Bentley will implement an actively managed investment strategy undertaking investments typically into one of two broad investment categories: • Strategic Investments; and • Non-strategic Investments. Bentley will not allocate a fixed proportion of funds into each or any of the above investment categories, as it believes that complete flexibility to invest across these categories is key to maximising medium-term value growth for shareholders. For each strategic and non-strategic investment, Bentley will expect to receive a level of return that is commensurate with the level of risk associated with such investment. In each investment and for the investment portfolio in aggregate, Bentley will at least aim to achieve a return that is consistently in excess of an appropriate benchmark share index and or a return which could be earned from investments in cash, bills of exchange or negotiable instruments drawn or endorsed by a bank, non-bank financial institution or a government.
(a) Strategic Investments
Bentley will seek to undertake investments in which it can reasonably expect to exert a degree of influence, including board representation or through playing an active role alongside management in order to enhance or realise shareholder value. Investments will include those that have the potential for turnaround in profitability or capital appreciation through the introduction of new management, capital, improved business practices, industry rationalisation, and/or improved investor relations. Strategic investments by their nature will rely heavily on Bentley’s ability to identify, attract and exploit unique opportunities.
(b) Non-Strategic Investments
Bentley will seek to make non-strategic investments in entities where attractive investment opportunities develop due to market sentiment or mispricing or where Bentley sees other potential for generating positive returns. In contrast to strategic investments, with non-strategic investments Bentley does not envisage that it will take an active role in the management of the investment.
2. PORTFOLIO ALLOCATION
In executing its Investment Strategy, Bentley may, from time to time, hold a high proportion of net assets in cash, preferring to be patient and selective rather than filling its investment portfolio with mediocre or underperforming investments for the sake of becoming “fully-invested”. Bentley will not be limited to the principles of broad diversification; in other words, Bentley may invest a significant proportion of funds in any single investment that represents an exceptional opportunity.
3. INVESTMENTS
Investments may be made by Bentley in Australia and overseas and into any underlying industry, business or sector, in accordance with Bentley’s stated Investment Objectives and Strategies. In pursuit of the Investment Objectives and execution of the Investment Strategies outlined above, Bentley will have absolute discretion in applying its equity and any debt funds to a universe or range of potential investments in assets, businesses, securities, hybrid securities, cash, bills of exchange, other negotiable investments, debentures and other investments and structures.
4. MANAGEMENT OF INVESTMENTS
Bentley’s investment decisions are carried out by its Investment Committee, which currently comprises Executive Chairman, Farooq Khan, Executive Director, William Johnson and Company Secretary, Victor Ho (in conjunction with external consultants and advisers where appropriate). If it believed that it is in the best interests of Bentley, the Board may choose to delegate part or all of the responsibility for making investment decisions to an external investment manager, subject to the investment manager having appropriate capabilities, experience and the necessary Australian Financial Services Licence(s). * Investment Mandate was approved by shareholders at a
general meeting held on 25 February 2009
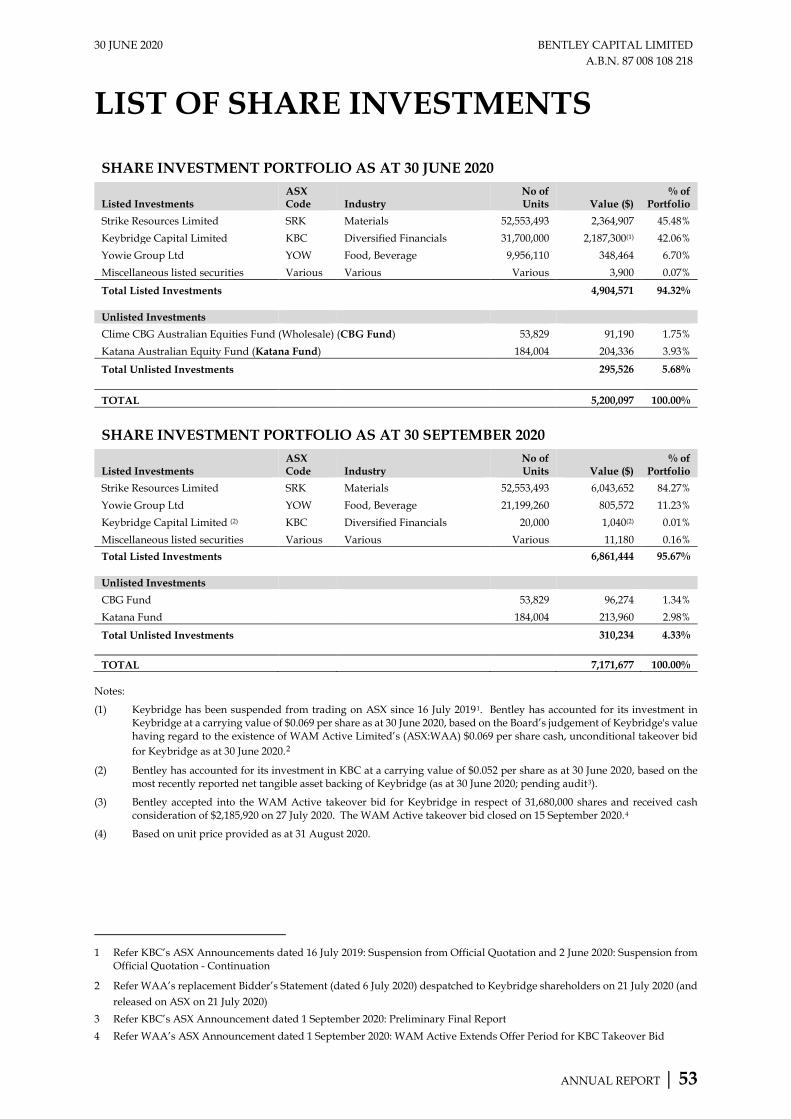
30 JUNE 2020 BENTLEY CAPITAL LIMITED A.B.N. 87 008 108 218
LIST OF SHARE INVESTMENTS
ANNUAL REPORT | 53
SHARE INVESTMENT PORTFOLIO AS AT 30 JUNE 2020
Listed Investments ASX Code Industry
No of Units Value ($)
% of Portfolio
Strike Resources Limited SRK Materials 52,553,493 2,364,907 45.48% Keybridge Capital Limited KBC Diversified Financials 31,700,000 2,187,300(1) 42.06% Yowie Group Ltd YOW Food, Beverage 9,956,110 348,464 6.70% Miscellaneous listed securities Various Various Various 3,900 0.07%
Total Listed Investments 4,904,571 94.32% Unlisted Investments Clime CBG Australian Equities Fund (Wholesale) (CBG Fund) 53,829 91,190 1.75% Katana Australian Equity Fund (Katana Fund) 184,004 204,336 3.93%
Total Unlisted Investments 295,526 5.68%
TOTAL 5,200,097 100.00%
SHARE INVESTMENT PORTFOLIO AS AT 30 SEPTEMBER 2020
Listed Investments ASX Code Industry
No of Units Value ($)
% of Portfolio
Strike Resources Limited SRK Materials 52,553,493 6,043,652 84.27% Yowie Group Ltd YOW Food, Beverage 21,199,260 805,572 11.23% Keybridge Capital Limited (2) KBC Diversified Financials 20,000 1,040(2) 0.01% Miscellaneous listed securities Various Various Various 11,180 0.16% Total Listed Investments 6,861,444 95.67% Unlisted Investments CBG Fund 53,829 96,274 1.34% Katana Fund 184,004 213,960 2.98%
Total Unlisted Investments 310,234 4.33% TOTAL 7,171,677 100.00%
Notes:
(1) Keybridge has been suspended from trading on ASX since 16 July 20191. Bentley has accounted for its investment in Keybridge at a carrying value of $0.069 per share as at 30 June 2020, based on the Board’s judgement of Keybridge's value having regard to the existence of WAM Active Limited’s (ASX:WAA) $0.069 per share cash, unconditional takeover bid for Keybridge as at 30 June 2020.2
(2) Bentley has accounted for its investment in KBC at a carrying value of $0.052 per share as at 30 June 2020, based on the most recently reported net tangible asset backing of Keybridge (as at 30 June 2020; pending audit3).
(3) Bentley accepted into the WAM Active takeover bid for Keybridge in respect of 31,680,000 shares and received cash consideration of $2,185,920 on 27 July 2020. The WAM Active takeover bid closed on 15 September 2020.4
(4) Based on unit price provided as at 31 August 2020.
1 Refer KBC’s ASX Announcements dated 16 July 2019: Suspension from Official Quotation and 2 June 2020: Suspension from
Official Quotation - Continuation
2 Refer WAA’s replacement Bidder’s Statement (dated 6 July 2020) despatched to Keybridge shareholders on 21 July 2020 (and released on ASX on 21 July 2020)
3 Refer KBC’s ASX Announcement dated 1 September 2020: Preliminary Final Report 4 Refer WAA’s ASX Announcement dated 1 September 2020: WAM Active Extends Offer Period for KBC Takeover Bid
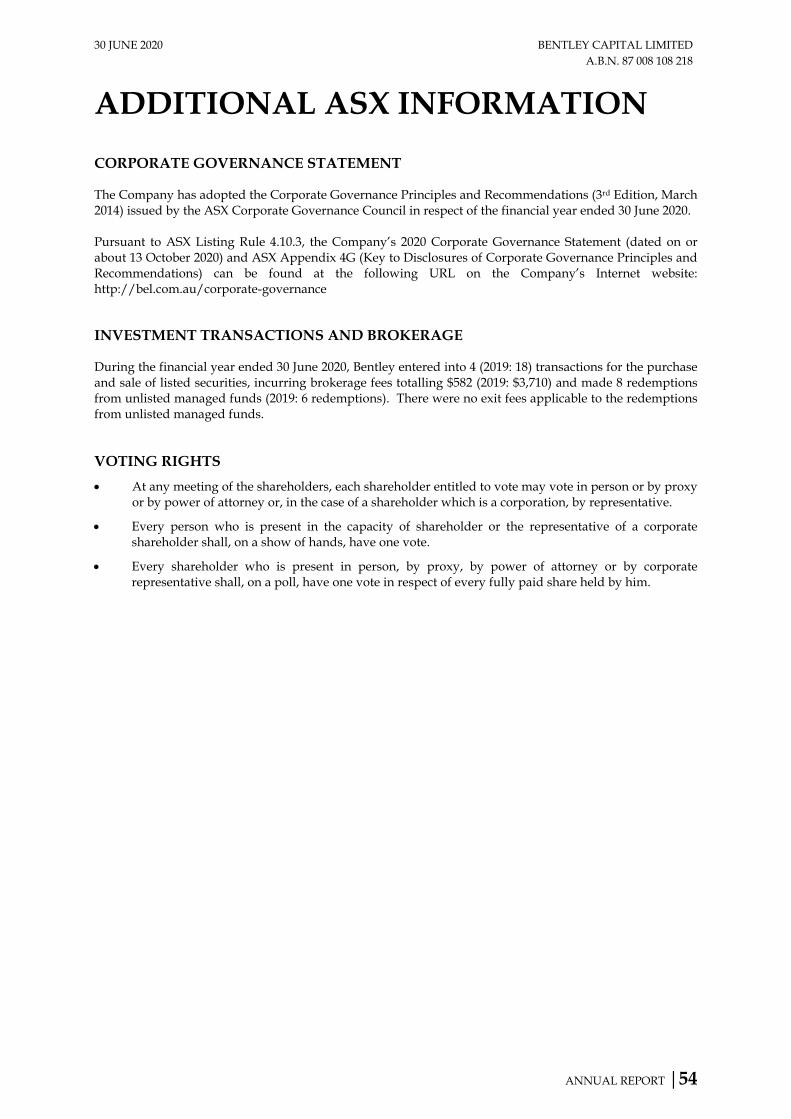
30 JUNE 2020 BENTLEY CAPITAL LIMITED A.B.N. 87 008 108 218
ADDITIONAL ASX INFORMATION
ANNUAL REPORT |54
CORPORATE GOVERNANCE STATEMENT The Company has adopted the Corporate Governance Principles and Recommendations (3rd Edition, March 2014) issued by the ASX Corporate Governance Council in respect of the financial year ended 30 June 2020. Pursuant to ASX Listing Rule 4.10.3, the Company’s 2020 Corporate Governance Statement (dated on or about 13 October 2020) and ASX Appendix 4G (Key to Disclosures of Corporate Governance Principles and Recommendations) can be found at the following URL on the Company’s Internet website: http://bel.com.au/corporate-governance INVESTMENT TRANSACTIONS AND BROKERAGE During the financial year ended 30 June 2020, Bentley entered into 4 (2019: 18) transactions for the purchase and sale of listed securities, incurring brokerage fees totalling $582 (2019: $3,710) and made 8 redemptions from unlisted managed funds (2019: 6 redemptions). There were no exit fees applicable to the redemptions from unlisted managed funds. VOTING RIGHTS • At any meeting of the shareholders, each shareholder entitled to vote may vote in person or by proxy
or by power of attorney or, in the case of a shareholder which is a corporation, by representative.
• Every person who is present in the capacity of shareholder or the representative of a corporate shareholder shall, on a show of hands, have one vote.
• Every shareholder who is present in person, by proxy, by power of attorney or by corporate representative shall, on a poll, have one vote in respect of every fully paid share held by him.
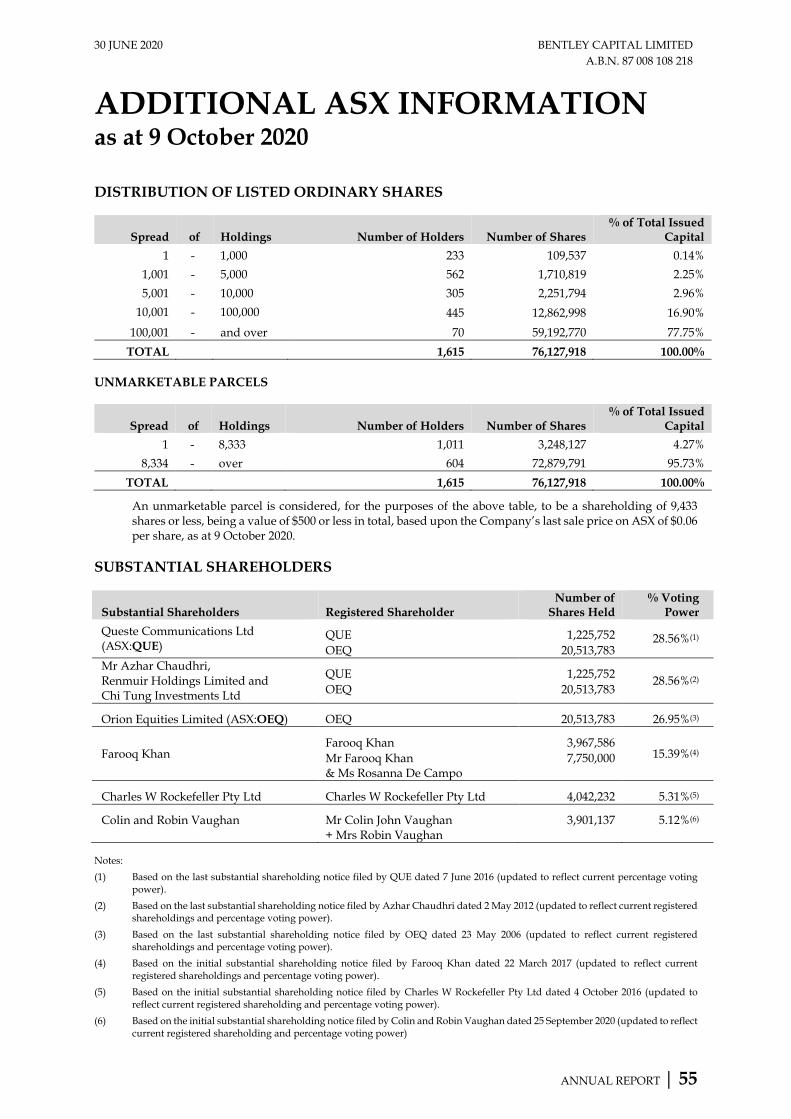
30 JUNE 2020 BENTLEY CAPITAL LIMITED A.B.N. 87 008 108 218
ADDITIONAL ASX INFORMATION as at 9 October 2020
ANNUAL REPORT | 55
DISTRIBUTION OF LISTED ORDINARY SHARES
Spread of Holdings Number of Holders Number of Shares % of Total Issued
Capital 1 - 1,000 233 109,537 0.14%
1,001 - 5,000 562 1,710,819 2.25% 5,001 - 10,000 305 2,251,794 2.96%
10,001 - 100,000 445 12,862,998 16.90% 100,001 - and over 70 59,192,770 77.75%
TOTAL 1,615 76,127,918 100.00% UNMARKETABLE PARCELS
Spread of Holdings Number of Holders Number of Shares % of Total Issued
Capital 1 - 8,333 1,011 3,248,127 4.27%
8,334 - over 604 72,879,791 95.73% TOTAL 1,615 76,127,918 100.00%
An unmarketable parcel is considered, for the purposes of the above table, to be a shareholding of 9,433 shares or less, being a value of $500 or less in total, based upon the Company’s last sale price on ASX of $0.06 per share, as at 9 October 2020.
SUBSTANTIAL SHAREHOLDERS
Substantial Shareholders Registered Shareholder Number of
Shares Held % Voting
Power Queste Communications Ltd (ASX:QUE)
QUE 1,225,752 28.56%(1) OEQ 20,513,783
Mr Azhar Chaudhri, Renmuir Holdings Limited and Chi Tung Investments Ltd
QUE 1,225,752 28.56%(2) OEQ 20,513,783
Orion Equities Limited (ASX:OEQ) OEQ 20,513,783 26.95%(3)
Farooq Khan Farooq Khan 3,967,586
15.39%(4) Mr Farooq Khan & Ms Rosanna De Campo
7,750,000
Charles W Rockefeller Pty Ltd Charles W Rockefeller Pty Ltd 4,042,232 5.31%(5)
Colin and Robin Vaughan Mr Colin John Vaughan + Mrs Robin Vaughan
3,901,137 5.12%(6)
Notes: (1) Based on the last substantial shareholding notice filed by QUE dated 7 June 2016 (updated to reflect current percentage voting
power). (2) Based on the last substantial shareholding notice filed by Azhar Chaudhri dated 2 May 2012 (updated to reflect current registered
shareholdings and percentage voting power). (3) Based on the last substantial shareholding notice filed by OEQ dated 23 May 2006 (updated to reflect current registered
shareholdings and percentage voting power). (4) Based on the initial substantial shareholding notice filed by Farooq Khan dated 22 March 2017 (updated to reflect current
registered shareholdings and percentage voting power). (5) Based on the initial substantial shareholding notice filed by Charles W Rockefeller Pty Ltd dated 4 October 2016 (updated to
reflect current registered shareholding and percentage voting power). (6) Based on the initial substantial shareholding notice filed by Colin and Robin Vaughan dated 25 September 2020 (updated to reflect
current registered shareholding and percentage voting power)
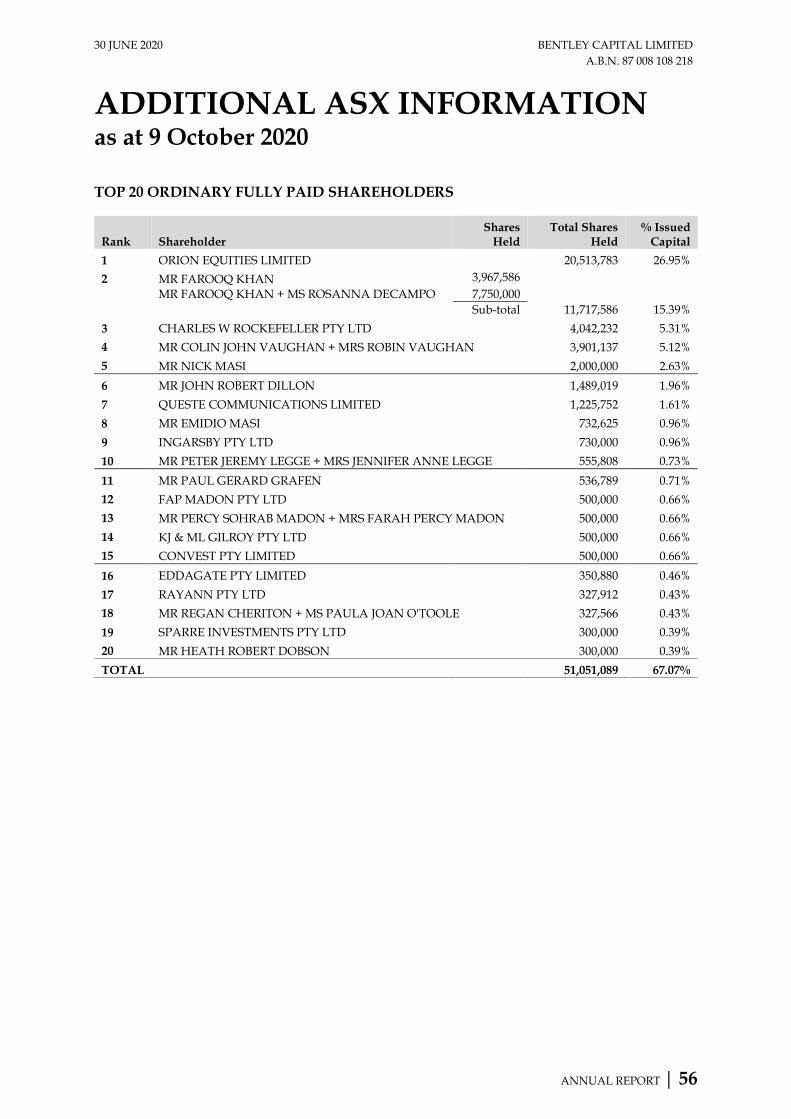
30 JUNE 2020 BENTLEY CAPITAL LIMITED A.B.N. 87 008 108 218
ADDITIONAL ASX INFORMATION as at 9 October 2020
ANNUAL REPORT | 56
TOP 20 ORDINARY FULLY PAID SHAREHOLDERS
Rank Shareholder Shares
Held Total Shares
Held % Issued
Capital 1 ORION EQUITIES LIMITED 20,513,783 26.95% 2 MR FAROOQ KHAN 3,967,586 MR FAROOQ KHAN + MS ROSANNA DECAMPO 7,750,000 Sub-total 11,717,586 15.39% 3 CHARLES W ROCKEFELLER PTY LTD 4,042,232 5.31% 4 MR COLIN JOHN VAUGHAN + MRS ROBIN VAUGHAN 3,901,137 5.12% 5 MR NICK MASI 2,000,000 2.63% 6 MR JOHN ROBERT DILLON 1,489,019 1.96% 7 QUESTE COMMUNICATIONS LIMITED 1,225,752 1.61% 8 MR EMIDIO MASI 732,625 0.96% 9 INGARSBY PTY LTD 730,000 0.96% 10 MR PETER JEREMY LEGGE + MRS JENNIFER ANNE LEGGE 555,808 0.73% 11 MR PAUL GERARD GRAFEN 536,789 0.71% 12 FAP MADON PTY LTD 500,000 0.66% 13 MR PERCY SOHRAB MADON + MRS FARAH PERCY MADON 500,000 0.66% 14 KJ & ML GILROY PTY LTD 500,000 0.66% 15 CONVEST PTY LIMITED 500,000 0.66% 16 EDDAGATE PTY LIMITED 350,880 0.46% 17 RAYANN PTY LTD 327,912 0.43% 18 MR REGAN CHERITON + MS PAULA JOAN O'TOOLE 327,566 0.43% 19 SPARRE INVESTMENTS PTY LTD 300,000 0.39% 20 MR HEATH ROBERT DOBSON 300,000 0.39% TOTAL 51,051,089 67.07%

ASX Code: BEL
Bentley Capital Limited A.B.N. 87 008 108 218
REGISTERED OFFICE: SHARE REGISTRY: Level 2 31 Ventnor Avenue West Perth, Western Australia 6005 T |(08) 9214 9757 F | (08) 9214 9701 E | [email protected]
W | www.bel.com.au
Advanced Share Registry Limited Western Australia – Main Office 110 Stirling Highway Nedlands, Western Australia 6009 PO Box 1156, Nedlands Western Australia 6909 Local T | 1300 113 258 T | (08) 9389 8033 F | (08) 6370 4203 E | [email protected]
New South Wales – Branch Office Suite 8H, 325 Pitt Street Sydney, New South Wales 2000 PO Box Q1736 Queen Victoria Building NSW 1230 T | (02) 8096 3502 W | www.advancedshare.com.au