Embed Size (px)
Citation preview

2019/20 StatisticsFederal Financial Supervisory Authority
Reinsurance undertakings
© iS
tock
-996
5735
06_o
oddy
smile
2019/20 Statistics
Federal Financial Supervisory Authority (Bundesanstalt für Finanzdienstleistungsaufsicht – BaFin)
– Reinsurance undertakings –
Content
I. Reinsurance Supervision in 2020 6
1 Authorised reinsurance undertakings 7
2 Economic trends 8
II. Statistical evaluation for 2019 10
1 Premiums 12
2 Losses 14
3 Technical provisions 14
4 Investments 16
5 Solvency 17


I
Reinsurance Supervision in 2020
1 Authorised reinsurance undertakings
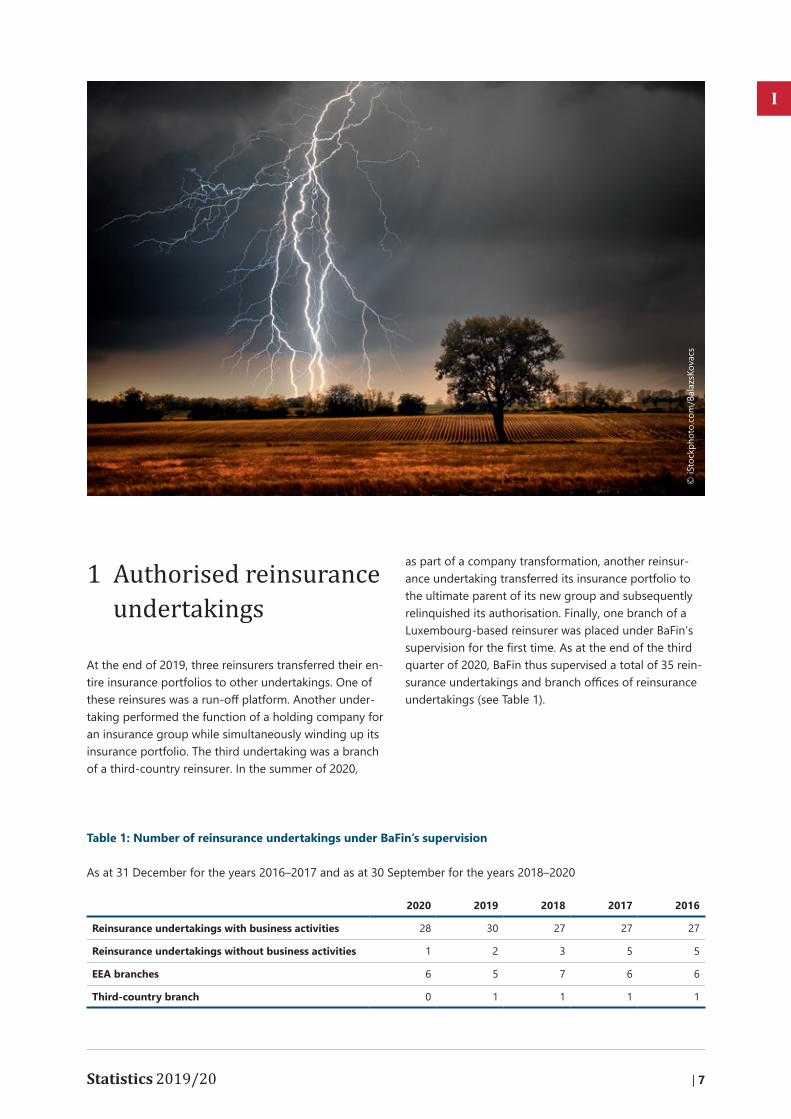
At the end of 2019, three reinsurers transferred their entire insurance portfolios to other undertakings. One of these reinsures was a run-off platform. Another undertaking performed the function of a holding company for an insurance group while simultaneously winding up its insurance portfolio. The third undertaking was a branch of a third-country reinsurer. In the summer of 2020,
as part of a company transformation, another reinsurance undertaking transferred its insurance portfolio to the ultimate parent of its new group and subsequently relinquished its authorisation. Finally, one branch of a Luxembourg-based reinsurer was placed under BaFin’s supervision for the first time. As at the end of the third quarter of 2020, BaFin thus supervised a total of 35 reinsurance undertakings and branch offices of reinsurance undertakings (see Table 1).
© iS
tock
phot
o.co
m/B
alaz
sKov
acs
Table 1: Number of reinsurance undertakings under BaFin’s supervision
As at 31 December for the years 2016–2017 and as at 30 September for the years 2018–2020
2020 2019 2018 2017 2016
Reinsurance undertakings with business activities 28 30 27 27 27
Reinsurance undertakings without business activities 1 2 3 5 5
EEA branches 6 5 7 6 6
Third-country branch 0 1 1 1 1
I
Statistics 2019/20 | 7
2 Economic trends
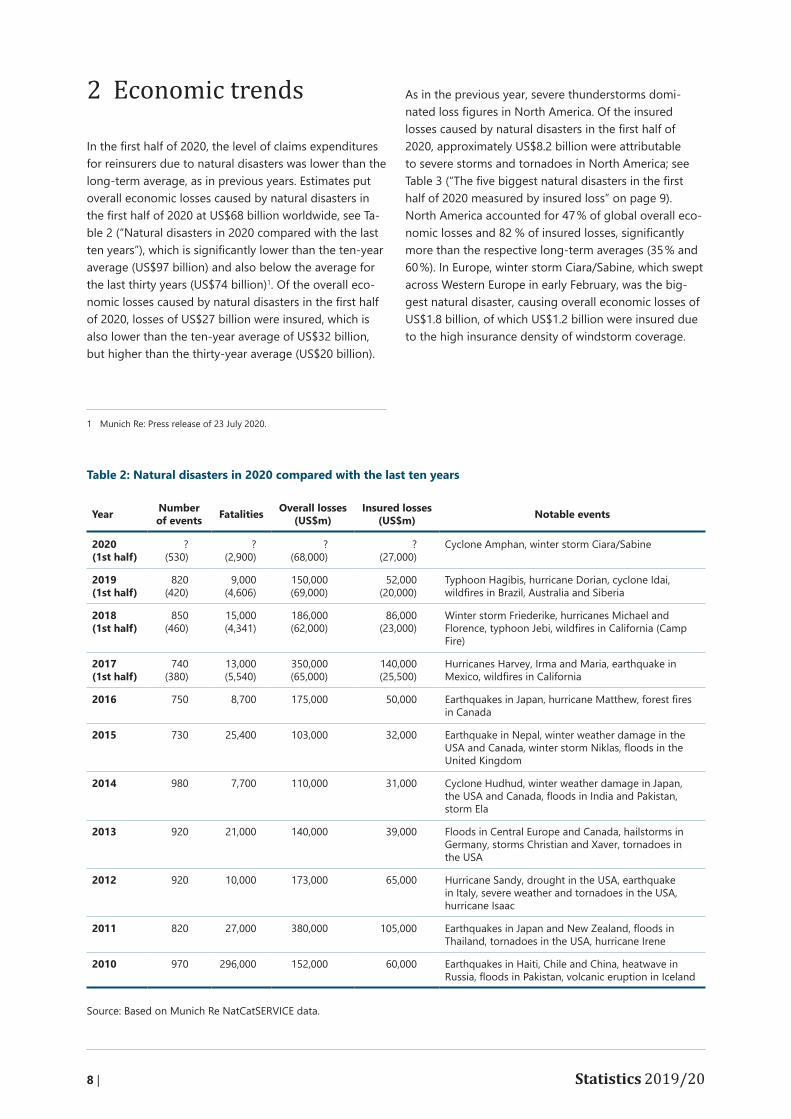
In the first half of 2020, the level of claims expenditures for reinsurers due to natural disasters was lower than the long-term average, as in previous years. Estimates put overall economic losses caused by natural disasters in the first half of 2020 at US$68 billion worldwide, see Table 2 (“Natural disasters in 2020 compared with the last ten years”), which is significantly lower than the ten-year average (US$97 billion) and also below the average for the last thirty years (US$74 billion)1. Of the overall economic losses caused by natural disasters in the first half of 2020, losses of US$27 billion were insured, which is also lower than the ten-year average of US$32 billion, but higher than the thirty-year average (US$20 billion).
1 Munich Re: Press release of 23 July 2020.
As in the previous year, severe thunderstorms domi-nated loss figures in North America. Of the insured losses caused by natural disasters in the first half of 2020, approximately US$8.2 billion were attributable to severe storms and tornadoes in North America; see Table 3 (“The five biggest natural disasters in the first half of 2020 measured by insured loss” on page 9). North America accounted for 47 % of global overall economic losses and 82 % of insured losses, significantly more than the respective long-term averages (35 % and 60 %). In Europe, winter storm Ciara/Sabine, which swept across Western Europe in early February, was the biggest natural disaster, causing overall economic losses of US$1.8 billion, of which US$1.2 billion were insured due to the high insurance density of windstorm coverage.
Table 2: Natural disasters in 2020 compared with the last ten years
Year Number of events Fatalities Overall losses
(US$m)Insured losses
(US$m) Notable events
2020 (1st half)
? (530)
? (2,900)
? (68,000)
? (27,000)
Cyclone Amphan, winter storm Ciara/Sabine
2019 (1st half)
820 (420)
9,000 (4,606)
150,000 (69,000)
52,000 (20,000)
Typhoon Hagibis, hurricane Dorian, cyclone Idai, wildfires in Brazil, Australia and Siberia
2018 (1st half)
850 (460)
15,000 (4,341)
186,000 (62,000)
86,000 (23,000)
Winter storm Friederike, hurricanes Michael and Florence, typhoon Jebi, wildfires in California (Camp Fire)
2017 (1st half)
740 (380)
13,000 (5,540)
350,000 (65,000)
140,000 (25,500)
Hurricanes Harvey, Irma and Maria, earthquake in Mexico, wildfires in California
2016 750 8,700 175,000 50,000 Earthquakes in Japan, hurricane Matthew, forest fires in Canada
2015 730 25,400 103,000 32,000 Earthquake in Nepal, winter weather damage in the USA and Canada, winter storm Niklas, floods in the United Kingdom
2014 980 7,700 110,000 31,000 Cyclone Hudhud, winter weather damage in Japan, the USA and Canada, floods in India and Pakistan, storm Ela
2013 920 21,000 140,000 39,000 Floods in Central Europe and Canada, hailstorms in Germany, storms Christian and Xaver, tornadoes in the USA
2012 920 10,000 173,000 65,000 Hurricane Sandy, drought in the USA, earthquake in Italy, severe weather and tornadoes in the USA, hurricane Isaac
2011 820 27,000 380,000 105,000 Earthquakes in Japan and New Zealand, floods in Thailand, tornadoes in the USA, hurricane Irene
2010 970 296,000 152,000 60,000 Earthquakes in Haiti, Chile and China, heatwave in Russia, floods in Pakistan, volcanic eruption in Iceland
Source: Based on Munich Re NatCatSERVICE data.
8 | Statistics 2019/20
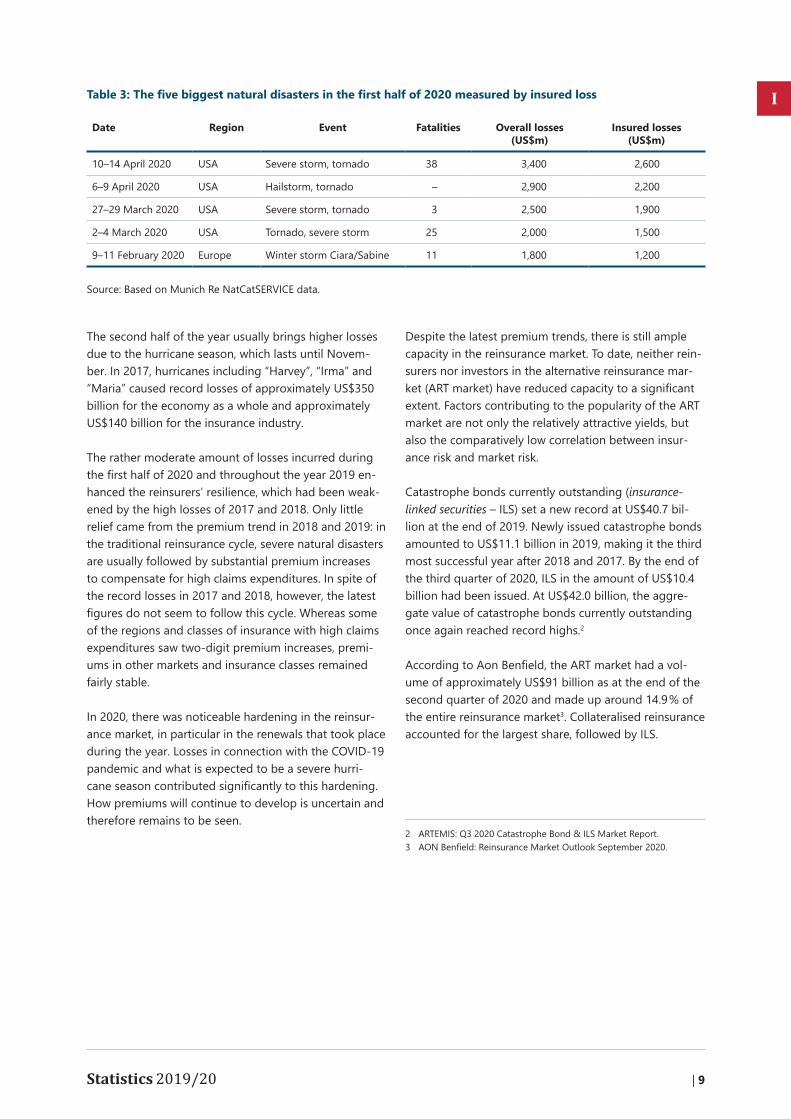
The second half of the year usually brings higher losses due to the hurricane season, which lasts until November. In 2017, hurricanes including “Harvey”, “Irma” and “Maria” caused record losses of approximately US$350 billion for the economy as a whole and approximately US$140 billion for the insurance industry.
The rather moderate amount of losses incurred during the first half of 2020 and throughout the year 2019 enhanced the reinsurers’ resilience, which had been weakened by the high losses of 2017 and 2018. Only little relief came from the premium trend in 2018 and 2019: in the traditional reinsurance cycle, severe natural disasters are usually followed by substantial premium increases to compensate for high claims expenditures. In spite of the record losses in 2017 and 2018, however, the latest figures do not seem to follow this cycle. Whereas some of the regions and classes of insurance with high claims expenditures saw two-digit premium increases, premiums in other markets and insurance classes remained fairly stable.
In 2020, there was noticeable hardening in the reinsurance market, in particular in the renewals that took place during the year. Losses in connection with the COVID-19 pandemic and what is expected to be a severe hurricane season contributed significantly to this hardening. How premiums will continue to develop is uncertain and therefore remains to be seen.
Despite the latest premium trends, there is still ample capacity in the reinsurance market. To date, neither reinsurers nor investors in the alternative reinsurance market (ART market) have reduced capacity to a significant extent. Factors contributing to the popularity of the ART market are not only the relatively attractive yields, but also the comparatively low correlation between insurance risk and market risk.
Catastrophe bonds currently outstanding (insurance-linked securities – ILS) set a new record at US$40.7 billion at the end of 2019. Newly issued catastrophe bonds amounted to US$11.1 billion in 2019, making it the third most successful year after 2018 and 2017. By the end of the third quarter of 2020, ILS in the amount of US$10.4 billion had been issued. At US$42.0 billion, the aggregate value of catastrophe bonds currently outstanding once again reached record highs.2
According to Aon Benfield, the ART market had a volume of approximately US$91 billion as at the end of the second quarter of 2020 and made up around 14.9 % of the entire reinsurance market3. Collateralised reinsurance accounted for the largest share, followed by ILS.
2 ARTEMIS: Q3 2020 Catastrophe Bond & ILS Market Report.3 AON Benfield: Reinsurance Market Outlook September 2020.
Table 3: The five biggest natural disasters in the first half of 2020 measured by insured loss
Date Region Event Fatalities Overall losses (US$m)
Insured losses (US$m)
10–14 April 2020 USA Severe storm, tornado 38 3,400 2,600
6–9 April 2020 USA Hailstorm, tornado – 2,900 2,200
27–29 March 2020 USA Severe storm, tornado 3 2,500 1,900
2–4 March 2020 USA Tornado, severe storm 25 2,000 1,500
9–11 February 2020 Europe Winter storm Ciara/Sabine 11 1,800 1,200
Source: Based on Munich Re NatCatSERVICE data.
Statistics 2019/20 | 9
I
II
Statistical evaluation for 2019

The editorial deadline for the reinsurance statistics presented here was 23 October 2020. Subsequent assessments, additional reports and corrections to figures may lead to ex post changes. Any changes to prior-year figures in the following tables are due to subsequent corrections.
The time lag between the year under review, 2019, and the publication of BaFin’s reinsurance statistics limits the informative value of this snapshot analysis and does not permit any conclusions to be drawn about the current situation.
The report on the statistics for financial year 2019 and 2018/2019 includes the data of 29 reinsurers (previous year: 29). The majority are stock corporations, one is a mutual insurance association (Versicherungsverein auf Gegenseitigkeit) and two are insurance undertakings under public law.
The data in the tables below are based on industry revenue. This figure is the total of the templates submitted by the reinsurance undertakings, calculated for each insurance segment. This not only allows for all the values to be reconstructed at any time, but also enables additional (consistent) data to be retrieved from the data sets if needed.
A disadvantage of this approach is that – depending on the templates actually submitted – the number of reporting reinsurance undertakings may differ from table to table. As far as the industry data are concerned, however, this does not have any significant impact, because these data are only published after all the relevant undertakings have submitted correct data, thus ensuring completeness at all times.
“Solvency II”, the new supervisory regime, entered into force on 1 January 2016. One of the advantages of Solvency II is the fact that reinsurance undertakings are now required to submit their reports much earlier than before. The reporting deadline for insurance and reinsurance undertakings is identical. The statistics on reinsurance undertakings are therefore prepared and published prior to the end of the year after the reporting year.
The statistical evaluation covers almost exclusively data that are based on the Solvency II supervisory regime. Nevertheless, BaFin continues to collect data (forms and statements under the German Insurance Reporting Regulation (Versicherungsberichterstattungs-Verordnung – BerVersV)) based on the accounting principles under the German Commercial Code (Handelsgesetzbuch – HGB), not least for statistical purposes. For the sake of completeness, these data – without explanations – will be published on BaFin’s website in the spring of 2021 in the usual format.
© iS
tock
phot
o.co
m/r
clas
senl
ayou
ts
Statistics 2019/20 | 11
II
1 Premiums
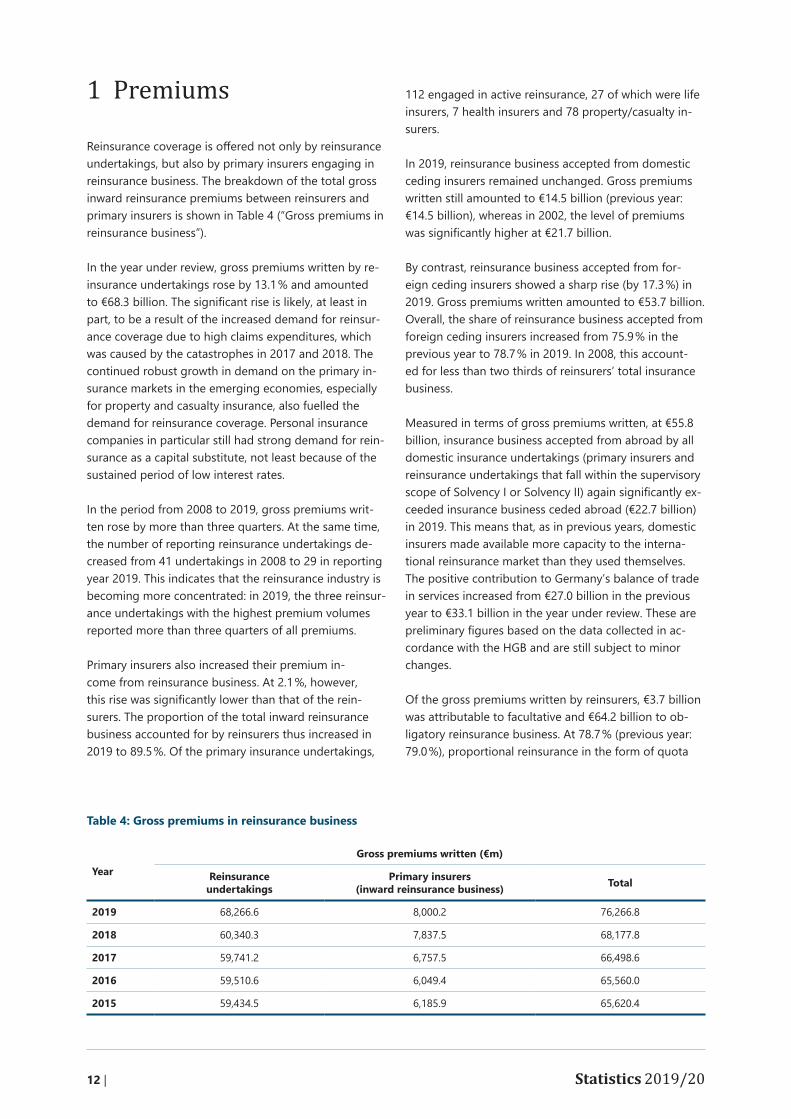
Reinsurance coverage is offered not only by reinsurance undertakings, but also by primary insurers engaging in reinsurance business. The breakdown of the total gross inward reinsurance premiums between reinsurers and primary insurers is shown in Table 4 (“Gross premiums in reinsurance business”).
In the year under review, gross premiums written by reinsurance undertakings rose by 13.1 % and amounted to €68.3 billion. The significant rise is likely, at least in part, to be a result of the increased demand for reinsurance coverage due to high claims expenditures, which was caused by the catastrophes in 2017 and 2018. The continued robust growth in demand on the primary insurance markets in the emerging economies, especially for property and casualty insurance, also fuelled the demand for reinsurance coverage. Personal insurance companies in particular still had strong demand for reinsurance as a capital substitute, not least because of the sustained period of low interest rates.
In the period from 2008 to 2019, gross premiums written rose by more than three quarters. At the same time, the number of reporting reinsurance undertakings decreased from 41 undertakings in 2008 to 29 in reporting year 2019. This indicates that the reinsurance industry is becoming more concentrated: in 2019, the three reinsurance undertakings with the highest premium volumes reported more than three quarters of all premiums.
Primary insurers also increased their premium income from reinsurance business. At 2.1 %, however, this rise was significantly lower than that of the reinsurers. The proportion of the total inward reinsurance business accounted for by reinsurers thus increased in 2019 to 89.5 %. Of the primary insurance undertakings,
112 engaged in active reinsurance, 27 of which were life insurers, 7 health insurers and 78 property/casualty insurers.
In 2019, reinsurance business accepted from domestic ceding insurers remained unchanged. Gross premiums written still amounted to €14.5 billion (previous year: €14.5 billion), whereas in 2002, the level of premiums was significantly higher at €21.7 billion.
By contrast, reinsurance business accepted from foreign ceding insurers showed a sharp rise (by 17.3 %) in 2019. Gross premiums written amounted to €53.7 billion. Overall, the share of reinsurance business accepted from foreign ceding insurers increased from 75.9 % in the previous year to 78.7 % in 2019. In 2008, this accounted for less than two thirds of reinsurers’ total insurance business.
Measured in terms of gross premiums written, at €55.8 billion, insurance business accepted from abroad by all domestic insurance undertakings (primary insurers and reinsurance undertakings that fall within the supervisory scope of Solvency I or Solvency II) again significantly exceeded insurance business ceded abroad (€22.7 billion) in 2019. This means that, as in previous years, domestic insurers made available more capacity to the international reinsurance market than they used themselves. The positive contribution to Germany’s balance of trade in services increased from €27.0 billion in the previous year to €33.1 billion in the year under review. These are preliminary figures based on the data collected in accordance with the HGB and are still subject to minor changes.
Of the gross premiums written by reinsurers, €3.7 billion was attributable to facultative and €64.2 billion to obligatory reinsurance business. At 78.7 % (previous year: 79.0 %), proportional reinsurance in the form of quota
Table 4: Gross premiums in reinsurance business
YearGross premiums written (€m)
Reinsurance undertakings
Primary insurers (inward reinsurance business) Total
2019 68,266.6 8,000.2 76,266.8
2018 60,340.3 7,837.5 68,177.8
2017 59,741.2 6,757.5 66,498.6
2016 59,510.6 6,049.4 65,560.0
2015 59,434.5 6,185.9 65,620.4
12 | Statistics 2019/20
share and surplus treaties continued to make up the largest proportion of gross premiums written. These are preliminary figures based on the data collected in accordance with the HGB and are still subject to minor changes.
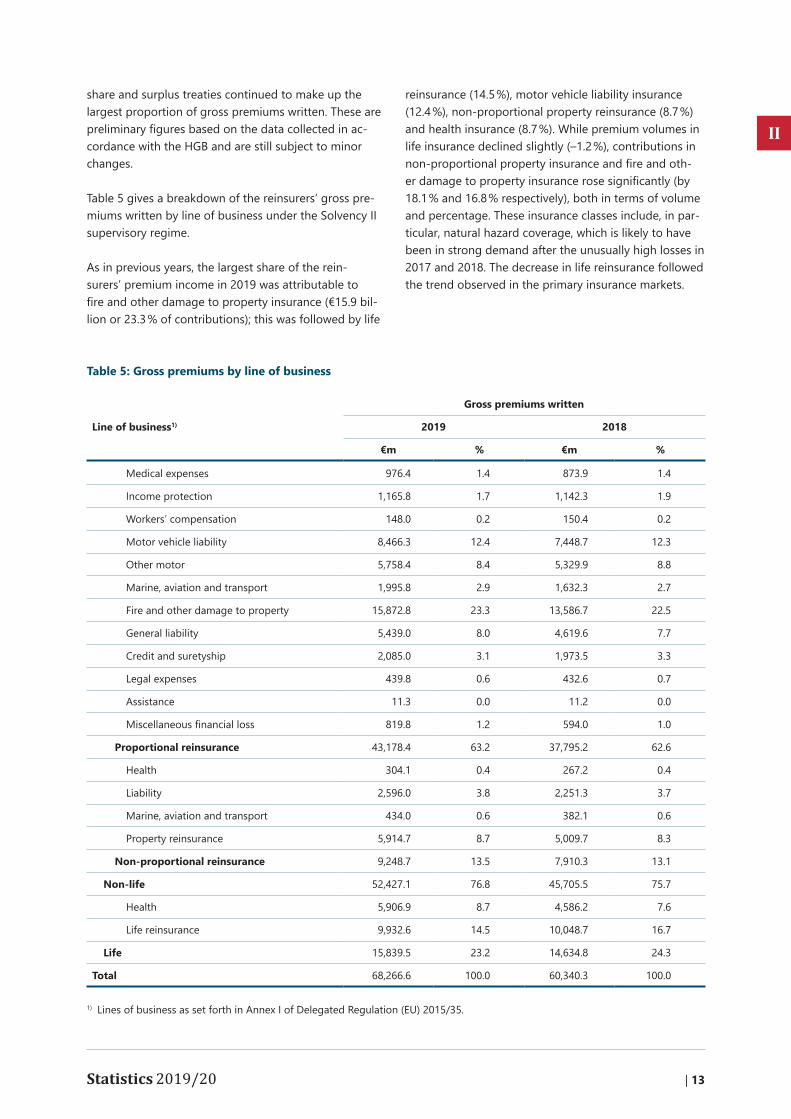
Table 5 gives a breakdown of the reinsurers’ gross premiums written by line of business under the Solvency II supervisory regime.
As in previous years, the largest share of the reinsurers’ premium income in 2019 was attributable to fire and other damage to property insurance (€15.9 billion or 23.3 % of contributions); this was followed by life
reinsurance (14.5 %), motor vehicle liability insurance (12.4 %), non-proportional property reinsurance (8.7 %) and health insurance (8.7 %). While premium volumes in life insurance declined slightly (–1.2 %), contributions in non-proportional property insurance and fire and other damage to property insurance rose significantly (by 18.1 % and 16.8 % respectively), both in terms of volume and percentage. These insurance classes include, in particular, natural hazard coverage, which is likely to have been in strong demand after the unusually high losses in 2017 and 2018. The decrease in life reinsurance followed the trend observed in the primary insurance markets.
Table 5: Gross premiums by line of business
Line of business1)
Gross premiums written
2019 2018
€m % €m %
Medical expenses 976.4 1.4 873.9 1.4
Income protection 1,165.8 1.7 1,142.3 1.9
Workers’ compensation 148.0 0.2 150.4 0.2
Motor vehicle liability 8,466.3 12.4 7,448.7 12.3
Other motor 5,758.4 8.4 5,329.9 8.8
Marine, aviation and transport 1,995.8 2.9 1,632.3 2.7
Fire and other damage to property 15,872.8 23.3 13,586.7 22.5
General liability 5,439.0 8.0 4,619.6 7.7
Credit and suretyship 2,085.0 3.1 1,973.5 3.3
Legal expenses 439.8 0.6 432.6 0.7
Assistance 11.3 0.0 11.2 0.0
Miscellaneous financial loss 819.8 1.2 594.0 1.0
Proportional reinsurance 43,178.4 63.2 37,795.2 62.6
Health 304.1 0.4 267.2 0.4
Liability 2,596.0 3.8 2,251.3 3.7
Marine, aviation and transport 434.0 0.6 382.1 0.6
Property reinsurance 5,914.7 8.7 5,009.7 8.3
Non-proportional reinsurance 9,248.7 13.5 7,910.3 13.1
Non-life 52,427.1 76.8 45,705.5 75.7
Health 5,906.9 8.7 4,586.2 7.6
Life reinsurance 9,932.6 14.5 10,048.7 16.7
Life 15,839.5 23.2 14,634.8 24.3
Total 68,266.6 100.0 60,340.3 100.0
1) Lines of business as set forth in Annex I of Delegated Regulation (EU) 2015/35.
Statistics 2019/20 | 13
II
In the year under review, the share of nonlife insurance classes was 76.8 % of the total volume of premiums, 82.4 % of which was attributable to proportional reinsurance and 17.6 % to non-proportional reinsurance. Life insurance classes accounted for 23.2 % of all premiums.
Reinsurers ceded €12.5 billion (previous year: €10.9 billion) of their total gross premiums written of €68.3 billion (previous year: €60.3 billion) to retrocessionaires. As a result, the retrocession ratio amounted to 18.3 % (previous year: 18.1 %), which was accompanied by a minimal decrease of approximately 0.2 % in reinsurers’ retentions.
2 Losses
In 2019, losses caused by natural disasters were in line with the long-term average. Natural disasters are estimated to have caused overall economic losses of approximately US$150 billion worldwide in 2019, which by and large corresponded to the thirtyyear average of US$145 billion1. Of the overall economic losses caused by natural disasters, losses in the amount of US$52 billion were insured, which falls close to the median between the ten-year average (US$65 billion) and the average for the last thirty years (US$43 billion).
Once again, cyclones caused the highest overall economic losses and insured losses. This time, Japan was hit particularly hard. Typhoons Hagibis and Faxai caused losses of US$10 billion and US$7 billion, respectively, thus accounting for one third of insured losses worldwide. A combination of heatwaves and severe hailstorms were the greatest cause of losses in Europe. In Italy, for instance, hailstones as large as oranges caused extensive damage to cars and roofs. Many people were injured.
The development of claims expenditures is reflected in the reinsurers’ loss ratios. According to the data submitted in reporting template S.05.01, the reinsurers’ gross loss ratio after settlement, measured as the ratio of expenses for claims incurred to premiums written, amounted to 69.9 % in the year under review (previous year: 67.4 %). The loss ratio for non-life insurance is more informative: on average, the reinsurance undertakings recorded a gross loss ratio of 68.3 % (prior year: 66.4 %). In non-proportional reinsurance, which is predominantly
1 Munich Re: Press release of 8 January 2020.
used for reinsuring peak risk, the gross loss ratio increased from 59.9 % in 2018 to 68.6 % in 2019. The net loss ratio for the nonlife insurance classes as a whole rose from 66.8 % in 2018 to 67.8 % in 2019.
The gross expense ratio continued to rise slightly in the year under review and amounted to 28.8 % (previous year: 28.5 %).
Overall, the reinsurers’ gross combined ratio after settlement amounted to 98.7 % in the year under review (previous year: 95.9 %). On a net basis, the combined ratio deteriorated to 100.1 % (previous year: 98.0 %).
3 Technical provisions
Gross technical provisions amounted to €128.0 billion as at 31 December 2019. In terms of gross premiums written, this translated into a total provision rate of 187.5 % (prior year: 187.3 %) in the reinsurance sector. For the composition of technical provisions in the year under review and in 2018, see Table 6 (page 15).
Claims provisions were by far the most significant item, accounting for €96.7 billion or 75.5 % of the technical provisions in the year under review. The provision rate, measured by the gross premiums of the non-life insurance classes, amounted to 184.4 % (prior year: 190.0 %).
In the year under review, the largest share of gross technical claims provisions was attributable to the following lines of business: proportional general liability insurance at €25.3 billion (26.1 % of reinsurers’ total gross claims provisions), non-proportional liability insurance at €21.7 billion (22.5 %) and fire and other damage to property insurance at €13.7 billion (14.2 %). Table 7 (page 16) gives a breakdown of the reinsurers’ gross claims provisions by line of business under the Solvency II supervisory regime.
More than one third of total gross provisions for claims outstanding were attributable to nonproportional reinsurance, whereas the share of nonproportional reinsurance in premium income was only slightly more than one sixth of nonlife contributions. Nonproportional reinsurance is used, in particular, to reinsure peak risks and long-term liability risks, which makes it necessary to recognise large provisions.
14 | Statistics 2019/20
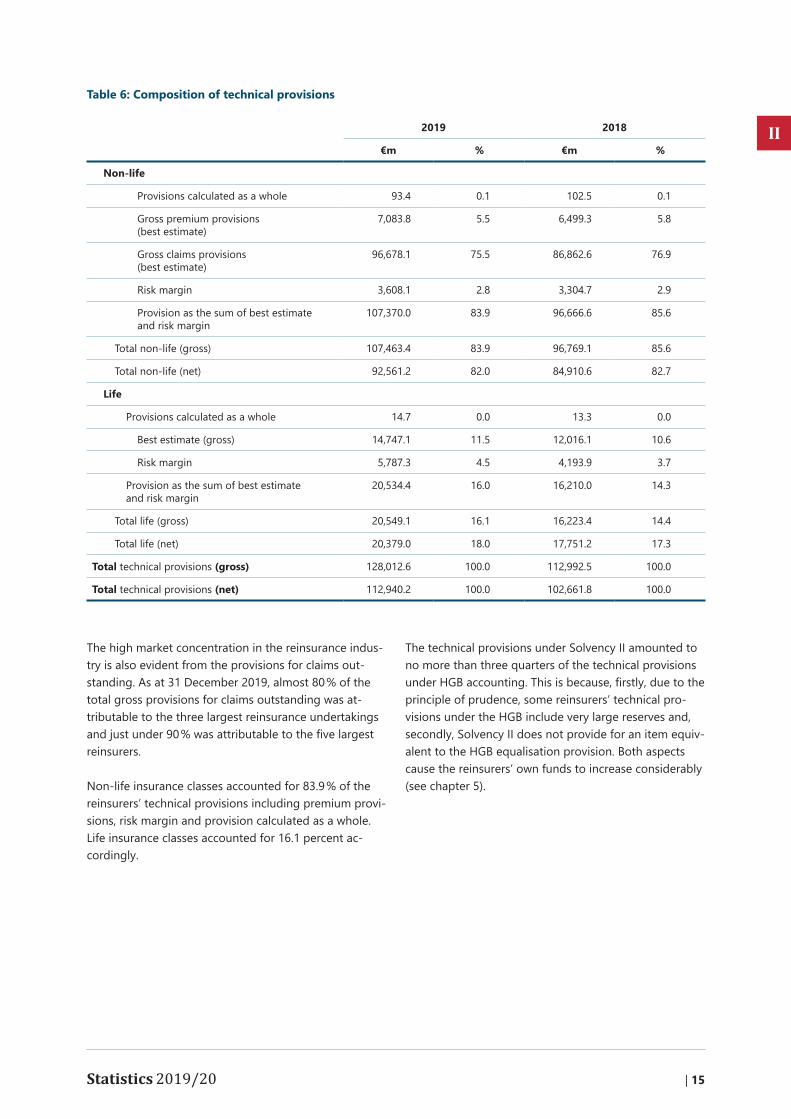
The high market concentration in the reinsurance industry is also evident from the provisions for claims outstanding. As at 31 December 2019, almost 80 % of the total gross provisions for claims outstanding was attributable to the three largest reinsurance undertakings and just under 90 % was attributable to the five largest reinsurers.
Non-life insurance classes accounted for 83.9 % of the reinsurers’ technical provisions including premium provisions, risk margin and provision calculated as a whole. Life insurance classes accounted for 16.1 percent accordingly.
The technical provisions under Solvency II amounted to no more than three quarters of the technical provisions under HGB accounting. This is because, firstly, due to the principle of prudence, some reinsurers’ technical provisions under the HGB include very large reserves and, secondly, Solvency II does not provide for an item equivalent to the HGB equalisation provision. Both aspects cause the reinsurers’ own funds to increase considerably (see chapter 5).
Table 6: Composition of technical provisions
2019 2018
€m % €m %
Non-life
Provisions calculated as a whole 93.4 0.1 102.5 0.1
Gross premium provisions (best estimate)
7,083.8 5.5 6,499.3 5.8
Gross claims provisions (best estimate)
96,678.1 75.5 86,862.6 76.9
Risk margin 3,608.1 2.8 3,304.7 2.9
Provision as the sum of best estimate and risk margin
107,370.0 83.9 96,666.6 85.6
Total nonlife (gross) 107,463.4 83.9 96,769.1 85.6
Total nonlife (net) 92,561.2 82.0 84,910.6 82.7
Life
Provisions calculated as a whole 14.7 0.0 13.3 0.0
Best estimate (gross) 14,747.1 11.5 12,016.1 10.6
Risk margin 5,787.3 4.5 4,193.9 3.7
Provision as the sum of best estimate and risk margin
20,534.4 16.0 16,210.0 14.3
Total life (gross) 20,549.1 16.1 16,223.4 14.4
Total life (net) 20,379.0 18.0 17,751.2 17.3
Total technical provisions (gross) 128,012.6 100.0 112,992.5 100.0
Total technical provisions (net) 112,940.2 100.0 102,661.8 100.0
Statistics 2019/20 | 15
II
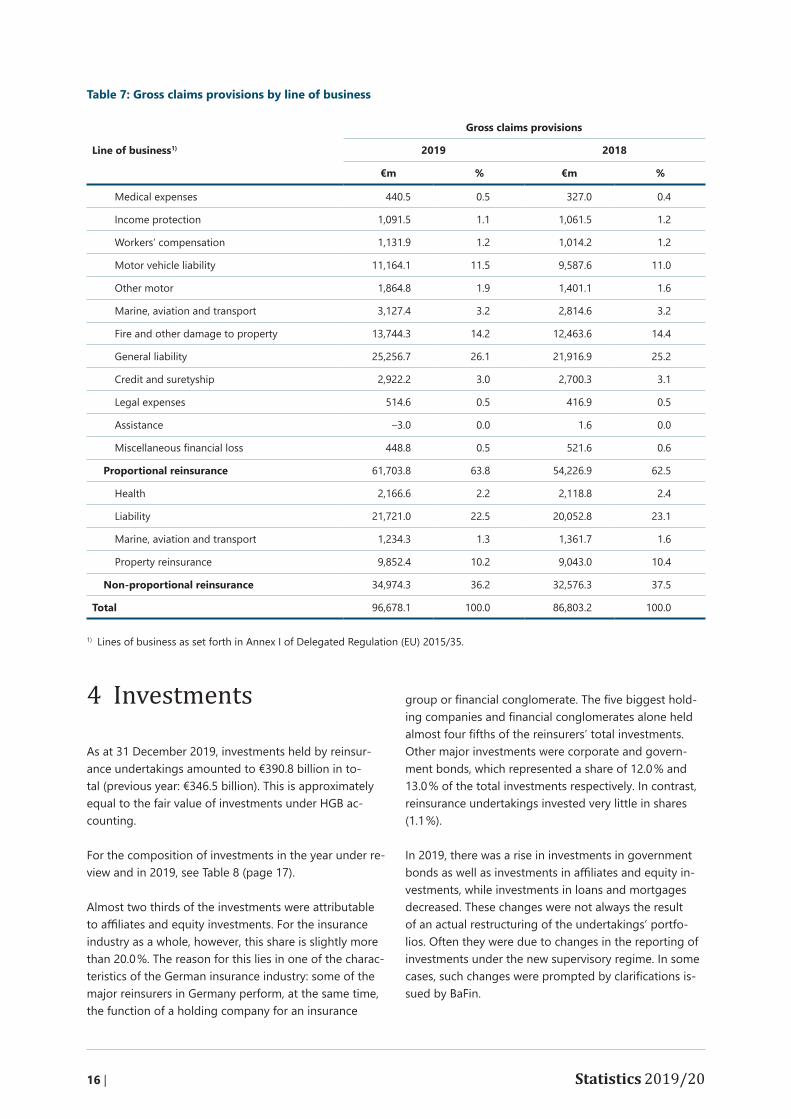
4 Investments
As at 31 December 2019, investments held by reinsurance undertakings amounted to €390.8 billion in total (previous year: €346.5 billion). This is approximately equal to the fair value of investments under HGB accounting.
For the composition of investments in the year under review and in 2019, see Table 8 (page 17).
Almost two thirds of the investments were attributable to affiliates and equity investments. For the insurance industry as a whole, however, this share is slightly more than 20.0 %. The reason for this lies in one of the characteristics of the German insurance industry: some of the major reinsurers in Germany perform, at the same time, the function of a holding company for an insurance
group or financial conglomerate. The five biggest holding companies and financial conglomerates alone held almost four fifths of the reinsurers’ total investments. Other major investments were corporate and government bonds, which represented a share of 12.0 % and 13.0 % of the total investments respectively. In contrast, reinsurance undertakings invested very little in shares (1.1 %).
In 2019, there was a rise in investments in government bonds as well as investments in affiliates and equity investments, while investments in loans and mortgages decreased. These changes were not always the result of an actual restructuring of the undertakings’ portfolios. Often they were due to changes in the reporting of investments under the new supervisory regime. In some cases, such changes were prompted by clarifications issued by BaFin.
Table 7: Gross claims provisions by line of business
Line of business1)
Gross claims provisions
2019 2018
€m % €m %
Medical expenses 440.5 0.5 327.0 0.4
Income protection 1,091.5 1.1 1,061.5 1.2
Workers’ compensation 1,131.9 1.2 1,014.2 1.2
Motor vehicle liability 11,164.1 11.5 9,587.6 11.0
Other motor 1,864.8 1.9 1,401.1 1.6
Marine, aviation and transport 3,127.4 3.2 2,814.6 3.2
Fire and other damage to property 13,744.3 14.2 12,463.6 14.4
General liability 25,256.7 26.1 21,916.9 25.2
Credit and suretyship 2,922.2 3.0 2,700.3 3.1
Legal expenses 514.6 0.5 416.9 0.5
Assistance –3.0 0.0 1.6 0.0
Miscellaneous financial loss 448.8 0.5 521.6 0.6
Proportional reinsurance 61,703.8 63.8 54,226.9 62.5
Health 2,166.6 2.2 2,118.8 2.4
Liability 21,721.0 22.5 20,052.8 23.1
Marine, aviation and transport 1,234.3 1.3 1,361.7 1.6
Property reinsurance 9,852.4 10.2 9,043.0 10.4
Non-proportional reinsurance 34,974.3 36.2 32,576.3 37.5
Total 96,678.1 100.0 86,803.2 100.0
1) Lines of business as set forth in Annex I of Delegated Regulation (EU) 2015/35.
16 | Statistics 2019/20
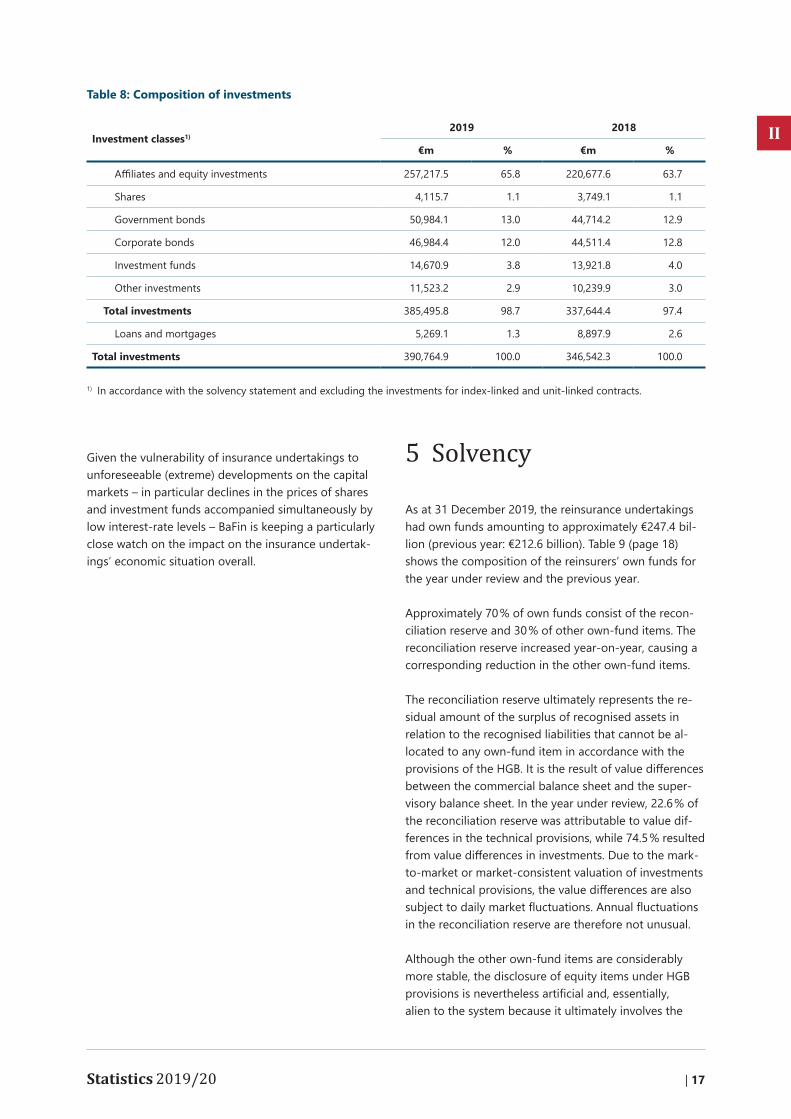
Given the vulnerability of insurance undertakings to unforeseeable (extreme) developments on the capital markets – in particular declines in the prices of shares and investment funds accompanied simultaneously by low interestrate levels – BaFin is keeping a particularly close watch on the impact on the insurance undertakings’ economic situation overall.
5 Solvency
As at 31 December 2019, the reinsurance undertakings had own funds amounting to approximately €247.4 billion (previous year: €212.6 billion). Table 9 (page 18) shows the composition of the reinsurers’ own funds for the year under review and the previous year.
Approximately 70 % of own funds consist of the reconciliation reserve and 30 % of other own-fund items. The reconciliation reserve increased yearonyear, causing a corresponding reduction in the other own-fund items.
The reconciliation reserve ultimately represents the residual amount of the surplus of recognised assets in relation to the recognised liabilities that cannot be allocated to any own-fund item in accordance with the provisions of the HGB. It is the result of value differences between the commercial balance sheet and the supervisory balance sheet. In the year under review, 22.6 % of the reconciliation reserve was attributable to value differences in the technical provisions, while 74.5 % resulted from value differences in investments. Due to the mark-to-market or market-consistent valuation of investments and technical provisions, the value differences are also subject to daily market fluctuations. Annual fluctuations in the reconciliation reserve are therefore not unusual.
Although the other own-fund items are considerably more stable, the disclosure of equity items under HGB provisions is nevertheless artificial and, essentially, alien to the system because it ultimately involves the
Table 8: Composition of investments
Investment classes1)2019 2018
€m % €m %
Affiliates and equity investments 257,217.5 65.8 220,677.6 63.7
Shares 4,115.7 1.1 3,749.1 1.1
Government bonds 50,984.1 13.0 44,714.2 12.9
Corporate bonds 46,984.4 12.0 44,511.4 12.8
Investment funds 14,670.9 3.8 13,921.8 4.0
Other investments 11,523.2 2.9 10,239.9 3.0
Total investments 385,495.8 98.7 337,644.4 97.4
Loans and mortgages 5,269.1 1.3 8,897.9 2.6
Total investments 390,764.9 100.0 346,542.3 100.0
1) In accordance with the solvency statement and excluding the investments for index-linked and unit-linked contracts.
Statistics 2019/20 | 17
II

disclosure of parts of the asset surplus, which as a whole is subject to market fluctuations.
As at 31 December 2019, own funds eligible to cover the minimum capital requirement (MCR) amounted to €232.1 billion (previous year: €198.4 billion), which is 93.8 % of the own funds eligible to cover the solvency capital requirement (SCR).
Even though reinsurance undertakings only represented 5.5 % of all insurers in terms of numbers, they nevertheless accounted for 47.0 % of the own funds of the entire insurance industry as at 31 December 2019. As already mentioned above, in many cases this is due to the dual function of reinsurance undertakings: they also perform the function of a holding company for an insurance group or a financial conglomerate. In such cases, the reinsurance activities are frequently subordinated to the holding company function and this is reflected, among other things, in more than adequate capital resources from the point of view of the reinsurance activities.
As at 31 December 2019, the SCR for reinsurance undertakings amounted to approximately €87.3 billion (previous year: €64.1 billion). The MCR increased from €20.7 billion in 2018 to €27.3 billion in the year under review. The MCR thus continues to account for approximately one third of the SCR.
Of the 29 reinsurance undertakings, 21 calculated their SCR using the standard formula. This corresponds to 72 % of all reinsurance undertakings; across the insurance industry as a whole, approximately 90 % use the standard formula. This means that more than one in four reinsurance undertakings uses the option of an internal model approved by BaFin. These eight undertakings account for roughly 90 % of all premiums and 90 % of all technical provisions. A representation of the
composition of the SCR based on the standard formula modules is therefore not very meaningful.
Irrespective of this, the most important risk driver by far is market risk, which represents approximately 80 % of the basic SCR of the undertakings that used the standard formula. Underwriting risk for non-life insurance is also important, representing roughly one quarter of the basic SCR, which, in turn, is reduced by 20 % by risk-mitigating diversification effects. All other risks are of secondary importance. The dominant role of market risk is due to the great influence of holding companies in the reinsurance industry. In addition, as these are often larger holding companies, market risks are also the dominant risk when looking at the industry average for reinsurers.
All in all, average SCR coverage amounted to approximately 283.3 % as at 31 December 2019 (previous year: 331.4 %). The MCR coverage ratio decreased slightly from 957.1 % in 2018 to 848.9 % in the year under review.
The range of the coverage ratios within the reinsurance sector is considerable, especially with respect to the MCR. As at 31 December 2019, the reinsurers reported SCR coverage ratios between 132.5 % and 558.6 % and MCR coverage ratios between 117.3 % and 2234.4 %.
The wide range of the coverage ratios reflects the heterogeneous nature of the reinsurance sector, which is small in terms of the number of companies. In addition to reinsurers with regional and international operations, the sector also includes captive insurers, run-off platforms and some reinsurance undertakings that also perform the function of a holding company for an insurance group or a financial conglomerate. Ultimately, the function of the reinsurance undertaking also influences its capital resources.
Table 9: Composition of own funds
Own-fund items2019 2018
€m % €m %
Ordinary share capital 4,636.07 1.9 4,437.9 2.1
Capital reserves 44,489.50 18.0 43,017.4 20.2
Reconciliation reserve 174,816.77 70.7 143,786.3 67.6
Subordinated capital 21,594.67 8.7 19,947.1 9.4
Other items 1,856.60 0.8 1,403.4 0.7
Eligible own funds to cover the SCR 247,393.61 100.0 212,592.1 100.0
18 | Statistics 2019/20
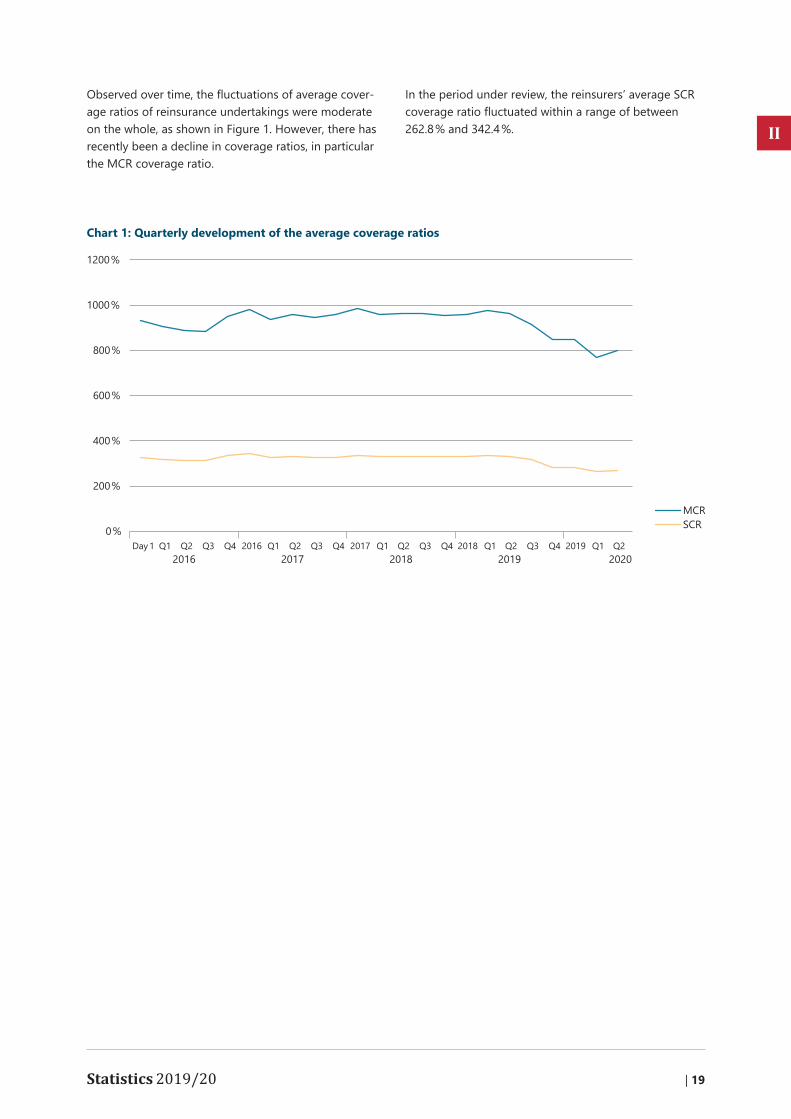
Observed over time, the fluctuations of average coverage ratios of reinsurance undertakings were moderate on the whole, as shown in Figure 1. However, there has recently been a decline in coverage ratios, in particular the MCR coverage ratio.
In the period under review, the reinsurers’ average SCR coverage ratio fluctuated within a range of between 262.8 % and 342.4 %.
Chart 1: Quarterly development of the average coverage ratios
Statistics 2019/20 | 19
II

Imprint
PublisherBundesanstalt für Finanzdienstleistungsaufsicht Communications (Group K)
Graurheindorfer Straße 108 | 53117 BonnMarie-Curie-Straße 24 – 28 | 60439 Frankfurt am Main
Phone: +49(0)228 41 08-0Internet: www.bafin.deE-Mail: [email protected]
Bonn/Frankfurt am Main | October 2020ISSN 1611-910X
EditingCommunications (Group K), BaFin
Editorial deadline23 October 2020
Designwerksfarbe.com, konzept+design, Frankfurt
TypesettingCMS – Cross Media Solutions GmbH