Embed Size (px)
Citation preview
au ..
U.S. Department of Justice National Institute of Justice
u.s. Department of Justice Bureau of Justice Statistics
Historical Statistics on Prisoners in State and Federal Institutions, Yearend 1925-86
By Patrick A. Langan, Ph.D., Jolut V. Fundis, and Lawrence A. Greenfeld BJS Statisticians, and Victoria W. Schneider, Ph.D. Archival Assistant Director, Inter-university Consortium for Political and Social Research, University of Michigan
May 1988 NC,J-I11098
111098 , l
This document has been reproduced exactly as received from the person or organization originating it. Points of view or opinions stated in this document are those of the authors and do not necessarily represent the official position or policies of the National Institute of Justice.
\
Permission to reprodlJce this ~material has been granted by
Public nomain/BJS u.s. Department of Justice
to the National Criminal Justice Reference Service (NCJRS).
Further reproduction outside of the NCJRS system requires permission of the c~owner.
If you have issues viewing or accessing this file, please contact us at NCJRS.gov.
U.s. Department of Justice Bureau of Justice Statistics
Steven R. Schlesinger Director
Acknowledgments. This report was written by Patrick A. Langan, John V. Fundis, and Lawrence A. Greenfeld of BJS and by Victoria W. Schneider of the Inter-university Consortium for Political and Social Research at the University of Michigan. Marilyn Marbrook, BJS publications unit chief, administered production, assisted by Jeanne Harris, Christina Roberts, and Yvonne Shields.
Many people contributed to building the dataset used in this report. In this regard, special recognition goes to Catherine Sharpe, Robert Denk, and Dena G. Myers, staff members of the National Criminal Justice Data Archive at the University of Michigan.
The Bureau of Justice Statistics wishes to acknowledge the contributions of those many correctional officials, both past lUld present, whose cooperation over the more than aO-year history of National Prisoner Statistics made this report possible. We deeply appreciate the continuing commitment of all NPS participants to this series.
The Assistant Attorney General, Office of Justice Programs, coordinates the activities of the following program offices aM bureaus: the Bureau of Justice Statistics, National Institute of Justice, Bureau of Justice Assistance, Office of Juvenile Justice and Delinquency Prevention, and the Office for Victims of G'rime.
ii Prisoners in State and Federal Institutions
Contents
L"ltroduction 1 National trends, 1925-86 2 Regional trends, 1925-86 2 Individual State trends, 1925-86 2 Trends in the size of the Federal prison population as a percentage of the total prison population 3 Methodology 3 How to obtain the data 4 Sources 16
Tables
1. Sentenced prisoners in State and Federal institutions on December 31, 1925-86 5 2. Average annual change in prison population, 1925-86 and 1980-86 14 3. Total number of sentenced prisoners in State and Federal institutions and percentage of prisoners in Federal institutions, 1925-86 15
•• Introduction
In 1926 the Federal Government, in a statistical series called "National Prisoner Statistics," began keeping annual records of State and Federal prison populations. The series has been in continuous operation ever since. Published reports from the series are the source of national statistical information on prison populations in the United States.
Among the several continuously published measures of the prison population, one from the annual report is intended to provide a measure of the overall size of the prison population. This measure is the number of
. prisoners present in State and Federal prisons at the end of each year. Changes from one year to the next in the number of prisoners present at yearend reveal whether prison populations are Increasing, decreasing, or staying the same in the United States.
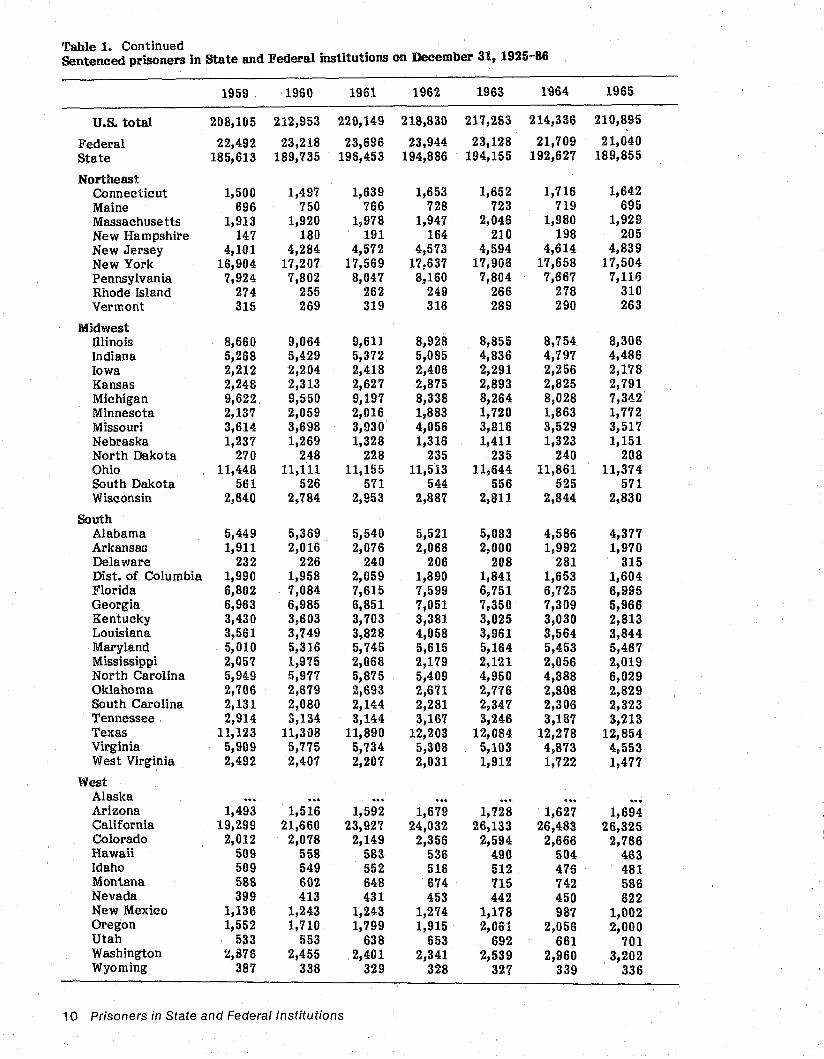
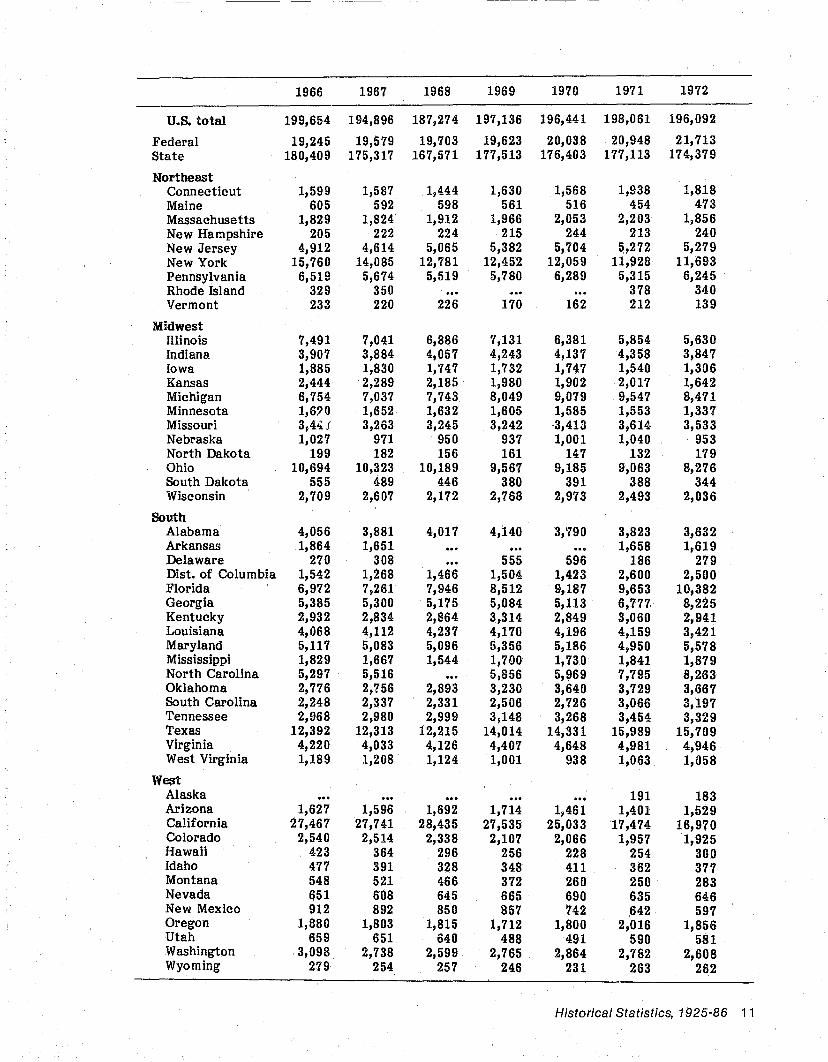
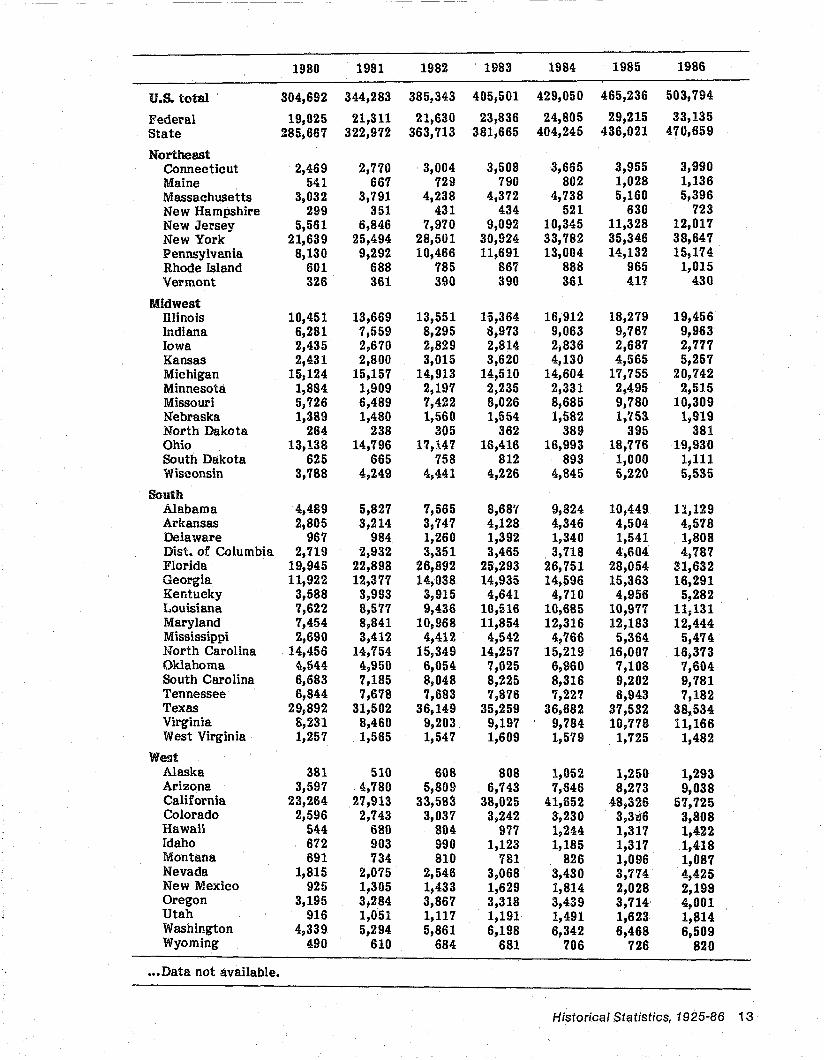
This report combines yearend population counts from the annual published reports into a single table (table 1). Table 1 shows the prison population of each State, the District of Columbia, and the Federal Government on December 31 of each year from 1925 to 1986.
Over the more than 60 years in which . prisoner counts have been reported, definitions of included populations have occasionally changed, and published figures have been revised (see Methodology). Annual counts reported here are based on final revised figures and represent the most comparable data published.
Historical Statistics, 1925-86 1
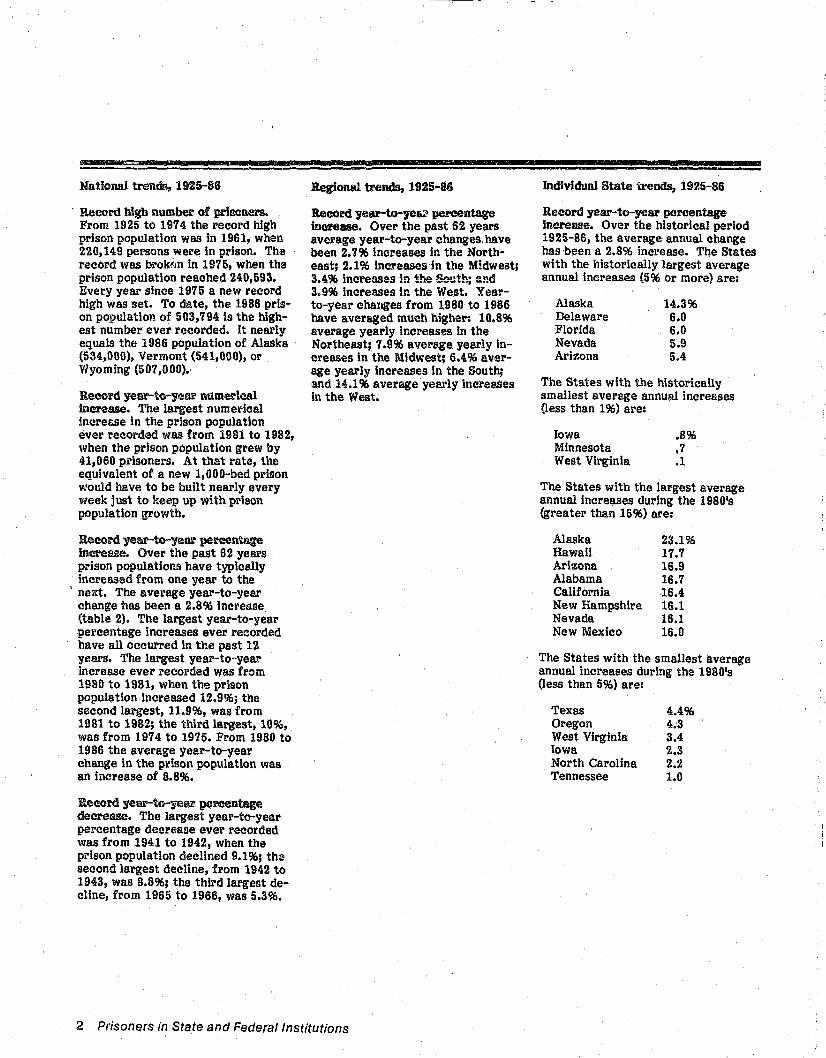
National trends, 1925-86
. Record bigh number of prisoners. From 1925 to 1974 the record high prison population was in 1961, when 220,149 persons were in prison. The record was brok!JD in 1975, when the prison population reached 240,593. Every year since 1975 a new record high was set. To date, the 1986 prison population of 563,794 is the highest number ever recorded. It nearly equals the 1986 population of Alaska (534,600), Vermont (541,000), 01' Wyoming (507,000).
Record year-to-yem' numerical increase. The largest numerical increase in the prison popula.tion ever recorded was from 1981 to 1982, when the prison population grew by 41,060 prisoners. At that rate, the equivalent of a new 1,000-bed prison would have to be built nearly every week just to keep up with prison popula tion growth.
Record year-to-yem' percent&tJe increase. Over the past 62 years prison populations have typically illcreased from one year to the
, next. The average year-to-year change has been a 2.896 Increase (table 2). The largest year-ta-year percentage increases ever recorded have all occurred in the past 12 years. The largest year-to-year increase ever recorded was from 1980 to 1981, when the prison population increased 12.996; the second largest, 11.9%, was from 1981 to 1982; the third largest, 10%, was from 1974 to 1975. From 1980 to 1986 the average year-ta-year change in the prison population was an increase of 8.8%.
Record year-to-year percentage decrease. The largest year-ta-year percentage decrease ever recorded was from 1941 to 1942, when the prison population declined 9.1%; the second largest decline, from 1942 to 1943. was 8.8%; the third largest decline, from 1965 to 1966, was 5.3%.
Regional trends, 1925-86
Record year-to-ye~ percentage increase. Over the past 62 years average year-to-year changes have been 2.'196 increases in the Northeast; 2.196 increases in the Midwest; 3.496 increases in the ~uth; and 3.996 increases in the West. Yearto-year changes from 1980 to 1986 have averaged much higher: 10.896 average yearly increases in the Northeast; 7.996 average yearly increases in the Midwest; 6.4% average yearly increases in the South; and 14.1 % average yearly increases in the West.
2 Prisoners in State and Federal Institutions
Individual State trends, 1925-86
Record year-ta-year percentage mcre8BC. Over the historical period 1925-86, the average annual change has ,been a 2.896 increase. The States with the historically largest average annual ineresses (596 or more) are:
Alaska Delaware Florida Nevada Arizona
14.3% 6.0 6.0 5.9 5.4
The States with the historically smallest average annual increases (less than 196) are:
Iowa .896 Minnesota .7 West Virginia. .1
The States with the largest average annual increases during the 1980's (greater than 1596) are:
Alaska Hawaii Arizona Alabama California New Hampshire Nevada New Mexico
23.196 17.7 16.9 16.7 16.4 16.1 16.1 16.0
The States with the smallest average annual increases during the 1980's (less than 596) are:
Texas 4.4% Oregon 4.3 West Virginia 3.4 Iowa 2.3 North Carolina 2.2 Tennessee 1.0
'l't'ends in the size of the Federal prison population as a percentage of the total prison population
Record high percentage of Federal Pl'isoners. The prison population has two components: a State prison population (including the District of Columbia) and a Federal prison population. The Federal prison population as a percentage of the total population has fluctuated over time. From 1925 to 1945 the prevalence of Federal prisoners increased, reaching its all-time high level of 13.9% in 1945 (table 3).
Record low ~rcentage of Federal prisoners. From 1945 to 1982 the prevalence of Federal prisoners steadily declined, reaching its alltime low level of 5.696 in 1982 (table 3). Since 1982 the prevalence of Federal prisoners has been growing.
Methodology
National Prisoner Statistics is a voluntary reporting program initiated by the Federal Government in 1926. The Federal agency responsible for administering the program was the Bureau of the Census from 1926 to 1949, the Federal Bureau of Prisons from 1950 to 1970, the Law Enforcement Assistance Administration from 1971 to 1978, and the Bureau of Justice Statistics from 1979 to the present.
Y<!arend prison population counts are the product of a yearly national census in which the responsible Federal agency asks each State correctional institution (or its central reporting agency), the District of Columbia, and the Federal Bureau of Prisons to report summary statistics. The census is one among many other censuses and surveys that together make up the series called National Prisoner Statistics.
The census of yearend prison population uses a mail questionnaire. Results of the census are reported in an annual publication. Revisions to published results are reported in subsequent publications.
For some years the same publication reported more than one set of yearend figures, reflecting different ways of defining the yearend population. The yearend figures that were chosen for inclusion in this publication are based on the most comparable data published. The most comparable data are: 1) those that define the prison popUlation as the total number of sentenced adult felons in the physical custody of State and Federal institutions at yearend and 2) those that reflect any revisions to originally published figures. Three specific exceptions to this definition are:
o The prison population on January 1, 1926, is reported here as December 31, 1925. For other years as well, yearend population figures reported here are actually figures for January 1 of the subsequent year. January 1 counts are used because they provide an acceptable measure of the
yearend population !md because they reflect revisions to previously published December 31 figures.
• Figures for 1925 through 1970 include a small number of misdemeanants (defined as inmates with a maximum sentence less than 1 year). Data for felons alone were not published during these years. Figures for 1971 through 1986 refer solely to felons (defined as inmates with a maximum sentence greater than 1 year).
18 Figures for 1986 are subject to revision. Final revised figures were not available at the time of this publication.
Other exceptions are noted in the published reports from which the da ta wer~ taken.
In most cases yearend figures reported here are not from the original publication. The source is typically a later publication presenting revised yearend figures.
Further details of the methodology used in the annual census of yearend prison population are provided in the pUblication State and Federal Prisoners, 1925-85 (BJS Bulletin, NCJ-102494, October 1986). Total prison populations reported here supersede those reported in that publication.
Historical Statistics, 1925-86 3
-s m
How to obtain the data
The dataset for liB .. orical statistics on prisoners in Stale and Federal institutions, yearend 1925-86" is available in a variety of machinereadable formats (floppy disk, ninetrack tape, and so forth) from the National Criminal Justice Data Archive at the University of Michigan. Contact the archive at P.O. Box 1248, Ann At"bor, MI 48106 (313-763-5010). In addition to the counts of prisoners by year and by jurisdiction, the dataset also includes general population estimates by year and by jurisdiction. Tliese general population estimates were supplied by the U.S. Bureau of the Census to this project and incorporate any revisions to previously published estimates. As a result, calculated rates of imprisonment (prisoners per 100,000 population) from the dataset may differ from previously published rates.
4 Prisoners in State and Federaiinstitutions
------------ -----
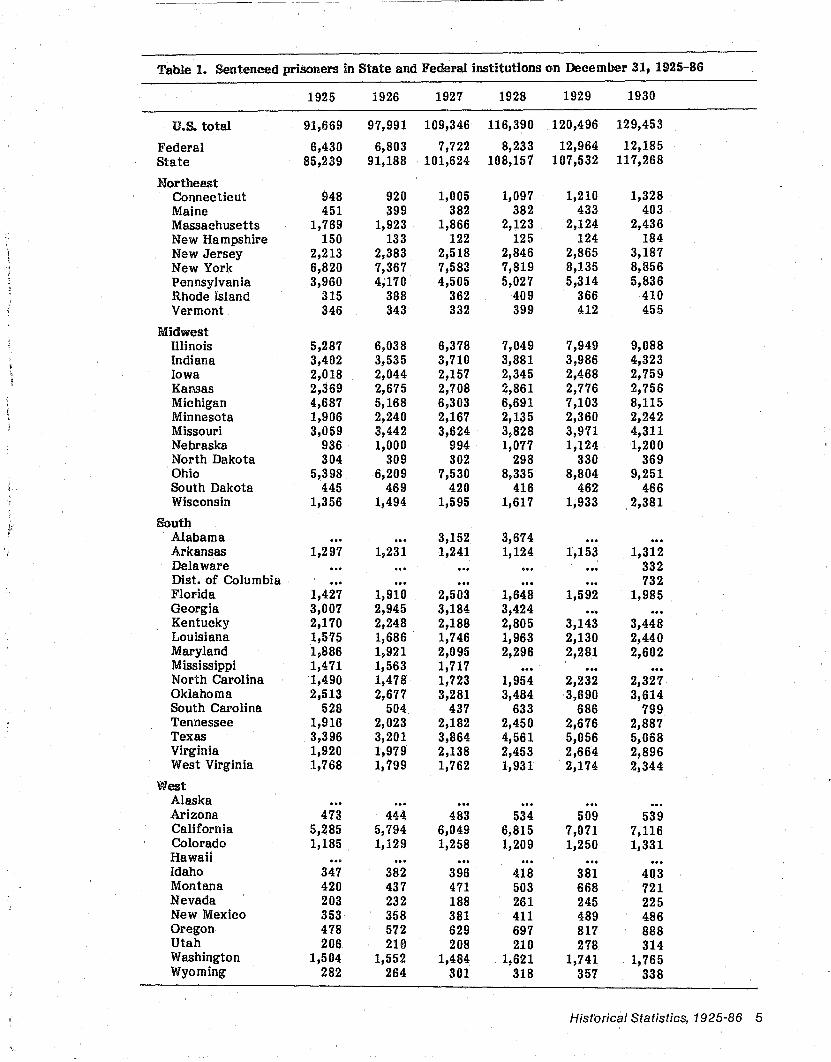
Table 1. Sentenced prisoners in State and Federal institutions on Decemoor 31, 1925-86
1925 1926 1927 1928 1929 1930
U.s. total 91,669 97,991 109,346 116,390 120,496 129,453
Federal 6,430 6,803 7,722 8,233 12,964 12,185 State 85,239 91,188 101,624 108,157 107,532 117,268
Northeast Connecticut 948 920 1,005 1,097 1,210 1,328 Maine 451 399 382 382 433 403 Massachusetts 1,769 1,923 1,866 2,123 2,124 2,436 New Hampshire 150 133 122 125 124 184 New Jersey 2,213 2,383 2,518 2,846 2,865 3,187 New York 6,820 7,367 7,583 7,819 8,135 8,856 Pennsylvania 3,960 4,170 4,505 5,027 5,314 5,836 Rhode Island 315 388 362 409 366 410 Vermont 346 343 332 399 412 455
Midwest Illinois 5,287 6,038 6,378 7,049 7,949 9,088 Indiana 3,402 3,535 3,710 3,881 3,986 4,323 Iowa 2,018 2,044 2,157 2,345 2,468 2,759 Kansas 2,369 2,675 2,708 2,861 2,776 2,756 Michigan 4,687 5,168 6,303 6,691 7,103 8,115 Minnesota 1,906 2,240 2,167 2,135 2,360 2,242 Missouri 3,059 3,442 3,624 3,828 3,971 4,311 Nebraska 936 1,000 994 1,077 1,124 1,200 North Dakota 304 309 302 298 330 369 Ohio 5,398 6,209 7,530 8,335 8,804 9,251 South Dakota 445 469 420 416 462 466 Wisconsin 1,356 1,494 1,595 1,617 1,933 2,381
tJ South Alabama 3,152 3,674 Arkansas 1,297 1,231 1,241 1,124 1,153 1,312 Delaware 332 Dist. of Columbia 732 Florida 1,427 1,910 2,503 1,648 1,592 1,985 Georgia 3,007 2,945 3,184 3,424 Kentucky 2,170 2,248 2,188 2,805 3,143 3,448 Louisiana 1,575 1,686 1,746 1,963 2,130 2,440 Maryland 1,886 1,921 2,095 2,296 2,281 2,602 Mississippi 1,471 1,563 1,717 North Carolina 1,490 1,478 1,723 1,954 2,232 2,327 Oklahoma 2,513 2,677 3,281 3,484 31690 3,614 South Carolina 528 504 437 633 686 799 Tennessee 1,916 2,023 2,182 2,450 2,676 2,887 Texas 3,396 3,201 3,864 4,561 5,056 5,068 Virginia 1,920 1,979 2,138 2,453 2,664 2,896 West Virginia 1,768 1,799 1,762 1,931 2,174 2,344
West Alaska Arizona 473 444 483 534 509 539 California 5,285 5,794 6,049 6,815 7,071 7,116 Colorado 1,185 1,129 1,258 1,209 1,250 1,331 Hawaii Idaho 347 382 396 418 381 403 Montana 420 437 471 503 668 721 Nevada 203 232 188 261 245 225 New Mexico 353 358 381 411 489 486 Oregon 478 572 629 697 817 888 Utah 206 210 208 210 278 314 Washington 1,504 1,552 1,484 1,621 1,741 1,765 Wyoming 282 264 301 318 357 338
Historical Statistics, 1925-86 5
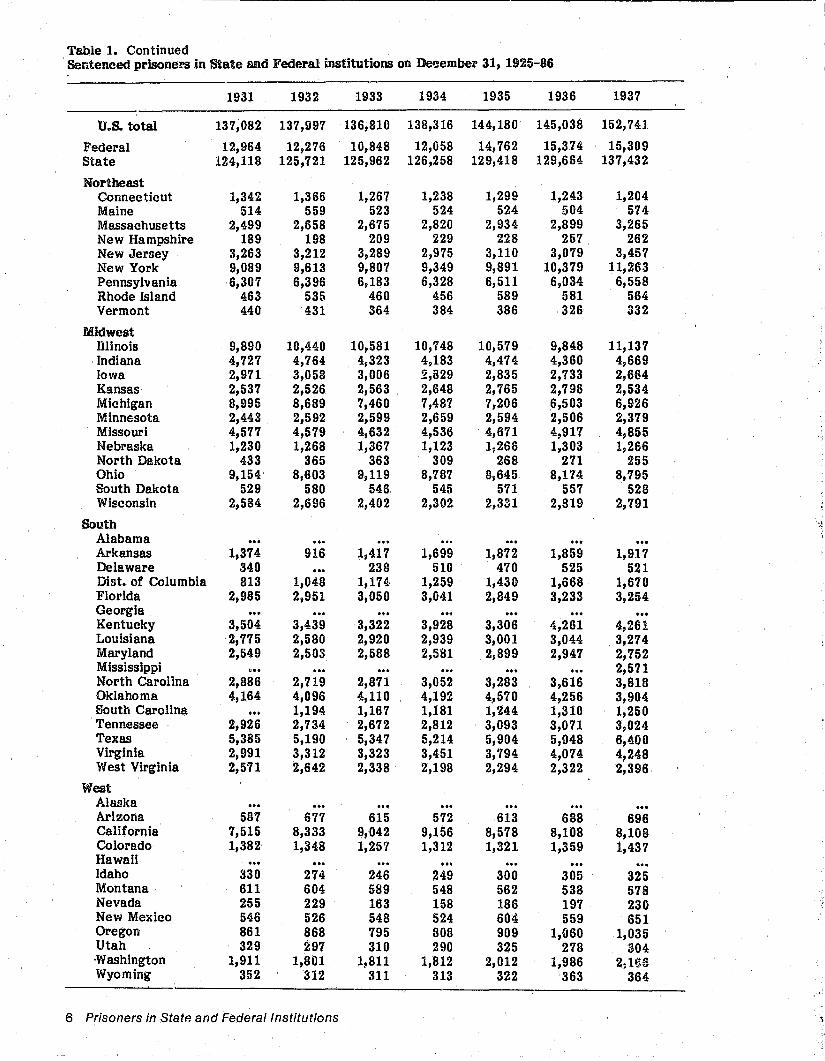
Table 1. Continued Sentenced prisoners in State and Federal institutions on I.»e!!ember 31, 1925-86
1931 1932 1933 1934 1935 1936 1937
U.s. total 137,082 137,997 136,810 138,316 144,180 145,038 152,741.
Federal 12,964 12,276 10,848 12,058 14,762 15,374 15,309 State 124,118 125,721 125,962 126,258 129,418 129,664 137,432
Northeast Connecticut 1,342 1,366 1,267 1,238 1,299 1,243 1,204 Maine 514 559 523 524 524 504 574 Massachusetts 2,499 2,658 2,675 2,820 2,934 2,899 3,265 New Hampshire 189 198 209 229 228 257 262 New Jersey 3,263 3,212 3,289 2,975 3,110 3,079 3,457 New York 9,089 9,613 9,807 9,349 9,891 10,379 11,263 Pennsylvania 6,307 6,396 6,183 6,328 6,511 6,034 6,558 Rhode Island 463 535 460 456 589 581 564 Vermont 440 431 364 384 386 326 332
Midwest lllinois 9,890 10,440 10,581 10,748 10,579 9,848 11,137 Indiana 4,727 4,764 4s323 4,183 4,474 4,360 4,669 Iowa 2,971 3,058 3,006 2,829 2,835 2,733 2,664 Kansas 2,537 2,526 2,563 2,648 2,765 2,796 2,534 Michigan 8,995 8,689 7,460 7,487 7,206 6,503 6,926 Minnesota 2,443 2,592 2,599 2,659 2,594 2,506 2,379 Missouri 4,577 4,579 4,632 4,536 4,671 4,917 4,855 Nebraska 1,230 1,268 1,367 1,123 1,266 1,303 1,266 North Dakota 433 365 363 309 268 271 255 Ohio 9,154 8,603 9,119 8,787 8,645 8,174 8,795 South Dakota 529 580 546 545 571 557 528 Wisconsin 2,584 2,696 2,402 2,302 2,331 2,819 2,791
South '" Alabama Arkansas 1,374 916 1,417 1,699 1,872 1,859 1,917 Delaware 340 238 510 470 525 521 Dist. of Columbia 813 1,048 1,174 1,259 1,430 1,668 1,670 Florida 2,985 2,951 3,050 3,041 2,849 3,233 3,254 Georgia Kentucky 3,504 3,439 3,322 3,928 3,306 4,261 4,261 Louisiana 2,775 2,580 2,920 2,939 3,001 3,044 3,274 Maryland 2,549 2,503 2,588 2,581 2,899 2,947 2,752 Mississippi ... 2,571 North Carolina 2,886 2,719 2,871 3,052 3,283 3,616 3,818 Oklahoma 4,164 4,096 4,110 4,192 4,570 4,256 3,904 South Carolina 1,194 1,167 1,181 1,244 1,310 1,250 Tennessee 2,926 2,734 2,672 2,812 3,093 3,071 3,024 Texas 5,385 5,190 5,347 5,214 5,904 5,948 6,400 Virginia 2,991 3,312 3,323 3,451 3,794 4,074 4,248 West Virginia 2,571 2,642 2,338 2,198 2,294 2,322 2,396
West Alaska Arizona 587 677 615 572 613 688 696 California 7,515 8,333 9,042 9,156 8,578 8,108 8,108 Colorado 1,382 1,348 1,257 1,312 1,321 1,359 1,437 Hawaii Idaho 330 274 246 249 300 305 325 Montana 611 604 589 548 562 538 578 Nevada 255 229 163 158 186 197 230 New Mexico 546 526 548 524 604 559 651 Oregon 861 868 795 808 909 1,060 1,035 Utah 329 297 310 290 325 278 304 ·Washington 1,911 1,801 1,811 1,812 2,012 1,986 2,1~5 Wyoming 352 312 311 313 322 363 364
6 Prisoners in State and Federal Institutions '\
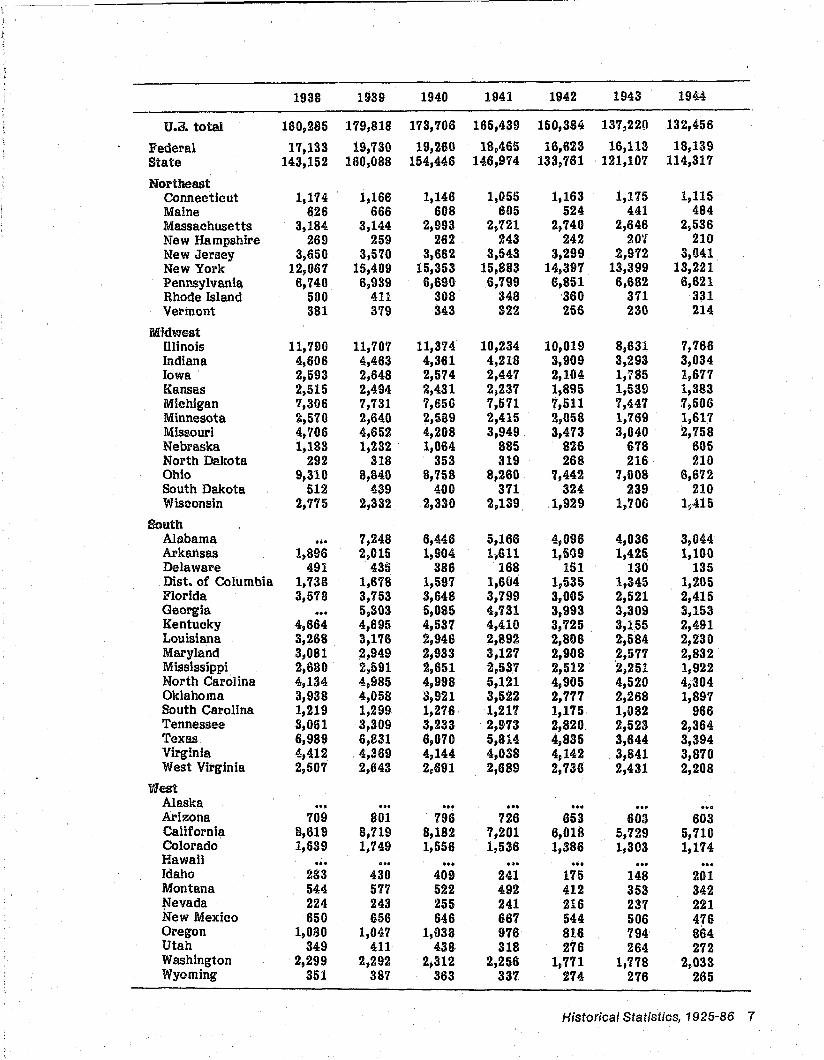
1938 1939 1940 1941 1942 1943 1944
U.a.. total 160,285 179,818 173,706 165,439 150,384 137,220 132,456
Federal 17,133 19,'130 19,260 18,465 16,623 16,113 18,139 State 143,152 160,088 154,446 146,974 133,761 121,107 114,317
Northeast Connecticut 1,174 1,166 1,146 1,055 1,163 1,175 1,115 Maine 626 666 608 605 524 441 484 Massachusetts 3,184 3,144 2,993 2,'121 2, '140 2,646 2,536 New Hampshire 269 259 262 243 242 20', 210 New Jersey 3,650 3,570 3,662 3,543 3,299 2,972 3,041 New York 12,067 15,409 15,353 15,883 14,397 13,399 13,221 Pennsylvania 6,740 6,939 6,690 6,799 6,851 6,682 6,621 Rhode Island 500 411 308 348 360 3'll 331 Vermont 381 379 343 322 256 230 214
Mwdwest lllinois 11,790 11,707 11,374 10,234 10,019 8,631 7,766 Indiana 4,606 4,463 4,361 4,218 3,909 3,293 3,034 Iowa 2,593 2,648 2,574 2,447 2,104 1,795 1,677 Kansas 2,515 2,494 2,431 2,237 1,895 1,539 1,383 Michigan 7,306 7,731 7,65G 7,571 7,511 7,447 7,506 Minnesota 2,570 2,640 2,589 2,415 2,058 1,769 1,617 Missouri 4,706 4,652 4,208 3,949 3,473 3,040 2,758 Nebraska 1,183 1,232 1,064 885 826 678 605 North Dakota 292 318 353 319 268 216 210 Ohio 9,310 8,840 8,758 8~260 7,442 '1,008 6,6'12 South Dakota 512 439 400 371 324 239 210 Wisconsin 2, '175 2,332 2,330 2,139 1,929 1, 'l06 1~U5
South Alabama 7,248 6,446 5,166 4,096 4,036 3,044 Arkansas 1,896 2,015 1,904 1,611 1,599 1,425 1,100 Delaware 491 435 386 168 151 130 135 Dist. of Columbia 1, '138 1,678 1,597 1,604 1,535 1,345 1,205 Florida 3,578 3,753 3,648 3,'199 3,005 2,521 2,415 Georgia ... 5,303 5,085 4,731 3,993 3,309 3,153 Kentucky 4,664 4,695 4,531 4,410 3,725 3,155 2,491 Louisiana 3,268 3,176 2,946 2,892 2,808 2,584 2,230 Maryland 3,081 2,949 2,933 3,127 2,908 2,577 2,832 Mississippi 2,680 2,591 2,651 2,53'1 2,512 2,251 1,922 North Carolina 4,134 4,985 4,998 5,121 4,905 4,520 4,304 Oklahoma 3,938 4,058 3,921 3,522 2,777 2,268 1,897 South Carolina 1,219 1,299 1,276 1,217 1,175 1,082 966 Tennessee 3,061 3,309 3,233 2,913 2,820 2,523 2,364 Texas 6,989 6,831 6,070 5,814 4,835 3,644 3,394 Virginia 4,412 4,369 4,144 4,038 4,142 3,841 3,870 West Virginia 2,507 2,643 2$691 2,689 2,736 2,431 2,208
f/est Alaska ... ... Arizona 709 801 796 726 653 603 603 California 8,619 8, '119 8,182 7,201 6,018 5,729 5,710 Colorado 1,639 1,749 1,556 1,536 1,386 1,303 1,174 Hawaii ... Idaho 283 430 409 241 175 148 201 Montana 544 577 522 492 412 353 342 Nevada 224 243 255 241 216 231 221 New Mexico 650 656 646 667 544 506 476 Oregon 1,080 1,041 1,038 976 816 794 864 Utah 349 411 438 318 276 264 272 Washington 2,299 2,292 2,312 2,256 1, '/71 1,778 2,033 Wyoming 351 38'1 363 337 274 276 265
Historical Statistics, 1925-86 7
----~-~~
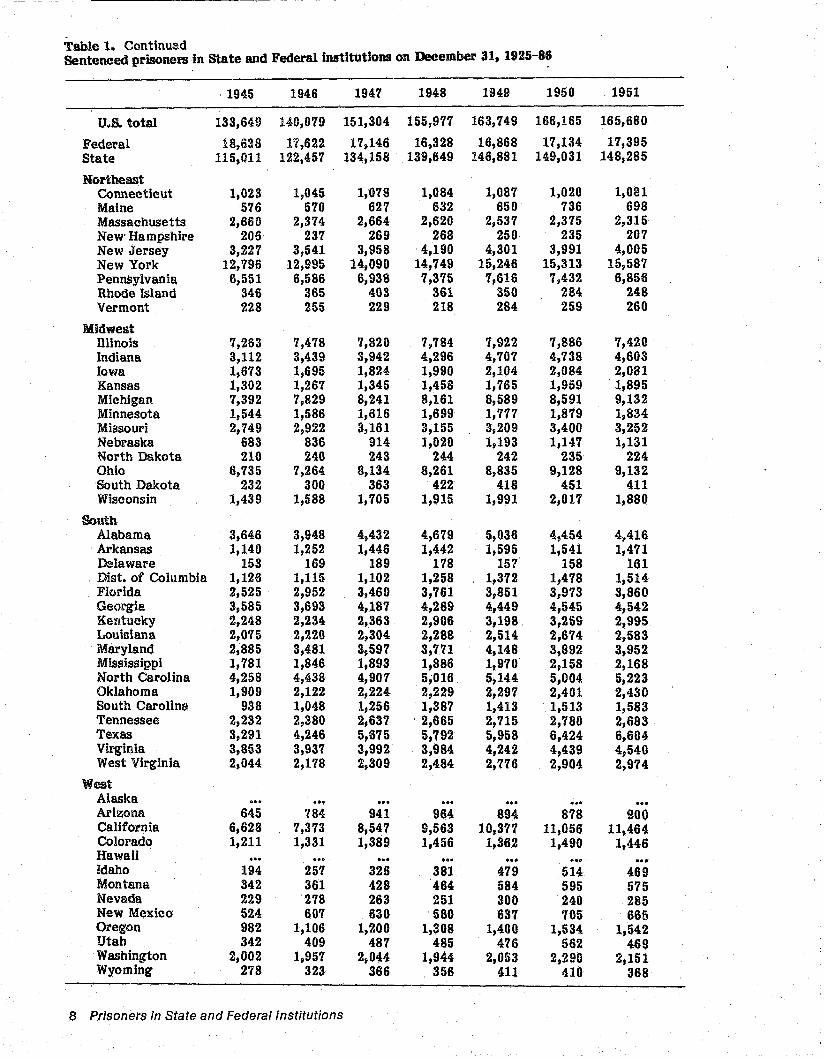
Table 1. Continu3d Sentenced prisoners in State and Federal institutions on December 31, 1925-8~
1945 1946 1947 1948 1949 1950 1951
U.s.. total 133,649 140,079 151,304 155,977 163,749 166,165 165,680
Federal 18,638 11,622 17,146 16,328 16,868 17,134 17,395 State 115,011 122,457 134,158 139,649 146,881 149,031 148,285
Northeast Connecticut 1,023 1,045 1,078 1,084 1,087 1,020 1,081 Maine 576 570 627 632 650 736 698 Massachusetts 2,660 2,374 2,664 2,620 2,537 2,375 2,315 New· Hampshire 206 237 269 268 250 235 207 New Jersey 3,227 3,541 3,958 4,190 4,301 3,991 4,005 New York 12,796 12,995 14,090 14,749 15,246 15,313 15,587 Pennsylvania 6,551 6,586 6,938 7,375 7,616 7,432 6,856 Rhode Island 346 365 403 361 350 284 248 Vermont 228 255 229 218 284 259 260
Midwest lllinois 7,263 7,478 7,820 7,784 7,922 7,886 7,420 Indiana 3,112 3,439 3,942 4,296 4,707 4,738 4,603 Iowa 1,673 1,695 1,824 1,990 2,104 2,084 2,081 Kansas 1,302 1,267 1,345 1,458 1,765 1,959 1,895 Michigan 7,392 7,829 8,241 8,161 8,589 8,591 9,132 Minnesota 1,544 1,586 1,616 1,699 1,777 1,879 1,834 Missouri 2,749 2,922 3,161 3,155 3,209 3,400 3,252 Nebraska 683 836 914 1,020 1,193 1,147 1,131 North Dakota 210 240 243 244 242 235 224 Ohio 6,735 7,264 8,134 8,261 8,835 9,128 9,132 South Dakota 232 300 363 422 418 451 411 Wisconsin 1,439 1,588 1,705 1,915 1,991 2,017 1,880
South Alabama 3,646 3,948 4,432 4,679 5,036 4,454 4,416 Arkansas 1,140 1,252 1,446 1,442 1,595 1,541 1,471 D::!laware 153 169 189 178 157 158 161 Dist. of Columbia 1,126 1,115 1,102 1,258 1,372 1,478 1,514 Florida 2,525 2,952 3,460 3,761 3,851 3,973 3,860 Georgia 3,585 3,693 4,18'1 4,269 4,449 4,545 4,542 Kentucky 2,248 2,234 2,363 2,906 3,198 3,259 2,995 Louisiana 2,075 2,220 2~304 2,288 2,514 2,674 2,583 Maryland 2,885 3,481 3,597 3,771 4,148 3,892 3,952 Mississippi 1,781 1,846 1,893 1,886 1,970 2,158 2,168 North Carolina 4,258 4,438 4,907 5,016 5,144 5,004 5,223 Oklahoma 1,909 2,122 2,224 2,229 2,297 2,401 2,430 South Carolina 936 1,048 1,256 1,387 1,413 1,513 1,583 Tennessee 2,232 2,380 2,637 2,665 2,715 2,'180 2,683 Texas 3,291 4,246 5,675 5,792 5,958 6,424 6,60~ Virginia 3,853 3,937 3,992 3,984 4,242 4,439 4,540 West Virginia 2,044 2,178 ~,309 2,484 2,776 2,904 2,974
West Alaska Arizona 645 784 941 964 894 878 900 California 6,628 7,373 8,547 9,563 10,377 11,056 11,464 Colora.do 1,211 1,331 1,389 1,456 1,362 1,490 1,446 Hawaii ... Idaho 194 257 326 381 479 514 469 Montana 342 361 428 464 584 595 575 Nevada 229 278 263 251 300 240 285 New Mexico 524 G07 630 580 637 105 665 Oregon 982 1,106 1,200 1,308 1,400 1,534 1,542 Utah 342 409 487 485 476 562 469 Washington 2,002 1,951 2,044 1,944 2,053 2,290 2,151 Wyoming 278 323 366 356 411 410 368
8 Prisoners in State and Federal institutions
----------
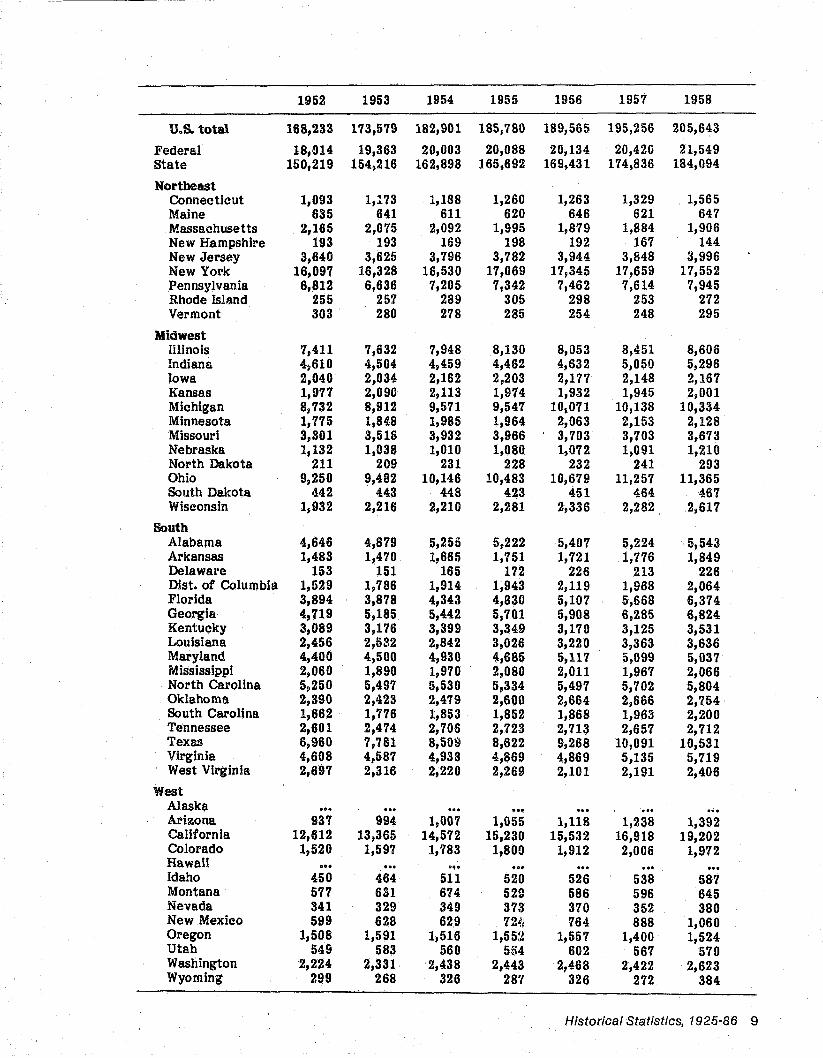
1952 1953 1954 1955 1956 1957 1958
U.s. total 168,233 173,579 182,901 185,780 189,565 195,256 205,643
Federal 18,014 19,363 20,003 20,088 20,134 20,420 21,549 state 150,219 154,216 162,898 165,692 169,431 174,836 184,094
Northeast Connecticut 1,093 1,173 1,188 1,260 1,263 1,329 1,565 Maine 635 641 611 620 646 621 647 Massachusetts 2,165 2,075 2,092 1,995 1,879 1,884 1,906 New Hampshire 193 193 169 198 192 167 144 New Jersey 3,640 3,625 3,796 3,782 3,944 3,848 3,996 New York 16,097 16,328 16,530 17,069 17,345 17,659 17,552 Pennsylvania 6,812 6,636 7,205 7,342 7,462 7,614 7,945 Rhode Island 255 257 289 305 298 253 272 Vermont 303 280 278 285 254 248 295
Midwest Illinois 7,411 7,632 7,948 8,130 8,053 8,451 8,606 Indiana 4p610 4,504 4,459 4,462 4,632 5,050 5,296 Iowa 2,040 2,034 2,162 2,203 2,177 2,148 2,167 Kansas 1,977 2,090 2,113 1,974 1,932 1,945 2,001 Michigan 8,732 8,912 9,571 9,547 10,071 10,138 10,334 Minnesota 1,775 1,848 1,985 1,964 2,063 2,153 2,128 Missouri 3,301 3,518 3,932 3,966 3,703 3,703 3,673 Nebraska 1,132 1,038 1,010 1,080 1,072 1,091 1,210 North Dakota 211 209 231 228 232 241 293 Ohio 9,250 9,482 10,146 10,483 10,679 11,257 11,365 South Dakota 442 443 448 423 451 464 467 Wisconsin 1s932 2,216 2,210 2,281 2,336 2,282 2,617
South Alabama 4,646 4,879 5,255 5,222 5,407 5,224 5,543 Arkansas 1,483 1,470 1,665 1,751 1,721 1,776 1,849 Delaware 153 151 165 172 226 213 226 Dist. of Columbia 1,529 1,786 1,914 1,943 2,119 1,968 2,064 Florida 3,894 3,878 4,343 4,830 5,107 5,668 6,374 Georgia 4,'119 5,185 5,442 5,701 5,908 6,285 6,824 Kentucky 3,089 3,176 3,399 3,349 3,170 3,125 3,531 Louisiana 2,456 2,532 2,842 3,026 3,220 3,363 3,636 Maryland 4,400 4,500 4,930 4,685 5,117 5,099 5,037 Mississippi 2,060 1,890 1,970 2,080 2,011 1,967 2,066 North Carolina 5,250 5,497 5,530 5,334 5,497 5,702 5,804 Oklahoma 2,390 2,423 2,479 2,600 2,664 2,666 2,754 South Carolina 1,662 1,776 1,853 1,852 1,868 1,963 2,200 Tennessee 2,601 2,474 2,706 2,723 2,713 2,657 2,712 Texas 6,960 7,781 8,50~ 8,622 9,268 10,091 10,531 Virginia 4,608 4,587 4,938 4,869 4,869 5,135 5,719 West Virginia 2,697 2,316 2,220 2,269 2,101 2,191 2,406
West Alaska ... Arizona 931 994 1,007 1,055 1,118 1,238 1,392 California 12,612 13,365 14,572 15,230 15,532 16,918 19,202 Colorado 1,520 1,597 1,783 1,800 1,912 2,006 1,972 Hawaii ... Idaho 450 464 511 520 526 538 587 Montana 577 631 674 529 586 596 645 Nevada 341 329 349 373 370 352 380 New Mexico 599 628 629 7241 764 888 1,060 Oregon 1,508 1,591 1,516 1,55~~ 1,557 1,400 1,524 Utah 549 583 560 5M 602 567 570 Washington 2,224 2,331 2,438 2,443 2,468 2,422 2,623 Wyoming 299 268 326 287 326 272 384
Historical Statistics, 1925-86 9
------ -
Table 1. Continued Sentenced prisoners in State and Federal institutions on December 31, 1925-86
1959 1960 1961 1962 1963 1964 1965
U.s. total 208,105 212,953 220,149 218,830 217,283 214,336 210,895
Federal 22,492 23,218 23,696 23,944 23,128 21,709 21,040 State 185,613 189,735 196,453 194,886 194,155 192,627 189,855
Northeast Connecticut 1,500 1,497 1,639 1,653 1,652 1,716 1,642 Maine 696 750 766 728 723 719 695 Massachusetts 1,913 1,920 1,978 1,947 2,046 1,980 1,929 New Hampshire 147 180 191 164 210 198 205 New Jersey 4,101 4,284 4,572 4,573 4,594 4,614 4,839 New York 16,904 17,207 17,569 17 :637 17,906 17,658 17,504 Pennsylvania 7,924 7,802 8,047 8,160 7,804 7,667 7,1113 Rhode Island 274 255 262 249 266 278 310 Vermont 315 269 319 316 289 290 263
Midwest Illinois 8,660 9,064 9,611 8,928 8,855 8,754 8,306 Indiana 5,268 5,429 5,372 5,085 4,836 4,797 4,486 Iowa 2,212 2,204 2,418 2,406 2,291 2,256 2,178 Kansas 2,248 2,313 2,627 2,875 2,893 2,825 2,791 Michigan 9,622 9,550 9,197 8,338 8,264 8,028 7,3t!2 Minnesota 2,137 2,05'9 2,016 1,883 1,720 1,863 1,772 Missouri 3,614 3,698 3,930 4,056 3,816 3,529 3,517 Nebraska 1,237 1,269 1,328 1,316 1,411 1,323 1,151 North Dakota 270 248 228 235 235 240 208 Ohio 11,448 11,111 11,155 11,513 11,644 11,861 11,374 South Dakota 561 526 571 544 556 525 571 Wisconsin 2,640 2,784 2,953 2,887 2,811 2,844 2,830
South Alabama 5,449 5,369 5,540 5,521 5,083 4,586 4,377 Arkansas 1,911 2,016 2,076 2,066 2,000 1,992 1,970 Delaware 232 226 240 206 208 281 315 Dist. of Columbia 1,990 1,958 2,059 1,890 1,841 1,653 1,604 Florida 6,802 7,084 7,615 7,599 6,751 6,725 6,995 Georgia 6,963 6,985 6,851 7,051 7,350 7,309 5,966 Kentucky 3,430 3,603 3,703 3,381 3,025 3,030 2,813 Louisiana 3,561 3,749 3,828 4,058 3,961 3,564 3,844 Maryland 5,010 5,316 5,745 5,615 5,164 5,453 5,467 Mississippi 2,057 1,975 2,068 2,179 2,121 2,056 2,019 North Carolina 5,949 5,977 5,875 5,409 4,950 4,888 6,029 Oklahoma 2,706 2,679 2,693 2,671 2,776 2,808 2,829 South Carolina 2,131 2,080 2,144 2,281 2,34'1 2,306 2,323 Tennessee 2,914 3,134 3,144 3,167 3,246 3,187 3,213 Texas 11,123 11,308 11,890 12,203 12,084 12,278 12,854 Virginia 5,909 5,775 5,734 5,308 5,103 4,873 4,553 West Virginia 2,492 2,407 2,207 2,031 1,912 1,722 1,477
West Alaska Arizona 1,493 1,516 1,592 1,679 1,728 1,627 1,694 California 19,299 21,660 23,927 24,032 26,133 26,483 26,325 Colorado 2,012 2,078 2,149 2,356 2,594 2,666 2,766 Hawaii 509 558 583 536 490 504 463 Idaho 509 549 552 516 512 476 481 Montana 588 602 648 6'14 715 742 586 Nevada 399 413 431 453 442 450 622 New Mexico 1,136 1,243 1,243 1,274 1,178 987 1,002 Oregon 1,552 1,710 1,799 1,915 2,061 2,056 2,000 Utah 533 553 638 653 692 661 701 Washington ~,B76 2,455 2,401 2,341 2,539 2,960 3,202 Wyoming 387 338 329 328 327 339 336
10 Prisoners in State and Federal Institutions
1966 1967 1968 1969 1970 1971 1972
U.s. total 199,654 194,896 187,274 197,136 196,441 198,061 196,092
Federal 19,245 19,579 19,703 19,623 20,038 20,948 21,713 State 180,409 175,317 167,571 177,513 176,403 177,113 174,379
Northeast Connecticut 1,599 1,587 1,444 1,630 1,568 1,938 1,818 Maine 605 592 598 561 516 454 473 Massachusetts 1,829 1,824 1,912 1,966 2,053 2,203 1,856 New Hampshire 205 222 224 215 244 213 240 New Jersey 4,912 4,614 5,065 5,382 5,704 5,272 5,279 New York 15,760 14,085 12,781 12,452 12,059 11,928 11,693 Pennsylvania 6,519 5,674 5,519 5,780 6,289 5,315 6,245 Rhode Island 329 350 378 340 Vermont 233 220 226 170 162 212 139
Midwest Illinois 7,491 7,041 6,886 7,131 6,381 5,854 5,630 Indiana 3,907 3,884 4,057 4,243 4,137 4,358 3,847 Iowa 1,885 1,830 1,747 1,732 1,747 1,540 1,306 Kansas 2,444 2,289 2,185 1,980 1,902 2,017 1,642 Michigan 6,754 7,037 7,743 8,049 9,079 9,547 8,471 Minnesota 1,6?O 1,652 1,632 1,605 1,585 1,553 1,337 Missouri 3,4';'1 3,263 3,245 3,242 -3,413 3,614 3,533 Nebraska 1,027 971 950 937 1,001 1,040 953 North Dakota 199 182 156 161 147 132 179 Ohio 10,694 10,323 10,189 9,567 9,185 9,063 8,276 South Dakota 555 489 446 380 391 388 344 Wisconsin 2,709 2,607 2,172 2,768 2,973 2,493 2,036
South Alabama 4,056 3,881 4,017 4,140 3, '19O 3,823 3,632 Arkansas 1,864 1,651 1,658 1,619 Delaware 270 308 555 596 186 279 Dist. of Columbia 1,542 1,268 1,466 1,504 1,423 2,600 2,500 Florida 6,972 7,261 7,946 8,512 9,187 9,653 10,382 Georgia 5,385 5,300 5,175 5,084 5,113 6,777 8,225 Kentucky 2,932 2,834 2,864 3,314 2,849 3,060 2,941 Louisiana 4,068 4,112 4,237 4,170 4,196 4,159 3,421 Maryland 5,117 5,083 5,096 5,356 5,186 4,950 5,578 Mississippi 1,829 1,667 1,544 1,700 1,730 1,841 1,879 North Carolina 5,297 5,516 5,856 5,969 7,795 8,263 Oklahoma 2,776 2, 'l56 2,893 3,230 3,640 3,729 3,667 South Carolina 2,248 2,337 2,331 2,506 2,726 3,066 3,197 Tennessee 2,968 2,980 2,999 3,148 3,268 3,454 3,329 Texas 12,392 12,313 12,215 14,014 14,331 15,989 15,709 Virginia 4,220 4,033 4,126 4,407 4,648 4,981 4,946 West Virginia 1,189 1,208 1,124 1,001 938 1,063 1,058
West Alaska 191 183 Arizona 1,627 1,596 1,692 1,714 1,461 1,401 1,529 California 27,467 27,741 28,435 27,535 25,033 17,474 16,970 Colorado 2,540 2,514 2,338 2,107 2,066 1,957 1,925 Hawaii 423 364 296 256 228 254 300 Idaho 477 391 328 348 411 362 377 Montana 548 521 466 372 260 250 283 Nevada 651 608 645 665 690 635 646 New Mexico 912 892 850 857 742 642 597 Oregon 1,380 1,803 1,815 1,712 1,800 2,016 1,856 Utah 659 651 640 488 491 590 581 Washington 3,098 2,738 2,599 2,765 2,864 2,782 2,608 Wyoming 279 254 257 246 231 263 262
Historical Statistics, 1925-86 11
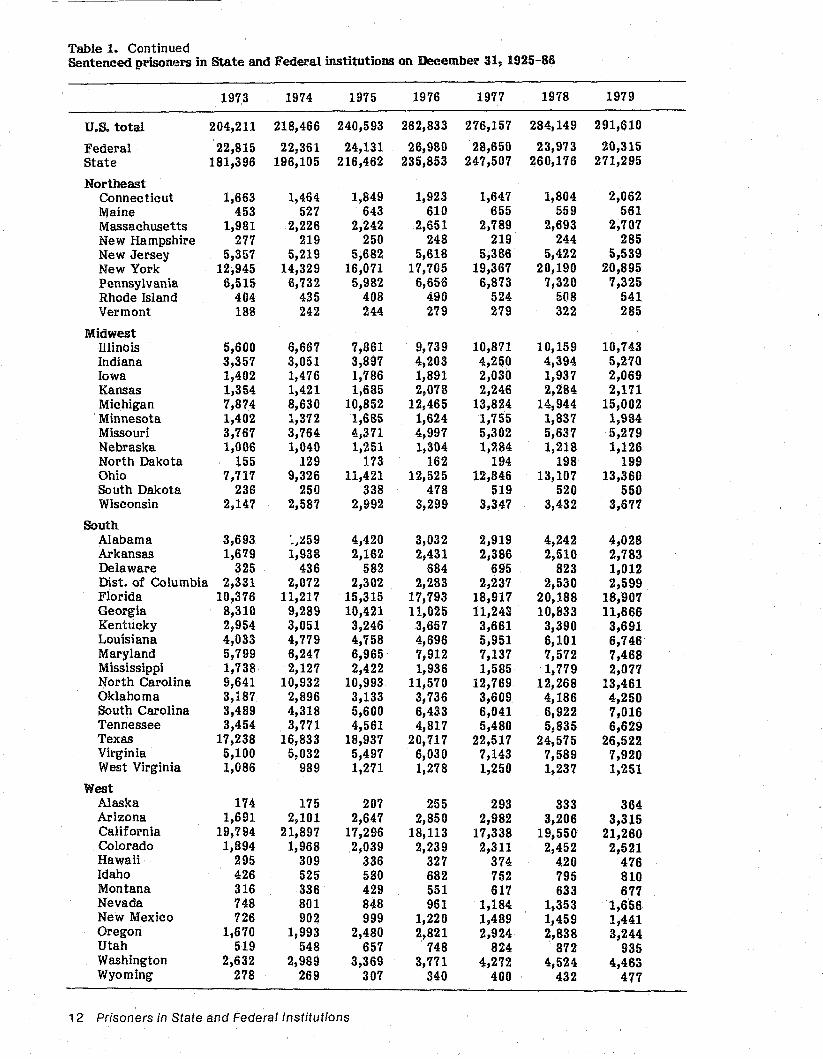
Table 1. Continued Sentenced prison'~rs in State and Federal institutions on December 31, 1925-86
1973 1974 1975 1976 1977 1978 1979
U.s. total 204,211 218,466 240,593 262,833 276,157 284,149 291,610
Federal 22,815 22,361 24,131 26,980 28,650 23,973 20,315 State 181,396 196,105 216,462 235,853 247,507 260,176 271,295
Northeast Connecticut 1,663 1,464 1,849 1,923 1,647 1,804 2,062 Maine 453 527 643 610 655 559 561 Massachusetts 1,981 2,226 2,242 2,651 2,789 2,693 2,707 New Hampshire 277 219 250 248 219 244 285 New Jersey 5,357 5,219 5,682 5,618 5,386 5,422 5,539 New York 12,945 14,329 16,071 17,705 19,367 20,190 20,895 Pennsylvania 6,515 6,732 5,982 6,656 6,873 7,320 7,325 Rhode Island 404 435 408 490 524 508 541 Vermont 188 242 244 279 279 322 285
Midwest Illinois 5,600 6,667 7,861 9,739 10,871 10,159 10,743 Indiana 3,357 3,051 3,897 4,203 4,250 4,394 5,270 Iowa 1,402 1,476 1,786 1,891 2,030 1,937 2,069 Kansas 1,354 1,421 1,685 2,078 2,246 2,284 2,171 Michigan 7,874 8,630 10,852 12,465 13,824 14,944 15,002 Minnesota 1,402 1,372 1,685 1,624 1,755 1,837 1,984 Missouri 3,767 3,764 4,371 4,997 5,302 5,637 5,279 Nebraska 1,006 1,040 1,251 1,304 1,284 1,218 1,126 North Dakota 155 129 173 162 194 198 199 Ohio 7,717 9,326 11,421 12,525 12,846 13,107 13,360 South Dakota 236 250 338 478 519 520 550 Wisconsin 2,147 2,587 2,992 3,299 3,347 3,432 3,677
South Alabama 3,693 ·.,~59 4,420 3,032 2,919 4,242 4,028 Arkansas 1,679 1,938 2,162 2,431 2,386 2,510 2,783 Delaware 325 436 582 684 695 823 1,012 Dist. of Columbia 2,331 2,072 2,302 2,283 2,237 2,530 2,599 Florida 10,376 11,217 15,315 17,793 18,917 20,188 18,907 Georgia 8,310 9,289 10,421 11,025 11,243 10,833 11,666 Kentucky 2,954 3,051 3,246 3,657 3,661 3,390 3,691 Louisiana 4,033 4,779 4,758 4,696 5,951 6,101 6,746 Maryland 5,799 6,247 6,965 7,912 7,137 7,572 7,468 Mississippi 1,738 2,127 2,422 1,936 1,585 1,779 2,077 North Carolina 9,641 10,932 10,993 11,570 12,769 12,268 13,461 Oklahoma 3,187 2,896 3,133 3,736 3,609 4,186 4,250 South Carolina 3,489 4,318 5,600 6,433 6,041 6,922 7,016 Tennessee 3,454 3,771 4,561 4,817 5,480 5,835 6,629 Texas 17,238 16,833 18,937 20,717 22,517 24,575 26,522 Virginia 5,100 5,032 5,497 6,030 7,143 7,589 7,920 West Virginia 1,086 989 1,271 1,278 1,250 1,237 1,251
West Alaska 174 175 207 255 293 333 364 Arizona 1,691 2,101 2,647 2,850 2,982 3,206 3,315 California 19,794 21,897 17,296 18,113 17,338 19,550 21,260 Colorado 1,894 1,968 2,039 2,239 2,311 2,452 2,521 Hawaii 295 309 336 327 374 420 476 Idaho 426 525 580 682 752 795 810 Montana 316 336 429 551 617 633 677 Nevada 748 801 848 961 1,184 1,353 1,656 New Mexico 726 902 999 1,220 1,489 1,459 1,441 Oregon 1,670 1,993 2,480 2,821 2,924 2,838 3,244 Utah 519 548 657 748 824 872 935 Washington 2,632 2,989 3,369 3,771 4,272 4,524 4,463 Wyoming 278 269 307 340 400 432 477
12 Prisoners in State and Federal Institutions
1980 1981 1982 1983 1984 1985 1986
U.s. t(.ltal 304,692 344,283 385,343 405,501 429,050 465,236 503,'194
Federal 19,025 21,311 21,630 23~836 24,805 29,215 33,135 State 285,66'1 322,972 363,713 381,665 404,245 436,021 470,659
Northeast Connecticut 2,469 2,770 3,004 3,508 3,665 3,955 3,990 Maine 541 667 729 790 802 1,028 1,136 Massachusetts 3,032 3,791 4,238 4,372 4,738 5,160 5,396 New Hampshire 299 351 431 434 521 630 723 New Jersey 5,561 6,846 '1,970 9,092 10,345 11,328 12,017 New York 21,639 25,494 28,501 30,924 33,782 35,346 38,64'1 Pennsylvania 8,130 9,292 10,466 11,691 13,004 14,132 15,1'14 Rhode Island 601 688 785 867 888 965 1,015 Vermont 326 361 390 390 361 417 430
Midwest Illinois 10,451 13,669 13,551 15,364 16,912 18,279 19,456 Indiana 6,281 7,559 8,295 8,973 9,063 9,767 9,963 Iowa 2,435 2,670 2,829 2,814 2,836 2,687 2,777 Kansas 2,431 2,800 3,015 3,620 4,130 4,565 5,257 Michigan 15,124 15,157 14,913 14,510 14,604 17,755 20,742 Minnesota 1,884 1,909 2,197 2,235 2,331 2,495 2,515 Missouri 5,726 6,489 7,422 8,026 8,685 9,780 10,309 Nebraska 1,389 1,480 1,560 1,554 1,582 1,753 1,919 North Dakota 264 238 305 362 389 395 381 Ohio 13,138 14,796 17,147 16,416 16,993 18,776 19,930 South Dakota 625 665 758 812 893 1,000 1,111 Wisconsin 3, '188 4,249 4,441 4,226 4,845 5,220 5,535
South Alabama 4,489 5,827 7,565 8,68'{ 9,824 10,449 11,129 Arkansas 2,805 3,214 3,747 4,128 4,346 4,504 4,578 Delaware 967 984 1,260 1,392 1,340 1,541 1,808 nist. of Columbia 2,719 2,932 3,351 3,465 3,718 4,604 4,787 Florida 19,945 22,898 26,892 25,293 26,751 28,054 31,632 Georgia 11,922 12,377 14,038 14,935 14,596 15,363 16,291 Kentucky 3,588 3,993 3,915 4,641 4,710 4,956 5,282 Louisiana 7,622 8,577 9,436 10,516 10,685 10,977 11,131 Maryland 7,454 8,841 10,968 11,854 12,316 12,183 12,444 Mississippi 2,690 3,412 4,412 4,542 4,766 5,364 5,474 North Carolina 14,456 14,754 15,349 14,257 15,219 16,007 16,373 Oklahoma ~,544 4,950 6,054 7,025 6,960 7,108 7,604 South Carolina 6,683 7,185 8,048 8,225 8,316 9,202 9,781 Tennessee 6,844 7,678 7,683 7,8'16 '[ ,22'1 6,943 7,182 Texas 29,892 31,502 36,149 35,259 36,682 37,532 38,534 Virginia 8,231 8,460 9,203 9,197 9,784 10,778 11,166 West Virginia 1,257 1,565 1,547 1,609 1,579 1,725 1,482
West Alaska 381 510 608 S08 1,052 1,250 1,293 Arizona 3,597 4,780 5,809 6, '143 7,646 8,273 9,038 California 23,264 27,913 33,583 38,025 41,652 48,326 57,725 Colorado 2,596 2,743 3,037 3,242 3,230 3,3~6 3,808 Hawaii 544 680 804 977 1,244 1,317 1,422 Idaho 672 903 990 1,123 1,185 1,317 1,418 Montana 691 734 810 781 826 1,096 1,087 Nevada 1,815 2,075 2,546 3,068 3,430 3,774 4,425 New Mexico 925 1,305 1,433 1,629 1,814 2,028 2,198 Oregon 3,195 3,284 3,867 3,318 3,439 3,714 4,001 Utah 916 1,051 1,117 1,191 1,491 1,623 1,814 Washington 4,339 5,294 5,861 6,198 6,342 6,468 6,509 Wyoming 490 610 684 681 706 726 820
••• Data not available.
Historical Statistics, 1925-86 13
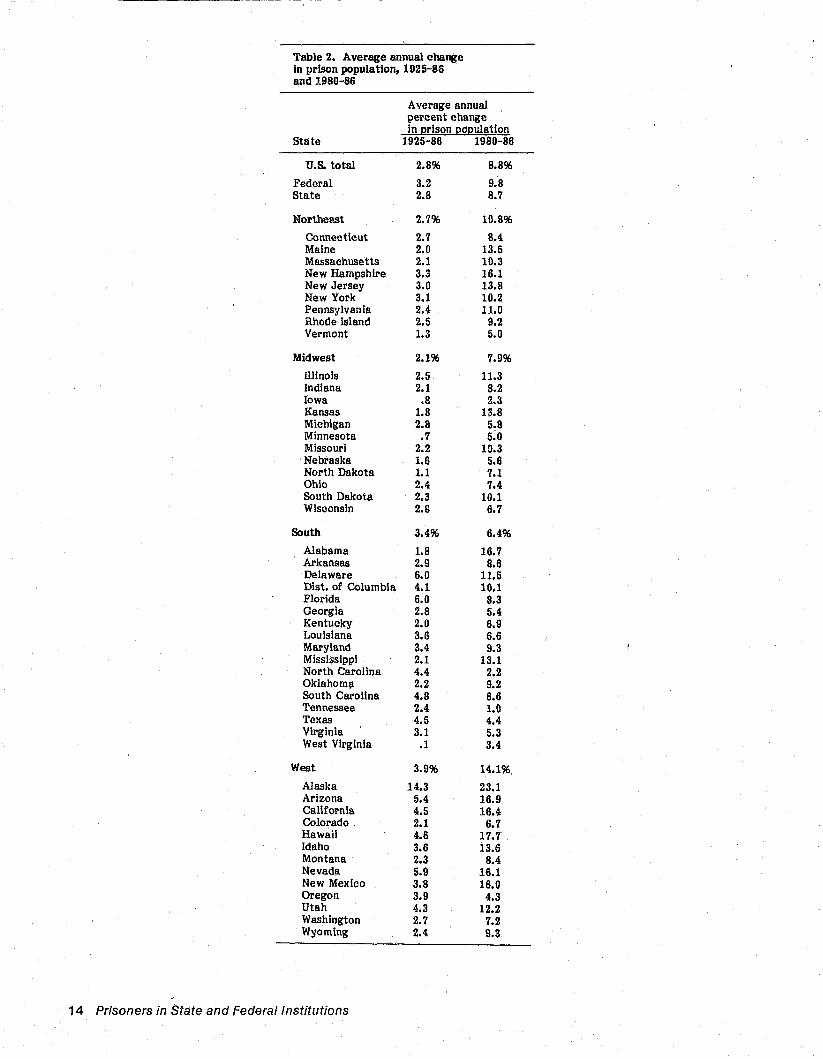
Table 2. Average annual change in prison population, 1925-86 and 1980-86
Average annual percent change in Qrlson (;!o(;!u1atlon
State 1925-86 1980-86
U.s. tots.! 2.896 8.896
Federal 3.2 9.8 State 2.8 8.7
Northeast 2.7% 10.896
Connecticut 2.7 8.4 Maine 2.0 13.5 Massachusetts 2.1 10.3 New Hampshire 3.3 16.1 New Jersey 3.0 13.8 New York 3.1 10.2 Pennsylvania 2.4 11.0 Rhode island 2.5 9.2 Vermont 1.3 5.0
Midwest 2.196 7.996
Illinois 2.5 11.3 Indiana 2.1 8.2 Iowa .8 2.3 Kansas 1.8 13.8 Michigan 2.8 5.8 Minnesota .7 5:0 Missouri 2.2 10.3 Nebraska 1.6 5.6 North Dakota 1.1 7.1 Ohio 2.4 7.4 South Dakota 2.3 10.1 Wisconsin 2.8 6.7
South 3.496 6.4%
Alabama 1.B 16.7 Arkansas 2.9 8.6 Delaware 6.0 11.5 Dlst. of Columbia 4.1 10.1 Florida 6.0 B.3 Georgia 2.8 5.4 Kentucky 2.0 6.9 Louisiana 3.6 6.6 Maryland 3.4 9.3 Mississippi 2.1 13.1 North Carolina 4.4 2.2 Oklahoma 2.2 9.2 South Carolina 4.8 6.6 Tennessee 2.4 1.0 Texas 4.5 4.4 Virginia 3.1 5.3 West Virginia .1 3.4
West 3.996 14.1%
Alaska 14.3 23.1 Arizona 5.4 16.9 California 4.5 16.4 Colorado 2.1 6.7 Hawaii 4.6 17.7 Idaho 3.6 13.6 Montana 2.3 8.4 Nevada 5.9 IS.1 New Mexico 3.8 16.0 Oregon 3.9 4.3 Utah 4.3 12.2 Washington 2.7 7.2 Wyoming 2.4 9.3
14 Prisoners in State and Federal Institutions
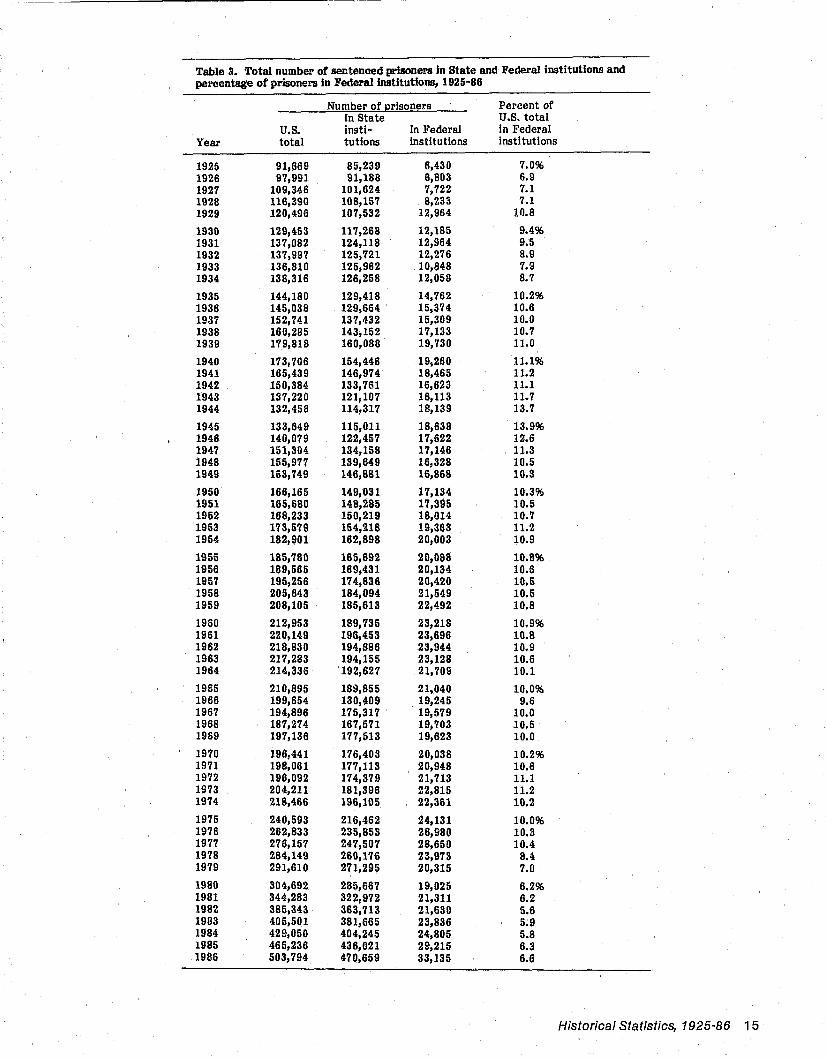
Table 3. Total number of sentenced prisoners In State and Federal institutions and percentage of prisoners In Federallnstitutions, 1925-86
Number of Qrlsoners Percent of In State U.S. total
U.S. Instl- In Federal In Federal Year total tutlons Instltu tlons institutions
1925 91,669 85,239 6,430 7.096 1926 97,991 91,188 6,803 6.9 1927 109,346 101,624 7,722 7.1 1928 116,390 108,157 8,233 7.1 1929 120,496 107,532 12,964 10.8
1930 129,453 117,268 12,185 9.496 1931 137,082 124,118 12,964 9.5 1932 137,997 125,721 12,276 8.9 1933 136,810 125,962 10,848 7.9 1934 138,316 126,258 12,058 8.7
1935 144,180 129,418 14,762 10.296 1936 145,038 129,664 15,374 10.6 1937 152,741 137,432 15,309 10.0 1938 160,285 143,152 17,133 10.7 1939 179,818 160,088 19,730 11.0
1940 173,706 154,446 19,260 11.196 1941 165,439 146,974 18,465 11.2 1942 150,384 133,761 16,623 11.1 1943 137,220 121,107 16,113 11.7 1944 132,456 114,317 18,139 13.7
1945 133,649 115,011 18,638 13.996 1946 140,079 122,457 17,622 12.6 194'1 151,304 134,158 17,146 11.3 1948 155,977 139,649 16,328 10.5 1949 163,749 146,881 16,868 10.3
1950 166,165 149,031 17,134 10.396 1951 165,680 148,285 1'1,395 10.5 1952 168,233 150,219 18,014 10.'1 1953 173,579 154,216 19,363 11.2 1954 182,901 162,898 20,003 10.9
1955 185,780 165,692 20,088 10.896 1956 189,565 169,431 20,134 ID.6 1957 195,256 1'14,836 20,420 10.5 1958 205,643 184,094 21,549 10.5 1959 208,105 185,613 22,492 10.8
1960 212,953 189,735 23,218 10.996 1961 220,149 196,453 23,696 10.8 1962 218,830 194,886 23,944 10.9 1963 217,283 194,155 23,128 10.6 1964 214,336 192,627 21,709 10.1
1965 210,895 1811,855 21,040 10.096 1966 199,654 130,409 19,245 9.6 1967 194,896 175,317 19,579 10.0 1968 187,274 16'1,571 19,703 10.5 1969 197,136 177,513 19,623 10.0
1910 196,441 176,403 20,038 10.296 1971 198,061 177,113 20,948 10.6 1972 196,092 174,3'19 21,713 11.1 1973 204,211 181,396 22,815 11.2 1974 218,466 196,105 22,361 10.2
1975 240,593 216,462 24,131 10.096 19'16 262,833 235,853 26,980 10.3 1977 276,157 247,507 28,650 10.4 19'18 284,149 260,1'16 23,9'13 8.4 19'19 291,610 271,295 20,315 '1.0
1980 304,692 285,66'1 19,025 6.296 1981 344,283 322,972 21,311 6.2 1982 385,343 363,713 21,630 5.6 1983 405,501 381,665 23,836 5.9 1984 429,050 404,245 24,805 5.8 1985 465,236 436,021 29,215 6.3 1986 503,794 470,659 33,135 6.6
Historical Statistics, 1925-86 15
--------------- --- --
Sources
1925 Pr~ In state and FedeN! Prlaons 1959 PtlIIoners in state and Federal Instltu- 1977 PrI500ers in state and Federal Instltu-and RefOl'llllltories 1927, Bureau of tlOII8l!1l10, National Prisoner Statls- tIons on December 31, 1970, National the Census, U.S. Department of Com- tics Report Number 27, Bureau of Prisoner statistics Bulletin NCJ-merce, 1931, p. 4, table 2 Prisons, U.S. Department of Justice, 64671, Bureau ot Justice Statistics,
1926-29 PriaoDers in state and Federal PrfzIons 1961, tables 2 and 3 U.S. Department of Justice, 1980, p. aDd Beformatories 19Z9 and 1930, Bu- 1960-61 PrIaoners in State and Federal IMtltu- 42, Special table reau of the Census, U.S. Department tlODS 1964, Na tlonal Prisoner Sta tls- 1978 Prisoners in state and FederallDstitu-of Commerce, 1932, p. 3, table 2 tics Report Number 38, Bureau ot tiOD!! on December 31, 1979, National
1930-31 PriaonerIIin State and Federal PriIIoM Prisons, U.S. Department of Justice, Prisoner StatlBtlcs Bulletin NCJ-and Reformatories 1931 and 1932, Bu- 1965, tables 1 and 6 73719, Bureau of Justice Statistics, resu of the Census, U.S. Department 1962 PrIlIooers in State and Federal Institu- U.S. Department of Justice, :981, p. of Commerce, 1934, p. 48, table 48 tIOIIS 19113, National Prisoner Statls- 31, Special table
1932 l'riaoIlen in State and Federal PriIIoruI tics Report Number 36, Bureau of 1979 PrIaoners in State and Federallnstitu-and Reformatories 1933, Bureau of Prisons, U,S. Department of JUstice, tJou on December 31,1980, National the Census, U.S. Department of Com- 1964, tables 1 and 4 Prisoner Statistics Bulletin NCJ-merce, 1935, p. 3, table 2 1963 PrJaoners in State and Federal Instltu- 80520, Bureau of JUstice Statistics,
1933 PrI80nen m State and Federal PriIIoruI tIons 19114, National Prisoner Statls- U.S. Department of Justice, 1982, p. and Reformatories 1934, Bureau of tics Report Number 38, Bureau of 35, Special table the Census, U.S. Department of Com- Prisons, U.S. De~rtment of Justice, 1980 PrisIooeI'II in state and Federal lnstftu-merce, 1936, p. 3, table 2 1965, tables 1 and 6 tionB on December 31, 1911:1., National
1934 Pri800ers in State and Federal PrIsons 1964 Priaoners in state and Federal Institu- Prisoner Statistics Bulletin NCJ-and Beformatorld 1935, Bureau of tioDs 1965, National Prisoner Statls- 86485, Bureau·of Justice statistics, the Census, U.S. Department of Com- tics Report Number 40, Buresu of U.S. Department of Justice, 1983, p. merce, 1937, p. 3, table 2 Prisons, U.S. Department of JUstice, 35, Special table
1935 PrIaoDers in State and Federal Prf80ns 1966, tables 1 and 6 1981 PrJaooers in State and Feder'allDstltu-and Reformatories 1936, Bureau of 1965-66 PriMlners in State and Fedaral InstItu- tions on December 31, 1982, National the Census, U.S. Department of COJII- tIons for Adult FelODa 19114, National Prisoner Statistics Bulletin NCJ-merce, 1938, p. 4, table 2 Prisoner Statistics Report Number 43, 93311, Bureau of Justice Stctlstlcs,
1936 PriIIooers in State and Federal Pri!Joos Bureau of Prisons, U.S. Department U.S. Department of Justice, 1984, p. and Reformatories 193'1, Bureau ot of Justice. 1988, tables 1 and 6 37, Special table the Census, U.S. Department ot Com- 1967 Prfaoners in State and Federal IostItu- 1982 Priaooers in state and Fedefallnstitu-merce, 1939, p. 4, table 2 tIons for Adult FeloD!l196'1. National tIODs on December 31,1983, National
1937 PriIIoaers in State and Federal PrI800s Prisoner Stlltlstics Report Number 44, Prisoner Statistics Report NCJ-aDd Beformatorles 1938, Bureau of Bureau of Prisons, U.S. Department 99861, Bureau ot Justice Statistic!'!, the Census, U.S. Department of Com- of Justice, 1969, tables 1 and 6 U.S. Department of Jus~ibe, 1986, p. merce, 1941, p. -i, table 2 1968-70 Pris.HIers in state and FederallMtltu- 33, Special table
1938 ~ers m State and Federal Prl80ruJ tlOII8 for Adult FeJoM 19118, 1969, 1983 Priaoaers in St.llte aDd Feden!! InstItu-and RefOl'lD!ltorles 1939, Bureau of 1970, National Prisoner Statistics tiODs on December 31,1984, National the Census, U.S. Department of Report Number 47, Bureau ot Prisons, Prisoner Statistics Report NCJ- . Commerce, 1941, p. 4, table 2 U.S. Department of Justice, 1972, 103768, Bureau of Justice Statistics,
1939-43 Prlaaaers in State and Federalll1!Jtl- tables 4 and 6 U.S. Department of Ju:rtlce, 1987, p. tntiODs 1957, National Prisoner Sta- 1971 I'lVooers in State and Federal InstItu- 33, table 18 tlstlcs RepQrt Number 19, Bureau of tiona OIl December 31, 1971, 1912, 1984 Correctional Populations In the Prisons, U.S. Department of Justice, 1913, National Prisoner Statistics United States 1985, National Prisoner 1958, table 4 Bulletin SD-NPS-PSF-l, Law Enfcrce- Statistics Report NCJ-I03957, Bureau
1944 Prf80aers in Stale and Federal InstItn- ment Assistance Administration, U.S. of Justice Statistics, U.S. Department tIoIIIJI195t, National Prisoner Statls- Thlpartment of Justice, 1975, p. 12, ot Justice, 1987, table 5.18 tlcl! neport Number 24, BlJreau of table 1 1985 Correctional PopuJatiou In the Prisons, U.S. Department of Justice, 1972-73 Prf800ers in State and Federal InstItu- United States 19811, National Prisoner 1960, table 4 tIons on December 31,19'14, National Statistics Report. Bureau of Justice
1945-54 l'riIoners in State and Federal InstItu- Prisoner Statistics Bulletin SD-NPS- Statistics, U.S. Department ot Justice tIODs 195'1, National Prisoner Statls- PSF-2, Law Enforcement Asslstanlle (torthcoming) tics Report Number 19, Bureau of Administration, U.S. Department of 1986 CorNcUonal PopalaticMIs In the Prisons, U.S. Department ot Justice, Justice, 1976, p. 14, table 1 United States 198'1, National Prlson/;'.-1958, table 4 1974 Pritoners in state and FederallD!lt!tu- Statisti<(!!1 Report, Bureau ot Justice
1955 PrIaooera in State and Federal !D!Itf- tiooa on December 31, 19'15, Nat!ol'al Statistics, U.S. Department of Justice tntlou tor Adult FeJooa 19118, 1989, Prisoner Statistics Bulletin SD-NPS- (forthcoming) 1t'lI, National PrIsoDllr Statistics PSF-3, Law Enforcement Assistance Report NUmber 47, Buresu of Prisons, Administration, U.S. Department of U.S. Department of Justice, 1972, Justice, 1977, p. 22, table 4 taMes 4 and 6 1975 PriIIoners in State and FederallDstltu-
1956 PrieoDers in state and F~raJ. InstItu- tiooa on December 31,19'111, National tIons 195'1, National Prisoner Statls- Prisoner. Statistics Bulletin SD-NPS-tics Report Number 19, Bureau of PSF-4, Law Enforcement Assistance PrI30ns, U.S. Department ot Justice, Administration, U.S. Department of 1958, table 4 Justice, 1978, p. 22, table 4
1957 PrIIoGers in State and Federal Instl~- 1976 Pr1aooers in State and FederallDstltu-tIcaa 1983, National Prisoner Statls- tiooa on December 31.197'1, National tics Report Number 36, Bureau of Prisoner Statistics Bulletin SD-NPS-Prisons, U.S. Departm~nt of Justice, PSF-5, Law Enforcement Assistance 1964, tables 1 and 4 Administration, U.S. Department ot
1958 Prisofter!I in State IlIIIli FedemJ. Jmrtitu- Justice, 19'19, p. 16, table 7 tiona 1959, National Prisoner Statis-tics Report Number 24, Bureau of PrlsoJU:. U.S. Department of Justice, 1960, table 4
«U.S. G.P.O. 1988-202-032:80004 16 Prisoners in State and Federal Institutions