Embed Size (px)
Citation preview
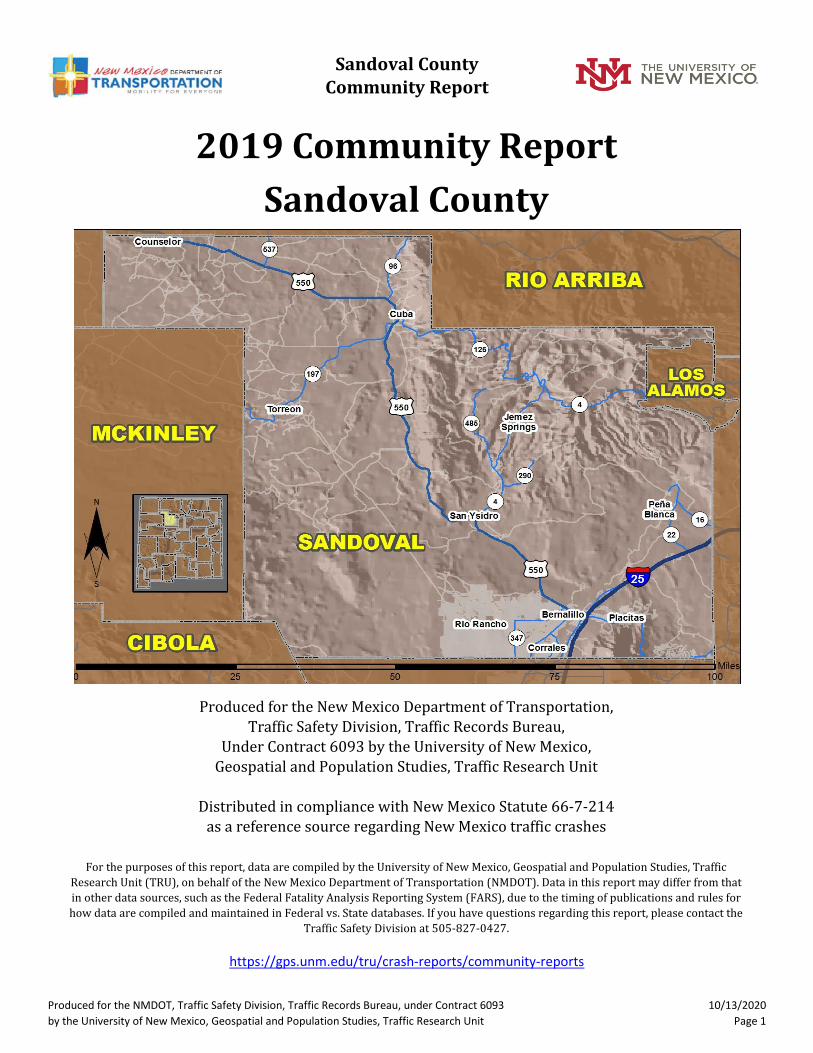
Sandoval CountyCommunity Report
2019 Community Report
Sandoval County
https://gps.unm.edu/tru/crash-reports/community-reports
For the purposes of this report, data are compiled by the University of New Mexico, Geospatial and Population Studies, Traffic
Research Unit (TRU), on behalf of the New Mexico Department of Transportation (NMDOT). Data in this report may differ from that
in other data sources, such as the Federal Fatality Analysis Reporting System (FARS), due to the timing of publications and rules for
how data are compiled and maintained in Federal vs. State databases. If you have questions regarding this report, please contact the
Traffic Safety Division at 505-827-0427.
Produced for the New Mexico Department of Transportation, Traffic Safety Division, Traffic Records Bureau,
Under Contract 6093 by the University of New Mexico, Geospatial and Population Studies, Traffic Research Unit
Distributed in compliance with New Mexico Statute 66-7-214as a reference source regarding New Mexico traffic crashes
Produced for the NMDOT, Traffic Safety Division, Traffic Records Bureau, under Contract 6093
by the University of New Mexico, Geospatial and Population Studies, Traffic Research Unit
10/13/2020
Page 1

Sandoval CountyCommunity Report
Sources
Aggravated DWI – A driver arrested for 1) driving with a BAC of 0.16 or higher, 2) driving under the influence of alcohol
or drugs and causing bodily injury to a human being as a result, or 3) driving under the influence of alcohol or drugs and
refusing to submit to a BAC test at the time of arrest for DWI.
Alcohol-involved Crash – A crash for which the Uniform Crash Report indicated that 1) a DWI citation was issued, 2)
alcohol was a contributing factor, or 3) a person in control of a vehicle (including a pedestrian or pedalcyclist) was
suspected of being under the influence of alcohol.
Alcohol-involved Driver – A person in control of a vehicle who was cited for DWI or indicated on the Uniform Crash
Report as being either suspected or determined by testing to be under the influence of alcohol. There can be multiple
alcohol-involved drivers in a single alcohol-involved crash.
Crash – A reported incident on a public roadway involving one or more motor vehicles that resulted in death, personal
injury, or at least $500 in property damage. Crashes on private property (such as a parking lot) are not included.
DWI Arrest (Citation) – In this report, a DWI arrest (a.k.a. a DWI citation) is a driver arrested for either DWI or
aggravated DWI. New Mexico’s legal limit for presumption of driving while intoxicated (DWI) is 0.08 for non-
commercial drivers older than 21 years of age, 0.04 for commercial vehicle drivers, and 0.02 for drivers younger than
21 years of age.
DWI Conviction – A driver convicted of driving under the intoxicating influence of alcohol, narcotics, or pathogenic
drugs, including aggravated DWI.
Fatal Crash – A crash in which at least one person was killed. More than one person can be killed in a single fatal crash.
Fatalities – The number of people killed in a crash. The terms “killed” and “deaths” are synonymous with “fatalities.” A
fatality is crash-related if it occurs at the time of the crash or if the person(s) involved in the crash dies within 30 days.
Injury Crash – A reported crash in which at least one person was injured. Injury crashes involve at least one suspected
serious injury (Class A), suspected minor injury (Class B), or possible injury (Class C). Fatal crashes are not included.
Missing Data – An indication that the applicable field on the UCR form was left blank or contained an invalid code.
Starting with crashes that occurred in 2012, improvements in the identification of missing data in the NMDOT crash
database led to an increase in the reported amount of missing data.
Pedalcyclist – A person riding a mechanism of transport that is powered solely by pedals (a.k.a. bicyclist).
Pedestrian – A person on foot, walking, running, jogging, hiking, sitting or lying down who is involved in a motor vehicle
traffic crash.
Definitions
Crash Data – New Mexico Department of Transportation, Traffic Safety Division, Traffic Records Bureau, Traffic Crash
Database, as of the report date below. Crash data are compiled using NMDOT Uniform Crash Reports (UCR), submitted by law
enforcement agencies in the state, for any incident on a public roadway involving one or more motor vehicles that resulted in
death, injury, or at least $500 in property damage. These reports are processed by the NMDOT Traffic Records Bureau and
analyzed by the University of New Mexico, Geospatial and Population Studies, Traffic Research Unit (TRU).
DWI Citation Tracking System (CTS) – New Mexico Taxation and Revenue Department (NM TRD), Motor Vehicle Division
(MVD), DWI Citation Tracking System (CTS), as of October 2020. Repeat offenders are identified by the combination of
account key, arrest date, and citation number. County data are based upon the county where the arrest took place. City data
are based upon the city where the offender resides.
Urban Areas – Areas defined by the New Mexico Department of Transportation, Asset Management and Planning, 2010 U.S.
Census Urbanized Area Boundaries, NMDOT-Adjusted, and U.S. Census Urban Clusters, August 21, 2013. Urban areas for crash
years 2013-2017 include a 1/2 mile buffer extending out from those urban boundaries. In crashes before 2013, “urban” was
defined as a town or city with a population of at least 2,500 people.
Produced for the NMDOT, Traffic Safety Division, Traffic Records Bureau, under Contract 6093
by the University of New Mexico, Geospatial and Population Studies, Traffic Research Unit
10/13/2020
Page 2

Sandoval CountyCommunity Report
2010 12 599 1,338 1,949 5 40 54 99
2011 11 544 1,266 1,821 5 37 59 101
2012 11 446 1,132 1,589 7 43 63 113
2013 13 482 1,156 1,651 5 43 57 105
2014 10 392 1,030 1,432 3 43 43 89
2015 5 491 1,197 1,693 2 37 55 94
2016 11 569 1,350 1,930 6 40 63 109
2017 13 570 1,513 2,096 4 50 60 114
2018 20 605 1,528 2,153 10 58 57 125
2019 16 655 1,467 2,138 7 40 76 123
Figure 1: Alcohol-involved Fatal and Injury Crashes Compared with
Non-alcohol-involved Fatal and Injury Crashes in Sandoval County, 2010-2019
Table 1: Total Crashes and Alcohol-involved Crashes by Crash Severity in Sandoval County, 2010-2019
TotalYear
Total Crashes Alcohol-involved Crashes
Fatal Injury
Property
Damage
Only
Total Fatal Injury
Property
Damage
Only
45 42 50 48 46 39 46 54 68 47
566513
407 447356
457534
529 557 624
611
555
457495
402
496
580 583625
671
0
200
400
600
800
2010 2011 2012 2013 2014 2015 2016 2017 2018 2019
Alcohol-involved Fatal and Injury Crashes Non-alcohol-involved Fatal and Injury Crashes
Produced for the NMDOT, Traffic Safety Division, Traffic Records Bureau, under Contract 6093
by the University of New Mexico, Geospatial and Population Studies, Traffic Research Unit
10/13/2020
Page 3

Sandoval CountyCommunity Report
2015 2016 2017 2018 2019
January 152 133 156 162 173 155
February 98 141 153 149 193 147
March 70 140 210 180 151 150
April 114 159 176 149 163 152
May 135 156 143 185 195 163
June 156 139 149 138 144 145
July 143 160 171 167 139 156
August 147 168 176 208 180 176
September 176 188 208 172 186 186
October 155 193 189 228 199 193
November 150 171 180 192 230 185
December 197 182 185 223 185 194
Total Crashes 1,693 1,930 2,096 2,153 2,138 2,002
2015 2016 2017 2018 2019
January 7 6 12 11 10 9
February 6 5 8 12 8 8
March 3 10 10 11 5 8
April 10 9 8 10 13 10
May 6 11 12 3 13 9
June 6 13 12 6 17 11
July 11 10 15 13 4 11
August 10 7 9 16 8 10
September 10 7 7 7 16 9
October 6 11 7 9 11 9
November 9 7 6 10 11 9
December 10 13 8 17 7 11
Total Crashes 94 109 114 125 123 113
Table 2: Crashes by Month in Sandoval County, 2015-2019
Table 3: Alcohol-involved Crashes by Month in Sandoval County, 2015-2019
MonthAlcohol-involved Crashes 5-Year
Average
MonthCrashes 5-Year
Average
Produced for the NMDOT, Traffic Safety Division, Traffic Records Bureau, under Contract 6093
by the University of New Mexico, Geospatial and Population Studies, Traffic Research Unit
10/13/2020
Page 4

Sandoval CountyCommunity Report
Figure 3: Alcohol-involved Crashes by Hour in Sandoval County, 2019
Figure 2: Crashes by Hour in Sandoval County, 2019
* In 2019, Sandoval County had 0 alcohol-involved crashes for which hour data were missing.
* In 2019, Sandoval County had 17 crashes for which hour data were missing.
38
20 22 2114
29
88
135
115
87
108
88
116130 130
150
185 186
142
106
82
5543
31
0
50
100
150
200
250
12 a.m. 2 a.m. 4 a.m. 6 a.m. 8 a.m. 10 a.m. 12 p.m. 2 p.m. 4 p.m. 6 p.m. 8 p.m. 10 p.m.
13
5 54
2
0
3 3
12
43
54
1
4
8
10 1011
10
3
7
5
0
5
10
15
20
12 a.m. 2 a.m. 4 a.m. 6 a.m. 8 a.m. 10 a.m. 12 p.m. 2 p.m. 4 p.m. 6 p.m. 8 p.m. 10 p.m.
Produced for the NMDOT, Traffic Safety Division, Traffic Records Bureau, under Contract 6093
by the University of New Mexico, Geospatial and Population Studies, Traffic Research Unit
10/13/2020
Page 5

Sandoval CountyCommunity Report
2015 2016 2017 2018 2019
Sunday 14 17 23 25 25 21
Monday 13 10 12 14 10 12
Tuesday 9 14 13 12 11 12
Wednesday 11 12 19 16 22 16
Thursday 10 6 14 15 19 13
Friday 20 31 10 17 19 19
Saturday 17 19 23 26 17 20
Total Crashes 94 109 114 125 123 113
2015 2016 2017 2018 2019
Sunday 69 59 51 66 77 64
Monday 62 94 87 98 112 91
Tuesday 69 83 93 84 96 85
Wednesday 60 80 94 94 95 85
Thursday 76 84 86 87 109 88
Friday 81 99 90 119 105 99
Saturday 79 81 82 77 77 79
Total Crashes 496 580 583 625 671 591
2015 2016 2017 2018 2019
Sunday 2 3 2 2 5 3
Monday 2 4 2 8 3 4
Tuesday 3 3 3 7 5 4
Wednesday 2 3 5 1 3 3
Thursday 4 4 6 9 3 5
Friday 4 4 2 7 3 4
Saturday 3 2 2 7 3 3
Total Crashes 20 23 22 41 25 26
Table 4: Alcohol-involved Crashes by Day of Week in Sandoval County, 2015-2019
Day of WeekAlcohol-involved Crashes 5-Year
Average
Table 6: Pedestrian and Pedalcyclist Crashes by Day of Week in Sandoval County, 2015-2019
Day of WeekPedestrian and Pedalcyclist Crashes 5-Year
Average
Table 5: Fatal and Injury Crashes by Day of Week in Sandoval County, 2015-2019
Day of WeekFatal and Injury Crashes 5-Year
Average
Produced for the NMDOT, Traffic Safety Division, Traffic Records Bureau, under Contract 6093
by the University of New Mexico, Geospatial and Population Studies, Traffic Research Unit
10/13/2020
Page 6

Sandoval CountyCommunity Report
Figure 5: Pedestrian and Pedalcyclist Crashes by Hour in Sandoval County, 2019
Figure 4: Fatal and Injury Crashes by Hour in Sandoval County, 2019
* In 2019, Sandoval County had 1 crashes for which hour data were missing.
* In 2019, Sandoval County had 0 crashes for which hour data were missing.
129 10
7 510
31 30
36
24
47
27
3338 36
43
6166
48
26
34
1512 10
0
30
60
90
12 a.m. 2 a.m. 4 a.m. 6 a.m. 8 a.m. 10 a.m. 12 p.m. 2 p.m. 4 p.m. 6 p.m. 8 p.m. 10 p.m.
0 0 0 0 0 0
4
2
0 0
2
1
3
1
3
0
3
1
2
1
0
2
0 0
0
2
4
6
12 a.m. 2 a.m. 4 a.m. 6 a.m. 8 a.m. 10 a.m. 12 p.m. 2 p.m. 4 p.m. 6 p.m. 8 p.m. 10 p.m.
Produced for the NMDOT, Traffic Safety Division, Traffic Records Bureau, under Contract 6093
by the University of New Mexico, Geospatial and Population Studies, Traffic Research Unit
10/13/2020
Page 7

Sandoval CountyCommunity Report
People in Alcohol-involved Crashes 8 2 25 23 178 236
Urban 6 1 19 20 151 197
Rural Non-Interstate 1 1 2 3 24 31
Rural Interstate 1 0 4 0 3 8
People in Crashes 17 34 235 663 4,369 5,318
Urban 9 10 171 548 3,705 4,443
Rural Non-Interstate 7 21 43 93 493 657
Rural Interstate 1 3 21 22 171 218
Percent in Alcohol-involved Crashes 47% 6% 11% 3% 4% 4%
2015 2016 2017 2018 2019
Total Rural Interstate 80 87 86 104 101 92
Fatal Crash 0 1 1 1 1 1
Injury Crash 21 28 22 29 36 27
Property Damage Only Crash 59 58 63 74 64 64
Total Rural Non-Interstate 246 219 206 308 316 260
Fatal Crash 2 6 6 8 7 6
Injury Crash 75 58 50 87 108 76
Property Damage Only Crash 169 155 150 213 201 178
Total Urban 1,367 1,624 1,804 1,741 1,721 1,651
Fatal Crash 3 4 6 11 8 6
Injury Crash 395 483 498 489 511 475
Property Damage Only Crash 969 1,137 1,300 1,241 1,202 1,170
Crash Severity by SystemCrashes by Year 5-Year
Average
Urban and Rural Locations
by Alcohol-involvement
Total
People
Table 8: Total Crashes by Roadway System and Crash Severity in Sandoval County, 2015-2019
Table 7: Severity of Injuries to People in Crashes by Rural and Urban Location in Sandoval County, 2019
Fatalities
(Class K)
Suspected
Serious
Injuries
(Class A)
Suspected
Minor
Injuries
(Class B)
Possible
Injuries
(Class C)
No
Apparent
Injuries
(Class O)
People in Crashes by Severity of Injuries
Produced for the NMDOT, Traffic Safety Division, Traffic Records Bureau, under Contract 6093
by the University of New Mexico, Geospatial and Population Studies, Traffic Research Unit
10/13/2020
Page 8

Sandoval CountyCommunity Report
2015 2016 2017 2018 2019
Animal 42 63 78 81 90 71
Fixed Object 254 243 213 262 255 245
Other (Non-Collision) 32 25 30 42 33 32
Other (Object) 48 30 47 56 54 47
Other Vehicle 1,104 1,365 1,546 1,506 1,516 1,407
Overturn/Rollover 54 75 78 75 72 71
Parked Vehicle 48 49 57 45 38 47
Pedalcyclist 8 10 12 21 12 13
Pedestrian 12 13 10 20 13 14
Railroad Train 0 0 0 0 0 0
Rollover 55 21 13 33 34 31
Vehicle on Other Road 6 8 11 4 9 8
Missing Data 30 28 1 8 12 16
Total Crashes 1,693 1,930 2,096 2,153 2,138 2,002
2015 2016 2017 2018 2019
Bus 7 18 4 16 9 11
Motorcycle/ATV 57 48 52 62 45 53
Passenger 1,599 1,964 2,253 2,262 2,264 2,068
Pedalcyclist 8 10 12 21 13 13
Pedestrian 12 13 10 21 13 14
Pickup 533 576 579 595 656 588
Semi 68 81 92 81 113 87
Van/SUV/4WD 551 788 845 796 749 746
Other Vehicle 52 8 7 27 3 19
Missing Data 186 114 121 98 92 122
Total Vehicles 3,073 3,620 3,975 3,979 3,957 3,7211 Pedestrians and pedalcyclists are counted as non-motorized vehicles, when involved in a crash with
a motor vehicle. See Page 17 for data on drivers of non-motorized vehicles in crashes (i.e.
pedestrians and pedalcyclists).
Vehicle Type 1Vehicles in Crashes by Vehicle Type 5-Year
Average
Table 9: Total Crashes by Crash Classification in Sandoval County, 2015-2019
Crash ClassificationTotal Crashes by Year 5-Year
Average
Table 10: Vehicles in Crashes by Vehicle Type in Sandoval County, 2015-2019
Produced for the NMDOT, Traffic Safety Division, Traffic Records Bureau, under Contract 6093
by the University of New Mexico, Geospatial and Population Studies, Traffic Research Unit
10/13/2020
Page 9

Sandoval CountyCommunity Report
BusMotor-
cyclePassenger Pickup Semi
Van
4WD
SUV
Other
Vehicle
Missing
Data
15-19 0 5 339 62 3 59 0 0 468
20-24 0 4 289 40 6 54 0 3 396
25-29 0 6 273 52 19 50 0 2 402
30-34 0 2 195 65 4 92 0 0 358
35-39 0 5 183 73 12 80 0 1 354
40-44 1 5 150 51 11 62 0 2 282
45-49 0 3 136 44 8 62 0 0 253
50-54 1 0 104 38 13 51 0 1 208
55-59 2 4 120 41 10 52 0 0 229
60-64 2 6 106 42 12 50 0 0 218
65-69 1 1 102 41 2 36 1 0 184
70 + 2 2 127 49 5 58 1 1 245
Missing Data 0 2 140 58 8 43 1 82 334
Total Drivers 9 45 2,264 656 113 749 3 92 3,931
BusMotor-
cyclePassenger Pickup Semi
Van
4WD
SUV
Other
Vehicle
Missing
Data
15-19 0 0 6 1 0 0 0 0 7
20-24 0 1 14 3 0 4 0 0 22
25-29 0 2 15 3 0 1 0 0 21
30-34 0 1 13 2 0 1 0 0 17
35-39 0 0 8 3 0 2 0 0 13
40-44 0 0 6 3 0 2 0 0 11
45-49 0 0 7 4 0 4 0 0 15
50-54 0 0 2 0 0 0 0 0 2
55-59 0 0 2 1 0 0 0 0 3
60-64 0 0 2 0 0 0 0 0 2
65-69 0 0 3 0 0 1 0 0 4
70 + 0 1 2 0 0 1 0 0 4
Missing Data 0 0 0 2 0 0 0 0 2
Total Drivers 0 5 80 22 0 16 0 0 123
Age Groups
Alcohol-involved Motor Vehicle1 Drivers by Vehicle Type and Age GroupTotal
Drivers
1 See Page 17 for data on drivers of non-motorized vehicles in crashes (i.e. pedestrians and pedalcyclists).
Table 11: Motor Vehicle Drivers in Crashes by Vehicle Type and Age Group in Sandoval County, 2019
Age Groups
Motor Vehicle1 Drivers by Vehicle Type and Age GroupTotal
Drivers
Table 12: Alcohol-involved Motor Vehicle Drivers in Crashes by Vehicle Type and Age Group in Sandoval County, 2019
Produced for the NMDOT, Traffic Safety Division, Traffic Records Bureau, under Contract 6093
by the University of New Mexico, Geospatial and Population Studies, Traffic Research Unit
10/13/2020
Page 10

Sandoval CountyCommunity Report
Figure 7: Alcohol-involved Motor Vehicle Drivers in Crashes by Age Group and Sex in Sandoval County, 2019
Figure 6: Motor Vehicle Drivers in Crashes by Age Group and Sex in Sandoval County, 2019
* In 2019, Sandoval County had 345 drivers in crashes for which age or sex data were missing.
* In 2019, Sandoval County had 2 drivers in crashes for which age or sex data were missing.
24
2
22
0
22
9
18
9
19
4
15
0
13
9
13
3
13
9
11
6
11
0 14
1
22
4
17
5
17
2
16
9
15
9
13
1
11
4
74 9
0 10
1
74
10
1
0
120
240
360
15-19 20-24 25-29 30-34 35-39 40-44 45-49 50-54 55-59 60-64 65-69 70 +
Mo
tor
Veh
icle
Dri
vers
in C
rash
es
Male Female
5
13 1
4
12
10
6
8
2
3
1
4
3
2
9
7
5
3
5
7
0 0
1
0
1
0
5
10
15
20
25
15-19 20-24 25-29 30-34 35-39 40-44 45-49 50-54 55-59 60-64 65-69 70 +
Alc
oh
ol-
invo
lved
M
oto
r V
ehic
le D
rive
rs in
Cra
she
s
Male Female
Produced for the NMDOT, Traffic Safety Division, Traffic Records Bureau, under Contract 6093
by the University of New Mexico, Geospatial and Population Studies, Traffic Research Unit
10/13/2020
Page 11

Sandoval CountyCommunity Report
2015 2016 2017 2018 2019
15 0 0 0 0 1 1
16 1 0 0 1 1 3
17 1 1 1 1 2 6
18 1 2 4 2 2 11
19 1 3 1 3 1 9
20 3 3 3 2 3 14
Total Drivers 7 9 9 9 10 44
Male Female Male Female
15 17 12 29 5% 1 0 1 10%
16 55 53 108 19% 0 1 1 10%
17 62 59 121 22% 2 0 2 20%
18 61 54 115 21% 2 0 2 20%
19 47 46 93 17% 0 1 1 10%
20 50 42 92 16% 3 0 3 30%
Total Drivers 292 266 558 100% 8 2 10 100%
1 For analysis of drivers under age 21, when the driver age or sex are not identified on the crash report (typically hit-
and-run drivers), the driver data are considered unreliable and are excluded from the analysis.
Table 13: Alcohol-involved Motor Vehicle Drivers Under 21 (Ages 15-20) in Crashes in Sandoval County, 2015-2019
Table 14: Motor Vehicle Drivers Under 21 (Ages 15-20) in Crashes by Age, Sex and Alcohol-involvement in Sandoval County, 2019
Age1Year 5-Year
Total
Sex SexAge1 Percent of
Total
Total
Drivers
Total Drivers Alcohol-involved Drivers
Total
Drivers
Percent of
Total
Produced for the NMDOT, Traffic Safety Division, Traffic Records Bureau, under Contract 6093
by the University of New Mexico, Geospatial and Population Studies, Traffic Research Unit
10/13/2020
Page 12

Sandoval CountyCommunity Report
Human 28 1,034 1,945 3,007
Driver Inattention 4 338 646 988
Following Too Closely 0 125 299 424
Failed to Yield Right of Way 0 123 185 308
Other Improper Driving 0 70 139 209
Excessive Speed 4 78 83 165
Speed Too Fast for Conditions 1 53 75 129
Alcohol Involved 7 41 76 124
Made Improper Turn 1 34 80 115
Disregarded Traffic Signal 0 49 49 98
Improper Lane Change 1 17 80 98
Avoid No Contact - Vehicle 1 27 51 79
Drove Left Of Center 3 9 35 47
Improper Backing 0 2 41 43
Improper Overtaking 1 9 31 41
Avoid No Contact - Other 0 11 20 31
Passed Stop Sign 0 10 15 25
Drug Involved 4 8 11 23
Cell Phone 0 11 11 22
Vehicle Skidded Before Brake 0 7 9 16
Pedestrian Error 1 3 2 6
Driverless Moving Vehicle 0 1 4 5
Failed to Yield to Police Vehicle 0 3 1 4
High Speed Pursuit 0 2 1 3
Failed to Yield to Emergency Vehicle 0 2 0 2
Texting 0 1 1 2
Vehicle 0 13 44 57
Defective Tires 0 3 18 21
Other Mechanical Defect 0 7 13 20
Inadequate Brakes 0 2 8 10
Defective Steering 0 1 5 6
Environment 0 3 12 15
Road Defect 0 2 12 14
Traffic Control Not Functioning 0 1 0 1
Low Visibility Due to Smoke 0 0 0 0
Other 9 587 1,197 1,793
None 4 442 920 1,366
Other - No Driver Error 5 145 277 427
Table 15: Frequency of Contributing Factors in Crashesby Crash Severity in Sandoval County, 2019
1 Multiple contributing factors may be reported for any vehicle in a crash.
Contributing Factors Frequency in
Fatal Crashes
Frequency in
Injury Crashes
Frequency in
Property Damage
Only Crashes
Frequency in
All Crashes
Frequency of Contributing Factor1 by Crash Severity
Produced for the NMDOT, Traffic Safety Division, Traffic Records Bureau, under Contract 6093
by the University of New Mexico, Geospatial and Population Studies, Traffic Research Unit
10/13/2020
Page 13

Sandoval CountyCommunity Report
Animal 1 0 6 17 131 155
Fixed Object 1 2 36 42 273 354
Other (Non-Collision) 0 0 2 9 42 53
Other (Object) 0 3 8 9 72 92
Other Vehicle 8 21 131 541 3,584 4,285
Overturn/Rollover 4 5 22 22 75 128
Parked Vehicle 0 0 1 0 79 80
Pedalcyclist 0 0 7 3 17 27
Pedestrian 1 1 5 3 19 29
Railroad Train 0 0 0 0 0 0
Rollover 2 2 17 12 29 62
Vehicle on Other Road 0 0 0 5 23 28
Missing Data 0 0 0 0 25 25
Total People 17 34 235 663 4,369 5,318
Table 16: People in Crashes by Crash Classification and Severity of Injuries in Sandoval County, 2019
People in Crashes by Severity of Injuries
Crash ClassificationTotal
PeopleFatalities
(Class K)
Suspected
Serious
Injuries
(Class A)
Suspected
Minor
Injuries
(Class B)
Possible
Injuries
(Class C)
No
Apparent
Injuries
(Class O)
Produced for the NMDOT, Traffic Safety Division, Traffic Records Bureau, under Contract 6093
by the University of New Mexico, Geospatial and Population Studies, Traffic Research Unit
10/13/2020
Page 14

Sandoval CountyCommunity Report
MalePercent of
MaleFemale
Percent of
Female
0-4 0 0% 1 8% 1
5-9 1 5% 1 8% 2
10-14 1 5% 0 0% 1
15-19 1 5% 3 23% 4
20-24 3 16% 1 8% 4
25-29 2 11% 1 8% 3
30-34 4 21% 3 23% 7
35-39 1 5% 1 8% 2
40-44 2 11% 0 0% 2
45-49 1 5% 0 0% 1
50-54 1 5% 1 8% 2
55-59 0 0% 0 0% 0
60-64 1 5% 0 0% 1
65-69 0 0% 0 0% 0
70 + 1 5% 1 8% 2
Missing Data 0 0% 0 0% 0
Total People 19 100% 13 100% 32
Figure 8: Seatbelt Use by People in Crashes with Fatal or Suspected Serious Injuries in Sandoval County, 2015-2019
1 People injured are in one of three categories: suspected serious injury, suspected minor injury, or possible injury.2 Excludes people in or on buses, heavy trucks, motorcycles, or ATVs.
Table 17: Killed or Injured Unbelted People in Crashes by Sex and Age Group in Sandoval County, 2019
Age Groups
Unbelted People Killed or Injured 1,2
Total
People
79%71% 70%
33%
69%
12% 24% 20%
43%
18%
9% 5% 10%23%
13%
0%
25%
50%
75%
100%
2015 2016 2017 2018 2019Percent Belted Percent Unbelted Percent Missing Data
Produced for the NMDOT, Traffic Safety Division, Traffic Records Bureau, under Contract 6093
by the University of New Mexico, Geospatial and Population Studies, Traffic Research Unit
10/13/2020
Page 15

Sandoval CountyCommunity Report
Figure 9: People in Crashes by Age Group and Sex in Sandoval County, 2019
* In 2019, Sandoval County had 379 people in crashes for which age or sex data were missing.
* In 2019, Sandoval County had 7 people in alcohol-involved crashes for which age or sex data were missing.
Figure 10: People in Alcohol-involved Crashes by Age Group and Sex in Sandoval County, 2019
0
3
7
9
23
20
19
15
8
11
7
9
4
8 8
2
3
2
5
11
13
8
7
9
10
1 1
2
1
3
0
7
14
21
28
35
0-4 5-9 10-14 15-19 20-24 25-29 30-34 35-39 40-44 45-49 50-54 55-59 60-64 65-69 70 +
Pe
op
le in
Alc
oh
ol-
invo
lved
Cra
she
s
Male Female
82
78
79
34
3
28
1
27
4
21
8
21
4
17
0
15
7
15
6
15
2
12
9
11
7 15
9
93
94
83
32
9
22
6
21
5
20
5
19
2
15
6
13
6
10
3
11
6
12
7
10
4
15
1
0
100
200
300
400
500
0-4 5-9 10-14 15-19 20-24 25-29 30-34 35-39 40-44 45-49 50-54 55-59 60-64 65-69 70 +
Pe
op
le in
Cra
shes
Male Female
Produced for the NMDOT, Traffic Safety Division, Traffic Records Bureau, under Contract 6093
by the University of New Mexico, Geospatial and Population Studies, Traffic Research Unit
10/13/2020
Page 16

Sandoval CountyCommunity Report
2015 2016 2017 2018 2019
0-4 1 0 0 0 0 1
5-9 1 1 0 2 1 5
10-14 4 2 0 3 4 13
15-19 0 1 0 4 2 7
20-24 1 1 1 7 2 12
25-29 2 2 3 7 4 18
30-34 1 3 2 3 2 11
35-39 0 3 2 4 2 11
40-44 2 0 1 0 1 4
45-49 2 0 3 3 1 9
50-54 2 3 4 3 1 13
55-59 1 1 2 3 3 10
60-64 1 1 1 0 0 3
65-69 0 1 2 0 1 4
70 + 0 4 1 1 1 7
Missing Data 2 0 0 2 1 5
Total People 20 23 22 42 26 133
Total Pedalcyclists 0 0 7 3 3 13
Involved 0 0 0 0 0 0
Not Involved 0 0 7 3 3 13
Total Pedestrians 1 1 5 3 3 13
Involved 1 0 0 0 0 1
Not Involved 0 1 5 3 3 12
Total People 1 1 12 6 6 26
1 Pedestrians and pedalcyclists are counted as non-motorized vehicles, when involved in a crash with a motor vehicle.
Table 18: Pedestrians and Pedalcyclists in Crashes by Age Group in Sandoval County, 2015-2019
Possible
Injuries
(Class C)
No
Apparent
Injury
(Class O)
Alcohol
Involvement
Pedestrians and Pedalcyclists1 in Crashes
Total
PeopleFatalities
(Class K)
Suspected
Serious
Injuries
(Class A)
Suspected
Minor
Injuries
(Class B)
Table 19: Pedestrians and Pedalcyclists in Crashes by Alcohol Involvement and Severity of Injuries in Sandoval County, 2019
Age GroupsPedestrians and Pedalcyclists1 in Crashes 5-Year
Total
People
Produced for the NMDOT, Traffic Safety Division, Traffic Records Bureau, under Contract 6093
by the University of New Mexico, Geospatial and Population Studies, Traffic Research Unit
10/13/2020
Page 17

Sandoval CountyCommunity Report
Figure 11: DWI Arrests in Sandoval County, Showing First and Repeat DWI Arrests, 2015-2019
Figure 12: DWI Convictions in Sandoval County, Showing First and Repeat DWI Convictions, 2015-2019
*Values are based upon the year of the conviction.
*Values are based upon the year of the arrest.
289 335 335 325252
169154 164 155
124
458 489 499 480376
0
200
400
600
2015 2016 2017 2018 2019
Co
nvi
ctio
ns
First DWI Convictions Repeat DWI Convictions Total DWI Convictions
367433 429
373 325
314287 315
290
247
681 720 744663
572
0
250
500
750
2015 2016 2017 2018 2019
Arr
est
s
First DWI Arrests Repeat DWI Arrests Total DWI Arrests
Produced for the NMDOT, Traffic Safety Division, Traffic Records Bureau, under Contract 6093
by the University of New Mexico, Geospatial and Population Studies, Traffic Research Unit
10/13/2020
Page 18

Sandoval CountyCommunity Report
2015 2016 2017 2018 2019
Sunday 140 130 165 96 92 125
Monday 55 48 65 52 45 53
Tuesday 49 49 45 52 54 50
Wednesday 70 86 74 68 64 72
Thursday 89 94 103 88 78 90
Friday 115 152 119 123 109 124
Saturday 163 161 173 184 130 162
Total Arrests 681 720 744 663 572 676
Figure 13: DWI Arrests by Hour in Sandoval County, 2019
* In 2019, Sandoval County had 18 arrests for which hour data were missing.
Table 20: DWI Arrests by Day of Week in Sandoval County, 2015-2019
Day of WeekYear 5-Year
Average
74
46
20 21
92 5 2 4 7 6 7
1510 9
15
2430 28
36 35 32
51
66
0
40
80
120
12 a.m. 2 a.m. 4 a.m. 6 a.m. 8 a.m. 10 a.m. 12 p.m. 2 p.m. 4 p.m. 6 p.m. 8 p.m. 10 p.m.
Produced for the NMDOT, Traffic Safety Division, Traffic Records Bureau, under Contract 6093
by the University of New Mexico, Geospatial and Population Studies, Traffic Research Unit
10/13/2020
Page 19

Sandoval CountyCommunity Report
2015 2016 2017 2018 2019
15-19 15 28 29 28 22
20-24 97 101 109 91 73
25-29 70 77 75 79 67
30-34 60 69 63 45 55
35-39 27 45 41 31 33
40-44 25 37 28 19 25
45-49 23 21 35 29 21
50-54 24 24 16 19 10
55-59 11 14 10 16 5
60-64 7 8 14 6 8
65-69 7 7 7 7 3
70 + 1 2 2 3 3
Missing Data 0 0 0 0 0
Total Drivers 367 433 429 373 325
2015 2016 2017 2018 2019
15-19 3 0 2 2 2
20-24 21 24 25 20 22
25-29 57 45 58 57 32
30-34 44 55 62 44 31
35-39 44 52 51 48 44
40-44 51 28 31 30 29
45-49 29 36 22 28 42
50-54 30 18 23 24 12
55-59 19 16 24 21 18
60-64 13 6 9 10 8
65-69 2 3 6 5 4
70 + 1 4 2 1 3
Missing Data 0 0 0 0 0
Total Drivers 314 287 315 290 247
1 Values are based upon the year of the arrest.
Table 21: Driver First DWI Arrests by Age Group in Sandoval County, 2015-2019
Age GroupsDriver First DWI Arrests1
Age GroupsDriver Repeat DWI Arrests1
Table 22: Driver Repeat DWI Arrests by Age Group in Sandoval County, 2015-2019
1 Values are based upon the year of the arrest.
Produced for the NMDOT, Traffic Safety Division, Traffic Records Bureau, under Contract 6093
by the University of New Mexico, Geospatial and Population Studies, Traffic Research Unit
10/13/2020
Page 20

Sandoval CountyCommunity Report
2015 2016 2017 2018 2019
15-19 10 23 9 16 11
20-24 73 85 75 93 44
25-29 63 59 70 62 65
30-34 48 58 58 33 41
35-39 27 34 40 29 19
40-44 27 21 25 20 19
45-49 16 18 21 27 15
50-54 10 11 16 15 14
55-59 9 6 10 9 15
60-64 3 8 5 11 5
65-69 2 9 4 8 2
70 + 1 3 2 2 2
Missing Data 0 0 0 0 0
Total Drivers 289 335 335 325 252
2015 2016 2017 2018 2019
15-19 0 0 1 1 1
20-24 8 6 15 11 12
25-29 24 25 33 34 11
30-34 23 19 27 25 27
35-39 29 25 22 24 21
40-44 24 25 17 24 10
45-49 23 23 15 9 20
50-54 21 14 12 13 4
55-59 11 11 12 10 8
60-64 3 5 5 3 4
65-69 3 0 2 1 4
70 + 0 1 3 0 2
Missing Data 0 0 0 0 0
Total Drivers 169 154 164 155 124
1 Values are based upon the year of the conviction.
Table 23: Driver First DWI Convictions by Age Group in Sandoval County, 2015-2019
Table 24: Driver Repeat DWI Convictions by Age Group in Sandoval County, 2015-2019
Age GroupsDriver Repeat DWI Convictions1
Age GroupsDriver First DWI Convictions1
1 Values are based upon the year of the conviction.
Produced for the NMDOT, Traffic Safety Division, Traffic Records Bureau, under Contract 6093
by the University of New Mexico, Geospatial and Population Studies, Traffic Research Unit
10/13/2020
Page 21

Sandoval CountyCommunity Report
Court Disposition of
DWI Arrest1
Sandoval
CountyStatewide
Percent of
Statewide
Total DWI Arrests 572 10,376 5.5%
DWI Arrests Resulting in
Convictions260 4,597 5.7%
DWI Arrests Resulting in
Dismissals2 104 887 11.7%
DWI Arrests Awaiting
Disposition208 4,892 4.3%
1
2
Sandoval
CountyStatewide
DWI Conviction 178 159 19
DWI Dismissal 162 160 1
These are the number of DWI arrests in 2019 and whether the case resulted in a
conviction or dismissal, or is still awaiting court disposition, as reported in the NM MVD
Citation Tracking System (CTS) as of October 2020.
Table 25: Court Disposition of DWI Arrests for Sandoval County and the State, 2019
Table 26: Average Number of Days from Date of DWI Arrest to Date of Court Disposition in Sandoval County and the State, 2019
For this table, a very small number of "not guilty" rulings may be included in the category
Dismissals.
Court Disposition
Deviation from
Statewide
Average
Average Number of Days
Produced for the NMDOT, Traffic Safety Division, Traffic Records Bureau, under Contract 6093
by the University of New Mexico, Geospatial and Population Studies, Traffic Research Unit
10/13/2020
Page 22

Sandoval CountyCommunity Report
2015 308 159 120 94 681
2016 334 160 143 83 720
2017 359 174 127 84 744
2018 297 136 88 142 663
2019 176 84 104 208 572
*Table 27 contains the values used to calculate percentages shown in Figure 14.
Table 27: Court Disposition of DWI Arrests in Sandoval County, 2015-2019
Figure 14: Court Dispositions by Percentage of DWI Arrests in Sandoval County, 2015-2019
1 Values are based upon the year of the arrest.
First DWI
Conviction
Repeat DWI
ConvictionDismissed
Awaiting
Disposition
Year of DWI
Arrest1
Total DWI
Arrests
Court Disposition
45% 46% 48% 45%
31%
23% 22% 23%21%
15%
18% 20% 17%
13%
18%
14% 12% 11%21%
36%
681 720 744 663 572
0%
25%
50%
75%
100%
2015 2016 2017 2018 2019
First DWI Conviction Repeat DWI Conviction Dismissed Awaiting Disposition Total DWI Arrests
Produced for the NMDOT, Traffic Safety Division, Traffic Records Bureau, under Contract 6093
by the University of New Mexico, Geospatial and Population Studies, Traffic Research Unit
10/13/2020
Page 23