Embed Size (px)
Citation preview

ab
2019 Capital Market Assumptions Update
At UBS, our Capital Market Assumptions (CMAs) and Strategic Asset Alloca-tions (SAAs) are the fundamental underpinnings that inform our investment advice. The Chief Investment Office (CIO) and the Wealth Management Americas (WMA) Asset Allocation Committee (AAC) regularly review our CMAs and SAAs as asset class expected returns and risks change over time. The latest review determined that it is appropriate to update the CMAs, which last occurred in February 2017, but there are no changes to the recom-mended SAAs. The other significant change is the introduction of new “equi-librium” CMAs created for financial planning purposes.
For the existing “strategic” CMAs, most equity returns have come down, while fixed income returns have generally increased in this update. Overall, these CMAs should result in a somewhat higher return for more conserva-tive SAAs over the cycle, a lower return for aggressive SAAs, with moderate risk portfolio returns only modestly impacted. The risk CMAs are the same for both the strategic and equilibrium returns, and the risk numbers are relatively unchanged in this update. Consequently, the impact on SAAs’ estimated total risk is modest.
The following sections explain what the CMAs are, the reason for introduc-ing equilibrium CMAs, the economic assumptions driving the CMA update, and explanations for the major asset class CMAs. While there are no SAA changes, we review the affect the CMA changes have on the SAAs’ estimated returns and risks.
Capital Market Assumptions: The BasicsPrudent asset allocation decision-making starts with reasonable assumptions about the risk and return prospects for a range of asset classes. In total, we estimate CMAs for over 100 distinct asset classes, including stocks, bonds, hedge fund strategies, private equity, and private real estate. The return assumptions represent the average annual estimated gain we expect from a particular asset class. The risk assumptions include the volatilities, which mea-sure the dispersion of returns, and correlations, which estimate how asset classes move together over time. Our process of developing CMAs is not a “hard science” using repeated, controlled experiments, but our methodology combines both objective and subjective elements to use the most dependable aspects of a data-driven approach and enable us to overlay expert judgment in the process where necessary.
Contents
1 Capital Market Assumptions: The Basics
3 Why a CMA update was necessary
3 Changes to the major asset class CMAs
4 How we use CMAs
4 SAAs: Allocations aren’t changing, but returns and risks are
5 Final thoughts: what does this mean for investors?
2 of 16 February 2019
2019 Capital Market Assumptions Update
Return assumptions represent the average annual estimated gain we expect from a particular asset class. They do not represent the return of any particular security or investment. To derive strategic expected returns we explicitly model the expected returns individually for the coming years.
Our volatility estimates seek to quantify the dispersion we expect in the asset class returns on a year-by-year basis. Of course, expected volatility for any particular asset class comes with a range of caveats. For example, an investment manager or a fund structure might be more or less volatile than the asset class as a whole depending on factors like the investment objective, manager style, or constraints. Addi-tionally, we’re also making an assumption that asset classes themselves will be diversified; one particular position within an asset class can certainly exhibit different risk and return characteristics than the asset class as a whole.
Finally, correlation measures the interaction of two asset classes over time. Positively correlated asset classes tend to increase or decrease in value at the same time, whereas negatively correlated asset classes tend to move in opposite directions. Correlations fall on a range from –1 to 1, where –1 indicates a perfectly negative correlation, 0 indicates no correlation, and 1 indicates a perfectly positive correlation between the asset classes.
In this CMA update we introduce new equilibrium return assumptions. The difference between the strategic and equi-librium return assumptions is their investment time horizons. Specifically:
Strategic returns reflect our expectation for the average annual total return for various asset classes over one full business cycle. This includes the recovery, expansion, slow-down, and recession stages of the cycle. The length of busi-ness cycles isn’t fixed, though in advanced economies they have been getting longer on average. The starting points for estimating returns are typically current values, such as bond yields or equity price-earnings ratios, and then we project a future path for this return driver to a long-term sustainable level.
Equilibrium returns are expectations for average annual returns over multiple business cycles. We assume that asset class drivers eventually converge to their long-run level, which is the economy’s sustainable steady state. Furthermore, we assume that it takes at least 10 but not more than 20 years for the economy to reach this steady state. The expected return is calculated assuming return drivers and returns them-selves are in equilibrium. By definition, equilibrium returns are not influenced by cyclical developments or current circum-stances. Instead, they reflect structural assumptions about the
economy, including the long-term potential growth rate and the neutral rate of interest.
The purpose of having two sets of CMA return assumptions is to distinguish the average annual return estimates for investors when their investment horizon changes from one to multiple business cycles. The strategic returns are applica-ble for short- to long-term investment horizons over a cycle, such as when constructing strategic asset allocations. In contrast, equilibrium returns are appropriate for multi-cycle investment horizons that are typical of financial planning.
We continue to have only one set of volatility and correla-tion assumptions. Unlike expected returns that can vary quite a bit depending on starting economic conditions and valuations, risk properties tend to be more stable and mean-reverting over time, and are unlikely to change from one economic cycle to the next.
For the primary asset classes, Fig. 1 lists the updated strategic CMA return assumptions, the new equilibrium returns, and the updated risks, which is the annualized standard deviation of returns. The full set of CMAs can be found in Appendix 1. The updated strategic return CMAs are generally lower for public equities, hedge funds, and private equity and real estate, but they’re higher for fixed income asset classes. Since our last CMA update, US interest rates across most of the yield curve are notably higher than they were two years ago, lifting fixed income returns. In contrast, the prospect for earnings growth has diminished, weighing on all equity returns.
The equilibrium returns are generally higher than the strate-gic returns, with a few exceptions and the largest differences occur in equities. For fixed income, the higher equilibrium returns reflect the fact that US Treasury bond yields are below our estimate for the steady state values. Once yields have converged to the steady state, the annual returns for US government fixed income will be higher than our stra-tegic return CMA estimates. To estimate the equilibrium returns for all other asset classes, we add an appropriate risk premium to these risk free equilibrium returns, which results in higher equilibrium returns than strategic returns.
Both the strategic and equilibrium returns are point esti-mates, but the actual annual returns can deviate quite a bit from these returns. An investment that increases in value by 20% one year might easily decline by 10% the follow-ing year. Combining the return and volatility estimates for an asset class provides a more realistic outlook for “normal” returns. For example, US large-cap equity returns could fall between –9.8% (i.e. 5.7% – 15.5%) and 21.2% (i.e. 5.7% + 15.5%) over 12 months. This range of estimated “normal”

February 2019 3 of 16
2019 Capital Market Assumptions Update
Fig 1
Primary asset class risk and return assumptionsIn %
Strategic Equilibrium
Asset Class Ann’l total return
Ann’l total return
Ann’l risk
US Cash 3.0% 2.8% 0.2%
US Government Fixed Income 3.1% 3.7% 4.0%
US Municipal Fixed Income 2.6% 3.1% 2.8%
US Corporate Investment Grade Fixed Income 3.9% 5.0% 5.6%
US Corporate High Yield Fixed Income 5.1% 6.6% 9.1%
International Developed Markets Fixed Income 3.3% 4.3% 8.1%
Emerging Markets Fixed Income (Blend) 5.2% 5.6% 9.1%
US Large-cap Equity 5.7% 7.2% 15.8%
US Large-cap Growth Equity 5.5% 7.1% 15.7%
US Large-cap Value Equity 5.9% 7.3% 16.2%
US Mid-cap Equity 6.1% 7.5% 18.2%
US Small-cap Equity 6.3% 7.7% 20.3%
International Developed Markets Equity 7.6% 7.9% 16.3%
International Developed Markets Value Equity 8.0% 7.7% 16.0%
Emerging Markets Equity 8.9% 9.9% 21.8%
Senior Loans 6.4% 6.4% 7.0%
Preferreds 5.3% 5.1% 16.5%
MLPs 9.4% 8.7% 18.1%
US Real Estate 6.8% 8.8% 25.3%
Hedge Funds 5.4% 5.9% 6.2%
Private Equity 8.7% 10.2% 12.9%
Private Real Estate 6.0% 8.4% 11.6%
These CMAs are not guaranteed and do not represent the return of a particular security or investment.
Source: UBS Wealth Management Americas Asset Allocation Committee, as of 4 February, 2019. See Important Information and Disclosures section, Wealth Management Americas Asset Alloca-tion Committee and the UBS Capital Market Assumptions and Strategic Asset Allocation Models, for more information.
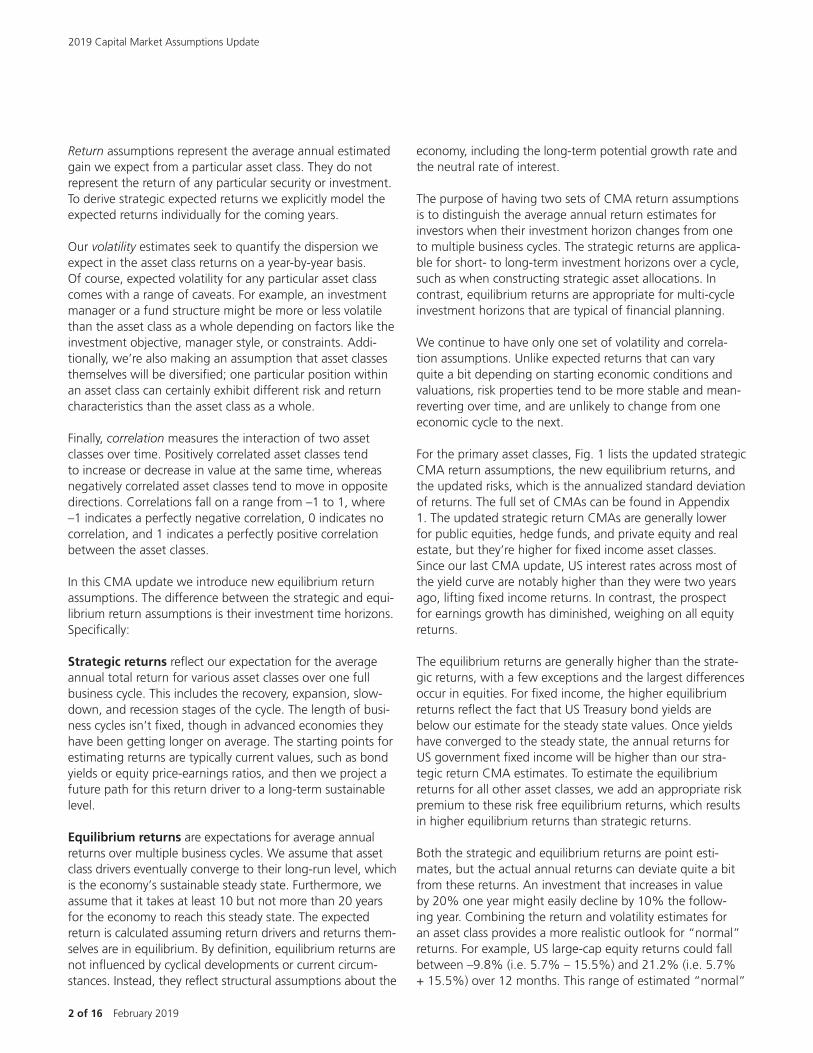
Changes to the major asset class CMAs In our CMAs most equity returns have come down, while fixed income returns have generally increased in this update (Fig. 4). The most significant declines in traditional asset classes are in US and international developed equities, with return estimates falling between –1.2% to –1.5%, and in private markets (equity and real estate) with declines in excess of –3%. In contrast, we expect US government fixed income returns of 3.1%, up from 1.9%, with other fixed income around or below those levels. Even with a better
125
75
100
Simulated paths beginning with USD 100 invested in US Large cap equities over a 12-month period
For illustrative purposes only; this is not a guarantee of the minimum or maximum level of losses or gains that can be incurred.Source: UBS WMA AAC
Monte Carlo simulated returns for US large cap equities using UBS Wealth Management Americas CMAs, in USD
Fig. 2
11109876543210 12
Months
equity returns is illustrated in Fig. 2 with a number of simu-lated paths for US large-cap equities over one year.
Why a CMA update was necessary The drivers behind the CMA changes are mainly related to a significant evolution of the global economic and policy environment over the past two years. The major developed market economies and many emerging economies are more advanced in the expansion stage of the business cycle. Trade tensions have surfaced that have slowed global growth, and could reverse some benefits of globalization from the past few decades. Led by the US Federal Reserve, major central banks have become less accommodative, as monetary policy is grad-ually moving towards a neutral stance. This is perhaps the big-gest change impacting the return outlook, as cash now offers a competitive return for the first time in a decade (Fig. 3).
4
3
2
5
0
1
Cash now provides a competitive return with Bonds
Past performance is not a guarantee of future results.Source: Bloomberg, as of 28 January 2019
Cash return is based on the US 3-month Treasury yield; bond returns are based on the Barclays Global Aggregate Index yield, in %
Fig. 3
20172016201520142013201220112010200920082007 2018
US 3-month Treasury yield
Barclays Global Aggregate yield
4 of 16 February 2019
2019 Capital Market Assumptions Update
outlook for fixed income, the expected returns for most tra-ditional asset classes are typically below the historical levels realized over the last 15 years.
Additionally, our return estimates for private equity and pri-vate real estate have fallen materially—the private equity strategic return assumption has come down by roughly 3.3%, and for private real estate it’s fallen by nearly 3.9%.Private equity’s recent outperformance relative to public equity has also declined. In absolute terms, the updated strategic expected return for private equity is lower than its historical performance, but in line with the somewhat ele-vated valuation and high levels of dry powder (private equity capital committed but not yet drawn). For private real estate, our strategic expected return of 6% is a result of real estate prices being close to their cyclical highs, boosted by the low interest rates during the last couple of years.
How we use CMAsCapital Market Assumptions can be used in a range of activi-ties, including Strategic Asset Allocation, financial planning, risk monitoring, and custom portfolio analysis. The strategic and equilibrium CMAs were designed not only for different investment horizons, as discussed earlier, but also with differ-ent intended applications.
First, our strategic CMAs form a core input for creating our Strategic Asset Allocations (SAAs). The SAAs are created to provide an attractive return-risk trade-off over the next full
economic cycle. We discuss Strategic Asset Allocation in greater depth later in this report.
Second, we use our strategic CMAs as a starting point for portfolio customization. Some investors hold portfolios that follow the UBS Strategic Asset Allocation models, but many others use these allocations as a starting point to customize an allocation that reflects the investor’s particular situation or need. For instance, a family might need to produce a higher level of income than estimated by our SAA model portfolios, or they might have a substantial portion of their assets in a private company. Our CMAs provide a baseline to help ana-lytically customize portfolios in these situations.
Finally, our equilibrium CMAs are intended for longer-term time horizons and are used in analyses that can help assess the potential success of a financial plan. A well-constructed financial plan integrates asset modeling (the investment portfolio asset allocation) and liability modeling (the house-hold’s goals and objectives) to develop a prudent strategy. Equilibrium CMAs play a vital role in that process. Based on this CMA update, households should revisit their financial plans to determine if any changes are necessary.
SAAs: Allocations aren’t changing, but returns and risks are Strategic Asset Allocations are diversified portfolios that we expect to produce a reasonable risk and return trade-off over a full economic cycle. We design the SAAs to be efficient,
8
6
4
10
12
0
2
Our equity return assumptions have mostly declined, and increased for fixed income
Source: UBS WMA AAC
Strategic return estimates for select asset classes, revised vs. previous CMAs, in %
Fig. 4
Priv
ate
Equi
ty
Hed
ge
Fund
s
Emer
ging
Mar
ket
Equi
ty
Int’
l Dev
. Mar
ket
Equi
ty
US
Smal
l-ca
p Eq
uity
US
Mid
-cap
Equ
ity
US
Larg
e-ca
p Eq
uity
Emer
ging
Mar
ket
Fixe
d In
com
e
US
Hig
h Y
ield
Fixe
d In
com
e
US
Inv.
Gra
deFi
xed
Inco
me
US
Mu
ni
Fixe
d In
com
e
US
Gov
’tFi
xed
Inco
me
US
Cas
h
Priv
ate
Real
Est
ate
Updated
Previous

February 2019 5 of 16
2019 Capital Market Assumptions Update
return without much change in risk, the Aggressive SAA return dropped about 1% also with slightly less risk, while the Moderate SAA return and risk are relatively unchanged because higher fixed income returns offset much of the lower equity returns. In short, the CMA changes effectively pivoted the efficient frontier around the Moderate risk SAA. The full set of SAAs can be found in Appendix 2.
Final thoughts: what does this mean for investors? The important question for investors is simply “what do I need to do now?” The unchanged SAAs reflect the portfo-lios that we’re most comfortable holding in the current envi-ronment, so we recommend evaluating current positioning relative to these allocation models, and making adjustments as appropriate, given your current circumstances.
With some significant changes to the CMAs, especially the introduction of equilibrium returns, we also believe it’s a good time to revisit your financial plan as part of the port-folio review. Assess whether the equilibrium CMAs have impacted your plan results and whether there are alloca-tion adjustments or opportunities to consider that may help improve the plan’s probability of success.
Contact your UBS Financial Advisor to review your accounts and update or create a financial plan, and discuss any changes you might be considering. Your Financial Advisor can help you assess the impact of these changes and guide you through the investment decision making process.
Fig. 5
Moderate House View Strategic Asset AllocationsComparison of moderate SAAs without non-traditional assets, in %
Taxable Non-taxable
Cash 5% 5%
Fixed Income 46% 46%
US Gov’t FI 2% 16%
US Municipal FI 40% 0%
US IG Corp FI 0% 21%
US HY Corp FI 2% 5%
EM FI (Blend) 2% 4%
Equity 49% 49%
US Large cap 20% 18%
US Mid cap 5% 5%
US Small cap 3% 3%
Int’l Developed Markets 15% 17%
Emerging Markets 6% 6%
Note: Asset allocation does not assure profits or prevent against losses from an investment portfolio or accounts in a declining market.
Source: UBS WMA AAC
6
5
4
7
8
2
3
The efficient frontier has pivoted around the Moderate portfolio
Source: UBS WMA AAC
Non-taxable SAAs without non-traditional assets, using updated Strategic CMAs
Fig. 6
Conservative
Estimated risk, in %
Estimated return, in %
Moderate
Aggressive
ModeratelyConservative
ModeratelyAggressive
1210864 14
2017 Portfolio Risk & Return
2019 Portfolio Risk & Return
providing the highest expected return for a target level of risk, based on the CMA strategic return and risk assumptions. We publish SAAs by investor risk profile, ranging from Conservative to Aggressive. These include portfolios for taxable and non-tax-able investors, investors that only want to use traditional, pub-licly traded, liquid assets, and those who want to also include non-traditional assets such as hedge funds, private equity, and private real estate. These SAAs provide a reference point for tactical shifts based on short-term considerations, and are a starting point for financial planning analysis.
We made no changes to the SAAs, even though the CMAs were updated to reflect current economic and policy conditions and valuations. There are a few reasons why the SAAs have not changed. First, designing efficient SAAs depends as much on the risk CMAs as the expected returns. Since the volatili-ties and correlations are relatively unchanged, the SAAs should not change much even with some larger changes to returns. Second, we wanted the SAAs to maintain estimated risks close to their current levels, which also dampened potential SAA changes. Third, there were no structural changes to the SAAs, such as significantly increasing the non-US equity allocation, as occurred last update cycle. Collectively, these factors meant that we didn’t think SAA changes were warranted.
Fig. 6 demonstrates the consequences of the CMA changes on the estimated return and risk for all five risk profiles of the non-taxable SAAs without non-traditional assets shown in Fig. 5. The Conservative SAA now has a higher expected

6 of 16 February 2019
2019 Capital Market Assumptions Update
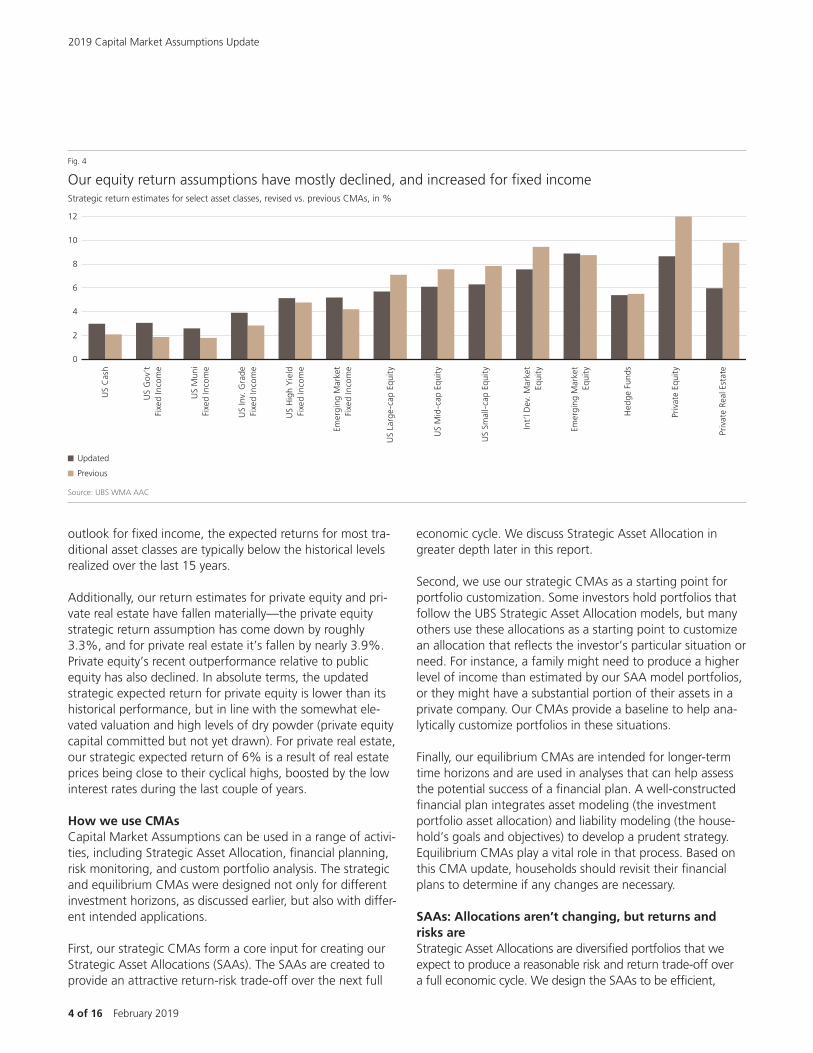
Appendix 1: Capital Market Assumptions
Broad Asset Class Asset Class Subclass Style Capital Market Assumptions, in %
Strategic Return
Equilibrium Return
Risk
Cash CashUS US Cash 3.0 2.8 0.2
International International Cash 3.2 3.0 8.0
Fixed Income
US
US Fixed Income
Core 3.4 3.8 3.8
Short 3.3 3.3 1.3
Intermediate 3.4 3.6 3.0
Long 3.5 5.5 10.2
Other 3.4 3.8 3.8
Government
Core 3.1 3.7 4.0
Short 3.1 3.1 1.3
Intermediate 3.1 3.7 5.7
Long 3.4 4.6 9.5
Other 3.1 3.7 4.0
Municipals
Core 2.6 3.1 2.8
Short 2.4 2.4 0.7
Intermediate 2.6 3.1 2.8
Long 3.1 4.1 4.4
High Yield 4.7 5.8 8.1
Other 2.6 3.1 2.8
Corporate Investment Grade Credit
Core 3.9 5.0 5.6
Short 3.7 3.8 2.1
Intermediate 3.9 4.6 4.2
Long 4.5 6.2 10.0
Other 3.9 5.0 5.6
Corporate High Yield Corporate High Yield 5.1 6.6 9.1
Puerto Rico Municipals Puerto Rico Municipals 2.4 2.5 7.8
Preferred Preferred 5.3 5.1 16.5
Convertibles Convertibles 4.5 6.3 12.5
Global Global Global 3.3 4.1 5.8
International
International International 3.3 4.3 8.1
Developed Markets Developed Markets 3.3 4.3 8.1
Emerging Markets Emerging Markets 5.2 5.6 9.1
Equity US
US Equity
Core 5.7 7.2 16.0
Growth 5.6 7.1 15.9
Value 5.9 7.3 16.4
Master Limited Partnerships 9.4 8.7 18.1
Public Real Estate 6.8 8.8 25.3
Other 5.7 7.2 16.0
Large Cap
Core 5.7 7.2 15.8
Growth 5.5 7.1 15.7
Value 5.9 7.3 16.2
Master Limited Partnerships 9.4 8.7 18.1
Public Real Estate 6.8 8.8 25.3
Other 5.7 7.2 15.8
Mid Cap
Core 6.1 7.5 18.2
Growth 6.0 7.5 18.3
Value 6.2 7.5 18.3
Master Limited Partnerships 9.4 8.7 18.1
Public Real Estate 6.8 8.8 25.3
Other 6.1 7.5 18.2
SMid Cap
Core 6.2 7.6 19.2
Growth 6.2 7.7 19.9
Value 6.3 7.6 18.8
Master Limited Partnerships 9.4 8.7 18.1
Public Real Estate 6.8 8.8 25.3
Other 6.2 7.6 19.2
Small Cap
Core 6.3 7.7 20.3
Growth 6.2 7.7 20.9
Value 6.4 7.7 20.1
Master Limited Partnerships 9.4 8.7 18.1
Public Real Estate 6.8 8.8 25.3
Other 6.3 7.7 20.3
Preferred Preferred 5.3 5.1 16.5
Convertibles Convertibles 4.5 6.3 12.5
February 2019 7 of 16
2019 Capital Market Assumptions Update
Equity
Global Global
Core 6.7 7.8 15.0
Growth 6.3 7.4 14.2
Value 6.9 7.8 14.5
Public Real Estate 6.4 8.2 20.6
Other 6.7 7.8 15.0
International
International
Core 7.3 8.5 17.2
Growth 7.7 7.5 15.2
Value 7.9 7.9 16.3
Public Real Estate 6.2 7.9 20.5
Other 7.3 8.5 17.2
Developed Markets
Core 7.6 7.9 16.3
Growth 7.4 7.3 15.2
Value 8.0 7.7 16.0
Other 7.6 7.9 16.3
Emerging Markets
Core 8.9 9.9 21.8
Growth 8.9 9.7 22.2
Value 8.9 9.5 22.0
Other 8.9 9.9 21.8
Commodities Commodities Commodities
Commodities 3.5 3.6 18.8
Energy 5.9 5.9 25.3
Agriculture 1.5 1.4 21.3
Industrial Metals 4.8 5.0 22.7
Precious Metals 1.5 2.6 21.0
Other 3.5 3.6 18.8
Non-Traditional Non-Traditional
Non-Traditional Non-Traditional 6.7 8.2 9.7
Hedge Funds
Multi Strategy 5.4 5.9 6.2
Diversified Fund of Funds 3.9 4.4 5.3
Global Macro 3.0 3.5 5.6
Event Driven 3.7 4.2 6.6
Relative Value 3.0 3.5 6.9
Managed Futures 2.1 2.1 5.0
Equity Long/Short 3.3 4.2 7.7
Other 5.4 5.9 6.2
Private Equity Private Equity 8.7 10.2 12.9
Private Real Estate Private Real Estate 6.0 8.4 11.6
Other
Other Other Other 5.0 6.0 6.5
Balanced Balanced Balanced 5.0 6.0 6.5
Insured Solutions
Insured Solutions Insured Solutions 4.3 5.0 6.9
Annuities
Annuities 4.3 5.0 6.9
Fixed 3.1 3.7 4.0
Variable 4.3 5.0 6.9
Immediate 3.1 3.7 4.0
Indexed 4.3 5.0 6.9
Insurance
Insurance 3.8 4.1 4.0
Term Life 3.0 2.8 0.2
Whole Life 3.1 3.7 4.0
Survivorship Whole Life 3.1 3.7 4.0
Universal Life 3.1 3.7 4.0
Survivorship Universal Life 3.1 3.7 4.0
Variable Universal Life 4.3 5.0 6.9
Survivorship Variable Universal Life 4.3 5.0 6.9
Indexed Universal Life 4.3 5.0 6.9
Hybrid Universal Life 3.1 3.7 4.0
Hybrid Whole Life 3.1 3.7 4.0
LTC 3.0 2.8 0.2
Disability 3.0 2.8 0.2
These CMAs are not guaranteed and do not represent the return of a particular security or investment.
Source: UBS Wealth Management Americas Asset Allocation Committee, as of February 4, 2019. See Important Information and Disclosures section, Wealth Management Americas Asset Allocation Committee and the UBS Capital Market Assumptions and Strategic Asset Allocation Models, for more information.
Broad Asset Class Asset Class Subclass Style Capital Market Assumptions, in %
Strategic Return
Equilibrium Return
Risk
8 of 16 February 2019
2019 Capital Market Assumptions Update
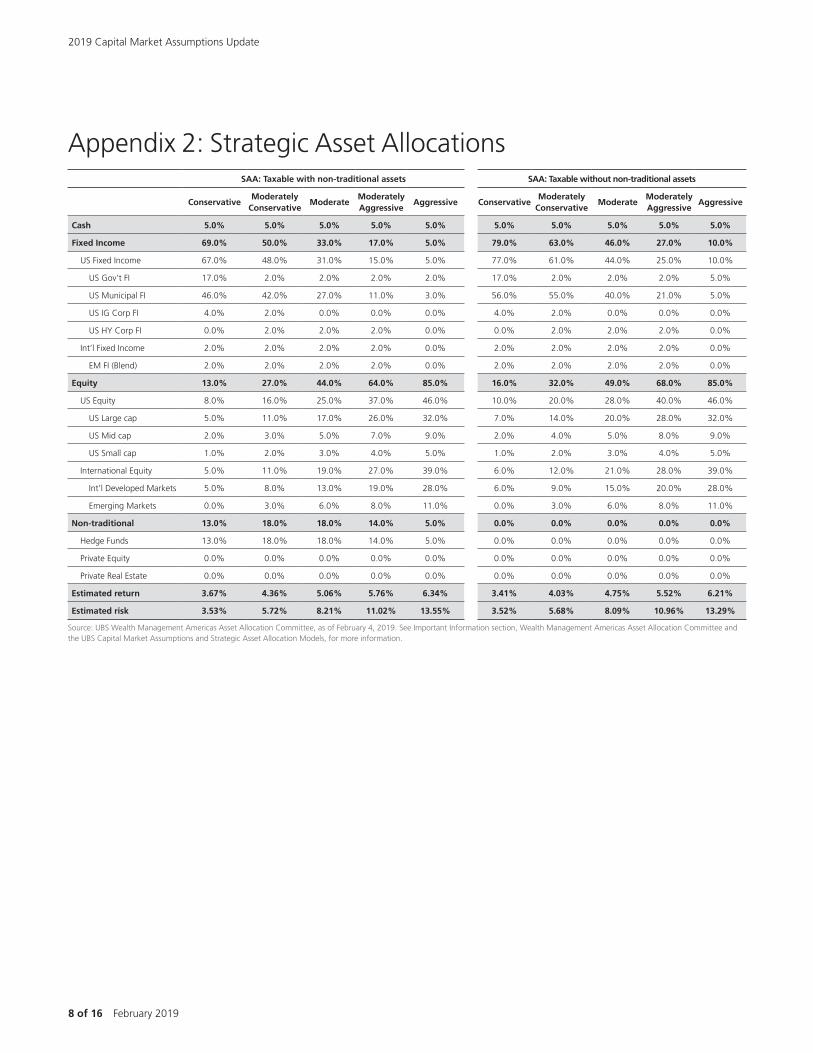
SAA: Taxable with non-traditional assets SAA: Taxable without non-traditional assets
ConservativeModerately
ConservativeModerate
Moderately Aggressive
Aggressive ConservativeModerately
ConservativeModerate
Moderately Aggressive
Aggressive
Cash 5.0% 5.0% 5.0% 5.0% 5.0% 5.0% 5.0% 5.0% 5.0% 5.0%
Fixed Income 69.0% 50.0% 33.0% 17.0% 5.0% 79.0% 63.0% 46.0% 27.0% 10.0%
US Fixed Income 67.0% 48.0% 31.0% 15.0% 5.0% 77.0% 61.0% 44.0% 25.0% 10.0%
US Gov’t FI 17.0% 2.0% 2.0% 2.0% 2.0% 17.0% 2.0% 2.0% 2.0% 5.0%
US Municipal FI 46.0% 42.0% 27.0% 11.0% 3.0% 56.0% 55.0% 40.0% 21.0% 5.0%
US IG Corp FI 4.0% 2.0% 0.0% 0.0% 0.0% 4.0% 2.0% 0.0% 0.0% 0.0%
US HY Corp FI 0.0% 2.0% 2.0% 2.0% 0.0% 0.0% 2.0% 2.0% 2.0% 0.0%
Int’l Fixed Income 2.0% 2.0% 2.0% 2.0% 0.0% 2.0% 2.0% 2.0% 2.0% 0.0%
EM FI (Blend) 2.0% 2.0% 2.0% 2.0% 0.0% 2.0% 2.0% 2.0% 2.0% 0.0%
Equity 13.0% 27.0% 44.0% 64.0% 85.0% 16.0% 32.0% 49.0% 68.0% 85.0%
US Equity 8.0% 16.0% 25.0% 37.0% 46.0% 10.0% 20.0% 28.0% 40.0% 46.0%
US Large cap 5.0% 11.0% 17.0% 26.0% 32.0% 7.0% 14.0% 20.0% 28.0% 32.0%
US Mid cap 2.0% 3.0% 5.0% 7.0% 9.0% 2.0% 4.0% 5.0% 8.0% 9.0%
US Small cap 1.0% 2.0% 3.0% 4.0% 5.0% 1.0% 2.0% 3.0% 4.0% 5.0%
International Equity 5.0% 11.0% 19.0% 27.0% 39.0% 6.0% 12.0% 21.0% 28.0% 39.0%
Int’l Developed Markets 5.0% 8.0% 13.0% 19.0% 28.0% 6.0% 9.0% 15.0% 20.0% 28.0%
Emerging Markets 0.0% 3.0% 6.0% 8.0% 11.0% 0.0% 3.0% 6.0% 8.0% 11.0%
Non-traditional 13.0% 18.0% 18.0% 14.0% 5.0% 0.0% 0.0% 0.0% 0.0% 0.0%
Hedge Funds 13.0% 18.0% 18.0% 14.0% 5.0% 0.0% 0.0% 0.0% 0.0% 0.0%
Private Equity 0.0% 0.0% 0.0% 0.0% 0.0% 0.0% 0.0% 0.0% 0.0% 0.0%
Private Real Estate 0.0% 0.0% 0.0% 0.0% 0.0% 0.0% 0.0% 0.0% 0.0% 0.0%
Estimated return 3.67% 4.36% 5.06% 5.76% 6.34% 3.41% 4.03% 4.75% 5.52% 6.21%
Estimated risk 3.53% 5.72% 8.21% 11.02% 13.55% 3.52% 5.68% 8.09% 10.96% 13.29%
Source: UBS Wealth Management Americas Asset Allocation Committee, as of February 4, 2019. See Important Information section, Wealth Management Americas Asset Allocation Committee and the UBS Capital Market Assumptions and Strategic Asset Allocation Models, for more information.
Appendix 2: Strategic Asset Allocations

February 2019 9 of 16
2019 Capital Market Assumptions Update
SAA: Non-taxable with non-traditional assets SAA: Non-taxable without non-traditional assets
ConservativeModerately
ConservativeModerate
Moderately Aggressive
Aggressive ConservativeModerately
ConservativeModerate
Moderately Aggressive
Aggressive
Cash 5.0% 5.0% 5.0% 5.0% 5.0% 5.0% 5.0% 5.0% 5.0% 5.0%
Fixed Income 69.0% 50.0% 33.0% 17.0% 5.0% 79.0% 63.0% 46.0% 27.0% 10.0%
US Fixed Income 64.0% 45.0% 29.0% 14.0% 5.0% 74.0% 58.0% 42.0% 24.0% 10.0%
US Gov’t FI 35.0% 25.0% 16.0% 7.0% 5.0% 35.0% 25.0% 16.0% 7.0% 5.0%
US Municipal FI 0.0% 0.0% 0.0% 0.0% 0.0% 0.0% 0.0% 0.0% 0.0% 0.0%
US IG Corp FI 24.0% 15.0% 8.0% 2.0% 0.0% 34.0% 28.0% 21.0% 12.0% 5.0%
US HY Corp FI 5.0% 5.0% 5.0% 5.0% 0.0% 5.0% 5.0% 5.0% 5.0% 0.0%
Int’l Fixed Income 5.0% 5.0% 4.0% 3.0% 0.0% 5.0% 5.0% 4.0% 3.0% 0.0%
EM FI (Blend) 5.0% 5.0% 4.0% 3.0% 0.0% 5.0% 5.0% 4.0% 3.0% 0.0%
Equity 10.0% 25.0% 42.0% 62.0% 85.0% 16.0% 32.0% 49.0% 68.0% 85.0%
US Equity 6.0% 14.0% 22.0% 33.0% 45.0% 10.0% 18.0% 26.0% 35.0% 45.0%
US Large cap 4.0% 10.0% 16.0% 24.0% 32.0% 7.0% 13.0% 18.0% 24.0% 32.0%
US Mid cap 1.0% 3.0% 4.0% 6.0% 8.0% 2.0% 3.0% 5.0% 7.0% 8.0%
US Small cap 1.0% 1.0% 2.0% 3.0% 5.0% 1.0% 2.0% 3.0% 4.0% 5.0%
International Equity 4.0% 11.0% 20.0% 29.0% 40.0% 6.0% 14.0% 23.0% 33.0% 40.0%
Int’l Developed Markets 4.0% 8.0% 14.0% 21.0% 29.0% 6.0% 10.0% 17.0% 24.0% 29.0%
Emerging Markets 0.0% 3.0% 6.0% 8.0% 11.0% 0.0% 4.0% 6.0% 9.0% 11.0%
Non-traditional 16.0% 20.0% 20.0% 16.0% 5.0% 0.0% 0.0% 0.0% 0.0% 0.0%
Hedge Funds 16.0% 20.0% 20.0% 16.0% 5.0% 0.0% 0.0% 0.0% 0.0% 0.0%
Private Equity 0.0% 0.0% 0.0% 0.0% 0.0% 0.0% 0.0% 0.0% 0.0% 0.0%
Private Real Estate 0.0% 0.0% 0.0% 0.0% 0.0% 0.0% 0.0% 0.0% 0.0% 0.0%
Estimated return 4.19% 4.78% 5.37% 5.94% 6.37% 4.10% 4.69% 5.26% 5.90% 6.29%
Estimated risk 4.24% 6.02% 8.32% 11.02% 13.51% 4.74% 6.49% 8.69% 11.36% 13.34%
Source: UBS Wealth Management Americas Asset Allocation Committee, as of February 4, 2019. See Important Information section, Wealth Management Americas Asset Allocation Committee and the UBS Capital Market Assumptions and Strategic Asset Allocation Models, for more information.
10 of 16 February 2019
2019 Capital Market Assumptions Update
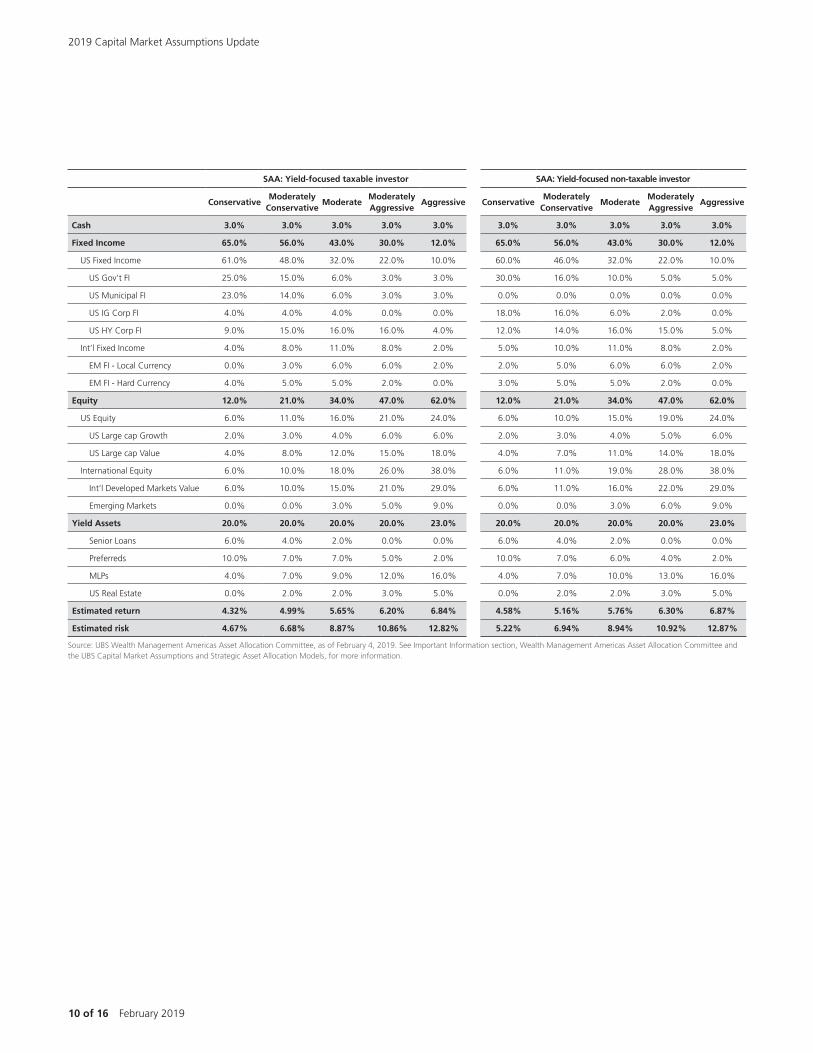
SAA: Yield-focused taxable investor SAA: Yield-focused non-taxable investor
ConservativeModerately
ConservativeModerate
Moderately Aggressive
Aggressive ConservativeModerately
ConservativeModerate
Moderately Aggressive
Aggressive
Cash 3.0% 3.0% 3.0% 3.0% 3.0% 3.0% 3.0% 3.0% 3.0% 3.0%
Fixed Income 65.0% 56.0% 43.0% 30.0% 12.0% 65.0% 56.0% 43.0% 30.0% 12.0%
US Fixed Income 61.0% 48.0% 32.0% 22.0% 10.0% 60.0% 46.0% 32.0% 22.0% 10.0%
US Gov’t FI 25.0% 15.0% 6.0% 3.0% 3.0% 30.0% 16.0% 10.0% 5.0% 5.0%
US Municipal FI 23.0% 14.0% 6.0% 3.0% 3.0% 0.0% 0.0% 0.0% 0.0% 0.0%
US IG Corp FI 4.0% 4.0% 4.0% 0.0% 0.0% 18.0% 16.0% 6.0% 2.0% 0.0%
US HY Corp FI 9.0% 15.0% 16.0% 16.0% 4.0% 12.0% 14.0% 16.0% 15.0% 5.0%
Int’l Fixed Income 4.0% 8.0% 11.0% 8.0% 2.0% 5.0% 10.0% 11.0% 8.0% 2.0%
EM FI - Local Currency 0.0% 3.0% 6.0% 6.0% 2.0% 2.0% 5.0% 6.0% 6.0% 2.0%
EM FI - Hard Currency 4.0% 5.0% 5.0% 2.0% 0.0% 3.0% 5.0% 5.0% 2.0% 0.0%
Equity 12.0% 21.0% 34.0% 47.0% 62.0% 12.0% 21.0% 34.0% 47.0% 62.0%
US Equity 6.0% 11.0% 16.0% 21.0% 24.0% 6.0% 10.0% 15.0% 19.0% 24.0%
US Large cap Growth 2.0% 3.0% 4.0% 6.0% 6.0% 2.0% 3.0% 4.0% 5.0% 6.0%
US Large cap Value 4.0% 8.0% 12.0% 15.0% 18.0% 4.0% 7.0% 11.0% 14.0% 18.0%
International Equity 6.0% 10.0% 18.0% 26.0% 38.0% 6.0% 11.0% 19.0% 28.0% 38.0%
Int’l Developed Markets Value 6.0% 10.0% 15.0% 21.0% 29.0% 6.0% 11.0% 16.0% 22.0% 29.0%
Emerging Markets 0.0% 0.0% 3.0% 5.0% 9.0% 0.0% 0.0% 3.0% 6.0% 9.0%
Yield Assets 20.0% 20.0% 20.0% 20.0% 23.0% 20.0% 20.0% 20.0% 20.0% 23.0%
Senior Loans 6.0% 4.0% 2.0% 0.0% 0.0% 6.0% 4.0% 2.0% 0.0% 0.0%
Preferreds 10.0% 7.0% 7.0% 5.0% 2.0% 10.0% 7.0% 6.0% 4.0% 2.0%
MLPs 4.0% 7.0% 9.0% 12.0% 16.0% 4.0% 7.0% 10.0% 13.0% 16.0%
US Real Estate 0.0% 2.0% 2.0% 3.0% 5.0% 0.0% 2.0% 2.0% 3.0% 5.0%
Estimated return 4.32% 4.99% 5.65% 6.20% 6.84% 4.58% 5.16% 5.76% 6.30% 6.87%
Estimated risk 4.67% 6.68% 8.87% 10.86% 12.82% 5.22% 6.94% 8.94% 10.92% 12.87%
Source: UBS Wealth Management Americas Asset Allocation Committee, as of February 4, 2019. See Important Information section, Wealth Management Americas Asset Allocation Committee and the UBS Capital Market Assumptions and Strategic Asset Allocation Models, for more information.
February 2019 11 of 16
2019 Capital Market Assumptions Update
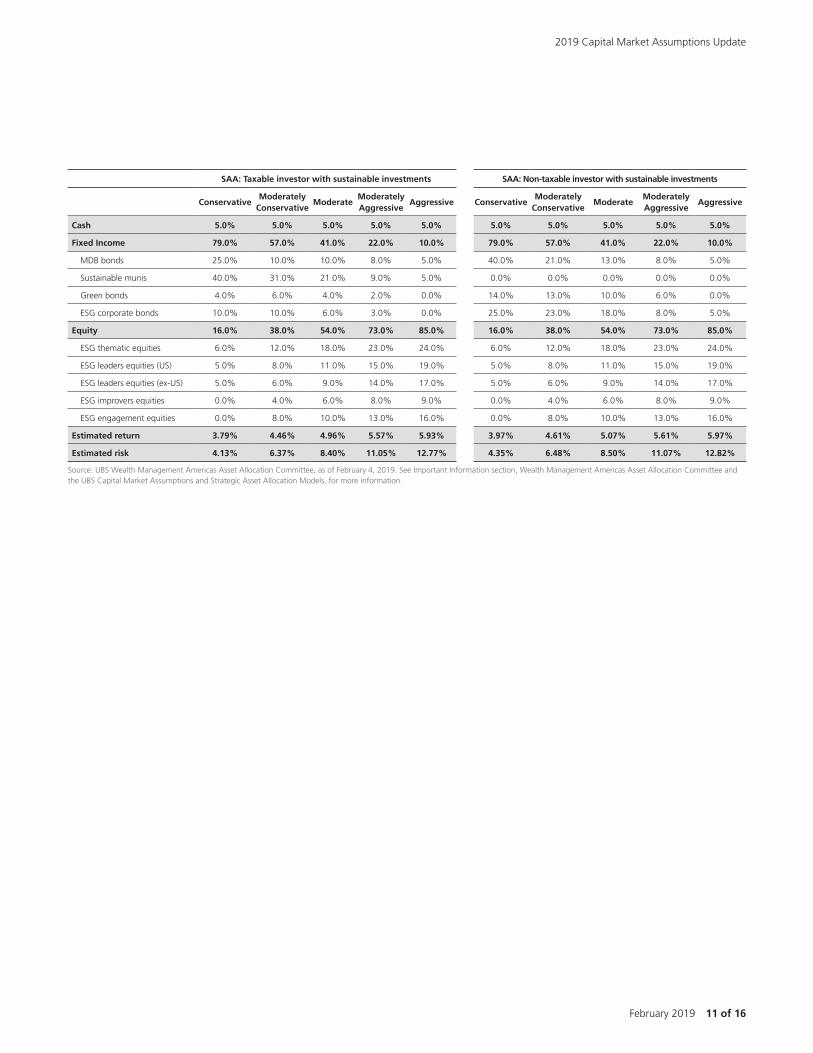
SAA: Taxable investor with sustainable investments SAA: Non-taxable investor with sustainable investments
ConservativeModerately
ConservativeModerate
Moderately Aggressive
Aggressive ConservativeModerately
ConservativeModerate
Moderately Aggressive
Aggressive
Cash 5.0% 5.0% 5.0% 5.0% 5.0% 5.0% 5.0% 5.0% 5.0% 5.0%
Fixed Income 79.0% 57.0% 41.0% 22.0% 10.0% 79.0% 57.0% 41.0% 22.0% 10.0%
MDB bonds 25.0% 10.0% 10.0% 8.0% 5.0% 40.0% 21.0% 13.0% 8.0% 5.0%
Sustainable munis 40.0% 31.0% 21.0% 9.0% 5.0% 0.0% 0.0% 0.0% 0.0% 0.0%
Green bonds 4.0% 6.0% 4.0% 2.0% 0.0% 14.0% 13.0% 10.0% 6.0% 0.0%
ESG corporate bonds 10.0% 10.0% 6.0% 3.0% 0.0% 25.0% 23.0% 18.0% 8.0% 5.0%
Equity 16.0% 38.0% 54.0% 73.0% 85.0% 16.0% 38.0% 54.0% 73.0% 85.0%
ESG thematic equities 6.0% 12.0% 18.0% 23.0% 24.0% 6.0% 12.0% 18.0% 23.0% 24.0%
ESG leaders equities (US) 5.0% 8.0% 11.0% 15.0% 19.0% 5.0% 8.0% 11.0% 15.0% 19.0%
ESG leaders equities (ex-US) 5.0% 6.0% 9.0% 14.0% 17.0% 5.0% 6.0% 9.0% 14.0% 17.0%
ESG improvers equities 0.0% 4.0% 6.0% 8.0% 9.0% 0.0% 4.0% 6.0% 8.0% 9.0%
ESG engagement equities 0.0% 8.0% 10.0% 13.0% 16.0% 0.0% 8.0% 10.0% 13.0% 16.0%
Estimated return 3.79% 4.46% 4.96% 5.57% 5.93% 3.97% 4.61% 5.07% 5.61% 5.97%
Estimated risk 4.13% 6.37% 8.40% 11.05% 12.77% 4.35% 6.48% 8.50% 11.07% 12.82%
Source: UBS Wealth Management Americas Asset Allocation Committee, as of February 4, 2019. See Important Information section, Wealth Management Americas Asset Allocation Committee and the UBS Capital Market Assumptions and Strategic Asset Allocation Models, for more information.
12 of 16 February 2019
2019 Capital Market Assumptions Update
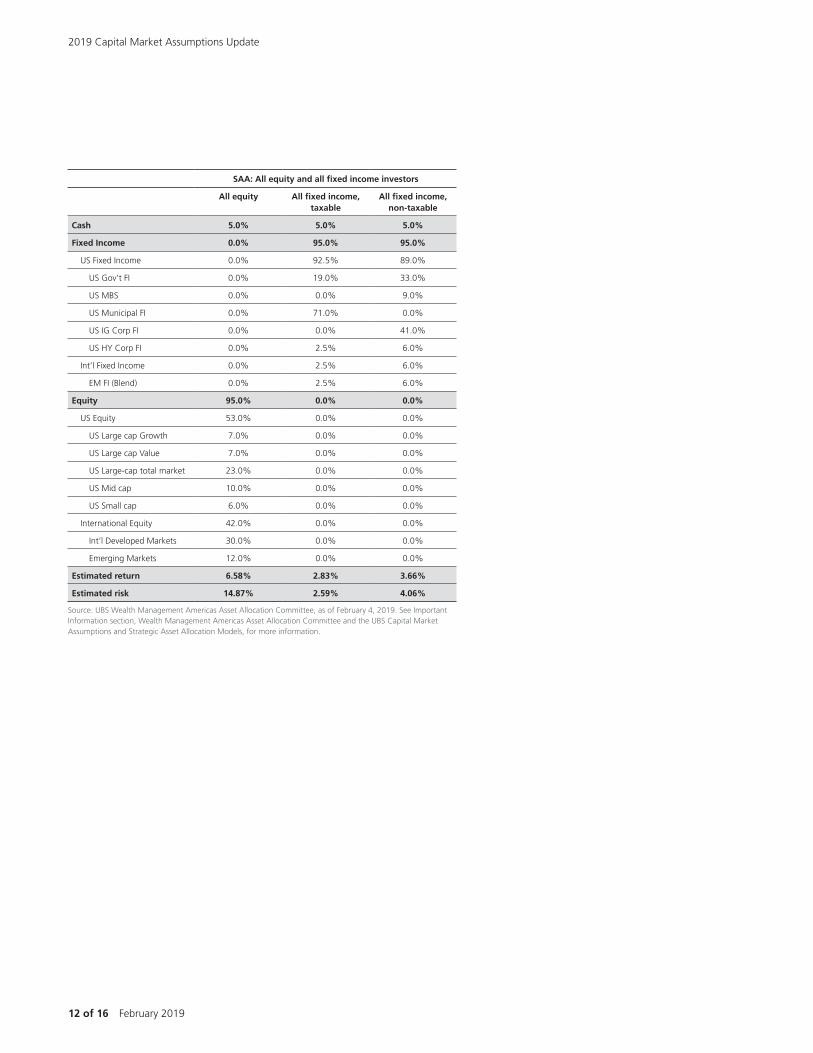
SAA: All equity and all fixed income investors
All equity All fixed income, taxable
All fixed income, non-taxable
Cash 5.0% 5.0% 5.0%
Fixed Income 0.0% 95.0% 95.0%
US Fixed Income 0.0% 92.5% 89.0%
US Gov’t FI 0.0% 19.0% 33.0%
US MBS 0.0% 0.0% 9.0%
US Municipal FI 0.0% 71.0% 0.0%
US IG Corp FI 0.0% 0.0% 41.0%
US HY Corp FI 0.0% 2.5% 6.0%
Int’l Fixed Income 0.0% 2.5% 6.0%
EM FI (Blend) 0.0% 2.5% 6.0%
Equity 95.0% 0.0% 0.0%
US Equity 53.0% 0.0% 0.0%
US Large cap Growth 7.0% 0.0% 0.0%
US Large cap Value 7.0% 0.0% 0.0%
US Large-cap total market 23.0% 0.0% 0.0%
US Mid cap 10.0% 0.0% 0.0%
US Small cap 6.0% 0.0% 0.0%
International Equity 42.0% 0.0% 0.0%
Int’l Developed Markets 30.0% 0.0% 0.0%
Emerging Markets 12.0% 0.0% 0.0%
Estimated return 6.58% 2.83% 3.66%
Estimated risk 14.87% 2.59% 4.06%
Source: UBS Wealth Management Americas Asset Allocation Committee, as of February 4, 2019. See Important Information section, Wealth Management Americas Asset Allocation Committee and the UBS Capital Market Assumptions and Strategic Asset Allocation Models, for more information.

February 2019 13 of 16
2019 Capital Market Assumptions Update
SAA: All equity and all income, yield-focused investors
All equity All fixed income, taxable
All fixed income, non-taxable
Cash 3.0% 3.0% 3.0%
Fixed Income 0.0% 77.0% 77.0%
US Fixed Income 0.0% 58.0% 58.0%
US Gov’t FI 0.0% 13.0% 18.0%
US MBS 0.0% 0.0% 5.0%
US Municipal FI 0.0% 30.0% 0.0%
US IG Corp FI 0.0% 0.0% 20.0%
US HY Corp FI 0.0% 15.0% 15.0%
Int’l Fixed Income 0.0% 19.0% 19.0%
EM FI - Local Currency 0.0% 10.0% 11.0%
EM FI - Hard Currency 0.0% 9.0% 8.0%
Equity 77.0% 0.0% 0.0%
US Equity 39.0% 0.0% 0.0%
US Large cap Growth 7.0% 0.0% 0.0%
US Large cap Value 32.0% 0.0% 0.0%
International Equity 38.0% 0.0% 0.0%
Int’l Developed Markets Value 28.0% 0.0% 0.0%
Emerging Markets 10.0% 0.0% 0.0%
Yield Assets 20.0% 20.0% 20.0%
Senior Loans 0.0% 15.0% 15.0%
Preferreds 0.0% 5.0% 5.0%
MLPs 16.0% 0.0% 0.0%
US Real Estate 4.0% 0.0% 0.0%
Estimated return 7.13% 4.08% 4.38%
Estimated risk 14.43% 4.03% 4.51%
Source: UBS Wealth Management Americas Asset Allocation Committee, as of February 4, 2019. See Important Information section, Wealth Management Americas Asset Allocation Committee and the UBS Capital Market Assumptions and Strategic Asset Allocation Models, for more information.

14 of 16 February 2019
2019 Capital Market Assumptions Update
SAA: All equity and all income sustainable investment
All equity All fixed income, taxable
All fixed income, non-taxable
Cash 5.0% 5.0% 5.0%
Fixed Income 0.0% 95.0% 95.0%
MDB bonds 0.0% 30.0% 25.0%
Sustainable munis 0.0% 0.0% 45.0%
Green bonds 0.0% 25.0% 10.0%
ESG corporate bonds 0.0% 40.0% 15.0%
Equity 95.0% 0.0% 0.0%
ESG thematic equities 28.0% 0.0% 0.0%
ESG leaders equities (US) 20.0% 0.0% 0.0%
ESG leaders equities (ex-US) 18.0% 0.0% 0.0%
ESG improvers equities 9.0% 0.0% 0.0%
ESG engagement equities 20.0% 0.0% 0.0%
Estimated return 6.24% 3.54% 3.30%
Estimated risk 14.21% 4.17% 3.70%
Source: UBS Wealth Management Americas Asset Allocation Committee, as of February 4, 2019. See Important Information section, Wealth Management Americas Asset Allocation Committee and the UBS Capital Market Assumptions and Strategic Asset Allocation Models, for more information.

February 2019 15 of 16
2019 Capital Market Assumptions Update
DisclaimerThis material is published solely for informational purposes, may be dis-tributed only under such circumstances as may be permitted by appli-cable law, and is not to be construed as a solicitation or an offer to buy or sell any securities or related financial instruments. This information is general in nature and does not take into account the specific investment objectives, financial situation or particular needs of any recipient.
All information and opinions represent our current views on the top-ics covered which are based, in part, on information and data obtained from third party and/or publicly available sources. While we believe those sources to be reliable, no representation or warranty, express or implied, is made as to its accuracy or completeness (other than disclo-sures relating to UBS and its affiliates) of that information.
The information presented is not intended to be a complete statement or summary of the securities, markets or developments referred to in the materials. It should not be regarded by recipients as a substitute for the exercise of their own judgment. Any opinions expressed in this material are subject to change without notice and may differ or be contrary to opinions expressed by other business areas or groups of UBS as a result of using different assumptions and criteria. UBS is under no obligation to update or keep current the information contained herein.
Cautionary statement regarding forward-looking statements. This report contains statements that constitute “forward-looking state-ments”, including but not limited to statements relating to the current and expected state of the securities market and capital market assump-tions. While these forward-looking statements represent our judgments and future expectations concerning the matters discussed in this docu-ment, a number of risks, uncertainties, changes in the market, and other important factors could cause actual developments and results to differ materially from our expectations. These factors include, but are not limited to (1) the extent and nature of future developments in the US market and in other market segments; (2) other market and macro-economic developments, including movements in local and international securities markets, credit spreads, currency exchange rates and interest rates, whether or not arising directly or indirectly from the current mar-ket crisis; (3) the impact of these developments on other markets and asset classes. UBS is not under any obligation to (and expressly disclaims any such obligation to) update or alter its forward-looking statements whether as a result of new information, future events, or otherwise.
Wealth Management Americas Asset Allocation Committee and the UBS Capital Market Assumptions and Strategic Asset Alloca-tion Models The capital market assumptions and strategic asset allocation models discussed in this publication were vetted and approved by the Wealth Management Americas Asset Allocation Committee (WMA AAC).
The capital market assumptions are estimates of forward-looking aver-age annual returns for a particular asset class. They are not guaran-teed and do not represent the return of a particular security or investment.
The strategic asset allocation models are intended to provide a general framework to assist our clients in making informed investment deci-sions. They are provided for illustrative purposes, and were designed by the WMA AAC for hypothetical U.S. investors with a total return
Important Information and Disclosures
objective under five different investor risk profiles: conservative, moder-ate conservative, moderate, moderate aggressive and aggressive. Your UBS Financial Services Inc. Financial Advisor can help you determine how a strategic allocation could be applied or modified according to your individual profile and investment goals.
Asset allocation does not assure profits or prevent against losses from an investment portfolio or accounts in a declining market.
Please note that UBS has changed its capital market assumptions and strategic asset allocation models in the past and may do so in the future.
Index performance dataIndex information is provided for illustrative purposes only. indexes are not available for direct investment and represent an unmanaged uni-verse of securities which does not take into account advisory or transac-tion fees, all of which will reduce overall return.
Investment Risks Asset Class is a term that broadly defines a category of investments that share common investment characteristics. Typical broad asset classes include equities, fixed income securities, cash and cash alternatives. This section describes some of the asset classes used in this report and some of the general risk considerations. All investments involve risks which you should carefully consider prior to implementing an investment strategy.
Cash: Cash and cash alternatives typically include money market securi-ties or three-month T-Bills. These securities have short maturity dates and they typically provide a stable investment value as compared to other investments and current interest income. These investments may be subject to credit risks and inflation risks. Treasuries also carry liquidity risks for sales prior to maturity. Investments in money market funds are neither insured nor guaranteed by the Federal Deposit Insurance Cor-poration (FDIC), the U.S. government or any other government agency. There can be no assurance that the funds will be able to maintain a stable net asset value at $1.00 per share or unit.
Equities: Equity securities are subject to market risk and will undergo price fluctuations in which downward and upward trends may occur over short or extended periods. Historically, equities have shown greater growth potential than other types of securities, but they have also shown greater volatility. In addition to these risks, securities issued by small-cap companies may be relatively highly volatile because their earnings and business prospects typically fluctuate more than those of larger-cap companies. Securities issued by non-U.S. companies can have risks not typically associated with domestic securities, including risks associated with changes in currency values, economic, political and social conditions, loss of market liquidity, the regulatory environments of the respective countries and difficulties in receiving current or accurate information.
Fixed Income: Fixed Income represents debt issued by private corpora-tions, governments or Federal agencies. Two main risks related to fixed income investing are interest rate risk and credit risk. Typically, when interest rates rise, there is a corresponding decline in the market value of bonds. Credit risk refers to the possibility that the issuer of the bond will not be able to make principal and interest payments. High yield invest-ments are high yielding securities but may also carry more risk. A bond

16 of 16 February 2019
2019 Capital Market Assumptions Update
fund’s yield and value of its portfolio fluctuate and can be affected by changes in interest rates, general market conditions and other political, social and economic developments.
Corporate Bonds: Fixed income securities are subject to market risk and interest rate risk. If sold in the secondary market prior to maturity, investors may experience a gain or loss depending on interest rates, market conditions and issuer credit quality.
Municipal Securities: Income from municipal bonds may be subject to state and local taxes based on residency of the investor and may be subject to the Alternative Minimum Tax. Call features may exist that can impact yield. If sold prior to maturity, investments in municipal securities are subject to gains/losses based on the level of interest rates, market conditions and credit quality of the issuer.
Foreign Exchange/Currency Risk: Investors in securities of issuers located outside of the United States should be aware that even for securities denominated in U.S. dollars, changes in the exchange rate between the U.S. dollar and the issuer’s “home” currency can have unexpected effects on the market value and liquidity of those securities. Those securities may also be affected by other risks (such as political, economic or regulatory changes) that may not be readily known to a U.S. investor.
Emerging Markets: Investing in emerging market securities can pose some risks different from, and greater than, risks of investing in U.S. or developed markets securities. These risks include: a risk of loss due to political instability; exposure to economic structures that are generally less diverse and mature, and to political systems which may have less stability, than those of more developed countries; smaller market capi-talization of securities markets, which may suffer periods of relative illi-quidity; significant price volatility; restrictions on foreign investment; and possible repatriation of investment income and capital.
Non-Traditional Asset Classes: Non-traditional asset classes are alternative investments that include hedge funds, private equity, and private real estate, (collectively, alternative investments). Interests of alternative investment funds are sold only to qualified inves-tors, and only by means of offering documents that include information about the risks, performance and expenses of alternative investment funds, and which clients are urged to read carefully before subscribing and retain. An investment in an alternative investment fund is speculative and involves significant risks. Specifically, these invest-ments (1) are not mutual funds and are not subject to the same regu-latory requirements as mutual funds; (2) may have performance that is volatile, and investors may lose all or a substantial amount of their investment; (3) may engage in leverage and other speculative invest-ment practices that may increase the risk of investment loss; (4) are long-term, illiquid investments, there is generally no secondary market for the interests of a fund, and none is expected to develop; (5) interests of alternative investment funds typically will be illiquid and subject to restrictions on transfer; (6) may not be required to provide periodic pric-ing or valuation information to investors; (7) generally involve complex tax strategies and there may be delays in distributing tax information to investors; (8) are subject to high fees, including management fees and other fees and expenses, all of which will reduce profits.
Interests in alternative investment funds are not deposits or obligations of, or guaranteed or endorsed by, any bank or other insured depository institution, and are not federally insured by the Federal Deposit Insur-ance Corporation, the Federal Reserve Board, or any other governmental agency. Prospective investors should understand these risks and have the financial ability and willingness to accept them for an extended period of time before making an investment in an alternative investment fund and should consider an alternative investment fund as a supplement to an overall investment program.
In addition to the risks that apply to alternative investments gener-ally, the following are additional risks related to an investment in these strategies:
• Hedge Fund Risk: There are risks specifically associated with invest-ing in hedge funds, which may include risks associated with investing in short sales, options, small-cap stocks, “junk bonds,” derivatives, distressed securities, non-US securities and illiquid investments.
• Managed Futures: There are risks specifically associated with invest-ing in managed futures programs. For example, not all managers focus on all strategies at all times, and managed futures strategies may have material directional elements.
• Real Estate: There are risks specifically associated with investing in real estate products and real estate investment trusts. They involve risks associated with debt, adverse changes in general economic or local market conditions, changes in governmental, tax, real estate and zoning laws or regulations, risks associated with capital calls and, for some real estate products, the risks associated with the abil-ity to qualify for favorable treatment under the federal tax laws.
• Private Equity: There are risks specifically associated with investing in private equity. Capital calls can be made on short notice, and the failure to meet capital calls can result in significant adverse conse-quences including, but not limited to, a total loss of investment.
About Our Wealth Management ServicesAs a firm providing wealth management services to clients, UBS Finan-cial Services Inc. is registered with the U.S. Securities and Exchange Commission (SEC) as an investment adviser and a broker-dealer, offering both investment advisory and brokerage services. Advisory services and brokerage services are separate and distinct, differ in material ways and are governed by different laws and separate arrangements. It is impor-tant that you carefully read the agreements and disclosures UBS provides to you about the products or services offered. For more information, please visit our website at ubs.com/workingwithus. In providing financial planning services, we may act as a broker-dealer or investment adviser, depending on whether we charge a fee for the service. The nature and scope of the services are detailed in the documents and reports provided to you as part of the service.
UBS Financial Services Inc., its affiliates, and its employees do not pro-vide tax or legal advice. Clients should speak with their independent legal or tax advisor regarding their particular circumstances.
© 2019. The key symbol and UBS are among the registered and unreg-istered trademarks of UBS. All rights reserved. UBS Financial Services Inc. is a subsidiary of UBS AG. Member FINRA. Member SIPC. ubs.com/fs.