Embed Size (px)
Citation preview
February 2018 | NASRA ISSUE BRIEF: Public Pension Plan Investment Return Assumptions | Page 1
Figure 1: Public Pension Sources of Revenue, 1987-2016
Compiled by NASRA based on U.S. Census Bureau data
NASRA Issue Brief: Public Pension Plan Investment Return Assumptions
Updated February 2018
As of September 30, 2017, state and local government retirement systems held assets of $4.16 trillion.1 These assets are held in trust and invested to pre-fund the cost of pension benefits. The investment return on these assets matters, as investment earnings account for a majority of public pension financing. A shortfall in long-term expected investment earnings must be made up by higher contributions or reduced benefits. Funding a pension benefit requires the use of projections, known as actuarial assumptions, about future events. Actuarial assumptions fall into one of two broad categories: demographic and economic. Demographic assumptions are those pertaining to a pension plan’s membership, such as changes in the number of working and retired plan participants; when participants will retire, and how long they’ll live after they retire. Economic assumptions pertain to such factors as the rate of wage growth and the future expected investment return on the fund’s assets. As with other actuarial assumptions, projecting public pension fund investment returns requires a focus on the long-term. This brief discusses how investment return assumptions are established and evaluated, compares these assumptions with public funds’ actual investment experience, and the challenging investment environment public retirement systems currently face. Because investment earnings account for a majority of revenue for a typical public pension fund, the accuracy of the return assumption has a major effect on a plan’s finances and actuarial funding level. An investment return assumption that is set too low will overstate liabilities and costs, causing current taxpayers to be overcharged and future taxpayers to be undercharged. A rate set too high will understate liabilities, undercharging current taxpayers, at the expense of future taxpayers. An assumption that is significantly wrong in either direction will cause a misallocation of resources and unfairly distribute costs among generations of taxpayers. As shown in Figure 1, since 1987, public pension funds have accrued approximately $7.0 trillion in revenue, of which $4.3 trillion, or 61 percent, is from investment earnings. Employer contributions account for $1.9 trillion, or 27 percent of the total, and employee contributions total $844 billion, or 12 percent.2
Most public retirement systems review their actuarial assumptions regularly, pursuant to state or local statute or system
policy. The entity (or entities) responsible for setting the return assumption, as identified in Appendix B, typically works
with one or more professional actuaries, who follow guidelines set forth by the Actuarial Standards Board in Actuarial
Standards of Practice No. 27 (Selection of Economic Assumptions for Measuring Pension Obligations) (ASOP 27). ASOP
27 prescribes the factors actuaries should consider in setting economic actuarial assumptions, and recommends that
actuaries consider the context of the measurement they are making, as defined by such factors as the purpose of the
1 Federal Reserve, Flow of Funds Accounts of the United States: Flows and Outstandings, Third Quarter 2017, Table L.120
2 US Census Bureau, Annual Survey of Public Pensions, State & Local Data

February 2018 | NASRA ISSUE BRIEF: Public Pension Plan Investment Return Assumptions | Page 2
Figure 3: Median public pension annualized investment returns for period ended 12/31/2017
Figure 2: Average nominal and real rate of return, and average assumed inflation rate, FY 02 – FY 16
Public Plans Data and Public Fund Survey
measurement, the length of time the measurement period is intended to cover, and the projected pattern of the plan’s
cash flows.
ASOP 27 also advises that actuarial assumptions be
reasonable, defined in subsection 3.6 as being consistent
with five specified characteristics; and requires that
actuaries consider relevant data, such as current and
projected interest rates and rates of inflation; historic and
projected returns for individual asset classes; and historic
returns of the fund itself. For plans that remain open to
new members, actuaries focus chiefly on a long investment
horizon, i.e., 20 to 30 years, which is the length of a typical
public pension plan’s funding period. One key purpose for
relying on a long timeframe is to promote the key policy
objectives of cost stability and predictability, and
intergenerational equity among taxpayers.
The investment return assumption used by public pension
plans typically contains two components: inflation and the
real rate of return. The sum of these components is the
nominal return rate, which is the rate that is most often
used and cited. The system’s inflation assumption typically
is applied also to other actuarial assumptions, such as the level of wage growth and, where relevant, assumed rates of
cost-of-living adjustments (COLAs). Achieving an investment return approximately commensurate with the inflation rate
normally is attainable by investing in securities, such as US Treasury bonds, that are often characterized as risk-free, i.e.,
that pay a guaranteed rate of return.
The second component of the investment return assumption is the real rate of return, which is the return on investment
after adjusting for inflation. The real rate of return is intended to reflect the return produced as a result of the risk taken
by investing the assets. Achieving a return higher than the risk-free rate requires taking some investment risk; for public
pension funds, this risk takes the form of investments in assets such as public and private equities and real estate, which
contain more risk than Treasury bonds.
Figure 2 illustrates the changes in the average nominal (non-inflation-adjusted) return, the inflation assumption, and the resulting real rate of return assumption. As the chart shows, although the average nominal public pension fund investment return has been declining, because the average rate of assumed inflation has been dropping more quickly, the average real rate of return has risen, from 4.21 percent in FY 02 to 4.60 percent in FY 16. One factor that may be contributing to the higher real rate of return is public pension funds’ higher allocations to alternative assets, particularly to private equities, which usually have a higher expected return than other asset classes. Figure 3 plots median public pension fund annualized investment returns for a range of periods ended December 31, 2017. As the figure shows, relatively strong returns in recent years are somewhat offset by the effects of market declines of 2000-02 and 2008-09, which are affecting returns for the 10- or 20-year periods ended 12/31/17, or both.
February 2018 | NASRA ISSUE BRIEF: Public Pension Plan Investment Return Assumptions | Page 3
In the wake of the 2008-09 decline in capital markets and Great Recession, global interest rates and inflation have
remained low by historic standards, due partly to so-called quantitative easing of central banks in many industrialized
economies, including the U.S. Now in their ninth year, these low interest rates, with low rates of projected global
economic growth, have led to reductions in projected returns for most asset classes, which, in turn, have resulted in an
unprecedented number of reductions in the investment return assumption used by public pension plans. This trend is
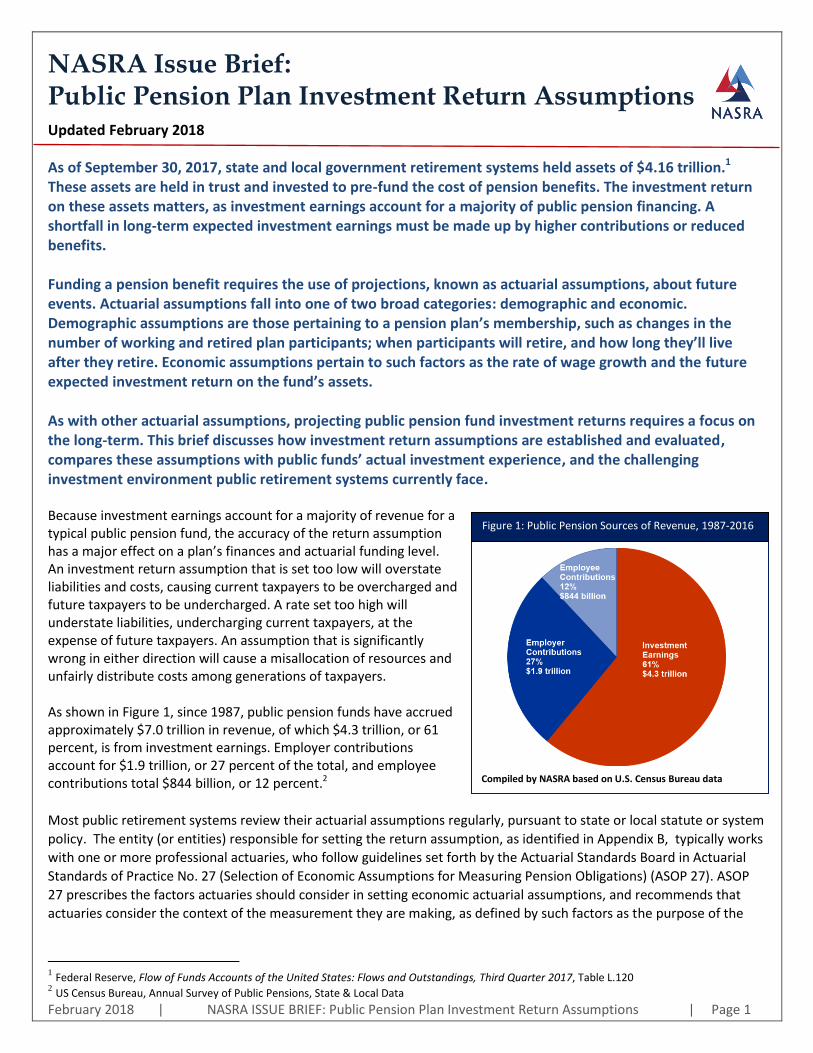
illustrated by Figure 4, which plots the distribution of investment return assumptions among a representative group of
plans since 2001. Among the 129 plans
measured, nearly three-fourths have reduced
their investment return assumption since fiscal
year 2010, resulting in a decline in the average
return assumption from 7.91 percent to 7.36
percent. If projected returns continue to
decline, investment return assumptions are
likely to also to continue their downward trend.
Appendix A lists the assumptions in use or
adopted for future use by the 129 plans in this
dataset.
One challenging facet of setting the investment
return assumption that has emerged more
recently is a divergence between expected
returns over the near term, i.e., the next five to
10 years, and over the longer term, i.e., 20 to 30
years3. A growing number of investment return
projections are concluding that near-term
returns will be materially lower than both
historic norms as well as projected returns over
longer timeframes. Because many near-term
projections calculated recently are well below
the long-term assumption most plans are using,
some plans face the difficult choice of either maintaining a return assumption that is higher than near-term
expectations, or lowering their return assumption to reflect near-term expectations.
If actual investment returns in the near-term prove to be lower than historic norms, plans that maintain their long-term
return assumption risk experiencing a steady increase in unfunded pension liabilities and corresponding costs.
Alternatively, plans that reduce their assumption in the face of diminished near-term projections will experience an
immediate increase unfunded liabilities and required costs. As a rule of thumb, a 25 basis point reduction in the return
assumption, such as from 8.0 percent to 7.75 percent, will increase the cost of a plan that has a COLA, by three percent
of pay (such as from 10 percent to 13 percent), and a plan that does not have a COLA, by two percent of pay.
Conclusion The investment return assumption is the single most consequential of all actuarial assumptions in terms of its effect on a pension plan’s finances. The sustained period of low interest rates since 2009 has caused many public pension plans to re-evaluate their long-term expected investment returns, leading to an uprecedented number of reductions in plan investment return assumptions. Absent other changes, a lower investment return assumption increases both the plan’s unfunded liabilities and cost. The process for evaluating a pension plan’s investment return assumption should include abundant input and feedback from professional experts and actuaries, and should reflect consideration of the factors prescribed in actuarial standards of practice.
3 Horizon Actuarial Services, “Survey of Capital Market Assumptions, 2017 Edition (August 2017) p4
Figure 4: Change in Distribution of Public Pension Investment Return Assumptions, FY 01 to FY 18
February 2018 | NASRA ISSUE BRIEF: Public Pension Plan Investment Return Assumptions | Page 4
See Also: Actuarial Standards of Practice No. 27, Actuarial Standards Board
The Liability Side of the Equation Revisited, Missouri SERS, September 2006
Contact: Keith Brainard, Research Director, [email protected]
Alex Brown, Research Manager, [email protected]
National Association of State Retirement Administrators
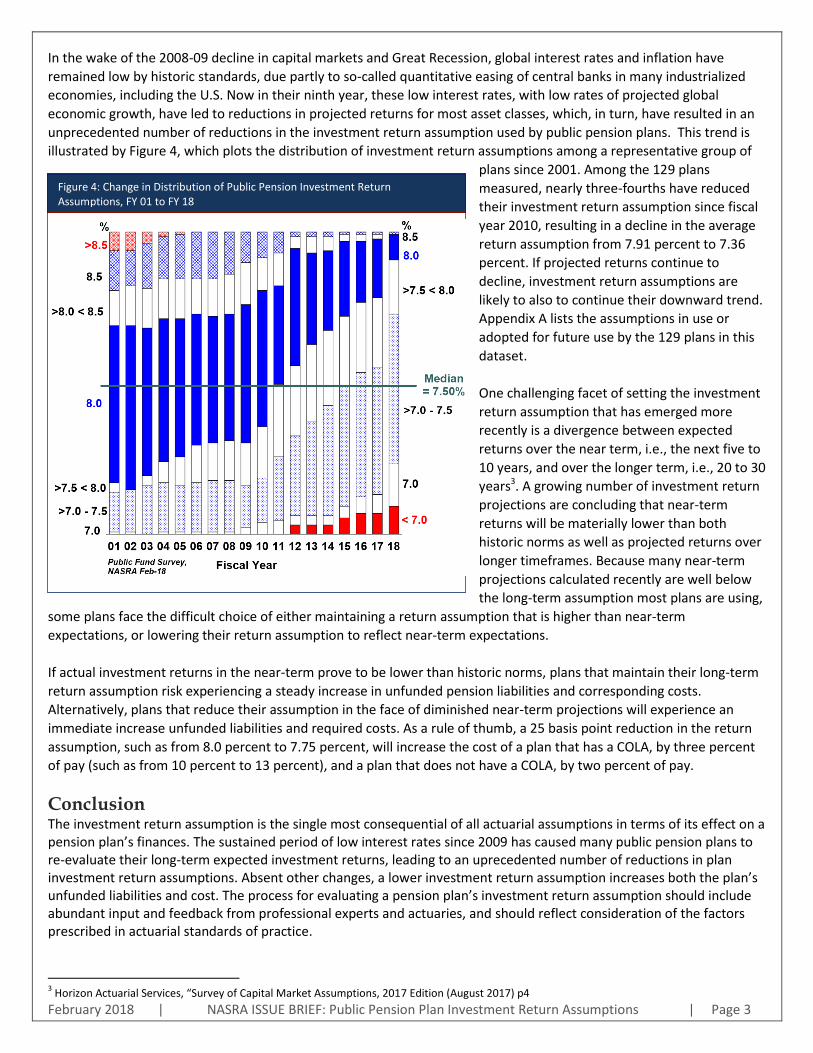
Figure 5: Distribution of investment return assumptions
February 2018 | NASRA ISSUE BRIEF: Public Pension Plan Investment Return Assumptions | Page 5
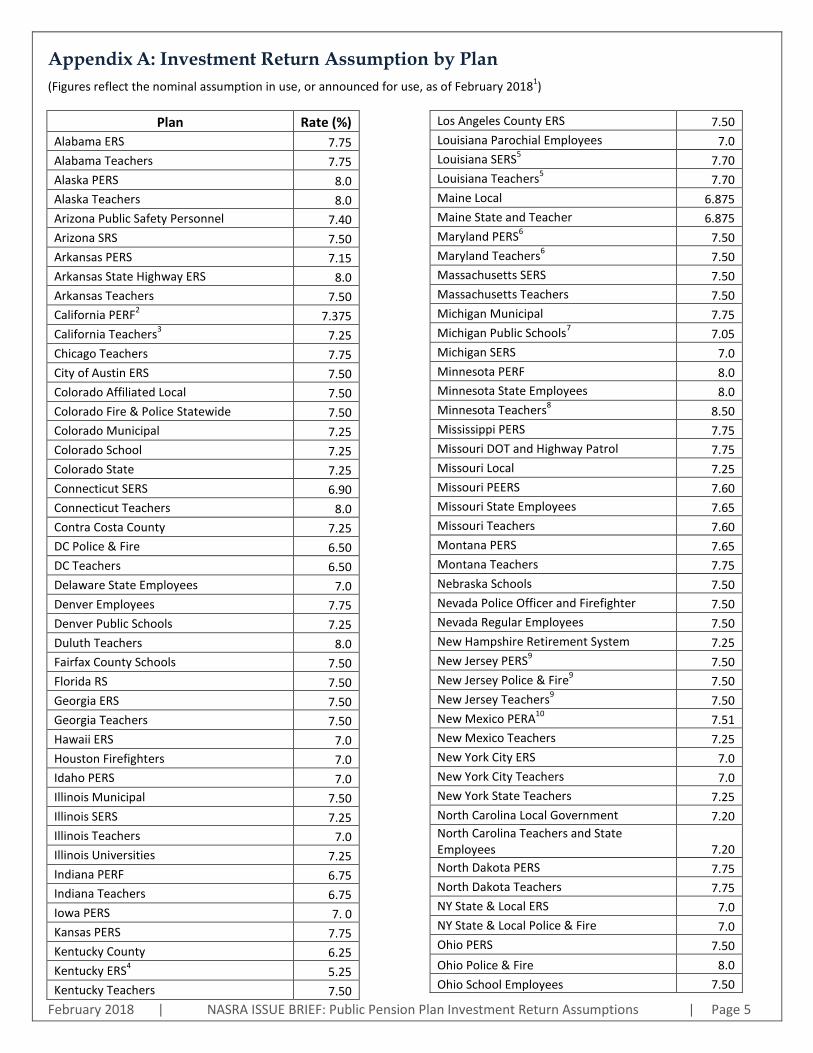
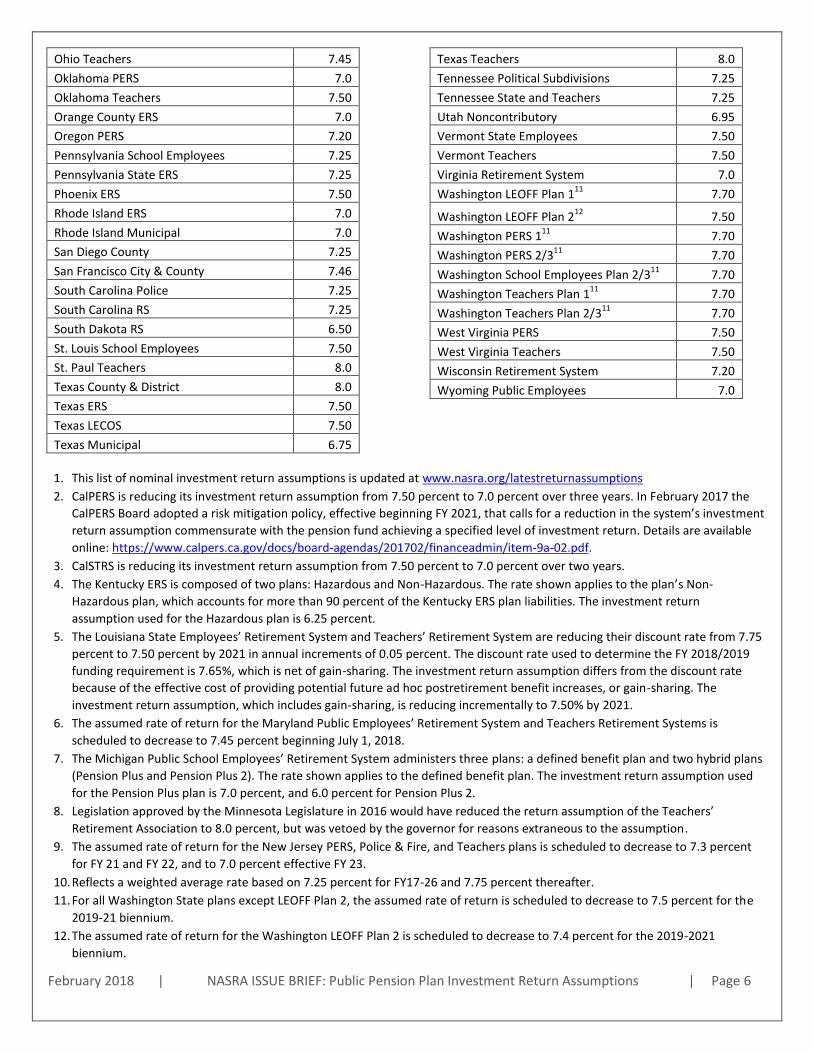
Appendix A: Investment Return Assumption by Plan
(Figures reflect the nominal assumption in use, or announced for use, as of February 20181)
Plan Rate (%)
Alabama ERS 7.75
Alabama Teachers 7.75
Alaska PERS 8.0
Alaska Teachers 8.0
Arizona Public Safety Personnel 7.40
Arizona SRS 7.50
Arkansas PERS 7.15
Arkansas State Highway ERS 8.0
Arkansas Teachers 7.50
California PERF2 7.375
California Teachers3 7.25
Chicago Teachers 7.75
City of Austin ERS 7.50
Colorado Affiliated Local 7.50
Colorado Fire & Police Statewide 7.50
Colorado Municipal 7.25
Colorado School 7.25
Colorado State 7.25
Connecticut SERS 6.90
Connecticut Teachers 8.0
Contra Costa County 7.25
DC Police & Fire 6.50
DC Teachers 6.50
Delaware State Employees 7.0
Denver Employees 7.75
Denver Public Schools 7.25
Duluth Teachers 8.0
Fairfax County Schools 7.50
Florida RS 7.50
Georgia ERS 7.50
Georgia Teachers 7.50
Hawaii ERS 7.0
Houston Firefighters 7.0
Idaho PERS 7.0
Illinois Municipal 7.50
Illinois SERS 7.25
Illinois Teachers 7.0
Illinois Universities 7.25
Indiana PERF 6.75
Indiana Teachers 6.75
Iowa PERS 7. 0
Kansas PERS 7.75
Kentucky County 6.25
Kentucky ERS4 5.25
Kentucky Teachers 7.50
Los Angeles County ERS 7.50
Louisiana Parochial Employees 7.0
Louisiana SERS5 7.70
Louisiana Teachers5
7.70
Maine Local 6.875
Maine State and Teacher 6.875
Maryland PERS6
7.50
Maryland Teachers6 7.50
Massachusetts SERS 7.50
Massachusetts Teachers 7.50
Michigan Municipal 7.75
Michigan Public Schools7 7.05
Michigan SERS 7.0
Minnesota PERF 8.0
Minnesota State Employees 8.0
Minnesota Teachers8 8.50
Mississippi PERS 7.75
Missouri DOT and Highway Patrol 7.75
Missouri Local 7.25
Missouri PEERS 7.60
Missouri State Employees 7.65
Missouri Teachers 7.60
Montana PERS 7.65
Montana Teachers 7.75
Nebraska Schools 7.50
Nevada Police Officer and Firefighter 7.50
Nevada Regular Employees 7.50
New Hampshire Retirement System 7.25
New Jersey PERS9 7.50
New Jersey Police & Fire9 7.50
New Jersey Teachers9 7.50
New Mexico PERA10
7.51
New Mexico Teachers 7.25
New York City ERS 7.0
New York City Teachers 7.0
New York State Teachers 7.25
North Carolina Local Government 7.20
North Carolina Teachers and State Employees 7.20
North Dakota PERS 7.75
North Dakota Teachers 7.75
NY State & Local ERS 7.0
NY State & Local Police & Fire 7.0
Ohio PERS 7.50
Ohio Police & Fire 8.0
Ohio School Employees 7.50
February 2018 | NASRA ISSUE BRIEF: Public Pension Plan Investment Return Assumptions | Page 6
Ohio Teachers 7.45
Oklahoma PERS 7.0
Oklahoma Teachers 7.50
Orange County ERS 7.0
Oregon PERS 7.20
Pennsylvania School Employees 7.25
Pennsylvania State ERS 7.25
Phoenix ERS 7.50
Rhode Island ERS 7.0
Rhode Island Municipal 7.0
San Diego County 7.25
San Francisco City & County 7.46
South Carolina Police 7.25
South Carolina RS 7.25
South Dakota RS 6.50
St. Louis School Employees 7.50
St. Paul Teachers 8.0
Texas County & District 8.0
Texas ERS 7.50
Texas LECOS 7.50
Texas Municipal 6.75
Texas Teachers 8.0
Tennessee Political Subdivisions 7.25
Tennessee State and Teachers 7.25
Utah Noncontributory 6.95
Vermont State Employees 7.50
Vermont Teachers 7.50
Virginia Retirement System 7.0
Washington LEOFF Plan 111
7.70
Washington LEOFF Plan 212
7.50
Washington PERS 111
7.70
Washington PERS 2/311
7.70
Washington School Employees Plan 2/311
7.70
Washington Teachers Plan 111
7.70
Washington Teachers Plan 2/311
7.70
West Virginia PERS 7.50
West Virginia Teachers 7.50
Wisconsin Retirement System 7.20
Wyoming Public Employees 7.0
1. This list of nominal investment return assumptions is updated at www.nasra.org/latestreturnassumptions
2. CalPERS is reducing its investment return assumption from 7.50 percent to 7.0 percent over three years. In February 2017 the
CalPERS Board adopted a risk mitigation policy, effective beginning FY 2021, that calls for a reduction in the system’s investment
return assumption commensurate with the pension fund achieving a specified level of investment return. Details are available
online: https://www.calpers.ca.gov/docs/board-agendas/201702/financeadmin/item-9a-02.pdf.
3. CalSTRS is reducing its investment return assumption from 7.50 percent to 7.0 percent over two years.
4. The Kentucky ERS is composed of two plans: Hazardous and Non-Hazardous. The rate shown applies to the plan’s Non-
Hazardous plan, which accounts for more than 90 percent of the Kentucky ERS plan liabilities. The investment return
assumption used for the Hazardous plan is 6.25 percent.
5. The Louisiana State Employees’ Retirement System and Teachers’ Retirement System are reducing their discount rate from 7.75
percent to 7.50 percent by 2021 in annual increments of 0.05 percent. The discount rate used to determine the FY 2018/2019
funding requirement is 7.65%, which is net of gain-sharing. The investment return assumption differs from the discount rate
because of the effective cost of providing potential future ad hoc postretirement benefit increases, or gain-sharing. The
investment return assumption, which includes gain-sharing, is reducing incrementally to 7.50% by 2021.
6. The assumed rate of return for the Maryland Public Employees’ Retirement System and Teachers Retirement Systems is
scheduled to decrease to 7.45 percent beginning July 1, 2018.
7. The Michigan Public School Employees’ Retirement System administers three plans: a defined benefit plan and two hybrid plans
(Pension Plus and Pension Plus 2). The rate shown applies to the defined benefit plan. The investment return assumption used
for the Pension Plus plan is 7.0 percent, and 6.0 percent for Pension Plus 2.
8. Legislation approved by the Minnesota Legislature in 2016 would have reduced the return assumption of the Teachers’
Retirement Association to 8.0 percent, but was vetoed by the governor for reasons extraneous to the assumption.
9. The assumed rate of return for the New Jersey PERS, Police & Fire, and Teachers plans is scheduled to decrease to 7.3 percent
for FY 21 and FY 22, and to 7.0 percent effective FY 23.
10. Reflects a weighted average rate based on 7.25 percent for FY17-26 and 7.75 percent thereafter.
11. For all Washington State plans except LEOFF Plan 2, the assumed rate of return is scheduled to decrease to 7.5 percent for the
2019-21 biennium.
12. The assumed rate of return for the Washington LEOFF Plan 2 is scheduled to decrease to 7.4 percent for the 2019-2021
biennium.
February 2018 | NASRA ISSUE BRIEF: Public Pension Plan Investment Return Assumptions | Page 7
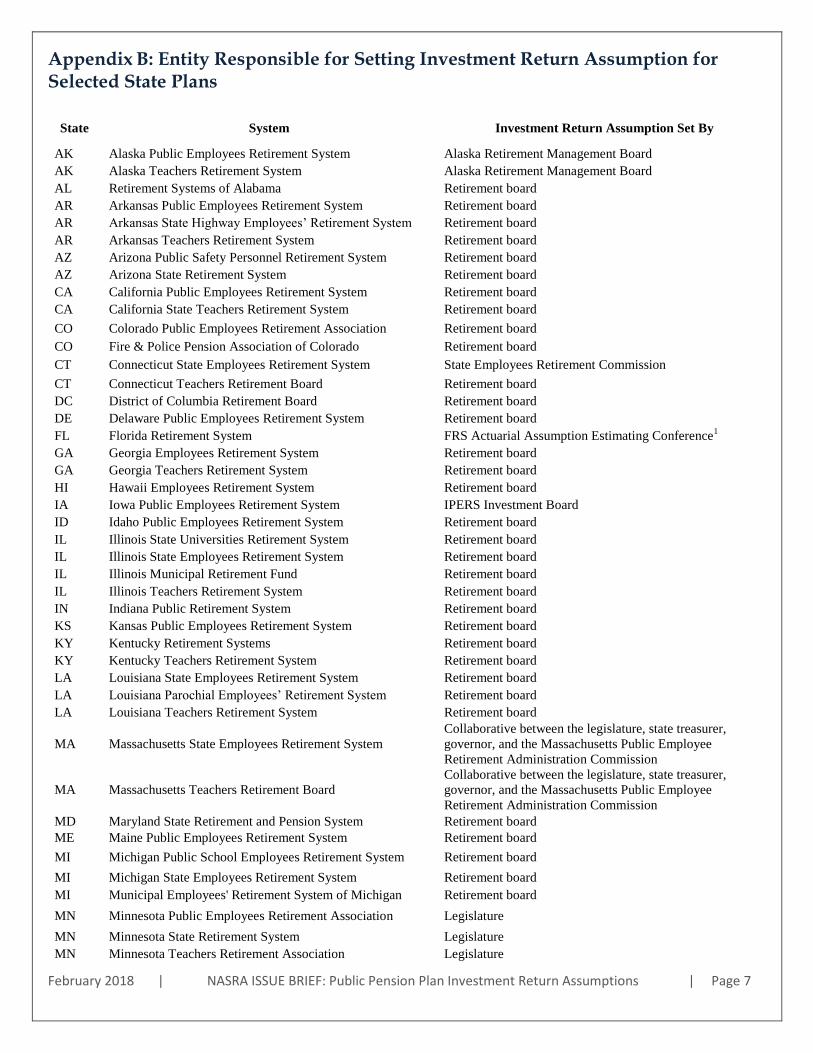
Appendix B: Entity Responsible for Setting Investment Return Assumption for Selected State Plans
State System Investment Return Assumption Set By
AK Alaska Public Employees Retirement System Alaska Retirement Management Board
AK Alaska Teachers Retirement System Alaska Retirement Management Board
AL Retirement Systems of Alabama Retirement board
AR Arkansas Public Employees Retirement System Retirement board
AR Arkansas State Highway Employees’ Retirement System Retirement board
AR Arkansas Teachers Retirement System Retirement board
AZ Arizona Public Safety Personnel Retirement System Retirement board
AZ Arizona State Retirement System Retirement board
CA California Public Employees Retirement System Retirement board
CA California State Teachers Retirement System Retirement board
CO Colorado Public Employees Retirement Association Retirement board
CO Fire & Police Pension Association of Colorado Retirement board
CT Connecticut State Employees Retirement System State Employees Retirement Commission
CT Connecticut Teachers Retirement Board Retirement board
DC District of Columbia Retirement Board Retirement board
DE Delaware Public Employees Retirement System Retirement board
FL Florida Retirement System FRS Actuarial Assumption Estimating Conference1
GA Georgia Employees Retirement System Retirement board
GA Georgia Teachers Retirement System Retirement board
HI Hawaii Employees Retirement System Retirement board
IA Iowa Public Employees Retirement System IPERS Investment Board
ID Idaho Public Employees Retirement System Retirement board
IL Illinois State Universities Retirement System Retirement board
IL Illinois State Employees Retirement System Retirement board
IL Illinois Municipal Retirement Fund Retirement board
IL Illinois Teachers Retirement System Retirement board
IN Indiana Public Retirement System Retirement board
KS Kansas Public Employees Retirement System Retirement board
KY Kentucky Retirement Systems Retirement board
KY Kentucky Teachers Retirement System Retirement board
LA Louisiana State Employees Retirement System Retirement board
LA Louisiana Parochial Employees’ Retirement System Retirement board
LA Louisiana Teachers Retirement System Retirement board
MA Massachusetts State Employees Retirement System
Collaborative between the legislature, state treasurer,
governor, and the Massachusetts Public Employee
Retirement Administration Commission
MA Massachusetts Teachers Retirement Board
Collaborative between the legislature, state treasurer,
governor, and the Massachusetts Public Employee
Retirement Administration Commission
MD Maryland State Retirement and Pension System Retirement board
ME Maine Public Employees Retirement System Retirement board
MI Michigan Public School Employees Retirement System Retirement board
MI Michigan State Employees Retirement System Retirement board
MI Municipal Employees' Retirement System of Michigan Retirement board
MN Minnesota Public Employees Retirement Association Legislature
MN Minnesota State Retirement System Legislature
MN Minnesota Teachers Retirement Association Legislature

February 2018 | NASRA ISSUE BRIEF: Public Pension Plan Investment Return Assumptions | Page 8
MO Missouri Local Government Employees Retirement System Retirement board
MO Missouri Public Schools Retirement System Retirement board
MO Missouri State Employees Retirement System Retirement board
MO MoDOT & Patrol Employees' Retirement System Retirement board
MS Mississippi Public Employees Retirement System Retirement board
MT Montana Public Employees Retirement Board Retirement board
MT Montana Teachers Retirement System Retirement board
NC North Carolina Retirement Systems Retirement board
ND North Dakota Public Employees Retirement System Retirement board
ND North Dakota Teachers Fund for Retirement Retirement board
NE Nebraska Public Employees Retirement System Retirement board
NH New Hampshire Retirement System Retirement board
NJ New Jersey Division of Pension and Benefits Retirement board and state treasurer
NM New Mexico Educational Retirement Board Retirement board
NM New Mexico Public Employees Retirement Association Retirement board
NV Nevada Public Employees Retirement System Retirement board
NY New York State & Local Retirement Systems State comptroller
NY New York State Teachers Retirement System Retirement board
OH Ohio Police and Fire Pension Fund Retirement board
OH Ohio Public Employees Retirement System Retirement board
OH Ohio School Employees Retirement System Retirement board
OH Ohio State Teachers Retirement System Retirement board
OK Oklahoma Public Employees Retirement System Retirement board
OK Oklahoma Teachers Retirement System Retirement board
OR Oregon Public Employees Retirement System Retirement board
PA Pennsylvania Public School Employees Retirement System Retirement board
PA Pennsylvania State Employees Retirement System Retirement board
RI Rhode Island Employees Retirement System Retirement board
SC South Carolina Retirement Systems Legislature
SD South Dakota Retirement System Retirement board
TN Tennessee Consolidated Retirement System Retirement board
TX Teacher Retirement System of Texas Retirement board
TX Texas County & District Retirement System Retirement board
TX Texas Employees Retirement System Retirement board
TX Texas Municipal Retirement System Retirement board
UT Utah Retirement Systems Retirement board
VA Virginia Retirement System Retirement board
VT Vermont State Employees Retirement System Retirement board
VT Vermont Teachers Retirement System Retirement board
WA Washington Department of Retirement Systems Legislature
WI Wisconsin Retirement System Retirement board
WV West Virginia Consolidated Public Retirement Board Retirement board
WY Wyoming Retirement System Retirement board
1. The Conference consists of staff from the Florida House, Senate, and Governor’s office