Embed Size (px)
Citation preview

Schwab Retirement Technologies, Inc. ®
Schwab RT
dailyVest planAnalytics
Investment Performance Calculation Assumptions Annualized Return Calculations

Real-Time Personal Investment Performance Reporting System
IMPLEMENTATION NOTES
Investment Performance Calculation Assumptions
TECHNICAL INFORMATION Revision 4
June 30th, 2010
Copyright © 2010, dailyVest, Incorporated. All Rights reserved

Implementation Notes - Investment Performance Calculation Assumptions
CONFIDENTIAL INFORMATION. NOT FOR RE-DISTRIBUTION.
2
Table of Contents
1.0 INTRODUCTION 3
2.0 TIME-WEIGHTED RATE OF RETURN (“TWRR”) 3
2.1 TIME-WEIGHTED RATE OF RETURN - MODIFIED DIETZ 4
2.2 TWRR - DAILY VALUATION 6
2.3 GEOMETRIC LINKING 7
3.0 DOLLAR-WEIGHTED RATE OF RETURN (“IRR”) 8
4.0 COMPARISON OF TIME-WEIGHTED AND DOLLAR-WEIGHTED METHODS 10
5.0 OTHER ASSUMPTIONS 11

Implementation Notes - Investment Performance Calculation Assumptions
CONFIDENTIAL INFORMATION. NOT FOR RE-DISTRIBUTION.
3
1.0 INTRODUCTION This document outlines the standards and underlying calculation assumptions employed by dailyVest’s performance calculation engine (the “FOM”) for time-weighted and dollar-weighted rates of return. 2.0 TIME-WEIGHTED RATE OF RETURN (“TWRR”) A time-weighted rate of return takes into account the amount of time an investor has been invested in a fund. It measures how well he or she performs in increasing the dollars that have been invested. Cash flows moving in and out of the fund do not affect the time-weighted rate of return (unlike with dollar-weighted rates of return or “IRR.” Time-weighted rates of return can be calculated on a daily basis (one method known as Daily Valuation) or on a slightly less accurate monthly basis (known as Modified Dietz) where inflows/outflows are averaged for the month. This time-weighted methodology used for calculation of personal rate of return provides a truer measurement of how investments are performing. ABOUT GIPS® STANDARDS
dailyVest’s FOM is capable of calculating personal investment performance using Dollar-Weighted Rate of Return (DWRR) and Time-Weighted Rate of Return (TWRR) methods. When employing time-weighted rate of return calculation methods, dailyVest follows the recommendations of the Investment Performance Council of the CFA Institute (formerly the Association for Investment Management and Research or AIMR) in its "Global Investment Performance Standard" (GIPS®) handbook used for calculating investment performance returns. The Investment Performance Council of the CFA Institute™ and GIPS requires calculation of a time-weighted rate of return, which takes into consideration the cash flows that occur and the market value of the asset on the beginning and ending period dates. dailyVest makes monthly valuations using the Modified Dietz Method, which does not require daily valuations. (Although, we understand that for the majority of our clients daily valuations are available.) Modified Dietz uses beginning and ending asset values for the period and weights each cash flow by the amount of time it is invested within that period. Consistent with The Investment Performance Council recommendations, dailyVest treats a "cash flow" as an external flow of cash and/or securities (capital additions or withdrawals) that is investor initiated. (Reinvested income is not considered a cash flow. Instead, reinvested income represents an appreciation/depreciation in the value of the portfolio and must be taken into account when calculating historical beginning and ending sub-period market values.) The Investment Performance Council of the CFA Institute™ (“IPC”) is a global nonprofit organization that provides information and knowledge to investment professionals and promotes voluntary calculation and performance presentation standards within the investment industry. The CFA Institute also oversees and administers the Chartered Financial Analyst (CFA) designation. The GIPS standards are guidelines that define how investment performance should be calculated and reported. Full GIPS compliance is composed of many components of which calculation methodology is only one. dailyVest does not and cannot claim “compliance” with IPC-GIPS. It claims only to follow some of the guidelines contained within the standard relating to calculation methodology.

4
Implementation Notes - Investment Performance Calculation Assumptions 2.1 TIME-WEIGHTED RATE OF RETURN - MODIFIED DIETZ METHODOLOGY TWRR - Modified Dietz
CALCULATION OF PERIOD RETURNS IN PRESENCE OF CASH FLOWS
When no cash flows are present, calculating total return is accomplished for a given period using the following equation:
…where EMV is the market value of the asset at the end of the period, including any accrued income. BMV is the market value of the asset at the beginning of the period. When cash flows are present, dailyVest uses the Modified Dietz approximation method. (The TWRR - Modified Dietz method provides an approximate time-weighted return whereas the TWRR - Daily Valuation method is a true TWRR.) TWRR – Modified Dietz uses the beginning and ending portfolio value for the month, and weights each cash flow (contribution or withdrawal) by the amount of time it is invested. The monthly portfolio returns are then geometrically linked to arrive at a quarterly or annual return. The formula for estimating the time-weighted rate of return using the Modified Dietz Method is…
…where EMV is the market value of the portfolio at the end of the period, including all income accrued up to the end of the period, and BMV is the portfolio's market value at the beginning of the period, including all income accrued up to the end of the previous period. CF is the net cash flows within the period (contributions to the portfolio are positive flows, and withdrawals or distributions are negative flows), and…
…is the sum of each cash flow CFi, multiplied by its weight, Wi. The weight (Wi) is the proportion of the total number of days in the period that cash flow CFi has been held in (or out of) the portfolio. The formula for Wi is…
where CD is the total number of calendar days in the period and Di is the number of calendar days since the beginning of the period in which cash flow CFi occurred. (The numerator is based on the assumption that the cash flows occur at the end of the day.) For example, if a cash flow occurred on January 20th, Wi is then calculated as (31–20)/31 = 0.35483871.
PROS/CONS The chief advantage of the Modified Dietz Method is that it does not require
CONFIDENTIAL INFORMATION. NOT FOR RE-DISTRIBUTION.

Implementation Notes - Investment Performance Calculation Assumptions
CONFIDENTIAL INFORMATION. NOT FOR RE-DISTRIBUTION.
5
portfolio valuation on the date of each cash flow. (This is not usually an issue with dailyVest's customer systems since daily account valuations are usually a de-facto standard.) Its chief disadvantage is that it provides a less accurate estimate of the true time-weighted rate of return. The estimate suffers most when a combination of the following conditions exists:
(1) one or more large cash flows occur; (2) cash flows occur during periods of high market volatility
dailyVest customers should note that the Modified Dietz approximation method will not conform with GIPS standards beginning 1 January 2010 when the Standards will likely require the use of calculations methods that use actual valuations at the time of external cash flows (such as with the Daily Valuation method).

6
Implementation Notes - Investment Performance Calculation Assumptions 2.2 TWRR - DAILY VALUATION dailyVest’s performance calculation engine (“FOM”) adheres to the following standards and calculates returns according to the following assumptions: METHODOLOGY TWRR - Daily Valuation
ACTUAL VALUATIONS AT TIME OF EXTERNAL CASH FLOWS
The actual valuation of the position, account or portfolio each time there is an external cash flow will result in the most accurate time-weighted rate of return calculation. In practice, this can only be met by having the ability to obtain daily valuations on all portfolio holdings on a continuous basis. (Again, this is standard in most dailyVest customer systems.) Returns are calculated under these conditions using the “Daily Valuation Method.” This method calculates the true TWRR rather than an estimate. The Daily Valuation Method breaks the total performance period into sub-periods, the boundaries of which are based on the occurrence of cash flows. The formula for calculating a sub-period return is…
…where EMV is the market value of the portfolio at the end of the sub-period, before any cash flows in the period, but including accrued income for the period. BMV is the market value at the end of the previous sub-period (i.e., the beginning of the current sub-period), including any cash flows at the end of the previous sub-period and including accrued income up to the end of the previous period. Boundaries of sub-periods can be depicted in the following example which contains two cash flows …
The sub-period returns (e.g., R1, R2, R3) are then geometrically linked according to the following formula…
…where RTR is the total return and R1, R2…Rn are the sub-period returns for sub-period 1 through n respectively. Sub-period 1 extends from the first day of the overall period up to and including the date of the first cash flow (excluding the value of that cash flow but including all accrued income for that sub-period). Sub-period 2 begins the next day and extends to the date of the second cash flow (again, excluding the value of that cash flow but including accrued income), and so forth. The final sub-period extends from the day of the final cash flow through the last day of the overall period. Based on how the sub-period boundaries were defined above, this
CONFIDENTIAL INFORMATION. NOT FOR RE-DISTRIBUTION.

7
Implementation Notes - Investment Performance Calculation Assumptions
method assumes that the cash flow is not available for investment until the beginning of the next day. Accordingly, when the portfolio is revalued on the date of a cash flow, the cash flow is not reflected in the Ending Market Value, but is added to the Ending Market Value to determine the Beginning Market Value for the next day.
PROS/CONS The chief advantage of this method is that it calculates the true time-weighted rate of return rather than an estimate as with the Modified Dietz Method.
2.3 GEOMETRIC LINKING LINKING PERIOD RETURNS
After computing monthly returns, they are linked geometrically to compute a quarterly return using this formula…
…where RQT is the portfolio quarterly return and RMO1, RMO2, and RMO3 are the portfolio returns for months 1, 2, and 3, respectively. dailyVest computes the annual rate of return from portfolio returns calculated quarterly using the following formula…
… where RQT1, RQT2, RQT3, and RQT4 are returns for Quarters 1, 2, 3, and 4, respectively. Alternatively, dailyVest may geometrically link the twelve monthly returns to calculate the annual return.
CONFIDENTIAL INFORMATION. NOT FOR RE-DISTRIBUTION.

8
Implementation Notes - Investment Performance Calculation Assumptions 3.0 DOLLAR-WEIGHTED RATE OF RETURN (“IRR”) Dollar-weighted rate of return, or “DWRR” for short, is also known as "Internal Rate of Return" or simply "IRR." It is used to determine the rate of return on an investment. IRR equates the present value of an investment's cash inflows (dividends, interest, and sales proceeds received) with the present cost of the investment. That is, for an investment that produces a number of cash flows over time, the IRR is defined to be the discount rate that makes the net present value of those cash flows equal to zero. Stated another way, the IRR is “…the interest rate that will make the present value of the cash flows from all the sub-periods in the evaluation period plus the terminal market value of the portfolio equal to the initial market value of the portfolio.” (Fabozzi, Frank J., Fixed Income Mathematics, ©1993 1997, pp 157). The IRR method (DWRR) requires an iterative solution for determining a rate of return and therefore leverages that inherent capacity in a client's web-based computer system. METHODOLOGY DOLLAR-WEIGHTED RATE OF RETURN
also known as Internal Rate of Return and “IRR”
INTERNAL RATE OF RETURN METHOD MODIFIED TO TAKE INTO ACCOUNT THE EXACT TIMING OF EACH CASH FLOW
dailyVest uses a modified form of the IRR equation to take into account the exact timing of each cash flow within a period. Known as a "Modified IRR," dailyVest software uses iteration to solve the following equation for the Internal Rate of Return “R…”
… where EMV is the market value of the asset at the end of the period, including any accrued income. The weight Wi is the proportion of the total number of days in the period that cash flow CFi has been held in (or out of) the portfolio. The formula for Wi is as before…
…where CD is the total number of calendar days in the period and Di is the number of calendar days since the beginning of the period in which cash flow CFi occurred. For example, if a cash flow occurred on January 20th, Wi is then calculated as (31–20)/31 = 0.35483871. (The numerator is based on the assumption that the cash flows occur at the end of the day.) Cash flows are treated the same way as in the Modified Dietz method with one important exception: the beginning market value is treated as a cash flow, or CF0 = BMV. Therefore, the IRR equation above can be represented as…
Where the value of R can be obtained by iterating through values of R until the result equals EMV.
NOTES GIPS recommends that IRR be used to measure the return of investments in private securities. This is so because private investment managers (or in dailyVest’s case, participants and individual investors themselves) exercise a greater degree of control over the amount and timing of their holdings’ cash flows. How participants and investors exercise this control is of course tied to their investment skill and their success in achieving a retirement goal. Thus, individual investors who use IRR are using a return calculation method that takes into account the amount and timing of their cash flows.
CONFIDENTIAL INFORMATION. NOT FOR RE-DISTRIBUTION.

Implementation Notes - Investment Performance Calculation Assumptions
CONFIDENTIAL INFORMATION. NOT FOR RE-DISTRIBUTION.
9
Returns for periods exceeding 1year are typically annualized.
PROS/CONS An advantage of the IRR method is that it takes into account the amount and timing of an investor’s cash flows. A disadvantage of the IRR method is that it is possible to have multiple returns if there are cash inflows and cash outflows within the same evaluation period. There is no closed “formula” for the IRR and the expression must be solved iteratively using numerical analysis.

Implementation Notes - Investment Performance Calculation Assumptions
CONFIDENTIAL INFORMATION. NOT FOR RE-DISTRIBUTION.
10
4.0 COMPARISON OF TIME-WEIGHTED AND DOLLAR-WEIGHTED METHODS The table below summarizes the main points behind the time-weighted and dollar-weighted rate of return calculation methods.
Time-Weighted Rate of Returns (“TWRR”) Dollar-Weighted Rate of Returns (“TWRR”)
DEFINITION: 1.) The return produced over time by a fund independent of contributions or withdrawals. Measures a fund’s compounded rate of growth over a specified time period.
DEFINITION: 1.) IRR is the discount rate that equates the cost of an investment with the cash generated by that investment. IRR tracks the performance of actual dollars invested over time.
MAJOR DIFFERENCES: 1.) Time-weighted returns are not affected by the size of interim cash inflows or outflows. The return for each period is calculated based on the amount of money in the portfolio at the start of each period.
2.) Time-weighted returns split up the time for which a return is going to be calculated into equal sub-periods. Time-weighted returns also tie these sub-period returns together to form the final rate of return using geometric linking. By geometrically linking the returns from each sub-period a time-weighted return eliminates any skewing of returns that will be calculated when large cash flows move though an investment. Note: TWRR is used to measure the performance of public fund managers, according to IPC-GIPS recommendations because it eliminates the impact of the timing of fund cash flows and isolates the portion of a portfolio’s return that is attributable solely to the manager’s actions. It is used by public fund managers because they normally do not control cash flowing into or out of their funds. (This recommendation of course does not exclude use of this method by individual investors.)
MAJOR DIFFERENCES: 1.) Dollar-weighted returns do reflect cash inflows and outflows, as well as the investment performance of the funds chosen by the investor. Dollar-weighted returns can be heavily changed depending on if and when large cash flows in and/or out of an investment occur. 2.) IRR does not split up the time period into equal sub-periods; instead it searches for a constant rate of return for one entire time period.

Implementation Notes - Investment Performance Calculation Assumptions
CONFIDENTIAL INFORMATION. NOT FOR RE-DISTRIBUTION.
11
5.0 OTHER ASSUMPTIONS PERIOD RETURN CONVENTION
dailyVest displays returns for periods less than 12 months as cumulative returns and annualizes returns for periods greater than or equal to 12 months. (Annualized returns express the rate of return of a portfolio or investment over a given time period on an annual basis, or a return per year.)
TRADE DATE ACCOUNTING
dailyVest uses trade-date accounting rather than settlement-date accounting, unless a customer specifically requests settlement-date (or “process date”) accounting. Trade-date accounting provides more accurate performance returns because of the volatility and lengthy settlement periods of some securities.
ZERO BALANCE THRESHOLD
Under certain conditions such as rounding, a transfer of funds from one account (or plan) to another, or a complete liquidation, a very low residual balance may remain. In cases such as these, a “very low” balance (e.g., pennies), is treated to be effectively a zero balance. This is done to eliminate subtle problems which arise when doing performance calculations and rendering charted illustrations. This threshold is given in terms of shares or unit.
“STANDARD” PERIODS dailyVest calculates returns for standard periods including 1-full month, 1-full quarter, and 1-full year.
“PARTIAL” PERIOD RETURNS
dailyVest defines partial periods as a partial month, partial quarter, and a partial year (“YTD”). Partial period returns therefore, can result if a return is requested for which either insufficient data is available to compute a return or if the current date (as-of date) falls before the end of the current month. Furthermore, if an investment’s inception date begins mid-month a partial period can result, as can a partial period result for a custom period where the “start” date is mid-month. Individual Asset Level and Partial Period Returns Displayed in a Minimum of Monthly Periods: For minimum of monthly standard periods, at the individual asset level if data is not available for a standard period (month, quarter, year), the dailyVest FOM returns an “n/a.” If an asset has an inception date or liquidation date mid-month, an “n/a” is also displayed for that month. Since an “n/a” is produced for the partial month, so too is an “n/a” produced for the applicable quarter which the partial month falls within. Similarly, an “n/a” would also be displayed for the corresponding year. An “n/a” would also be displayed if the current (as-of) date falls within a month. For example, if the current date is September 7th, an “n/a” will be returned for the month of September and for the 3rd quarter as well. An exception to this is if the date being displayed is a YTD where a return will be computed for the entire year-to-date period. In the example above, period returns for months January through August are geometrically linked with a partial period return for September 1st through September 6th. The Portfolio Level and Partial Period Returns: At a portfolio level (containing multiple assets), partial period returns are treated the same as immediately above however, the absence of full data for any one underlying asset would not preclude the return from being computed and displayed. At the portfolio level, period returns may be calculated from the date of the first transaction, including beginning balance transactions, through either the current date’s previous market close of the last transaction of any underlying asset. For example, for a portfolio containing three assets and the current date is May 13th, assume only one of the three assets has account data through the previous market

Implementation Notes - Investment Performance Calculation Assumptions
CONFIDENTIAL INFORMATION. NOT FOR RE-DISTRIBUTION.
12
close on May 12th. (…Lets assume the other two were liquidated prior to May 13th.) Here, relevant period returns for the portfolio could include values for Jan., Feb., Mar., Q1, and April. A YTD return would include returns for Jan., Feb., Mar., Q1, April, and a partial period return for May 1st through May 12th. Weighting Factor for Partial Period Returns: It is important to note that for partial periods at the portfolio level (and for the Cumulative returns chart below), dailyVest assumes the cash flow weighting factor is based on the total number of days in that partial period. Therefore, the partial period return for the May 12th example above (i.e., May 1st through May 12th) has a weighting factor based on the total number of calendar days in that sub-period of 12. Therefore, any cash flow occurring during this partial period is weighted using the total days in the (partial) period minus the date of the cash flow, all divided by the total calendar days in the partial period. For example, assume a cash out-flow of $1,000 occurs on May 5th. This would then be weighted as: -$1,000 * (12 – 5) / 12 = $583.33. Year-to-Date Returns: dailyVest computes year-to-date (“YTD”) returns by chaining (geometrically linking) all year to date monthly period returns. If the current date falls within a month, we calculate a partial period return for that fraction of the current month and chain that sub-period return with any other monthly period or sub-period returns. dailyVest displays YTD returns as cumulative returns.
HANDLING PERIODS WITH INSUFFICIENT DATA
When an investor selects a viewing period, it is not guaranteed that there will be sufficient data to display the period requested. In situations such as these, dailyVest traps two specific conditions and displays corresponding warning messages: 1) WHEN THERE IS SIMPLY NOT ENOUGH DATA TO DISPLAY ANYTHING IN A CHART OR TABLE MESSAGE: "Please Note: Complete data is not available for the period selected. Please select a different viewing period or investment." 2) WHEN THERE IS ENOUGH DATA TO DISPLAY A CHART OR TABLE, BUT THE DATA AVAILABLE FOR THE VIEWING PERIOD IS A SUB-SET OF THE REQUESTED PERIOD MESSAGE: "Please Note: Complete data is not available for the period selected and therefore, your personal rate-of-return and charted results have been adjusted to reflect a new period for which data is available."
CUMULATIVE RETURNS CHART
dailyVest’s “Cumulative Returns” chart helps tracks total cumulative return for a portfolio, account or individual asset over a selectable period of time. Each point on the chart represents a personal rate of return for the period beginning on the chart's start date (in the example below this start date is 10/15/2001 – probably the inception date for the account), through the date corresponding to that “point.” For example, according to the illustration below, the return on April 1st, 2003 is approximately +5%. Therefore, the personal rate of return for the period 10/15/2001 through April 1st, 2003 is approximately +5%.

13
Implementation Notes - Investment Performance Calculation Assumptions
Return Calculations for the Cumulative Returns Chart: Plotted returns for each point (blue pixel) in the Cumulative Returns chart are calculated using the time-weighted rate of return, Modified Dietz method. Here, each daily point is the calculated result of geometrically linked whole-month periods and any partial periods. For example, the return (blue pixel point) on April 1st, 2002 of approximately +10% (with an overall period beginning at market close on 10/14/2001) was calculated by linking the cash flows for the following seven standard monthly periods (periods 2 - 6) and partial periods (periods 1 and 7):
Period No.
From after market close on…
To after market close on…
Period Type
Total Days in sub-period
1 10/14/2001 10/31/2001 partial 17 2 10/31/2001 11/30/2001 full month 30 3 11/30/2001 12/31/2001 full month 31 4 12/31/2001 01/31/2002 full month 31 5 01/31/2002 02/28/2002 full month 28 6 02/28/2002 03/31/2002 full month 31 7 03/31/2003 04/01/2003 partial 1
Similarly, the return point calculated for the following day, Tuesday April 2nd, 2004 is calculated using the same periods in the table above except that Period No. 7 is from after market close on 03/31/2002 to after market close on 04/02/2002, and so on. Note that in Modified Dietz, the “Total Days in sub-period” as outlined in the “Weighting Factor for Partial Period Returns” section above is a key variable and that even for partial periods 1 and 7, dailyVest considers the total days in those partial periods to be 17 and 1, respectively. Therefore, if a cash flow were to have occurred on 10/17/2001, then the weighting factor for that cash flow is calculated using (17 – 17) / 17 = 0.000 Special Case Involving Liquidation: Using the Modified Dietz method, a Cumulative Returns chart can look misleading in certain special situations where the viewing period highlights investment(s) which have been liquidated and then
CONFIDENTIAL INFORMATION. NOT FOR RE-DISTRIBUTION.
Implementation Notes - Investment Performance Calculation Assumptions
CONFIDENTIAL INFORMATION. NOT FOR RE-DISTRIBUTION.
14
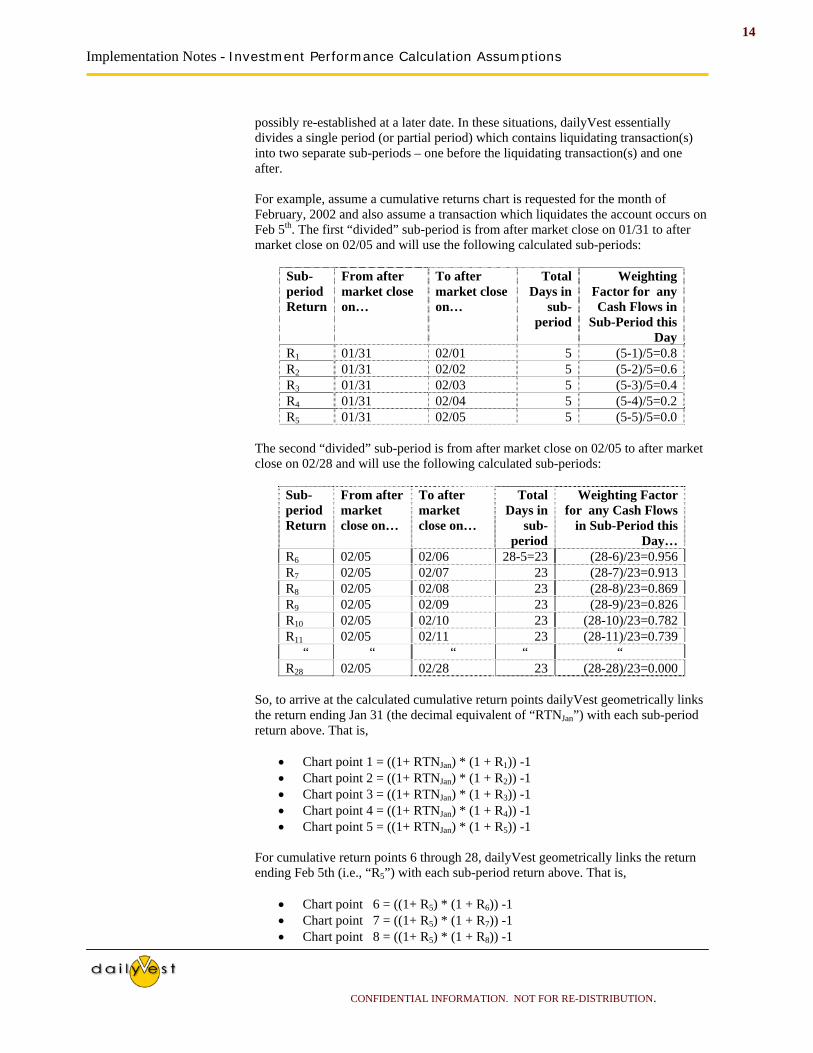
possibly re-established at a later date. In these situations, dailyVest essentially divides a single period (or partial period) which contains liquidating transaction(s) into two separate sub-periods – one before the liquidating transaction(s) and one after. For example, assume a cumulative returns chart is requested for the month of February, 2002 and also assume a transaction which liquidates the account occurs on Feb 5th. The first “divided” sub-period is from after market close on 01/31 to after market close on 02/05 and will use the following calculated sub-periods:
Sub-period Return
From after market close on…
To after market close on…
Total Days in
sub-period
Weighting Factor for any Cash Flows in
Sub-Period this Day
R1 01/31 02/01 5 (5-1)/5=0.8 R2 01/31 02/02 5 (5-2)/5=0.6 R3 01/31 02/03 5 (5-3)/5=0.4 R4 01/31 02/04 5 (5-4)/5=0.2 R5 01/31 02/05 5 (5-5)/5=0.0
The second “divided” sub-period is from after market close on 02/05 to after market close on 02/28 and will use the following calculated sub-periods:
Sub-period Return
From after market close on…
To after market close on…
Total Days in
sub-period
Weighting Factor for any Cash Flows
in Sub-Period this Day…
R6 02/05 02/06 28-5=23 (28-6)/23=0.956 R7 02/05 02/07 23 (28-7)/23=0.913 R8 02/05 02/08 23 (28-8)/23=0.869 R9 02/05 02/09 23 (28-9)/23=0.826 R10 02/05 02/10 23 (28-10)/23=0.782 R11 02/05 02/11 23 (28-11)/23=0.739
“ “ “ “ “ R28 02/05 02/28 23 (28-28)/23=0.000
So, to arrive at the calculated cumulative return points dailyVest geometrically links the return ending Jan 31 (the decimal equivalent of “RTNJan”) with each sub-period return above. That is,
• Chart point 1 = ((1+ RTNJan) * (1 + R1)) -1 • Chart point 2 = ((1+ RTNJan) * (1 + R2)) -1 • Chart point 3 = ((1+ RTNJan) * (1 + R3)) -1 • Chart point 4 = ((1+ RTNJan) * (1 + R4)) -1 • Chart point 5 = ((1+ RTNJan) * (1 + R5)) -1
For cumulative return points 6 through 28, dailyVest geometrically links the return ending Feb 5th (i.e., “R5”) with each sub-period return above. That is,
• Chart point 6 = ((1+ R5) * (1 + R6)) -1 • Chart point 7 = ((1+ R5) * (1 + R7)) -1 • Chart point 8 = ((1+ R5) * (1 + R8)) -1

15
Implementation Notes - Investment Performance Calculation Assumptions
• Chart point 9 = ((1+ R5) * (1 + R9)) -1 • Chart point 10 = ((1+ R5) * (1 + R10)) -1 • “ “ “ “ “ “ “ • Chart point 28 = ((1+ R5) * (1 + R28)) -1
NET INVESTMENT vs. MARKET VALUE CHART
dailyVest’s “Net Investment vs. Market Value” chart helps to illustrate for investors two important points: the total net investments within a portfolio, account, or selected asset over time, and the corresponding market value fluctuation of those investments. Net investments are represented by (in the example figure below) the step-like black line and correspond to cash flows resulting from the investor's own transactions. The market value of these investments is represented by the fluctuating blue line and is a function of the price of each asset within the account or portfolio times the total number of units for each asset. Red shading (if any) indicates periods of negative unrealized gains where the value is less than what was invested. Green shading (if any) represents periods of positive unrealized gains where the value is greater than what was invested. It is important to note that because complete transaction history is not always available since inception, the “net investment” line is “forced” to start at the same level as the “market value” line. Relative to this date forward until the end of the period charted, net investments are portrayed accurately.
Note the following features about this chart (these are implementation-specific. Customer may desire different implementation functions, layout, colors, etc.)… 1. Personal Rate of Return Over Viewing Period - shows the calculated personal
return over the selected viewing period (here, 16.7% from 10-15-2001 to 06-30-2003).
2. Select List for Choosing What to Analyze – analysis can be made for an individual position within account or all positions.
3. Select List for Choosing Time Period -- selects a time period corresponding to all available history, or a specific period..
CONFIDENTIAL INFORMATION. NOT FOR RE-DISTRIBUTION.

Real-Time Personal Investment Performance Reporting System
IMPLEMENTATION NOTES
Annualized Return Calculations
TECHNICAL INFORMATION Revision 4
June 30th, 2010
Copyright © 2010, dailyVest, Incorporated. All Rights reserved

Implementation Notes - Annualized Return Calculation Assumptions
CONFIDENTIAL INFORMATION. NOT FOR RE-DISTRIBUTION.
2
Table of Contents
HOW DAILYVEST ANNUALIZES RETURNS .................................................................... 3
1.0 ANNUALIZED RETURNS ................................................................................................................................ 3 1.1 Annualized Returns for Fractional Years..................................................................................................... 4 1.2 Annualization for Periods Less Than One Year........................................................................................... 4
2.0 GEOMETRIC LINKING................................................................................................................................... 5

3
Implementation Notes - Annualized Return Calculation Assumptions
HOW DAILYVEST ANNUALIZES RETURNS 1.0 ANNUALIZED RETURNS Investors often need to see returns for multi-year periods reflected on an annualized basis. Annualized returns for such periods show the equivalent yearly return for each of the years within the multi-year period that that would have been needed to achieve the overall period return. This document describes how dailyVest software derives annualized returns (R annualized) for multi-year periods. The dailyVest FOM readily calculates returns for each of the individual years (and partial years) within the overall period, but since returns fluctuate from year-to-year, investors may want to know what single rate of return would have been needed to be achieved each year within the overall period to arrive at the overall period return.
11 −+= n multiyearannualized RTNRTN …where “RTN multiyear” is the overall period return for the multi-year period expressed as a decimal1 and “n” is the number of years in the multi-year period. Example 1.0: Assume a 5-year period return of 31.54% and assume the following sub-period returns were actually achieved:
Year 1 = 3.75%, Year 2 = 6.21%, Year 3 = 4.83%, Year 4 = 8.45%, Year 5 = 5.01%
As can be seen, each year’s return varies between a minimum of 3.75% and maximum of 8.45%. What equivalent return (i.e., “annualized return”) would be required to achieve a 31.55% return for the overall 5-year period? Using the formula above, the “RTN annualized” = 5.6359%. So, it can be said that the 31.55% return for the 5-year period could also have been achieved had we had annual returns of 5.63% for each of the 5 years. This can be proved by geometrically linking the 5-year returns of 5.63%, as shown in the next section.
1 To convert a 3.75% return to a decimal, divide by 100. So, 3.75/100 = 0.0375.
CONFIDENTIAL INFORMATION. NOT FOR RE-DISTRIBUTION.

4
Implementation Notes - Annualized Return Calculation Assumptions 1.1 Annualized Returns for Fractional Years Investors may want to see an annualized return for a period which includes a fractional year. dailyVest software handles scenarios like this using the same method above. Example 1.1: Assume an investor wants to know the annualized return since account inception, which in this case is assumed to be 18 months (1½ years). If the period return since inception is 21.39%, then the annualized return is computed as 13.74%, or…
12139.015.1 −+=annualizedRTN While this example was done for illustration mainly, dailyVest software uses days instead of months when calculating the nth root. This is more accurate since not all months have the same number of days. 1.2 Annualization for Periods Less Than One Year dailyVest DOES NOT annualize returns for periods less than one year. Doing so would be inaccurate, since the period is too short to attempt to derive a return for a year from it. This is also a standard industry practice.
CONFIDENTIAL INFORMATION. NOT FOR RE-DISTRIBUTION.

5
Implementation Notes - Annualized Return Calculation Assumptions 2.0 GEOMETRIC LINKING dailyVest software calculates personal rate of return for smaller periods of a month and a quarter. However, investors often want to see returns for longer periods such as a year. To derive a quarterly personal rate of return from 3 monthly returns, or to derive a yearly return from 12 monthly returns or 4 quarterly returns is accomplished using the technique of geometric linking. (This situation is opposite of that described in the “Annualized Returns” section above. Here, investors may want to see returns for longer periods of time such as quarters or years.) Sub-period returns are geometrically linked according to the following formula…
…where RTR is the total return and R1, R2…Rn are the sub-period returns for sub-period 1 through n respectively. Sub-period 1 extends from the first day of the period up to and including the date of the first cash flow. Sub-period 2 begins the next day and extends to the date of the second cash flow, and so forth. The final sub-period extends from the day after the final cash flow through the last day of the period. If monthly portfolio returns are already calculated, the monthly returns can be linked geometrically to compute a quarterly return. Example 2.0: Using the yearly period returns in the example above, derive a 5-year period return… RTR = [ (1+.0375)*( 1+.0621)*( 1+.0483)*( 1+.0845)*( 1+.0501) -1] x 100 = 31.54% To prove the annualized return computed in Example 1.0 above, derive a 5-year period return using the 5.63% annualized returns assumed to be achieved year for 5 years… RTR = [ (1+.0563)*( 1+.0563)*( 1+.0563)*( 1+.0563)*( 1+.0563) -1] x 100 = 31.54%
CONFIDENTIAL INFORMATION. NOT FOR RE-DISTRIBUTION.