Embed Size (px)
Citation preview

Telstra Annual Report 2019

We believe it’s people who give purpose to our technology
So we’re committed to staying close to our customers and providing them the best experience
And delivering the best tech
On the best network
Because our purpose is to build a connected future so everyone can thrive
Our values
Bettertogether
Trust each other to deliver
Make the complex simple
Show you care
Find your courage

FY19 Financial performance 2
FY19 highlights 3
Chairman and CEO message 4
Strategy and performance 7
Our material risks 12
Outlook 14
Full year results and operations review 16
Board of Directors 26
Senior management team 28
Sustainability 30
Governance at Telstra 30
Directors’ report 31
• Message from the Remuneration Committee Chairman 36
• Remuneration report 38
Financial report 73
• Financial statements 75
• Notes to the financial statements 81
• Directors’ declaration 168
Shareholder information 174
Reference tables 176
Glossary 179
Indicative financial calendar 180
Our 2019 reporting suite
We take our reporting obligations seriously and we provide concise and up to date information about your company online.
In 2019 this information includes our Annual Report, our Corporate Governance Statement and our Bigger Picture Sustainability Report.
Our 2019 Annual Report
Our Annual Report describes our strategy, financial performance and remuneration practices.
The sections of our Annual Report titled Chairman and CEO message, Strategy and performance, Our material risks, Outlook, and Full year results and operations review comprise our operating and financial review (OFR) and form part of the Directors’ report.
Our OFR, Directors’ report and Financial report were released to the ASX on 15 August 2019 in the document titled ‘Financial results for the year ended 30 June 2019’ which is available at telstra.com/investor.
Our 2019 Corporate Governance Statement
Our 2019 Corporate Governance Statement (CGS) provides detailed information about governance at Telstra and together with our 2019 ASX Appendix 4G (which cross references the ASX Corporate Governance Principles & Recommendations to information in our CGS and on our website), is available at telstra.com/governance.
Our Bigger Picture 2019 Sustainability Report
Our Bigger Picture 2019 Sustainability Report, which provides an in-depth look at Telstra’s approach and performance in relation to our most material social and environmental topics, is available at telstra.com/sustainability/report.
Telstra Corporation Limited ABN 33 051 775 556

FY19 Financial performance
FY19 reported performance in line with market expectations
1 Total Income excludes finance income
378,000Net retail postpaid
mobile services
$456 million(down 6.0 per cent)
Underlying fixed costs
$1.9 billionreturned to
shareholders
More than
16 centsper share
fully franked
Total FY19 dividends
$2.1 billionNet Profit After Tax (NPAT)Down 39.6 per cent
$8.0 billionEarnings Before Interest, Tax Depreciation and Amortisation (EBITDA)
Down 21.7 per cent
$27.8 billionTotal Income1
Down 3.6 per cent
Reported results

FY19 highlights | Telstra Annual Report 2019
3
FY19 highlights
Helped approximately
1 million customers in
vulnerable circumstances stay connected
Provided digital capability training to almost 36,000 people
Australia’s first 5G network
New rewards
program for customers Calls to
contact centres
22%
Emissions intensity since 2017
40%
Radically simplified plans
1800 20Even more coverage
Mobile: 2.5 million km2
NB loT^: 3.5 million km2
^ Narrowband Internet of Things

4
Chairman and CEO message
Dear Shareholders,
This has been an incredibly important year for Telstra, a year where we embraced the many changes we need to ensure our continued success in the future, while staying true to our purpose and core values.
Already we are a very different, much simpler and more customer focused organisation than we were a year ago.
In the year since we launched T22 – in June 2018 – we have taken some great strides toward becoming a company that is easier to interact with, improving our service and offering fewer and more flexible products. All of this is supported by our investment to deliver Australia’s largest, fastest, smartest, and safest next generation networks and new technology to deliver a market-leading customer experience.
Through T22 we have radically simplified our products and services by reducing more than 1,800 Consumer and Small Business plans to just 20 in-market core fixed and mobile plans. In the past year, we have also introduced new no lock-in mobile plans with no excess data charges in Australia and launched our customer loyalty program, Telstra Plus, which rewards members with points that can be put towards the latest devices, accessories and entertainment.
For our business customers, we continue to be the best one-stop shop for all business-to-business technology needs. We have made progress on our ambition to provide modular, curated, self-service and simplified products to customers and have launched and enhanced Connected Workplace to selected customers, built on our new technology stack.
While we are making good progress on our T22 strategy, we continue to feel the significant impact of the rollout of the nbnTM on our earnings and profit, and competition in the mobile market remains high.

5
Our financial results
Our full year results for financial year 2019, which were in line with guidance and market expectations, showed strong progress against the T22 strategy.
On a reported basis, Total Income1 decreased 3.6 per cent to $27.8 billion, EBITDA decreased 21.7 per cent to $8.0 billion, and NPAT decreased 39.6 per cent to $2.1 billion. On a guidance basis2, Total Income1 decreased 2.6 per cent to $27.8 billion, EBITDA (excluding restructuring costs) decreased 11.4 per cent to $9.4 billion. Underlying EBITDA3 decreased 11.2 per cent to $7.8 billion.
The largest reason for the decline in EBITDA was the impact of the nbn, with Telstra absorbing around $600 million of negative recurring EBITDA headwind4 in the period. Underlying EBITDA decreased approximately 4 per cent if you exclude the in-year nbn headwind. To date we estimate the nbn has adversely impacted EBITDA by approximately $1.7 billion, and estimate we are around 50 per cent of the way through the recurring financial impact of the nbn.
We saw continued customer growth, with 378,000 net retail postpaid mobile services added, including 181,000 from Belong, taking retail mobile postpaid handheld services to 8.2 million. We also added more than 230,000 wholesale MVNO mobile prepaid and postpaid services and 107,000 net new fixed-line retail bundle and data services, including 51,000 from Belong.
Our Internet of Things (IoT) business exceeded industry growth rates, with revenue growth of 19.4 per cent. On average 2,000 things are being connected to our IoT networks every day including vehicles, machines, infrastructure, smart meters and a wide array of other sensors.
While we continued to grow our customers, we also significantly reduced our costs, with a $456 million (6 per cent) reduction in underlying fixed costs.
Notwithstanding the intense competitive environment and the challenging structural dynamics of our industry, it is a year in which we believe we can start to see the turning point in the fortunes of the company from the changes we have embraced.
For FY19, the Board resolved to pay a total fully franked final dividend of 8 cents per share, comprising a final ordinary dividend of 5 cents per share and a final special dividend of 3 cents per share. Combined with the total interim dividend paid in February 2019, shareholders will receive a total dividend
of 16 cents per share for FY19, returning more than $1.9 billion to shareholders.
The ordinary dividend represents a 59 per cent payout ratio on FY19 underlying earnings5, while the special dividend represents a 63 per cent payout ratio of FY19 net one-off nbn receipts6. The FY19 ordinary dividend is below the payout ratio of 70 to 90 per cent of underlying earnings, which is one of the principles in our capital management framework. In our updated Capital Management Framework7 underlying earnings now explicitly exclude guidance adjustments8
as well as net one-off nbn receipts. In determining the FY19 final ordinary dividend, the Board has taken into account a number of factors including the overall capital management framework objectives, including maintenance of financial strength and retaining financial flexibility.
World-class networks
We continue to invest in our world-class networks and this year we began rolling out 5G, the next generation of telecommunications technology. We were the first to launch 5G in Australia and the first telco to begin offering 5G handsets here. To begin with, we are building out our 5G coverage in 10 cities nationally, with more locations to follow.
5G is much more than just a faster smartphone – it will be a key connectivity technology enabling extraordinary new opportunities in fields like the Internet of Things, cloud computing, big data, machine learning and artificial intelligence – all areas where we continue to build our expertise and capabilities for the future.
Our mobile footprint stretches out to more than 2.5 million square kilometres, vastly more than any other mobile network in Australia, and coverage extends to 99.5 per cent of the Australian population.
Delivering more connectivity and better networks in a country as large and as sparsely populated as Australia is no easy thing, but Telstra continues to lead. So far we have erected 600 mobile base stations as part of the Federal Government’s Mobile Black Spot Program, and by the end of the program we will build around 800 stations – four times more than the rest of the industry combined.
We are pioneering the use of new and more affordable technologies like small cell technology and mobile repeaters to increase coverage on the road. We will never be able to provide coverage to
every last Australian, but our commitment is that we will work cooperatively with governments and other stakeholders, and will do our absolute best to bridge the gap between city and country better than anyone else.
Simpler and more customer focused
We have greatly simplified our structure and ways of working to empower our people and serve our customers. Re-engineering how we operate and removing complexity and management layers has meant a reduction in the size of our workforce particularly as nbn co, a company which did not exist several years ago, progressively becomes the wholesale provider of fixed broadband services in Australia, a role previously held by Telstra. The reality is it is not possible for Telstra to continue to operate with the same number of employees after the nbn network is rolled out as it had before nbn co-existed.
Around 75 per cent of the net 8,000 direct workforce role reductions we announced as part of our T22 strategy have now been identified. We have also made progress on our target to create 1,500 new roles in areas like cyber security and software engineering.
The impact our T22 strategy has on our people is the hardest of the changes we are making and we have seen that reflected in our employee sustainable engagement figure, which declined this year by 10 per cent. To support our people through the change, we are investing up to $50 million in a transition program that provides a range of services to help people move into new roles.
You can read more about the T22 strategy and the progress we are making in the Strategy and performance section.
In the past year, the Australian corporate landscape has undergone a seismic readjustment as customers, regulators and investors have publicly reminded large organisations of the value they place on companies being transparent, ethical and accountable in all their dealings.
We understand and respect the long-standing responsibilities we have as part of the community. We were one of three Australian companies recognised on the global CDP 2018 Climate A List for our efforts to address climate change. This year we also helped around one million vulnerable people to stay connected, which is part of our 2020 target to enable 1.5 million people to connect or thrive online. We know we have more work to do
Chairman and CEO message | Telstra Annual Report 2019

6
and we are committed to continuously improving the way we serve and support potentially vulnerable customers. Our Bigger Picture 2019 Sustainability Report provides more information on these and other initiatives. You can read more at telstra.com/sustainability/report9.
Leadership renewal
We continue to review and renew the composition of the Board to ensure we have the right balance of experience, expertise and fresh thinking. Our thanks to retiring directors Russell Higgins, Trae Vassallo, Jane Hemstritch and Steven Vamos for their enormous contributions and welcome to Niek Jan van Damme (previously a member of the Deutsche Telekom Board of Management) and Eelco Blok (who has more than 30 years’ experience at Dutch-based landline and mobile telecommunications company KPN). While the composition of the Board has changed over the year, we remain focused on achieving our 40 per cent target for female non-executive directors.
You can read more about the Board’s composition in the Board of Directors section.
In the management team, Michael Ackland was appointed to lead the Consumer and Small Business function, Christian von Reventlow now leads Product & Technology, Michael Ebeid leads Enterprise, and Nikos Katinakis leads Networks and IT. Robyn Denholm also stepped down as Chief Financial Officer (her contribution as Telstra’s CFO and COO were enormous) and has been replaced by Vicki Brady, formerly Group Executive, Consumer and Small Business.
Our year ahead
Our business is well positioned for the era in which we are about to head – the 2020s. Returning to growth will take time. However, we have great confidence that our strategy can arrest the decline in our earnings and create opportunities for growth.
While the reported financial trends in FY19 were challenging, underlying trends are expected to improve over the course of FY20.
Telstra released guidance for FY2010, with Total Income11 in the range of $25.7 to $27.7 billion, underlying EBITDA12 in the range of $7.3 to $7.8 billion, restructuring costs of around $300 million, capital
expenditure of $2.9 to $3.3 billion, and free cash flow after operating lease payments13,14 of $3.4 to $3.9 billion.
Telstra expects net one-off nbn DA receipts15
(less nbn net cost to connect (C2C)) of $1.6 billion to $2.0 billion. Telstra also expects FY20 to be the biggest in-year nbn headwind16 to date, with $800 million to $1 billion expected from the recurring impact of the nbn. The clearest view of future financial performance of the business is provided by looking at underlying EBITDA, excluding the recurring in-year headwind of the nbn, which in FY20 is expected to grow by up to $500 million.17
You can read more about the year ahead in the Outlook section.
A year of challenge and important change
To sum up, FY19 was a year in which we met guidance, achieved strong subscriber growth in both fixed and mobile, and built significant momentum behind our T22 strategy.
The progress we made this year is the result of the combined efforts of many people, including our dedicated employees who serve our customers and help us return value to our shareholders.
We are still closer to the start of T22 than the finish, but we are confident we are moving at speed toward fulfilling our purpose to build a connected future so everyone can thrive. We are confident we have the right strategy to create sustained value for our customers, our shareholders and our employees well into the future.
On behalf of everyone at Telstra, thank you for your support and we wish you a happy and healthy year ahead.
John P Mullen, Chairman
Andrew R Penn, CEO and Managing Director
1. Excluding finance income. 2. This guidance assumed wholesale product
price stability and no impairments to investments or core assets, and excluded any proceeds on the sale of businesses, mergers and acquisitions and purchase of spectrum. The guidance also assumed the nbn™ rollout and migration in FY19 was broadly in accordance with the nbn Corporate Plan 2019. The guidance was provided on the basis of AASB15. Capex was measured on an accrued basis and excluded expenditure on spectrum and externally funded capex.
3. FY19 Underlying EBITDA excluded net one-off nbn DA receipts less nbn net cost to connect (C2C), and guidance adjustments.
4. In-year nbn headwind defined as the net negative recurring EBITDA impact on our business based on management best estimates.
5. Underlying earnings is defined as net profit after tax from continuing operations excluding net one-off nbn receipts and guidance adjustments (see notes 6 & 8 below).
6. ‘net one-off nbn receipts’ is defined as net one-off nbn Definitive Agreement (nbn DA) receipts (consisting of Per Subscriber Address Amount (PSAA), Infrastructure Ownership and Retraining) less nbn net cost to connect less tax.
7. See FY19 management presentation materials for updated Capital Management Framework which has been lodged with the ASX and available on Telstra’s Investor website at www.telstra.com.au/aboutus/investors.
8. Guidance adjustments include one-off restructuring costs, impairments in and to investments or property, plant and equipment and intangible assets, proceeds on the sale of businesses, mergers and acquisitions and purchase of spectrum.
9. This report will be available online from 30 August 2019.
10. This guidance assumes wholesale product price stability and no impairments in and to investments or property, plant and equipment and intangible assets, and excludes any proceeds on the sale of businesses, mergers and acquisitions and purchase of spectrum. The guidance also assumes the nbn rollout and migration in FY20 is broadly in accordance with the nbn Corporate Plan 2019. Guidance is provided on the basis of AASB16 leases and assumes impacts consistent with management estimates and current interpretation of the standard. Capex is measured on an accrued basis and excludes expenditure on spectrum and externally funded capex and capitalised leases under AASB16 Leases.
11. Excluding finance income.12. Underlying EBITDA excludes net one-off
nbn DA receipts less nbn net C2C, guidance adjustments and includes amortisation of mobile operating lease costs.
13. FY20 free cash flow defined as operating cash flows less investing cash flows less operating leases (reported in financing cash flow under AASB16 leases).
14. FY20 free cash flow guidance includes ~$1b working capital increase including from exit of mobile lease plans, remaining outflows from restructuring costs announced in May 2019, and an increase in nbn receivables.
15. ‘net one-off nbn receipts’ is defined as net one-off nbn Definitive Agreement (nbn DA) receipts (consisting of Per Subscriber Address Amount (PSAA), Infrastructure Ownership and Retraining) less nbn net cost to connect less tax.
16. In-year nbn headwind defined as the net negative recurring EBITDA impact on our business based on management best estimates including key input of the nbn corporate plan 2019.
17. This estimate is based on the midpoint ($900m) of expected in-year nbn headwind (defined in note 16 above).

7
Strategy and performance

8
Strategy and performance
We have taken major steps forward and built great momentum for the next phase of our T22 transformation.
It has been more than twelve months since Telstra embarked on its T22 strategy – a major transformation that is enabling us to respond to a rapidly changing environment and continue to lead the Australian telco market. T22 is about simplifying our operations and products, improving the experience of our people and customers, reducing our costs and structuring the business to maximise the value of our assets.
A lot has happened in the past year and we have made good progress. Telstra is already a company that is easier to interact with, offering better service and simpler, more flexible products, delivered with world-class technology. Telstra InfraCo, our new standalone infrastructure business unit, is operational. We are working and doing
business differently under a simplified structure and new ways of working and we have made significant progress on our ambition to implement industry-leading cost reduction and portfolio management programs.
T22 is underpinned by our multi-billion dollar strategic investment program to digitise and automate our systems and deliver the networks for the future, including 5G, which became a reality with our launch this year.
This is just the start and there remains much to do. Our values and our renewed purpose – to build a connected future so everyone can thrive – continue to guide us as we deliver T22 and beyond.
9
The four pillars of the strategy are:
Pillar 1: Radically simplify our product offerings, eliminate customer pain points and create all digital experiences
We have delivered a game-changing overhaul of the way we develop and sell our Consumer and Small Business products by creating simple, flexible ways for customers to choose the best value connectivity, devices and services for them.
We have kept our promise to simplify our product range by reducing more than 1,800 Consumer and Small Business plans to just 20 in-market core fixed and mobile plans.
In FY19, Telstra became the first major telco in Australia with no lock-in plans across fixed and mobile. We also launched build-your-own mobile plans, giving our customers freedom and flexibility. Pain points, such as excess mobile data usage charges, are also a thing of the past across all our new domestic mobile plans with more than 820,000 customers already enjoying the freedom of no excess data usage charges in Australia.
Our customers can now add their choice of a great range of entertainment options, add-on BYO mobile plans, pick from an expanded range of accessories and devices with no upfront charges and add innovative technology solutions like Smart Home onto their core mobile or home broadband plans.
Our support for small business customers also underwent a major revamp. As well as no lock-in contracts and no excess data charges in Australia on new mobile and tablet plans, we launched a host of more dedicated support services. This included a new 24/7 tech support service, training thousands more dedicated small business specialists across the country and rolling out our new Telstra Business Technology Centres – a new national premium Information and Communications Technology (ICT) channel for small business customers with more complex technology needs.
As well as flexibility, simplicity and choice, our customers told us they wanted to be rewarded and recognised for their loyalty. We listened, and now our millions of loyal customers can access Telstra Plus – a new rewards program giving them the opportunity to earn discounts on new technology as well as bonus entertainment and more. More than 770,000 customers have already enrolled and begun earning points since Telstra Plus launched in April 2019.
We are on track to halve the number of Enterprise plans by 2022 and we have released Connected Workplace to selected customers. Connected Workplace is a simple, streamlined way for our business customers (with between 20 and 200 employees) to get all the communications, data and connectivity solutions an office needs at a fixed price per-user, per-month.
Telstra also continues to develop leading products of its own, such as the Telstra Smart Modem 2.0, Telstra TV, Telstra Track and Monitor and award-winning Telstra Locator.
Customers increasingly prefer to use digital channels to interact with us. This creates great opportunities for us to deliver a better experience. During the year we refreshed our Telstra 24x7 App, adding additional features and making it simpler for customers to self-manage their account and services.
Our Digital experience now accounts for 16.8 per cent of sales as well as more than 53 per cent of service transactions, which include account management and billing related enquiries.
Simpler products and processes and more ways for customers to self-serve saw calls to our Consumer and Small Business call centres drop significantly, with nearly 7.7 million (22 per cent) fewer calls in FY19. Call volumes also reduced by 9 per cent with our Enterprise customers.
Pillar 2: Establish a standalone infrastructure business unit to drive performance and set up optionality post the nbn rollout
On 1 July 2018, we created Telstra InfraCo, a standalone infrastructure business unit within Telstra, to provide greater visibility to the market of the value of this business and create more optionality in the future.
Telstra InfraCo controls assets with a book value of around $11 billion and is responsible for network infrastructure assets such as data centres and exchange buildings, most of our fibre network, the copper and hybrid fibre coaxial (HFC) networks, international subsea cables, exchanges, poles, ducts and pipes.
Establishing Telstra InfraCo as a separate business unit, with its own segment reporting in our financial accounts, allows us to drive greater efficiency in the operation of our infrastructure assets and provides investors with greater visibility of the value of those assets and the returns they generate.
Telstra InfraCo serves three customer segments, with more than 200 customers in total, including Wholesale in Australia; nbn co; and the broader Telstra organisation.
Pillar 3: Greatly simplify our structure and ways of working to empower our people and serve our customers
A critical part of delivering on our T22 commitments is changing how we work to allow our people to collaborate more quickly and easily so that they can deliver better and faster outcomes for our customers.
We have made good progress on our commitment to remove hierarchies and silos and redesign our organisation from the ground up.
We have removed three management layers already and are on track to reduce up to four management layers in the organisation.
Our new Global Business Services function has been operational through FY19, providing a point of consolidation for many of our large scale “back of house” processes and functions using technology to reduce costs for large repeatable functions.
We are ahead of plan with our direct workforce reductions, with around 75 per cent of the net 8,000 roles now announced. The decision to accelerate these changes was made carefully and deliberately to, in part, provide our people certainty about the future. This resulted in an increase in Telstra’s forecasted total FY19 restructuring costs from around $600 million to approximately $800million. While not all impacted employees left the organisation before the end of FY19, consultation concluded in mid-June and therefore the relevant restructuring costs were brought forward from FY20 to FY19. Total remaining restructuring costs from T22 initiatives are expected to be in the vicinity of $350 million with around $300 million in FY20.
We are supporting our people through the change. This includes our standard redundancy packages and an up to $50 million transition program that provides a range of services to help people move into a new role.
We are transitioning across our organisation to an Agile at scale model – a suite of practices and mindsets that are enabling us to work more collaboratively and transparently and respond faster and more easily to the changing needs of our customers.
Strategy and performance | Telstra Annual Report 2019

10
We are also investing in critical capabilities needed for the future such as software engineering, DevOps (development and operations collaboration practices) and automation by opening our Innovation and Capability Centre (ICC) in Bangalore.
This centre means we can scale crucial skills and access a greater resource pool. Longer term, we want to see these skills being further developed right here in Australia and we are establishing a partnership program with a small number of universities to develop specific capabilities.
Pillar 4: Industry-leading cost reduction programs and portfolio management
Our cost reduction and portfolio management programs are well underway and remain on track to reach our net cost out target of $2.5 billion by the end of 2022.
We have already delivered around $1.17 billion of our commitment and we are targeting a further reduction in fixed costs in FY20 of $660 million. Under the strategic investment in digitisation announced in 2016, we are well progressed in building new IT platforms and retiring many of our legacy systems. This has resulted in a non-cash impairment and a write down of the value of our legacy IT assets for FY19 of approximately $500 million. Further details on our new digital platforms are provided below.
In line with our T22 strategy to monetise up to $2 billion of assets by the end of FY20, we reached an agreement to sell three international data centres in Europe and Asia to global private equity firm I-Squared Capital, the owners of HGC Global Communications. The agreement is subject to a number of conditions precedent and if these are satisfied, Telstra expects the transaction to be completed in first half of FY20, with estimated proceeds from sale of approximately $160 million. This is in addition to the sale of our Edison Exchange in Brisbane’s CBD and other opportunities which continue to be developed**.
Australia’s largest, fastest, safest, smartest and most reliable next generation network
The 5G future arrived in FY19 and Telstra has been a global leader in its development, testing, rollout and product range.
5G is expected to deliver ultrafast speeds, ultra-low latency (less lag between a request for data being sent and received) and greater bandwidth that will transform the way we live and work by enabling all sorts of future applications and technologies.
We have started rolling out 5G in 10 cities around Australia and we expect our 5G coverage to increase almost five-fold in area and reach into at least 35 Australian cities over the next twelve months.
The rollout of 5G coverage is in its early stages with the current footprint being in CBD locations and selected regional centres where more than four million people live, work or visit every day.
Our network leadership has resulted in exclusive access to the world’s first 5G smartphones and devices.
We have also continued to grow our mobile network, launching our 10,000th mobile network site and building around 600 new mobile base stations under the Federal Government’s Mobile Black Spot Program since its inception. Nationally, our mobile footprint now stretches out to more than 2.5 million square kilometres, at least 1 million square kilometres more than any other mobile network in Australia. The rollout of 5G will complement and increase the capabilities of Internet of Things (IoT) beyond the limitations of existing 4G standards.
Telstra has also deployed advanced IoT technology. Our leading mobile footprint is why we can offer more than 3.5 million square kilometres of Narrowband IoT coverage and around 3 million square kilometres of Cat M1 coverage, and we are now focussing on harnessing its potential to introduce connected solutions to solve everyday problems, such as analytic sensors and track and monitor – from fleet vehicles to the family pet. We saw continued positive momentum in this area in FY19.
Telstra has invested around $8 billion over the past five years to 30 June 2019 to enhance the capacity, capability and reach of Telstra’s mobile network.
We continue to lead the market in a number of key speed and other quality benchmarks, with our networks recognised in the 2018 SpeedtestTM Awards by OoklaTM as well as P3, Systemics, and every Netflix survey since February 2018.
We also grew our subsea cable network to more than 400,000 kilometres – enough to circle the world 10 times – including a number of large capacity purchases on new-generation cables. Telstra has the largest subsea cable network in the Asia Pacific, which enables much of the information our customers consume and share to be transmitted. Through our continued investment we are well placed to meet our customers’ growing demand for data, as well as adding diversity and resiliency to our network.
We will continue to work to build and develop the networks for the future so that we can seek to provide our customers with the largest, fastest, smartest and safest next generation networks.
T22’s four pillars are enabled by a program of up to $3 billion of strategic investments, announced in 2016, to transform our network and digital capabilities.
** Since the release of our OFR on 15 August 2019, which was lodged with the ASX in the document titled “Financial results for the year ended 30 June 2019”, Telstra announced that it had established an unlisted property trust to own 37 of its exchange properties and had reached an agreement to sell a 49% stake, realising proceeds of $700 million. Further information is available in our ASX announcement dated 16 August 2019 and in the transcript of the analyst conference held on 16 August 2019 (which was lodged with the ASX on 21 August 2019) which are available at telstra.com/investor.

11
Strategy and performance | Telstra Annual Report 2019
Strategic pillars
Radically simplify our product offerings, eliminate customer pain points and create all digital experiences
Establish a standalone infrastructure business unit to drive performance and set up optionality post the nbn rollout
Greatly simplify our structure and ways of working to empower our people and serve our customers
Industry leading cost reduction program and portfolio management
Enabled by our up to $3b investment program
New digital platforms
Australia’s largest, fastest, safest, smartest and most reliable next generation network
DeliveringMarket leading customer experience
Simplified products, business and operating model
Extended network superiority and 5G leadership
Achieve Global High Performance Norm in employee engagement
Net cost productivity of $2.5bn by FY22
Post-nbn ROIC > 10%1
New digital platforms
Digitisation remains crucial to achieving our strategy to radically simplify our product offerings, eliminate customer pain points and create great digital experiences.
Telstra is continuing to invest in digitisation to replace our legacy tools and complex manual processes with fully-automated, world-class digital applications.
Our new digital platforms are enabling the simplification of our business, which will lead to improved customer experience and reduced costs.
They will cover the full customer lifecycle and underpin our ability to move to a new, simplified product suite.
Functionality on our new Salesforce customer relationship management
(CRM) system is being progressively rolled out. This system allows us to remove complexity for our Consumer and Small Business frontline employees by servicing customer needs from one console. This will make it easier and faster for our people to process transactions, manage an account or fault, recommend additional products and services and undertake a host of other interactions. Salesforce is now also the single portal for Telstra Enterprise and our partners to manage our sales opportunities and has helped increase our sales pipeline by 27 per cent over the past 12 months.
We have also established key personalisation capabilities using our Big Data platform and the Marketing Cloud feature of the new Salesforce platform,
which collectively enable us to deliver highly targeted and personalised communications.
We have achieved significant momentum for our Enterprise customers with approximately 6,000 customers onboarded to our Telstra Connect platform. Telstra Connect brings together more than 50 active portals into one to improve our customer experience and it is becoming our single digital channel for business to business (B2B) customer interactions.
Our B2B Digital Transformation, which is automating and simplifying processes across the full Enterprise customer lifecycle, has also automated more than 170 processes, allowing our people to focus on more valuable tasks.
T22
1 Post-nbn defined as FY23 and beyond on AASB16 basis

12
Our material risks
Telstra operates in an environment that is constantly evolving and facing rapid change, therefore it is important that we have frameworks in place to identify, measure and monitor the most material risks to our organisation, and to leverage our opportunities. The following describes the material risks that could affect Telstra, including any material exposure to economic, environmental and social sustainability risks, and how we seek to manage them.
These risks are not listed in any order of significance, nor are they all encompassing. Rather they reflect the most significant risks identified at a whole-of-entity level through our risk management process.
Transformation and competition
The impacts of the nbnTM network rollout and the intensified competition across the industry has seen us launch the T22 strategy which aims to simplify our business, reduce our cost base and maximise the value of our infrastructure. We are now a year into this strategy and have made good progress addressing customer pain points, digitising customer experiences, setting up Telstra InfraCo and simplifying our structure and ways of working. Digitisation of our systems and processes is a key enabler of our T22 strategy allowing us to further simplify our products and achieve our efficiency goals. The T22 strategy has also changed the way we sell our products, increasing the risk that our new market propositions fail to meet the needs of our customers.
As we execute on our T22 strategy, it is essential that we continue to effectively manage our risks and avoid inadvertently undermining our critical processes, controls or obligations. Throughout this period of change, we are focused on maintaining effective formal structures of governance and leadership to effectively identify and manage the transformation risks, including the Digitisation program. While we have set a clear path for Telstra, failure to implement the appropriate systems and processes, and put the correct people in place, would severely impact on our ability to achieve our T22 goals.
To mitigate this risk, we are committed to ensuring our people have access to the right tools and technology to help successfully deliver the transformation.
People and culture
To be successful in achieving our T22 strategy, it is imperative that we attract, develop and retain a workforce capable of delivering our objectives through our new ways of working. Our people and our ability to maintain our desired culture are also integral to operating at the standards expected by our stakeholders and community. Our Culture and Capability program is focused on building an agile and enabled culture, centred on simplicity and accountability and driven by strong leadership. We have had additional focus on the Responsible Business components of our sustainability strategy this year, including initiatives that further improve our culture and the way we conduct our business.
Our workforce continues to be impacted as we progress through the transformation changes. To assist with the transition, we have invested in a new operating model and organisational change teams to train and uplift capability. A transition program is also in place to provide outplacement support for employees leaving Telstra.

13
Our material risks | Telstra Annual Report 2019
Privacy and cyber security
At Telstra the privacy and security of our customers’ data is critical and front of mind in everything we do. Cyber threats are constantly evolving, including from foreign groups targeting individuals and companies based in Australia and sophisticated phishing scams and cyber-attacks targeting the critical infrastructure that we manage. The privacy and security of customer and corporate information may be compromised in many ways, including a breach to our IT systems and our vendors’ systems, unauthorised or inadvertent release of information or human error. Should our systems be compromised, it would impact our customers’ trust, damage our brand and reputation, and potentially significantly disrupt our operations.
We have a number of strategies to manage these cyber threats, including enterprise wide cyber drills designed to test the level of staff compliance and vigilance, reviews of third party security to confirm it meets our standards, and development of policies and procedures. We regularly update our privacy statement and privacy procedures including in consideration of how societal expectations and technological changes affect the way we collect, store and use personal information.
Health, safety, wellbeing and environment
The nature of the infrastructure we maintain and the activities we undertake involve a level of inherent Health, Safety, Wellbeing and Environmental (HSWE) risk. This includes risks to employees, members of the public and environmental hazards associated with our work, our products and services and the facilities in which we operate. Failure to manage these risks effectively could also impact our reputation with stakeholders and customers and expose us to regulatory action or litigation. We have a comprehensive system and processes in place to responsibly manage our risks and to actively monitor safety outcomes and build employee awareness. We also have a Mental Health and Wellbeing Strategy to address workplace mental health and wellbeing risks including those associated with change and
transformation. Our approach to managing HSWE risk incorporates broader considerations of our safety culture, including managing workplace aggression and drug and alcohol use, how we manage environmental hazards and those that may arise from use of our products such as electromagnetic energy.
Resilience
Our competitive advantage is driven through the scale, speed and resilience of our network. The importance of our network is further emphasised by our customers’ need to be always connected, and this dependency is greater now than ever before. If this growing reliance is not met, for example during periods of network congestion or prolonged network disruptions, the impacts can be frustrating and disruptive. We are also cognisant of the responsibilities we have in providing critical infrastructure and important products and services to our customers. When we get this wrong it can have severe ramifications for our customers, and may undermine their trust in us and impact our brand and reputation.
The threats to our ability to maintain resilience and continuity of key processes and systems include equipment failure, natural disasters, malicious attacks, loss of key third party service providers, and human errors. Given the breadth and complexity of our underlying infrastructure, we also expect our exposure to climate change related risks will increase over time in line with the frequency and intensity of extreme weather events.
To manage these risks, we have a number of capabilities, strategies and plans that seek to prevent, respond to and recover from network or critical service disruptions. We are also implementing a cross company Integrated Resilience approach to better manage end-to-end resilience of key products and services. Our 5G technology is being developed and built, among other things, to satisfy our customers’ demand for fast mobile data speeds and lower latency which is being completed under increasing regulatory and government scrutiny.
Major regulatory change and stakeholder engagement
Regulatory or policy changes may directly impact our strategy and business model, as well as increase complexity and the cost of doing business. As the leading provider in a heavily-regulated industry, our products and services and the ways in which we deliver them, are subject to ongoing scrutiny from a range of regulators and agencies. We proactively maintain relationships with relevant regulatory stakeholders and policy makers, community groups and industry in an effort to ensure fair and balanced policy and regulatory decisions.
We understand the importance of clear, transparent and timely communications with our stakeholders (including customers, shareholders, investors, government and regulators) to ensure we acknowledge their views and maintain good relationships with them. We recognise if we are not successful in doing so, it may adversely affect our ability to execute our strategy. We also understand the relationship between business and society is changing in a heightened regulatory environment in light of the findings from the Hayne Royal Commission. Increasing stakeholder expectations, coupled with a decline in trust in business means it is critical we continue to conduct business in a responsible manner consistent with our stakeholders’ expectations.
The key regulatory matters currently relevant to Telstra relate to nbn network customer experience, spectrum allocation, regulatory reform, pricing of regulated services and regulatory compliance. As with any regulatory or policy changes, these matters may directly impact our strategy and business model as well as raise the risk of additional regulatory cost and complexity being imposed on our business.
Further detail about our risk management framework and how we manage our risks is provided in our 2019 Corporate Governance Statement available at www.telstra.com/governance.
Further information about our sustainability related risks is provided in our Bigger Picture 2019 Sustainability Report, available at www.telstra.com/ sustainability/report.

14
OutlookSignificant work over the past twelve months has seen strong progress on our T22 strategy. Notwithstanding the intense competitive environment and the challenging structural dynamics of our industry, underlying trends are expected to improve over the course of FY20.
While good progress on T22 has been made there remains much to do to ensure we continue to lead the Australian telecommunications market.
In the coming year the transition of customers to the nbnTM network and competition in Australia’s mobile market are expected to continue to impact revenues and profit.
We will monitor how our new and existing customers respond to our efforts to simplify and provide better value products and remove pain points and we look forward to announcing further initiatives that will set us apart from our competitors over the next year ahead.
The migration of our existing customers to the new plans and technology stack is underway, which in turn will allow us to accelerate the decommissioning of old products and technology.
The next twelve months will be an important period in our plan to monetise up to $2 billion of assets and we look forward to providing further updates on our progress. We have achieved good momentum in reducing our costs and this will remain a focus as we target a further reduction in underlying fixed costs this year.
Re-engineering how we work and do business will remain a significant focus this year as we embed new ways of working. While the majority of our major cross-company restructures and organisational design work is behind us, we will continue to see change in our workforce as part of our investments in digitisation, new technology and reduced activity within the business.
All this will occur amid a continually challenging environment.
With the rollout of the nbn network expected to be complete by the end of the 2020 calendar year, and with many premises still to connect, the next twelve months will be a critical period and we expect continued pressure on our earnings. Telstra expects a FY20 headwind of $800 million to $1 billion from the recurring impact of the nbn, the biggest in-year nbn headwind1 to date.
nbn co has also begun directly targeting the business sector as an infrastructure provider, which could also further impact our business. We will continue to advocate for a reduction in nbn wholesale prices to help ensure the long-term sustainability of the industry.
Competition in the Australian mobile market is expected to remain strong and dynamic, but also full of opportunity. Leading in 5G is an integral part of T22 and our next generation network will continue to expand, with 5G coverage growing from the 10 cities across Australia where it is currently being rolled out to reach into at least 35 in the next year ahead. Performance should also further improve with the activation of additional device and network feature enhancements. More 5G-enabled handsets and devices are expected to hit the market and we also look forward to seeing the development of new applications made possible by this revolutionary technology.
While we believe our customers will value the freedom, flexibility and simplicity of our new plans, and encourage them to consider Telstra as their go-to for more of their communication and technology needs, such fundamental changes can take time to translate into financial results. We expect mobile post-paid Average Revenue Per User (ARPU) to continue to decline into FY20 as a result of competitive pricing dynamics in the market and the decline of out-of-bundle revenue, while fixed ARPU will also continue to be impacted by intense competition as the nbn rollout progresses.
We have faced many challenges and know there will be many more ahead, but we remain very positive about Telstra’s prospects for the future. Guided by our purpose – to build a connected future so everyone can thrive – we will remain bold and determined to do everything we possibly can to transform Telstra from being a leader in the old world, to being the leader in the new world of telecommunications in Australia.
Further information in relation to our Outlook is provided in the Chairman and CEO message.
1. In-year nbn headwind defined as the net negative recurring EBITDA impact on our business based on management best estimates including key input of the nbn Corporate Plan 2019.

15
Outlook | Telstra Annual Report 2019

16
Full year results and operations review
Summary financial results
FY19FY18
restated Change
$m $m %
Revenue (excluding finance income) 25,259 25,848 (2.3)
Total income (excluding finance income) 27,807 28,841 (3.6)
Operating expenses 19,835 18,622 6.5
Share of net profit/(loss) from joint ventures and associated entities 12 (22) n/m
EBITDA 7,984 10,197 (21.7)
Depreciation and amortisation 4,282 4,470 (4.2)
EBIT 3,702 5,727 (35.4)
Net finance costs 630 588 7.1
Income tax expense 923 1,582 (41.7)
Profit for the period 2,149 3,557 (39.6)
Profit attributable to equity holders of Telstra 2,154 3,591 (40.0)
Capex1 4,140 4,717 (12.2)
Free cashflow 3,068 4,695 (34.7)
Earnings per share (cents) 18.1 30.2 (40.1)
1. Capex is defined as additions to property, equipment and intangible assets including capital lease additions, excluding expenditure on spectrum, measured on an accrued basis. Capex excludes externally funded capex.

17
Full year results and operations review | Telstra Annual Report 2019
Reported results
Our FY19 results show our focus on building value and growth, improved customer experience, and ongoing momentum in our cost reduction efforts, while also reflecting the impact of the nbn rollout and competitive headwinds.
For commentary on our key results and market context, please refer to the Chairman and CEO message. Detail on our FY19 highlights and progress against our T22 strategy can be found in Strategy and performance. FY18 results have been restated to account for the adoption of AASB15 – refer to Note 1.5 in the Financial Report for further detail. The definition of “underlying earnings” now excludes guidance adjustments – refer to the dividend discussion below for further detail.
On 15 August 2019, the Directors of Telstra Corporation Limited resolved to pay a fully franked final dividend of 8 cents per share, comprising a final ordinary dividend of 5 cents and a final special dividend of 3 cents. Shares will trade excluding entitlement to the dividends from 28 August 2019 with payment on 26 September 2019.
The total dividend for FY19 is 16 cents per share, fully franked, including 10 cents ordinary and 6 cents special. The ordinary dividend represents a 59 per cent payout ratio on FY19 underlying earnings1 while the special dividend represents a 63 per cent payout ratio of FY19 net one-off nbn receipts2. The FY19 ordinary dividend is below the payout ratio of 70 to 90 per cent of underlying earnings which is one of the principles in our capital management framework. In our updated capital management framework, underlying earnings now explicitly exclude guidance adjustments as well as net one-off nbn receipts. In determining the FY19 final ordinary dividend, the Board has taken into account a number of factors including the overall capital management framework objectives including maintenance of financial strength and retaining financial flexibility. Our FY19 underlying earnings were $2,019 million while net one-off nbn receipts were $1,129 million.
1. “underlying earnings” is defined as net profit after tax from continuing operations excluding net one-off nbn receipts (as defined in footnote 2) and guidance adjustments (as defined in footnote 3).
2. “net one-off nbn receipts” is defined as net one-off nbn Definitive Agreement (nbn DA) receipts (consisting of Per Subscriber Address Amount (PSAA), Infrastructure Ownership and Retraining) less nbn net cost to connect less tax.
3. Guidance adjustments include one-off restructuring costs, impairments in and to investments or property, plant and equipment and intangible assets, proceeds on the sale of businesses, mergers and acquisitions and purchase of spectrum.
Results on a guidance basis1 FY19 FY19 Guidance2
Total income3 $27.8b $26.2b to $28.1b
EBITDA excluding restructuring costs $9.4b $8.7b to $9.4b
Net one-off nbn DA receipts less nbn net cost to connect
$1.6b $1.5b to $1.7b
Restructuring costs $0.8b ~$0.8b4
Capex $4.1b $3.9b to $4.4b
Free cashflow $3.2b Lower end of $3.1b to $3.6b5
1. This guidance assumed wholesale product price stability and no impairments to investments or core assets, and excluded any proceeds on the sale of businesses, mergers and acquisitions and purchase of spectrum. The guidance also assumed the nbn™ rollout and migration in FY19 was broadly in accordance with the nbn Corporate Plan 2019. The guidance was provided on the basis of AASB15. Capex was measured on an accrued basis and excluded expenditure on spectrum and externally funded capex. Refer to the Guidance versus reported results schedule. This reconciliation has been reviewed by our auditors.
2. FY19 guidance revised on 6 September 2018 after nbn co released the nbn Corporate Plan 2019.3. Total income excludes finance income.4. Revised to be around $0.8b on 29 May 2019.5. Revised to be at the lower end of $3.1b to $3.6b on 14 February 2019.
Guidance versus reported results1
FY19 FY19 FY19FY18
restated
Reported results $m
Adjustments $m
Guidance basis $m
Guidance basis $m
Total income2 27,807 (3) 27,804 28,542
EBITDA 7,984 1,3823 9,366 10,568
Free cashflow 3,068 118 3,186 4,873
1. This guidance assumed wholesale product price stability and no impairments to investments or core assets, and excluded any proceeds on the sale of businesses, mergers and acquisitions and purchase of spectrum. The guidance also assumed the nbn™ rollout and migration in FY19 was broadly in accordance with the nbn Corporate Plan 2019. The guidance was provided on the basis of AASB15. Capex was measured on an accrued basis and excluded expenditure on spectrum and externally funded capex. Refer to the Guidance versus reported results schedule. This reconciliation has been reviewed by our auditors.
2. Total income excludes finance income.3. FY19 EBITDA guidance adjustments include $801 million restructuring costs and $493 million asset impairment. Refer to the Guidance
versus reported results schedule.
18
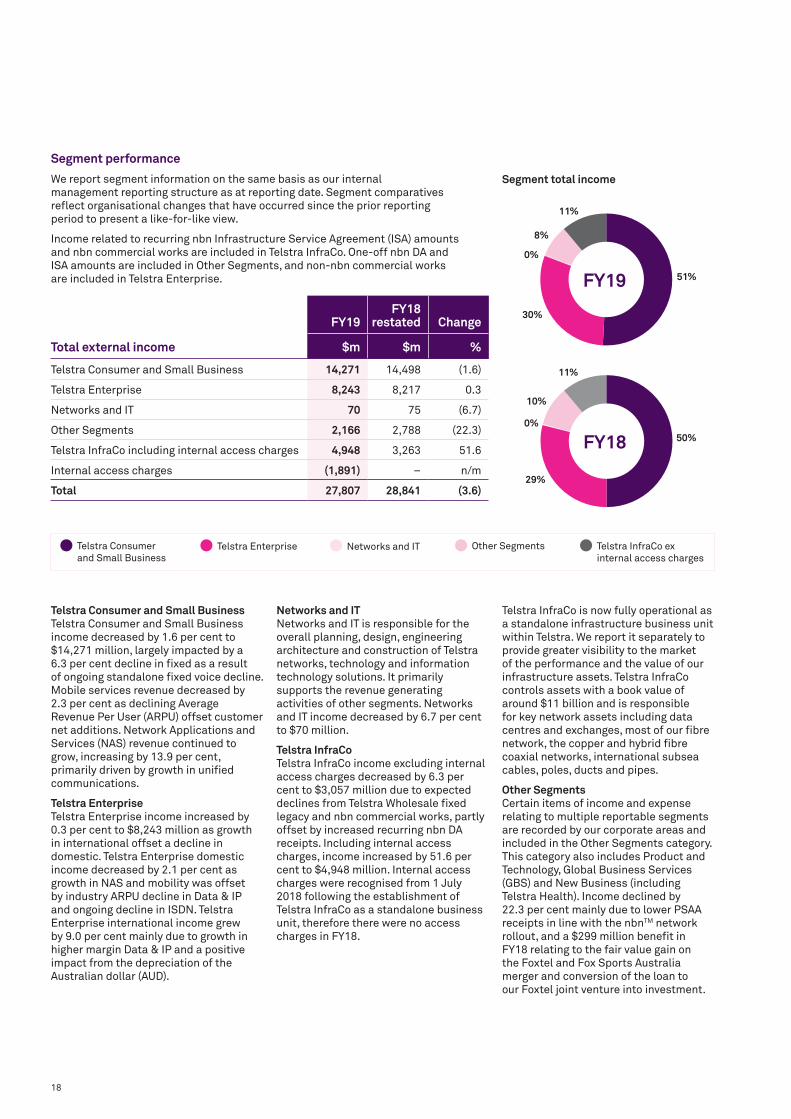
Segment performance
We report segment information on the same basis as our internal management reporting structure as at reporting date. Segment comparatives reflect organisational changes that have occurred since the prior reporting period to present a like-for-like view.
Income related to recurring nbn Infrastructure Service Agreement (ISA) amounts and nbn commercial works are included in Telstra InfraCo. One-off nbn DA and ISA amounts are included in Other Segments, and non-nbn commercial works are included in Telstra Enterprise.
Telstra Consumer and Small BusinessTelstra Consumer and Small Business income decreased by 1.6 per cent to $14,271 million, largely impacted by a 6.3 per cent decline in fixed as a result of ongoing standalone fixed voice decline. Mobile services revenue decreased by 2.3 per cent as declining Average Revenue Per User (ARPU) offset customer net additions. Network Applications and Services (NAS) revenue continued to grow, increasing by 13.9 per cent, primarily driven by growth in unified communications.
Telstra EnterpriseTelstra Enterprise income increased by 0.3 per cent to $8,243 million as growth in international offset a decline in domestic. Telstra Enterprise domestic income decreased by 2.1 per cent as growth in NAS and mobility was offset by industry ARPU decline in Data & IP and ongoing decline in ISDN. Telstra Enterprise international income grew by 9.0 per cent mainly due to growth in higher margin Data & IP and a positive impact from the depreciation of the Australian dollar (AUD).
Networks and ITNetworks and IT is responsible for the overall planning, design, engineering architecture and construction of Telstra networks, technology and information technology solutions. It primarily supports the revenue generating activities of other segments. Networks and IT income decreased by 6.7 per cent to $70 million.
Telstra InfraCoTelstra InfraCo income excluding internal access charges decreased by 6.3 per cent to $3,057 million due to expected declines from Telstra Wholesale fixed legacy and nbn commercial works, partly offset by increased recurring nbn DA receipts. Including internal access charges, income increased by 51.6 per cent to $4,948 million. Internal access charges were recognised from 1 July 2018 following the establishment of Telstra InfraCo as a standalone business unit, therefore there were no access charges in FY18.
Telstra InfraCo is now fully operational as a standalone infrastructure business unit within Telstra. We report it separately to provide greater visibility to the market of the performance and the value of our infrastructure assets. Telstra InfraCo controls assets with a book value of around $11 billion and is responsible for key network assets including data centres and exchanges, most of our fibre network, the copper and hybrid fibre coaxial networks, international subsea cables, poles, ducts and pipes.
Other SegmentsCertain items of income and expense relating to multiple reportable segments are recorded by our corporate areas and included in the Other Segments category. This category also includes Product and Technology, Global Business Services (GBS) and New Business (including Telstra Health). Income declined by 22.3 per cent mainly due to lower PSAA receipts in line with the nbnTM network rollout, and a $299 million benefit in FY18 relating to the fair value gain on the Foxtel and Fox Sports Australia merger and conversion of the loan to our Foxtel joint venture into investment.
Total external income
FY19FY18
restated Change
$m $m %
Telstra Consumer and Small Business 14,271 14,498 (1.6)
Telstra Enterprise 8,243 8,217 0.3
Networks and IT 70 75 (6.7)
Other Segments 2,166 2,788 (22.3)
Telstra InfraCo including internal access charges 4,948 3,263 51.6
Internal access charges (1,891) – n/m
Total 27,807 28,841 (3.6)
Segment total income
Telstra Consumer and Small Business
Telstra InfraCo ex internal access charges
Other SegmentsNetworks and ITTelstra Enterprise
11%
8%
0%
30%
51%FY19
11%
10%
0%
29%
50%FY18

19
Full year results and operations review | Telstra Annual Report 2019
On a reported basis, total income (excluding finance income) declined by 3.6 per cent to $27,807 million. On a guidance basis, total income (excluding finance income) declined by 2.6 per cent to $27,804 million in line with FY19 guidance and market expectations. Income continues to be impacted by competitive pressure across all products and markets, accelerated decline in legacy products and services, and negative impacts from the nbnTM network rollout. The decline has been partly offset by continued growth in mobile and fixed customer services.
More detail on each of the products are outlined below.
Product performance
Product revenue breakdown
Key product revenue
FY19FY18
restated Change
$m $m %
Mobile 10,545 10,380 1.6
Fixed 5,223 5,765 (9.4)
Data & IP 2,358 2,556 (7.7)
NAS 3,477 3,627 (4.1)
Global connectivity 1,700 1,569 8.3
EBITDA margins1FY19
%2H19
%1H19
%FY18
restated %
Mobile 34 33 35 38
Fixed (including nbn cost to connect)
19 16 22 30
Data & IP 63 62 64 64
NAS 10 16 2 10
Global connectivity 19 19 19 19
1. The data in this table includes minor adjustments to historic numbers to reflect changes in product hierarchy. Product EBITDA restated due to accounting changes and review of fixed cost allocation methodologies to products. Mobile and fixed restated to include International network costs previously included in Other.
Mobile Global connectivity Media OtherNASData & IPFixed
FY18
4%4%6%
14%
10%
22%
40%
21%
FY19
4%3%7%
14%
9%
42%

20
Domestic mobile retail customer services
(millions)
FY17
17.417.7
18.3
FY18 FY19
Mobile
Mobile revenue increased by 1.6 per cent to $10,545 million with growth across hardware, postpaid handheld, Internet of Things (IoT) and wholesale, partly offset by prepaid handheld and mobile broadband declines.
Retail customer services increased by 622,000, bringing the total to 18.3 million. We now have 8.2 million postpaid handheld retail customer services, an increase of 378,000 including 181,000 from Belong.
Postpaid handheld revenue increased by 1.2 per cent to $5,294 million due to continued net add momentum, partly offset by 3.1 per cent ARPU decline from $56.53 to $54.77 resulting from lower out of bundle revenue, Minimum Monthly Commitment (MMC) decline, and an increasing mix of lower Belong customer ARPU causing dilution. ARPU declines are expected to continue into FY20 largely due to a further decline of approximately $200 million in out of bundle revenue.Prepaid handheld revenue declined by 13.5 per cent to $829 million impacted by lower ARPU, increased competition, and migration to postpaid, Belong and wholesale. ARPU decline of 8.7 per cent from $22.75 to $20.76 was compounded by a 49,000 reduction in unique users.
Mobile broadband revenue decreased by 14.0 per cent to $673 million after a decline in ARPU and reduction of 266,000 customer services in postpaid and prepaid.
IoT revenue grew by 19.4 per cent to $203 million, increasing customer services by 561,000 due to the introduction of new IoT products including Telstra Locator, and the launch of a commercial vehicle product and digital water metering solution.
Wholesale services revenue increased 6.3 per cent to $201 million. Wholesale customer services increased by 230,000, bringing the total to 1.2 million.
Mobile hardware revenue increased by 10.0 per cent to $3,106 million largely due to devices sold at a higher price per unit.
Mobile EBITDA margin declined by 3.9 percentage points to 34 per cent due to lower services revenue and hardware margin, partly offset by fixed cost reduction.
FixedFixed revenue declined by 9.4 per cent to $5,223 million, impacted by nbn migration, competition and ongoing legacy decline.
Bundles and standalone data revenue declined by 0.3 per cent to $3,290 million due to a 3.0 per cent ARPU decline from $77.37 to $75.07 caused by lower value added services and voice billed usage. MMC revenue grew with bundle and standalone data revenue now more than 98 per cent MMC. There were 107,000 retail bundles and standalone data net subscriber additions including 51,000 from Belong, bringing the total bundles and standalone data customers to 3.7 million.
Standalone voice revenue decreased by 25.7 per cent to $881 million with lower services in operation (SIO) and usage due to standalone voice line abandonment and migration to bundles. ARPU declined by 1.2 per cent from $44.16 to $43.62. There were 542,000 retail standalone voice net subscriber losses taking total standalone voice customers to 1.4 million.
We continue to lead the nbn market with a total of 2,605,000 nbn connections, an increase of 659,000. Our nbn market share is now 49 per cent (excluding satellite). The Telstra Smart Modem is now being utilised by 44 per cent of our fixed data consumer base, providing a better experience on the nbn and improved churn outcomes.
Other retail fixed revenue, which includes platinum, once off revenue (hardware and professional installation fees), payphones directory assistance and fixed interconnect, decreased by 8.2 per cent to $247 million.
Fixed (including nbn cost to connect) EBITDA margin declined by 10.2 percentage points to 19 per cent due to high margin revenue reduction, growing network payments to nbn co and nbn migration costs, partly offset by fixed cost reduction.
Data & IPData & IP revenue decreased by 7.7 per cent to $2,358 million reflecting competitive pricing pressures, technology shifts, and legacy product declines especially in ISDN, despite continued growth in IP based Virtual Private Network (IPVPN) service volumes.
IPVPN revenue, which includes IPMAN/Ethernet MAN, IPWAN and nbn, declined by 6.4 per cent to $996 million as SIO growth in fibre and nbn access was outweighed by declines in legacy copper services and continued competitive pressure on yield.
ISDN revenue decline accelerated, down 17.8 per cent to $387 million due to service rationalisation of legacy products and customer migrations to equivalent voice products within the NAS portfolio.
Other data and calling products revenue decreased by 4.5 per cent to $975 million including a 2.6 per cent decline in wholesale. Enterprise internet growth of 10.2 per cent was offset by declines in legacy inbound calling and data products, and media solutions.
Data & IP EBITDA margin declined by 0.9 percentage points to 63 per cent reflecting declining revenue on high margin products including ISDN and pricing pressure in IPVPN. Margins will increasingly be impacted by the resale of nbn at lower margins.
Network Applications and Services (NAS)NAS revenue declined by 4.1 per cent to $3,477 million impacted by lower nbn commercial works and integrated services. Excluding nbn commercial works, revenue grew by 2.0 per cent with 13.9 per cent growth in Small Business and 0.8 per cent growth in domestic Enterprise due to a higher mix of annuity revenue.
Managed network services revenue decreased by 4.0 per cent to $648 million, reflecting a decline in non-recurring revenue within managed data networks, partly offset by a 31.9 per cent growth in security services.

21
Full year results and operations review | Telstra Annual Report 2019
Unified communications revenue increased by 14.0 per cent to $1,009 million due to increased calling and collaboration annuity revenue reflecting new service growth and fixed migration, in addition to growth in Enterprise professional services revenue.
Cloud services revenue growth of 0.5 per cent to $430 million includes increased annuity revenue from public cloud services offset by lower professional services and customer premises equipment.
Industry solutions revenue declined by 13.8 per cent to $1,184 million largely due to a reduction in nbn commercial works.
Integrated services revenue declined by 22.3 per cent to $206 million mainly from a decline in consulting and project management, and timing of project revenues.
NAS EBITDA margin declined by 0.6 percentage points to 10 per cent reflecting a change in revenue mix including a decline in nbn commercial works revenues and contract timing impacts. NAS has historically seen seasonality in periods which was evident in FY19 with a 2.5 per cent margin in 1H19 and a 15.5 per cent margin in 2H19. The strong performance in 2H19 reflected better revenue mix.
Global connectivityGlobal connectivity represents the international business of Telstra Enterprise. Revenue grew by 2.1 per cent in constant currency (CC) terms with growth in more profitable Data & IP products offset by declining legacy voice revenues.
Fixed revenue increased by 0.1 per cent (CC), performing solidly in a declining market. Data & IP revenue grew by 3.2 per cent (CC) from existing and new capacity, while NAS revenue increased by 0.3 per cent with growth in professional services, cloud services and unified communications, offset by pricing pressure in co-location.
Global connectivity EBITDA margin increased by 0.9 percentage points to 19 per cent reflecting continued profitable revenue growth and cost productivity.
MediaMedia revenue excluding cable decreased by 7.2 per cent to $797 million due to the performance of Foxtel from Telstra, which declined by 5.4 per cent to $664 million and had 60,000 subscriber exits, reflecting a broader industry transition from Broadcast to IPTV. There are now 1,546,000 Telstra TV devices in the market, an increase of 256,000. Sports Live Pass users increased by 757,000 to 3,058,000 across AFL, NRL, Netball and FFA, with most users receiving the service as part of their mobile subscription.
OtherOther revenue includes recurring revenue related to nbn co access to our infrastructure (nbn DA), and revenue from other products such as late payment fees and revenue from Telstra Health and Telstra Software.
Other income includes gains and losses on asset and investment sales (including assets transferred under the nbn DAs), income from government grants under the Telstra Universal Service Obligation Performance Agreement (TUSOPA), income from nbnTM network disconnection fees (PSAA), subsidies and other miscellaneous items. The decrease in other income of 14.9 per cent is largely due to a decline in one-off PSAA which decreased by 9.5 per cent to $1,611 million and a $299 million benefit in FY18 relating to Foxtel (refer to Other Segments in Segment performance), partly offset by a 4.3 per cent increase in ISA income to $387 million in line with the progress of the nbn network rollout. The decline in PSAA receipts from the nbn reflects nbn migrations in the period.
Expense performance
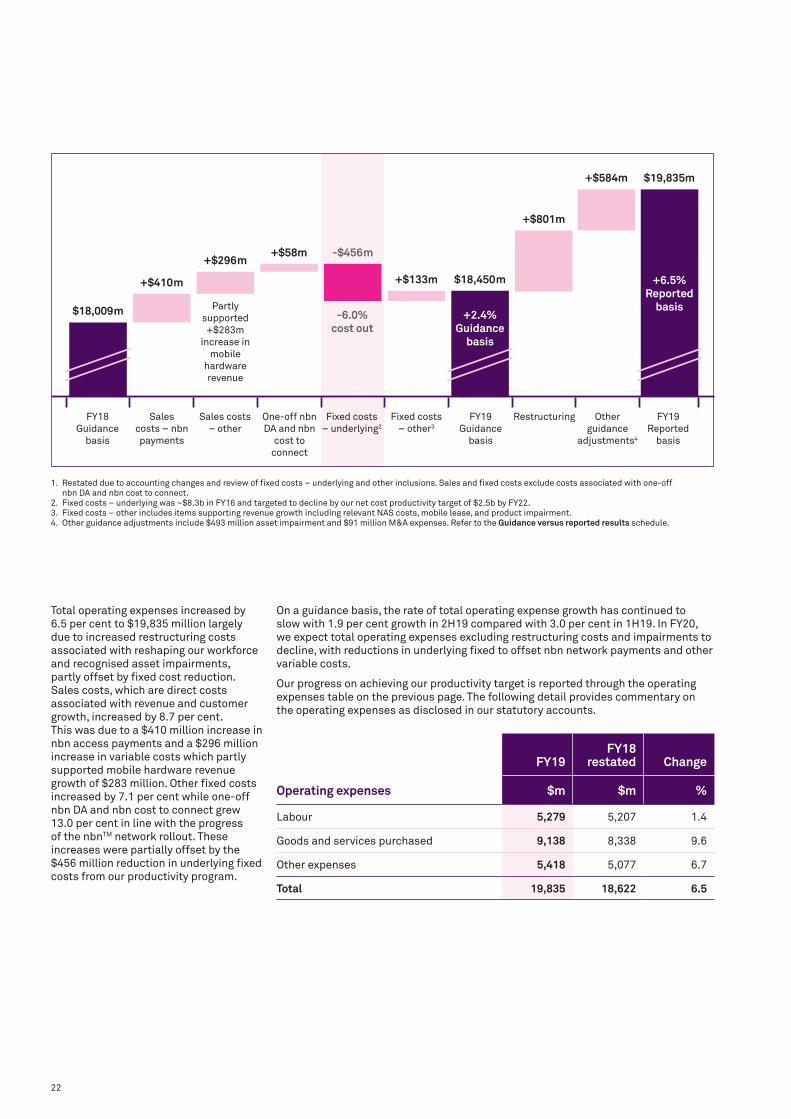
In June 2018, we announced we would target a $2.5 billion annual reduction in underlying fixed costs by FY22 compared with underlying fixed costs of ~$8.3 billion in base year FY16. We have delivered against our cost ambitions for the year and are in line with the run rate required for our net productivity target with underlying fixed costs declining by 6.0 per cent or $456 million. We have now achieved around $1.2 billion of annual cost out since FY16.
Operating expenses1FY19
$m
FY18 restated
$m
Change
$m %
Sales costs 8,831 8,125 706 8.7
– nbn payments 1,351 941 410 43.6
– other 7,480 7,184 296 4.1
One-off nbn DA and nbn cost to connect 503 445 58 13.0
Fixed costs 9,116 9,439 (323) (3.4)
– underlying2 7,105 7,561 (456) (6.0)
– other3 2,011 1,878 133 7.1
Guidance basis 18,450 18,009 441 2.4
Restructuring 801 286 515 n/m
Other guidance adjustments4 584 327 257 n/m
Reported basis 19,835 18,622 1,213 6.5
22
Total operating expenses increased by 6.5 per cent to $19,835 million largely due to increased restructuring costs associated with reshaping our workforce and recognised asset impairments, partly offset by fixed cost reduction. Sales costs, which are direct costs associated with revenue and customer growth, increased by 8.7 per cent. This was due to a $410 million increase in nbn access payments and a $296 million increase in variable costs which partly supported mobile hardware revenue growth of $283 million. Other fixed costs increased by 7.1 per cent while one-off nbn DA and nbn cost to connect grew 13.0 per cent in line with the progress of the nbnTM network rollout. These increases were partially offset by the $456 million reduction in underlying fixed costs from our productivity program.
Operating expenses
FY19FY18
restated Change
$m $m %
Labour 5,279 5,207 1.4
Goods and services purchased 9,138 8,338 9.6
Other expenses 5,418 5,077 6.7
Total 19,835 18,622 6.5
1. Restated due to accounting changes and review of fixed costs – underlying and other inclusions. Sales and fixed costs exclude costs associated with one-off nbn DA and nbn cost to connect.
2. Fixed costs – underlying was ~$8.3b in FY16 and targeted to decline by our net cost productivity target of $2.5b by FY22.3. Fixed costs – other includes items supporting revenue growth including relevant NAS costs, mobile lease, and product impairment.4. Other guidance adjustments include $493 million asset impairment and $91 million M&A expenses. Refer to the Guidance versus reported results schedule.
Other guidance
adjustments4
FY18 Guidance
basis
Sales costs – nbn payments
Partly supported +$283m
increase in mobile
hardware revenue
-6.0% cost out
Sales costs – other
One-off nbn DA and nbn
cost to connect
Fixed costs – underlying2
Fixed costs – other3
FY19 Guidance
basis
Restructuring FY19 Reported
basis
$18,009m
+$410m
+$296m+$58m -$456m
+$133m $18,450m
+$801m
+$584m $19,835m
+2.4% Guidance
basis
+6.5% Reported
basis
On a guidance basis, the rate of total operating expense growth has continued to slow with 1.9 per cent growth in 2H19 compared with 3.0 per cent in 1H19. In FY20, we expect total operating expenses excluding restructuring costs and impairments to decline, with reductions in underlying fixed to offset nbn network payments and other variable costs.
Our progress on achieving our productivity target is reported through the operating expenses table on the previous page. The following detail provides commentary on the operating expenses as disclosed in our statutory accounts.

23
Full year results and operations review | Telstra Annual Report 2019
LabourTotal labour expenses increased by 1.4 per cent or $72 million to $5,279 million. Redundancy costs increased by $479 million largely as a result of the T22 strategy restructure, partially offset by a $407 million decrease in salary costs due to lower headcount and reduced labour substitution.
Total full time staff and equivalents (FTE) decreased by 14.0 per cent or 4,855 to 29,769. We expect to realise the full financial benefits of these FTE reductions in FY20.
Goods and services purchasedTotal goods and services purchased increased by 9.6 per cent or $800 million to $9,138 million.
Cost of goods sold, which includes mobile handsets, tablets, cellular Wi-Fi, broadband modems and NAS hardware, increased by 6.2 per cent or $220 million to $3,771 million as mobile hardware costs increased due to more expensive handsets being sold.
Network payments increased by 23.1 per cent or $524 million to $2,791 million, including a $410 million increase in nbn access payments as customers migrate across to nbn services. Offshore network payments were $117 million higher mainly due to higher offshore network traffic.
Other goods and services purchased costs increased by 2.2 per cent or $56 million to $2,576 million mainly due to an $87 million increase in service contracts and agreements in support of NAS services.
Other expensesTotal other expenses increased by 6.7 per cent or $341 million to $5,418 million. Impairment expenses increased by 23.6 per cent or $151 million largely due to a $493 million non-cash impairment of our legacy IT assets as a result of making good progress in standing up our new IT platforms as part of our T22 strategy. Service contracts and other agreements expenses declined by 5.2 per cent or $87 million driven lower by productivity and cost reduction programs, while other expenses increased by 10.0 per cent or $277 million including mobile lease plans.
Depreciation and amortisationDepreciation and amortisation decreased by 4.2 per cent or $188 million to $4,282 million. Review of asset service lives during the year resulted in a $253 million decrease in depreciation expense and a $130 million decrease in amortisation expense.
Foreign currency impactsFor the purposes of reporting our consolidated results, the translation of foreign operations denominated in foreign currency to AUD increased our expenses by $125 million across labour, goods and services purchased, and other expenses. This foreign exchange impact was offset by a $135 million sales revenue increase resulting in a favourable EBITDA contribution of $10 million.
Net finance costsNet finance costs increased by 7.1 per cent or $42 million to $630 million due to an increase in net borrowing costs of $30 million and other net finance cost impacts of $12 million. The increase in net borrowing costs was primarily from a reduction in interest revenue from our joint venture loan asset to Foxtel Management Pty Ltd which was converted to an equity instrument in FY18, an increase in finance lease interest costs, and refinancing short term debt with long term debt. Our gross borrowing yield remains flat at 4.9 per cent. The increase in other net finance costs was largely from non-cash market valuation adjustments on our financial instruments.
Summary statement of cash flows
FY19FY18
restated Change
$m $m %
Net cash provided by operating activities 6,683 8,606 (22.3)
Net cash used in investing activities (3,615) (3,911) 7.6
– Capital expenditure (before investments) (4,370) (4,932) 11.4
– Other investing cash flows 755 1,021 (26.1)
Free cashflow 3,068 4,695 (34.7)
Net cash used in financing activities (3,088) (5,015) 38.4
Net (decrease) in cash and cash equivalents (20) (320) 93.8
Cash and cash equivalents at the beginning of the period 620 936 (33.8)
Effects of exchange rate changes on cash and cash equivalents 4 4 n/m
Cash and cash equivalents at the end of the period 604 620 (2.6)

24
Summary statement of financial position
30 Jun 191 Jul 18
restated1 Change
$m $m %
Current assets 7,303 7,202 1.4
Non-current assets 35,286 35,432 (0.4)
Total assets 42,589 42,634 (0.1)
Current liabilities 9,553 8,785 8.7
Non-current liabilities 18,506 19,293 (4.1)
Total liabilities 28,059 28,078 (0.1)
Net assets 14,530 14,556 (0.2)
Total equity 14,530 14,556 (0.2)
Return on average assets (%) 8.8 13.8 (5.0)pp
Return on average equity (%) 14.8 25.0 (10.2)pp
1. Opening balance of 1 July 2018 used versus 30 June 2018 due to AASB9 restatements going through opening balances only.
Financial position
Capital expenditure and cash flowFree cashflow generated from operating and investing activities was $3,068 million representing a decline of $1,627 million or 34.7 per cent. This was largely due to lower EBITDA including increased restructuring costs and working capital, partly offset by lower cash capital expenditure and tax paid.
Net cash provided by operating activities decreased by 22.3 per cent to $6,683 million mainly due to a decrease in one-off nbn receipts in line with the progress of the nbnTM network rollout and an increase in payments to suppliers and employees. This was partly offset by a reduction in income taxes paid. The decrease in net cash used in investing activities primarily reflects lower capital expenditure for the period. The $1,927 million decrease in net cash used in financing activities reflects higher funding from borrowings and lower dividend paid.
Our accrued capital expenditure for the year on a guidance basis was $4,140 million or 17.0 per cent of sales revenue. We have now completed our strategic investment program which we announced in August 2016, having invested $2.6 billion building the networks of the future and digitising the business. We are now moving the ongoing initiatives and investments into business as usual of our mid-term capex to sales ratio of 14 per cent.
On a guidance basis free cashflow was $3,186 million. Performance against guidance has been adjusted for free cashflow associated with M&A activity ($89 million) and spectrum ($29 million).
Financial settings
FY19Actual
FY19Comfort
zone
Debt servicing1 1.8x 1.3 to 1.8x
Gearing2
50.3% 50% to 70%
Interest cover3 10.5x >7x
1. Debt servicing ratio is calculated as net debt/EBITDA.
2. Gearing ratio is calculated as net debt/total net debt plus equity.
3. Interest cover is calculated as EBITDA/net interest on borrowings.
Debt position Our gross debt position was $15,331 million comprising borrowings of $17,253 million and net derivative assets of $1,922 million. Gross debt declined by 0.2 per cent or $37 million due to a $47 million debt reduction from financing cash outflow and a $9 million bank overdraft reduction, offset by a $19 million increase in finance leases and other non-cash revaluation impacts on our borrowings and derivatives. Financing cash outflow comprises debt issuance of $1,570 million less debt repayments of $1,617 million.
Debt repayments $m
Bonds (752)
Short term commercial paper (net)
(537)
Revolving bank facilities (net)
(200)
Loans (39)
AUD private placements (10)
Finance leases (79)
Total (1,617)
Debt issuance $m
10 year EUR bond 959
1 year AUD floating rate note 300
7 year bilateral loan facility 300
Other current loans 11
Total 1,570
Net debt decreased by 0.1 per cent or $12 million to $14,727 million, comprising the reduction in gross debt and a $25 million reduction in cash and cash equivalents. Net of bank overdraft our cash decreased by $16 million.
We remain within our comfort ranges for all our credit metrics. Our gearing ratio is at 50.3 per cent (30 June 2018: 50.2 per cent), debt servicing is 1.8 times (30 June 2018: 1.5 times), and interest cover is 10.5 times (30 June 2018: 14.0 times). On an adjusted basis, excluding restructuring costs from EBITDA, our debt servicing would be 1.7 times at 30 June 2019.

25
Statement of financial positionOur balance sheet remains in a strong position with net assets of $14,530 million.
Current assets increased by 1.4 per cent to $7,303 million. Assets classified as held for sale increased by $121 million and derivative financial assets increased by $104 million reflecting an increase in derivatives maturing within 12 months associated with hedges of our offshore bonds, partly offset by a $108 million reduction in trade and other receivables.
Non-current assets decreased by 0.4 per cent to $35,286 million. Intangible assets declined by $712 million mainly due to a $493 million non-cash impairment and
write down of the value of our legacy IT assets as a result of good progress on our T22 strategy. This was partly offset by a $224 million increase in property, plant and equipment driven by mobile and Network 2020 investment, and a $186 million increase in derivative financial assets due to foreign currency movements and other valuation impacts arising from measuring to fair value, offset by reclassification of some derivatives to current assets.
Current liabilities increased by 8.7 per cent to $9,553 million. Borrowings increased by $587 million resulting from an increase in term debt maturing within 12 months, offset by a reduction in short-
term borrowings. Debt maturing within 12 months largely comprises a €1 billion Euro bond and an AUD 300 million floating rate note. Contract liabilities and other revenue received in advance increased by $125 million.
Non-current liabilities decreased by 4.1 per cent to $18,506 million. Contract liabilities and other revenue received in advance declined by $410 million. Borrowings decreased by $285 million reflecting a reclassification to current liabilities of debt maturing within the next 12 months and repayment of revolving bank facilities, offset by term debt issuance, foreign currency and other valuation impacts.
Full year results and operations review | Telstra Annual Report 2019

26
Nora L Scheinkestel Niek Jan van Damme
Board of Directors
John P MullenAge 64, BSc
Non-executive Director since July 2008, Chairman effective 27 April 2016 and last re-elected in 2017. Chairman of the Nomination Committee and previously Chairman of the Remuneration Committee (2009-2016). John has extensive experience in international transportation and logistics, with more than two decades in senior positions with some of the world’s largest transport and infrastructure companies. He has lived or worked in 13 countries over this time.
John is currently Executive Chairman of the Toll Group and a director of Brookfield Infrastructure. From 2011 to 2017 John was Chief Executive Officer of Asciano, Australia’s largest ports and rail operator. Prior to this, John spent 15 years with DHL Express, a US$20b company employing over 140,000 people in 220 countries, serving as the global Chief Executive Officer from 2005 to 2009.
Prior to DHL, John spent ten years with the TNT Group, with four years from 1991 to 1994 as Chief Executive Officer of TNT Express Worldwide based in the Netherlands. Former directorships include Brambles Ltd and Macquarie Airports Corporation. John was also Chairman of the US National Foreign Trade Council in Washington from 2008 to 2010.
Directorships of listed companies (past three years) and other directorships/appointments: Director, Brookfield Infrastructure Partners L.P (from 2017), Asciano Ltd (2011-2016). Other: Chairman, Toll Group (from 2016), Australian National Maritime Foundation (from 2015). Councillor, Australian National Maritime Museum (from 2016). Director Kimberley Foundation Australia Limited (from 2016). Member, UNICEF Task Force on Workplace Gender Discrimination and Harassment (from 2018) and UNSW Business School Advisory Council (from 2005).
Andrew R PennAge 56, MBA (Kingston), AMP (Harvard), FCCA, HFAIPM
Chief Executive Officer and Managing Director since 1 May 2015. Andy Penn became the CEO and Managing Director of Telstra, Australia’s largest telecommunications company, on 1 May 2015. At Telstra Andy is leading an ambitious change program transforming Telstra to be positioned to compete in the radically changing technology world of the future with 5G at its core.
Andy has had an extensive career spanning 40 years across 3 different industries – telecommunications, financial services and shipping. He joined Telstra in 2012 as Chief Financial Officer. In 2014 he took on the additional responsibilities as Group Executive International.
Prior to Telstra, Andy spent 23 years with AXA Asia Pacific Holdings, part of the AXA Group, one of the world’s largest insurance and investment groups. His time at AXA included the roles of Chief Executive Officer 2006-2011, Chief Financial Officer 2000-2002, Chief Executive Asia and Chief Executive Australia and New Zealand. At AXA, Andy was instrumental in building one of the most successful Asian businesses by an Australian company that was sold to its parent in 2011 for more than A$10bn.
Other directorships/appointments: Board Director of the Groupe Speciale Mobile Association (GSMA) (from 2018), Patron, on behalf of Telstra, of the National and Torres Straights Islanders Arts Awards (NATSIAA), Life Governor of Very Special Kids (from 2003) and an Ambassador for the Amy Gillet Foundation. He serves on the advisory boards of both The Big Issue Home for Homes and Juvenile Diabetes Research Foundation.
Eelco BlokAge 62, MS, BBA
Non-executive Director appointed 15 February 2019. Member of the Nomination Committee. Eelco has almost 35 years of telecommunications experience at Dutch-based landline and mobile telecommunications company, KPN, where he was CEO for seven years until April 2018.
Andrew R Penn Eelco Blok
Craig W Dunn Peter R Hearl
John P Mullen
Roy H Chestnutt
Margaret L Seale

27
Board of Directors | Telstra Annual Report 2019
Eelco started his career in Finance at KPN before becoming responsible for several businesses including Carrier Services, Corporate Networks and Network Operations.
In 2006 he was appointed a member of the KPN Board of Management, where he was consecutively responsible for the Fixed Division, Business Market – Wholesale – Operations and Mobile International. He was appointed CEO in April 2011.
From 2011 to 2017 Eelco was co-chairman of the Dutch National Cyber Security Council, an advisory body of the Dutch government. He was also a Director for the international association GSMA from 2017 to April 2018.
Directorships of listed companies (past three years) and other directorships/appointments:Member of the Supervisory Boards of Post NL (from 2017), Signify NV (from 2017) and Koninklijke VolkerWessels N.V (from 2019). Director, OTE Group (from 2019). Other: Advisor, Reggeborgh Groep BV (from 2018). Member, Dutch Sports Council, an advisory Board of the Dutch Government (from 2019).
Roy H ChestnuttAge 60, BSc, BA, MBA
Non-executive Director appointed 11 May 2018 and elected on 16 October 2018. Member of the Audit & Risk Committee and the Nomination Committee. Roy has more than 30 years of direct telecommunications experience. Most recently he was Executive Vice President, Chief Strategy Officer for Verizon Communications and has held leadership positions with other leading firms including Motorola, Grande Communications, Sprint-Nextel and AirTouch. Roy’s last six years with Verizon included almost five as head of strategy responsible for the development and implementation of Verizon’s overall corporate strategy, including business development, joint ventures, strategic investments, acquisitions and divestitures.
Roy has been a Director for international industry association GSMA and is a former chair of the Chief Strategy Officers Group including 25 global strategists from the world’s leading wireless carriers. He is also a senior advisor at Blackstone and VMware Inc, and a board member for Saudi Telecom and Digital Turbine.
Directorships of listed companies (past three years) and other directorships/appointments: Director, Boingo Wireless, Inc (from 2019), Saudi Telecom (from 2018) and Digital Turbine Inc (from 2018). Other: Non-executive Partner, Delta Partners.
Craig W Dunn Age 55, BCom, FCA
Non-executive Director appointed 12 April 2016. Chairman of the Audit & Risk Committee and member of the Nomination Committee. Craig is a highly regarded business leader with more than 20 years’ experience in financial services, pan-Asian business activities and strategic advice for government and major companies.
Craig was Chief Executive Officer and Managing Director of AMP from 2008 to 2013 and held various roles at AMP in a 13-year career, including Managing Director of AMP Financial Services, Managing Director for AMP Bank and head of Corporate Strategy and M&A.
Previously he was at Colonial Mutual Group from 1991 to 2000, including Managing Director for EON CMB Life Insurance in Malaysia and senior roles in Group Strategy, M&A and Finance. He has also served as a member of the Federal Government’s Financial System Inquiry in 2014 and the Consumer and Financial Literacy Taskforce.
Directorships of listed companies (past three years) and other directorships/appointments:Director, Westpac (from 2015). Other: Chair, ISO Blockchain Standards Committee (from 2017). Chairman, The Australian Ballet (from 2015 (Director from 2014)) and Co-Chair, the Australian Government Fintech Advisory Group (from 2016). Director, Financial Literacy Australia Limited (from 2012). Member, ASIC External Advisory Panel (from 2015).
Peter R HearlAge 68, B Com (UNSW), MAIM, FAICD, Member – AMA
Non-executive Director since 15 August 2014, last re-elected in October 2017. Chairman of the Remuneration Committee and member of the Nomination Committee. Peter is an experienced company director with substantial international experience as a senior executive in the fast moving consumer goods sector.
Peter served in senior executive roles with Yum! Brands Inc from 1997 to 2008, including global Chief Operations and Development Officer for Yum! Brands from 2006 until 2008 and President of Pizza Hut from 2002 to 2006. He previously worked for PepsiCo Inc in Sydney and London reaching regional vice-president level, as well as in various roles with Exxon in the United States and Australia.
Directorships of listed companies (past three years) and other directorships/appointments: Director, Santos Ltd (from 2016), Treasury Wine Estates (2012-2017) and Goodman Fielder Ltd (2010-2015). Other: Member, UNSW’s Australian School of Business Alumni Leaders Group and honorary member of The Stepping Stone Foundation Investment Committee (from 2018). Previously honorary Chairman of the US-based UNSW Study Abroad-Friends and US Alumni Inc.
Nora L ScheinkestelAge 59, LLB (Hons), PhD, FAICD
Non-executive Director since August 2010 and last re-elected in 2016. Member of the Audit & Risk Committee (previously Chairman Audit & Risk Committee 2012-2019), the Nomination Committee and the Remuneration Committee. Nora is an experienced company director with a background as a senior banking executive in international and project financing. She has served as Chairman and Director in a range of companies across various industry sectors and in the public, private and government arena. She is also an Associate Professor in the Melbourne Business School at Melbourne University and a former member of the Takeovers Panel. In 2003, Nora was awarded a centenary medal for services to Australian society in business leadership.
Directorships of listed companies (past three years) and other directorships/appointments: Chairman, Atlas Arteria Limited (from 2015 (Director from 2014), Director, Atlas Arteria International Limited (from 2015), OceanaGold Corporation (from 2018), AusNet Services Ltd (from 2016), Stockland Group (2015-2018). Other: Trustee, Victorian Arts Centre Trust (from 2017).
Margaret L SealeAge 58, BA, FAICD
Non-executive Director since May 2012 and last re-elected in 2018. Member of the Audit and Risk Committee and the Nomination Committee. Margie has more than 25 years’ experience in senior executive roles in Australia and overseas, including in consumer goods, global publishing and the transition of traditional business models to adapt and thrive in a digital environment, and in sales and marketing.
Margie was Managing Director of Random House, Australia (with managerial responsibility for Random House New Zealand) and President, Asia Development for Random House Inc, the global company. She was Chief Executive Officer of The Macquarie Dictionary and Lansdowne Publishing (1997-1999), and also of the Juvenile Diabetes Research Foundation (1994-1997). She served on the boards of Penguin Random House Australia/New Zealand as non-executive Director then Chair (2000-2016), the Australian Publishers’ Association, the Powerhouse Museum, the Sydney Writers Festival and on the Council of Chief Executive Women, chairing its Scholarship Committee (2011-2012).
In 2015 Margie founded a philanthropic literary travel company, Ponder & See, which funds writers’ festivals and writers through creating literary trips or experiences for interested readers. She donates funds and time to create, organise and lead the trips.
Directorships of listed companies (past three years) and other directorships/appointments: Director, Westpac Banking Corporation (from 2019), Scentre Group Limited (from 2016), Ramsay Health Care Limited (2015-2018), Bank of Queensland Limited (2014-2018). Other: Director, Australian Pacific (Holdings) Pty Limited (from 2018).
Niek Jan van Damme Age 58, Drs.
Non-executive Director appointed 16 October 2018. Member of the Remuneration Committee and the Nomination Committee. Mr van Damme has almost 20 years direct telecommunications experience, with the first part of his career focusing on brand and category management in a range of businesses including consumer goods and retail. Most recently he was a member of the Deutsche Telekom Board of Management, where he was responsible for fixed line and mobile communications in Germany.
Niek Jan has held leadership positions with other leading firms including Ben Nederland, later T-Mobile Netherlands, a challenger mobile brand, where he was the Chairman of the Managing Board.
At Deutsche Telekom he led the merger of mobile and fixed line business, laying the foundation for making Deutsche Telekom the leading operator in converged services. He also led a major network modernisation program with the establishment of a new IP core, and high 4G network investments.

28
Andrew Penn, Chief Executive Officer.
Andy became the CEO and Managing Director of Telstra, Australia’s largest telecommunications company, on 1 May 2015. At Telstra Andy is leading an ambitious change program transforming Telstra to be positioned to compete in the radically changing technology world of the future with 5G at its core. Andy has had an extensive career spanning 40 years across 3 different industries - telecommunications, financial services and shipping. He joined Telstra in 2012 as Chief Financial Officer. In 2014 he took on the additional responsibilities as Group Executive International.
Further detail about Andy can be found in the Board of Directors section.
Vicki Brady, Chief Financial Officer and Group Executive, Strategy & Finance.
The Finance and Strategy team guides the company’s financial performance and reporting, leads the development of and progress against its corporate strategy, and oversees its risk and internal audit capabilities, with the aim of delivering shareholder value over the long term.
Michael Ackland, Group Executive, Consumer & Small Business.
Consumer and Small Business brings together Telstra’s core domestic activities covering consumer, business, sales, fixed and mobiles, and services over the nbn.
Alexandra Badenoch, Group Executive, Transformation & People.
Transformation and People leads the delivery of Telstra’s company-wide T22 transformation strategy so we deliver on our commitments to our customers, shareholders and to employees by simplifying our organisational structure and transforming how we work to become more customer focused, agile and collaborative.
David Burns, Group Executive, Global Business Services.
Global Business Services (GBS) is creating a radically simplified business model and bringing together support services, service operations and enablement functions which were previously delivered separately throughout the company. GBS creates value by driving a consistent and relentless approach to improving customer experience, efficiency, and service levels through a radically simplified model.
Michael Ebeid AM, Group Executive, Enterprise.
Enterprise is responsible for revenues in excess of $8bn and managing a growing business that delivers connectivity, platforms, applications and tailored industry solutions to Telstra’s enterprise and government customers. It is also responsible for Telstra’s international operations and the largest subsea cable network in the Asia Pacific region.
Nikos Katinakis, Group Executive, Networks & IT.
Networks & IT is responsible for managing and operating all of Telstra’s technology and security infrastructure, and ensuring Telstra delivers next generation network technologies to create the largest, smartest, safest and most reliable networks in the world, as well as delivering new digital platforms and capabilities to enable digital experiences for our customers.
Carmel Mulhern, Group General Counsel and Group Executive, Legal & Corporate Affairs.
Legal and Corporate Affairs is responsible for providing legal advice to Telstra’s Board, CEO and senior management as well protecting and enhancing Telstra’s reputation with responsibility for communications, government relations, sustainability, regional affairs, regulatory and compliance.
Brendon Riley, CEO, Telstra InfraCo.
Telstra InfraCo is responsible for driving greater efficiency in the operation of Telstra’s key infrastructure assets as well as driving growth in the wholesale market, while creating more optionality for the future. Brendon Riley is also responsible for the Telstra Health business, which is separate to Telstra InfraCo.
Christian von Reventlow, Group Executive, Product & Technology.
The Product & Technology team understands emerging technology trends and is responsible for delivering Telstra’s product and technology roadmap, including creating and delivering brilliant products and solutions for all of Telstra’s customers, as well as driving profitable growth. The team has accountability for Telstra’s product strategy and lifecycle, and technology and innovation where products are incubated and brought to scale.
A number of new and previously announced appointments to our senior management team were made over the past 12 months as part of our new T22 topline organisational structure.
Senior management team

29

30
Governance at Telstra
Our governance framework plays an integral role in supporting our business and helping us deliver on our strategy. It provides the structure through which our strategy and business objectives are set, our performance is monitored, and the risks we face are managed.
It includes a clear framework for decision making and accountability across our business and provides guidance on the standards of behaviour we expect of each other.
We comply with the third edition of the ASX Corporate Governance Council’s Corporate Governance Principles and Recommendations.
SustainabilityTelstra’s Sustainability Strategy
Our goal is to embed social and environmental considerations into our business in ways that create value for the company and our stakeholders. Our Sustainability Strategy responds to the topics that are most material for our business, the areas in which we have the expertise to make a meaningful impact, and where we see opportunities to use innovative, tech-based solutions to help address societal challenges and opportunities whether they be emerging or major.
Our 2019 Corporate Governance Statement, which provides detailed information about governance at Telstra, is available on our website at telstra.com/governance.
Our Bigger Picture 2019 Sustainability Report, available online at telstra.com/ sustainability/report, provides a transparent overview of our progress and performance in relation to our material topics in FY19. The report also details the work we are undertaking in support of the United Nations’ Sustainable Development Goals (SDGs).
Our governance framework includes:
• open, clear and timely communications with our shareholders;
• a skilled, experienced, diverse and independent Board, with a Board Committee structure suited to our needs;
• clear delegation, decision making and accountability frameworks;
• robust systems of risk management and assurance;
• Telstra Values, Code of Conduct and policy framework which explain what we stand for as an organisation and how we will conduct ourselves as we work together to deliver our strategy.
Telstra Board
Audit & Risk Committee
Remuneration Committee
Nomination Committee
Chief Executive Officer
Our People
Shareholders
We are committed to excellence in corporate governance, transparency and accountability. This is essential for the long term performance and sustainability of our company, and to protect and enhance the interests of our shareholders and other stakeholders.
We want everyone to thrive in a digital world.
Responsible business Digital futures Environmental solutions
We will be a sustainable, globally trusted company
that people want to work for and with.
We will foster strong, inclusive communities that
are empowered to thrive in a digital world.
We will use technology to address environmental challenges and help our suppliers, customers
and communities do the same.

31
Directors’ Report

32
Principal activity
Our principal activity during the financial year was to provide telecommunications and information services for domestic and international customers. There has been no significant change in the nature of this activity during the year.
Review and results of operations
Information on the operations and financial position for the Telstra Group is set out in the Operating and Financial Review (OFR), comprising the Chairman and CEO’s message, Strategy and performance, Our material risks, Outlook and Full year results and operations review sections accompanying this Directors’ Report.
Dividend
The objectives of our Capital Management Framework are maximising returns for shareholders, maintaining financial strength and retaining financial flexibility. The objectives of the Capital Management Framework are supported by the following principles:
• maintain balance sheet settings consistent with an A band credit rating;
• pay a fully-franked ordinary dividend of 70 to 90 per cent of our underlying earnings, which is calculated as net profit after tax excluding net one-off nbn receipts and guidance adjustments;
• target capex/sales ratio of around 14 per cent excluding spectrum from FY20 (capex is measured on an accrued basis and excludes expenditure on spectrum and externally funded capex and capitalised leases under AASB 16); and
• maintain flexibility for portfolio management and to make strategic investments.
In addition to the ordinary dividend, we intend to return in the order of 75 per cent of net one-off nbn receipts to shareholders over time via fully-franked special dividends.
As discussed in the Chairman and CEO message, under our Capital Management Framework, the definition of underlying earnings has been updated and now explicitly excludes guidance adjustments as well as net one-off nbn receipts. Guidance adjustments include one-off restructuring costs, impairments in and to investments or property, plant and equipment and intangible assets, proceeds on the sale of businesses, mergers and acquisitions and purchase of spectrum. “Net one-off nbn receipts” is defined as the net nbn one-off Definitive Agreement receipts (consisting of Per Subscriber Address Amount, Infrastructure Ownership and Retraining) less nbn net cost to connect less tax. The definition of underlying earnings has been updated to align with market practice and provide consistency across our reporting. The dividend is subject to no unexpected material events, and is subject to Board discretion having regard to financial and market conditions, business needs and maintenance of financial strength and flexibility consistent with our Capital Management Framework.
On 14 February 2019, the Directors resolved to pay an interim fully franked dividend for the financial year 2019 of 8 cents per ordinary share, comprising an interim ordinary dividend of 5 cents per share and an interim special dividend of 3 cents per share.
On 15 August 2019, the Directors resolved to pay a final fully franked dividend of 8 cents per ordinary share ($951 million), comprising a final ordinary dividend of 5 cents per share and a final special dividend of 3 cents per share. The record date for the final dividend will be 29 August 2019, with payment to be made on 26 September 2019. Shares will trade excluding entitlement to the final dividend on 28 August 2019.
Further information regarding FY19 dividends is set out in the Chairman and CEO message and the Full Year Results and Operations Review accompanying this Directors’ Report.
The Dividend Reinvestment Plan (DRP) continues to operate for the final dividend for financial year 2019. The election date for participation in the DRP is 30 August 2019.
In accordance with a resolution of the Board, the Directors present their report on the consolidated entity (Telstra Group) consisting of Telstra Corporation Limited (Telstra) and the entities it controlled at the end of, or during the year ended, 30 June 2019. Financial comparisons used in this report are of results for the year ended 30 June 2019 compared with the restated results for the year ended 30 June 2018.
The historical financial information included in this Directors’ Report has been extracted from the audited Financial Report accompanying this Directors’ Report.
Directors’ Report
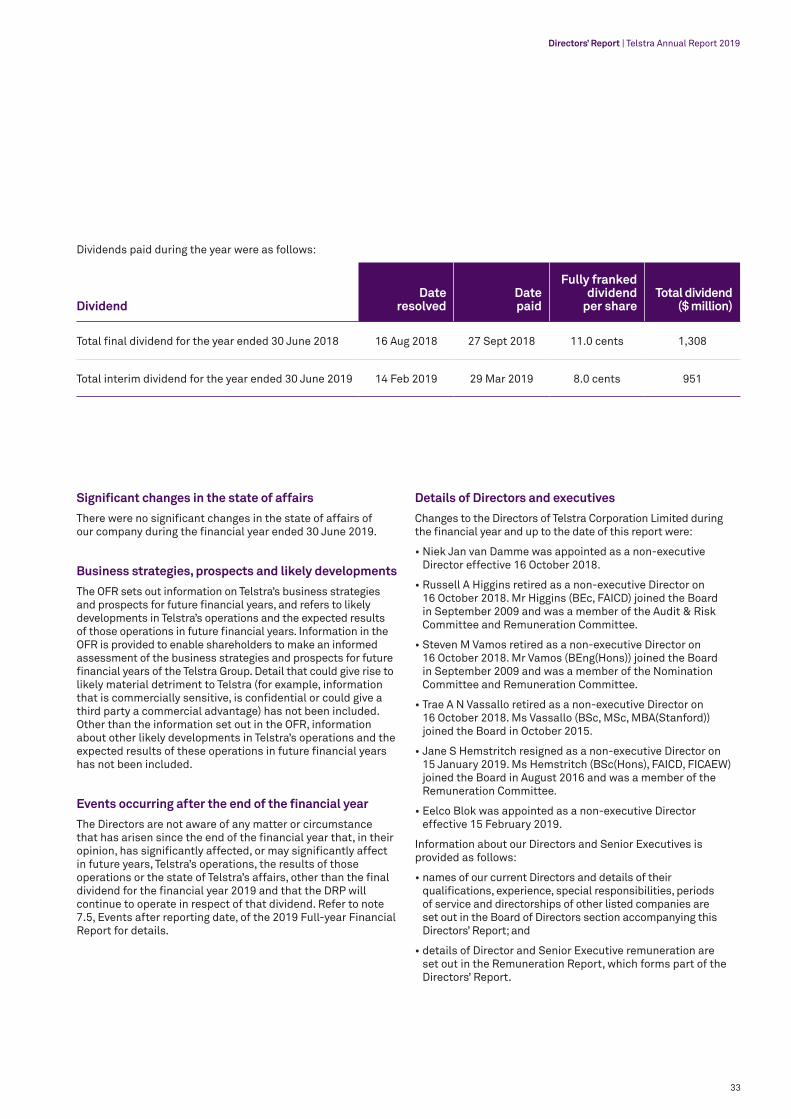
33
Directors’ Report | Telstra Annual Report 2019
Dividends paid during the year were as follows:
DividendDate
resolvedDate paid
Fully franked dividend
per share Total dividend
($ million)
Total final dividend for the year ended 30 June 2018 16 Aug 2018 27 Sept 2018 11.0 cents 1,308
Total interim dividend for the year ended 30 June 2019 14 Feb 2019 29 Mar 2019 8.0 cents 951
Significant changes in the state of affairs
There were no significant changes in the state of affairs of our company during the financial year ended 30 June 2019.
Business strategies, prospects and likely developments
The OFR sets out information on Telstra’s business strategies and prospects for future financial years, and refers to likely developments in Telstra’s operations and the expected results of those operations in future financial years. Information in the OFR is provided to enable shareholders to make an informed assessment of the business strategies and prospects for future financial years of the Telstra Group. Detail that could give rise to likely material detriment to Telstra (for example, information that is commercially sensitive, is confidential or could give a third party a commercial advantage) has not been included. Other than the information set out in the OFR, information about other likely developments in Telstra’s operations and the expected results of these operations in future financial years has not been included.
Events occurring after the end of the financial year
The Directors are not aware of any matter or circumstance that has arisen since the end of the financial year that, in their opinion, has significantly affected, or may significantly affect in future years, Telstra’s operations, the results of those operations or the state of Telstra’s affairs, other than the final dividend for the financial year 2019 and that the DRP will continue to operate in respect of that dividend. Refer to note 7.5, Events after reporting date, of the 2019 Full-year Financial Report for details.
Details of Directors and executives
Changes to the Directors of Telstra Corporation Limited during the financial year and up to the date of this report were:
• Niek Jan van Damme was appointed as a non-executive Director effective 16 October 2018.
• Russell A Higgins retired as a non-executive Director on 16 October 2018. Mr Higgins (BEc, FAICD) joined the Board in September 2009 and was a member of the Audit & Risk Committee and Remuneration Committee.
• Steven M Vamos retired as a non-executive Director on 16 October 2018. Mr Vamos (BEng(Hons)) joined the Board in September 2009 and was a member of the Nomination Committee and Remuneration Committee.
• Trae A N Vassallo retired as a non-executive Director on 16 October 2018. Ms Vassallo (BSc, MSc, MBA(Stanford)) joined the Board in October 2015.
• Jane S Hemstritch resigned as a non-executive Director on 15 January 2019. Ms Hemstritch (BSc(Hons), FAICD, FICAEW) joined the Board in August 2016 and was a member of the Remuneration Committee.
• Eelco Blok was appointed as a non-executive Director effective 15 February 2019.
Information about our Directors and Senior Executives is provided as follows:
• names of our current Directors and details of their qualifications, experience, special responsibilities, periods of service and directorships of other listed companies are set out in the Board of Directors section accompanying this Directors’ Report; and
• details of Director and Senior Executive remuneration are set out in the Remuneration Report, which forms part of the Directors’ Report.

34
Director shareholdings in Telstra
Details of Directors’ shareholdings in Telstra as at 15 August 2019 are shown in the table below:
DirectorNumber of
shares held1
John P Mullen 101,159
Andrew R Penn2 1,385,048
Eelco Blok 75,000
Roy H Chestnutt 43,000
Niek Jan van Damme –
Craig W Dunn 70,073
Peter R Hearl 70,000
Jane S Hemstritch 91,000
Russell A Higgins 106,769
Nora L Scheinkestel 121,067
Margaret L Seale 253,500
Steven M Vamos 40,000
Trae A N Vassallo 15,793
1. The number of shares held refers to shares held either directly or indirectly by Directors as at 15 August 2019 or, if earlier, as at the date of cessation as a Director. Shares in which the Director does not have a relevant interest, including shares held by the Directors’ related parties (including relatives), are excluded. Refer to the Remuneration Report tables for total shares held by Directors and their related parties directly, indirectly or beneficially as at 30 June 2019. The numbers above include 175,000 shares held by a related party of Margaret Seale and 479 shares held by a related party of Russell Higgins. In both cases, the Director has a relevant interest.
2. Andrew Penn also holds 383,554 Performance Rights.
Company Secretary
Sue LaverBA, LLB (Hons) (Monash), GAICD
Sue was appointed Company Secretary of Telstra Corporation Limited effective 1 February 2018.
Sue is a senior legal and governance professional with over 20 years’ experience advising senior management and boards. Sue reports to the board and her duties include continuous disclosure compliance, corporate governance and communication with Telstra’s 1.4 million shareholders.
Sue joined Telstra in 1997 and has served in senior legal roles throughout the company including as Deputy Group General Counsel, and General Counsel roles across the company including: Dispute Resolution, HR, Finance, Risk and Compliance, Media and Telstra Country Wide. She holds a Bachelor of Law (Hons) and a Bachelor of Arts from Monash University.
Board and Committee meeting attendance
Details of the number of meetings held by the Board and its Committees during financial year 2019, and attendance by Board members, are set out below:
Board
Committees1
Audit and Risk Nomination4 Remuneration
a b a b a b a b
John P Mullen 12 11 – (2) 6 6 – (6)
Andrew R Penn 12 12 – (6) 6 6 – (7)
Eelco Blok2 4 3 – – 2 2 – –
Roy H Chestnutt 12 11 4 4 4 4 (2) – –
Niek Jan van Damme2 9 9 – – 4 4 5 5
Craig W Dunn 12 12 6 6 4 4 (2) – –
Peter R Hearl 12 12 – – 6 6 8 8
Jane S Hemstritch3 6 6 – – 1 1 (2) 3 3
Russell A Higgins3 3 3 2 2 – (1) 3 3
Nora L Scheinkestel 12 12 6 6 4 3 (2) 5 4
Margaret L Seale 12 12 6 6 4 3 (2) – –
Steven M Vamos3 3 3 – – 1 1 3 3
Trae A N Vassallo3 3 2 – – – (1) – –
Total number of meetings held 12 6 6 8
Column a: number of meetings held while a member.Column b: number of meetings attended.
1. Committee meetings are open to all Directors to attend. Where a Director has attended a meeting of a Committee of which he or she was not a member, this is indicated by ( ).2. Niek Jan van Damme was appointed as a non-executive Director effective 16 October 2018. Eelco Blok was appointed as a non-executive Director effective 15 February 2019.3. Russell Higgins, Steven Vamos and Trae Vassallo ceased as non-executive Directors on 16 October 2018. Jane Hemstritch ceased as a non-executive Director on 15 January 2019.4. All Directors became a member of the Nomination Committee effective 18 October 2018.

35
Directors’ Report | Telstra Annual Report 2019
Directors’ and officers’ indemnity and insurance
(a) ConstitutionTelstra’s constitution provides for it to indemnify, to the maximum extent permitted by law:
• certain officers of Telstra and its related bodies corporate (“Telstra Officers”), for any liability and legal costs they incur in that capacity; and
• Telstra Officers and certain employees asked by Telstra to be an officer of a company that is not related to Telstra, for any liability they incur as an officer of that company, as if that liability had been incurred in the capacity as a Telstra Officer.
Telstra’s constitution also allows for it to indemnify, to the maximum extent permitted by law:
• certain employees of Telstra and its related bodies corporate, for any liability they incur in that capacity; and
• certain other officers of Telstra’s related bodies corporate, for any liability they incur in that capacity.
(b) Deeds of indemnity in favour of directors, officers, employees and consultants
Telstra has also executed deeds of indemnity in favour of (amongst others):
• Directors and secretaries of Telstra (past and present);
• certain senior managers and employees of Telstra and its wholly-owned subsidiaries and partly-owned companies (including, for example, in relation to particular projects); and
• certain Telstra Group senior managers, employees and other persons that act as nominee directors or secretaries (at Telstra’s request) for entities, including wholly-owned subsidiaries and partly-owned companies of Telstra,
in each case as permitted under Telstra’s constitution and the Corporations Act 2001 (the Act).
The deeds in favour of Directors of Telstra also give Directors certain rights of access to Telstra’s books and require Telstra to maintain insurance cover for the Directors.
(c) Directors’ and officers’ insuranceTelstra maintains directors’ and officers’ insurance policies that, subject to some exceptions, provide worldwide insurance cover to past, present and future directors, secretaries and officers and certain employees of Telstra and its subsidiaries and, in certain limited circumstances, other entities. Telstra has paid the premiums for the policies. The directors’ and officers’ insurance policies prohibit disclosure of the premiums payable under the policies and the nature of the liabilities insured.
Environmental regulation and performance
Telstra, as a minimum, seeks to be compliant with all applicable environmental laws and regulatory obligations relevant to its operations. Where instances of non-compliance may occur, Telstra has procedures requiring that internal investigations are conducted to determine the cause of the non-compliance and to ensure that any risk of recurrence is minimised. Telstra’s procedures further require that the relevant government authorities are notified of any environmental incidents (where applicable) in compliance with statutory requirements. Telstra complies with notices issued by government authorities and regulators.
(a) Prosecutions or convictionsTelstra has not been prosecuted for, or convicted of, any significant breaches of environmental regulation during the financial year.
(b) Energy and greenhouse emissionsIn Australia, Telstra is subject to the reporting requirements of the National Greenhouse and Energy Reporting Act 2007, which requires Telstra to report its annual Australian greenhouse gas emissions, energy consumption and energy production. Telstra has implemented systems and processes for the collection and reporting of data and has, in accordance with our obligations, reported to the Clean Energy Regulator on an annual basis. The next report is due on 31 October 2019 and will again be supported with an independent assurance report.
In the United Kingdom, Telstra is subject to the Energy Savings Opportunity Scheme (ESOS) Regulations 2014. Telstra qualifies for ESOS and must carry out energy savings assessments every four years. These assessments are audits of the energy used by our buildings, network facilities and transport to identify cost-effective energy saving measures. Telstra has met our obligations under ESOS for the first compliance period ended 5 December 2015. Telstra has an obligation for a second ESOS audit to be completed by the next qualification date on 5 December 2019. At this time, the audit has been completed and the findings of the report are being assessed prior to them being accepted.
For more information on environmental performance, including environmental regulation, refer to the Bigger Picture 2019 Sustainability Report, which is available online at telstra.com/sustainability/report.
Non-audit services
During financial year 2019, Telstra’s auditor, Ernst & Young (EY), has been employed on assignments additional to its statutory audit duties. Details of the amounts paid or payable to EY for audit and non-audit services provided during the year are detailed in note 7.2 to the financial statements in our 2019 Financial Report.
The Directors are satisfied, based on advice provided by the Audit & Risk Committee that the provision of non-audit services during financial year 2019 is consistent with the general standard of independence for auditors imposed by the Act and that the nature and scope of each type of non-audit service provided did not compromise the auditor independence requirements of the Act for the following reasons:
• all EY engagements, including non-audit services, were approved in accordance with the external auditor services policy adopted by Telstra and subject to confirmation by both management and EY that the provision of these services does not compromise auditor independence;
• the external auditor services policy clearly identifies prohibited services, which include reviewing or auditing the auditor’s own work or EY partners or staff acting in a managerial or decision-making capacity for Telstra; and
• the provision of non-audit services by EY is monitored by the Audit & Risk Committee via periodic reporting to the Audit & Risk Committee.
A copy of the auditor’s independence declaration is set out in the Auditor’s Independence Declaration to the Directors of Telstra Corporation Limited and forms part of this report.

36
Message from the Remuneration Committee Chairman
FY19 was a watershed year for Telstra. Under the CEO’s leadership, your company embarked upon the first year of a major strategic transformation program, called “T22”. T22 completes the digital rebuild of the company’s core systems, dramatically streamlining our operations to provide our customers with easily understood and easily accessible products and services, supported by both state of the art networks and technology, as well as dramatic improvements in both our productivity and decision making. All of this is designed to deliver great customer experiences and industry leading capital efficiency by the 2022 horizon of T22 and beyond. This transformation is believed to be the most ambitious transformation program being undertaken by any legacy telecommunications company in the world today. We have made strong progress over FY19 and have equally ambitious plans for FY20.
FY19 was also a critically important year for Telstra, in that we passed the half-way mark of the migration to the nbn™ network which as you are aware, has had a significant adverse impact on Telstra’s profitability and dividends. FY19 has also been impacted by a highly competitive market. The impact of the nbn will still be felt in FY20, but in FY20 we expect Telstra’s underlying EBITDA, excluding the in-year nbn headwind, to grow as outlined in the Chairman and CEO’s message in the Directors’ Report.
During FY19 we have made strong progress on T22 and delivered financial performance in line with expectations and the Executive Variable Remuneration Plan (EVP) targets published in October 2018. We believe that the material rise in Telstra’s share price during the year has been influenced by factors including shareholders’ confidence in the success of the T22 program to date and the remuneration outcomes for the Chief Executive Officer (CEO) and Group Executives reflect this context, with EVP outcomes above target.
Enhancing Our Remuneration Framework
The Telstra Board spent a great deal of time designing what we believe is a remuneration structure best suited to reflect the interests of the company, its shareholders and its management. While we continue to strongly believe that our EVP remains the most appropriate mechanism to reward performance, your Remuneration Committee and Board took very seriously the “first strike” received against Telstra’s FY18 Remuneration Report. As a result, throughout FY19 we undertook a process of significant consultation with both major shareholders and shareholder advisory companies (proxy advisors) to truly understand the concerns and develop appropriate, sustainable enhancements to the EVP that address these concerns without undermining the integrity of what we absolutely believe is the best structure for the company.
Therefore, effective for FY20, we have made the following changes to the EVP:
• An increase in the weighting of “Financial” to “Strategic” performance metrics from a 50:50 to 60:40 ratio.
• A reduction in the CEO’s maximum EVP opportunity from 400% of Fixed Remuneration to 300%.
• A reduction in all Group Executive’s maximum EVP opportunity from 360% of Fixed Remuneration to 300%.
• An increase in the proportion of EVP delivered in equity from 35% Cash: 65% Equity (26% Restricted Shares: 39% Performance Rights) to 25% Cash: 75% Equity (35% Restricted Shares: 40% Performance Rights).
• An increase in the vesting period of the Restricted Shares from a 2 year (100% “cliff” vesting) to a 4 year period (pro-rata vesting).
• Strengthening the already challenging “2nd performance hurdle” on the Performance Rights from a 100% “cliff” vest where Telstra’s Relative Total Shareholder Return (RTSR) ranks at the 50th percentile of ASX 100 (excluding resources companies) to a sliding scale of 50% vesting at the 50th percentile of RTSR rising to 100% vesting at the 75th percentile. The 2nd performance hurdle for Performance Rights will continue to be assessed over a total 5 year period from the start of the performance year.
Dear Fellow Shareholders,
On behalf of your company’s Remuneration Committee, I am pleased to present Telstra’s FY19 Remuneration Report.
37
• Clawback (Malus) Events have also been expanded to cover conduct that may negatively impact Telstra’s standing, reputation or relationship with its key regulators and behaviour that has resulted in a material breach of Telstra’s risk management framework.
In addition, to enhance the long-term alignment with shareholders, we have significantly increased the shareholding obligations for the CEO. The CEO will now be required to hold 200% of Fixed Remuneration in Telstra shares within 5 years of appointment. Finally, for the Chairman of Telstra we have doubled the shareholding obligation. The Chairman will now be required to hold 200% of the non-executive Director annual base fee, within 5 years of appointment as Chairman.
Leading Edge Transparency
In October 2018, to provide greater transparency to all shareholders, Telstra provided the actual metrics and performance levels that would be used in assessing EVP outcomes for FY19. We have continued to increase the transparency of information to shareholders to enable an informed view of performance and reward given the challenging headwinds and the extent of the transformation program being led by our executive team. The Remuneration Report provides detailed information on both performance outcomes for FY19 and the metrics and performance levels that will be applied in FY20.
FY19 performance was assessed against the robust targets outlined in the shareholder letter of October 2018. The Board has determined the appropriate FY19 CEO EVP outcome to be 111.8% of target (55.9% of the maximum opportunity). The outcome was objectively determined by measurement against the targets in accordance with our governance framework (Section 2.2(e) of the Remuneration Report). Rewards will be delivered under the FY19 EVP structure with 26% of the total award allocated in the form of Restricted Shares deferred for 2 years and 39% allocated in the form of Performance Rights. The Performance Rights are subject to measurement against a RTSR 2nd performance hurdle in June 2023.
We continue to experience the ongoing headwinds from the progressive nationalisation of our fixed line business via the government owned nbn. To date we estimate the nbn has adversely impacted EBITDA by $1.7 billion representing around 50 per cent of the estimated financial impact. Despite this and given a highly competitive mobile market, management has made strong progress against most of the T22 Financial and Strategic measures. FY19 performance highlights include:
• Delivering against our EVP Total Income target and meeting EBITDA threshold.
• Better than target productivity outcome through our Net Opex reduction.
• A material increase in our episode NPS score to +25.
• A reduction in Consumer and Small Business (C&SB) in market fixed and mobile plans from 1,800 to 20 during FY19.
• A reduction in our active Enterprise plans from a baseline of 651 to 517.
• A significant increase in the C&SB Sales being made digitally from 6.2% in FY18 to 16.8% in FY19.
• Continued network leadership and the launch of the nation’s first 5G network.
• The establishment of “InfraCo” and its operation as a standalone infrastructure business unit within Telstra with “InfraCo” financial performance separately provided to the market to give a greater understanding of the value of its assets.
Disappointments in FY19 include our failure to hit the EVP “threshold” performance target on Free Cash Flow and a dip in our Employee Engagement Score in the face of the very significant organisational change which occurred throughout FY19. Overall, however, this has been a strong first year of our T22 turnaround program.
Strengthened Executive Team
During FY19 we reorganised the structure of our business and strengthened the management team with the appointment of three new talented executives bringing global capability in technology, digital and business leadership. We also appointed five executives to Group Executive roles leading critical functions including the newly established “InfraCo”. To execute our T22 strategy and deliver value to our customers, shareholders and communities we require access to the best executive talent and capability. Engaging and appropriately rewarding this high calibre leadership team is critical to the execution of Telstra’s strategy.
Remuneration Committee’s Ongoing Focus
We will continue to drive the structure of Telstra’s executive remuneration practices to promote:
• Strategic Alignment to support the delivery of our T22 strategy.
• High standards of sustainable performance against critical strategic and operational objectives.
• Long-term decision-making fostering effective stewardship, sound risk management and the generation of sustainable, long-term shareholder value.
• Shareholder alignment so that reward outcomes reflect the returns delivered to long-term shareholders.
• Attraction and retention of executive talent enabling Telstra to compete in the global talent market.
• Effective Governance ensuring reward structures are simple, transparent and clearly linked to sustainable performance.
We look forward to continuing conversations with our stakeholders and welcome your feedback on our remuneration framework to ensure it also meets the standards and expectations you have of our unique organisation.
We urge you to read the full report in detail and strongly recommend your endorsement of it.
Peter R. HearlRemuneration CommitteeChairman

38
Remuneration ReportThis report details the remuneration framework and outcomes for Key Management Personnel (KMP) of the Telstra Group for the year ended 30 June 2019 (FY19).
Contents
1.0 First Strike in 2018
1.1 Our response to stakeholder feedback
1.2 Why the EVP remains appropriate
1.3 Specific issues raised and our response
2.0 Policy
2.1 Key Management Personnel
2.2 Remuneration policy, strategy and governance
3.0 Senior Executive remuneration
3.1 Remuneration structure
3.2 FY19 EVP outcomes
3.3 FY17 LTI plan outcomes
3.4 Detailed remuneration and interests in Telstra shares
4.0 Non-executive Director remuneration
4.1 Remuneration structure
4.2 Detailed remuneration and interests in Telstra shares
5.0 Looking forward to FY20
5.1 Enhancements to the FY20 EVP
5.2 FY20 EVP Performance measures and targets
6.0 Glossary

39
Remuneration at Telstra and FY19 Remuneration Outcomes – Key Highlights
The following table includes the key highlights and remuneration outcomes for FY19, as well as key remuneration changes applicable to future financial years.
Key area of focus or outcome Highlights / Details Where to find more
information
First Strike in 2018 and changes to the FY20 EVP
We received a ‘first strike’ against our FY18 Remuneration Report at last year’s Annual General Meeting (AGM). The Board took that very seriously. As a result, the Board completed a comprehensive review of our executive remuneration framework, including our Executive Variable Remuneration Plan (EVP).
The Chairman of the Board and the Chairman of the Remuneration Committee engaged throughout the year with stakeholders to seek feedback and consider opportunities to further enhance the effectiveness of our reward structure. During FY19, a total of 44 shareholder and stakeholder meetings were held including 9 meetings with shareholder advisory companies.
Following that review and considering the feedback received, the Board believes the EVP remains an appropriate mechanism to reward the CEO and Group Executives. However, having regard to feedback provided by our stakeholders the Board recognises that there are certain enhancements that should be made to the EVP to ensure it continues to best meet the overall objectives of Telstra’s remuneration policy outlined in section 2.2.
Those enhancements are summarised below and will be implemented for the FY20 EVP. They did not apply to the FY19 EVP because the FY19 EVP had commenced before Telstra received its first strike, and seeking to amend the FY19 EVP while it was in operation would have created complexity and disruption.
• The weighting of financial performance measures within the primary performance measures has been increased to 60% (previously 50%) with the remaining 40% covering customer, strategic and transformation performance measures.
• The maximum award opportunity has been significantly reduced: We have reduced the maximum EVP opportunity for the CEO and Group Executives to 300% of Fixed Remuneration (from 400% and 360% respectively).
• More shares, less cash: The CEO and Group Executives will now receive 75% (previously 65%) of their EVP award in the form of Restricted Shares and Performance Rights.
• The Restricted Shares will now be eligible to vest in four equal tranches, with 25% eligible to vest each year over the four years following the end of the initial performance period.
• We have changed the performance condition for the Performance Rights making it more challenging for the Performance Rights to vest. Vesting will now be determined on a straight line scale, with 50% of the Performance Rights vesting if Telstra’s RTSR ranks at the 50th percentile of a comparator group (previously 100%), up to 100% of the Performance Rights vesting if Telstra’s RTSR ranks at the 75th percentile of the comparator group. No Performance Rights vest if Telstra’s RTSR ranks below the 50th percentile when compared with the comparator group. This performance condition will continue to be assessed over a total five year period from the start of the initial performance period.
• Claw-back Events (Malus) have also been expanded (for both the FY19 and FY20 EVP) to include conduct that may negatively impact on Telstra’s standing, reputation or relationship with its key regulators and behaviour that has resulted in a material breach of Telstra’s risk management framework.
On our response to the ‘first strike’ and why the EVP remains appropriate: section 1.0
On the changes to the FY20 EVP: section 5.1
FY19 EVP outcome
The FY19 EVP outcome was 111.8% of target (or 55.9% of maximum) based on the assessment of the primary performance measures.
After taking into account individual performance, the average total FY19 EVP outcome for current Senior Executives, as a percentage of maximum opportunity was 55.9%, with 39% of the total FY19 EVP outcome still subject to a future RTSR performance condition, measured over a five year performance period through to the end of FY23.
Our remuneration structure links financial rewards directly to employee contributions and company performance.
The FY19 full year results showed solid performance in financial outcomes and significant progress on the delivery of our T22 strategy.
Telstra’s performance against target on the Total Income, EBITDA, Net Opex Reduction and our strategic performance measures was strong. However, we did not achieve our FCF and People Capability & Engagement performance measures resulting in no award being provided in relation to these components.
Telstra’s Total Return over FY19 was 57.7%. Total Return incorporates price change and dividends for the period 1 July 2018 to 30 June 2019 with dividends assumed to be reinvested and total return compounded daily.
Section 3.2
FY17 LTI plan outcome
The FY17 LTI plan was tested on 30 June 2019 and while it would have met one of the two performance measures, the Board exercised its discretion not to vest that component of the FY17 LTI Plan resulting in no awards vesting under the plan.
Section 3.3
Remuneration Report | Telstra Annual Report 2019
40
1.0 First Strike in 2018
1.1 Our response to shareholder feedbackAt our 2018 AGM, 61.98% of votes cast were against the adoption of the FY18 Remuneration Report, constituting a ‘first strike’ under the Corporations Act. Shareholder participation in the resolution was 40.7% of Telstra’s total shares on issue, resulting in 25.2% of Telstra’s total shares on issue being cast against the resolution.
The Board has undertaken a comprehensive review of Telstra’s executive remuneration framework and engaged with shareholders, proxy advisers and other stakeholders to understand their concerns around our remuneration policy and practice. The Board has listened and taken all comments on board in an effort to try and get the balance right between supporting shareholders’ interests, and appropriate performance based remuneration, while at the same time motivating, incentivising and retaining our executive talent to implement our ambitious T22 strategy.
1.2 Why the EVP remains appropriateFollowing its review, the Board believes the EVP remains an appropriate mechanism to align performance and reward for the CEO and Group Executives through our industry and business cycles and directly links reward to the delivery of our T22 strategy. The initial variable reward outcomes under the EVP are based on a rigorous assessment by the Board of performance against robust measures in a performance year. In FY19, 65% of the initial EVP outcome (increasing to 75% in FY20) is comprised of equity which is subject to ongoing requirements of service, conduct and performance. The Board believes that significant Senior Executive equity participation reinforces the ultimate focus on shareholder value creation through the delivery of our T22 strategy over the medium to longer term. The Board believes that the EVP remains effective as it promotes the following:
• Strategic Alignment: The EVP supports the delivery of our T22 strategy and the investment lead times in our industry.
• High standards of sustainable performance: The EVP requires leading performance against critical strategic objectives, as well as operational performance against robust annual performance measures. The Board assesses the proposed outcome in the context of Telstra’s performance, customer experience and shareholder expectations and each Senior Executive’s performance and contribution. This includes an assessment of the effective management of risk in accordance with our risk management framework. This determines an initial EVP outcome, a significant proportion of which is provided in the form of Performance Rights that are subject to a separate long term performance measure assessed over a five year period. This approach encourages strong financial performance in the near term without compromising the requirements of building a sustainable, long-term business.
• Long-term decision-making: As the majority of a Senior Executive’s EVP outcome is provided as Restricted Shares and Performance Rights that remain at risk for a period of time after they are allocated, the EVP requires leadership and effective stewardship over the longer term promoting a focus on sound risk management and the generation of sustainable, long-term shareholder value.
• Shareholder alignment: As the majority of variable remuneration is provided in the form of Restricted Shares and Performance Rights it helps align actual pay outcomes with returns delivered to long-term shareholders.
• Attraction and retention: We operate in a highly competitive global market for the talent required to lead Telstra through constant innovation, re-invention and disruption. The EVP seeks to provide appropriate reward opportunities to enable Telstra to compete in the global talent market.
• Effective Governance: The Remuneration Committee and the Board actively evaluate performance results relative to performance metrics, progress toward strategic objectives and a range of additional factors including shareholder expectations and customer experience to determine the appropriate, balanced remuneration outcome. Our plan design enables further consideration before any award deferred from a prior performance period vests, ensuring that both the initial and final award reflect appropriate sustainable performance.
Throughout the course of FY19 the Board has considered feedback provided by our stakeholders and made changes to address their areas of concern (see section 5.0 for further information). These demonstrate a clear commitment to ensuring our EVP supports our long-term shareholders’ interests and expectations.
The Board has concentrated on making enhancements to the FY20 EVP structure rather than creating further disruption and complexity by amending the FY19 EVP, which was in place prior to the 2018 AGM. The Board believes this is the right thing to do for the company and is in the interest of both our shareholders and Senior Executives.
1.3 Specific issues raised and our responseThe following table summarises the issues raised by our shareholders and proxy advisors at our 2018 AGM and as part of our review process, and includes our responses to those concerns.

41
Issues Raised Response
EVP Structure
It is easier to achieve pay outcomes under a combined incentive plan (as opposed to a traditional STI/LTI incentive structure)
In a traditional STI/LTI construct, an executive receives their LTI grant (for example 200% of Fixed Remuneration) at the beginning of each year, irrespective of annual performance. Under Telstra’s EVP the performance against the primary performance measures in the prior year dictates the number of Performance Rights (equivalent to LTI in a standard STI/LTI construct) that are granted. As an example, if the EVP outcome for a given year is 50% of maximum, then the Performance Rights granted will also only be 50% of maximum.
Under the EVP, Performance Rights will only vest at the end of a five year performance period if a further RTSR performance condition has been achieved. This means executives have a double hurdle, with performance measured over both the initial performance period and the five year RTSR performance period, making it considerably more challenging for Senior Executives to obtain variable remuneration than was the case under the previous STI/LTI structure.
Nonetheless, we have listened to shareholders and have introduced a more challenging second hurdle by tightening the RSTR performance condition through the use of a sliding vesting scale as explained further below.
Maximum opportunity considered excessive and a high portion of award provided in cash
Having considered feedback, the Board has enhanced the FY20 EVP by strengthening its alignment with shareholders’ interests, and delivery of the T22 strategy through the following key changes:
• The weighting of financial performance measures within the primary performance measures has increased to 60% (previously 50%) with the remaining 40% covering customer, strategic and transformation performance measures.
• The maximum opportunity for all Senior Executives has been reduced to 300% of Fixed Remuneration (previously it was 400% for the CEO and 360% for Group Executives).
• The cash component of the FY20 EVP has been reduced from 35% to 25% of a Senior Executive’s EVP outcome.
• The overall portion of a Senior Executive’s EVP outcome delivered in equity has increased and is now 75% (previously 65%), with 35% provided in Restricted Shares and 40% provided in Performance Rights.
• The Restricted Shares will be eligible to vest in four equal tranches, with 25% eligible to vest each year over the four years following the end of the initial performance period. The Performance Rights are eligible to vest 5 years from the start of the initial performance period subject to the RTSR performance condition.
• The secondary performance hurdle applying to the Performance Rights, has been strengthened by introducing a sliding vesting scale as opposed to ‘cliff vesting’ as described below.
Applicable to both the FY19 and FY20 EVPs, our claw-back (malus) framework has also been enhanced to drive greater executive accountability and focus on sustainable performance. We have introduced new Claw-back Events which focus on conduct that may negatively impact our reputation with key regulators or result in a material breach of our risk management requirements.
The inclusion of the Dividend Equivalent Payment (DEP) which is payable if Performance Rights vest.
For Performance Rights that vest following satisfaction of the RTSR performance condition, a cash payment equivalent to the dividends paid by Telstra during the period between allocation of the Performance Rights and vesting will be made at or around the time of vesting. This is known as a Dividend Equivalent Payment (DEP). A minority of stakeholders believe Senior Executives should not receive this payment.
After lengthy consideration, the Board has decided to retain the DEP on the basis that our approach enhances the alignment of executive remuneration with the shareholder experience over the performance period by balancing considerations of both price and yield. To reiterate, DEPs are only paid if the RTSR performance condition is met on the Performance Right component of the EVP.
Remuneration Report | Telstra Annual Report 2019

42
Issues Raised Response
Pay for Performance
The FY18 performance measure targets were considered not sufficiently demanding and performance outcomes were therefore not aligned with shareholders’ expectations
Last year, the Board reduced the EVP outcome for Senior Executives by 30% as it recognised that our overall performance had been disappointing. The Board believed the 30% reduction was an appropriate reduction to balance the achievements of the management team with the experience of shareholders. Despite this action, we understand that some shareholders still felt that the remuneration outcomes were too high.
In setting the FY19 performance measure targets the Board sought to ensure the targets were sufficiently demanding and aligned with market guidance provided by Telstra. In October 2018, we took the step of providing all shareholders with detailed information on the FY19 EVP performance measure targets and the rationale for adopting those targets. In addition, as part of our FY19 half year results released in February 2019, we provided the market with an update on how performance was tracking relative to each target. This step was taken to inform all shareholders of the performance expectations and reward alignment for FY19.
Assessing performance on the Performance Right component of the EVP, with vesting occurring if RTSR ranks at the 50th percentile (referred to as ‘cliff vesting’)
We listened to feedback that vesting 100% of the Performance Rights where Telstra’s RTSR ranks at the 50th percentile of the comparator group, was not sufficiently challenging.
Whilst the Board considers the current 50th percentile ‘cliff vesting’ to be a challenging performance measure as it is the second part of a double hurdle, to enhance our pay for performance alignment and delivery of long term shareholder value, the Board decided to change this element of the EVP structure for FY20. Vesting will now be determined on a straight-line vesting scale, with 50% of the Performance Rights vesting if Telstra’s RTSR ranks at the 50th percentile of the comparator group, up to 100% of the Performance Rights vesting if Telstra’s RTSR ranks at the 75th percentile of the comparator group. No Performance Rights vest if Telstra’s RTSR ranks below the 50th percentile when compared with the comparator group.
Disclosure
Lack of transparency with respect to the FY19 EVP performance measures
In an effort to address this feedback in October 2018, the Chairman released a letter to shareholders, which included additional detail on the FY19 EVP performance measure targets and the rationale for adopting those targets. In addition, as part of our FY19 half year results released in February 2019, we provided the market with an update on how performance was tracking relative to each target.
In the interest of continuing to be transparent, we have included our FY20 EVP performance measures and targets in this report (as set out in section 5.0)
CEO Fixed Remuneration
FY18 increase not in line with shareholder expectations and considered excessive relative to other employees
In the four years since appointment in May 2015, the CEO has received only one Fixed Remuneration increase of 2.8% on 1 October 2017. In determining that increase, the Board took into consideration the fixed remuneration of CEOs at other ASX listed companies of similar size, complexity and market capitalisation. The CEO’s Fixed Remuneration has remained unchanged for FY19 and we do not anticipate any further increases for FY20.

43
Remuneration Report | Telstra Annual Report 2019
2.0 Policy
2.1 Key Management Personnel (KMP)Telstra’s KMP are assessed each year and comprise the Directors of the company and Senior Executives. The term “Senior Executives” refers to the CEO and those executives with authority and responsibility for planning, directing and controlling the activities of the company and the Group, directly or indirectly. Each KMP held their position for the whole of FY19, unless stated otherwise.
Effective 1 October 2018, we reorganised the structure of our business and implemented a new topline organisation structure and leadership team as an important step in delivering our T22 strategy. As a result of these organisational changes, our KMP recognised during FY19 were:
Non-executive Directors Senior Executives
Current Current KMP Position
John P Mullen Andrew Penn Chief Executive Officer & Managing Director (CEO)
Eelco Blok from 15/02/19 Michael Ackland Group Executive (GE) Telstra Consumer & Small Business (C&SB) from 11/09/18
Roy H Chestnutt Alex Badenoch GE Transformation & People (T&P) from 1/10/18
Craig W Dunn Vicki Brady* GE C&SB from 1/7/18 to 10/09/18
Peter R Hearl David Burns GE Global Business Services (GBS) from 30/07/18
Nora L Scheinkestel Michael Ebeid AM GE Telstra Enterprise (TE) from 1/10/18
Margaret L Seale Nikos Katinakis GE Networks & IT from 15/10/18
Niek Jan van Damme from 16/10/18 Brendon Riley GE and CEO Telstra InfraCo from 1/10/18, formerly GE TE from 1/07/18 to 30/09/18
Christian Von Reventlow GE Product & Technology from 1/11/18
Former Former
Jane S Hemstritch until 15/01/19 Warwick Bray Chief Financial Officer (CFO) from 1/7/18 to 30/09/18
Russell A Higgins AO until 16/10/18
Steven M Vamos until 16/10/18
Trae A N Vassallo until 16/10/18
Robyn Denholm CFO from 1/10/18 to 30/06/19, formerly Chief Operations Officer from 1/07/18 to 30/9/18
Will Irving GE Telstra Wholesale from 1/07/18 to 30/09/18
* Between 11/09/2018 and 1/07/2019 when she commenced as CFO, Vicki Brady was on leave.
2.2 Remuneration policy, strategy and governanceOur remuneration policy is designed to:• support our strategy and reinforce our culture and values• link financial rewards directly to employee contributions
and company performance• provide market competitive remuneration to attract,
motivate and retain highly skilled employees• achieve remuneration outcomes of internal consistency• ensure employees performing at similar levels in similar roles
are remunerated within a broadly similar range• ensure that all reward decisions are made free from bias and
support diversity within Telstra• support commercially responsible pay decisions
Our governance framework for determining Senior Executive remuneration includes the aspects outlined below.
(a) The Remuneration CommitteeThe Remuneration Committee monitors and advises the Board on remuneration matters and consists only of independent non-executive Directors. It assists the Board in its responsibilities by reviewing and advising on Board and Senior Executive remuneration, giving due consideration to the law and corporate governance principles.
The Remuneration Committee also reviews and makes recommendations to the Board on Telstra’s overall remuneration strategies, policies and practices, and monitors the effectiveness of Telstra’s overall remuneration framework in achieving Telstra’s remuneration strategies.
As noted earlier, the governance of Senior Executives’ remuneration outcomes has been a significant focus of the Remuneration Committee and the Board this past financial year. Further detail about the Remuneration Committee and its responsibilities is provided in our Corporate Governance Statement available at telstra.com/governance.
(b) Annual remuneration reviewThe Remuneration Committee and the Board review Senior Executive remuneration annually to ensure there is a balance between fixed and at risk pay, and that it reflects both short and long term performance objectives aligned to Telstra’s strategy.
Fixed Remuneration is usually reviewed annually taking into account:
• the employee’s level of skill, experience and scope of responsibilities
• business performance, scarcity of talent, economic climate and market conditions
• consistency with increases elsewhere within Telstra• external comparator groups (which are used for reference
purposes only) made up of companies of similar size and complexity to Telstra
The Remuneration Committee and Board reviews the CEO’s fixed and variable remuneration and the CEO undertakes a similar exercise in relation to other Senior Executives. The results of the CEO’s annual review of other Senior Executives’ performance and remuneration are subject to Remuneration Committee and Board review and approval.

44
(c) Engagement with consultantsDuring FY19, Telstra did not seek a remuneration recommendation from a remuneration consultant in relation to any of our KMP.
(d) Engagement with shareholders and stakeholdersThe Chairman of the Board and the Chairman of the Remuneration Committee engage throughout the year with stakeholders to seek feedback and consider opportunities to further enhance the effectiveness of our reward structure with a commitment to ensure we are focused on the alignment of the interests of our executives with the generation of long term shareholder value. During FY19, a total of 44 shareholder and stakeholder meetings were held including 9 meetings with shareholder advisory companies.
(e) Incentive design and performance assessmentThe Remuneration Committee oversees the process of setting robust measures and targets to encourage strong Senior Executive performance and behaviour that is aligned to our values. The FY19 EVP performance measures are summarised in section 3.1(c).
For each primary performance measure, no EVP outcome is awarded unless a threshold level of performance is achieved. If the primary performance measure targets are achieved we award 50 per cent of the total maximum potential. The maximum level is only paid if there is significant over achievement of targets on all primary performance measures.
At the end of each financial year, the Board reviews the company’s results, including the financial statements which are audited by Ernst & Young (EY) our external auditor and the results of the other non-financial performance measures which are audited by Telstra’s Group Internal Audit. The Employee Engagement Score (EES) is reviewed by EY. The Board determines the outcome of the EVP and any legacy LTI plan on foot, by assessing performance against each performance measure.
Each Senior Executive’s EVP outcome is ultimately at the discretion of the Board. In considering whether to exercise its discretion and change the outcome provided by the assessment of the primary performance measures, the Board assesses whether the proposed outcome is appropriate, including in the context of Telstra’s performance, customer experience and shareholder expectations. The Board also takes into account each Senior Executive’s performance and individual contribution during the year to determine their individual EVP outcome.
(f) Share Ownership PoliciesTelstra has in place an Executive Share Ownership Policy which applies to the CEO and Group Executives. The intent of the policy is to align the interests of the CEO and Group Executives with the interests of our long term shareholders.
Under the policy, the CEO and Group Executives are required to hold Telstra shares to the value of 100 per cent of their Fixed Remuneration within five years of their first appointment to Group Executive level. Commencing in FY20 the share ownership requirement has increased to 200 per cent of Fixed Remuneration for the CEO. Any Restricted Shares held by Senior Executives are included in calculating their shareholding for the purposes of this policy. Senior Executives must obtain Board or, in certain circumstances, CEO or Chairman approval before they sell shares if they have not yet met their share ownership requirements under the policy.
Those Senior Executives who have held a Group Executive position for at least five years have met the shareholding requirement as at 30 June 2019. Progress is monitored on an ongoing basis. For information on Senior Executives’ interests in Telstra Shares and how they are progressing against the shareholding requirement, refer to section 3.4. As at 30 June 2019, the CEO held Telstra shares to the value of 223 per cent of his Fixed Remuneration based on the Telstra closing share price of $3.85 on that date.
To align the interests of non-executive Directors with those of our shareholders, non-executive Directors are required to hold Telstra shares to the value of at least 100 per cent of the annual non-executive Director base fee, within five years of their appointment. The value of such shares is based on their price at the time of acquisition. Progress is monitored on an ongoing basis. As at the date of this report, all non-executive Directors have met this minimum holding requirement with the exception of two Directors who have been on the Board for 15 months or less. In August 2019, the policy was amended to include a higher minimum holding requirement for the Chairman of the Board, being at least 200 per cent of the annual non-executive Director base fee within five years of appointment as Chairman. Directors’ shareholdings as at 15 August 2019 are set out in the Directors’ Report.
(g) Restrictions and governanceAll KMP must comply with Telstra’s Securities Trading Policy, which includes a requirement that Telstra securities can only be traded during specified trading windows and with prior approval. KMP must also consider how any proposed dealing in Telstra securities could be perceived by the market and must not deal if the proposed dealing could be perceived as taking advantage of their position in an inappropriate way.
They are also prohibited from:
• speculative dealing in Telstra securities for short term gain, using Telstra securities as collateral in any financial transactions (including margin loan arrangements), or engaging in stock lending arrangements using their Telstra shares; and
• entering into any hedging arrangement that limits the economic risk of holding Telstra securities (including those held under Telstra equity plans).
This helps align our KMP’s interests with shareholders’ interests.
KMP are required to confirm on an annual basis that they comply with our Securities Trading Policy, which assists in monitoring and enforcing our policy.

45
Remuneration Report | Telstra Annual Report 2019
3.0 Senior Executive remuneration
3.1 FY19 Remuneration StructureThe following diagram illustrates the remuneration framework that applied to our Senior Executives during FY19.
Reinforce our culture and values
Reward achievement of financial and
strategic objectives
Align to long term shareholder value
creation
Attract, motivate and retain highly
skilled people
Market competitive base reward
Recognises sustainable performance in the medium to longer term
• Set based on skills, capabilities, experience and performance
• 35% of the FY19 EVP outcome is cash
Rewards annual performance, providing
specific focus on strategic priorities
• 26% of the FY19 EVP outcome is deferred as Restricted Shares
• Subject to claw-back and forfeiture
Recognises the criticality of strategic non-financial
measures as drivers of longer-term value creation
• 39% of the FY19 EVP outcome is allocated in Performance Rights subject to a Relative Total Shareholder Return (RTSR) performance condition
• Subject to claw-back and forfeiture
Focuses on achieving longer-term superior
performance for stakeholders
Cash
Base salary plus superannuation
FY19 EVP outcome based on communicated financial, strategic, customer and transformation priorities. Performance over the financial year is measured against stretching
financial and non-financial performance targets set at the start of the financial year.
Equity
Fixed Remuneration
Executive Variable Remuneration Plan (EVP)
(a) FY19 Remuneration mix for Senior ExecutivesThe graph below shows the FY19 remuneration mix for Senior Executives expressed as a percentage of Fixed Remuneration (FR).
CEO
EVP at Target = 200% of Fixed Remuneration comprised of:
Total Equity = 130% of Fixed Remuneration
52%*EVP Restricted Shares
100%Fixed Remuneration
78%*EVP Performance Rights
70%*EVP Cash
Other Senior Executives**
Total Equity = 117% of Fixed Remuneration
EVP at Target = 180% of Fixed Remuneration comprised of:
46.8%*EVP Restricted Shares
100%Fixed Remuneration
70.2%*EVP Performance Rights
63%* EVP Cash
* The percentages shown are calculated from the 35% Cash, 26% Restricted Share and 39% Performance Right components of the FY19 EVP multiplied by the FY19 EVP target opportunity for the CEO (200% of FR) and other Senior Executives (180% of FR).
** Warwick Bray - former CFO and Will Irving - former GE Telstra Wholesale ceased employment for a Permitted Reason while participating in the FY19 EVP. As disclosed in our FY18 Remuneration Report they will be allocated Cash Rights in lieu of Restricted Shares and Performance Rights under the FY19 EVP. The Cash Rights will be subject to the same time conditions and performance measures as those applying to the FY19 Restricted Shares and Performance Rights (except that the Cash Rights granted to Will Irving in lieu of the Performance Rights will not be subject to an RTSR performance condition due to constraints under the SSU). In addition they will also be entitled to receive the FY19 EVP cash component, pro-rated for their length of service during the year. As Robyn Denholm resigned from Telstra, she forfeited her FY19 EVP award.

46
(b) Current Senior Executive Fixed Remuneration and contract details The following table summarises the Fixed Remuneration, notice and termination payment provisions that apply under the ongoing service contracts for current Senior Executives.
Name TitleFR as at
15 August 2019 Notice periodTermination
payment
Andrew Penn CEO $2,390,000 6 months 6 months
Michael Ackland GE C&SB $1,000,000 6 months 6 months
Alex Badenoch GE T&P $930,000 6 months 6 months
Vicki Brady CFO $1,200,000 6 months 6 months
David Burns GE GBS $1,000,000 6 months 6 months
Michael Ebeid AM GE TE $1,150,000 6 months 6 months
Nikos Katinakis GE Networks & IT $1,100,000 6 months 6 months
Brendon Riley GE & CEO Telstra InfraCo $1,400,000 6 months 12 Months*
Christian Von Reventlow GE Product & Technology $1,100,000 6 months 6 months
* Brendon Riley has a 12 month termination payment clause in his contract that was negotiated upon commencing employment at Telstra in February 2011. Telstra’s current policy is to provide for a six month termination payment in executive contracts.
Upon notice being given, Telstra can require a Senior Executive to work through the notice period, or may terminate employment immediately by providing payment in lieu of notice, or a combination of both. Any payment in lieu of notice is calculated based on the Senior Executive’s Fixed Remuneration as at the date of termination.
There is no termination payment if termination is for serious misconduct, or for redundancy (unless the severance payment under Telstra’s redundancy policy would be less than the termination payment, in which case the termination payment applies instead).
(c) FY19 EVP StructureThe CEO and all Group Executives participated in the FY19 EVP. The construct of the FY19 EVP is illustrated in the diagram below:
FY19 FY20 FY21 FY22 FY23 FY24
Jul Jun Aug Oct Nov Jun Jul Jun Jul Jun Jul Jun Jul
FY19 EVP Performance Rights RTSR Performance Period1 July 2018 to 30 June 2023
Restricted Shares
Performance Rights
FY19 EVP Initial Performance
Period1 July 2018 to 30 June 2019
Restricted Shares End of restriction 30 June 2021
Performance RightsFinal RTSR Test 30 June 2023
FY19 Results Release
2019 AGM
EVP Cash Paid (35%)
EVP Equity Allocated (65%)
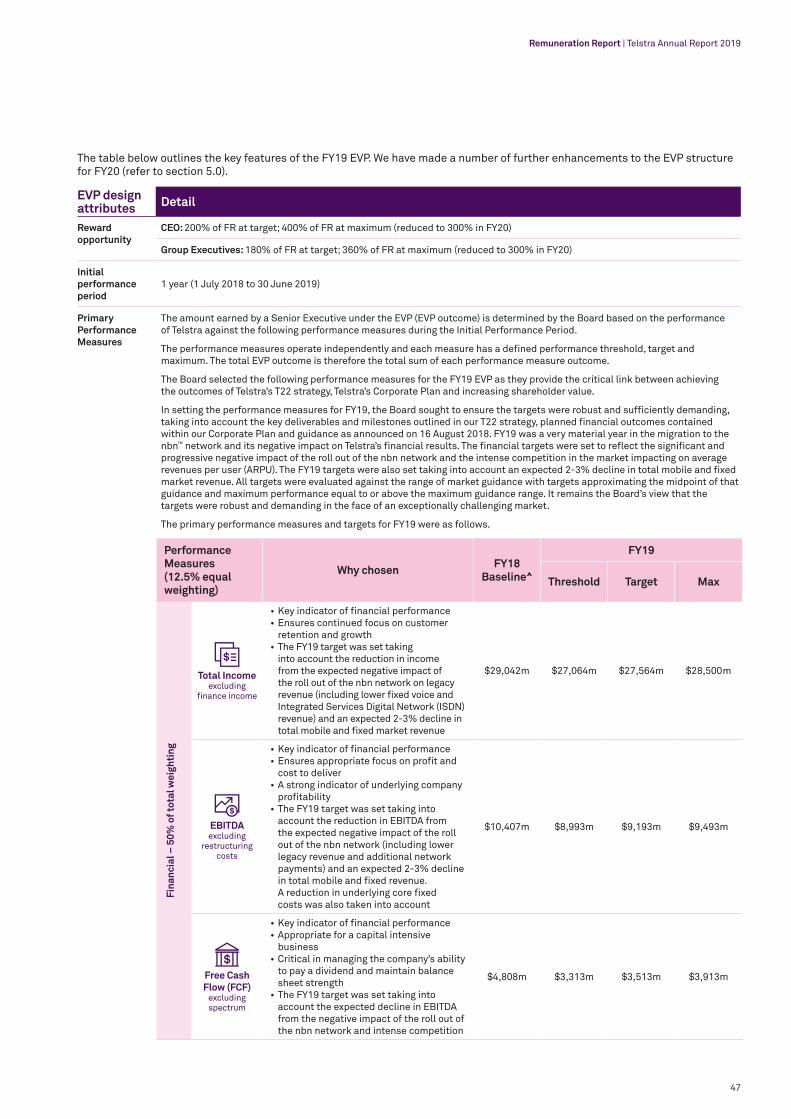
47
Remuneration Report | Telstra Annual Report 2019
EVP design attributes Detail
Reward opportunity
CEO: 200% of FR at target; 400% of FR at maximum (reduced to 300% in FY20)
Group Executives: 180% of FR at target; 360% of FR at maximum (reduced to 300% in FY20)
Initial performance period
1 year (1 July 2018 to 30 June 2019)
Primary Performance Measures
The amount earned by a Senior Executive under the EVP (EVP outcome) is determined by the Board based on the performance of Telstra against the following performance measures during the Initial Performance Period.
The performance measures operate independently and each measure has a defined performance threshold, target and maximum. The total EVP outcome is therefore the total sum of each performance measure outcome.
The Board selected the following performance measures for the FY19 EVP as they provide the critical link between achieving the outcomes of Telstra’s T22 strategy, Telstra’s Corporate Plan and increasing shareholder value.
In setting the performance measures for FY19, the Board sought to ensure the targets were robust and sufficiently demanding, taking into account the key deliverables and milestones outlined in our T22 strategy, planned financial outcomes contained within our Corporate Plan and guidance as announced on 16 August 2018. FY19 was a very material year in the migration to the nbn™ network and its negative impact on Telstra’s financial results. The financial targets were set to reflect the significant and progressive negative impact of the roll out of the nbn network and the intense competition in the market impacting on average revenues per user (ARPU). The FY19 targets were also set taking into account an expected 2-3% decline in total mobile and fixed market revenue. All targets were evaluated against the range of market guidance with targets approximating the midpoint of that guidance and maximum performance equal to or above the maximum guidance range. It remains the Board’s view that the targets were robust and demanding in the face of an exceptionally challenging market.
The primary performance measures and targets for FY19 were as follows.
Performance Measures(12.5% equal weighting)
Why chosen FY18 Baseline^
FY19
Threshold Target Max
Fina
ncia
l – 5
0% o
f tot
al w
eigh
ting
Total Incomeexcluding
finance income
• Key indicator of financial performance• Ensures continued focus on customer
retention and growth• The FY19 target was set taking
into account the reduction in income from the expected negative impact of the roll out of the nbn network on legacy revenue (including lower fixed voice and Integrated Services Digital Network (ISDN) revenue) and an expected 2-3% decline in total mobile and fixed market revenue
$29,042m $27,064m $27,564m $28,500m
EBITDAexcluding
restructuring costs
• Key indicator of financial performance• Ensures appropriate focus on profit and
cost to deliver• A strong indicator of underlying company
profitability• The FY19 target was set taking into
account the reduction in EBITDA from the expected negative impact of the roll out of the nbn network (including lower legacy revenue and additional network payments) and an expected 2-3% decline in total mobile and fixed revenue. A reduction in underlying core fixed costs was also taken into account
$10,407m $8,993m $9,193m $9,493m
Free Cash Flow (FCF)
excluding spectrum
• Key indicator of financial performance• Appropriate for a capital intensive
business • Critical in managing the company’s ability
to pay a dividend and maintain balance sheet strength
• The FY19 target was set taking into account the expected decline in EBITDA from the negative impact of the roll out of the nbn network and intense competition
$4,808m $3,313m $3,513m $3,913m
The table below outlines the key features of the FY19 EVP. We have made a number of further enhancements to the EVP structure for FY20 (refer to section 5.0).

48
EVP design attributes Detail
Primary Performance Measures(continued)
Performance Measures(12.5% equal weighting)
Why chosen FY18 Baseline^
FY19
Threshold Target Max
Net Opex Reduction(Underlying core fixed
cost reduction)
• Active reduction of our costs will be key to competing and delivering strong financial performance in an increasingly competitive market
• Delivering significant absolute cost reduction aligns with intent to drive productivity and reduce costs
– $388m $438m $513m
Str
ateg
ic, C
usto
mer
& T
rans
form
atio
n -
50%
of t
otal
wei
ghti
ng
Episode NPS(improvement in
Episode NPS points)
• A key driver of business success and our ability to differentiate in an increasingly competitive market
• Key to generating increased share of wallet from existing customers, maintaining a price premium, and attracting new customers
+19points
+21points
+24points
+27points
Product Portfolio
SimplificationNumber of
active plans
• Will increase the simplicity, transparency and satisfaction that our customers experience and allow the delivery of material cost reductions
C&
SB
(50%
w
eigh
ting
)
400products
40products
30products
20products
TE (5
0%
wei
ghti
ng)
651products
570products
549products
527products
Digital Delivery
C&SB Digital Sales
Transactions / Total
Transactions ratio
• Improves customer experience• Supports our cost reduction focus• Enables delivery of strong financial
results
6.2% 11.3% 14.0% 16.5%
People Capability
& EngagementMaintenance of employee engagement score (EES) from FY18
• Focusses on our employee engagement • Supports our ability to have both the key
leadership and technical talent required to deliver on our ambitious strategy
74 n/a 74 76
^ Baseline refers to FY18 results (as per the letter to shareholders dated 11 October 2018) that provide a comparison for FY19 performance.
Due to the provisions of the SSU, the former GE Telstra Wholesale is assessed against the following primary performance measures: Telstra Wholesale Income, Telstra Wholesale EBITDA and Telstra Wholesale NPS.

49
Remuneration Report | Telstra Annual Report 2019
EVP design attributes Detail
Secondary Performance Measures
In addition to the EVP primary performance measures (which are assessed over the initial performance period), 39% of the EVP outcome (in the form of Performance Rights) only vests if at the end of the five year performance period on 30 June 2023, the RTSR performance condition has been achieved. This means executives have a double hurdle, with performance measured over both the initial performance period and the five year RTSR performance period.
RTSR measures the performance of an ordinary Telstra share (including the value of any cash dividend and other shareholder benefits paid during the period) relative to the performance of ordinary securities issued by the other companies in the comparator group over the RTSR performance period.
The Board believes that RTSR is an appropriate secondary performance measure because it links executive reward to Telstra’s share price and dividend performance relative to companies in the ASX100 (excluding resources companies) over the long term.
The Performance Rights will only vest if Telstra’s RTSR ranks at the 50th percentile or greater against a comparator group comprising the ASX100 (excluding resource companies) as at 1 July 2018 over the five year performance period. For FY20 we have introduced a sliding RTSR vesting scale where vesting will be determined on a straight line scale, with 50% of the Performance Rights vesting if Telstra’s RTSR ranks at the 50th percentile of a comparator group, up to 100% of the Performance Rights vesting if Telstra’s RTSR ranks at the 75th percentile of the comparator group. No Performance Rights vest if Telstra’s RTSR ranks below the 50th percentile when compared with the comparator group.
For the purposes of RTSR performance testing for the FY19 EVP, the average market value of Telstra shares against which RTSR performance will be determined at the testing date of 30 June 2023, is $2.76 and was calculated by reference to Telstra’s daily closing share price over the 30 day period to 30 June 2018. Telstra measures the RTSR percentile ranking to two decimal places and rounds up to the nearest whole number if the two decimal places are .50 or above and rounds down to the nearest whole number if the two decimal places are below .50. If the RTSR performance condition is not satisfied, all of the FY19 EVP Performance Rights will lapse.
Due to the provisions of the SSU, Cash Rights allocated in lieu of Performance Rights to the former GE Telstra Wholesale will not be subject to a RTSR performance condition.
Board’s discretion to determining the EVP outcome
Each Senior Executive’s EVP outcome is ultimately at the discretion of the Board after taking into account matters which may include whether the proposed outcome is appropriate in the context of Telstra’s performance, customer experience and shareholder expectations, and the individual’s performance and contribution during the year.
EVP outcome – Cash vs equity balance
The EVP outcome is made up of a combination of cash (35%), Restricted Shares (26%) and Performance Rights (39%). This results in a 35:65 ratio of cash to equity. On vesting of a Performance Right, Telstra has discretion to provide the holder with a share or a cash amount equivalent to the value of a share at vesting. In FY20, the cash component of the EVP outcome will be reduced to 25% and the equity component increased to 75%.
Equity allocation methodology
Opportunity Outcome AwardNo. of Instruments
Allocated
VWAP
FR $
Primary performance
measure Result %
Target EVP Opportunity
%
FY19 EVP Outcome (Subject to Board
discretion)
35% Cash
26% Restricted Shares No. of Restricted Shares
39% Performance Rights (Subject to RTSR)
No. of Performance Rights (Subject to RTSR)
X X =
=÷
The number of Restricted Shares and Performance Rights to be granted is based on the dollar value of the EVP outcome, multiplied by 26% for Restricted Shares and 39% for Performance Rights, and then divided by the five day volume weighted average share price (VWAP) of Telstra shares commencing on the day after the FY19 results announcement (ie a face value allocation methodology).
Issue/exercise price
As the Restricted Shares and Performance Rights form part of a Senior Executive’s variable remuneration, no amount is payable by the Senior Executive on grant of the Restricted Shares or on grant or vesting of the Performance Rights. Both the Restricted Shares and any shares to be provided on the vesting of Performance Rights will be purchased on-market.
Restriction and performance periods for equity
Restricted Shares: Restriction Period ending 30 June 2021. (From FY20, Restricted Shares will be eligible to vest in four equal tranches, with 25% eligible to vest each year for the four years following the end of the initial performance period.)
Performance Rights: In addition to the initial performance period, the Performance Rights will be subject to a challenging RTSR performance condition over a five year performance period from 1 July 2018 to 30 June 2023. (From FY20, the secondary performance measure will be more challenging through the introduction of the sliding RTSR vesting scale.)
In certain limited circumstances, such as a takeover event where 50% or more of all issued fully paid shares in Telstra are acquired, the Board may exercise discretion to accelerate vesting of Performance Rights and accelerate the end of the Restriction Period of Restricted Shares.

50
At the 2019 AGM to be held on 15 October 2019, we will seek shareholder approval for the Restricted Shares and Performance Rights to be allocated to the CEO under the FY19 EVP.
The details of each EVP performance measure and outcome for FY19 are provided in section 3.2.
(d) Financial performanceThe table below provides a summary of Telstra’s key financial results over the past five financial years. A summary of how those results have been reflected in the EVP and LTI remuneration outcomes is provided in sections 3.2 and 3.3.
Financial Performance
FY19 FY18 FY17 FY16 FY15
$m $m $m $m $m
Earnings1
Total Income2 27,807 28,841 28,205 27,050 26,112
EBITDA2 7,984 10,197 10,679 10,465 10,553
Net Profit3 2,154 3,591 3,891 5,780 4,231
Shareholder Value
Share Price ($)4 3.85 2.62 4.30 5.56 6.14
Total Dividend Paid Per Share (cents)5 19.0 26.5 31.0 31.0 30.0
1. Total Income, EBITDA and Net Profit for FY18 have been restated due to the adoption of AASB 15 “Revenue from Contracts with Customers”. Refer to Note 1.5 – Adoption of new accounting standards in the Financial Report. As a result, the FY18 and FY19 results are prepared under this new standard and FY15-FY17 are prepared under the superseded revenue standard.
2. When there is a discontinued operation for the year, Total Income and EBITDA include only results from continuing operations. There have been no discontinued operations since FY16.
3. Net Profit attributable to equity holders of the Telstra entity includes results from continuing and discontinued operations (i.e. this includes the Autohome Group and the Sensis Group for FY16 and FY15).
4. Share prices are as at 30 June for the respective year. The closing share price for FY14 was $5.21. 5. We currently pay dividend to equity holders of the Telstra Entity twice a year, an interim and a final dividend. The amounts included in this table relates to dividends
paid during the financial year. Therefore, for each respective year, the amount includes the dividend paid for the previous year final dividend and the current year interim dividend. Refer to Note 4.1 in the Financial Report for further information.
EVP design attributes Detail
Dividends Restricted Shares: Participants receive dividends on Restricted Shares during the Restriction Period consistent with other Telstra shareholders.
Performance Rights: No dividends are paid on Performance Rights prior to vesting. For any Performance Rights that ultimately vest following satisfaction of the RTSR performance condition, a cash payment equivalent to the dividends paid by Telstra during the period between allocation of the Performance Rights and vesting will be made at or around the time of vesting, subject to applicable taxation (Dividend Equivalent Payment).
Leaver Before the Restricted Shares and Performance Rights are allocated: If a Senior Executive ceases employment for a Permitted Reason, the Senior Executive is eligible for a pro-rata EVP outcome based on the proportion of time employed during the initial performance period. The Senior Executive will receive a grant of Cash Rights (or, at the Board’s discretion, cash, if the Senior Executive ceases employment due to death, total and permanent disablement or certain medical conditions) in lieu of Performance Rights and Restricted Shares. On vesting, a Cash Right entitles the executive to a cash payment equivalent to the value of a share at the end of the applicable Restriction Period or performance period and dividends paid between the date the Cash Right is allocated and the end of the applicable Restriction Period or performance period. Where the Senior Executive receives Cash Rights, there is no change to the restriction and performance periods, or the RTSR performance condition. If the Senior Executive ceases employment for any other reason, their EVP entitlement is forfeited. The Cash Rights are subject to the same conditions as the equity awards provided to continuing executives which ensures equal treatment for all executives and that departing executives continue to make decisions that are aligned to the long term interests of our shareholders.
After the Restricted Shares and Performance Rights are allocated: If a Senior Executive ceases employment for a Permitted Reason after the equity is allocated, Restricted Shares and Performance Rights that have been allocated will remain on foot. There is no change to the restriction and performance periods, or the RTSR performance condition. If the Senior Executive ceases employment for any other reason, their EVP entitlement is forfeited.
Claw-back (malus)
The Board has discretion to claw-back Performance Rights and Restricted Shares if certain Claw-back Events occur during the performance period or Restriction Period. Claw-back Events include fraud, gross misconduct or material breach of obligations by the Senior Executive or behaviour that brings Telstra into disrepute, may negatively impact Telstra’s long term financial strength or causes a significant deterioration in Telstra’s financial performance. Our Claw-Back Events have also been expanded to cover conduct that may negatively impact on Telstra’s standing, reputation or relationship with its key regulators and behaviour that has resulted in a material breach of Telstra’s risk management framework.
In addition to the Claw-back Events outlined above, the Board has full discretion to claw-back unvested awards if it determines the awards constitute an inappropriate benefit.
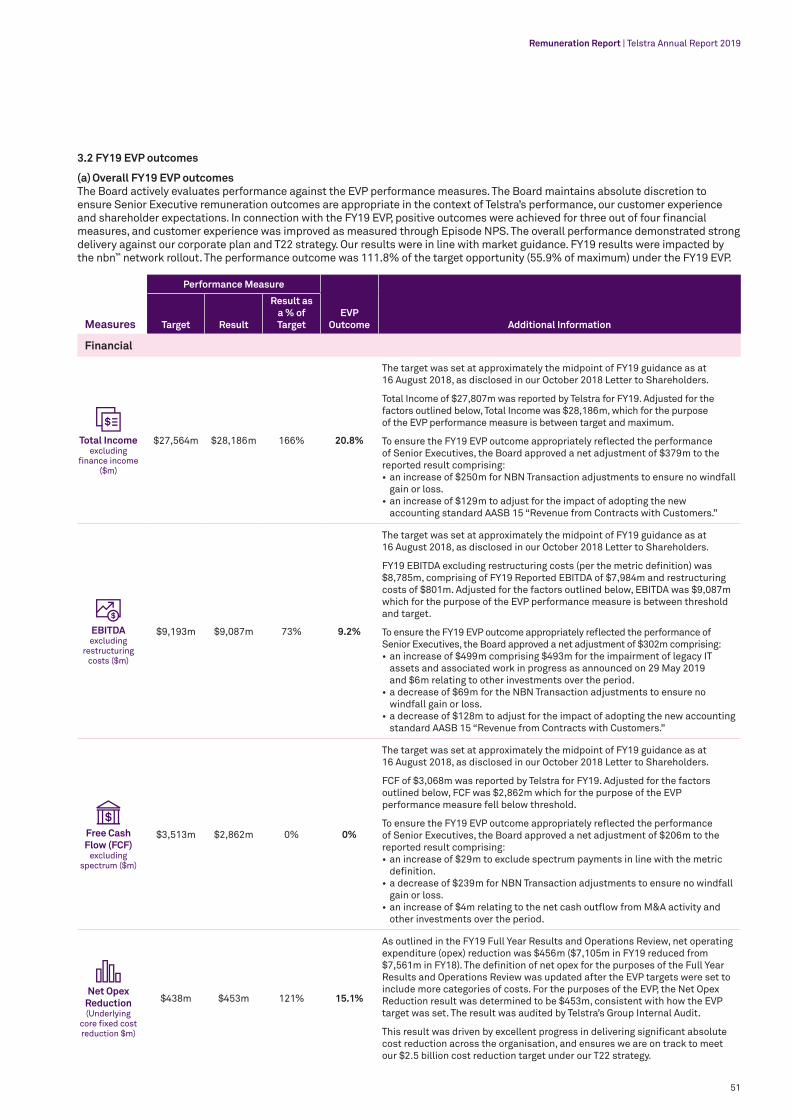
51
Measures
Performance Measure
EVP Outcome Additional InformationTarget Result
Result as a % of Target
Financial
Total Incomeexcluding
finance income ($m)
$27,564m $28,186m 166% 20.8%
The target was set at approximately the midpoint of FY19 guidance as at 16 August 2018, as disclosed in our October 2018 Letter to Shareholders.
Total Income of $27,807m was reported by Telstra for FY19. Adjusted for the factors outlined below, Total Income was $28,186m, which for the purpose of the EVP performance measure is between target and maximum.
To ensure the FY19 EVP outcome appropriately reflected the performance of Senior Executives, the Board approved a net adjustment of $379m to the reported result comprising:• an increase of $250m for NBN Transaction adjustments to ensure no windfall
gain or loss.• an increase of $129m to adjust for the impact of adopting the new
accounting standard AASB 15 “Revenue from Contracts with Customers.”
EBITDAexcluding
restructuring costs ($m)
$9,193m $9,087m 73% 9.2%
The target was set at approximately the midpoint of FY19 guidance as at 16 August 2018, as disclosed in our October 2018 Letter to Shareholders.
FY19 EBITDA excluding restructuring costs (per the metric definition) was $8,785m, comprising of FY19 Reported EBITDA of $7,984m and restructuring costs of $801m. Adjusted for the factors outlined below, EBITDA was $9,087m which for the purpose of the EVP performance measure is between threshold and target.
To ensure the FY19 EVP outcome appropriately reflected the performance of Senior Executives, the Board approved a net adjustment of $302m comprising: • an increase of $499m comprising $493m for the impairment of legacy IT
assets and associated work in progress as announced on 29 May 2019 and $6m relating to other investments over the period.
• a decrease of $69m for the NBN Transaction adjustments to ensure no windfall gain or loss.
• a decrease of $128m to adjust for the impact of adopting the new accounting standard AASB 15 “Revenue from Contracts with Customers.”
Free Cash Flow (FCF)
excluding spectrum ($m)
$3,513m $2,862m 0% 0%
The target was set at approximately the midpoint of FY19 guidance as at 16 August 2018, as disclosed in our October 2018 Letter to Shareholders.
FCF of $3,068m was reported by Telstra for FY19. Adjusted for the factors outlined below, FCF was $2,862m which for the purpose of the EVP performance measure fell below threshold.
To ensure the FY19 EVP outcome appropriately reflected the performance of Senior Executives, the Board approved a net adjustment of $206m to the reported result comprising: • an increase of $29m to exclude spectrum payments in line with the metric
definition. • a decrease of $239m for NBN Transaction adjustments to ensure no windfall
gain or loss.• an increase of $4m relating to the net cash outflow from M&A activity and
other investments over the period.
Net Opex Reduction(Underlying
core fixed cost reduction $m)
$438m $453m 121% 15.1%
As outlined in the FY19 Full Year Results and Operations Review, net operating expenditure (opex) reduction was $456m ($7,105m in FY19 reduced from $7,561m in FY18). The definition of net opex for the purposes of the Full Year Results and Operations Review was updated after the EVP targets were set to include more categories of costs. For the purposes of the EVP, the Net Opex Reduction result was determined to be $453m, consistent with how the EVP target was set. The result was audited by Telstra’s Group Internal Audit.
This result was driven by excellent progress in delivering significant absolute cost reduction across the organisation, and ensures we are on track to meet our $2.5 billion cost reduction target under our T22 strategy.
Remuneration Report | Telstra Annual Report 2019
3.2 FY19 EVP outcomes
(a) Overall FY19 EVP outcomesThe Board actively evaluates performance against the EVP performance measures. The Board maintains absolute discretion to ensure Senior Executive remuneration outcomes are appropriate in the context of Telstra’s performance, our customer experience and shareholder expectations. In connection with the FY19 EVP, positive outcomes were achieved for three out of four financial measures, and customer experience was improved as measured through Episode NPS. The overall performance demonstrated strong delivery against our corporate plan and T22 strategy. Our results were in line with market guidance. FY19 results were impacted by the nbn™ network rollout. The performance outcome was 111.8% of the target opportunity (55.9% of maximum) under the FY19 EVP.

52
Measures
Performance Measure
EVP Outcome Additional InformationTarget Result
Result as a % of Target
Customer, Strategic and People measures
Episode NPS(Improvement in
Episode NPS points)
+24 +25 133% 16.7%
The overall Episode NPS result for Telstra is a weighted average calculation of the survey results from Telstra business segments – 65% Consumer and Small Business (combined calculation) and 35% Enterprise (Telstra Enterprise Australia only).
The overall Episode NPS result was above target and was audited by Telstra’s Group Internal Audit.
The result increased significantly driven by excellent progress in key customer experiences including:• initiating company wide improvement programs focused on improving
customer experience, such as the introduction of a dedicated team to manage live chat orders.
• increasing our customer value proposition by launching new plans and eliminating customer pain-points such as excess data charges in Australia.
• increasing our level of service. We now offer our customers the ability to tailor their plans to meet their needs.
• servicing 248,105 moves during FY19. During this time, new approaches and tools were adopted to generate a more consistent moving home experience and to improve customer experience, which provided greater visibility of the move progress and quicker resolution of connectivity issues.
Product Portfolio
Simplification (Number of
active plans)
30 20 200% 12.5%
The FY19 Product Portfolio Simplification was achieved by the following:• C&SB: We launched our radically simplified product proposition and we now
have 20 core connectivity plans in market for our C&SB customers (compared to 1,800 plans previously, comprising 1,400 legacy and 400 active). Our mobile customers can now enjoy month-to-month plans with no lock in contracts, no excess data charges in Australia across mobile phone and broadband services, flexibility in how mobile handsets can be purchased and the ability to customise plans.
• TE: We have made excellent progress toward our T22 target of halving the number of Telstra Enterprise products by FY21. In FY19, we exceeded the target and reduced our active products to 517 in FY19. The TE products that were discontinued over the period included products covering IP and Private Network, Cloud, Internet of Things (IoT) value added services, mobile applications and Apps & Services.
549 517 200% 12.5%
Digital Delivery(C&SB Digital
Sales Transactions /
Total Transactions
ratio)
14.0% 16.8% 200% 25%
FY19 Digital Delivery increased significantly driven by excellent progress in key customer digital experiences as a result of the following:• We introduced month-to-month plan constructs with a guided and simplified
experience to help customers understand our plans and make a selection. • Marketing, search and media coverage resulted in an increase of online
traffic. Specific sales campaigns provided strong growth in online sales such as Click Frenzy offers, and the Samsung S10 5G trade in offer which allowed customers who purchased a Samsung S10+ to trade in/upgrade their device to the S10 5G device.
• Bundled product and service activations online improved by 36% year on year.• Due to digital campaign activity and live chat support, online nbn migration
was strong.• FY19 re-contract sales improved by 45% year on year, driven predominately
by the deployment of express check out and the clearance shopping experience.
People Capability & Engagement
Simplification (Employee
Engagement Score)
74 67 0% 0% The People Capability & Engagement measure was not achieved as the result was below target.
Total 111.8% 55.9% of the maximum EVP opportunity

53
The graph below shows the FY19 EVP and previous EVP and STI plan outcomes as a percentage of the target opportunity relative to the performance of Telstra’s share price over the past five years. The performance in the initial performance period for the FY19 EVP is measured against a scorecard similar to how performance was measured under the previous EVP and STI plans, albeit the measures and weightings have changed. We believe that including the historical EVP and STI outcomes in this graph provides a useful comparison. The FY19 performance outcome reflects significant progress against the T22 transformation and delivery of financial results in line with expectations.
1. The average EVP/STI outcomes as a percentage of target is shown for all KMP for the relevant period.
2. Excludes LTI plan awards which were previously granted at the maximum opportunity of 200% of Fixed Remuneration for the CEO and 160% of Fixed Remuneration for Group Executives.
STI/
EVP
Pay
out %
of T
arge
t1
0%
20%
40%
60%
80%
100%
120%
140%
$1.00
$0.00
$2.00
$3.00
$4.00
$5.00
$6.00
$7.00
FY15 STI2
30/06/2015
81%
FY16 STI2
30/06/2016FY17 STI2
30/06/2017FY18 EVP
30/06/2018FY19 EVP
30/06/2019
Historical STI EVP Cash EVP Restricted Shares EVP Performance Rights (RTSR) Telstra Share Price
Remuneration Report | Telstra Annual Report 2019
3.3 FY17 LTI plan outcomes
The performance period for the FY17 LTI plan concluded on 30 June 2019. The details of the FY17 LTI plan outcome against the two equally weighted performance measures, Relative Total Shareholder Return (RTSR) and Free Cashflow Return On Investment (FCF ROI) are provided below.
(a) RTSR The results of the RTSR performance measure were calculated by an external provider and audited by Telstra’s Group Internal Audit team. The RTSR vesting result was based on Telstra ranking at the 14th percentile of the global telecommunications companies peer group. This outcome was below the threshold for vesting and resulted in no vesting for the RTSR component of the FY17 LTI plan.
(b) FCF ROIAs disclosed in our FY18 Remuneration Report, when testing the FCF ROI measure, any reward would reflect the Board’s assessment of management’s performance in delivering against the strategic investment program (both the costs and benefits of the program). In 2016, we announced an additional investment of up to $3 billion over three years on our networks for the future and digitisation to transform our business and drive improvements in customer experience. These investments have driven improvements in our network superiority, digital capabilities, customer experience and have become a key enabler of our T22 transformation strategy. You can read more about the investment we made in networks and digital capability in the Strategy and Performance section of our FY19 Annual Report.
FCF ROI adjustments Consistent with prior years, when assessing the FCF ROI performance the Board considered a range of potential impacts to reported results. These included spectrum purchases and other acquisitions and divestments, gains or losses due to the timing of the nbn™ network rollout, other significant out of plan business developments and material regulatory or legislative changes. Through this assessment, the Board sought to ensure there were no windfall gains or losses and that the outcome reflected the Board’s assessment of management’s performance in delivering against the FCF ROI targets.
The Board concluded a detailed assessment of performance under the FY17 LTI plan taking into account both the cost and benefits of the strategic investment program. The Board concluded that management had delivered the program outcomes above the expectations established in 2016 and provided critical capabilities which have been crucial to the delivery of the T22 program.
An adjustment to the FCF ROI target to reflect the delivery of the strategic investment program combined with the other FCF ROI adjustments would have resulted in a FCF ROI outcome above threshold and a vesting outcome for the FCF ROI component to plan participants. However, while recognising management’s strong delivery of the strategic investment program, the Board determined, in light of the shareholder experience over the performance period, to apply its discretion not to vest the FCF ROI component of the FY17 LTI plan.
This decision has resulted in no vesting for the FCF ROI component of the FY17 LTI plan.
70.6%
111.8%
43.6%Performance Rights (RTSR)
18.4%Restricted
Shares
24.7%Cash
39.1%Cash
122%
82.6%
27.5%Performance Rights (RTSR) 29.1%
Restricted Shares
Tels
tra
Sha
re P
rice
($)

54
Tels
tra
Sha
re P
rice
($)
% L
TI o
f max
imum
0%
10%
20%
30%
40%
50%
60%
$1.00
$2.00
$3.00
$4.00
$5.00
$6.00
$7.0053.0%
30/06/2016LTI Plan: FY14
30/06/2017 LTI Plan: FY15
30/06/2018LTI Plan: FY16
30/06/2019 LTI Plan: FY17
0.0%0.0%0.0%
LTI Plan Payout Telstra Share Price
(c) Historical LTI plan performance relative to Telstra share priceThe following chart compares Telstra’s LTI plan vesting results for FY14 – FY17 LTI plans (as a percentage of plan maximum opportunity) to the Telstra share price during the same period:

55
3.4 Detailed remuneration and interests in Telstra shares
The tables in this section disclose Senior Executive information and only represent their time as Senior Executives.
(a) Actual pay which crystallised in FY19 for the CEOAs a general principle, the Australian Accounting Standards require the value of share-based payments to be calculated at the time of grant and expensed over the performance period and Restriction Period. This may not reflect what Senior Executives actually received or became entitled to during the year.
The following table is a voluntary disclosure and is not prepared in accordance with Australian Accounting Standards, but is designed to provide greater transparency for shareholders.
It details the actual pay the CEO received in each of the past four years. We consider this information to be helpful to assist shareholders in understanding the actual pay received by the CEO from the various components of his remuneration from FY16 to FY19.
As the CEO receives a significant portion of his variable remuneration in the form of equity, the value of actual pay received on his variable components is tied directly to Telstra’s share price performance. We believe this demonstrates that our reward framework is effective as variable compensation is aligned with our shareholders’ interests and demonstrates an appropriate level of pay for performance over the period.
Due to the significant change in the structure of the organisation during FY19 and the consequential changes in Senior Executives during the year, we have not included this information for Senior Executives as the majority of Senior Executives have been KMP for less than a full year.
The statutory tables for Senior Executive remuneration can be found in Sections 3.4(b) to (e).
Name Year
Fixed Remuneration
($000)2
EVP/STI payable as
cash ($000)3
Value of STI & EVP
Restricted Shares that
became unrestricted
($000)4,5
Value of LTI that became unrestricted
($000)4,6Total
($000)
% change from prior
year
Andrew Penn
2019 2,390 1,870 738 – 4,998 +33.6%
20181 2,374 1,103 263 – 3,740 -28.1%
20171 2,325 1,486 349 1,039 5,199 -23.1%
20161 2,325 1,200 438 2,795 6,758 –
1. As reported in our Remuneration Reports for FY18 to FY16.2. As disclosed in the FY18 Remuneration Report, the CEO’s change in Fixed Remuneration to $2.39 million took effect from 1 October 2017. The value reported for FY19
represents a full year of FR of $2.39 million. 3. For FY19 and FY18, the amounts relate to the cash component of the FY19 and FY18 EVP, respectfully. For FY17 and FY16, the amounts relate to the cash component of
the historical FY17 and FY16 STI plans. For FY19, the amount earned under the FY19 EVP will be payable in September 2019.4. Equity in this table has been valued based on the Telstra closing share price on 30 June 2019. 5. Amount relates to the value of variable remuneration earned in prior financial years which was provided as Restricted Shares. For amounts reported for FY19,
the restriction period for these shares ended on 30 June 2019 and relates to Tranche 2 of the FY17 STI deferral and Tranche 1 of the FY18 EVP.6. The outcome of the FY16 and FY15 LTI plans was that none of the Performance Rights vested as Restricted Shares, therefore no shares became unrestricted on
30 June 2019 or 30 June 2018, respectively. For the value reported in 2017 the amount relates to the FY14 LTI plan which was released from restriction on 30 June 2017. For the value reported in 2016, the amount relates to the FY13 LTI plan which was released from restriction on 30 June 2016.
Remuneration Report | Telstra Annual Report 2019

56
Short term employee benefitsPost-
employment benefits
Termination benefits
Other long term benefits
Equity settled share-based payments
Cash settled share-based
payments
Accounting value (at risk) ($)8,9
Name and title YearSalary &
fees ($000)1
EVP (cash) ($000)2
Non- monetary
benefits ($000)3
Other ($000)4
Superannuation ($000)5
Termination benefits ($000)6
Accrued leave
benefits ($000)7
Dividend Equivalent Payment Accural
($000)
Restricted shares ($000)10
Performance rights ($000)11
Cash rights ($000)12
Total ($000)13
Andrew PennCEO
2019 2,369 1,870 10 7 21 – 59 31 838 (86) – 5,119
2018 2,354 1,103 5 46 20 – 59 – 672 305 – 4,564
Michael AcklandGE C&SB
2019 691 637 4 (9) 16 – 14 – 140 438 – 1,931
2018 – – – – – – – – – – – –
Alex BadenochGE T&P
2019 680 563 5 27 15 – 13 7 200 3 – 1,513
2018 – – – – – – – – – – – –
Vicki BradyFormer GE C&SB
2019 193 155 2 (73) 4 – 1 2 54 10 – 348
2018 803 340 5 220 16 – 20 – 159 92 – 1,655
David Burns14 GE GBS
2019 922 655 206 138 19 – 21 – 177 4 – 2,142
2018 – – – – – – – – – – – –
Robyn DenholmCFO
2019 1,103 – 7 (9) 20 – 26 – 28 (62) – 1,113
2018 1,080 559 6 3 20 – 27 – 248 62 – 2,005
Michael Ebeid AMGE TE
2019 845 563 3 22 15 – 16 – 88 51 – 1,603
2018 – – – – – – – – – – – –
Nikos KatinakisGE N&IT
2019 766 550 164 134 15 – 14 – 83 48 – 1,774
2018 – – – – – – – – – – – –
Brendon RileyGE & CEO InfraCo
2019 1,379 917 10 (4) 21 – 35 16 384 (69) – 2,689
2018 1,367 582 10 38 20 – 34 – 379 222 – 2,652
Christian Von ReventlowGE P&T
2019 716 385 123 258 14 – 12 – 55 32 – 1,595
2018 – – – – – – – – – – – –
Warwick BrayFormer CFO
2019 310 222 1 (38) 5 1,048 2 24 (149) (306) 753 1,872
2018 1,187 519 2 (10) 25 – 30 – 320 98 – 2,171
Will IrvingFormer GE TW
2019 247 103 4 (8) 5 1,817 2 21 35 (85) 863 3,004
2018 980 461 9 – 20 – 3 – 283 235 – 1,991
Total current and former KMP
2019 10,221 6,620 539 445 170 2,865 215 101 1,933 (22) 1,616 24,703
2018 7,771 3,564 37 297 121 – 173 – 2,061 1,014 – 15,038
(b) Senior Executive remuneration (main table) The table below has been prepared in accordance with the requirements of the Corporations Act and the relevant Australian Accounting Standards. The figures provided under the equity and cash settled share-based payments columns are based on accounting values and do not reflect actual payments received by Senior Executives in FY19.
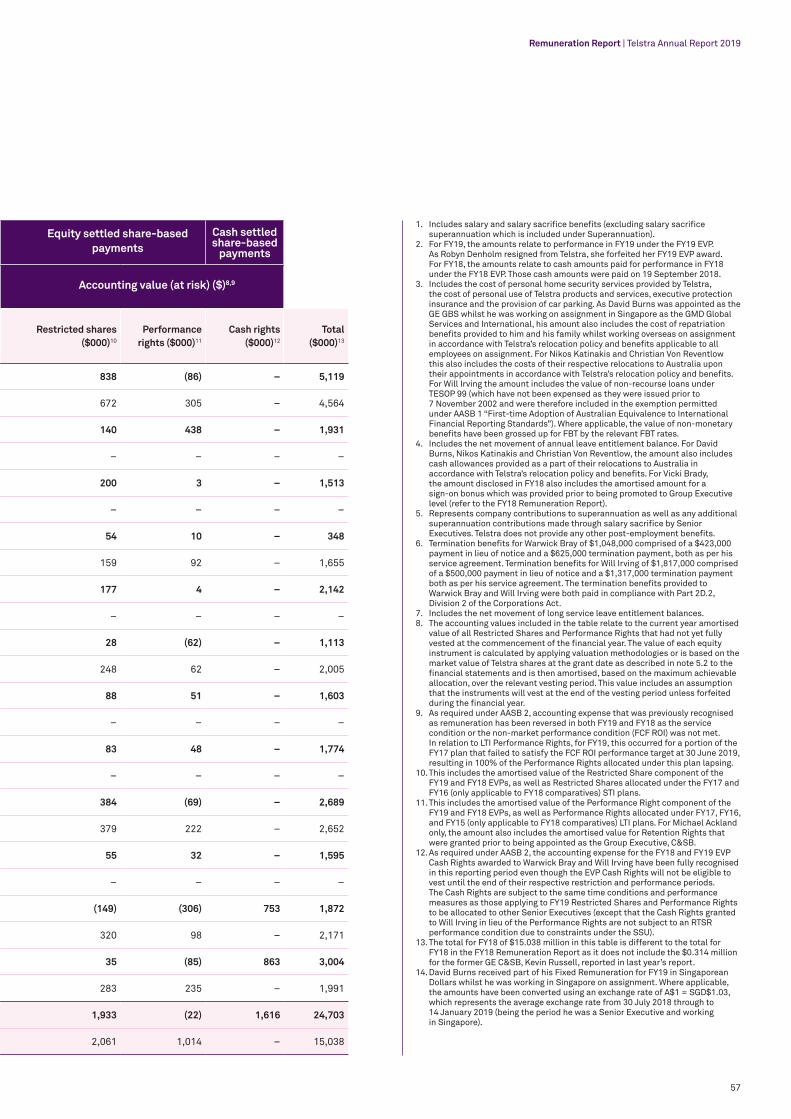
57
Short term employee benefitsPost-
employment benefits
Termination benefits
Other long term benefits
Equity settled share-based payments
Cash settled share-based
payments
Accounting value (at risk) ($)8,9
Name and title YearSalary &
fees ($000)1
EVP (cash) ($000)2
Non- monetary
benefits ($000)3
Other ($000)4
Superannuation ($000)5
Termination benefits ($000)6
Accrued leave
benefits ($000)7
Dividend Equivalent Payment Accural
($000)
Restricted shares ($000)10
Performance rights ($000)11
Cash rights ($000)12
Total ($000)13
Andrew PennCEO
2019 2,369 1,870 10 7 21 – 59 31 838 (86) – 5,119
2018 2,354 1,103 5 46 20 – 59 – 672 305 – 4,564
Michael AcklandGE C&SB
2019 691 637 4 (9) 16 – 14 – 140 438 – 1,931
2018 – – – – – – – – – – – –
Alex BadenochGE T&P
2019 680 563 5 27 15 – 13 7 200 3 – 1,513
2018 – – – – – – – – – – – –
Vicki BradyFormer GE C&SB
2019 193 155 2 (73) 4 – 1 2 54 10 – 348
2018 803 340 5 220 16 – 20 – 159 92 – 1,655
David Burns14 GE GBS
2019 922 655 206 138 19 – 21 – 177 4 – 2,142
2018 – – – – – – – – – – – –
Robyn DenholmCFO
2019 1,103 – 7 (9) 20 – 26 – 28 (62) – 1,113
2018 1,080 559 6 3 20 – 27 – 248 62 – 2,005
Michael Ebeid AMGE TE
2019 845 563 3 22 15 – 16 – 88 51 – 1,603
2018 – – – – – – – – – – – –
Nikos KatinakisGE N&IT
2019 766 550 164 134 15 – 14 – 83 48 – 1,774
2018 – – – – – – – – – – – –
Brendon RileyGE & CEO InfraCo
2019 1,379 917 10 (4) 21 – 35 16 384 (69) – 2,689
2018 1,367 582 10 38 20 – 34 – 379 222 – 2,652
Christian Von ReventlowGE P&T
2019 716 385 123 258 14 – 12 – 55 32 – 1,595
2018 – – – – – – – – – – – –
Warwick BrayFormer CFO
2019 310 222 1 (38) 5 1,048 2 24 (149) (306) 753 1,872
2018 1,187 519 2 (10) 25 – 30 – 320 98 – 2,171
Will IrvingFormer GE TW
2019 247 103 4 (8) 5 1,817 2 21 35 (85) 863 3,004
2018 980 461 9 – 20 – 3 – 283 235 – 1,991
Total current and former KMP
2019 10,221 6,620 539 445 170 2,865 215 101 1,933 (22) 1,616 24,703
2018 7,771 3,564 37 297 121 – 173 – 2,061 1,014 – 15,038
Remuneration Report | Telstra Annual Report 2019
1. Includes salary and salary sacrifice benefits (excluding salary sacrifice superannuation which is included under Superannuation).
2. For FY19, the amounts relate to performance in FY19 under the FY19 EVP. As Robyn Denholm resigned from Telstra, she forfeited her FY19 EVP award. For FY18, the amounts relate to cash amounts paid for performance in FY18 under the FY18 EVP. Those cash amounts were paid on 19 September 2018.
3. Includes the cost of personal home security services provided by Telstra, the cost of personal use of Telstra products and services, executive protection insurance and the provision of car parking. As David Burns was appointed as the GE GBS whilst he was working on assignment in Singapore as the GMD Global Services and International, his amount also includes the cost of repatriation benefits provided to him and his family whilst working overseas on assignment in accordance with Telstra’s relocation policy and benefits applicable to all employees on assignment. For Nikos Katinakis and Christian Von Reventlow this also includes the costs of their respective relocations to Australia upon their appointments in accordance with Telstra’s relocation policy and benefits. For Will Irving the amount includes the value of non-recourse loans under TESOP 99 (which have not been expensed as they were issued prior to 7 November 2002 and were therefore included in the exemption permitted under AASB 1 “First-time Adoption of Australian Equivalence to International Financial Reporting Standards”). Where applicable, the value of non-monetary benefits have been grossed up for FBT by the relevant FBT rates.
4. Includes the net movement of annual leave entitlement balance. For David Burns, Nikos Katinakis and Christian Von Reventlow, the amount also includes cash allowances provided as a part of their relocations to Australia in accordance with Telstra’s relocation policy and benefits. For Vicki Brady, the amount disclosed in FY18 also includes the amortised amount for a sign-on bonus which was provided prior to being promoted to Group Executive level (refer to the FY18 Remuneration Report).
5. Represents company contributions to superannuation as well as any additional superannuation contributions made through salary sacrifice by Senior Executives. Telstra does not provide any other post-employment benefits.
6. Termination benefits for Warwick Bray of $1,048,000 comprised of a $423,000 payment in lieu of notice and a $625,000 termination payment, both as per his service agreement. Termination benefits for Will Irving of $1,817,000 comprised of a $500,000 payment in lieu of notice and a $1,317,000 termination payment both as per his service agreement. The termination benefits provided to Warwick Bray and Will Irving were both paid in compliance with Part 2D.2, Division 2 of the Corporations Act.
7. Includes the net movement of long service leave entitlement balances.8. The accounting values included in the table relate to the current year amortised
value of all Restricted Shares and Performance Rights that had not yet fully vested at the commencement of the financial year. The value of each equity instrument is calculated by applying valuation methodologies or is based on the market value of Telstra shares at the grant date as described in note 5.2 to the financial statements and is then amortised, based on the maximum achievable allocation, over the relevant vesting period. This value includes an assumption that the instruments will vest at the end of the vesting period unless forfeited during the financial year.
9. As required under AASB 2, accounting expense that was previously recognised as remuneration has been reversed in both FY19 and FY18 as the service condition or the non-market performance condition (FCF ROI) was not met. In relation to LTI Performance Rights, for FY19, this occurred for a portion of the FY17 plan that failed to satisfy the FCF ROI performance target at 30 June 2019, resulting in 100% of the Performance Rights allocated under this plan lapsing.
10. This includes the amortised value of the Restricted Share component of the FY19 and FY18 EVPs, as well as Restricted Shares allocated under the FY17 and FY16 (only applicable to FY18 comparatives) STI plans.
11. This includes the amortised value of the Performance Right component of the FY19 and FY18 EVPs, as well as Performance Rights allocated under FY17, FY16, and FY15 (only applicable to FY18 comparatives) LTI plans. For Michael Ackland only, the amount also includes the amortised value for Retention Rights that were granted prior to being appointed as the Group Executive, C&SB.
12. As required under AASB 2, the accounting expense for the FY18 and FY19 EVP Cash Rights awarded to Warwick Bray and Will Irving have been fully recognised in this reporting period even though the EVP Cash Rights will not be eligible to vest until the end of their respective restriction and performance periods. The Cash Rights are subject to the same time conditions and performance measures as those applying to FY19 Restricted Shares and Performance Rights to be allocated to other Senior Executives (except that the Cash Rights granted to Will Irving in lieu of the Performance Rights are not subject to an RTSR performance condition due to constraints under the SSU).
13. The total for FY18 of $15.038 million in this table is different to the total for FY18 in the FY18 Remuneration Report as it does not include the $0.314 million for the former GE C&SB, Kevin Russell, reported in last year’s report.
14. David Burns received part of his Fixed Remuneration for FY19 in Singaporean Dollars whilst he was working in Singapore on assignment. Where applicable, the amounts have been converted using an exchange rate of A$1 = SGD$1.03, which represents the average exchange rate from 30 July 2018 through to 14 January 2019 (being the period he was a Senior Executive and working in Singapore).

58
(c) FY19 EVP Payments (cash and equity)
Breakdown of FY19 EVP Outcome1
Name
Maximum potential EVP
opportunity ($000)2
35% Cash component
($000)
26% Restricted
Shares component
($000)3
39% Restricted
Rights component
($000)3Total grant
of EVP ($000)
% of maximum
opportunity earned
% of maximum
opportunity forfeited
Andrew Penn 9,560 1,870 1,389 2,084 5,343 55.9% 44.1%
Michael Ackland 2,505 637 473 710 1,820 72.7% 27.3%
Alex Badenoch 2,504 563 419 628 1,610 64.3% 35.7%
Vicki Brady 852 155 115 173 443 52.0% 48.0%
David Burns 3,349 655 487 730 1,872 55.9% 44.1%
Robyn Denholm 4,320 – – – – 0.0% 100.0%
Michael Ebeid AM 3,096 563 419 628 1,610 52.0% 48.0%
Nikos Katinakis 2,810 550 408 613 1,571 55.9% 44.1%
Brendon Riley 5,040 917 681 1,022 2,620 52.0% 48.0%
Christian Von Reventlow 2,626 385 286 429 1,100 41.9% 58.1%
Warwick Bray 1,134 222 165 247 634 55.9% 44.1%
Will Irving 706 103 76 115 294 41.6% 58.4%
1. The FY19 EVP outcomes were approved by the Board on 14 August 2019. These values represent the time served in FY19 as a Senior Executive. The cash component of the FY19 EVP will be paid in September 2019.
2. Represents the maximum potential EVP opportunity specific to their time as Senior Executives for FY19, adjusted for any variation in Fixed Remuneration throughout FY19 that impacts the maximum potential EVP opportunity available. If the minimum threshold performance is not met, the minimum possible EVP payment is nil.
3. The Restricted Shares and Performance Rights awarded are expected to be allocated in November 2019 and are subject to Restriction Periods and performance periods (as set out in section 3.1(c)) subject to the Senior Executive’s continued employment. As Will Irving and Warwick Bray ceased employment for a Permitted Reason whilst being a participant in the FY19 EVP but prior to the Restricted Shares and Performance Rights being allocated, they will be allocated Cash Rights in lieu of those Restricted Shares and Performance Rights. The Cash Rights are subject to the same time conditions and performance measures as those applying to the FY19 Restricted Shares and Performance Rights to be allocated to other Senior Executives (except that the Cash Rights granted to Will Irving in lieu of the Performance Rights are not subject to an RTSR performance condition due to constraints under the SSU).

59
(d) Number and value of rights over equity instruments allocated, vested and exercised during FY19
Equity Movements Equity Outcomes
Name
Total held at 1 July
20181
Allocated during FY192
Value of rights
allocated ($000)3
Rights vested /
exercised during FY194
Value of rights
vested/ exercised
($000)5
Other changes (lapsed rights)6
Total held at 30 June
20197
Achieved perfor-mance target during
FY198
Andrew Penn 853,210 383,554 469,854 – – (853,210) 383,554 –
Michael Ackland 339,480 – – – – – 339,480 –
Alex Badenoch 142,202 115,548 143,857 – – (142,202) 115,548 –
Vicki Brady 85,872 – – – – (85,872) – –
David Burns 90,838 – – – – (90,838) – –
Robyn Denholm – 194,184 241,759 – – (194,184) –
Michael Ebeid AM – – – – – – – –
Nikos Katinakis – – – – – – – –
Brendon Riley 396,330 202,208 251,749 – – (396,330) 202,208 –
Christian Von Reventlow – – – – – – – –
Warwick Bray 322,936 – – – – (322,936) – –
Will Irving9 – – – – – – – –
In the table above, vest has the meaning defined in the Australian Accounting Standards. A Performance Right vests when it has been performance tested and the resultant share has been released from restriction and provided to the executive. Table 3.4(e) includes details of such shares provided during FY19.
All service and performance conditions for rights granted in previous financial years and that have vested or been exercised in FY19 are summarised in the Remuneration Report for each relevant year of grant. Each equity instrument granted, vested or exercised in FY19 (where applicable) in the table above was issued by Telstra and resulted or will result in one ordinary Telstra share being provided to the holder per equity instrument granted, vested or exercised. No amount is payable by the KMP. Restricted Shares are excluded from this table, refer to tables 3.4(c) and (e) for further information.
1. The balance reflects the number of equity instruments held on 1 July 2018 or the date on which the executive commenced as a KMP. Refer to section 2.1 for further information.
2. Performance Rights allocated during FY19 relate to the FY18 EVP which were allocated on 7 November 2018. The FY19 EVP Performance Rights will be allocated in November 2019. Refer to section 3.1 for more information.
3. The fair value reflects the valuation approach required by AASB 2 using an option pricing model for Performance Rights granted. The fair value of the Performance Rights allocated in FY19 under the FY18 EVP are based on the grant dates of 17 October 2017 for the CEO and 29 September 2017 for all other Senior Executives, respectively. The fair value of Performance Rights granted under the FY18 EVP are $1.20 (Tranche 1) and $1.25 (Tranche 2) for the CEO, and $1.22 (Tranche 1) and $1.27 (Tranche 2) for Senior Executives.
4. Relates to Performance Rights vesting as defined above. For FY19, there were no Performance Rights that vested. For more information on our Senior Executives’ interests in Telstra Shares refer to table 3.4(e).
5. The value of the Performance Rights vested/exercised reflects the market value at the date the instruments vested and were released from restriction.6. Relates to Performance Rights that lapsed due to the specified performance measures or service conditions not being achieved. Performance Rights in this column
relate to the FY17 LTI plan that was performance tested at the end of FY19 and resulted in 100 per cent of the Performance Rights lapsing. For Robyn Denholm only, the amount relates to the FY18 EVP Performance Rights that lapsed upon her ceasing employment.
7. The balance reflects the number of Performance Rights held at 30 June 2019 or the date on which the executive ceased to hold the KMP position. Refer to section 2.1 for further information.
8. Relates to instruments that have been performance tested for the performance period ending on 30 June 2019 and met the specified performance measures. Performance Rights in this column relate to the FY17 LTI plan that was performance tested at the end of FY19 and resulted in 0% per cent of the Performance Rights vesting into Restricted Shares.
9. In his capacity as GE Telstra Wholesale, Will Irving was not granted any LTI Performance Rights due to constraints under the SSU. Instead he participated in a LTI Restricted Share plan (refer to table 3.4 (e) for his interests in Telstra shares). He will receive Cash Rights in lieu of Restricted Shares and Performance Rights under the FY18 EVP and FY19 EVP as he ceased employment for a Permitted Reason prior to the respective equity allocations.
There are no Performance Rights or options held by any KMP’s related parties and no Performance Rights or options held indirectly or beneficially by our KMP. As at 30 June 2019, there were no options or Performance Rights vested, or vested and exercisable or vested and unexercisable.
Remuneration Report | Telstra Annual Report 2019
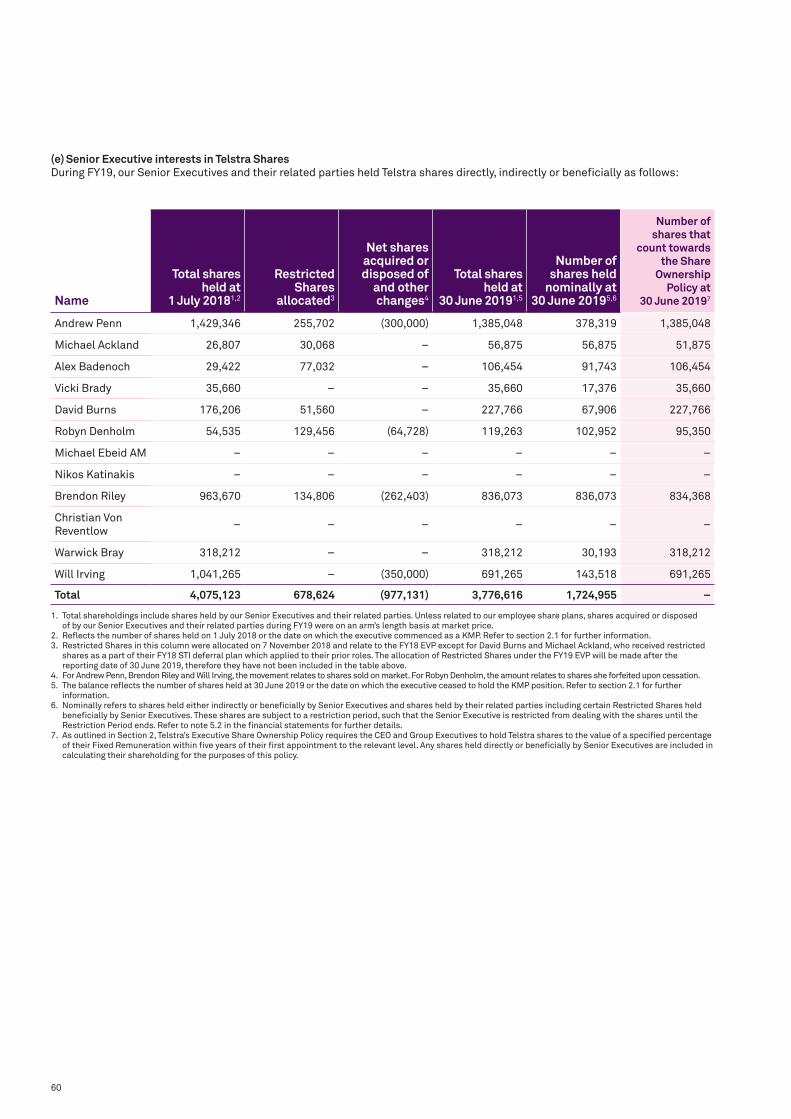
60
Name
Total shares held at
1 July 20181,2
Restricted Shares
allocated3
Net shares acquired or disposed of
and other changes4
Total shares held at
30 June 20191,5
Number of shares held
nominally at 30 June 20195,6
Number of shares that
count towards the Share
Ownership Policy at
30 June 20197
Andrew Penn 1,429,346 255,702 (300,000) 1,385,048 378,319 1,385,048
Michael Ackland 26,807 30,068 – 56,875 56,875 51,875
Alex Badenoch 29,422 77,032 – 106,454 91,743 106,454
Vicki Brady 35,660 – – 35,660 17,376 35,660
David Burns 176,206 51,560 – 227,766 67,906 227,766
Robyn Denholm 54,535 129,456 (64,728) 119,263 102,952 95,350
Michael Ebeid AM – – – – – –
Nikos Katinakis – – – – – –
Brendon Riley 963,670 134,806 (262,403) 836,073 836,073 834,368
Christian Von Reventlow
– – – – – –
Warwick Bray 318,212 – – 318,212 30,193 318,212
Will Irving 1,041,265 – (350,000) 691,265 143,518 691,265
Total 4,075,123 678,624 (977,131) 3,776,616 1,724,955 –
1. Total shareholdings include shares held by our Senior Executives and their related parties. Unless related to our employee share plans, shares acquired or disposed of by our Senior Executives and their related parties during FY19 were on an arm’s length basis at market price.
2. Reflects the number of shares held on 1 July 2018 or the date on which the executive commenced as a KMP. Refer to section 2.1 for further information. 3. Restricted Shares in this column were allocated on 7 November 2018 and relate to the FY18 EVP except for David Burns and Michael Ackland, who received restricted
shares as a part of their FY18 STI deferral plan which applied to their prior roles. The allocation of Restricted Shares under the FY19 EVP will be made after the reporting date of 30 June 2019, therefore they have not been included in the table above.
4. For Andrew Penn, Brendon Riley and Will Irving, the movement relates to shares sold on market. For Robyn Denholm, the amount relates to shares she forfeited upon cessation. 5. The balance reflects the number of shares held at 30 June 2019 or the date on which the executive ceased to hold the KMP position. Refer to section 2.1 for further
information. 6. Nominally refers to shares held either indirectly or beneficially by Senior Executives and shares held by their related parties including certain Restricted Shares held
beneficially by Senior Executives. These shares are subject to a restriction period, such that the Senior Executive is restricted from dealing with the shares until the Restriction Period ends. Refer to note 5.2 in the financial statements for further details.
7. As outlined in Section 2, Telstra’s Executive Share Ownership Policy requires the CEO and Group Executives to hold Telstra shares to the value of a specified percentage of their Fixed Remuneration within five years of their first appointment to the relevant level. Any shares held directly or beneficially by Senior Executives are included in calculating their shareholding for the purposes of this policy.
(e) Senior Executive interests in Telstra Shares During FY19, our Senior Executives and their related parties held Telstra shares directly, indirectly or beneficially as follows:

61
4.0 Non-executive Director remuneration
4.1 Remuneration structure
(a) OverviewOur non-executive Directors are remunerated with set fees and do not receive any performance based pay. This enables non-executive Directors to maintain independence and impartiality when making decisions affecting the future direction of the company.
There were no increases in Board or Committee fees during the year. The Telstra Board and Committee fee structure (inclusive of superannuation) during FY19 was:
FY19 Board fees Chairman
Non-executive Director
(annual base fee)
Board $775,000 $235,000
FY19 Committee fees
Committee Chairman
Committee Member
Audit & Risk Committee
$70,000 $35,000
Remuneration Committee
$56,000 $28,000
Nomination Committee
– –1
1. Reduced from $7,000 in October 2018 when all non-executive Directors became members of the Nomination Committee.
The Chairman of the Board does not receive Committee fees if he is a Member of a Board Committee. Our non-executive Directors are remunerated in accordance with Telstra’s Constitution, which provides for an aggregate fee pool that is set, and varied, only by approval of a resolution of shareholders at the AGM. The current annual fee pool of $3.5 million was approved by shareholders at Telstra’s 2012 AGM. The total of Board and Committee fees, including superannuation, paid to non-executive Directors in FY19 remained within the approved fee pool.
Superannuation contributions are included within each non-executive Director’s Total Remuneration, in accordance with the ASX Listing Rules and Telstra policy. Non-executive Directors may choose to increase the proportion of their remuneration taken as superannuation, subject to legislative requirements.
Telstra does not provide retirement benefits for non-executive Directors other than the superannuation contributions noted above.
Sections 2.2(f) and (g) of this report provide details of the share ownership policy and Telstra securities trading restrictions that apply to our non-executive Directors. Table 4.2 provides full details of non-executive Director remuneration for FY19.
(b) Changes to the Board and Committee composition
Non-executive Director changes during the yearNiek Jan van Damme and Eelco Blok joined the Board effective from 16 October 2018 and 15 February 2019, respectively. Mr van Damme was elected as a Director at our 2018 AGM and Mr Blok will stand for election by shareholders at our 2019 AGM in October.
Russell Higgins, Steven Vamos and Trae Vassallo each retired as a non-executive Director at the conclusion of our 2018 AGM on 16 October 2018, and Jane Hemstritch resigned as a non-executive Director on 15 January 2019.
Changes to Committee composition during FY19During FY19 the following changes occurred:
• Craig Dunn was appointed as Chairman of the Audit and Risk Committee effective 15 February 2019, succeeding Dr Nora Scheinkestel (who continues to be a member of that Committee).
• Roy Chestnutt was appointed to the Audit and Risk Committee effective 18 October 2018.
• Niek Jan van Damme was appointed to the Remuneration Committee effective 18 October 2018.
• Dr Nora Scheinkestel was appointed to the Remuneration Committee, effective 1 February 2019.
• All non-executive Directors became members of the Nomination Committee, effective 18 October 2018.
• Upon commencement as a Director, Eelco Blok was appointed to the Nomination Committee.
Remuneration Report | Telstra Annual Report 2019

62
4.2 Detailed remuneration and interests in Telstra shares
(a) Non-executive Director Remuneration
Short term employee benefits Post–employment benefits
Name and title YearSalary and fees
($000)1Non-monetary
benefits ($000)2Superannuation
($000) Total ($000)
John P MullenChairman
2019 754 4 21 779
2018 755 6 20 781
Eelco Blok3,4
Director
2019 86 – 2 88
2018 – – – –
Roy H Chestnutt4
Director
2019 255 – 5 260
2018 32 – 1 33
Craig W DunnDirector
2019 263 – 21 284
2018 250 – 20 270
Peter R HearlDirector
2019 273 – 21 294
2018 278 – 20 298
Nora L ScheinkestelDirector
2019 283 – 21 304
2018 285 2 20 307
Margaret L SealeDirector
2019 249 – 21 270
2018 250 – 20 270
Niek Jan van Damme3,4
Director
2019 183 – 3 186
2018 – – – –
Jane S Hemstritch5
Director
2019 132 – 11 143
2018 243 2 20 265
Russell Higgins AO5
Director
2019 82 – 6 88
2018 278 1 20 299
Steven M Vamos5
Director
2019 74 – 6 80
2018 250 – 20 270
Trae A N Vassallo4,5
Director
2019 68 – 1 69
2018 231 – 4 235
Total2019 2,702 4 139 2,845
2018 2,852 11 165 3,028
1. Includes fees for membership on Board Committees.2. Includes the provision of car parking as well as the value of Telstra products and services (such as Foxtel, new technology) provided to Directors without charge to
allow them to familiarise themselves with Telstra’s products and services and with recent technological developments. The value of non-monetary benefits have been grossed up for FBT by the relevant FBT rates.
3. Niek Jan van Damme and Eelco Blok qualify as KMP from 16 October 2018 and 15 February 2019, respectively, when they were appointed as non-executive Directors of the company.
4. As Eelco Blok, Niek Jan van Damme, Roy Chestnutt and Trae Vassallo are overseas residents, their superannuation contributions for FY19 are less than the contributions for Australian resident non-executive Directors.
5. Jane Hemstritch ceased as KMP on 15 January 2019. Russell Higgins, Steven Vamos and Trae Vassallo ceased as KMP on 16 October 2018.

63
NameTotal shares held at
1 July 20181,2
Net shares acquired or disposed of and
other changes1Total shares held at
30 June 20191,4
Shares held nominally at
30 June 20193,4
John P Mullen 101,159 – 101,159 75,000
Eelco Blok – 75,000 75,000 –
Roy H Chestnutt – 43,000 43,000 43,000
Craig W Dunn 73,173 – 73,173 72,473
Peter R Hearl 70,000 – 70,000 –
Nora L Scheinkestel 115,618 14,860 130,478 114,168
Margaret L Seale 310,540 – 310,540 310,540
Niek Jan van Damme – – – –
Jane Hemstritch 91,000 – 91,000 91,000
Russell A Higgins AO 103,217 3,552 106,769 106,769
Steven M Vamos 40,000 – 40,000 40,000
Trae A N Vassallo 15,793 – 15,793 15,793
Total 920,500 136,412 1,056,912 868,743
1. Total shareholdings include shares held by our non-executive Directors and their related parties. Shares acquired or disposed of by our non-executive Directors and their related parties during FY19 were on an arm’s length basis at market price.
2. For Eelco Blok and Niek Jan van Damme, the balance as at 1 July 2018 represents shares held as at the date on which they became KMP. 3. Nominally refers to shares held either indirectly or beneficially by non-executive Directors including those shares held by their related parties. 4. For Jane Hemstritch, Russell Higgins, Steven Vamos and Trae Vassallo the balance as at 30 June 2019 represents shares held as at the date on which they
ceased being KMP.
(b) Non-executive Directors’ interests in Telstra SharesDuring FY19, our non-executive Directors and their related parties held Telstra shares directly, indirectly or beneficially as follows:
5.0 Looking forward to FY20
5.1 Enhancements to the FY20 EVPAs outlined at the start of this report, following a comprehensive review of our Senior Executive remuneration framework the Board has further enhanced the FY20 EVP through the following changes:
Summary of key changes
Feature FY19 EVP FY20 EVP
Weighting of financial performance measures within the primary performance measure
• Financial – 50% of total weighting• Customer, strategic and transformation
performance measures – 50% of total weighting
• Financial – 60% of total weighting• Customer, strategic and transformation
performance measures – 40% of total weighting
Incentive Opportunity • CEO: Target: 200%• CEO: Maximum 400%• GEs: Target 180%• GEs: Maximum 360%
• CEO: Target: 200%• CEO: Maximum 300%• GEs: Target 180%• GEs: Maximum 300%
EVP Composition • 35% Cash• 26% Restricted Shares• 39% Performance Rights
(subject to an RTSR performance condition)
• 25% Cash• 35% Restricted Shares• 40% Performance Rights
(subject to an RTSR performance condition)
Equity Vesting Period • Restricted Shares: 2 years from end of the initial performance period
• Performance Rights: 5 Years from start of the initial performance period
• Restricted Shares: 4 equal tranches with 25% eligible to vest each year for the four years following the end of the initial performance period
• Performance Rights: No change – 5 years from start of the initial performance period
RTSR vesting • Cliff vesting – 100% of Performance Rights vest at 50th percentile
• Sliding RTSR vesting scale – 50% of Performance Rights vest at 50th percentile; straight line vesting to the 75th percentile where 100% vest.
Performance Period No change – 1 year initial performance period and a 5 year RTSR performance period
Remuneration Report | Telstra Annual Report 2019

64
The following section outlines in more detail the changes that apply to the FY20 EVP and the rationale for making those changes.
Increased weighting of financial performance measuresFinancial performance measures now 60% of total weighting
• The weighting of financial performance measures within the primary performance measures of the FY20 EVP has been increased to 60% (previously 50%) with the remaining 40% covering customer, strategic and transformation performance measures.
• In the interest of generating sustainable, long-term shareholder value, the re-weighting of measures ensures a greater dependency on financial outcomes whilst ensuring our Senior Executives continue to focus on the delivery of our T22 strategic priorities, improving customer experiences and the engagement of our people.
Reduced Maximum Opportunity to 300%Reduced the maximum opportunity for the CEO and Group Executives down to 300% of Fixed Remuneration
CEOGateway
Gateway
Target
Target
FY20 Max
FY20 Max FY19 Max
FY19 Max
100%
100%
200%
180%
300%
300% 360%
400%
GEs
• We have reduced the maximum opportunity to recognise broader market and community expectations and further align with ASX20 market practice.
• The reduction in the maximum opportunity as a percentage of FR equates to: −100 percentage points (or a 25% reduction) for the CEO; and −60 percentage points (or a 16.7% reduction) for the Group Executives.
• As each performance measure of the EVP operates independently and the performance range of each measure is calculated over a defined threshold, target and maximum, the reduction in the maximum opportunity reduces the payout for each performance measure between target and maximum.
Therefore, this change represents more than just being a cap on maximum payouts, as the range between target and maximum for each measure has been compressed. For the CEO, the EVP award is reduced by $23,900 for each 1% performance interval from target to maximum, with a total reduction of $2.39 million at maximum performance.
•
EVP Performance and Payout Range (%) for the CEO
Performance Range Threshold Target Maximum
FY19 EVP % of FR 100% 200% 250% 300% 350% 400%
FY20 EVP % of FR 100% 200% 225% 250% 275% 300%
Change 0.0% 0.0% -10.0% -16.7% -21.4% -25.0%
EVP Performance and Payout Range ($000) for the CEO
Performance Range Threshold Target Maximum
FY19 EVP ($000) $2,390 $4,780 $5,975 $7,170 $8,365 $9,560
FY20 EVP ($000) $2,390 $4,780 $5,378 $5,975 $6,573 $7,170
Change +$0 +$0 -$598 -$1,195 -$1,793 -$2,390
Reducing the maximum opportunity results in a significant reduction in the total reward opportunity for the CEO and Group Executives and moderates the overall quantum of variable pay.
FinancialCustomer, Strategic and Transformation
50%
FY19
60%
FY20
50%
FY19
40%
FY20

65
Reduced the cash component down and increased the equity component to 75% of the total awardIncreased the proportion of EVP awarded in equity to 75% (with 35% in Restricted Shares and 40% in Performance Rights subject to RTSR)
• We have reduced the proportion of the award paid in cash to recognise broader market and community expectations and further align with ASX20 market practice.
• Increased equity holding creates stronger alignment to the longer term performance of Telstra.
• Executives will now have more value at risk with return and payouts dependent upon shareholder returns and service conditions.
Revised the Restriction Period for the Restricted SharesIn addition to increasing the weighting towards equity, the Restricted Share component will now be provided in four tranches
• EVP participants will receive 35% of their EVP outcome in the form of Restricted Shares, delivered in 4 tranches.
• 25% of the Restricted Shares will be eligible to vest each year for the four years following the end of the initial performance period.
• The new structure increases equity participation enhancing focus on long-term, sustainable performance.
RTSR vesting schedule
We have introduced a sliding RTSR vesting scale where 50% of the Performance Rights vest if Telstra’s RTSR ranks at the 50th percentile of a comparator group comprising the ASX 100 (excluding resource companies), with up to 100% of the Performance Rights vesting if Telstra’s RTSR ranks at the 75th percentile of the comparator group. No Performance Rights vest if Telstra’s RTSR ranks below the 50th percentile when compared with the comparator group. This makes this performance condition considerably more challenging.
Enhanced our claw-back provisions of equity termsAdditional claw-back provisions have been incorporated into the FY19 and FY20 EVP equity terms to drive greater accountability and focus on sustainable performance
The claw-back provisions in our EVP equity terms have been enhanced to reflect community expectations and high standards of governance. Both our FY19 and FY20 EVP terms give the Board absolute discretion to lapse or forfeit unvested equity if it determines that the equity constitutes an inappropriate benefit. We have also included two new Claw-back Events in both the FY19 and FY20 EVP equity terms which enable the Board to lapse or forfeit unvested equity in the following circumstances:
• the Senior Executive engages in conduct that may negatively impact on Telstra’s standing, reputation or relationship with its key regulators.
• the Senior Executive fails to fulfil their responsibilities under Telstra’s risk management framework which results in a material breach of Telstra’s risk management requirements.
Both our FY19 and FY20 EVP equity terms also contain the following Claw-back Events which enable the Board to lapse or forfeit unvested equity in the following circumstances:
• the Senior Executive engages in fraud, dishonesty, gross misconduct, behaviour that may negatively impact on Telstra’s long term financial strength or that brings Telstra into disrepute.
• the Senior Executive materially breaches a representation, warranty, undertaking or any other obligation to Telstra.
• the financial results that led to the Senior Executive’s equity being granted are subsequently shown to be materially misstated.
• the Senior Executive causes (through an act or omission) a significant deterioration in the financial performance of Telstra.
• the Senior Executive ceases employment for the Permitted Reason of retirement and subsequently re-enters the workforce.
• the equity is allocated in error.
To further enhance our claw-back framework, during FY19 the Board also adopted a Claw-back Policy for unvested securities which sets out the process that will be followed to put the Board in a position to determine whether a Claw-back Event has occurred and whether to exercise its discretion to lapse or forfeit unvested Performance Rights and Restricted Shares granted under the EVP.
These claw-back terms and the Claw-back Policy apply equally to unvested Cash Rights.
Remuneration Report | Telstra Annual Report 2019
Cash Restricted Shares Performance Rights
35%
FY19
25%
FY20
26%
FY19
35%
FY20
39%
FY19
40%
FY20
FY20 FY21 FY22 FY23 FY24
Cash
Restricted Shares
RTSR Performance Period (for Performance Rights only) 1 Jul 2019 to 30 Jun 2024
Performance Rights
Initial Performance Period 1 Jul 2019 to 30 Jun 2020

66
The overall reward opportunity and the time-frame of the FY20 EVP will follow the timeline below:
FY20 FY21 FY22 FY23 FY24 FY25
Jul Jun Aug Oct Nov Jun Jul Jun Jul Jun Jul Jun Jul
FY20 EVP Initial Performance
Period1 July 2019 to 30 June 2020
FY20 Results Release
2020 AGM
EVP Cash Paid (25%) Restricted Shares (1st tranche) End of restriction 30 June 2021
Restricted Shares (2nd tranche) End of restriction 30 June 2022
Restricted Shares (3rd tranche) End of restriction 30 June 2023
Restricted Shares (4th tranche) End of restriction 30 June 2024
Performance RightsFinal RTSR Test 30 June 2024
FY20 EVP Performance Rights RSTR Performance Period1 July 2019 to 30 June 2024
Restricted Shares T4
Restricted Shares T3
Restricted Shares T2
Restricted Shares - T1
Performance Rights
EVP equity allocated (75%)
5.2 FY20 EVP Performance Measures and Targets
We recognise the importance of increased transparency for our shareholders. It is our intention to continue to provide meaningful information to enable shareholders to assess the appropriateness of our targets. For FY20, our financial targets again reflect the negative impacts of the nbn™ network rollout and the positive benefits delivered under our T22 strategy. It is the Board’s view that in this transformative environment such transparency enables an informed view of executive performance and the appropriateness of reward outcomes.
To reflect this, the Board is endeavouring to provide market leading levels of transparency around the targets. We are providing this detail not just retrospectively (for FY19), but also prospectively for FY20, providing shareholders with a high level of transparency over the company’s remuneration framework and outcomes. The Board considers this an imperative as our operating environment requires careful shareholder consideration of the need to appropriately recognise and reward strong management performance for the value created for the company and its shareholders.
The table below outlines the performance measures and targets that will apply to the FY20 EVP. These performance measures and targets have been selected by the Board to ensure that the CEO and Group Executives continue to deliver against our T22 strategy, and that financial rewards are linked directly to Senior Executive contributions, company performance and long term shareholder value creation.
In setting annual performance measures for FY20, the Board sought to ensure the targets were robust and sufficiently demanding, taking into account the key deliverables and milestones outlined in our T22 strategy, planned financial outcomes contained within our 2020 Corporate Plan and guidance (as announced on 15 August 2019). The financial targets were set to reflect the significant and progressive negative impact of the roll out of the nbn network and the intense competition in the market impacting on average revenues per user (ARPU).
The financial targets that apply to the FY20 EVP do not constitute market guidance. Subsequent adjustments to guidance throughout the year (for example relating to the nbn network rollout or unplanned one-off events) and their impact on EVP outcomes will be considered at the end of the year in accordance with established principles to ensure that outcomes appropriately reflect the performance of Senior Executives. Any adjustments that the Board makes will be fully disclosed to shareholders in next year’s Remuneration Report. The Board also has the ability to amend the performance measures themselves if it considers it necessary to ensure EVP outcomes are appropriate in the context of Telstra’s performance, customer experience and shareholder expectations.

67
All of the following measures have been selected on the basis that they are directly linked to our T22 strategy as described below.
Performance Measure Metric Weighting
FY19 Baseline^
FY20*
Rationale for why chosenGateway Target Max
Fina
ncia
l60
% o
f tot
al w
eigh
ting
Total Income
Telstra External Income (excluding finance income)
15.0% $27,807m
Above bottom end of MarketGuidance*
Approx. Midpoint of Market Guidance*
At or above top end of MarketGuidance*
• Key indicator of financial performance.
• Ensures continued focus on customer retention and growth.
• Aligns to Pillar 1 of the T22 strategy.
Underlying EBITDA
Underlying EBITDA is Earnings Before Interest, Tax, Depreciation & Amortisation, excludes net one-off nbn DA receipts less nbn net C2C, guidance adjustments and includes amortisation of mobile operating lease costs
15.0% $8,203m
Above bottom end of MarketGuidance*
Approx. Midpoint of Market Guidance*
At or above top end of MarketGuidance*
• Key indicator of financial performance.
• Ensures appropriate focus on profit and cost to deliver.
• A strong indicator of underlying company profitability.
• Aligns to Pillar 4 of our T22 strategy.
Free Cash Flow (FCF)
Free Cashflow excluding spectrum plus operating lease payments (reported in financing cash flow under AASB 16)
15.0% $3,068m
Above bottom end of MarketGuidance*
Approx. Midpoint of Market Guidance*
At or above top end of MarketGuidance*
• Key indicator of financial performance.
• Appropriate for a capital intensive business critical in managing the company’s ability to pay a dividend and maintain balance sheet strength.
• Aligns to Pillar 4 of our T22 strategy.
Net Opex Reduction
Reduction in operating non-Direct Variable Cost (DVC) expenses
15.0% $456m $625m $660m $760m
• Active reduction of our costs will be key to competing and delivering strong financial performance in an increasingly competitive market.
• Delivering significant absolute cost reduction aligns with intent to drive productivity and reduce costs.
• Aligns to Pillar 4 of our T22 strategy.
Remuneration Report | Telstra Annual Report 2019

68
Performance Measure Metric Weighting
FY19 Baseline^
FY20*
Rationale for why chosenGateway Target Max
Str
ateg
ic, C
usto
mer
& T
rans
form
atio
n 40
% o
f tot
al w
eigh
ting
Episode NPS
Improvement in our Episode NPS
10% +25 +27 +29 +32
• A key driver of business success and our ability to differentiate in an increasingly competitive market.
• Key to generating increased share of wallet from existing customers, maintaining a price premium, and attracting new customers.
• Aligns to Pillar 1 of our T22 Strategy.
• See further information below.
Product Portfolio
Simplification
TE P
lans
TE Number of Active Plans, the target provides progress towardour T22 reduction of 50% by FY21
5% 517 461 441 400
• Will increase the simplicity, transparency and satisfaction that our customers experience and allow the delivery of material cost reductions.
• Aligns to Pillar 1 of our T22 strategy.
• See further information below.S
ervi
ces
on in
m
arke
t pl
ans
Services on in-market plans
5% 0.4m 2.5m 3m 4m
Digital Engagement
Dig
ital
Del
iver
y
Requires the build of digital first capability. The 24% target is the average of Q4 FY20 and not an average measure for the year
5% 16.8% 22.5% 24.0% 29.0%• Improves customer
experience.
• Supports our cost reduction focus.
• Enables delivery of strong financial results.
• Aligns to Pillar 1 of our T22 strategy.
• See information below.
Tels
tra
Con
nect Active Telstra
Enterprise customers on Telstra Connect in the last 3 months of FY20
5% 1,269 3,500 4,000 5,000
People Capability &
Engagement
Increase employee engagement outcome by 9 points (from FY19 baseline)
10% 67 72 76 78
• Focusses on our employee engagement.
• Supports our ability to have both the key leadership and technical talent required to deliver on our ambitious strategy.
• Aligns to Pillar 3 of our T22 strategy.
^ For FY20 targets, the baseline refers to FY19 results calculated on the same basis as the metric definition and includes restatement for AASB 16: Leases where applicable.
* Market Guidance means guidance for FY20 as set out in Telstra’s ASX announcement dated 15 August 2019.

69
Relevance of non-financial measuresA key theme from the feedback we received from shareholder and shareholder advisory companies was the importance and use of ‘Non-Financial’ performance measures within the EVP. The Board believes that the strategic, customer and transformation measures directly demonstrate the delivery of critical components of the T22 strategy and are fundamental key drivers of long term value creation.
Our T22 strategy is ambitious, requiring considerable skill, leadership and determination to execute as it spans dramatic simplification of the entire Telstra business, customer proposition, how we connect with our customers, together with extensive changes to our organisational structure and ways of working. The FY20 targets are robust, challenging the executive team to execute across all functions within our business model.
To assist shareholders’ understanding of these measures and their relevance to Telstra’s performance, further information on each measure is provided below.
Episode NPS
We have maintained Episode NPS in our EVP measures as a continuous focus on improving customer experience and differentiating our products and services in an increasingly competitive market will be a key driver of long term business success. It is in our shareholder interests to have the executive team specifically focused on improving the key interactions that are most important to this customer experience. These interactions are those that are most likely to drive both customer attraction and retention.
Episode NPS is the customer metric most directly aligned to the other key T22 initiatives that are improving customer experience and ease of doing business with Telstra, including the simplification of our product portfolio and improving our digital delivery.
In addition to increasing the value and innovation that our customers receive in our products, Episode NPS also underpins companywide improvement programs focused on improving our operational excellence by identifying and eliminating the causes of unnecessary customer effort, particularly within the Sales and Activation and Assurance episodes for customers connecting to the nbn™ network. Improvement programs include the launch of our new plans and removing traditional pain-points such as excess data charges in Australia, and continuously improving the ways in which customers can self-manage their services through My Telstra digital tool for customers. In addition, when customers do contact our contact centres, we aim to ensure that customer issues are resolved within the first contact.
Product Portfolio
Simplification
TE P
lans
In FY19 Telstra delivered against the target for simplification of our product portfolio for our Enterprise customers. We will continue to focus on product simplification in FY20 in line with our commitment to rationalise 50% of Enterprise products by FY21. For our Enterprise customers the simplification strategy is a complex and often an individual customer transformation requiring consultation to ensure a good customer experience and retention of revenue.
Ser
vice
s on
in
mar
ket
plan
s In FY19 Telstra delivered against the target for simplification of our product portfolio for our Consumer & Small Business customers. Along with maintaining our committed 20 simplified connectivity plans, in FY20 the priority for Consumer & Small Business will shift to moving our customers to these new radically simplified plan constructs. This supports delivery of improved customer experiences, offers our customers simplicity and ease of dealing with Telstra, and supports readiness for future delivery of digitised experiences for customers.
Digital Engagement
Dig
ital
D
eliv
ery
In FY19 Telstra delivered against our target to increase digital sales interactions. We will continue to increase the engagement of our mass market customers through digital sales channels, targeting nearly 1 in 4 sales to occur through digital channels in FY20. Key to achieving this target is maximising the value and ease for our customers in using our digital channels. This strategy is intended to provide customer choice, reduce our servicing cost and improve profit margins.
Tels
tra
Con
nect
Delivering self-servicing solutions for our Enterprise customers is key to improving customer experience and removing cost by reducing servicing calls. By the end of FY20 we are targeting 4,000 enterprise customers to actively use Telstra Connect. Key to achieving this target will be increasing adoption and developing new functionality for this customer base moving away from more traditional service channels. This strategy is intended to enhance our customer connectivity and experience, reduce our servicing cost and improve profit margins.
Remuneration Report | Telstra Annual Report 2019

70
Cash Rights Rights granted to a Senior Executive who ceases employment for a Permitted Reason before the Restricted Shares and Performance Rights are granted in respect of the EVP in lieu of those Restricted Shares and Performance Rights. The Cash Rights are subject to the same time conditions and performance measures as those applying to those Restricted Shares and Performance Rights. On vesting, a Cash Right will entitle the Senior Executive to a cash payment equivalent to the value of a share at the end of the applicable Restriction Period or performance period and dividends paid between the date the Cash Right is allocated and the end of the applicable Restriction Period or performance period.
Claw-back Event (malus) Includes fraud, gross misconduct or material breach of obligations by the Senior Executive or behaviour that brings Telstra into disrepute or may negatively impact Telstra’s long term financial strength. It also includes where the Senior Executive causes a significant deterioration in Telstra’s financial performance or negatively impacts Telstra’s standing with its regulators, where the financial results that led to the Performance Rights or Restricted Shares being granted are subsequently shown to be materially misstated, where the Senior Executive fails to fulfil his or her responsibilities under Telstra’s risk management framework resulting in a material breach of Telstra’s risk management framework, or where the Board determines that the Performance Rights or Restricted Shares are an inappropriate benefit.
EBITDA Earnings Before Interest, Tax, Depreciation and Amortisation.
EVP Executive Variable Remuneration Plan.
FCF Free Cashflow.
FCF for LTI Annual FCF from operating and investing activities adjusted for interest paid and non-recurring factors such as spectrum licence purchases, acquisitions (i.e. the removal of trading cashflows and purchase prices of those entities acquired), divestments (i.e. reinstate forecasted trading cashflows and sale proceeds for those entities disposed) and material regulatory adjustments that impact on pricing that was assumed when setting plan targets.
FCF ROI The average of the annual FCF for LTI over the performance period expressed as a percentage of the average investment over the performance period. Average investment over the period is the average of the sum of net debt and shareholders’ funds over the entire three year performance period.
Fixed Remuneration or FR Base salary plus company and private salary sacrificed superannuation contributions.
FY Financial year.
GE Group Executive.
KMP Key Management Personnel.
LTI Long Term Incentive.
NBN Transaction Agreements with nbn co and the Government in relation to Telstra’s participation in the rollout of the nbn™ network. This includes the entire Definitive Agreement receipts, any impacts the nbn™ has on our existing products, costs associated with connecting customers to the nbn™ network and any tax, interest or debt impacts of nbn™ related changes in profit or cash. Any nbn™ related commercial works are excluded from this definition.
NPS Net Promoter Score is a non financial performance that we use to measure customer experience at Telstra.
The Episode NPS performance measure is based on responses to internal surveys following actual service experiences customers had with Telstra.
The overall Episode NPS result for Telstra is a weighted average calculation of the survey results from Telstra business segments – Consumer & Small Business contribute collectively at 65% and Telstra Enterprise at 35%.
6.0 Glossary

71
Performance Right A right to a share or a cash amount equivalent to the value of a share at the end of a performance period, at Telstra’s discretion and subject to the satisfaction of certain performance measures and service conditions.
Permitted Reason Permitted Reason under the EVP, means death, total and permanent disablement, certain medical conditions, company initiated separation for a reason unrelated to performance or conduct, redundancy or retirement. Permitted Reason under the EVP Performance Rights and Restricted Share terms also includes mutual separation.
Related parties Related parties of a person means:• a close member of the person’s family; and/or• an entity over which the person or close family member has, directly or indirectly, control,
joint control or significant influence.
Restricted Share A Telstra share that is subject to a Restriction Period.
Restriction Period A period during which a Telstra share is subject to a service condition and cannot be traded. Restricted Shares are transferred to a Senior Executive on the first day after the end of the Restriction Period that Senior Executives are able to deal in shares under Telstra’s Securities Trading Policy.
RTSR Relative Total Shareholder Return (RTSR) measures the performance of an ordinary Telstra share (including the value of any cash dividend and other shareholder benefits paid during the period) relative to the performance of ordinary securities issued by the other companies in a comparator group over the same period.
Senior Executive Refers to the CEO and those executives who are KMP with authority and responsibility for planning, directing and controlling the activities of the company and Group, directly or indirectly.
Service Agreement A Senior Executive's contract of employment.
SSU Structural Separation Undertaking.
STI Short Term Incentive.
Total Income Total Telstra income.
Total Remuneration The sum of all the fixed and variable components of remuneration as detailed in section 3.4 for Senior Executives, and all the remuneration components as detailed in section 4.2 for non-executive Directors.
Total Return The total shareholder return calculated by incorporating share price change and any relevant dividends for the specified period (assumed to be reinvested). The Total Return is calculated by Thomson Reuters Eikon, an external third party.
Underlying EBITDA Underlying EBITDA is Earnings Before Interest, Tax, Depreciation & Amortisation, excludes net one-off nbn DA receipts less nbn net C2C, guidance adjustments and includes amortisation of mobile operating lease cost.
Remuneration Report | Telstra Annual Report 2019

72
Rounding
The Telstra Entity is a company of the kind referred to in the Australian Securities and Investments Commission Corporations (Rounding in Financial/Directors’ Reports) Instrument 2016/191, dated 24 March 2016 and issued pursuant to section 341(1) of the Corporations Act 2001. Except where otherwise indicated, the amounts in this Directors’ Report and the accompanying financial report have been rounded to the nearest million dollars ($m) and amounts in the Remuneration Report have been rounded to the nearest thousand dollars ($000).
This report is made on 15 August 2019 in accordance with a resolution of the Directors.
John P MullenChairman15 August 2019
Andrew R PennChief Executive Officer and Managing Director15 August 2019
Auditor’s Independence Declaration to the Directors of Telstra Corporation Limited
As lead auditor for the audit of the financial report of Telstra Corporation Limited for the financial year ended 30 June 2019, I declare to the best of my knowledge and belief, there have been:
(a) no contraventions of the auditor independence requirements of the Corporations Act 2001 in relation to the audit; and
(b) no contraventions of any applicable code of professional conduct in relation to the audit.
This declaration is in respect of Telstra Corporation Limited and the entities it controlled during the financial year.
Ernst & Young
Andrew PricePartner15 August 2019
A member firm of Ernst & Young Global Limited Liability limited by a scheme approved under Professional Standards Legislation
Directors’ Report 8 Exhibition Street
Melbourne VIC 3000 AustraliaGPO Box 67 Melbourne VIC 3001Tel: +61 3 9288 8000Fax: +61 3 8650 7777ey.com/au
8 Exhibition StreetMelbourne VIC 3000 AustraliaGPO Box 67 Melbourne VIC 3001
Tel: +61 3 9288 8000Fax: +61 3 8650 7777ey.com/au
A member firm of Ernst & Young Global LimitedLiability limited by a scheme approved under Professional Standards Legislation 169
Independent Auditor’s Report to the Shareholders of Telstra Corporation Limited
Report on the Audit of the Financial Report
Opinion
We have audited the financial report of Telstra Corporation Limited (the Company) and its subsidiaries (collectively the Group), which comprises the consolidated statement of financial position as at 30 June 2019, the consolidated income statement, consolidated statement of comprehensive income, the consolidated statement of changes in equity and the consolidated statement of cash flows for the year then ended, notes to the financial statements, including a summary of significant accounting policies and the Directors’ Declaration.
In our opinion:
the accompanying financial report of the Group is in accordance with the Corporations Act 2001, including:
a. Giving a true and fair view of the consolidated financial position of the Group as at 30 June 2019 and of its consolidated financial performance for the year ended on that date; and
b. Complying with Australian Accounting Standards and the Corporations Regulations 2001.
Basis for Opinion
We conducted our audit in accordance with Australian Auditing Standards. Our responsibilities under those standards are further described in the Auditor’s Responsibilities for the Audit of the Financial Report section of our report. We are independent of the Group in accordance with the auditor independence requirements of the Corporations Act 2001 and the ethical requirements of the Accounting Professional and Ethical Standards Board’s APES110 Code of Ethics for Professional Accountants (the Code) that are relevant to our audit of the financial report in Australia. We have also fulfilled our other ethical responsibilities in accordance with the Code.
We believe that the audit evidence we have obtained is sufficient and appropriate to provide a basis for our opinion.
Key Audit Matters
Key audit matters are those matters that, in our professional judgment, were of most significance in our audit of the financial report of the current year. These matters were addressed in the context of our audit of the financial report as a whole, and in forming our opinion thereon, but we do not provide a separate opinion on these matters. For each matter below, our description of how our audit addressed the matter is provided in that context.
We have fulfilled the responsibilities described in the Auditor’s Responsibilities for the Audit of the Financial Report section of our report, including in relation to these matters. Accordingly, our audit included the performance of procedures designed to respond to our assessment of the risks of material misstatement of the financial report. The results of our audit procedures, including the procedures performed to address the matters below, provide the basis for our audit opinion on the accompanying financial report.
Key audit matter How our audit addressed the matterRevenue recognitionAustralian Accounting Standard AASB 15 Revenue from Contracts with Customers (AASB 15) applied to the Group from 1 July 2018. Upon adoption of AASB 15, there are five areas where the Group exercises significant judgment relating to revenue recognition:
• accounting for new products and plans including multiple element arrangements;
• accounting for large Network Application Services (NAS) contracts;
• accounting for NBN revenue under the revised Definitive Agreements (DAs) with nbn co and the Commonwealth Government;
• determination of standalone selling prices for products sold in multiple element arrangements; and
• assessment of significant financing components.
Disclosures relating to revenue recognition can be found at Notes 2.1 and 2.2 and disclosure of the impact of the adoption of the new revenue accounting standard can be found within Notes 1.5 and 7.1.
The accuracy and completeness of amounts recorded as revenue is an inherent industry risk due to the complexity of billing systems, the complexity of products and services, and the combination of products sold and price changes in the year.
We evaluated the effectiveness of key controls over the capture and measurement of revenue transactions across all material revenue streams, including evaluating the relevant IT systems and new process and controls implemented during the current year for the appropriate recognition of revenue under AASB 15.
We examined the process and controls over the capture and assessment of the timing of revenue recognised for new products and plans, as well as performed testing of a sample of new plans to supporting evidence.
For all key revenue streams, we obtained supporting evidence such as customer contracts, statements of work, invoices and service detail records to test the occurrence and measurement for a sample of revenue transactions.
For the major NAS contracts, we focused our work on those which we regarded as higher risk because of the nature of the contract, its stage of delivery or the quantum of the related assets and those which were significant by size.
SignOffs.fm Page 169 Tuesday, August 27, 2019 8:28 AM

73
Financial Report

74 | Telstra Corporation Limited and controlled entities
Notes to the financial statements (continued)
74 | Telstra Corporation Limited and controlled entities
Telstra Corporation Limited and controlled entitiesAustralian Business Number (ABN): 33 051 775 556
Financial report: introduction and contentsAs at 30 June 2019
About this reportThis is the financial report for Telstra Corporation Limited (referred to as the Company or Telstra Entity) and its controlled entities (together referred to as we, us, our, Telstra, the Telstra Group or the Group) for the year ended 30 June 2019.
Telstra Corporation Limited is a ‘for profit’ company limited by shares incorporated in Australia whose shares are publicly traded on the Australian Securities Exchange (ASX).
This financial report was authorised for issue in accordance with a resolution of the Telstra Board of Directors on 15 August 2019. The Directors have the power to amend and reissue the financial report.
Reading the financials
Section introductionThe introduction at the start of each section outlines the focus of the section and explains the purpose and content of that section.
Note and topic summaryA summary at the start of certain notes explains the objectives and content of that note, or at the start of certain specific topics clarifies complex concepts, which users may not be familiar with.
Narrative tableSome narrative disclosures are presented in a tabular format to provide readers with a clearer understanding of the information being presented.
Information panelThe information panel describes our key accounting estimates and judgements applied in the preparation of the financial report, which are relevant to that section or note.
Contents
Financial StatementsIncome Statement 75Statement of Comprehensive Income 76Statement of Financial Position 77Statement of Cash Flows 79Statement of Changes in Equity 80
Notes to the Financial Statements
Section 1: Basis of preparation1.1 - Basis of preparation of the financial report 811.2 - Terminology used in our income statement 811.3 - Principles of consolidation 811.4 - Key accounting estimates and judgements 811.5 - Adoption of the new accounting standards 82
Section 2: Our performance2.1 - Segments and disaggregated revenue 882.2 - Income 942.3 - Expenses 1022.4 - Income taxes 1032.5 - Earnings per share 1062.6 - Notes to the statement of cash flows 106
Section 3: Our core assets and working capital3.1 - Property, plant and equipment 1083.2 - Goodwill and other intangible assets 1113.3 - Trade and other receivables and contract assets 1143.4 - Inventories 1173.5 - Trade and other payables 1173.6 - Contract liabilities and other revenue received in
advance 118
3.7 - Trade receivables from customer contracts, contract assets and contract liabilities
118
3.8 - Deferred contract costs 120
Section 4: Our capital and risk management4.1 - Dividend 1224.2 - Equity 1224.3 - Capital management 1244.4 - Financial instruments and risk management 133
Section 5: Our people5.1 - Employee benefits 1415.2 - Employee share plans 1425.3 - Post-employment benefits 1465.4 - Key management personnel compensation 148
Section 6: Our investments6.1 - Investments in controlled entities 1496.2 - Investments in joint ventures and associated
entities153
Section 7: Other information7.1 - Other accounting policies 1587.2 - Auditor’s remuneration 1647.3 - Parent entity disclosures 1657.4 - Commitments and contingencies 1667.5 - Events after reporting date 167
Directors’ Declaration 168
Independent Auditor’s Report 169
Statements.fm Page 74 Tuesday, August 27, 2019 8:23 AM
Telstra Corporation Limited and controlled entities | 75
Telstra Financial Report 2019Income StatementFor the year ended 30 June 2019
Telstra Group Year ended 30 June2019 2018
RestatedNote $m $m
Income
Revenue (excluding finance income) 2.2 25,259 25,848
Other income 2.2 2,548 2,993
27,807 28,841
Expenses
Labour 5,279 5,207
Goods and services purchased 9,138 8,338
Net impairment losses on financial assets 184 190
Other expenses 2.3 5,234 4,887
19,835 18,622
Share of net profit/(loss) from joint ventures and associated entities 6.2 12 (22)
19,823 18,644
Earnings before interest, income tax expense, depreciation and amortisation (EBITDA) 7,984 10,197
Depreciation and amortisation 2.3 4,282 4,470
Earnings before interest and income tax expense (EBIT) 3,702 5,727
Finance income 2.2 238 218
Finance costs 2.3 868 806
Net finance costs 630 588
Profit before income tax expense 3,072 5,139
Income tax expense 2.4 923 1,582
Profit for the year 2,149 3,557
Profit/(loss) attributable to:
Equity holders of Telstra Entity 2,154 3,591
Non-controlling interests (5) (34)
2,149 3,557
Earnings per share (cents per share) cents cents
Basic 2.5 18.1 30.2
Diluted 2.5 18.1 30.2
The notes following the financial statements form part of the financial report.
Statements.fm Page 75 Tuesday, August 27, 2019 8:23 AM

Telstra Corporation Limited and controlled entities | 75
Notes to the financial statements (continued) Telstra Financial Report 2019
Telstra Corporation Limited and controlled entities | 75
Telstra Financial Report 2019Income StatementFor the year ended 30 June 2019
Telstra Group Year ended 30 June2019 2018
RestatedNote $m $m
Income
Revenue (excluding finance income) 2.2 25,259 25,848
Other income 2.2 2,548 2,993
27,807 28,841
Expenses
Labour 5,279 5,207
Goods and services purchased 9,138 8,338
Net impairment losses on financial assets 184 190
Other expenses 2.3 5,234 4,887
19,835 18,622
Share of net profit/(loss) from joint ventures and associated entities 6.2 12 (22)
19,823 18,644
Earnings before interest, income tax expense, depreciation and amortisation (EBITDA) 7,984 10,197
Depreciation and amortisation 2.3 4,282 4,470
Earnings before interest and income tax expense (EBIT) 3,702 5,727
Finance income 2.2 238 218
Finance costs 2.3 868 806
Net finance costs 630 588
Profit before income tax expense 3,072 5,139
Income tax expense 2.4 923 1,582
Profit for the year 2,149 3,557
Profit/(loss) attributable to:
Equity holders of Telstra Entity 2,154 3,591
Non-controlling interests (5) (34)
2,149 3,557
Earnings per share (cents per share) cents cents
Basic 2.5 18.1 30.2
Diluted 2.5 18.1 30.2
The notes following the financial statements form part of the financial report.
Statements.fm Page 75 Tuesday, August 27, 2019 8:23 AM

76 | Telstra Corporation Limited and controlled entities
Notes to the financial statements (continued)
76 | Telstra Corporation Limited and controlled entities
Statement of Comprehensive IncomeFor the year ended 30 June 2019
Telstra Group Year ended 30 June2019 2018
RestatedNote $m $m
Profit/(loss) for the year attributable to:
Equity holders of Telstra Entity 2,154 3,591
Non-controlling interests (5) (34)
2,149 3,557
Items that will not be reclassified to the income statement
Retained profits
Actuarial (loss)/gain on defined benefit plans attributable to equity holders of Telstra Entity 5.3 (10) 112
Income tax on actuarial (loss)/gain on defined benefit plans 3 (34)
Fair value of equity instruments reserve
Gain/(loss) from investments in equity instruments designated at fair value through other comprehensive income 3 (16)
Share of other comprehensive income of equity accounted entities 66 29
Income tax on fair value movements for investments in equity instruments (22) 2
Foreign currency translation reserve
Translation differences of foreign operations attributable to non-controlling interests - (3)
40 90
Items that may be subsequently reclassified to the income statement
Foreign currency translation reserve
Translation differences of foreign operations attributable to equity holders of Telstra Entity 39 48
Share of foreign currency translation reserve of equity accounted entities - 4
Cash flow hedging reserve 4.3
Movements in cash flow hedging reserve 3 (97)
Income tax on movements in the cash flow hedging reserve (1) 29
Foreign currency basis spread reserve
Changes in the value of the foreign currency basis spread (22) (31)
Income tax on movements in the foreign currency basis spread reserve 7 9
26 (38)
Total other comprehensive income 66 52
Total comprehensive income for the year 2,215 3,609
Total comprehensive income attributable to:
Equity holders of Telstra Entity 2,220 3,646
Non-controlling interest (5) (37)
The notes following the financial statements form part of the financial report.
Statements.fm Page 76 Tuesday, August 27, 2019 8:23 AM
Telstra Corporation Limited and controlled entities | 77
Telstra Financial Report 2019Statement of Financial PositionAs at 30 June 2019
Telstra Group As at30 June
201930 June
2018 Restated
1 July 2017
RestatedNote $m $m $m
Current assets
Cash and cash equivalents 2.6 604 629 938
Trade and other receivables and contract assets 3.3 5,392 5,588 6,090
Deferred contract costs 3.8 95 69 106
Inventories 3.4 448 492 469
Derivative financial assets 4.3 179 75 21
Current tax receivables 7 6 11
Prepayments 457 431 412
Assets classified as held for sale 3.1 121 - -
Total current assets 7,303 7,290 8,047
Non-current assets
Trade and other receivables and contract assets 3.3 780 730 971
Deferred contract costs 3.8 1,232 1,180 997
Inventories 3.4 35 19 29
Investments – accounted for using the equity method 6.2 1,298 1,237 194
Investments – other 4.4 25 36 292
Property, plant and equipment 3.1 22,332 22,108 21,350
Intangible assets 3.2 7,210 7,922 8,317
Derivative financial assets 4.3 2,083 1,897 1,623
Deferred tax assets 2.4 59 54 44
Defined benefit asset 5.3 232 250 142
Total non-current assets 35,286 35,433 33,959
Total assets 42,589 42,723 42,006
Current liabilities
Trade and other payables 3.5 4,528 4,528 3,944
Employee benefits 5.1 804 868 865
Other provisions 103 89 169
Borrowings 4.3 2,222 1,635 2,476
Derivative financial liabilities 4.3 57 1 42
Current tax payables 2.4 103 132 161
Contract liabilities and other revenue received in advance 3.6 1,657 1,532 1,424
Liabilities classified as held for sale 3.1 79 - -
Total current liabilities 9,553 8,785 9,081
Non-current liabilities
Other payables 3.5 68 65 70
Employee benefits 5.1 158 157 160
Other provisions 158 168 134
Borrowings 4.3 15,031 15,316 14,808
Derivative financial liabilities 4.3 283 388 536
Deferred tax liabilities 2.4 1,529 1,537 1,443
Defined benefit liability 5.3 8 7 6
Contract liabilities and other revenue received in advance 3.6 1,271 1,681 1,617
Total non-current liabilities 18,506 19,319 18,774
Total liabilities 28,059 28,104 27,855
Net assets 14,530 14,619 14,151
Statements.fm Page 77 Tuesday, August 27, 2019 8:23 AM

Telstra Corporation Limited and controlled entities | 77
Notes to the financial statements (continued) Telstra Financial Report 2019
Telstra Corporation Limited and controlled entities | 77
Telstra Financial Report 2019Statement of Financial PositionAs at 30 June 2019
Telstra Group As at30 June
201930 June
2018 Restated
1 July 2017
RestatedNote $m $m $m
Current assets
Cash and cash equivalents 2.6 604 629 938
Trade and other receivables and contract assets 3.3 5,392 5,588 6,090
Deferred contract costs 3.8 95 69 106
Inventories 3.4 448 492 469
Derivative financial assets 4.3 179 75 21
Current tax receivables 7 6 11
Prepayments 457 431 412
Assets classified as held for sale 3.1 121 - -
Total current assets 7,303 7,290 8,047
Non-current assets
Trade and other receivables and contract assets 3.3 780 730 971
Deferred contract costs 3.8 1,232 1,180 997
Inventories 3.4 35 19 29
Investments – accounted for using the equity method 6.2 1,298 1,237 194
Investments – other 4.4 25 36 292
Property, plant and equipment 3.1 22,332 22,108 21,350
Intangible assets 3.2 7,210 7,922 8,317
Derivative financial assets 4.3 2,083 1,897 1,623
Deferred tax assets 2.4 59 54 44
Defined benefit asset 5.3 232 250 142
Total non-current assets 35,286 35,433 33,959
Total assets 42,589 42,723 42,006
Current liabilities
Trade and other payables 3.5 4,528 4,528 3,944
Employee benefits 5.1 804 868 865
Other provisions 103 89 169
Borrowings 4.3 2,222 1,635 2,476
Derivative financial liabilities 4.3 57 1 42
Current tax payables 2.4 103 132 161
Contract liabilities and other revenue received in advance 3.6 1,657 1,532 1,424
Liabilities classified as held for sale 3.1 79 - -
Total current liabilities 9,553 8,785 9,081
Non-current liabilities
Other payables 3.5 68 65 70
Employee benefits 5.1 158 157 160
Other provisions 158 168 134
Borrowings 4.3 15,031 15,316 14,808
Derivative financial liabilities 4.3 283 388 536
Deferred tax liabilities 2.4 1,529 1,537 1,443
Defined benefit liability 5.3 8 7 6
Contract liabilities and other revenue received in advance 3.6 1,271 1,681 1,617
Total non-current liabilities 18,506 19,319 18,774
Total liabilities 28,059 28,104 27,855
Net assets 14,530 14,619 14,151
Statements.fm Page 77 Tuesday, August 27, 2019 8:23 AM

78 | Telstra Corporation Limited and controlled entities
Notes to the financial statements (continued)
78 | Telstra Corporation Limited and controlled entities
Statement of Financial Position (continued)As at 30 June 2019
Telstra Group As at30 June
201930 June
2018 Restated
1 July 2017
RestatedNote $m $m $m
Equity
Share capital 4.2 4,447 4,428 4,421
Reserves 4.2 (58) (131) (105)
Retained profits 10,160 10,335 9,816
Equity available to Telstra Entity shareholders 14,549 14,632 14,132
Non-controlling interests (19) (13) 19
Total equity 14,530 14,619 14,151
The notes following the financial statements form part of the financial report.
Statements.fm Page 78 Tuesday, August 27, 2019 8:23 AM
Telstra Corporation Limited and controlled entities | 79
Telstra Financial Report 2019Statement of Cash FlowsFor the year ended 30 June 2019
Telstra Group Year ended 30 June2019 2018
Note $m $mCash flows from operating activities
Receipts from customers (inclusive of goods and services tax (GST)) 30,231 31,901
Payments to suppliers and employees (inclusive of GST) (22,748) (21,948)
Government grants received 156 174
Net cash generated by operations 7,639 10,127
Income taxes paid 2.4 (956) (1,521)
Net cash provided by operating activities 2.6 6,683 8,606
Cash flows from investing activities
Payments for property, plant and equipment (3,235) (3,571)
Payments for intangible assets (1,135) (1,361)
Capital expenditure (before investments) (4,370) (4,932)
Payments for business and shares in controlled entities (net of cash acquired) (115) (56)
Payments for equity accounted investments (21) (15)
Payments for other investments (26) (67)
Total capital expenditure (including investments) (4,532) (5,070)
Government grants received 53 91
Proceeds from sale of property, plant and equipment 646 796
Proceeds from sale of business and shares in controlled entities (net of cash disposed) 42 49
Proceeds from sale of other investments 6 24
Distributions received from equity accounted investments 33 9
Interest received 33 65
Proceeds from finance lease principal amounts 104 125
Net cash used in investing activities (3,615) (3,911)
Operating cash flows less investing cash flows 3,068 4,695
Cash flows from financing activities
Proceeds from borrowings 4,669 4,195
Repayment of borrowings (4,637) (5,148)
Repayment of finance lease principal amounts (79) (120)
Purchase of shares for employee share plans - (18)
Finance costs paid (781) (776)
Dividend paid to equity holders of Telstra Entity 4.1 (2,259) (3,150)
Other (1) 2
Net cash used in financing activities (3,088) (5,015)
Net decrease in cash and cash equivalents (20) (320)
Cash and cash equivalents at the beginning of the year 620 936
Effects of exchange rate changes on cash and cash equivalents 4 4
Cash and cash equivalents at the end of the year 2.6 604 620
The notes following the financial statements form part of the financial report.
Statements.fm Page 79 Tuesday, August 27, 2019 8:23 AM

Telstra Corporation Limited and controlled entities | 79
Notes to the financial statements (continued) Telstra Financial Report 2019Telstra Financial Report 2019
Telstra Corporation Limited and controlled entities | 79
Telstra Financial Report 2019Statement of Cash FlowsFor the year ended 30 June 2019
Telstra Group Year ended 30 June2019 2018
Note $m $mCash flows from operating activities
Receipts from customers (inclusive of goods and services tax (GST)) 30,231 31,901
Payments to suppliers and employees (inclusive of GST) (22,748) (21,948)
Government grants received 156 174
Net cash generated by operations 7,639 10,127
Income taxes paid 2.4 (956) (1,521)
Net cash provided by operating activities 2.6 6,683 8,606
Cash flows from investing activities
Payments for property, plant and equipment (3,235) (3,571)
Payments for intangible assets (1,135) (1,361)
Capital expenditure (before investments) (4,370) (4,932)
Payments for business and shares in controlled entities (net of cash acquired) (115) (56)
Payments for equity accounted investments (21) (15)
Payments for other investments (26) (67)
Total capital expenditure (including investments) (4,532) (5,070)
Government grants received 53 91
Proceeds from sale of property, plant and equipment 646 796
Proceeds from sale of business and shares in controlled entities (net of cash disposed) 42 49
Proceeds from sale of other investments 6 24
Distributions received from equity accounted investments 33 9
Interest received 33 65
Proceeds from finance lease principal amounts 104 125
Net cash used in investing activities (3,615) (3,911)
Operating cash flows less investing cash flows 3,068 4,695
Cash flows from financing activities
Proceeds from borrowings 4,669 4,195
Repayment of borrowings (4,637) (5,148)
Repayment of finance lease principal amounts (79) (120)
Purchase of shares for employee share plans - (18)
Finance costs paid (781) (776)
Dividend paid to equity holders of Telstra Entity 4.1 (2,259) (3,150)
Other (1) 2
Net cash used in financing activities (3,088) (5,015)
Net decrease in cash and cash equivalents (20) (320)
Cash and cash equivalents at the beginning of the year 620 936
Effects of exchange rate changes on cash and cash equivalents 4 4
Cash and cash equivalents at the end of the year 2.6 604 620
The notes following the financial statements form part of the financial report.
Statements.fm Page 79 Tuesday, August 27, 2019 8:23 AM

80 | Telstra Corporation Limited and controlled entities
Notes to the financial statements (continued)
80 | Telstra Corporation Limited and controlled entities
Statement of Changes in EquityFor the year ended 30 June 2019
Telstra Group Share capital
Reserves Retained profits
Total Non- control-
ling interests
Total equity
Note $m $m $m $m $m $mBalance as previously reported at 1 July 2017 4,421 (105) 10,225 14,541 19 14,560Change in accounting policy arising from AASB 15: 'Revenue from contracts with customers' 1.5 - - (409) (409) - (409)
Restated balance at 1 July 2017 4,421 (105) 9,816 14,132 19 14,151Restated profit/(loss) for the year - - 3,591 3,591 (34) 3,557Restated other comprehensive income - (23) 78 55 (3) 52Restated total comprehensive income for the year - (23) 3,669 3,646 (37) 3,609Dividend - - (3,150) (3,150) (2) (3,152)Non-controlling interests on disposals - - - - (1) (1)Transactions with non-controlling interests - (3) - (3) 3 -Amounts repaid on share loans provided to employees 1 - - 1 - 1
Additional shares purchased (18) - - (18) - (18)Share-based payments 24 - - 24 5 29Restated balance at 30 June 2018 4,428 (131) 10,335 14,632 (13) 14,619Change in accounting policy arising from AASB 9: 'Financial instruments' 1.5 - - (63) (63) - (63)
Restated balance at 1 July 2018 4,428 (131) 10,272 14,569 (13) 14,556Profit/(loss) for the year - - 2,154 2,154 (5) 2,149Other comprehensive income - 73 (7) 66 - 66Total comprehensive income for the year - 73 2,147 2,220 (5) 2,215Dividend - - (2,259) (2,259) (2) (2,261)Non-controlling interests on disposals - - - - 1 1Transactions with non-controlling interests - - - - (1) (1)Amounts repaid on share loans provided to employees 1 - - 1 - 1
Share-based payments 18 - - 18 1 19Balance at 30 June 2019 4,447 (58) 10,160 14,549 (19) 14,530
The notes following the financial statements form part of the financial report.
Statements.fm Page 80 Tuesday, August 27, 2019 8:23 AM
Telstra Corporation Limited and controlled entities | 81
Notes to the financial statements
Section 1. Basis of preparation
This section explains basis of preparation of our financial report and provides a summary of our key accounting estimates and judgements.
SECTION 1. BASIS OF PREPARATION1.1 Basis of preparation of the financial reportThis financial report is a general purpose financial report, prepared by a ‘for profit’ entity, in accordance with the requirements of the Australian Corporations Act 2001, Accounting Standards applicable in Australia and other authoritative pronouncements of the Australian Accounting Standards Board (AASB). It also complies with International Financial Reporting Standards (IFRS) and Interpretations published by the International Accounting Standards Board (IASB).
The financial report is presented in Australian dollars and, unless otherwise stated, all values have been rounded to the nearest million dollars ($m) under the option available under the Australian Securities and Investments Commission (ASIC) Corporations (Rounding in Financial/Directors’ Report) Instrument 2016/191. The functional currency of the Telstra Entity and its Australian controlled entities is Australian dollars. The functional currency of certain non- Australian controlled entities is not Australian dollars. The results of these entities are translated into Australian dollars in accordance with our accounting policy in note 7.1.2.
The financial report is prepared in accordance with historical cost, except for some categories of financial instruments, which are recorded at fair value.
1.2 Terminology used in our income statement Earnings before interest, income tax expense, depreciation and amortisation (EBITDA) reflect our profit for the year, prior to including the effect of net finance costs, income taxes, depreciation and amortisation. Our management primarily uses EBITDA and earnings before interest and income tax expense (EBIT), in combination with other financial measures, to evaluate the Company’s operating performance. In addition, we believe EBITDA is useful to our shareholders, analysts and other members of the investment community who also view EBITDA as a widely recognised measure of operating performance.
EBIT is a similar measure to EBITDA, but takes into account depreciation and amortisation.
1.3 Principles of consolidationOur financial report includes the assets and liabilities of the Telstra Entity and its controlled entities as a whole as at the end of the financial year and the consolidated results and cash flows for the year.
An entity is considered to be a controlled entity where we are exposed, or have rights, to variable returns from our involvement with the entity and have the ability to affect those returns through our power to direct the activities of the entity. We consolidate the results of our controlled entities from the date on which we gain control until the date we cease control.
The effects of intra-group transactions and balances are eliminated in full from our consolidated financial statements.
Non-controlling interests in the results and equity of controlled entities are shown separately in our income statement, statement of comprehensive income, statement of financial position and statement of changes in equity.
The financial statements of controlled entities are prepared for the same reporting period as the Telstra Entity, using consistent accounting policies. Adjustments are made to bring into line any dissimilar accounting policies.
1.4 Key accounting estimates and judgementsPreparing the financial report requires management to make estimates and judgements. The accounting policies and significant management judgements and estimates used and any changes thereto are set out in the relevant notes. They can be located within the following notes:
Note 7.1 includes our accounting policy on foreign currency translation, changes in accounting policies and a summary of new accounting standards to be applied in future reporting periods.
Key accounting estimates and judgements Note PageAssessment of a significant financing component in mass market contracts 2.2 95
Determination of standalone selling prices 2.2 95Assessment of a significant financing component in Indefeasible Right of Use (IRU)
2.2 97
Impact of nbn Infrastructure Services Agreement (ISA) on revenue from customer contracts and other income
2.2 98
Assessment of a significant financing component in nbn DAs
2.2 98
Percentage of completion for commercial contracts with nbn co
2.2 99
Estimating provision for income tax 2.4 104Unrecognised deferred tax assets 2.4 105Cash generating units (CGUs) for impairment assessment 3.1 109
Useful lives and residual values of tangible assets 3.1 109Impact of nbn Infrastructure Services Agreement (ISA) on our fixed asset base 3.1 110
Determining CGUs and their recoverable amount for impairment assessment 3.2 112
Capitalisation of development costs 3.2 113Determining fair value of identifiable intangible assets 3.2 113
Useful lives of intangible assets 3.2 114Estimating allowance for doubtful debts 3.3 115Estimating net realisable value 3.4 117Amortisation period of deferred contract costs 3.8 121Long service leave provision 5.1 141Defined benefit plan 5.3 147Significant influence over our investments 6.2 155Joint control of our investments 6.2 155
Section 1 - Basis of Preparation.fm Page 81 Tuesday, August 27, 2019 4:29 PM

Telstra Corporation Limited and controlled entities | 81
Notes to the financial statements (continued) Telstra Financial Report 2019Telstra Financial Report 2019
Telstra Corporation Limited and controlled entities | 81
Notes to the financial statements
Section 1. Basis of preparation
This section explains basis of preparation of our financial report and provides a summary of our key accounting estimates and judgements.
SECTION 1. BASIS OF PREPARATION1.1 Basis of preparation of the financial reportThis financial report is a general purpose financial report, prepared by a ‘for profit’ entity, in accordance with the requirements of the Australian Corporations Act 2001, Accounting Standards applicable in Australia and other authoritative pronouncements of the Australian Accounting Standards Board (AASB). It also complies with International Financial Reporting Standards (IFRS) and Interpretations published by the International Accounting Standards Board (IASB).
The financial report is presented in Australian dollars and, unless otherwise stated, all values have been rounded to the nearest million dollars ($m) under the option available under the Australian Securities and Investments Commission (ASIC) Corporations (Rounding in Financial/Directors’ Report) Instrument 2016/191. The functional currency of the Telstra Entity and its Australian controlled entities is Australian dollars. The functional currency of certain non- Australian controlled entities is not Australian dollars. The results of these entities are translated into Australian dollars in accordance with our accounting policy in note 7.1.2.
The financial report is prepared in accordance with historical cost, except for some categories of financial instruments, which are recorded at fair value.
1.2 Terminology used in our income statement Earnings before interest, income tax expense, depreciation and amortisation (EBITDA) reflect our profit for the year, prior to including the effect of net finance costs, income taxes, depreciation and amortisation. Our management primarily uses EBITDA and earnings before interest and income tax expense (EBIT), in combination with other financial measures, to evaluate the Company’s operating performance. In addition, we believe EBITDA is useful to our shareholders, analysts and other members of the investment community who also view EBITDA as a widely recognised measure of operating performance.
EBIT is a similar measure to EBITDA, but takes into account depreciation and amortisation.
1.3 Principles of consolidationOur financial report includes the assets and liabilities of the Telstra Entity and its controlled entities as a whole as at the end of the financial year and the consolidated results and cash flows for the year.
An entity is considered to be a controlled entity where we are exposed, or have rights, to variable returns from our involvement with the entity and have the ability to affect those returns through our power to direct the activities of the entity. We consolidate the results of our controlled entities from the date on which we gain control until the date we cease control.
The effects of intra-group transactions and balances are eliminated in full from our consolidated financial statements.
Non-controlling interests in the results and equity of controlled entities are shown separately in our income statement, statement of comprehensive income, statement of financial position and statement of changes in equity.
The financial statements of controlled entities are prepared for the same reporting period as the Telstra Entity, using consistent accounting policies. Adjustments are made to bring into line any dissimilar accounting policies.
1.4 Key accounting estimates and judgementsPreparing the financial report requires management to make estimates and judgements. The accounting policies and significant management judgements and estimates used and any changes thereto are set out in the relevant notes. They can be located within the following notes:
Note 7.1 includes our accounting policy on foreign currency translation, changes in accounting policies and a summary of new accounting standards to be applied in future reporting periods.
Key accounting estimates and judgements Note PageAssessment of a significant financing component in mass market contracts 2.2 95
Determination of standalone selling prices 2.2 95Assessment of a significant financing component in Indefeasible Right of Use (IRU)
2.2 97
Impact of nbn Infrastructure Services Agreement (ISA) on revenue from customer contracts and other income
2.2 98
Assessment of a significant financing component in nbn DAs
2.2 98
Percentage of completion for commercial contracts with nbn co
2.2 99
Estimating provision for income tax 2.4 104Unrecognised deferred tax assets 2.4 105Cash generating units (CGUs) for impairment assessment 3.1 109
Useful lives and residual values of tangible assets 3.1 109Impact of nbn Infrastructure Services Agreement (ISA) on our fixed asset base 3.1 110
Determining CGUs and their recoverable amount for impairment assessment 3.2 112
Capitalisation of development costs 3.2 113Determining fair value of identifiable intangible assets 3.2 113
Useful lives of intangible assets 3.2 114Estimating allowance for doubtful debts 3.3 115Estimating net realisable value 3.4 117Amortisation period of deferred contract costs 3.8 121Long service leave provision 5.1 141Defined benefit plan 5.3 147Significant influence over our investments 6.2 155Joint control of our investments 6.2 155
Section 1 - Basis of Preparation.fm Page 81 Tuesday, August 27, 2019 4:29 PM

82 | Telstra Corporation Limited and controlled entities
Notes to the financial statements (continued)Notes to the financial statements
Section 1. Basis of preparation (continued)
82 | Telstra Corporation Limited and controlled entities
1.5 Adoption of the new accounting standardsIn the financial year 2019, we have adopted new accounting policies for revenue recognition, deferred contract costs and impairment of financial assets. A summary of the key impacts and restatement of the financial statements previously reported have been detailed below.
Key changes to our measurement, recognition and presentation of the impacted balances and transactions, i.e. our accounting policies are detailed in note 7.1.1.
(a) First time adoption of the new revenue standard
In December 2014, the AASB issued AASB 15: ‘Revenue from Contracts with Customers’ and AASB 2014-5: ‘Amendments to Australian Accounting Standards arising from AASB 15’. In October 2015, the AASB issued AASB 2015-8: ‘Amendments to Australian Accounting Standards – Effective Date of AASB 15’ which deferred the effective date of the new revenue standard from 1 January 2017 to 1 January 2018. In May 2016, the AASB issued AASB 2016-3: ‘Amendments to Australian Accounting Standards - Clarifications to AASB 15’. All these standards are further collectively referred to as AASB 15.
AASB 15 has superseded the existing accounting standards and interpretations for revenue and subscriber acquisition costs in the telecommunications industry.
We have adopted AASB 15 from 1 July 2018 and applied the standard retrospectively to prior reporting periods from 1 July 2017 (‘transition date’), subject to permitted and elected practical expedients. As a result, all comparative information in the financial statements has been prepared as if AASB 15 had always been in effect with a cumulative adjustment as at 1 July 2017.
The following practical expedients have been used for the transition to AASB 15:
• we have not restated contracts completed before 1 July 2017 (i.e. those contracts for which we have transferred all goods and services identified under the superseded accounting standards and interpretations)
• in the comparative reporting period of financial year 2018, for contracts that have variable consideration, we have used the transaction price at the date the contract was completed rather than estimating variable consideration amounts
• for contracts that were modified before 1 July 2017, we have not restated those contracts for their modifications effective prior to 1 July 2017 in accordance with AASB 15. Instead, we have reflected the aggregate effect of all modifications that occurred before 1 July 2017.
The application of AASB 15 did not affect our cash flows from operations or the methods and underlying economics through which we transact with our customers.
On adoption of the new standard, we have made the following adjustments to our comparative period in the financial statements for the financial year 2019 to reflect the requirements of AASB 15:
• $409 million after tax ($505 million before tax) decrease in opening retained earnings as at 1 July 2017 with corresponding adjustments against relevant line items in the statement of financial position
• $201 million decrease in total income, $277 million decrease in operating expenses, $76 million increase in EBITDA, $39 million increase in net finance costs, $37 million increase in profit before tax and $28 million increase in our net profit after tax for the year ended 30 June 2018.
AASB 15 adoption also resulted in changes to presentation and classification of certain items in the statement of financial position and in the income statement.
Refer to Tables A and B for impacts on our statement of financial position as at 1 July 2017 and 30 June 2018, respectively and to Tables C and D for impacts on our income statement and statement of comprehensive income for the year ended 30 June 2018.
(b) First time adoption of the new impairment rules for financial assets
In December 2014, the AASB issued the final version of AASB 9: ‘Financial Instruments’ (AASB 9 (2014)), and AASB 2014-7: ‘Amendments to Australian Accounting Standards arising from AASB 9 (December 2014)’.
AASB 9 is the new principal standard that consolidates requirements for the classification and measurement of financial assets and liabilities, hedge accounting and impairment of financial assets. AASB 9 (2014) supersedes all previously issued and amended versions of AASB 9 and applies to Telstra from 1 July 2018.
We early adopted the previous version of the standard, AASB 9 (2013), from 1 July 2014. This version excluded the impairment requirements, which replaced the incurred loss impairment model used previously with an expected credit loss model for impairment of financial assets. Expected credit losses are based on the difference between the contractual cash flows due under the contract and all the cash flows that we expect to receive. The differences are then discounted at the asset’s original effective interest rate.
We have applied the requirements of the new financial assets impairment model on a prospective basis from 1 July 2018 to balances, which incorporate the relevant restatements on a retrospective basis as at 1 July 2017 on the first time adoption of the new revenue standard.
Given AASB 9 requires us to hold allowances for expected rather than incurred credit losses, the allowance is therefore recognised earlier and most portfolio allowance holdings have increased. The increase in allowance resulted in a $63 million after tax ($89 million before tax) reduction of opening retained earnings as at 1 July 2018.
We have elected to apply the AASB 9 exemption and have not restated comparative periods in the year of initial application. Net impairment losses on financial assets as presented in the income statement in the comparative period were measured under the prior requirements.
Refer to Table B for impacts on our statement of financial position.
(c) Summary of new accounting policies
On adoption of the new accounting standards, our existing accounting policies have been amended to reflect the above changes in revenue recognition, contract costs and impairment of financial assets policies as described in the following notes.
New accounting policies Note PageRevenue from contracts with customers 2.2 99Revenue from other sources 2.2 101Impairment of financial assets 3.3 117Deferred contract costs 3.8 120
Section 1 - Basis of Preparation.fm Page 82 Tuesday, August 27, 2019 8:24 AM
Notes to the financial statements Telstra Financial Report 2019
Section 1. Basis of preparation (continued)
Telstra Corporation Limited and controlled entities | 83
1.5 Adoption of the new accounting standards (continued)(d) Overall impact on adoption of the new accounting policies
Tables A to D summarise the overall impact of changes in the accounting policies on our financial statements.
Table A: Impact of changes in the accounting policies on the statement of financial position as at 1 July 2017
Table ATelstra Group
As at 30 June 2017
AASB 15 As at 1 July 2017
Reported Adjustments Restated
$m $m $mCurrent assetsCash and cash equivalents 938 - 938Trade and other receivables and contract assets 5,468 622 6,090Deferred contract costs - 106 106Inventories 893 (424) 469Derivative financial assets 21 - 21Current tax receivables 11 - 11Prepayments 531 (119) 412Total current assets 7,862 185 8,047Non-current assetsTrade and other receivables and contract assets 1,039 (68) 971Deferred contract costs - 997 997Inventories 29 - 29Investments – accounted for using the equity method 194 - 194Investments – other 292 - 292Property, plant and equipment 21,350 - 21,350Intangible assets 9,558 (1,241) 8,317Derivative financial assets 1,623 - 1,623Deferred tax assets 44 - 44Defined benefit asset 142 - 142Total non-current assets 34,271 (312) 33,959Total assets 42,133 (127) 42,006Current liabilitiesTrade and other payables 4,189 (245) 3,944Employee benefits 865 - 865Other provisions 190 (21) 169Borrowings 2,476 - 2,476Derivative financial liabilities 42 - 42Current tax payables 161 - 161Contract liabilities and other revenue received in advance 1,236 188 1,424Total current liabilities 9,159 (78) 9,081Non-current liabilitiesOther payables 70 - 70Employee benefits 160 - 160Other provisions 134 - 134Borrowings 14,808 - 14,808Derivative financial liabilities 536 - 536Deferred tax liabilities 1,539 (96) 1,443Defined benefit liability 6 - 6Contract liabilities and other revenue received in advance 1,161 456 1,617Total non-current liabilities 18,414 360 18,774Total liabilities 27,573 282 27,855Net assets 14,560 (409) 14,151
Section 1 - Basis of Preparation.fm Page 83 Tuesday, August 27, 2019 8:24 AM
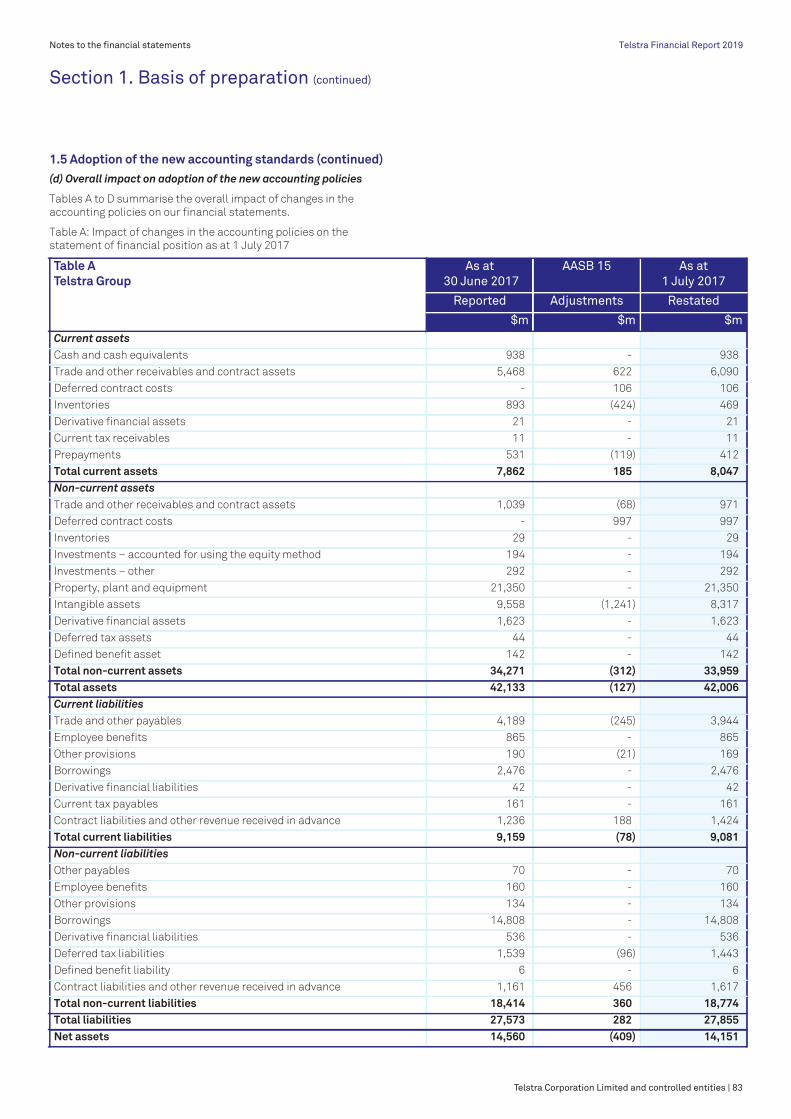
Telstra Corporation Limited and controlled entities | 83
Notes to the financial statements (continued) Telstra Financial Report 2019Telstra Financial Report 2019Notes to the financial statements Telstra Financial Report 2019
Section 1. Basis of preparation (continued)
Telstra Corporation Limited and controlled entities | 83
1.5 Adoption of the new accounting standards (continued)(d) Overall impact on adoption of the new accounting policies
Tables A to D summarise the overall impact of changes in the accounting policies on our financial statements.
Table A: Impact of changes in the accounting policies on the statement of financial position as at 1 July 2017
Table ATelstra Group
As at 30 June 2017
AASB 15 As at 1 July 2017
Reported Adjustments Restated
$m $m $mCurrent assetsCash and cash equivalents 938 - 938Trade and other receivables and contract assets 5,468 622 6,090Deferred contract costs - 106 106Inventories 893 (424) 469Derivative financial assets 21 - 21Current tax receivables 11 - 11Prepayments 531 (119) 412Total current assets 7,862 185 8,047Non-current assetsTrade and other receivables and contract assets 1,039 (68) 971Deferred contract costs - 997 997Inventories 29 - 29Investments – accounted for using the equity method 194 - 194Investments – other 292 - 292Property, plant and equipment 21,350 - 21,350Intangible assets 9,558 (1,241) 8,317Derivative financial assets 1,623 - 1,623Deferred tax assets 44 - 44Defined benefit asset 142 - 142Total non-current assets 34,271 (312) 33,959Total assets 42,133 (127) 42,006Current liabilitiesTrade and other payables 4,189 (245) 3,944Employee benefits 865 - 865Other provisions 190 (21) 169Borrowings 2,476 - 2,476Derivative financial liabilities 42 - 42Current tax payables 161 - 161Contract liabilities and other revenue received in advance 1,236 188 1,424Total current liabilities 9,159 (78) 9,081Non-current liabilitiesOther payables 70 - 70Employee benefits 160 - 160Other provisions 134 - 134Borrowings 14,808 - 14,808Derivative financial liabilities 536 - 536Deferred tax liabilities 1,539 (96) 1,443Defined benefit liability 6 - 6Contract liabilities and other revenue received in advance 1,161 456 1,617Total non-current liabilities 18,414 360 18,774Total liabilities 27,573 282 27,855Net assets 14,560 (409) 14,151
Section 1 - Basis of Preparation.fm Page 83 Tuesday, August 27, 2019 8:24 AM

84 | Telstra Corporation Limited and controlled entities
Notes to the financial statements (continued)Notes to the financial statements
Section 1. Basis of preparation (continued)
84 | Telstra Corporation Limited and controlled entities
1.5 Adoption of the new accounting standards (continued)(d) Overall impact on adoption of the new accounting policies (continued)
Table A (continued)Telstra Group
As at 30 June 2017
AASB 15 As at 1 July 2017
Reported Adjustments Restated
$m $m $mEquityShare capital 4,421 - 4,421Reserves (105) - (105)Retained profits 10,225 (409) 9,816Equity available to Telstra Entity shareholders 14,541 (409) 14,132Non-controlling interests 19 - 19Total equity 14,560 (409) 14,151
Section 1 - Basis of Preparation.fm Page 84 Tuesday, August 27, 2019 8:24 AM
Notes to the financial statements Telstra Financial Report 2019
Section 1. Basis of preparation (continued)
Telstra Corporation Limited and controlled entities | 85
1.5 Adoption of the new accounting standards (continued)(d) Overall impact on adoption of the new accounting policies (continued)
Table B: Impact of changes in the accounting policies on the statement of financial position as at 30 June 2018 and at 1 July 2018
Table BTelstra Group
As at 30 June 2018
AASB 15 As at 30 June 2018
AASB 9 As at 1 July 2018
Reported Adjustments Restated Adjustments Restated
$m $m $m $m $mCurrent assetsCash and cash equivalents 629 - 629 - 629Trade and other receivables and contract assets 5,018 570 5,588 (88) 5,500Deferred contract costs - 69 69 - 69Inventories 801 (309) 492 - 492Derivative financial assets 75 - 75 - 75Current tax receivables 6 - 6 - 6Prepayments 548 (117) 431 - 431Total current assets 7,077 213 7,290 (88) 7,202Non-current assetsTrade and other receivables and contract assets 1,012 (282) 730 (1) 729Deferred contract costs - 1,180 1,180 - 1,180Inventories 19 - 19 - 19Investments – accounted for using the equity method 1,237 - 1,237 - 1,237Investments – other 36 - 36 - 36Property, plant and equipment 22,108 - 22,108 - 22,108Intangible assets 9,180 (1,258) 7,922 - 7,922Derivative financial assets 1,897 - 1,897 - 1,897Deferred tax assets 54 - 54 - 54Defined benefit asset 250 - 250 - 250Total non-current assets 35,793 (360) 35,433 (1) 35,432Total assets 42,870 (147) 42,723 (89) 42,634Current liabilitiesTrade and other payables 4,835 (307) 4,528 - 4,528Employee benefits 868 - 868 - 868Other provisions 118 (29) 89 - 89Borrowings 1,635 - 1,635 - 1,635Derivative financial liabilities 1 - 1 - 1Current tax payables 132 - 132 - 132Contract liabilities and other revenue received in advance 1,227 305 1,532 - 1,532Total current liabilities 8,816 (31) 8,785 - 8,785Non-current liabilitiesOther payables 65 - 65 - 65Employee benefits 157 - 157 - 157Other provisions 171 (3) 168 - 168Borrowings 15,316 - 15,316 - 15,316Derivative financial liabilities 388 - 388 388Deferred tax liabilities 1,624 (87) 1,537 (26) 1,511Defined benefit liability 7 - 7 - 7Contract liabilities and other revenue received in advance 1,312 369 1,681 - 1,681Total non-current liabilities 19,040 279 19,319 (26) 19,293Total liabilities 27,856 248 28,104 (26) 28,078Net assets 15,014 (395) 14,619 (63) 14,556
Section 1 - Basis of Preparation.fm Page 85 Tuesday, August 27, 2019 8:24 AM

Telstra Corporation Limited and controlled entities | 85
Notes to the financial statements (continued) Telstra Financial Report 2019Telstra Financial Report 2019Notes to the financial statements Telstra Financial Report 2019
Section 1. Basis of preparation (continued)
Telstra Corporation Limited and controlled entities | 85
1.5 Adoption of the new accounting standards (continued)(d) Overall impact on adoption of the new accounting policies (continued)
Table B: Impact of changes in the accounting policies on the statement of financial position as at 30 June 2018 and at 1 July 2018
Table BTelstra Group
As at 30 June 2018
AASB 15 As at 30 June 2018
AASB 9 As at 1 July 2018
Reported Adjustments Restated Adjustments Restated
$m $m $m $m $mCurrent assetsCash and cash equivalents 629 - 629 - 629Trade and other receivables and contract assets 5,018 570 5,588 (88) 5,500Deferred contract costs - 69 69 - 69Inventories 801 (309) 492 - 492Derivative financial assets 75 - 75 - 75Current tax receivables 6 - 6 - 6Prepayments 548 (117) 431 - 431Total current assets 7,077 213 7,290 (88) 7,202Non-current assetsTrade and other receivables and contract assets 1,012 (282) 730 (1) 729Deferred contract costs - 1,180 1,180 - 1,180Inventories 19 - 19 - 19Investments – accounted for using the equity method 1,237 - 1,237 - 1,237Investments – other 36 - 36 - 36Property, plant and equipment 22,108 - 22,108 - 22,108Intangible assets 9,180 (1,258) 7,922 - 7,922Derivative financial assets 1,897 - 1,897 - 1,897Deferred tax assets 54 - 54 - 54Defined benefit asset 250 - 250 - 250Total non-current assets 35,793 (360) 35,433 (1) 35,432Total assets 42,870 (147) 42,723 (89) 42,634Current liabilitiesTrade and other payables 4,835 (307) 4,528 - 4,528Employee benefits 868 - 868 - 868Other provisions 118 (29) 89 - 89Borrowings 1,635 - 1,635 - 1,635Derivative financial liabilities 1 - 1 - 1Current tax payables 132 - 132 - 132Contract liabilities and other revenue received in advance 1,227 305 1,532 - 1,532Total current liabilities 8,816 (31) 8,785 - 8,785Non-current liabilitiesOther payables 65 - 65 - 65Employee benefits 157 - 157 - 157Other provisions 171 (3) 168 - 168Borrowings 15,316 - 15,316 - 15,316Derivative financial liabilities 388 - 388 388Deferred tax liabilities 1,624 (87) 1,537 (26) 1,511Defined benefit liability 7 - 7 - 7Contract liabilities and other revenue received in advance 1,312 369 1,681 - 1,681Total non-current liabilities 19,040 279 19,319 (26) 19,293Total liabilities 27,856 248 28,104 (26) 28,078Net assets 15,014 (395) 14,619 (63) 14,556
Section 1 - Basis of Preparation.fm Page 85 Tuesday, August 27, 2019 8:24 AM

86 | Telstra Corporation Limited and controlled entities
Notes to the financial statements (continued)Notes to the financial statements
Section 1. Basis of preparation (continued)
86 | Telstra Corporation Limited and controlled entities
1.5 Adoption of the new accounting standards (continued)(d) Overall impact on adoption of the new accounting policies (continued)
Table C: Impact of changes in the accounting policies on the income statement for the year ended 30 June 2018
Table B (continued)Telstra Group
As at 30 June 2018
AASB 15 As at 30 June 2018
AASB 9 As at 1 July 2018
Reported Adjustments Restated Adjustments Restated
$m $m $m $m $mEquityShare capital 4,428 - 4,428 - 4,428Reserves (117) (14) (131) - (131)Retained profits 10,716 (381) 10,335 (63) 10,272Equity available to Telstra Entity shareholders 15,027 (395) 14,632 (63) 14,569Non-controlling interests (13) - (13) - (13)Total equity 15,014 (395) 14,619 (63) 14,556
Table C Year ended 30 June
Telstra Group 2018 AASB 15 2018
Reported Adjustments Restated
$m $m $mIncomeRevenue (excluding finance income) 26,011 (163) 25,848Other income 3,031 (38) 2,993
29,042 (201) 28,841ExpensesLabour 5,157 50 5,207Goods and services purchased 8,758 (420) 8,338Net impairment losses on financial and contract assets 190 - 190Other expenses 4,794 93 4,887
18,899 (277) 18,622Share of net loss from joint ventures and associated entities (22) - (22)
18,921 (277) 18,644
Earnings before interest, income tax expense, depreciation and amortisation (EBITDA) 10,121 76 10,197
Depreciation and amortisation 4,470 - 4,470Earnings before interest and income tax expense (EBIT) 5,651 76 5,727Finance income 82 136 218Finance costs 631 175 806Net finance costs 549 39 588Profit before income tax expense 5,102 37 5,139Income tax expense 1,573 9 1,582Profit for the year 3,529 28 3,557Profit/(loss) attributable to:Equity holders of Telstra Entity 3,563 28 3,591Non-controlling interests (34) - (34)
3,529 28 3,557
Earnings per share (cents per share) cents cents centsBasic 30.0 0.2 30.2Diluted 30.0 0.2 30.2
Section 1 - Basis of Preparation.fm Page 86 Tuesday, August 27, 2019 8:24 AM
Notes to the financial statements Telstra Financial Report 2019
Section 1. Basis of preparation (continued)
Telstra Corporation Limited and controlled entities | 87
1.5 Adoption of the new accounting standards (continued)(d) Overall impact on adoption of the new accounting policies (continued)
Table D: Impact of changes in the accounting policies on the statement of comprehensive income for the year ended 30 June 2018
Changes in the accounting policies impacting retained profits and reserves (foreign currency translation reserve) are presented as restatements directly in the Statement of Changes in Equity.
Table D Year ended 30 June
Telstra Group 2018 AASB 15 2018
Reported Adjustments Restated
$m $m $mProfit/(loss) for the year attributable to:Equity holders of Telstra Entity 3,563 (28) 3,591Non-controlling interests (34) - (34)
3,529 (28) 3,557Items that will not be reclassified to the income statementRetained profitsActuarial gain on defined benefit plans attributable to equity holders of Telstra Entity 112 - 112Income tax on actuarial gain on defined benefit plans (34) - (34)Fair value of equity instruments reserveLoss from investments in equity instruments designated at fair value through other comprehensive income (16) - (16)
Share of other comprehensive income of equity accounted entities 29 - 29Income tax on fair value movements for investments in equity instruments 2 - 2Foreign currency translation reserveTranslation differences of foreign operations attributable to non-controlling interests (3) - (3)
90 - 90Items that may be subsequently reclassified to the income statementForeign currency translation reserveTranslation differences of foreign operations attributable to equity holders of Telstra Entity 62 14 48
Share of foreign currency translation reserve of equity accounted entities 4 - 4Cash flow hedging reserveMovements in cash flow hedging reserve (97) - (97)Income tax on movements in the cash flow hedging reserve 29 - 29Foreign currency basis spread reserveChanges in the value of the foreign currency basis spread (31) - (31)Income tax on movements in the foreign currency basis spread reserve 9 - 9
(24) 14 (38)Total other comprehensive income 66 14 52Total comprehensive income for the year 3,595 (14) 3,609Total comprehensive income attributable to:Equity holders of Telstra Entity 3,632 (14) 3,646Non-controlling interest (37) - (37)
Section 1 - Basis of Preparation.fm Page 87 Tuesday, August 27, 2019 8:24 AM

Telstra Corporation Limited and controlled entities | 87
Notes to the financial statements (continued) Telstra Financial Report 2019Telstra Financial Report 2019Notes to the financial statements Telstra Financial Report 2019
Section 1. Basis of preparation (continued)
Telstra Corporation Limited and controlled entities | 87
1.5 Adoption of the new accounting standards (continued)(d) Overall impact on adoption of the new accounting policies (continued)
Table D: Impact of changes in the accounting policies on the statement of comprehensive income for the year ended 30 June 2018
Changes in the accounting policies impacting retained profits and reserves (foreign currency translation reserve) are presented as restatements directly in the Statement of Changes in Equity.
Table D Year ended 30 June
Telstra Group 2018 AASB 15 2018
Reported Adjustments Restated
$m $m $mProfit/(loss) for the year attributable to:Equity holders of Telstra Entity 3,563 (28) 3,591Non-controlling interests (34) - (34)
3,529 (28) 3,557Items that will not be reclassified to the income statementRetained profitsActuarial gain on defined benefit plans attributable to equity holders of Telstra Entity 112 - 112Income tax on actuarial gain on defined benefit plans (34) - (34)Fair value of equity instruments reserveLoss from investments in equity instruments designated at fair value through other comprehensive income (16) - (16)
Share of other comprehensive income of equity accounted entities 29 - 29Income tax on fair value movements for investments in equity instruments 2 - 2Foreign currency translation reserveTranslation differences of foreign operations attributable to non-controlling interests (3) - (3)
90 - 90Items that may be subsequently reclassified to the income statementForeign currency translation reserveTranslation differences of foreign operations attributable to equity holders of Telstra Entity 62 14 48
Share of foreign currency translation reserve of equity accounted entities 4 - 4Cash flow hedging reserveMovements in cash flow hedging reserve (97) - (97)Income tax on movements in the cash flow hedging reserve 29 - 29Foreign currency basis spread reserveChanges in the value of the foreign currency basis spread (31) - (31)Income tax on movements in the foreign currency basis spread reserve 9 - 9
(24) 14 (38)Total other comprehensive income 66 14 52Total comprehensive income for the year 3,595 (14) 3,609Total comprehensive income attributable to:Equity holders of Telstra Entity 3,632 (14) 3,646Non-controlling interest (37) - (37)
Section 1 - Basis of Preparation.fm Page 87 Tuesday, August 27, 2019 8:24 AM

88 | Telstra Corporation Limited and controlled entities
Notes to the financial statements (continued)
88 | Telstra Corporation Limited and controlled entities
Notes to the financial statements (continued)
Section 2. Our performance
This section explains our results, performance of our segments, which are reported on the same basis as our internal management structure, and our earnings per share for the period. It also provides disaggregated revenue, details of selected income and expense items, information about taxation and a reconciliation of our profit to net cash generated from operating activities.
SECTION 2. OUR PERFORMANCE2.1 Segments and disaggregated revenue
Segment information is based on the information that management uses to make decisions about operating matters and allows users to review operations through the eyes of management.
Our operating segments represent the business units which offer our main products and services in the market, however only some of our operating segments meet the disclosure criteria for reportable segments.
The presentation of revenue is disaggregated by category and segment based on the timing of transfer of goods and services, major products and our geographical markets.
2.1.1 Operating segments
We report segment information on the same basis as our internal management reporting structure at the reporting date. Segment comparatives reflect any organisational changes that have occurred since the prior reporting period to present a like-for-like view.
On 20 June 2018, we announced the following organisational changes effective from 1 July 2018:
• establishment of a standalone infrastructure business unit, Telstra InfraCo segment, comprising previously reported Telstra Wholesale segment and network services provided to nbn co and other customers under commercial contracts (previously part of
Telstra Operations segment). Telstra InfraCo manages Telstra’s high quality fixed network infrastructure including data centres, non-mobiles related domestic fibre, copper, Hybrid Fibre Coaxial (HFC) cable network, international subsea cables, exchanges, poles, ducts and pipes. It supplies services to other business units within Telstra, to our wholesale customers and to nbn co
• creation of Global Business Services (GBS) which consolidates all large scale repeatable back of house processes across the billing, assurance, activations, field, accounting services, procurement, people and property functions and is designed to leverage scale, innovation and technology to improve experience, efficiency and costs.
Effective from 1 October 2018 the remaining lines of business in Telstra Operations segment were renamed Networks and IT (N&IT) segment. In addition, the Technology Innovation and Strategy segment was split between various segments with the majority transferred to N&IT. The remaining employees in the Technology Innovation and Strategy segment were joined by various product teams from Telstra Consumer & Small Business and Telstra Enterprise segments and this segment was renamed as Products and Technology.
The ‘All Other’ category includes business units that do not qualify as operating segments in their own right as well as the operating segments which do not meet the disclosure requirements of a reportable segment. These are New Business (which includes Telstra Health, Global Products, Telstra Software Group and Neto), GBS and Product and Technology Group.
We have four reportable segments as follows:
Segment Operation
Telstra Consumer and Small Business (TC&SB)
• provider of telecommunication products, services and solutions across mobiles, fixed and mobile broadband, telephony and Pay TV/IPTV and digital content to consumer and small business customers in Australia
• the operation of inbound and outbound call centres, Telstra shops (owned and licensed) and the Telstra dealership network
• online self-service capabilities for customers, from buying to billing and service requests
Telstra Enterprise (TE) • sales and contract management for medium to large business and government customers in Australia and globally
• management of Telstra's networks outside Australia in conjunction with N&IT and Telstra Infraco segments
• product management for advanced technology solutions and services, including Data and Internet Protocol (IP) networks, mobility services, and Network Applications and Services (NAS) products such as managed network, unified communications, cloud, industry solutions and integrated services and monitoring in Australia and globally
• development of industry vertical solutions based on Telstra's networks and technology
Section 2 - Our Performance.fm Page 88 Tuesday, August 27, 2019 8:37 AM
Notes to the financial statements (continued) Telstra Financial Report 2019
Section 2. Our performance (continued)
Telstra Corporation Limited and controlled entities | 89
2.1 Segments and disaggregated revenue (continued)2.1.1 Operating segments (continued)
Segment Operation
Networks and IT (N&IT) • overall planning, design, engineering architecture and construction of Telstra networks, technology and information technology solutions
• delivering network technologies • delivering digital platforms and capabilities to enable digital experiences• build and management of the shared platforms, infrastructure, cloud services, software and
technologies for all internal functions
Telstra InfraCo • provider of a wide range of telecommunication products and services delivered over Telstra networks and associated support systems to other carriers, carriage service providers and internet service providers
• holding fixed network infrastructure including data centres, non-mobiles related domestic fibre, copper, HFC cable, international subsea cables, exchanges, poles, ducts and pipes
• providing access to our fixed network infrastructure assets to other Telstra business units, wholesale customers and nbn co
• providing nbn co with long term access to certain components of our infrastructure and certain network services under the Infrastructure Services Agreement (ISA) and commercial contracts.
Consistent with information presented for internal management reporting purposes, the result of each segment is measured based on its EBITDA contribution. EBITDA contribution excludes the effects of all inter-segment balances and transactions, with the exception of transactions referred to following Table A in note 2.1.2 and those related to the Telstra InfraCo segment as explained below. As such, only transactions external to the Telstra Group are reported except as otherwise noted.
The majority of redundancy expenses for the Telstra Entity and restructuring costs are related to multiple reportable segments and are recorded by our corporate areas (included in the ‘All Other’ category).
From 1 July 2018 we manage Telstra InfraCo segment on a standalone basis, i.e. inclusive of its transactions with other business units. Other business units, however, do not reflect those transactions with Telstra InfraCo in their segment results. The following paragraphs describe types of transactions reported in Telstra InfraCo segment that are not included in the results of other business units. These transactions are eliminated at the Group level.
The following further explains how some items are allocated and managed and, as a result, how they are reflected in our segment results:
• Telstra InfraCo generates revenue from transactions with other business units. The inter-segment transactions which started from 1 July 2018 relate to access charges for the use of the infrastructure assets are not included in the EBITDA contribution of these other business units within Telstra Group. The access charges are charged on the assets which are allocated to Telstra InfraCo, being our fixed network infrastructure. Where such assets are shared with other business units, an allocation of the assets to Telstra InfraCo has been determined based on historical usage. These access charges are determined based on an approach that incorporates a variety of internally and externally observable inputs to reflect an arm’s length basis for charging. They are regularly reviewed by management and are eliminated at the Group level for statutory reporting purposes
• from 1 July 2018, the Telstra InfraCo segment result includes operations and maintenance expense. The expenses originating from the N&IT segment and ‘All Other’ category relate to Telstra
InfraCo assets and is eliminated at the Group level. The shared operations and maintenance costs allocated to Telstra InfraCo assets are based on a usage methodology
• the N&IT segment and ‘All Other’ category results include network service delivery costs for TC&SB, TE and Telstra InfraCo customers
• the operations and maintenance costs relating to Telstra InfraCo assets are included in Telstra InfraCo costs, but have not been excluded from the N&IT or ‘All Other’ category
• the N&IT segment recognises expenses in relation to the installation, maintenance and running of the HFC cable network held in Telstra InfraCo (except for operations and maintenance costs recharged by N&IT to Telstra InfraCo), while a portion of the running costs of the HFC cable network is managed by the Corporate Accounting unit (included in the ‘All Other’ category)
• the Telstra InfraCo segment result includes rental revenue from providing nbn co with long term access to ducts and pits and other components of our infrastructure under the ISA, while the associated costs are reported in the N&IT segment and in the ‘All Other’ category, respectively
• from 1 July 2018 Telstra InfraCo also includes costs associated with support functions which have not been removed from other segments. We allocate these costs by utilising driver-based cost allocation methodology for our internal performance reporting
• revenue associated with mobile handsets sold via dealers for the TE segment is allocated to the TC&SB segment along with the associated costs of goods sold, as the TC&SB segment manages our supplier, delivery and dealership arrangements. Ongoing pre-paid and post-paid mobile revenues derived from our mobile usage services are recorded in the TC&SB and TE segments depending on the type of customer serviced
• domestic promotion and advertising expenses for the Telstra Entity are recorded in the TC&SB segment
• the rental costs, with the exception of costs related to our retail shops and international operations, are reported in GBS (included in the ‘All Other’ category)
• the ‘All Other’ category includes income from nbn disconnection fees, while the associated costs are reported in GBS which is also included in the ‘All Other’ category.
Section 2 - Our Performance.fm Page 89 Tuesday, August 27, 2019 8:37 AM

Telstra Corporation Limited and controlled entities | 89
Notes to the financial statements (continued) Telstra Financial Report 2019Telstra Financial Report 2019Notes to the financial statements (continued) Telstra Financial Report 2019
Section 2. Our performance (continued)
Telstra Corporation Limited and controlled entities | 89
2.1 Segments and disaggregated revenue (continued)2.1.1 Operating segments (continued)
Segment Operation
Networks and IT (N&IT) • overall planning, design, engineering architecture and construction of Telstra networks, technology and information technology solutions
• delivering network technologies • delivering digital platforms and capabilities to enable digital experiences• build and management of the shared platforms, infrastructure, cloud services, software and
technologies for all internal functions
Telstra InfraCo • provider of a wide range of telecommunication products and services delivered over Telstra networks and associated support systems to other carriers, carriage service providers and internet service providers
• holding fixed network infrastructure including data centres, non-mobiles related domestic fibre, copper, HFC cable, international subsea cables, exchanges, poles, ducts and pipes
• providing access to our fixed network infrastructure assets to other Telstra business units, wholesale customers and nbn co
• providing nbn co with long term access to certain components of our infrastructure and certain network services under the Infrastructure Services Agreement (ISA) and commercial contracts.
Consistent with information presented for internal management reporting purposes, the result of each segment is measured based on its EBITDA contribution. EBITDA contribution excludes the effects of all inter-segment balances and transactions, with the exception of transactions referred to following Table A in note 2.1.2 and those related to the Telstra InfraCo segment as explained below. As such, only transactions external to the Telstra Group are reported except as otherwise noted.
The majority of redundancy expenses for the Telstra Entity and restructuring costs are related to multiple reportable segments and are recorded by our corporate areas (included in the ‘All Other’ category).
From 1 July 2018 we manage Telstra InfraCo segment on a standalone basis, i.e. inclusive of its transactions with other business units. Other business units, however, do not reflect those transactions with Telstra InfraCo in their segment results. The following paragraphs describe types of transactions reported in Telstra InfraCo segment that are not included in the results of other business units. These transactions are eliminated at the Group level.
The following further explains how some items are allocated and managed and, as a result, how they are reflected in our segment results:
• Telstra InfraCo generates revenue from transactions with other business units. The inter-segment transactions which started from 1 July 2018 relate to access charges for the use of the infrastructure assets are not included in the EBITDA contribution of these other business units within Telstra Group. The access charges are charged on the assets which are allocated to Telstra InfraCo, being our fixed network infrastructure. Where such assets are shared with other business units, an allocation of the assets to Telstra InfraCo has been determined based on historical usage. These access charges are determined based on an approach that incorporates a variety of internally and externally observable inputs to reflect an arm’s length basis for charging. They are regularly reviewed by management and are eliminated at the Group level for statutory reporting purposes
• from 1 July 2018, the Telstra InfraCo segment result includes operations and maintenance expense. The expenses originating from the N&IT segment and ‘All Other’ category relate to Telstra
InfraCo assets and is eliminated at the Group level. The shared operations and maintenance costs allocated to Telstra InfraCo assets are based on a usage methodology
• the N&IT segment and ‘All Other’ category results include network service delivery costs for TC&SB, TE and Telstra InfraCo customers
• the operations and maintenance costs relating to Telstra InfraCo assets are included in Telstra InfraCo costs, but have not been excluded from the N&IT or ‘All Other’ category
• the N&IT segment recognises expenses in relation to the installation, maintenance and running of the HFC cable network held in Telstra InfraCo (except for operations and maintenance costs recharged by N&IT to Telstra InfraCo), while a portion of the running costs of the HFC cable network is managed by the Corporate Accounting unit (included in the ‘All Other’ category)
• the Telstra InfraCo segment result includes rental revenue from providing nbn co with long term access to ducts and pits and other components of our infrastructure under the ISA, while the associated costs are reported in the N&IT segment and in the ‘All Other’ category, respectively
• from 1 July 2018 Telstra InfraCo also includes costs associated with support functions which have not been removed from other segments. We allocate these costs by utilising driver-based cost allocation methodology for our internal performance reporting
• revenue associated with mobile handsets sold via dealers for the TE segment is allocated to the TC&SB segment along with the associated costs of goods sold, as the TC&SB segment manages our supplier, delivery and dealership arrangements. Ongoing pre-paid and post-paid mobile revenues derived from our mobile usage services are recorded in the TC&SB and TE segments depending on the type of customer serviced
• domestic promotion and advertising expenses for the Telstra Entity are recorded in the TC&SB segment
• the rental costs, with the exception of costs related to our retail shops and international operations, are reported in GBS (included in the ‘All Other’ category)
• the ‘All Other’ category includes income from nbn disconnection fees, while the associated costs are reported in GBS which is also included in the ‘All Other’ category.
Section 2 - Our Performance.fm Page 89 Tuesday, August 27, 2019 8:37 AM

90 | Telstra Corporation Limited and controlled entities
Notes to the financial statements (continued)Notes to the financial statements (continued)
Section 2. Our performance (continued)
90 | Telstra Corporation Limited and controlled entities
2.1 Segments and disaggregated revenue (continued)2.1.2 Segment results and disaggregated revenue
Table A details our segment results and a reconciliation of EBITDA contribution to the Telstra Group’s EBITDA, EBIT and profit before income tax expense. It also presents disaggregated revenue based on the nature and the timing of transfer of goods and services.
Table ATelstra Group
TC&SB TE N&IT All Other Subtotal Telstra InfraCo
Elimina-tions
Total
$m $m $m $m $m $m $m $m
Year ended 30 June 2019Revenue from contracts with customersSale of services 10,714 7,121 1 (58) 17,778 2,786 - 20,564Sale of goods 2,869 810 - 2 3,681 2 - 3,683Other revenue from contracts with customers (1) 31 - 14 44 - - 44
13,582 7,962 1 (42) 21,503 2,788 - 24,291Revenue from other sources 674 251 34 9 968 - - 968Revenue from external customers 14,256 8,213 35 (33) 22,471 2,788 - 25,259Revenue from transactions between Telstra InfraCo and other segments
n/a n/a n/a n/a n/a 1,891 (1,891) -
Total revenue from external customers and Telstra InfraCo 14,256 8,213 35 (33) 22,471 4,679 (1,891) 25,259
Other income 15 30 35 2,199 2,279 269 - 2,548Total income 14,271 8,243 70 2,166 24,750 4,948 (1,891) 27,807Share of net profit from joint ventures and associated entities - 2 - 10 12 - - 12
EBITDA contribution 5,581 3,411 (1,459) (1,870) 5,663 3,192 (871) 7,984Depreciation and amortisation (4,282)Telstra Group EBIT 3,702Net finance costs (630)Telstra Group profit before income tax expense 3,072
Section 2 - Our Performance.fm Page 90 Tuesday, August 27, 2019 8:37 AM
Notes to the financial statements (continued) Telstra Financial Report 2019
Section 2. Our performance (continued)
Telstra Corporation Limited and controlled entities | 91
2.1 Segments and disaggregated revenue (continued)2.1.2 Segment results and disaggregated revenue (continued)
Table A (continued)Telstra Group
TC&SB TE N&IT All Other Subtotal Telstra InfraCo
Elimina-tions
Total
$m $m $m $m $m $m $m $m
Year ended 30 June 2018 (restated)Revenue from contracts with customersSale of services 11,400 7,039 1 33 18,473 3,050 - 21,523Sale of goods 2,554 809 - 3 3,366 2 - 3,368Other revenue from contracts with customers 4 39 - 16 59 - - 59
13,958 7,887 1 52 21,898 3,052 - 24,950Revenue from other sources 524 298 49 27 898 - 898Revenue from external customers 14,482 8,185 50 79 22,796 3,052 - 25,848Revenue from transactions between Telstra InfraCo and other segments
n/a n/a n/a n/a n/a - - -
Total revenue from external customers and Telstra InfraCo 14,482 8,185 50 79 22,796 3,052 - 25,848
Other income 16 32 25 2,709 2,782 211 - 2,993Total income 14,498 8,217 75 2,788 25,578 3,263 - 28,841Share of net profit/(loss) from joint ventures and associated entities - 2 - (24) (22) - - (22)
EBITDA contribution 6,626 3,527 (1,477) (897) 7,779 2,418 - 10,197Depreciation and amortisation (4,470)Telstra Group EBIT 5,727Net finance costs (588)Telstra Group profit before income tax expense 5,139
We recognise revenue from contracts with customers when the control of goods or services has been transferred to the customer. Revenue from sale of services is recognised over time, whereas revenue from sale of goods is recognised at a point in time. Other revenue from contracts with customers includes licensing revenue (recognised either at a point in time or over time) and agency revenue (recognised over time). Refer to note 2.2.1 for further details about our contracts with customers.
The effects of the following inter-segment transactions have not been excluded from segment EBITDA contribution:
• revenue from external customers in the TE segment includes $254 million (2018: $214 million) of inter-segment revenue treated as external expenses in the TC&SB and Telstra InfraCo segments, which is eliminated in the ‘All Other’ category
• external expenses in the TE segment include $11 million (2018: $13 million) of inter-segment expenses treated as external revenue in the Telstra InfraCo and eliminated in the ‘All Other’ category.
During the year, total impairment loss of $499 million related to property, plant and equipment and software assets was recognised in the ‘All Other’ category. Refer to notes 3.1 and 3.2 for further details.
In the financial year 2018, a total impairment loss of $317 million related to goodwill and other non-current assets was recognised in the ‘All Other’ category.
Section 2 - Our Performance.fm Page 91 Tuesday, August 27, 2019 8:37 AM
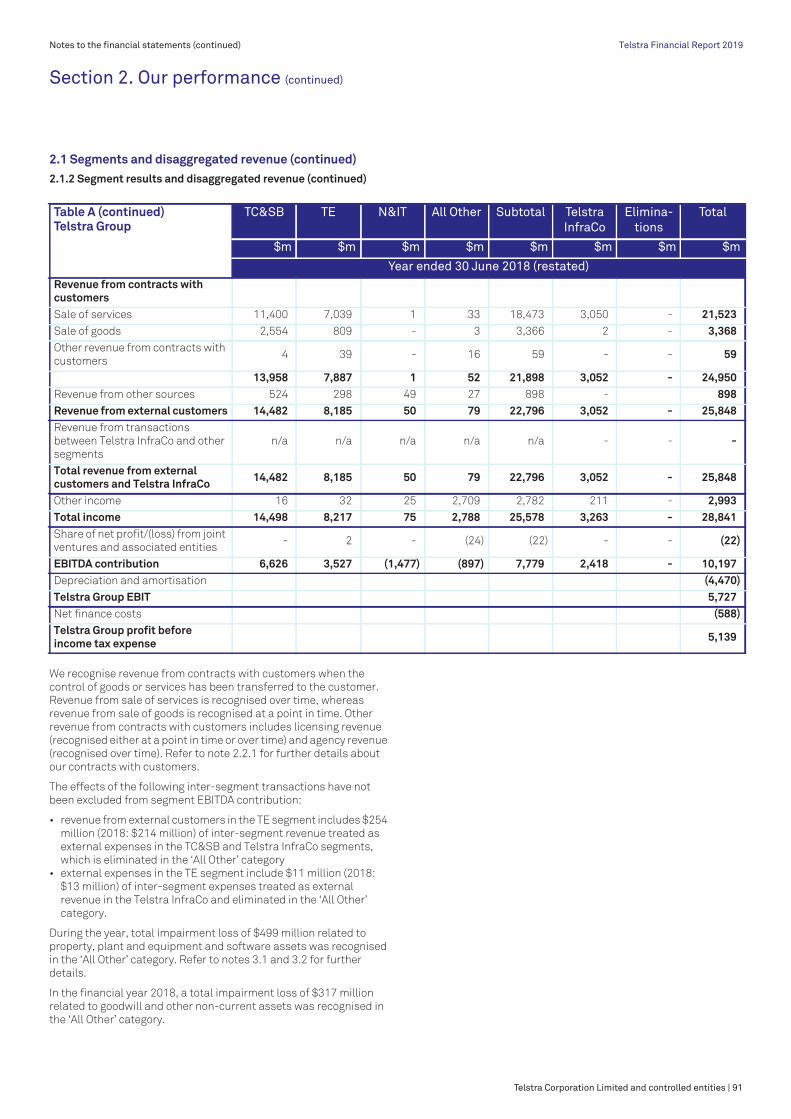
Telstra Corporation Limited and controlled entities | 91
Notes to the financial statements (continued) Telstra Financial Report 2019Telstra Financial Report 2019Notes to the financial statements (continued) Telstra Financial Report 2019
Section 2. Our performance (continued)
Telstra Corporation Limited and controlled entities | 91
2.1 Segments and disaggregated revenue (continued)2.1.2 Segment results and disaggregated revenue (continued)
Table A (continued)Telstra Group
TC&SB TE N&IT All Other Subtotal Telstra InfraCo
Elimina-tions
Total
$m $m $m $m $m $m $m $m
Year ended 30 June 2018 (restated)Revenue from contracts with customersSale of services 11,400 7,039 1 33 18,473 3,050 - 21,523Sale of goods 2,554 809 - 3 3,366 2 - 3,368Other revenue from contracts with customers 4 39 - 16 59 - - 59
13,958 7,887 1 52 21,898 3,052 - 24,950Revenue from other sources 524 298 49 27 898 - 898Revenue from external customers 14,482 8,185 50 79 22,796 3,052 - 25,848Revenue from transactions between Telstra InfraCo and other segments
n/a n/a n/a n/a n/a - - -
Total revenue from external customers and Telstra InfraCo 14,482 8,185 50 79 22,796 3,052 - 25,848
Other income 16 32 25 2,709 2,782 211 - 2,993Total income 14,498 8,217 75 2,788 25,578 3,263 - 28,841Share of net profit/(loss) from joint ventures and associated entities - 2 - (24) (22) - - (22)
EBITDA contribution 6,626 3,527 (1,477) (897) 7,779 2,418 - 10,197Depreciation and amortisation (4,470)Telstra Group EBIT 5,727Net finance costs (588)Telstra Group profit before income tax expense 5,139
We recognise revenue from contracts with customers when the control of goods or services has been transferred to the customer. Revenue from sale of services is recognised over time, whereas revenue from sale of goods is recognised at a point in time. Other revenue from contracts with customers includes licensing revenue (recognised either at a point in time or over time) and agency revenue (recognised over time). Refer to note 2.2.1 for further details about our contracts with customers.
The effects of the following inter-segment transactions have not been excluded from segment EBITDA contribution:
• revenue from external customers in the TE segment includes $254 million (2018: $214 million) of inter-segment revenue treated as external expenses in the TC&SB and Telstra InfraCo segments, which is eliminated in the ‘All Other’ category
• external expenses in the TE segment include $11 million (2018: $13 million) of inter-segment expenses treated as external revenue in the Telstra InfraCo and eliminated in the ‘All Other’ category.
During the year, total impairment loss of $499 million related to property, plant and equipment and software assets was recognised in the ‘All Other’ category. Refer to notes 3.1 and 3.2 for further details.
In the financial year 2018, a total impairment loss of $317 million related to goodwill and other non-current assets was recognised in the ‘All Other’ category.
Section 2 - Our Performance.fm Page 91 Tuesday, August 27, 2019 8:37 AM

92 | Telstra Corporation Limited and controlled entities
Notes to the financial statements (continued)Notes to the financial statements (continued)
Section 2. Our performance (continued)
92 | Telstra Corporation Limited and controlled entities
2.1 Segments and disaggregated revenue (continued)2.1.2 Segment results and disaggregated revenue (continued)
Table B presents disaggregation of our segment revenue by major products and geographical markets.
Table BTelstra Group
TC&SB TE N&IT All Other Telstra InfraCo
Total
$m $m $m $m $m $m
Year ended 30 June 2019Total revenue from external customers by productFixed 4,144 262 - 12 805 5,223Revenue from contracts with customers 4,142 262 - 12 805 5,221Revenue from other sources 2 - - - - 2Mobile 8,685 1,666 - (16) 210 10,545Revenue from contracts with customers 8,171 1,656 - (16) 210 10,021Revenue from other sources 514 10 - - - 524Data & IP 162 1,757 - (6) 445 2,358Revenue from contracts with customers 162 1,757 - (6) 445 2,358Revenue from other sources - - - - - -Network applications and services 311 2,565 35 13 553 3,477Revenue from contracts with customers 311 2,328 1 13 553 3,206Revenue from other sources - 237 34 - - 271Media 781 1 - 50 - 832Revenue from contracts with customers 781 1 - 50 - 832Revenue from other sources - - - - - -Global connectivity - 1,954 - (254) - 1,700Revenue from contracts with customers - 1,953 - (254) - 1,699Revenue from other sources - 1 - - - 1Other products and services 173 8 - 168 775 1,124Revenue from contracts with customers 15 5 - 159 775 954Revenue from other sources 158 3 - 9 - 170Total revenue from contracts with customers 13,582 7,962 1 (42) 2,788 24,291Total revenue from other sources 674 251 34 9 - 968
14,256 8,213 35 (33) 2,788 25,259Total revenue from external customers by geographical marketAustralian customers 14,256 6,506 35 203 2,788 23,788Revenue from contracts with customers 13,582 6,256 1 194 2,788 22,821Revenue from other sources 674 250 34 9 - 967Offshore customers - 1,707 - (236) - 1,471Revenue from contracts with customers - 1,706 - (236) - 1,470Revenue from other sources - 1 - - - 1
14,256 8,213 35 (33) 2,788 25,259
Section 2 - Our Performance.fm Page 92 Tuesday, August 27, 2019 8:37 AM
Notes to the financial statements (continued) Telstra Financial Report 2019
Section 2. Our performance (continued)
Telstra Corporation Limited and controlled entities | 93
2.1 Segments and disaggregated revenue (continued)2.1.2 Segment results and disaggregated revenue (continued)
Table B (continued)Telstra Group
TC&SB TE N&IT All Other Telstra InfraCo
Total
$m $m $m $m $m $m
Year ended 30 June 2018 (restated)Total revenue from external customers by productFixed 4,421 317 - 17 1,010 5,765Revenue from contracts with customers 4,410 317 - 17 1,010 5,754Revenue from other sources 11 - - - - 11Mobile 8,565 1,629 - (12) 198 10,380Revenue from contracts with customers 8,227 1,617 - (12) 198 10,030Revenue from other sources 338 12 - - - 350Data & IP 190 1,915 - (5) 456 2,556Revenue from contracts with customers 190 1,915 - (5) 456 2,556Revenue from other sources - - - - - -Network applications and services 273 2,546 50 5 753 3,627Revenue from contracts with customers 273 2,261 1 5 753 3,293Revenue from other sources 285 49 - - 334Media 840 1 - 78 - 919Revenue from contracts with customers 840 1 - 78 - 919Revenue from other sources - - - - - -Global connectivity - 1,783 - (214) - 1,569Revenue from contracts with customers - 1,783 - (214) - 1,569Revenue from other sources - - - - - -Other products and services 193 (6) - 210 635 1,032Revenue from contracts with customers 18 (7) - 183 635 829Revenue from other sources 175 1 - 27 - 203Total revenue from contracts with customers 13,958 7,887 1 52 3,052 24,950Total revenue from other sources 524 298 49 27 - 898
14,482 8,185 50 79 3,052 25,848Total revenue from external customers by geographical marketAustralian customers 14,482 6,646 50 210 3,052 24,440Revenue from contracts with customers 13,958 6,348 1 183 3,052 23,542Revenue from other sources 524 298 49 27 - 898Offshore customers - 1,539 - (131) - 1,408Revenue from contracts with customers - 1,539 - (131) - 1,408Revenue from other sources - - - - - -
14,482 8,185 50 79 3,052 25,848
Other products and services relate to nbn co accessing our infrastructure and miscellaneous revenue. It also includes revenue from Telstra Health and Telstra Software business units.
All Other category by product and by geographical market includes eliminations of the inter-segment transactions described in the segment results following Table A in note 2.1.2. Amounts disclosed in geographical markets were partly offset by revenue from operating segments which do not meet the disclosure requirements of a reportable segment. Other negative product revenue amounts relate to certain corporate level adjustments.
Section 2 - Our Performance.fm Page 93 Tuesday, August 27, 2019 8:37 AM

Telstra Corporation Limited and controlled entities | 93
Notes to the financial statements (continued) Telstra Financial Report 2019Telstra Financial Report 2019Notes to the financial statements (continued) Telstra Financial Report 2019
Section 2. Our performance (continued)
Telstra Corporation Limited and controlled entities | 93
2.1 Segments and disaggregated revenue (continued)2.1.2 Segment results and disaggregated revenue (continued)
Table B (continued)Telstra Group
TC&SB TE N&IT All Other Telstra InfraCo
Total
$m $m $m $m $m $m
Year ended 30 June 2018 (restated)Total revenue from external customers by productFixed 4,421 317 - 17 1,010 5,765Revenue from contracts with customers 4,410 317 - 17 1,010 5,754Revenue from other sources 11 - - - - 11Mobile 8,565 1,629 - (12) 198 10,380Revenue from contracts with customers 8,227 1,617 - (12) 198 10,030Revenue from other sources 338 12 - - - 350Data & IP 190 1,915 - (5) 456 2,556Revenue from contracts with customers 190 1,915 - (5) 456 2,556Revenue from other sources - - - - - -Network applications and services 273 2,546 50 5 753 3,627Revenue from contracts with customers 273 2,261 1 5 753 3,293Revenue from other sources 285 49 - - 334Media 840 1 - 78 - 919Revenue from contracts with customers 840 1 - 78 - 919Revenue from other sources - - - - - -Global connectivity - 1,783 - (214) - 1,569Revenue from contracts with customers - 1,783 - (214) - 1,569Revenue from other sources - - - - - -Other products and services 193 (6) - 210 635 1,032Revenue from contracts with customers 18 (7) - 183 635 829Revenue from other sources 175 1 - 27 - 203Total revenue from contracts with customers 13,958 7,887 1 52 3,052 24,950Total revenue from other sources 524 298 49 27 - 898
14,482 8,185 50 79 3,052 25,848Total revenue from external customers by geographical marketAustralian customers 14,482 6,646 50 210 3,052 24,440Revenue from contracts with customers 13,958 6,348 1 183 3,052 23,542Revenue from other sources 524 298 49 27 - 898Offshore customers - 1,539 - (131) - 1,408Revenue from contracts with customers - 1,539 - (131) - 1,408Revenue from other sources - - - - - -
14,482 8,185 50 79 3,052 25,848
Other products and services relate to nbn co accessing our infrastructure and miscellaneous revenue. It also includes revenue from Telstra Health and Telstra Software business units.
All Other category by product and by geographical market includes eliminations of the inter-segment transactions described in the segment results following Table A in note 2.1.2. Amounts disclosed in geographical markets were partly offset by revenue from operating segments which do not meet the disclosure requirements of a reportable segment. Other negative product revenue amounts relate to certain corporate level adjustments.
Section 2 - Our Performance.fm Page 93 Tuesday, August 27, 2019 8:37 AM

94 | Telstra Corporation Limited and controlled entities
Notes to the financial statements (continued)Notes to the financial statements (continued)
Section 2. Our performance (continued)
94 | Telstra Corporation Limited and controlled entities
2.1 Segments and disaggregated revenue (continued)2.1.2 Segment results and disaggregated revenue (continued)
Information about our non-current assets by geographical market is presented in Table C.
Table C As at 30 June
Telstra Group 2019 2018 Restated
$m $mCarrying amount of non-current assetsLocated in Australia 28,914 29,356Located offshore 1,926 1,911
30,840 31,267
Our geographical operations are split between our Australian and offshore operations. No individual geographical area of our offshore operations forms a significant part of our operations.
The carrying amount of our segment non-current assets excludes financial assets, inventories, defined benefit assets, deferred contract costs and deferred tax assets.
2.2 Income
Table A Year ended 30 June
Telstra Group 2019 2018 Restated
$m $mRevenue from contracts with customers 24,291 24,950Revenue from other sources 968 898Total revenue (excluding finance income) 25,259 25,848Other incomeNet gain on disposal of property, plant and equipment and intangibles 686 601Net gain on disposal of business and investments 1 323Government grants 200 209nbn disconnection fees 1,611 1,779Other miscellaneous income 50 81
2,548 2,993Total income (excluding finance income) 27,807 28,841Finance income 238 218Total income 28,045 29,059
Disaggregation of revenue from contracts with customers based on the nature and the timing of transfer of goods and services and by major products and geographical market is presented in note 2.1.2 in Table A and in Table B, respectively.
Revenue from other sources includes income from:
• operating leases of mobile handsets offered to our retail customers. For further information about these lease arrangements, refer to note 7.4.2.
• embedded sales type finance leases where Telstra is a dealer - lessor of customer premise equipment
• customer contributions to extend, relocate or amend our network assets, where the counterparty does not purchase any ongoing services under the same (or linked) contract(s).
Government grants include income under the Telstra Universal Service Obligation Performance Agreement (TUSOPA), Mobile Blackspot Government Program and other individually immaterial contracts accounted for as government grants. There are no unfulfilled conditions or other contingencies attached to these grants.
Section 2 - Our Performance.fm Page 94 Tuesday, August 27, 2019 8:37 AM
Notes to the financial statements (continued) Telstra Financial Report 2019
Section 2. Our performance (continued)
Telstra Corporation Limited and controlled entities | 95
2.2 Income (continued)2.2.1 Our contracts with customers
We generate revenue from customer contracts, which vary in their form (standard or bespoke), legal term (casual, short-term and long-term) and customer segment (consumer, small-medium business, government and large enterprise), with the main contracts being:
• homogeneous retail consumer contracts (mass market prepaid and postpaid mobile, fixed and media plans)
• retail small to medium business contracts (mass market and off-the-shelf technology solutions)
• retail enterprise and government contracts (carriage, standardised and bespoke technology solutions and their management)
• network capacity contracts (mainly Indefeasible Right of Use)• wholesale contracts for telecommunication services • nbn Definitive Agreements (nbn DAs) and related arrangements • network design, build and maintenance contracts (mainly with nbn
co).
The nature and type of contracts with customers are further described below.
We sell a wide range of goods and services, which are provided either directly by us or by third parties. Generally, we act as principal in our contracts with customers, i.e. we control any promised goods and services before they are transferred to the customer and we have primary obligation for their delivery.
(a) Telstra Consumer and Small Business (TC&SB) contracts
TC&SB is a provider of telecommunication products, services and solutions across mobiles, fixed and mobile broadband, media and digital content to consumer and small business customers in Australia, i.e. our mass market customers. We offer prepaid and postpaid services. These contracts are homogeneous in nature and sold directly by us or via our dealer channel.
Our mass market contracts often offer a bundle of goods and services, including products such as hardware, voice, text and data services, media content and others.
Our postpaid plans are either fixed term contracts, where early termination charges apply if the customer cancels the contract; or casual month-to-month contracts, where the customer may cancel the contract at any time without any significant termination penalty. Fixed term contracts are typically short term and rarely exceed two to five years, with the majority of mobile and fixed contracts being 24 months and some small business contracts with a longer term.
In general, we recognise revenue from sale of goods on their delivery and from sale of services based on passage of time (for contracts with fixed monthly fees) or when the services have been consumed (for usage or excess based contracts).
Our long-term mobile contracts often offer a bundle of hardware and services, where the customer pays a monthly fee and receives a discount. These arrangements include two separate legal contracts with a customer which are combined for accounting purposes.
For mobile bundles sold directly by us, the discount is allocated between handset and services based on their relative standalone selling prices. However, if the bundle is sold via our dealer channel, the whole discount is allocated only to services because Telstra is not acting as a principal for delivery of the handset.
Under some of our long-term mobile and fixed contracts with hardware we offer customers deferred payment terms for handsets or other devices.
Assessment of a
significant financing
component in mass market
contracts
We have applied management judgement to assess if a financing component is significant in the context of a contract as a whole and determine appropriate discount rates, where relevant.
In our long-term mobile mass market contracts with handsets, we separately account for a significant financing component, measured at contract inception using a discount rate reflecting credit characteristics of the customer.
We do not separately account for the financing component of our long-term fixed contracts with modems because it is not significant in the contract as a whole.
Some of our mass market contracts also include material rights and the transaction price allocated to them at contract inception is recognised as revenue either when the customer exercises the option and benefits from the free or discounted products or when the rights are forfeited.
We also offer mobile plans where the customer can lease a handset and purchase a bundle of services. Generally, we allocate the transaction price, and any relevant discounts, to all the products in the bundle based on a mixture of observable and estimated standalone selling prices of these products. However, any lease components are separated under the lease accounting standard based on the fair values of lease and aggregate non-lease components.
Determina-tion of
standalone selling prices
We have applied management judgement to estimate standalone selling prices in order to allocate the transaction price to multiple performance obligations under the same customer contract.
In the absence of observable prices, we use various estimation methods, including mostly an adjusted market assessment and cost plus margin approach to arrive at a standalone selling price.
Under our fixed contracts, we usually charge a connection fee for new connections to our network. Connection is a fulfilment activity, therefore this fee is added to the transaction price and allocated to distinct goods and services promised under the contract.
Generally, mass market contracts are not modified due to their homogeneous nature. Customers often have rights included in the original contract to move up and/or down within the plan family. However, these rights are not often used.
Section 2 - Our Performance.fm Page 95 Tuesday, August 27, 2019 8:37 AM

Telstra Corporation Limited and controlled entities | 95
Notes to the financial statements (continued) Telstra Financial Report 2019Telstra Financial Report 2019Notes to the financial statements (continued) Telstra Financial Report 2019
Section 2. Our performance (continued)
Telstra Corporation Limited and controlled entities | 95
2.2 Income (continued)2.2.1 Our contracts with customers
We generate revenue from customer contracts, which vary in their form (standard or bespoke), legal term (casual, short-term and long-term) and customer segment (consumer, small-medium business, government and large enterprise), with the main contracts being:
• homogeneous retail consumer contracts (mass market prepaid and postpaid mobile, fixed and media plans)
• retail small to medium business contracts (mass market and off-the-shelf technology solutions)
• retail enterprise and government contracts (carriage, standardised and bespoke technology solutions and their management)
• network capacity contracts (mainly Indefeasible Right of Use)• wholesale contracts for telecommunication services • nbn Definitive Agreements (nbn DAs) and related arrangements • network design, build and maintenance contracts (mainly with nbn
co).
The nature and type of contracts with customers are further described below.
We sell a wide range of goods and services, which are provided either directly by us or by third parties. Generally, we act as principal in our contracts with customers, i.e. we control any promised goods and services before they are transferred to the customer and we have primary obligation for their delivery.
(a) Telstra Consumer and Small Business (TC&SB) contracts
TC&SB is a provider of telecommunication products, services and solutions across mobiles, fixed and mobile broadband, media and digital content to consumer and small business customers in Australia, i.e. our mass market customers. We offer prepaid and postpaid services. These contracts are homogeneous in nature and sold directly by us or via our dealer channel.
Our mass market contracts often offer a bundle of goods and services, including products such as hardware, voice, text and data services, media content and others.
Our postpaid plans are either fixed term contracts, where early termination charges apply if the customer cancels the contract; or casual month-to-month contracts, where the customer may cancel the contract at any time without any significant termination penalty. Fixed term contracts are typically short term and rarely exceed two to five years, with the majority of mobile and fixed contracts being 24 months and some small business contracts with a longer term.
In general, we recognise revenue from sale of goods on their delivery and from sale of services based on passage of time (for contracts with fixed monthly fees) or when the services have been consumed (for usage or excess based contracts).
Our long-term mobile contracts often offer a bundle of hardware and services, where the customer pays a monthly fee and receives a discount. These arrangements include two separate legal contracts with a customer which are combined for accounting purposes.
For mobile bundles sold directly by us, the discount is allocated between handset and services based on their relative standalone selling prices. However, if the bundle is sold via our dealer channel, the whole discount is allocated only to services because Telstra is not acting as a principal for delivery of the handset.
Under some of our long-term mobile and fixed contracts with hardware we offer customers deferred payment terms for handsets or other devices.
Assessment of a
significant financing
component in mass market
contracts
We have applied management judgement to assess if a financing component is significant in the context of a contract as a whole and determine appropriate discount rates, where relevant.
In our long-term mobile mass market contracts with handsets, we separately account for a significant financing component, measured at contract inception using a discount rate reflecting credit characteristics of the customer.
We do not separately account for the financing component of our long-term fixed contracts with modems because it is not significant in the contract as a whole.
Some of our mass market contracts also include material rights and the transaction price allocated to them at contract inception is recognised as revenue either when the customer exercises the option and benefits from the free or discounted products or when the rights are forfeited.
We also offer mobile plans where the customer can lease a handset and purchase a bundle of services. Generally, we allocate the transaction price, and any relevant discounts, to all the products in the bundle based on a mixture of observable and estimated standalone selling prices of these products. However, any lease components are separated under the lease accounting standard based on the fair values of lease and aggregate non-lease components.
Determina-tion of
standalone selling prices
We have applied management judgement to estimate standalone selling prices in order to allocate the transaction price to multiple performance obligations under the same customer contract.
In the absence of observable prices, we use various estimation methods, including mostly an adjusted market assessment and cost plus margin approach to arrive at a standalone selling price.
Under our fixed contracts, we usually charge a connection fee for new connections to our network. Connection is a fulfilment activity, therefore this fee is added to the transaction price and allocated to distinct goods and services promised under the contract.
Generally, mass market contracts are not modified due to their homogeneous nature. Customers often have rights included in the original contract to move up and/or down within the plan family. However, these rights are not often used.
Section 2 - Our Performance.fm Page 95 Tuesday, August 27, 2019 8:37 AM

96 | Telstra Corporation Limited and controlled entities
Notes to the financial statements (continued)Notes to the financial statements (continued)
Section 2. Our performance (continued)
96 | Telstra Corporation Limited and controlled entities
2.2 Income (continued)2.2.1 Our contracts with customers (continued)
(b) Telstra Enterprise (TE) contracts
TE transacts with medium to large enterprise and government customers for the provision of telecommunication services, advanced technology solutions, network capacity and management, unified communications, cloud and integrated and monitoring services in Australia and globally. Large and complex TE contracts are usually bespoke in nature as they deliver tailored solutions and services. Outside of the large customers, the contracts are largely standard.
TE contracts are generally large in annual turnover and range from one year in contract length to more than 15 years for large infrastructure projects, with the average term being three years. International network capacity agreements, referred to as Indefeasible Right of Use (IRU) agreements, have an average contract term between 10 and 33 years.
Our TE legal contracts often are in a form of multi-year framework agreements under which customers can order our goods and services, including some of the mass market plans. Framework agreements often include performance conditions and grant different types of discounts or incentive funds. Legal framework agreements are rarely considered as contracts for accounting purposes. Instead, revenue recognition rules are applied to goods and services ordered under each valid purchase order or a statement of work raised under the terms of the framework agreement. This may result in an accounting contract term not matching the legal term of a framework agreement and in turn affect the amount and timing of revenue recognised under each accounting contract.
In some of our TE contracts, we also act as a dealer and a lessor for computer mainframes, processing equipment and other related equipment used by our customers as part of the solutions management and outsourcing services. Leases embedded in our contracts are separately accounted for, usually as sales type finance leases with finance lease receivables recognised in the statement of financial position.
Our bespoke TE contracts are varied or re-negotiated from time to time. Subject to the nature of these changes, accounting rules for contract modification apply, depending largely on the determination of distinct goods and services being delivered before and after the contract modifications and the price changes arising from the modifications.
Some of the TE contracts include two phases: a build phase followed by the management of the technology solutions. Due to the complex nature of those arrangements, we analyse the facts and circumstances of each contract in order to determine distinct performance obligations. If the build phase (or its components) qualifies as distinct, we recognise the build phase revenue over the term of the build or at its completion depending on when the customer obtains control over the technology solution. For each contract modification, we assess the scope of the modification or its impact on the contract price in order to determine whether the amendment must be treated as a distinct contract, as if the existing contract were terminated and a new contract signed, or whether the amendment must be considered as a change to the existing contract.
Under some of our enterprise arrangements, we receive customer contributions to extend or amend our network assets to ultimately enable delivery of telecommunication services. Where the counterparty makes a contribution for network construction activities and purchases ongoing services under the same (or linked) contract(s), the upfront contribution is added to the total transaction price of the customer contract and is allocated to the distinct goods and services to be delivered under that contract.
We recognise revenue from management services or fixed fee telecommunication services based on passage of time and from usage based carriage contracts when the services have been consumed.
Some of our framework agreements offer enterprise loyalty programs and technology funds under which customer can obtain additional free products. These are accounted for as material rights and the transaction price allocated to them at contract inception is recognised as revenue either when the customer exercises the option and benefits from the free products or when the rights are forfeited.
Our TE accounting contracts include multiple goods and services. Generally, we allocate the transaction price, and any relevant discounts, to all the products in the accounting contract based on the negotiated prices, which are largely aligned to the estimated standalone selling prices of distinct goods and services promised under the contracts. However, some discounts granted under the framework agreements may be allocated to selected performance obligations if specific performance conditions apply. Transaction price allocated to any lease components is based on the fair values as required by the lease accounting standard.
Our large commercial arrangements often incorporate service level agreements, e.g. agreed delivery time or service reinstatement time. If we fail to comply with one of these commitments, we pay compensation to the customer. The expected amount of such penalties reduce the revenue for the period in which the service level commitment has not been met, and it is recognised as soon as it is probable that the commitment has not been or will not be met. Some of the arrangements also include benchmarking or CPI clauses, which are accounted for as variable consideration, usually from the time the price changes take effect.
Our international TE arrangements include long-term network capacity arrangements (some being take-or-pay arrangements) as well as provision of satellite and colocation services (i.e. access to the rack spaces, utilities and managed services such as security and backups), for which revenue is usually recognised based on passage of time.
IRU arrangements usually include upfront payments for services which will be delivered over multiple years.
Section 2 - Our Performance.fm Page 96 Tuesday, August 27, 2019 8:37 AM
Notes to the financial statements (continued) Telstra Financial Report 2019
Section 2. Our performance (continued)
Telstra Corporation Limited and controlled entities | 97
2.2 Income (continued)2.2.1 Our contracts with customers (continued)
(b) Telstra Enterprise (TE) contracts (continued)
Assessment of a
significant financing
component in
Indefeasible Right of Use
(IRU)
We have applied management judgement to assess if a financing component is significant in the context of a contract as a whole and determine appropriate discount rates, where relevant.
We account for a significant financing component in our domestic and international bespoke network capacity agreements, i.e. IRUs, where customers make an upfront payment in advance of receiving services. These contracts have an average legal contract term between 10 and 33 years.
In IRUs where Telstra receives financing from the customer, revenue recognised over the contract term exceeds the cash payments received in advance of performance by the amount of interest expense recognised in net finance costs.
(c) Telstra Wholesale contracts
Telstra Wholesale (part of our Telstra InfraCo segment) is a provider of a wide range of telecommunication products and services to other telecommunication operators, carriage services providers and internet service providers, who in turn sell their services to a retail end user.
Revenue arises from fixed network services contracts, including usage based contracts and fixed bundles, with a term of up to two years. Other contracts provide data and IP and mobile products such as interconnect, domestic roaming, bulk SMS and postpaid mobile services.
Insignificant annual revenue arises under long-term network capacity contracts (i.e. IRUs), however some of those contracts have a fixed term of up to 15 years.
Telstra Wholesale legal contracts are generally signed as multi-year framework agreements, which set out pricing for the agreed services, the legal contract term and any renewal options, incentives, discounts and one-off fees. However, usually until our wholesale customer's customer, i.e. the end user, orders services, the obligation to deliver goods or services does not exist. Therefore, the accounting contract generally arises at the level of a service order of an end user.
Some of our framework agreements specify a minimum spend commitment (i.e. a take-or-pay arrangement), in which case the accounting contract may exist also at the framework agreement level.
Under some of our wholesale arrangements, we receive customer contributions to extend or amend our network assets to ultimately enable delivery of telecommunication services. Where the counterparty makes a contribution for network construction activities and purchases ongoing services under the same (or linked) contract(s), the upfront contribution is added to the total transaction price of the customer contract and allocated to the distinct goods and services to be delivered under that contract.
Telstra Wholesale service revenue is generally recognised over time during the period over which the services are rendered, mostly based on passage of time as the service provider (i.e. our customer) receives unlimited calls and data.
Some of the Telstra Wholesale contracts include multiple goods and services. We allocate the transaction price, and any relevant discounts, generally to all the products in the accounting contract based on the negotiated prices, which are largely aligned to the estimated standalone selling prices of distinct goods and services promised under the contracts. However, some discounts granted under the framework agreements may be allocated only to selected performance obligations based on the specific performance conditions in the framework agreement.
(d) Agreements with nbn co
We have two types of agreements with nbn co:
• nbn DAs and related arrangements• commercial contracts for network design, build and maintenance
services.
Revenue from contracts with nbn co is mainly reported within the Telstra InfraCo segment. Amounts recognised as other income are recorded in our corporate areas.
Our nbn DAs and related arrangements include a number of separate legal contracts with both nbn co and the Commonwealth Government (being related parties hence treated as the same customer for accounting purposes) which have been negotiated together with a common commercial objective. These separate legal contracts have been combined under the revenue recognition rules.
The combined accounting contract, comprising of nbn DAs and related arrangements, has a minimum fixed term of 30 years for accounting purposes.
The combined nbn DAs and related arrangements include a number of separately priced elements, some of which are accounted for under the revenue recognition standard whereas others under other accounting standards, e.g. government grants. The Subscriber Agreement continues to be separately accounted for as other income given the nbn disconnection fees do not relate to our ordinary activities and there is no price dependency on other nbn DAs.
Services provided under the Infrastructure Services Agreement (ISA) are accounted for under the revenue recognition requirements. We recognise revenue from providing long-term access to ducts and pits and other infrastructure, including dark fibre and exchange rack space over time, initially based on the cumulative nbnTM network rollout percentage and after rollout completion based on passage of time.
The build of nbn related infrastructure is not considered a separate performance obligation, therefore payments received for it under a separate legal agreement have been combined and accounted for together with the ISA long-term access services. These payments have been received upfront and recorded as a contract liability, i.e. an advance payment for services transferred over the ISA average contracted period of 35 years.
ISA also includes payments for sale of our infrastructure assets, with the net gain on sale of those assets recognised in other income. Net gain on sale of the infrastructure assets is recognised at point in time when the control passes to nbn co based on the incremental nbnTM network rollout percentage.
We deliver a number of different services under these arrangements and the transaction price includes a number of fixed and variable components as described on the following page in the ‘Impact of nbn Infrastructure Services Agreement (ISA) on revenue from customer contracts and other income’.
Section 2 - Our Performance.fm Page 97 Tuesday, August 27, 2019 8:37 AM

Telstra Corporation Limited and controlled entities | 97
Notes to the financial statements (continued) Telstra Financial Report 2019Telstra Financial Report 2019Notes to the financial statements (continued) Telstra Financial Report 2019
Section 2. Our performance (continued)
Telstra Corporation Limited and controlled entities | 97
2.2 Income (continued)2.2.1 Our contracts with customers (continued)
(b) Telstra Enterprise (TE) contracts (continued)
Assessment of a
significant financing
component in
Indefeasible Right of Use
(IRU)
We have applied management judgement to assess if a financing component is significant in the context of a contract as a whole and determine appropriate discount rates, where relevant.
We account for a significant financing component in our domestic and international bespoke network capacity agreements, i.e. IRUs, where customers make an upfront payment in advance of receiving services. These contracts have an average legal contract term between 10 and 33 years.
In IRUs where Telstra receives financing from the customer, revenue recognised over the contract term exceeds the cash payments received in advance of performance by the amount of interest expense recognised in net finance costs.
(c) Telstra Wholesale contracts
Telstra Wholesale (part of our Telstra InfraCo segment) is a provider of a wide range of telecommunication products and services to other telecommunication operators, carriage services providers and internet service providers, who in turn sell their services to a retail end user.
Revenue arises from fixed network services contracts, including usage based contracts and fixed bundles, with a term of up to two years. Other contracts provide data and IP and mobile products such as interconnect, domestic roaming, bulk SMS and postpaid mobile services.
Insignificant annual revenue arises under long-term network capacity contracts (i.e. IRUs), however some of those contracts have a fixed term of up to 15 years.
Telstra Wholesale legal contracts are generally signed as multi-year framework agreements, which set out pricing for the agreed services, the legal contract term and any renewal options, incentives, discounts and one-off fees. However, usually until our wholesale customer's customer, i.e. the end user, orders services, the obligation to deliver goods or services does not exist. Therefore, the accounting contract generally arises at the level of a service order of an end user.
Some of our framework agreements specify a minimum spend commitment (i.e. a take-or-pay arrangement), in which case the accounting contract may exist also at the framework agreement level.
Under some of our wholesale arrangements, we receive customer contributions to extend or amend our network assets to ultimately enable delivery of telecommunication services. Where the counterparty makes a contribution for network construction activities and purchases ongoing services under the same (or linked) contract(s), the upfront contribution is added to the total transaction price of the customer contract and allocated to the distinct goods and services to be delivered under that contract.
Telstra Wholesale service revenue is generally recognised over time during the period over which the services are rendered, mostly based on passage of time as the service provider (i.e. our customer) receives unlimited calls and data.
Some of the Telstra Wholesale contracts include multiple goods and services. We allocate the transaction price, and any relevant discounts, generally to all the products in the accounting contract based on the negotiated prices, which are largely aligned to the estimated standalone selling prices of distinct goods and services promised under the contracts. However, some discounts granted under the framework agreements may be allocated only to selected performance obligations based on the specific performance conditions in the framework agreement.
(d) Agreements with nbn co
We have two types of agreements with nbn co:
• nbn DAs and related arrangements• commercial contracts for network design, build and maintenance
services.
Revenue from contracts with nbn co is mainly reported within the Telstra InfraCo segment. Amounts recognised as other income are recorded in our corporate areas.
Our nbn DAs and related arrangements include a number of separate legal contracts with both nbn co and the Commonwealth Government (being related parties hence treated as the same customer for accounting purposes) which have been negotiated together with a common commercial objective. These separate legal contracts have been combined under the revenue recognition rules.
The combined accounting contract, comprising of nbn DAs and related arrangements, has a minimum fixed term of 30 years for accounting purposes.
The combined nbn DAs and related arrangements include a number of separately priced elements, some of which are accounted for under the revenue recognition standard whereas others under other accounting standards, e.g. government grants. The Subscriber Agreement continues to be separately accounted for as other income given the nbn disconnection fees do not relate to our ordinary activities and there is no price dependency on other nbn DAs.
Services provided under the Infrastructure Services Agreement (ISA) are accounted for under the revenue recognition requirements. We recognise revenue from providing long-term access to ducts and pits and other infrastructure, including dark fibre and exchange rack space over time, initially based on the cumulative nbnTM network rollout percentage and after rollout completion based on passage of time.
The build of nbn related infrastructure is not considered a separate performance obligation, therefore payments received for it under a separate legal agreement have been combined and accounted for together with the ISA long-term access services. These payments have been received upfront and recorded as a contract liability, i.e. an advance payment for services transferred over the ISA average contracted period of 35 years.
ISA also includes payments for sale of our infrastructure assets, with the net gain on sale of those assets recognised in other income. Net gain on sale of the infrastructure assets is recognised at point in time when the control passes to nbn co based on the incremental nbnTM network rollout percentage.
We deliver a number of different services under these arrangements and the transaction price includes a number of fixed and variable components as described on the following page in the ‘Impact of nbn Infrastructure Services Agreement (ISA) on revenue from customer contracts and other income’.
Section 2 - Our Performance.fm Page 97 Tuesday, August 27, 2019 8:37 AM

98 | Telstra Corporation Limited and controlled entities
Notes to the financial statements (continued)Notes to the financial statements (continued)
Section 2. Our performance (continued)
98 | Telstra Corporation Limited and controlled entities
2.2 Income (continued)2.2.1 Our contracts with customers (continued)
(d) Agreements with nbn co (continued)
Impact of nbn Infrastructure Services Agreement (ISA) on
revenue from customer contracts and other income
nbn co makes decisions about the access technologies (e.g. fibre to the premises 'FTTP', fibre to the basement 'FTTB', fibre to the node 'FTTN', fibre to the curb 'FTTC' or Hybrid Fibre Coaxial 'HFC') which it intends to use to serve premises in each of its rollout regions. In any given rollout region, these decisions trigger its election to acquire the relevant Telstra assets, the ownership of which we are progressively transferring to nbn co under the nbn Infrastructure Services Agreement (ISA). These assets include lead-in conduits (LICs), certain copper and HFC assets and associated passive infrastructure (being infrastructure that supports the relevant copper and HFC assets). In addition to the progressive transfer of these assets, we also provide nbn co with long-term access to certain other components of our infrastructure.
Under the ISA, we receive from nbn co the following payments:
• Infrastructure Ownership Payment (IOP) for the transfer of LICs, certain copper and HFC assets and associated passive infrastructure
• Infrastructure Access Payment (IAP) for long-term access to ducts and pits• payments for long-term access to other infrastructure, including dark fibre and
exchange rack space.
IOP are received over the duration of the nbnTM network rollout, CPI adjusted and linked to the progress of the nbnTM network rollout.
IAP are also indexed to CPI, will grow in line with the nbnTM network rollout until its completion and subsequently continue for the remaining average contracted period of 28 years.
IOP and IAP are classified in the income statement as other income and revenue, respectively, and are recognised on a percentage rollout basis of the nbnTM network footprint.
For any given period, the IOP and IAP amounts ultimately received from nbn co may vary from the amounts recognised in the income statement depending on progress of the nbnTM network rollout and the final number of our existing fixed line premises as defined and determined under the ISA. A change in the nbnTM network rollout progress and/or the final number of these premises could result in a material change to the amount of IOP and IAP recognised in the income statement.
We have applied management judgement in determining the amounts of IOP and IAP recognised for the financial year 2019. Should evidence exist in the future reporting periods that changes these amounts, other income and revenue will be adjusted in the future reporting periods.
Given significant variability in the overall ISA consideration, the legal contract includes specific clauses as to if, when and how an interest receivable or an interest payable should be calculated.
Assessment of a
significant financing
component in nbn DAs
We have applied management judgement to assess if a financing component is significant in the context of a contract as a whole and determine appropriate discount rates, where relevant.
We do not separately account for the financing component in our nbn DAs and related arrangements because it is not significant to the accounting contract.
Section 2 - Our Performance.fm Page 98 Tuesday, August 27, 2019 8:37 AM
Notes to the financial statements (continued) Telstra Financial Report 2019
Section 2. Our performance (continued)
Telstra Corporation Limited and controlled entities | 99
2.2 Income (continued)2.2.1 Our contracts with customers (continued)
(d) Agreements with nbn co (continued)
The other arrangements with nbn co are commercial contracts for network design, build and maintenance services. These arrangements provide a framework agreement with scheduled rates under which nbn co can order required services. Generally, the accounting contracts under these arrangements have no fixed term or minimum order quantities that extend beyond 12 months.
The majority of revenue is recognised over time on a percentage of completion basis. This is because the work being delivered can take several months to complete with control being passed progressively over that period. The percentage of completion is calculated as costs incurred as a percentage of total estimated costs.
Percentage of
completion for
commercial contracts
with nbn co
We use percentage of completion to measure progress and recognised revenue from our commercial contracts with nbn co.
In calculating the percentage of completion, we have applied management judgement to determine the total estimated costs to complete. These are based on historical costs to deliver and adjusted for any upcoming changes which might impact the previous costs to deliver.
Recognition of trade receivables, contract assets and contract liabilities from our contracts with customers and movements in net contract assets and contract liabilities are detailed in notes 3.7.1 and 3.7.2, respectively.
2.2.2 Remaining performance obligations
Nature, types and terms of our contracts with customers are described in note 2.2.1.
Sometimes goods and services purchased under the same customer contract will be transferred to the customer over multiple reporting periods.
For contracts where a customer has made a firm commitment, for example entered into a fixed term contract or a take-or-pay arrangement, and where some performance obligations remain unfulfilled as at 30 June 2019, we disclose the aggregate transaction price allocated to goods and services which will be transferred after 30 June 2019 but arise from contracts existing as at that date. These performance obligations represent goods and services that we are obliged to provide to customers during the remaining fixed term of our contracts, including contracts with an initial term of one year or less.
Certain contracts offer customers the ability to purchase additional goods or services at a discount. Any additional consideration for those products is not included in the transaction price as it will be recognised when the customer exercises the option to purchase those products under a new, and not an existing, accounting contract.
In determining the transaction price allocated to the remaining performance obligations we did not include any future amounts arising from usage based contracts, excess charges from consumption over and above the services included in the current contract, one-off transactions or casual contracts because no obligation arises under those contracts until the customer consumes our services.
Future revenue arising from nbn DAs is estimated based on a number of assumptions and the estimated amount of variable consideration has been constrained to the amount that is highly probable of not resulting in a significant cumulative revenue reversal. The estimated variable consideration and the constraint are reassessed each reporting period. However, given its size, long-term nature and a number of variable components impacting the contract consideration (refer to note 2.2.1 for details) the actual amounts recognised in the future periods may still materially differ from our estimates.
In addition, any amounts arising from our existing customer contracts which will be recognised as ‘revenue from other sources’ or ‘other income’, for example operating lease income or net gain on sale of assets, are excluded from the remaining performance obligations.
We have elected to apply the first time adoption practical expedient and not to disclose the remaining performance obligations for the financial year 2018.
Table B presents aggregate transaction price allocated to the remaining performance obligations promised under the contracts where a customer has made a firm commitment before the balance date but goods and services will be transferred after 30 June 2019. Presented time bands best depict future revenue recognition profiles.
Table B As at
Telstra Group 30 June 2019
$mLess than 1 year 6,935Between 1 to 2 years 3,174Between 2 to 5 years 4,068Between 5 to 10 years 5,793Between 10 to 20 years 13,412More than 20 years 13,016
46,398
2.2.3 Recognition and measurement
In the financial year 2019, we have adopted new accounting policies for revenue recognition.
(a) Revenue from contracts with customers
Revenue from contracts with customers arises from arrangements where the counterparty is a customer that transacts with us to obtain goods or services which are an output of our ordinary activities in exchange for consideration.
We apply the five-step approach to our customer arrangements to identify the contract for accounting purposes, i.e. the accounting contract and to determine the amount and timing of revenue to be recognised. The five steps are applied at inception of the accounting contract in order to provide an overview of the contract as a whole. This in turn allows us to determine the accounting for relevant costs to obtain and/or fulfil a contract. The five steps are described below. For the accounting policy for deferred costs to obtain and/or fulfil a contract refer to note 3.8.1.
Section 2 - Our Performance.fm Page 99 Tuesday, August 27, 2019 8:37 AM

Telstra Corporation Limited and controlled entities | 99
Notes to the financial statements (continued) Telstra Financial Report 2019Telstra Financial Report 2019Notes to the financial statements (continued) Telstra Financial Report 2019
Section 2. Our performance (continued)
Telstra Corporation Limited and controlled entities | 99
2.2 Income (continued)2.2.1 Our contracts with customers (continued)
(d) Agreements with nbn co (continued)
The other arrangements with nbn co are commercial contracts for network design, build and maintenance services. These arrangements provide a framework agreement with scheduled rates under which nbn co can order required services. Generally, the accounting contracts under these arrangements have no fixed term or minimum order quantities that extend beyond 12 months.
The majority of revenue is recognised over time on a percentage of completion basis. This is because the work being delivered can take several months to complete with control being passed progressively over that period. The percentage of completion is calculated as costs incurred as a percentage of total estimated costs.
Percentage of
completion for
commercial contracts
with nbn co
We use percentage of completion to measure progress and recognised revenue from our commercial contracts with nbn co.
In calculating the percentage of completion, we have applied management judgement to determine the total estimated costs to complete. These are based on historical costs to deliver and adjusted for any upcoming changes which might impact the previous costs to deliver.
Recognition of trade receivables, contract assets and contract liabilities from our contracts with customers and movements in net contract assets and contract liabilities are detailed in notes 3.7.1 and 3.7.2, respectively.
2.2.2 Remaining performance obligations
Nature, types and terms of our contracts with customers are described in note 2.2.1.
Sometimes goods and services purchased under the same customer contract will be transferred to the customer over multiple reporting periods.
For contracts where a customer has made a firm commitment, for example entered into a fixed term contract or a take-or-pay arrangement, and where some performance obligations remain unfulfilled as at 30 June 2019, we disclose the aggregate transaction price allocated to goods and services which will be transferred after 30 June 2019 but arise from contracts existing as at that date. These performance obligations represent goods and services that we are obliged to provide to customers during the remaining fixed term of our contracts, including contracts with an initial term of one year or less.
Certain contracts offer customers the ability to purchase additional goods or services at a discount. Any additional consideration for those products is not included in the transaction price as it will be recognised when the customer exercises the option to purchase those products under a new, and not an existing, accounting contract.
In determining the transaction price allocated to the remaining performance obligations we did not include any future amounts arising from usage based contracts, excess charges from consumption over and above the services included in the current contract, one-off transactions or casual contracts because no obligation arises under those contracts until the customer consumes our services.
Future revenue arising from nbn DAs is estimated based on a number of assumptions and the estimated amount of variable consideration has been constrained to the amount that is highly probable of not resulting in a significant cumulative revenue reversal. The estimated variable consideration and the constraint are reassessed each reporting period. However, given its size, long-term nature and a number of variable components impacting the contract consideration (refer to note 2.2.1 for details) the actual amounts recognised in the future periods may still materially differ from our estimates.
In addition, any amounts arising from our existing customer contracts which will be recognised as ‘revenue from other sources’ or ‘other income’, for example operating lease income or net gain on sale of assets, are excluded from the remaining performance obligations.
We have elected to apply the first time adoption practical expedient and not to disclose the remaining performance obligations for the financial year 2018.
Table B presents aggregate transaction price allocated to the remaining performance obligations promised under the contracts where a customer has made a firm commitment before the balance date but goods and services will be transferred after 30 June 2019. Presented time bands best depict future revenue recognition profiles.
Table B As at
Telstra Group 30 June 2019
$mLess than 1 year 6,935Between 1 to 2 years 3,174Between 2 to 5 years 4,068Between 5 to 10 years 5,793Between 10 to 20 years 13,412More than 20 years 13,016
46,398
2.2.3 Recognition and measurement
In the financial year 2019, we have adopted new accounting policies for revenue recognition.
(a) Revenue from contracts with customers
Revenue from contracts with customers arises from arrangements where the counterparty is a customer that transacts with us to obtain goods or services which are an output of our ordinary activities in exchange for consideration.
We apply the five-step approach to our customer arrangements to identify the contract for accounting purposes, i.e. the accounting contract and to determine the amount and timing of revenue to be recognised. The five steps are applied at inception of the accounting contract in order to provide an overview of the contract as a whole. This in turn allows us to determine the accounting for relevant costs to obtain and/or fulfil a contract. The five steps are described below. For the accounting policy for deferred costs to obtain and/or fulfil a contract refer to note 3.8.1.
Section 2 - Our Performance.fm Page 99 Tuesday, August 27, 2019 8:37 AM
100 | Telstra Corporation Limited and controlled entities
Notes to the financial statements (continued)Notes to the financial statements (continued)
Section 2. Our performance (continued)
100 | Telstra Corporation Limited and controlled entities
2.2 Income (continued)2.2.3 Recognition and measurement (continued)
(a) Revenue from contracts with customers (continued)
(i) Step 1: Identify the contract with customer
In order to identify an accounting contract, the contract must be legally enforceable. Any components of the contract which are accounted for under other accounting standards are then identified and separated out as they cannot be considered for revenue recognition.
The accounting contract may not align with the legal contract and in some cases multiple legal contracts may need to be combined to form one accounting contract. In other instances, a legal contract may only provide a framework agreement (i.e. an offer) and an accounting contract only exists when the customer commits to purchase goods or services. This is because an accounting contract must have commercial substance. Each party’s rights regarding the goods or services and specified payment terms must also exist. In addition, it has to be probable that the customer is able and intends to pay Telstra. The contract term impacts the identification of performance obligations and the transaction price.
(ii) Step 2: Identify the performance obligations in the contract
After the accounting contract and its term have been established, we determine the performance obligations within the contract. Performance obligations include promised distinct goods or services for which control is transferred from Telstra to the customer and material rights but exclude fulfilment activities (other activities that are necessary under the contract but that do not result in a transfer of goods or services).
Performance obligations can be explicitly stated in a contract or can be implied when the customer has a valid expectation that an additional good or service will be delivered.
A material right is accounted for as a separate performance obligation if we give the customer a beneficial option to purchase additional distinct goods or services, i.e. the customer receives an incremental discount of at least 5% of the transaction price compared to other customers.
We account for a series of goods or services which are substantially the same and have the same pattern of transfer to the customer as a single performance obligation.
A good or service is distinct if it is capable of being distinct, i.e. a customer can benefit from it on its own together with other readily available resources, and it is distinct within the context of the contract, i.e. no transformative relationship exists with other promised goods or services.
(iii) Step 3: Determine the transaction price
After all performance obligations have been identified, we determine the transaction price, which represents the total amount of revenue to be recognised under the accounting contract. In doing so, we assume that the contract will not be cancelled, renewed or modified.
The transaction price may include fixed and/or variable, cash and/or non-cash consideration. It may also need to be adjusted for:
• a significant financing component (if the period between when we would transfer the good or service to the customer and when the customer would pay for the good or service is expected to be greater than one year)
• consideration accounted for under other accounting standards (such as lease repayments)
• amounts collected on behalf of third parties (such government taxes).
Fixed cash consideration is not dependent on future events and is based on the minimum amount of cash we expect to receive in exchange for delivering the minimum level of goods or services the customer has legally committed to purchase at contract inception over the accounting contract term.
Variable consideration receivable or payable is an amount that is variable or contingent upon an uncertain future event before the exact amount is known. Examples of variable consideration include discounts, rebates, refunds, credits and price concessions. To estimate an amount of variable consideration, we use either the most likely amount or the expected value method depending on which better predicts the variable amount. After estimating it, we constrain the variable consideration to the amount that is highly probable of not resulting in a significant cumulative revenue reversal.
(iv) Step 4: Allocate the transaction price to the performance obligations in the contract
After the transaction price has been determined, we allocate it to the performance obligations generally based on their relative standalone selling price (SSP). SSP is the price for which we would sell the goods or services underlying the performance obligations on a standalone basis, i.e. not in a bundle. We determine SSPs at contract inception using an observable price for a standalone sale of substantially the same good or service under similar circumstances and to a similar class of customers. If no observable price is available, we estimate the SSP using an appropriate method, e.g. adjusted market assessment approach, expected cost plus a margin approach or a residual approach.
Using relative SSPs for allocating the transaction price to performance obligations generally reflects the proportional amount of consideration we expect to receive in exchange for delivering the underlying distinct goods and/or services under the contract. However, in some instances, in order to correctly reflect the amount of revenue to be recognised, we apply allocation exceptions for variable consideration, discounts or a significant financing component in order to correctly allocate these elements to some but not all performance obligations.
(v) Step 5: Recognise revenue when or as a performance obligation is satisfied
After the transaction price has been allocated to the performance obligations, we determine when revenue should be recognised, i.e. when a performance obligation is satisfied by us which is when control of the distinct good or service is transferred to the customer.
Customers obtain control over a good or service when they benefit from the good or service and decide how to use the good or service.
If any of the following three criteria are met, we recognise revenue over time:
• the customer simultaneously receives and consumes all benefits as we perform (this applies to routine or recurring services)
• our performance creates or enhances an asset controlled by the customer (this is relevant when the asset is built on a customer’s site)
• the asset has no alternative use to us and we have an enforceable right to payment (for example, an asset is being built to order).
If none of the criteria are met, we recognise revenue at a point in time.
Section 2 - Our Performance.fm Page 100 Tuesday, August 27, 2019 8:37 AM
Notes to the financial statements (continued) Telstra Financial Report 2019
Section 2. Our performance (continued)
Telstra Corporation Limited and controlled entities | 101
2.2 Income (continued)2.2.3 Recognition and measurement (continued)
(a) Revenue from contracts with customers (continued)
(v) Step 5: Recognise revenue when or as a performance obligation is satisfied (continued)
We use either input or output methods to measure progress when satisfying the performance obligations over time. Output methods use direct measurements of the value to the customer, i.e. they are based on the goods or services that control has transferred to date relative to the remaining goods or services promised under the contract (for example, milestones reached). It is applied when the value of the goods or services transferred to the customer can be measured directly. Input methods use our efforts or inputs in the satisfaction of the performance obligation relative to the total expected efforts or inputs in satisfying that performance obligation (for example, our labour hours used). It is applied when the value of the underlying goods or services transferred to the customer cannot be measured.
When a performance obligation is satisfied at a point in time, the allocated transaction price is recognised when control is transferred to the customer. In determining whether the control over the good has transferred to the customer, we consider the customer’s obligation to pay, transfer of legal title to the good, physical possession of the good, the customer’s acceptance and risks and rewards of ownership.
(vi) Accounting after contract inception
The five-step approach provides an accounting contract overview at its inception. However, some judgements and estimates may change over the accounting contract term. Where relevant, we account for the following events after contract inception:
• exercised or forfeited customer options (both material rights and marketing offers, i.e. non beneficial options)
• changes in estimates of variable consideration • changes in how the customer exercises its contractual rights• special arrangements, e.g. bill and hold or consignment
arrangements.
(vii) Contract modifications
From time to time, our contracts are renegotiated after contract inception and their scope and/or price change. We account for contract modifications either as:
• a separate contract which will not require any reallocation to performance obligations in the original contract
• a retrospective cumulative change to revenue (creating either a catch up or deferral of past revenues for all performance obligations in the original contract)
• a prospective change to revenue with a reallocation of revenues amongst remaining performance obligations in the original contract, or
• both a cumulative change and prospective change to revenue in the original contract.
(b) Revenue from other sources
Revenue from other sources includes income arising from arrangements other than those accounted for using the five-step approach. This is because in some cases income generated in the course of our ordinary activities does not relate to our performance under contracts with customers or it is explicitly accounted for under other accounting standards.
Contract terminations generally trigger different rights and obligations under the legal contract. These rights and obligations are not related to our performance and were not considered at inception of the accounting contract when applying the five-step approach. Therefore, where relevant, any income over and above the recovery of the consideration due for the delivered goods or services is not classified as revenue from customer contracts. Instead, we classify it as revenue from other sources.
We earn revenue from operating subleases of mobile handsets offered to our retail customers (Telstra as a lessor), which we lease from a third party in a back-to-back arrangement (Telstra as a lessee). We also earn revenue from property operating leases. Operating lease income is recognised on a straight- line basis over the lease term.
We earn revenue from embedded sales type finance leases where Telstra is a dealer-lessor of customer premise equipment. We recognise revenue from sale of these goods at point in time when the control transfers to the customer.
We receive contributions to extend, relocate or amend our network assets. Where the counterparty makes a contribution for network construction activities that is not considered a government grant, and does not purchase any ongoing services under the same (or linked) contract(s), we recognise revenue over the period of the network construction activities.
Other items we classify as revenue from other sources include late payment fees, which are recognised when charged and their collectability is reasonably assured.
(c) Government grants
Government grants are recognised where there is reasonable assurance that the grant will be received and Telstra will comply with all attached conditions. Government grants relating to costs are deferred and recognised in the income statement as other income over the period necessary to match them with the costs that they are intended to compensate.
Section 2 - Our Performance.fm Page 101 Tuesday, August 27, 2019 8:37 AM

Telstra Corporation Limited and controlled entities | 101
Notes to the financial statements (continued) Telstra Financial Report 2019Telstra Financial Report 2019Notes to the financial statements (continued) Telstra Financial Report 2019
Section 2. Our performance (continued)
Telstra Corporation Limited and controlled entities | 101
2.2 Income (continued)2.2.3 Recognition and measurement (continued)
(a) Revenue from contracts with customers (continued)
(v) Step 5: Recognise revenue when or as a performance obligation is satisfied (continued)
We use either input or output methods to measure progress when satisfying the performance obligations over time. Output methods use direct measurements of the value to the customer, i.e. they are based on the goods or services that control has transferred to date relative to the remaining goods or services promised under the contract (for example, milestones reached). It is applied when the value of the goods or services transferred to the customer can be measured directly. Input methods use our efforts or inputs in the satisfaction of the performance obligation relative to the total expected efforts or inputs in satisfying that performance obligation (for example, our labour hours used). It is applied when the value of the underlying goods or services transferred to the customer cannot be measured.
When a performance obligation is satisfied at a point in time, the allocated transaction price is recognised when control is transferred to the customer. In determining whether the control over the good has transferred to the customer, we consider the customer’s obligation to pay, transfer of legal title to the good, physical possession of the good, the customer’s acceptance and risks and rewards of ownership.
(vi) Accounting after contract inception
The five-step approach provides an accounting contract overview at its inception. However, some judgements and estimates may change over the accounting contract term. Where relevant, we account for the following events after contract inception:
• exercised or forfeited customer options (both material rights and marketing offers, i.e. non beneficial options)
• changes in estimates of variable consideration • changes in how the customer exercises its contractual rights• special arrangements, e.g. bill and hold or consignment
arrangements.
(vii) Contract modifications
From time to time, our contracts are renegotiated after contract inception and their scope and/or price change. We account for contract modifications either as:
• a separate contract which will not require any reallocation to performance obligations in the original contract
• a retrospective cumulative change to revenue (creating either a catch up or deferral of past revenues for all performance obligations in the original contract)
• a prospective change to revenue with a reallocation of revenues amongst remaining performance obligations in the original contract, or
• both a cumulative change and prospective change to revenue in the original contract.
(b) Revenue from other sources
Revenue from other sources includes income arising from arrangements other than those accounted for using the five-step approach. This is because in some cases income generated in the course of our ordinary activities does not relate to our performance under contracts with customers or it is explicitly accounted for under other accounting standards.
Contract terminations generally trigger different rights and obligations under the legal contract. These rights and obligations are not related to our performance and were not considered at inception of the accounting contract when applying the five-step approach. Therefore, where relevant, any income over and above the recovery of the consideration due for the delivered goods or services is not classified as revenue from customer contracts. Instead, we classify it as revenue from other sources.
We earn revenue from operating subleases of mobile handsets offered to our retail customers (Telstra as a lessor), which we lease from a third party in a back-to-back arrangement (Telstra as a lessee). We also earn revenue from property operating leases. Operating lease income is recognised on a straight- line basis over the lease term.
We earn revenue from embedded sales type finance leases where Telstra is a dealer-lessor of customer premise equipment. We recognise revenue from sale of these goods at point in time when the control transfers to the customer.
We receive contributions to extend, relocate or amend our network assets. Where the counterparty makes a contribution for network construction activities that is not considered a government grant, and does not purchase any ongoing services under the same (or linked) contract(s), we recognise revenue over the period of the network construction activities.
Other items we classify as revenue from other sources include late payment fees, which are recognised when charged and their collectability is reasonably assured.
(c) Government grants
Government grants are recognised where there is reasonable assurance that the grant will be received and Telstra will comply with all attached conditions. Government grants relating to costs are deferred and recognised in the income statement as other income over the period necessary to match them with the costs that they are intended to compensate.
Section 2 - Our Performance.fm Page 101 Tuesday, August 27, 2019 8:37 AM

102 | Telstra Corporation Limited and controlled entities
Notes to the financial statements (continued)Notes to the financial statements (continued)
Section 2. Our performance (continued)
102 | Telstra Corporation Limited and controlled entities
2.3 ExpensesIn our income statement, we classify our expenses (apart from finance costs) by nature as this classification more accurately reflects the type of operations we undertake.
Telstra Group Year ended 30 June
2019 2018 Restated
$m $mIncluded in our labour expenses are the following:Employee redundancy 642 163Share-based payments 23 29Defined contribution plan expense 226 253Defined benefit plan expense 52 69
Included in our goods and services purchased are the following:Network payments 2,791 2,267Cost of goods sold 3,771 3,551
Other expensesImpairment losses (excluding net losses on financial assets) 608 451Rental expense on operating leases 1,349 1,071Service contracts and other agreements 1,590 1,677Promotion and advertising 310 344General and administration 990 1,057Other operating expenses 387 287
5,234 4,887Depreciation and amortisationDepreciation of property, plant and equipment 2,810 3,005Amortisation of intangible assets 1,472 1,465
4,282 4,470Finance costsInterest on borrowings 792 777Other 181 130
973 907Less: interest on borrowings capitalised (105) (101)
868 806
The following paragraphs detail further information about our expenses and finance costs:
• share-based payments expense relates to both cash-settled and equity-settled share plans. Refer to note 5.2 for further details.
• impairment losses include $499 million impairment of property, plant and equipment and software assets (2018: $317 million impairment of goodwill and other non-current assets), and $100 million impairment of deferred contract costs (2018: $101 million). Refer to notes 3.1, 3.2 and 3.8 for further details on the impairment of property, plant and equipment, intangible assets and deferred contract costs respectively.
• other operating expenses include a loss of $85 million from the sale of Ooyala Inc. and Ooyala AB in October 2018
• interest on borrowings has been capitalised using a capitalisation rate of 4.9 per cent (2018: 4.9 per cent)
• other finance costs include unrealised valuation impacts on our borrowings and derivatives. These include net losses which arise from changes in the fair value of derivative financial instruments to the extent that hedge accounting is not effective or the hedge accounting criteria are not met. These fair values increase or decrease because of changes in financial indices and prices over which we have no control. All unrealised amounts unwind to nil at maturity of the underlying instrument.
• further information on our operating leases is provided in note 7.4.2.
Section 2 - Our Performance.fm Page 102 Tuesday, August 27, 2019 8:37 AM
Notes to the financial statements (continued) Telstra Financial Report 2019
Section 2. Our performance (continued)
Telstra Corporation Limited and controlled entities | 103
2.4 Income taxes
This note sets out our tax accounting policies and provides an analysis of our income tax expense and deferred tax balances, including a reconciliation of tax expense to accounting profit.
Current income tax is based on the accounting profit adjusted for differences in accounting and tax treatments of income and expenses (i.e. taxable income).
Deferred income tax, which is accounted for using the balance sheet method, arises because the accounting income is not always the same as taxable income. This creates temporary differences, which usually reverse over time. Until they reverse, a deferred tax asset or liability must be recognised on the balance sheet.
This note also provides disclosures which form part of the requirements of the Australian Board of Taxation’s Voluntary Tax Transparency Code.
2.4.1 Income tax expense
Table A provides a reconciliation of notional income tax expense to actual income tax expense.
Table A Year ended 30 June
Telstra Group 2019 2018 Restated
$m $mMajor components of income tax expenseCurrent tax expense 953 1,552Deferred tax resulting from the origination and reversal of temporary differences (20) 33Over provision of tax in prior years (10) (3)
923 1,582Reconciliation of notional income tax expense to actual income tax expenseProfit before income tax expense 3,072 5,139Notional income tax expense calculated at the Australian tax rate of 30% (2018: 30%) 922 1,542Notional income tax expense differs from actual income tax expense due to the tax effect of:Non-taxable and non-deductible items 38 64Amended assessments (18) (3)Over provision of tax in prior years (10) (3)Different tax rates in overseas jurisdictions (9) (18)Income tax expense on profit 923 1,582Income tax expense/(benefit) recognised directly in other comprehensive income or equity during the year 13 (6)
Tables B and C include disclosures which form part of the requirements of the Australian Board of Taxation’s Voluntary Tax Transparency Code. Any disclosed amounts are determined in accordance with Australian Accounting Standards.
Table B provides a breakdown of effective income tax rates and Tax Transparency Code effective income tax rates for both the Australian Economic Group (the Telstra Entity and its Australian resident controlled entities) and the Telstra Group.
Table B Year ended 30 June
Telstra Group 2019 2018 (restated)
Group Australia Group AustraliaEffective income tax rate 30.0% 33.2% 30.8% 30.5%Tax Transparency Code effective income tax rate 30.9% 34.3% 30.5% 30.1%
The effective income tax rate for the Telstra Group of 30.0 per cent (2018: 30.8 per cent) was calculated as income tax expense divided by profit before income tax expense.
The Tax Transparency Code effective income tax rate (TTC ETR) for the Telstra Group of 30.9 per cent (2018: 30.5 per cent) differs to the effective income tax rate due to excluding the impact of under or over provision of tax in prior years and amended assessments.
The 2018 TTC ETR for the Telstra Group of 30.5 per cent has been updated to include the impact of the net over provision of tax and amended 2018 assessments reflected in the current year income tax expense. The TTC ETR forms part of the requirements of the Voluntary Tax Transparency Code to disclose the income tax expense borne by Telstra in respect of the Australian and global operations for the individual year.
Section 2 - Our Performance.fm Page 103 Tuesday, August 27, 2019 8:37 AM

Telstra Corporation Limited and controlled entities | 103
Notes to the financial statements (continued) Telstra Financial Report 2019Telstra Financial Report 2019Notes to the financial statements (continued) Telstra Financial Report 2019
Section 2. Our performance (continued)
Telstra Corporation Limited and controlled entities | 103
2.4 Income taxes
This note sets out our tax accounting policies and provides an analysis of our income tax expense and deferred tax balances, including a reconciliation of tax expense to accounting profit.
Current income tax is based on the accounting profit adjusted for differences in accounting and tax treatments of income and expenses (i.e. taxable income).
Deferred income tax, which is accounted for using the balance sheet method, arises because the accounting income is not always the same as taxable income. This creates temporary differences, which usually reverse over time. Until they reverse, a deferred tax asset or liability must be recognised on the balance sheet.
This note also provides disclosures which form part of the requirements of the Australian Board of Taxation’s Voluntary Tax Transparency Code.
2.4.1 Income tax expense
Table A provides a reconciliation of notional income tax expense to actual income tax expense.
Table A Year ended 30 June
Telstra Group 2019 2018 Restated
$m $mMajor components of income tax expenseCurrent tax expense 953 1,552Deferred tax resulting from the origination and reversal of temporary differences (20) 33Over provision of tax in prior years (10) (3)
923 1,582Reconciliation of notional income tax expense to actual income tax expenseProfit before income tax expense 3,072 5,139Notional income tax expense calculated at the Australian tax rate of 30% (2018: 30%) 922 1,542Notional income tax expense differs from actual income tax expense due to the tax effect of:Non-taxable and non-deductible items 38 64Amended assessments (18) (3)Over provision of tax in prior years (10) (3)Different tax rates in overseas jurisdictions (9) (18)Income tax expense on profit 923 1,582Income tax expense/(benefit) recognised directly in other comprehensive income or equity during the year 13 (6)
Tables B and C include disclosures which form part of the requirements of the Australian Board of Taxation’s Voluntary Tax Transparency Code. Any disclosed amounts are determined in accordance with Australian Accounting Standards.
Table B provides a breakdown of effective income tax rates and Tax Transparency Code effective income tax rates for both the Australian Economic Group (the Telstra Entity and its Australian resident controlled entities) and the Telstra Group.
Table B Year ended 30 June
Telstra Group 2019 2018 (restated)
Group Australia Group AustraliaEffective income tax rate 30.0% 33.2% 30.8% 30.5%Tax Transparency Code effective income tax rate 30.9% 34.3% 30.5% 30.1%
The effective income tax rate for the Telstra Group of 30.0 per cent (2018: 30.8 per cent) was calculated as income tax expense divided by profit before income tax expense.
The Tax Transparency Code effective income tax rate (TTC ETR) for the Telstra Group of 30.9 per cent (2018: 30.5 per cent) differs to the effective income tax rate due to excluding the impact of under or over provision of tax in prior years and amended assessments.
The 2018 TTC ETR for the Telstra Group of 30.5 per cent has been updated to include the impact of the net over provision of tax and amended 2018 assessments reflected in the current year income tax expense. The TTC ETR forms part of the requirements of the Voluntary Tax Transparency Code to disclose the income tax expense borne by Telstra in respect of the Australian and global operations for the individual year.
Section 2 - Our Performance.fm Page 103 Tuesday, August 27, 2019 8:37 AM

104 | Telstra Corporation Limited and controlled entities
Notes to the financial statements (continued)Notes to the financial statements (continued)
Section 2. Our performance (continued)
104 | Telstra Corporation Limited and controlled entities
2.4 Income taxes (continued)2.4.1 Income tax expense (continued)
Non-taxable and non-deductible items in the current period include the tax effect of:
• loss on the sale of Ooyala Inc. and Ooyala AB ($26 million)• tax losses not recognised ($12 million)• attributable taxable income from Controlled Foreign Companies
($9 million)• non-assessable gain on sale of land and buildings ($6 million)• various other items ($3 million).
Table C provides a reconciliation of income tax expense to income tax paid during the year as part of the requirements of the Voluntary Tax Transparency Code.
Table C As at 30 JuneTelstra Group 2019 2018
Restated
$m $mIncome tax expense 923 1,582Over provision in prior years 10 3Temporary differences recognised in deferred tax expenseIntangible assets 169 126Property, plant and equipment (101) (133)Deferred contract costs (56) (71)Trade and other payables 52 18Contract liabilities and other revenue received in advance
(28) 89
Provision for employee entitlements (15) (25)Trade and other receivables and contract assets 1 (25)
Other (2) (12)20 (33)
Current tax expense 953 1,552Income tax payments for prior years 103 101Current year income tax payable next year (103) (132)Other 3 -Income tax paid 956 1,521
Estimating provision for
income tax
We are subject to income tax legislation in Australia and in jurisdictions where we have foreign operations. Judgement is required in determining our worldwide provisions for income taxes and in assessing whether deferred tax balances are to be recognised in the statement of financial position. Changes in tax legislation in the countries we operate in may affect the amount of provision for income taxes and deferred tax balances recognised.
2.4.2 Deferred tax assets/(liabilities)
Table D details the amount of deferred tax assets and liabilities recognised in the statement of financial position. Deferred tax items recognised in the income statement include impact of foreign exchange movements.
Table D Year ended 30 June
Telstra Group 2019 2018 Restated
$m $mDeferred tax items recognised in the income statementProperty, plant and equipment (1,546) (1,440)Intangible assets (571) (743)Contract liabilities and other revenue received in advance 405 426
Provision for employee entitlements 289 305Deferred contract costs (227) (172)Trade and other receivables and contract assets (209) (206)
Trade and other payables 174 135Other provisions 148 141Investments (143) (140)Capital tax losses 120 123Defined benefit (asset)/liability 98 96Borrowings and derivative financial instruments (57) (52)
Allowance for doubtful debts 36 27Income tax losses 29 32Other (9) (21)
(1,463) (1,489)Deferred tax items recognised in other comprehensive income or equityFinancial instruments 190 184Defined benefit (asset)/liability (168) (171)Investments (30) (8)Other 1 1
(7) 6Net deferred tax liability (1,470) (1,483)Comprising:Deferred tax assets 59 54Deferred tax liabilities (1,529) (1,537)
(1,470) (1,483)
A $26 million reduction in deferred tax liabilities was recognised in retained earnings as at 1 July 2018 due to the adoption of AASB 9 (2014).
Section 2 - Our Performance.fm Page 104 Tuesday, August 27, 2019 8:37 AM
Notes to the financial statements (continued) Telstra Financial Report 2019
Section 2. Our performance (continued)
Telstra Corporation Limited and controlled entities | 105
2.4 Income taxes (continued)2.4.2 Deferred tax assets/(liabilities) (continued)
Unrecognised deferred tax
assets
We apply management judgement to recognise a deferred tax asset and review its carrying amount at each reporting date. The carrying amount is only recognised to the extent that it is probable that sufficient taxable profit will be available in the future to utilise this benefit. Any amount unrecognised could be subsequently recognised if it has become probable that future taxable profit will allow us to benefit from this deferred tax asset.
Table E details deferred tax assets not recognised in the statement of financial position.
Table E Year ended 30 June
Telstra Group 2019 2018
$m $mDeferred tax assets not recognisedCapital tax losses 1,736 1,744Income tax losses 240 358Deductible temporary differences 167 165
2,143 2,267
2.4.3 Tax consolidated group
Under Australian taxation law, the Telstra Entity and its Australian resident wholly owned entities (members) form a tax consolidated group and are treated as a single entity for income tax purposes. The Telstra Entity is the head entity of the group and, in addition to its own transactions, it recognises the current tax liabilities and the deferred tax assets arising from unused tax losses and tax credits for all members in the group.
Entities within the tax consolidated group have entered into a tax sharing agreement and a tax funding agreement with the head entity.
The tax sharing agreement specifies methods of allocating any tax liability in the event the head entity defaults on its group payment obligations and the treatment where a member exits the tax consolidated group.
Under the tax funding agreement the head entity and each of the members have agreed to pay/receive a current tax payable to/receivable from the head entity based on the current tax liability or current tax asset recorded in the financial statements of the members. The Telstra Entity will also compensate the members for any deferred tax assets relating to unused tax losses and tax credits.
Amounts receivable by the Telstra Entity of $46 million (2018: $59 million) and payable by the Telstra Entity of $109 million (2018: $114 million) under the tax funding agreement are due in the next financial year upon final settlement of the current tax payable for the tax consolidated group.
2.4.4 Recognition and measurement
Our income tax expense is the sum of current and deferred income tax expenses. Current income tax expense is calculated on accounting profit after adjusting for non-taxable and non-deductible items based on rules set by the tax authorities. Deferred income tax expense is calculated at the tax rates that are expected to apply for the period in which the deferred tax asset is realised or the deferred tax liability is settled. Both our current and deferred income tax expenses are calculated using tax rates that have been enacted or substantively enacted at reporting date.
Our current and deferred taxes are recognised as an expense in the income statement, except when they relate to items that are directly recognised in other comprehensive income or equity. In this case, our current and deferred tax expenses are also recognised directly in other comprehensive income or equity.
We apply the balance sheet method for calculating our deferred tax balances. Deferred tax is the expected tax payable or recoverable on all taxable and deductible temporary differences determined with reference to the tax bases of assets and liabilities and their carrying amount for financial reporting purposes as at the reporting date.
We generally recognise deferred tax liabilities for all taxable temporary differences, except to the extent that the deferred tax liability arises from:
• the initial recognition of goodwill• the initial recognition of an asset or liability in a transaction that is
not a business combination and affects neither our accounting profit nor our taxable income at the time of the transaction.
For our investments in controlled entities, joint ventures and associated entities, recognition of deferred tax liabilities is required unless we are able to control the timing of our temporary difference reversal and it is probable that the temporary difference will not reverse.
Deferred tax assets are recognised to the extent that it is probable that taxable profit will be available against which the deductible temporary differences, and the carried forward unused tax losses and tax credits, can be utilised.
Deferred tax assets and deferred tax liabilities are offset in the statement of financial position where they relate to income taxes levied by the same taxation authority and to the extent that we intend to settle our current tax assets and liabilities on a net basis.
Section 2 - Our Performance.fm Page 105 Tuesday, August 27, 2019 8:37 AM

Telstra Corporation Limited and controlled entities | 105
Notes to the financial statements (continued) Telstra Financial Report 2019Telstra Financial Report 2019Notes to the financial statements (continued) Telstra Financial Report 2019
Section 2. Our performance (continued)
Telstra Corporation Limited and controlled entities | 105
2.4 Income taxes (continued)2.4.2 Deferred tax assets/(liabilities) (continued)
Unrecognised deferred tax
assets
We apply management judgement to recognise a deferred tax asset and review its carrying amount at each reporting date. The carrying amount is only recognised to the extent that it is probable that sufficient taxable profit will be available in the future to utilise this benefit. Any amount unrecognised could be subsequently recognised if it has become probable that future taxable profit will allow us to benefit from this deferred tax asset.
Table E details deferred tax assets not recognised in the statement of financial position.
Table E Year ended 30 June
Telstra Group 2019 2018
$m $mDeferred tax assets not recognisedCapital tax losses 1,736 1,744Income tax losses 240 358Deductible temporary differences 167 165
2,143 2,267
2.4.3 Tax consolidated group
Under Australian taxation law, the Telstra Entity and its Australian resident wholly owned entities (members) form a tax consolidated group and are treated as a single entity for income tax purposes. The Telstra Entity is the head entity of the group and, in addition to its own transactions, it recognises the current tax liabilities and the deferred tax assets arising from unused tax losses and tax credits for all members in the group.
Entities within the tax consolidated group have entered into a tax sharing agreement and a tax funding agreement with the head entity.
The tax sharing agreement specifies methods of allocating any tax liability in the event the head entity defaults on its group payment obligations and the treatment where a member exits the tax consolidated group.
Under the tax funding agreement the head entity and each of the members have agreed to pay/receive a current tax payable to/receivable from the head entity based on the current tax liability or current tax asset recorded in the financial statements of the members. The Telstra Entity will also compensate the members for any deferred tax assets relating to unused tax losses and tax credits.
Amounts receivable by the Telstra Entity of $46 million (2018: $59 million) and payable by the Telstra Entity of $109 million (2018: $114 million) under the tax funding agreement are due in the next financial year upon final settlement of the current tax payable for the tax consolidated group.
2.4.4 Recognition and measurement
Our income tax expense is the sum of current and deferred income tax expenses. Current income tax expense is calculated on accounting profit after adjusting for non-taxable and non-deductible items based on rules set by the tax authorities. Deferred income tax expense is calculated at the tax rates that are expected to apply for the period in which the deferred tax asset is realised or the deferred tax liability is settled. Both our current and deferred income tax expenses are calculated using tax rates that have been enacted or substantively enacted at reporting date.
Our current and deferred taxes are recognised as an expense in the income statement, except when they relate to items that are directly recognised in other comprehensive income or equity. In this case, our current and deferred tax expenses are also recognised directly in other comprehensive income or equity.
We apply the balance sheet method for calculating our deferred tax balances. Deferred tax is the expected tax payable or recoverable on all taxable and deductible temporary differences determined with reference to the tax bases of assets and liabilities and their carrying amount for financial reporting purposes as at the reporting date.
We generally recognise deferred tax liabilities for all taxable temporary differences, except to the extent that the deferred tax liability arises from:
• the initial recognition of goodwill• the initial recognition of an asset or liability in a transaction that is
not a business combination and affects neither our accounting profit nor our taxable income at the time of the transaction.
For our investments in controlled entities, joint ventures and associated entities, recognition of deferred tax liabilities is required unless we are able to control the timing of our temporary difference reversal and it is probable that the temporary difference will not reverse.
Deferred tax assets are recognised to the extent that it is probable that taxable profit will be available against which the deductible temporary differences, and the carried forward unused tax losses and tax credits, can be utilised.
Deferred tax assets and deferred tax liabilities are offset in the statement of financial position where they relate to income taxes levied by the same taxation authority and to the extent that we intend to settle our current tax assets and liabilities on a net basis.
Section 2 - Our Performance.fm Page 105 Tuesday, August 27, 2019 8:37 AM

106 | Telstra Corporation Limited and controlled entities
Notes to the financial statements (continued)Notes to the financial statements (continued)
Section 2. Our performance (continued)
106 | Telstra Corporation Limited and controlled entities
2.5 Earnings per share
This note outlines the calculation of Earnings per Share (EPS), which is the amount of post-tax profit attributable to each share. EPS excludes profit attributable to non-controlling interest and takes into account the average number of shares weighted by the number of days on issue.
We calculate basic and diluted EPS. Diluted EPS reflects the effects of the equity instruments allocated to our employee share schemes under the Telstra Growthshare Trust and the Telstra Employee Share Ownership Plan.
Telstra Group Year ended 30 June
2019 2018 Restated
$m $mEarnings used in the calculation of basic and diluted EPSProfit for the year attributable to equity holders of Telstra Entity 2,154 3,591
Weighted average number of ordinary shares
Number of shares (millions)
Weighted average number of ordinary shares used in the calculation of basic EPS
11,880 11,877
Dilutive effect of certain employee share instruments 20 7
Weighted average number of ordinary shares used in the calculation of diluted EPS
11,900 11,884
cents centsBasic EPS 18.1 30.2Diluted EPS 18.1 30.2
When we calculate the basic EPS, we adjust the weighted average number of ordinary shares to exclude the shares held in trust by Telstra Growthshare Trust (Growthshare) and by the Telstra Employee Share Ownership Plan Trust II (TESOP99).
Information about equity instruments issued under the Growthshare and TESOP99 share plans can be found in note 5.2.
2.6 Notes to the statement of cash flows2.6.1 Reconciliation of profit to net cash provided by operating activities
Table A Year ended 30 June
Telstra Group 2019 2018 Restated
Note $m $m
Profit for the year 2,149 3,557
Add/(subtract) items classified as investing/financing activities
Finance income (238) (218)
Finance costs 868 806
Net gain on disposal of property, plant and equipment and intangible assets
(686) (601)
Net loss/(gain) on disposal of business, controlled entities and equity accounted investments
85 (323)
Government grants received relating to investing activities (11) (91)
Add/(subtract) non-cash items
Depreciation and amortisation 4,282 4,470
Share-based payments 23 29
Defined benefit plan expense 52 69
Share of net (profit)/loss from joint ventures and associated entities 6.2 (12) 22
Impairment losses (excluding inventories, trade and other receivables)
501 327
Other (8) (33)
Cash movements in operating assets and liabilities (net of acquisitions and disposals of controlled entity balances)Decrease in trade and other receivables 177 197
Decrease/(increase) in inventories 28 (8)
Increase in prepayments and other assets (51) (85)
Increase in deferred contract costs (78) (146)
Increase in trade and other payables 121 587
(Decrease)/increase in contract liabilities and other revenue received in advance
(431) 34
(Decrease)/increase in net taxes payable (33) 61
Decrease in provisions (55) (48)
Net cash provided by operating activities 6,683 8,606
Section 2 - Our Performance.fm Page 106 Tuesday, August 27, 2019 8:37 AM
Notes to the financial statements (continued) Telstra Financial Report 2019
Section 2. Our performance (continued)
Telstra Corporation Limited and controlled entities | 107
2.6 Notes to the statement of cash flows (continued)2.6.2 Cash and cash equivalents
Table B Year ended 30 June
Telstra Group 2019 2018
$m $mCash at bank and on hand 219 129Bank deposits and negotiable certificates of deposit 385 500
604 629Bank overdraft - (9)Cash and cash equivalents in the statement of cash flows 604 620
2.6.3 Recognition, measurement and presentation
(a) Cash and cash equivalents
Cash and cash equivalents include cash at bank and on hand, bank deposits and negotiable certificates of deposit that are held to meet short-term cash commitments rather than for investment purposes.
Bank deposits and negotiable certificates of deposit are classified as financial assets held at amortised cost.
(b) Short-term borrowings in financing cash flows
Where our short-term borrowings are held for the purposes of meeting short-term cash commitments, we report the cash receipts and subsequent repayments in financing activities on a net basis in the statement of cash flows.
(c) Goods and Services Tax (GST) (including other value-added taxes)
We record our revenue, expenses and assets net of any applicable GST, except where the amount of GST incurred is not recoverable from the Australian Taxation Office (ATO). In these circumstances the GST is recognised as part of the cost of acquisition of the asset or as part of the expense item.
Receivables and payables balances include GST where we have either included GST in our price charged to customers or a supplier has included GST in their price charged to us. The net amount of GST due to the ATO but not paid is included in our current trade and other payables.
Section 2 - Our Performance.fm Page 107 Tuesday, August 27, 2019 8:37 AM
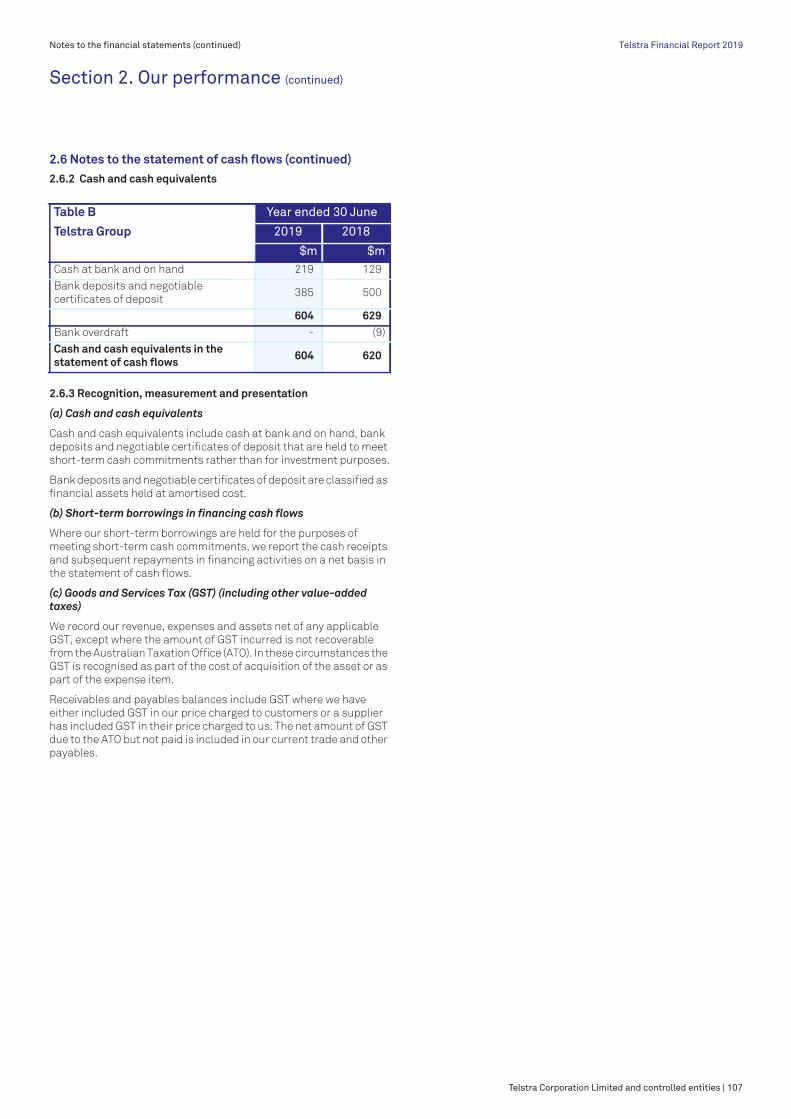
Telstra Corporation Limited and controlled entities | 107
Notes to the financial statements (continued) Telstra Financial Report 2019Telstra Financial Report 2019Notes to the financial statements (continued) Telstra Financial Report 2019
Section 2. Our performance (continued)
Telstra Corporation Limited and controlled entities | 107
2.6 Notes to the statement of cash flows (continued)2.6.2 Cash and cash equivalents
Table B Year ended 30 June
Telstra Group 2019 2018
$m $mCash at bank and on hand 219 129Bank deposits and negotiable certificates of deposit 385 500
604 629Bank overdraft - (9)Cash and cash equivalents in the statement of cash flows 604 620
2.6.3 Recognition, measurement and presentation
(a) Cash and cash equivalents
Cash and cash equivalents include cash at bank and on hand, bank deposits and negotiable certificates of deposit that are held to meet short-term cash commitments rather than for investment purposes.
Bank deposits and negotiable certificates of deposit are classified as financial assets held at amortised cost.
(b) Short-term borrowings in financing cash flows
Where our short-term borrowings are held for the purposes of meeting short-term cash commitments, we report the cash receipts and subsequent repayments in financing activities on a net basis in the statement of cash flows.
(c) Goods and Services Tax (GST) (including other value-added taxes)
We record our revenue, expenses and assets net of any applicable GST, except where the amount of GST incurred is not recoverable from the Australian Taxation Office (ATO). In these circumstances the GST is recognised as part of the cost of acquisition of the asset or as part of the expense item.
Receivables and payables balances include GST where we have either included GST in our price charged to customers or a supplier has included GST in their price charged to us. The net amount of GST due to the ATO but not paid is included in our current trade and other payables.
Section 2 - Our Performance.fm Page 107 Tuesday, August 27, 2019 8:37 AM

108 | Telstra Corporation Limited and controlled entities
Notes to the financial statements (continued)
108 | Telstra Corporation Limited and controlled entities
Notes to the financial statements (continued)
Section 3. Our core assets and working capitalThis section describes our core long-term tangible and intangible assets underpinning the Group’s performance and provides a summary of our asset impairment assessment. This section also describes our short-term assets and liabilities, i.e. our working capital supporting the operating liquidity of our business.
SECTION 3. OUR CORE ASSETS AND WORKING CAPITAL3.1 Property, plant and equipmentTable A shows movements in net book value of our tangible assets during the financial year.
Table ATelstra Group
Land and site
improve- ments
Buildings Commu- nication assets
Other plant and
equipment
Total property, plant and
equipment
$m $m $m $m $mNet book value at 1 July 2017 52 620 20,220 458 21,350Additions - 92 3,536 112 3,740Acquisition of controlled entities - - - 4 4Impairment losses - (4) (9) (7) (20)Depreciation expenses (3) (96) (2,801) (105) (3,005)Disposals - - (5) (3) (8)Net foreign currency exchange differences - 3 48 3 54Transfers - (3) 76 (80) (7)Net book value at 30 June 2018 49 612 21,065 382 22,108At cost 52 1,381 62,111 1,405 64,949Accumulated depreciation and impairment (3) (769) (41,046) (1,023) (42,841)
Net book value at 1 July 2018 49 612 21,065 382 22,108Additions - 141 3,004 60 3,205Impairment losses - (3) (51) (3) (57)Depreciation expenses (3) (98) (2,612) (97) (2,810)Disposals - - (21) - (21)Disposals through sale of controlled entities - - - (2) (2)Assets held for sale - (44) (60) (13) (117)Net foreign currency exchange differences - 2 47 3 52Transfers 16 (9) (16) (17) (26)Net book value at 30 June 2019 62 601 21,356 313 22,332At cost 65 1,390 61,780 1,251 64,486Accumulated depreciation and impairment (3) (789) (40,424) (938) (42,154)
Section 3 - Our Core Assets and Working Capital.fm Page 108 Tuesday, August 27, 2019 8:25 AM
Notes to the financial statements (continued) Telstra Financial Report 2019
Section 3. Our core assets and working capital (continued)
Telstra Corporation Limited and controlled entities | 109
3.1 Property, plant and equipment (continued)The following paragraphs provide further information about our fixed asset classes:
• additions to property, plant and equipment include $74 million (2018: $73 million) of capitalised borrowing costs directly attributable to qualifying assets
• buildings include leasehold improvements and a $57 million (2018: $103 million) net book value of buildings under finance lease
• communication assets include certain network land and building assets that are essential to the operation of our communication assets
• as at 30 June 2019, we had property, plant and equipment under construction amounting to $1,006 million (2018: $1,388 million). As these assets were not installed and ready for use, no depreciation has been charged on these assets.
3.1.1 Impairment assessment
All non-current tangible assets are reviewed for impairment whenever events or changes in circumstances indicate that the carrying amounts may not be recoverable. For our impairment assessment we identify cash generating units (CGUs), i.e. the smallest groups of asset that generate cash inflows that are largely independent of cash inflows from other assets or groups of assets.
The recoverable amount of an asset is the higher of its fair value less cost of disposal and its value in use. Fair value less cost of disposal is measured with reference to quoted market prices in an active market. Value in use represents the present value of the future amount expected to be recovered through the cash inflows and outflows arising from the asset’s continued use and subsequent disposal.
We recognise any reduction in the carrying value as an expense in the income statement in the reporting period in which the impairment loss occurs.
An impairment assessment is performed at the level of our Telstra Entity ubiquitous telecommunications network CGU.
Cash generating
units (CGUs) for impairment assessment
We apply management judgement to establish our CGUs.
We have determined that under the nbn Infrastructure Services Agreement (ISA) our ubiquitous telecommunications network also includes the Hybrid Fibre Coaxial (HFC) cable network. This resulted mainly from the fact that under the nbn ISA cash inflows generated by both networks can no longer be separated. No one item of telecommunications equipment is of any value without the other assets to which it is connected to deliver our products and services.
We did not identify any impairment indicators at the level of the ubiquitous network. However, we have recognised total impairment expense related to the tangible ($57 million) and intangible assets ($442 million), mostly pertaining to our legacy IT systems.
3.1.2 Recognition and measurement
(a) Acquisition
Property, plant and equipment, including construction in progress, is recorded at cost less accumulated depreciation and impairment. Cost includes the purchase price and costs directly attributable to bringing the asset to the location and condition necessary for its intended use.
We capitalise borrowing costs that are directly attributable to the acquisition, construction or production of a qualifying asset. All other borrowing costs are recognised as an expense in our income statement when incurred.
(b) Depreciation
Items of property, plant and equipment, including buildings and leasehold property but excluding freehold land, are depreciated on a straight-line basis in the income statement over their estimated useful lives. We start depreciating assets when they are installed and ready for use.
The useful lives of our significant property, plant and equipment classes are detailed in Table B.
Table B Useful life (years)
Telstra Group As at 30 June
2019 2018Buildings 5 - 55 5 - 48Communication assets 2 - 57 2 - 57Other plant and equipment 4 - 13 4 - 13
Useful lives and residual values
of tangible assets
We apply management judgement to estimate useful lives and residual values of our assets and review them each year. If useful lives or residual values need to be modified, the depreciation expense changes from the date of reassessment until the end of the revised useful life (for both the current and future years).
This assessment includes a comparison with international trends for telecommunication companies and, in relation to communications assets, includes a determination of when the asset may be superseded technologically or made obsolete.
The net effect of the assessment of useful lives was a $253 million (2018: $216 million) decrease in depreciation expense.
Section 3 - Our Core Assets and Working Capital.fm Page 109 Tuesday, August 27, 2019 8:25 AM

Telstra Corporation Limited and controlled entities | 109
Notes to the financial statements (continued) Telstra Financial Report 2019Telstra Financial Report 2019Notes to the financial statements (continued) Telstra Financial Report 2019
Section 3. Our core assets and working capital (continued)
Telstra Corporation Limited and controlled entities | 109
3.1 Property, plant and equipment (continued)The following paragraphs provide further information about our fixed asset classes:
• additions to property, plant and equipment include $74 million (2018: $73 million) of capitalised borrowing costs directly attributable to qualifying assets
• buildings include leasehold improvements and a $57 million (2018: $103 million) net book value of buildings under finance lease
• communication assets include certain network land and building assets that are essential to the operation of our communication assets
• as at 30 June 2019, we had property, plant and equipment under construction amounting to $1,006 million (2018: $1,388 million). As these assets were not installed and ready for use, no depreciation has been charged on these assets.
3.1.1 Impairment assessment
All non-current tangible assets are reviewed for impairment whenever events or changes in circumstances indicate that the carrying amounts may not be recoverable. For our impairment assessment we identify cash generating units (CGUs), i.e. the smallest groups of asset that generate cash inflows that are largely independent of cash inflows from other assets or groups of assets.
The recoverable amount of an asset is the higher of its fair value less cost of disposal and its value in use. Fair value less cost of disposal is measured with reference to quoted market prices in an active market. Value in use represents the present value of the future amount expected to be recovered through the cash inflows and outflows arising from the asset’s continued use and subsequent disposal.
We recognise any reduction in the carrying value as an expense in the income statement in the reporting period in which the impairment loss occurs.
An impairment assessment is performed at the level of our Telstra Entity ubiquitous telecommunications network CGU.
Cash generating
units (CGUs) for impairment assessment
We apply management judgement to establish our CGUs.
We have determined that under the nbn Infrastructure Services Agreement (ISA) our ubiquitous telecommunications network also includes the Hybrid Fibre Coaxial (HFC) cable network. This resulted mainly from the fact that under the nbn ISA cash inflows generated by both networks can no longer be separated. No one item of telecommunications equipment is of any value without the other assets to which it is connected to deliver our products and services.
We did not identify any impairment indicators at the level of the ubiquitous network. However, we have recognised total impairment expense related to the tangible ($57 million) and intangible assets ($442 million), mostly pertaining to our legacy IT systems.
3.1.2 Recognition and measurement
(a) Acquisition
Property, plant and equipment, including construction in progress, is recorded at cost less accumulated depreciation and impairment. Cost includes the purchase price and costs directly attributable to bringing the asset to the location and condition necessary for its intended use.
We capitalise borrowing costs that are directly attributable to the acquisition, construction or production of a qualifying asset. All other borrowing costs are recognised as an expense in our income statement when incurred.
(b) Depreciation
Items of property, plant and equipment, including buildings and leasehold property but excluding freehold land, are depreciated on a straight-line basis in the income statement over their estimated useful lives. We start depreciating assets when they are installed and ready for use.
The useful lives of our significant property, plant and equipment classes are detailed in Table B.
Table B Useful life (years)
Telstra Group As at 30 June
2019 2018Buildings 5 - 55 5 - 48Communication assets 2 - 57 2 - 57Other plant and equipment 4 - 13 4 - 13
Useful lives and residual values
of tangible assets
We apply management judgement to estimate useful lives and residual values of our assets and review them each year. If useful lives or residual values need to be modified, the depreciation expense changes from the date of reassessment until the end of the revised useful life (for both the current and future years).
This assessment includes a comparison with international trends for telecommunication companies and, in relation to communications assets, includes a determination of when the asset may be superseded technologically or made obsolete.
The net effect of the assessment of useful lives was a $253 million (2018: $216 million) decrease in depreciation expense.
Section 3 - Our Core Assets and Working Capital.fm Page 109 Tuesday, August 27, 2019 8:25 AM

110 | Telstra Corporation Limited and controlled entities
Notes to the financial statements (continued)Notes to the financial statements (continued)
Section 3. Our core assets and working capital (continued)
110 | Telstra Corporation Limited and controlled entities
3.1 Property, plant and equipment (continued)3.1.2 Recognition and measurement (continued)
(b) Depreciation (continued)
Impact of nbn Infrastructure
Services Agreement
(ISA) on our fixed assets
base
Under the nbn Infrastructure Services Agreement (ISA), we are required to progressively transfer the relevant Telstra assets to nbn co. These assets include lead-in conduits (LICs), certain copper and HFC assets and associated passive infrastructure (being infrastructure that supports the relevant copper and HFC assets).
As at 30 June 2019, the net book value of assets that are in scope to be potentially transferred to nbn co under the ISA amounted to $375 million (2018: $625 million). This represents 1.7 per cent of the net book value of our total property, plant and equipment. We have applied management judgement in assessing the useful lives of the in-scope assets based on the anticipated nbnTM network rollout period.
The nbnTM network rollout will also to a lesser extent impact useful lives of other assets, e.g. transmission and switching technologies, which will not be transferred to nbn co. The full impact on our useful lives is not yet known and will depend on nbn co's selection of access technologies in each rollout region and the sequence in which the nbnTM network rollout progresses. For the year ended 30 June 2019, we have applied management judgement in assessing the useful lives of these assets based on our best estimate of the expected consequential impacts of the nbnTM network rollout. The result of our assessment is included in the net effect of our useful lives assessment.
Should evidence exist in the future reporting periods that changes these best estimates, depreciation expense will be adjusted as a change in estimate in the future reporting periods.
(c) Leased assets (Telstra as a lessee)
We distinguish between finance leases, which effectively transfer substantially all the risks and benefits incidental to ownership of the leased asset from the lessor to the lessee, and operating leases under which the lessor effectively retains substantially all such risks and benefits. The determination of whether an arrangement is, or contains, a lease is based on the substance of the arrangement at inception date, whether fulfilment of the arrangement depends on the use of a specific asset or assets and the arrangement conveys a right to use the asset, even if that right is not explicitly specified in an arrangement.
Property, plant and equipment under finance lease are capitalised at the beginning of the lease term at the lower of the fair value of the asset and the present value of the future minimum lease payments. A corresponding liability is also established and each lease payment is allocated between the liability and finance charges.
Capitalised property, plant and equipment under finance lease are depreciated on a straight-line basis to the income statement over the shorter of the lease term or the expected useful life of the assets.
Where we lease properties, costs of improvements to these properties are capitalised as leasehold improvements and amortised over the shorter of the useful life of the improvements and the term of the lease.
Operating lease payments are charged to the income statement on a straight-line basis over the term of the lease.
When we sell and lease back the same asset, the accounting treatment depends on the classification of the leaseback. If the leaseback is classified as a finance lease, any gain or loss on the sale is deferred and amortised over the lease term. If the leaseback is classified as an operating lease, any profit or loss on sale is recognised immediately.
3.1.3 Non-current assets held for sale
As at 30 June 2019, $121 million of assets and $79 million of liabilities have been classified as held for sale, including assets and liabilities related to three data centres within the Telstra Enterprise segment. These assets are measured at the lower of carrying amount and fair value less cost to sell. The sale of these data centres is expected to complete in the second quarter of financial year 2020.
Section 3 - Our Core Assets and Working Capital.fm Page 110 Tuesday, August 27, 2019 8:25 AM
Notes to the financial statements (continued) Telstra Financial Report 2019
Section 3. Our core assets and working capital (continued)
Telstra Corporation Limited and controlled entities | 111
3.2 Goodwill and other intangible assets
This note provides details of our goodwill and other intangible assets and their impairment assessment.
Our impairment assessment compares the carrying value of our CGUs with their recoverable amounts determined using a ‘value in use’ calculation. The value in use calculations use key assumptions such as cash flow forecasts, discount rates and terminal growth rates.
Table ATelstra Group
Goodwill Software assets
Licences Other intan-gible assets
Total intan- gible assets
$m $m $m $m $mRestated net book value at 1 July 2017 1,269 4,543 2,325 180 8,317Additions - 1,205 88 - 1,293Acquisition of controlled entities 24 6 - 20 50Impairment losses (261) (31) - (5) (297)Amortisation expense - (1,217) (217) (31) (1,465)Disposal through sale of controlled entities (16) - (1) (11) (28)Net foreign currency exchange differences 33 7 - 5 45Transfers - 7 - - 7Restated net book value at 30 June 2018 1,049 4,520 2,195 158 7,922At cost 1,624 11,903 3,174 343 17,044Accumulated amortisation and impairment (575) (7,383) (979) (185) (9,122)
Net book value at 1 July 2018 1,049 4,520 2,195 158 7,922Additions - 1,091 56 - 1,147Acquisition of controlled entities 1 - - - 1Impairment losses - (442) - - (442)Amortisation expense - (1,216) (230) (26) (1,472)Disposal through sale of controlled entities - (5) (1) - (6)Net foreign currency exchange differences 26 3 1 4 34Transfers - 32 2 (8) 26Net book value at 30 June 2019 1,076 3,983 2,023 128 7,210At cost 1,171 10,917 2,878 335 15,301Accumulated amortisation and impairment (95) (6,934) (855) (207) (8,091)
Section 3 - Our Core Assets and Working Capital.fm Page 111 Tuesday, August 27, 2019 8:25 AM

Telstra Corporation Limited and controlled entities | 111
Notes to the financial statements (continued) Telstra Financial Report 2019Telstra Financial Report 2019Notes to the financial statements (continued) Telstra Financial Report 2019
Section 3. Our core assets and working capital (continued)
Telstra Corporation Limited and controlled entities | 111
3.2 Goodwill and other intangible assets
This note provides details of our goodwill and other intangible assets and their impairment assessment.
Our impairment assessment compares the carrying value of our CGUs with their recoverable amounts determined using a ‘value in use’ calculation. The value in use calculations use key assumptions such as cash flow forecasts, discount rates and terminal growth rates.
Table ATelstra Group
Goodwill Software assets
Licences Other intan-gible assets
Total intan- gible assets
$m $m $m $m $mRestated net book value at 1 July 2017 1,269 4,543 2,325 180 8,317Additions - 1,205 88 - 1,293Acquisition of controlled entities 24 6 - 20 50Impairment losses (261) (31) - (5) (297)Amortisation expense - (1,217) (217) (31) (1,465)Disposal through sale of controlled entities (16) - (1) (11) (28)Net foreign currency exchange differences 33 7 - 5 45Transfers - 7 - - 7Restated net book value at 30 June 2018 1,049 4,520 2,195 158 7,922At cost 1,624 11,903 3,174 343 17,044Accumulated amortisation and impairment (575) (7,383) (979) (185) (9,122)
Net book value at 1 July 2018 1,049 4,520 2,195 158 7,922Additions - 1,091 56 - 1,147Acquisition of controlled entities 1 - - - 1Impairment losses - (442) - - (442)Amortisation expense - (1,216) (230) (26) (1,472)Disposal through sale of controlled entities - (5) (1) - (6)Net foreign currency exchange differences 26 3 1 4 34Transfers - 32 2 (8) 26Net book value at 30 June 2019 1,076 3,983 2,023 128 7,210At cost 1,171 10,917 2,878 335 15,301Accumulated amortisation and impairment (95) (6,934) (855) (207) (8,091)
Section 3 - Our Core Assets and Working Capital.fm Page 111 Tuesday, August 27, 2019 8:25 AM

112 | Telstra Corporation Limited and controlled entities
Notes to the financial statements (continued)Notes to the financial statements (continued)
Section 3. Our core assets and working capital (continued)
112 | Telstra Corporation Limited and controlled entities
3.2 Goodwill and other intangible assets (continued)The following paragraphs detail further information about our intangible assets classes:
• additions to software assets include $31 million (2018: $28 million) of capitalised borrowing costs directly attributable to qualifying assets
• refer to note 3.1.1 for further details on the impairment of software assets
• as at 30 June 2019, we had software assets under development amounting to $372 million (2018: $493 million). As these assets were not installed and ready for use, no amortisation has been charged on the amounts.
• software assets mostly comprise internally generated assets• licences include $56 million for the ACMA Licence 900 MHz
apparatus acquired in the current financial year.
3.2.1 Impairment assessment
Goodwill and intangible assets with an indefinite useful life are not subject to amortisation and are assessed for impairment at least on an annual basis, or whenever an indication of impairment arises. Assets that are subject to amortisation are reviewed for impairment whenever events or changes in circumstances indicate that the carrying amount may not be recoverable.
The recoverable amount of an asset is the higher of its fair value less cost of disposal and its value in use.
Impairment losses are recognised in the income statement in the reporting period when the carrying amount of the asset exceeds the recoverable amount.
For our impairment assessment, we identify CGUs, to which goodwill is allocated, and which cannot be larger than an operating segment.
Our impairment testing compares the carrying value of an individual CGU with its recoverable amounts determined using a value in use calculation.
Determining CGUs and their
recoverable amount for
impairment assessment
We apply management judgement to identify our CGUs and determine their recoverable amounts using a ‘value in use’ calculation for our impairment assessment. These judgements include cash flow forecasts, as well as the selection of growth rates, terminal growth rates and discount rates based on past experience and our expectations for the future.
Our cash flow projections are based on five-year management-approved forecasts unless a longer period is justified. The forecasts use management estimates to determine income, expenses, capital expenditure and cash flows for each asset and CGU.
(a) Cash generating units with allocated goodwill
The carrying amount of goodwill has been allocated to the CGUs as detailed in Table B.
Table B As at 30 June
Telstra Group 2019 2018
$m $mTelstra Enterprise International Group ¹ 578 488Telstra Europe Group ¹ - 64Telstra Enterprise Australia Group ² 367 367Other ³ 131 130
1,076 1,049
1 These CGUs operate in overseas locations. Therefore the goodwill allocated to these CGUs will fluctuate in line with movements in applicable foreign exchange rates.
2 The Telstra Enterprise Australia Group includes goodwill from past acquisitions integrated into this business.
3 Other includes individually immaterial CGUs.
During the financial year ended 30 June 2019, there have been no changes to our CGUs with allocated goodwill except for:
• the operations of Telstra Europe Group were integrated into Telstra Enterprise International Group to generate combined cash inflows for the Group. Prior to integration, the CGUs were assessed individually.
• changes in other individually immaterial CGUs due to integration of operations.
(b) Value in use
We have used the following key assumptions in determining the recoverable amount of our CGUs to which goodwill has been allocated:
Table CTelstra Group
Discount rate Terminal value growth rate
2019 2018 2019 2018
% % % %Telstra Enterprise International Group 9.2 9.2 3.0 3.0
Telstra Europe Group - 8.5 - 3.0
Telstra Enterprise Australia Group 12.8 12.8 3.0 3.0
Discount rate represents the pre-tax discount rate applied to the cash flow projections. The discount rate reflects the market determined, risk-adjusted discount rate that is adjusted for specific risks relating to the CGU and the countries in which it operates.
Terminal value growth rate represents the growth rate applied to extrapolate our cash flows beyond the five-year forecast period. These growth rates are based on our expectation of the CGUs’ long-term performance in their markets.
Sensitivity analysis also examined the effect of a change in a key assumption on the remaining CGUs. The discount rate would need to increase by 293 basis points (2018: 221 basis points) or the terminal value growth rate would need to decrease by 413 basis points (2018: 294 basis points) before the recoverable amount of any of the CGUs would equal its carrying value. No other changes in key assumptions will result in a material impairment charge for any of the CGUs.
Section 3 - Our Core Assets and Working Capital.fm Page 112 Tuesday, August 27, 2019 8:25 AM
Notes to the financial statements (continued) Telstra Financial Report 2019
Section 3. Our core assets and working capital (continued)
Telstra Corporation Limited and controlled entities | 113
3.2 Goodwill and other intangible assets (continued)3.2.2 Recognition and measurement
Category Recognition and measurement
Goodwill Goodwill acquired in a business combination is measured at cost. Cost represents the excess of what we pay for the business combination over the fair value of the identifiable net assets acquired at the date of acquisition.
Goodwill is not amortised but is tested for impairment on an annual basis or when an indication of impairment arises.
Goodwill amount arising on acquisition of joint ventures or associated entities constitutes part of the cost of the investment.
Internally generated intangible assets
Internally generated intangible assets include mainly IT development costs incurred in design, build and testing of new or improved IT products and systems.
Research costs are expensed when incurred.
Capitalised development costs include:
• external direct costs of materials and services consumed• payroll and payroll-related costs for employees (including contractors) directly associated with the
project• borrowing costs that are directly attributable to the qualifying assets.
Refer to ‘Capitalisation of development costs’ for management judgement on recognition of development costs.
Internally generated intangible assets have a finite life and are amortised on a straight-line basis over their useful lives.
Acquired intangible assets
We acquire other intangible assets either as part of a business combination or through a separate acquisition. Intangible assets acquired in a business combination are recorded at their fair value at the date of acquisition and recognised separately from goodwill. Intangible assets acquired through a specific acquisition are recorded at cost.
Refer to ‘Determining fair value of identifiable intangible assets’ for management judgement on measurement of fair value of intangible assets acquired as part of a business combination.
Intangible assets that are considered to have a finite life are amortised on a straight-line basis over the period of expected benefit. Intangible assets that are considered to have an indefinite life are not amortised but tested for impairment on an annual basis or when an indication of impairment exists.
Capitalisation of development
costs
Management judgement is required to determine whether to capitalise development costs. Development costs are only capitalised if the project is assessed to be technically and commercially feasible, we are able to use or sell the asset and we have sufficient resources and intent to complete the development.
Determining fair value of identifiable
intangible assets
Management judgement is required to determine the appropriate fair value of identifiable intangible assets acquired in business combinations. This involves estimating timing and amounts of future cash flows derived from the use of these assets as well as an appropriate discount rate to be applied to the forecast cash flows. Such estimates are based on current forecasts, extrapolated for an appropriate period and taking into account growth rates, operating costs and the expected useful life of the assets.
Section 3 - Our Core Assets and Working Capital.fm Page 113 Tuesday, August 27, 2019 8:25 AM

Telstra Corporation Limited and controlled entities | 113
Notes to the financial statements (continued) Telstra Financial Report 2019Telstra Financial Report 2019Notes to the financial statements (continued) Telstra Financial Report 2019
Section 3. Our core assets and working capital (continued)
Telstra Corporation Limited and controlled entities | 113
3.2 Goodwill and other intangible assets (continued)3.2.2 Recognition and measurement
Category Recognition and measurement
Goodwill Goodwill acquired in a business combination is measured at cost. Cost represents the excess of what we pay for the business combination over the fair value of the identifiable net assets acquired at the date of acquisition.
Goodwill is not amortised but is tested for impairment on an annual basis or when an indication of impairment arises.
Goodwill amount arising on acquisition of joint ventures or associated entities constitutes part of the cost of the investment.
Internally generated intangible assets
Internally generated intangible assets include mainly IT development costs incurred in design, build and testing of new or improved IT products and systems.
Research costs are expensed when incurred.
Capitalised development costs include:
• external direct costs of materials and services consumed• payroll and payroll-related costs for employees (including contractors) directly associated with the
project• borrowing costs that are directly attributable to the qualifying assets.
Refer to ‘Capitalisation of development costs’ for management judgement on recognition of development costs.
Internally generated intangible assets have a finite life and are amortised on a straight-line basis over their useful lives.
Acquired intangible assets
We acquire other intangible assets either as part of a business combination or through a separate acquisition. Intangible assets acquired in a business combination are recorded at their fair value at the date of acquisition and recognised separately from goodwill. Intangible assets acquired through a specific acquisition are recorded at cost.
Refer to ‘Determining fair value of identifiable intangible assets’ for management judgement on measurement of fair value of intangible assets acquired as part of a business combination.
Intangible assets that are considered to have a finite life are amortised on a straight-line basis over the period of expected benefit. Intangible assets that are considered to have an indefinite life are not amortised but tested for impairment on an annual basis or when an indication of impairment exists.
Capitalisation of development
costs
Management judgement is required to determine whether to capitalise development costs. Development costs are only capitalised if the project is assessed to be technically and commercially feasible, we are able to use or sell the asset and we have sufficient resources and intent to complete the development.
Determining fair value of identifiable
intangible assets
Management judgement is required to determine the appropriate fair value of identifiable intangible assets acquired in business combinations. This involves estimating timing and amounts of future cash flows derived from the use of these assets as well as an appropriate discount rate to be applied to the forecast cash flows. Such estimates are based on current forecasts, extrapolated for an appropriate period and taking into account growth rates, operating costs and the expected useful life of the assets.
Section 3 - Our Core Assets and Working Capital.fm Page 113 Tuesday, August 27, 2019 8:25 AM

114 | Telstra Corporation Limited and controlled entities
Notes to the financial statements (continued)Notes to the financial statements (continued)
Section 3. Our core assets and working capital (continued)
114 | Telstra Corporation Limited and controlled entities
3.2 Goodwill and other intangible assets (continued)3.2.2 Recognition and measurement (continued)
(a) Amortisation
The weighted average amortisation periods of our identifiable intangible assets are as follows:
Table DTelstra Group
Expected benefit (years)
As at 30 June
2019 2018Software assets 8 8Licences 14 14Other intangibles 10 10
Useful lives of intangible
assets
We apply management judgement to determine the amortisation period based on the expected useful lives of each asset class. In addition, we apply management judgement to assess annually the indefinite useful life assumption applied to certain acquired intangible assets.
We review the useful lives of our identifiable intangible assets each year. The net effect of the reassessment of useful lives for the financial year 2019 was a $130 million (2018: $26 million) decrease in amortisation expense.
3.3 Trade and other receivables and contract assets3.3.1 Current and non-current trade and other receivables and contract assets
Table A As at 30 June
Telstra Group 2019 2018 Restated
Note $m $m
Current
Trade receivables from contracts with customers 3,151 3,209
Finance lease receivables 99 108
Accrued revenue 795 668
Other receivables 159 157
4,204 4,142
Contract assets 3.7 1,188 1,446
5,392 5,588
Non-current
Trade receivables from contracts with customers 473 394
Finance lease receivables 153 193
Other receivables 17 30
643 617
Contract assets 3.7 137 113
780 730
The majority of our receivables are in the form of contracted agreements with our customers. In general, the terms and conditions of these contracts require settlement between 14 to 30 days from the date of invoice. Credit risk associated with trade and other receivables and contract assets has been provided for.
Our trade receivables include receivables with deferred payment terms, which allow eligible customers the opportunity to repay the amounts due for certain hardware and professional installation services monthly over 12, 24 or 36 months.
Contract assets relate to our rights to consideration for goods or services provided to the customers but for which we do not have an unconditional right to payment at the reporting date.
Refer to note 3.7 for further details regarding trade receivables from contracts with customers and contract assets.
Section 3 - Our Core Assets and Working Capital.fm Page 114 Tuesday, August 27, 2019 8:25 AM
Notes to the financial statements (continued) Telstra Financial Report 2019
Section 3. Our core assets and working capital (continued)
Telstra Corporation Limited and controlled entities | 115
3.3 Trade and other receivables and contract assets (continued)3.3.1 Current and non-current trade and other receivables and contract assets (continued)
(a) Finance lease receivables
We enter into finance lease arrangements predominantly for communication assets dedicated to solutions management that we provide to our customers largely in a back-to-back finance lease arrangement. Refer to note 7.4 for information about our finance lease commitments arising from these finance arrangements (Telstra as a lessee). The weighted average remaining term of the finance lease in our customer contracts is 5 years (2018: 6 years).
Table B presents detailed information about our finance lease receivables.
Table B As at 30 June
Telstra Group 2019 2018
$m $mAmounts receivable under finance leasesWithin 1 year 109 115Within 1 to 5 years 125 183After 5 years 54 73Total minimum lease receivables 288 371Less: unearned finance income (36) (70)Present value of minimum lease receivables 252 301
Included in the financial statements asCurrent finance lease receivables 99 108Non-current finance lease receivables 153 193
252 301
The interest rate implicit in the leases is fixed at the contract date for the entire lease term. The average effective interest rate was 5.0 per cent (2018: 5.3 per cent) per annum.
(b) Impairment of trade and other receivables and contract assets
Trade and other receivables and contract assets are exposed to customers’ credit risk and are subject to impairment assessment.
If a credit loss is expected, an allowance for doubtful debt is raised to reduce the carrying amount of trade and other receivables and contract assets based on a review of outstanding amounts at a reporting date.
A credit loss is a shortfall between the cash flows that are due in accordance with the contract and the cash flows that we expect to receive, discounted at the original effective interest rate. The estimated expected credit loss is calculated using one of the following approaches:
• a portfolio approach based on historical credit loss experience (mostly applied to balances arising from our consumer and small business customer contracts)
• an individual account by account assessment based on past credit history, knowledge of debtor’s financial situation or other known credit risk (applied to balances arising from contracts with large corporate and government customers as well as to accounts where some detrimental change in payment behaviour has been noticed or certain thresholds have been exceeded by Telstra Enterprise and Telstra InfraCo customers)
• a hybrid of the portfolio approach and individual assessment (applied mostly to balances arising from Telstra Enterprise customer contracts).
Under the portfolio approach, receivables and contract assets are grouped based on shared credit risk characteristics, such as:
• account status (services still active or not)• customers’ payment history • the days past due.
Contract assets relate to the transferred goods and services where a valid invoice is yet to be issued to the customer and have substantially the same risk characteristics as the trade receivables for the same types of contracts. Therefore, the expected loss rates for trade receivables are a reasonable approximation of the loss rates for the contract assets.
Under a hybrid approach, accounts with an increased risk defined by balance, age or insolvency are assessed individually and any resulting impairment amount is recognised in lieu of the provision calculated using the portfolio approach for that particular account.
In Telstra Wholesale (part of Telstra InfraCo segment), the combination of the industry default rate corresponding to Standard & Poor’s BB credit risk rating and the individual approach is used to arrive at the provision amount.
Our provision rates for trade receivables and contract assets where a portfolio approach is applied range from 0.2 per cent for balances not past due to 91.0 per cent for balances where the payment is overdue by more than 90 days and the customer’s services have been deactivated.
Estimating allowance for
doubtful debts
We apply management judgement to estimate the allowance for doubtful debts for our trade and other receivables measured at amortised cost and for contract assets. The calculation is adjusted for forward looking factors where relevant.
Our analysis shows that overall macroeconomic factors, such as unemployment rates, interest rates or gross domestic product have no strong correlations with our bad debt losses and thus, do not have a significant impact on estimating the allowance for doubtful debts.
For trade receivables and contract assets arising from our Telstra Consumer and Small Business and Telstra Enterprise Australian customers, we have implemented a scenario based approach incorporating base, good and bad economic scenarios. The overall impairment is calculated as a weighted average of the three scenarios.
Section 3 - Our Core Assets and Working Capital.fm Page 115 Tuesday, August 27, 2019 8:25 AM

Telstra Corporation Limited and controlled entities | 115
Notes to the financial statements (continued) Telstra Financial Report 2019Telstra Financial Report 2019Notes to the financial statements (continued) Telstra Financial Report 2019
Section 3. Our core assets and working capital (continued)
Telstra Corporation Limited and controlled entities | 115
3.3 Trade and other receivables and contract assets (continued)3.3.1 Current and non-current trade and other receivables and contract assets (continued)
(a) Finance lease receivables
We enter into finance lease arrangements predominantly for communication assets dedicated to solutions management that we provide to our customers largely in a back-to-back finance lease arrangement. Refer to note 7.4 for information about our finance lease commitments arising from these finance arrangements (Telstra as a lessee). The weighted average remaining term of the finance lease in our customer contracts is 5 years (2018: 6 years).
Table B presents detailed information about our finance lease receivables.
Table B As at 30 June
Telstra Group 2019 2018
$m $mAmounts receivable under finance leasesWithin 1 year 109 115Within 1 to 5 years 125 183After 5 years 54 73Total minimum lease receivables 288 371Less: unearned finance income (36) (70)Present value of minimum lease receivables 252 301
Included in the financial statements asCurrent finance lease receivables 99 108Non-current finance lease receivables 153 193
252 301
The interest rate implicit in the leases is fixed at the contract date for the entire lease term. The average effective interest rate was 5.0 per cent (2018: 5.3 per cent) per annum.
(b) Impairment of trade and other receivables and contract assets
Trade and other receivables and contract assets are exposed to customers’ credit risk and are subject to impairment assessment.
If a credit loss is expected, an allowance for doubtful debt is raised to reduce the carrying amount of trade and other receivables and contract assets based on a review of outstanding amounts at a reporting date.
A credit loss is a shortfall between the cash flows that are due in accordance with the contract and the cash flows that we expect to receive, discounted at the original effective interest rate. The estimated expected credit loss is calculated using one of the following approaches:
• a portfolio approach based on historical credit loss experience (mostly applied to balances arising from our consumer and small business customer contracts)
• an individual account by account assessment based on past credit history, knowledge of debtor’s financial situation or other known credit risk (applied to balances arising from contracts with large corporate and government customers as well as to accounts where some detrimental change in payment behaviour has been noticed or certain thresholds have been exceeded by Telstra Enterprise and Telstra InfraCo customers)
• a hybrid of the portfolio approach and individual assessment (applied mostly to balances arising from Telstra Enterprise customer contracts).
Under the portfolio approach, receivables and contract assets are grouped based on shared credit risk characteristics, such as:
• account status (services still active or not)• customers’ payment history • the days past due.
Contract assets relate to the transferred goods and services where a valid invoice is yet to be issued to the customer and have substantially the same risk characteristics as the trade receivables for the same types of contracts. Therefore, the expected loss rates for trade receivables are a reasonable approximation of the loss rates for the contract assets.
Under a hybrid approach, accounts with an increased risk defined by balance, age or insolvency are assessed individually and any resulting impairment amount is recognised in lieu of the provision calculated using the portfolio approach for that particular account.
In Telstra Wholesale (part of Telstra InfraCo segment), the combination of the industry default rate corresponding to Standard & Poor’s BB credit risk rating and the individual approach is used to arrive at the provision amount.
Our provision rates for trade receivables and contract assets where a portfolio approach is applied range from 0.2 per cent for balances not past due to 91.0 per cent for balances where the payment is overdue by more than 90 days and the customer’s services have been deactivated.
Estimating allowance for
doubtful debts
We apply management judgement to estimate the allowance for doubtful debts for our trade and other receivables measured at amortised cost and for contract assets. The calculation is adjusted for forward looking factors where relevant.
Our analysis shows that overall macroeconomic factors, such as unemployment rates, interest rates or gross domestic product have no strong correlations with our bad debt losses and thus, do not have a significant impact on estimating the allowance for doubtful debts.
For trade receivables and contract assets arising from our Telstra Consumer and Small Business and Telstra Enterprise Australian customers, we have implemented a scenario based approach incorporating base, good and bad economic scenarios. The overall impairment is calculated as a weighted average of the three scenarios.
Section 3 - Our Core Assets and Working Capital.fm Page 115 Tuesday, August 27, 2019 8:25 AM

116 | Telstra Corporation Limited and controlled entities
Notes to the financial statements (continued)Notes to the financial statements (continued)
Section 3. Our core assets and working capital (continued)
116 | Telstra Corporation Limited and controlled entities
3.3 Trade and other receivables and contract assets (continued)3.3.1 Current and non-current trade and other receivables and contract assets (continued)
(b) Impairment of trade and other receivables and contract assets (continued)
The ageing analysis and loss allowance in relation to our trade receivables from contacts with customers, finance lease receivables and contract assets where the impairment allowance is calculated using a simplified approach (i.e. based on the probability of default over the lifetime of the financial asset and loss given default) are detailed in Table C.
Table C As at 30 June 2019
Telstra Group Gross Allow-ance
$m $mNot past due, including:- measured at amortised cost 3,008 (13)- measured at fair value 1,506 -
4,514 (13)Past due 1 - 30 days 481 (2)Past due 31 - 60 days 138 (4)Past due 61 - 90 days 86 (5)Past 91 days 125 (119)
5,344 (143)
Ageing analysis in Table C is based on the original due date of trade receivables, including where repayment terms for certain long outstanding trade receivables have been renegotiated. We have not presented the comparatives as allowed under the transition requirements to the new impairment measurement principles that we adopted as at 1 July 2018.
Contract assets are not yet due for collection, thus the entire balance has been included in the ‘not past due’ category.
Other receivables and accrued revenue totalling $971 million (2018: $855 million) are subject to impairment assessment under the general approach and include 72 per cent (2018: 70 per cent) of balances with an external credit rating of AA or above.
We hold security for a number of trade receivables, including past due or impaired receivables, in the form of guarantees, letters of credit and deposits. During the financial year 2019, no securities were called upon. These trade receivables, along with our trade receivables that are neither past due nor impaired, comprise customers who have a good debt history and are considered recoverable. Further, we limit our exposure to credit risk from trade receivables by establishing a maximum payment period and, in certain instances, cease providing further services after 90 days from the past due date.
Movements in the allowance for doubtful debts in respect of our trade and other receivables and contracts assets are detailed in Table D.
Table D Year ended 30 June
Telstra Group 2019 2018
$m $mOpening balance (103) (133)Change in accounting policy arising from AASB 9: 'Financial instruments' (89) -
Restated opening balance (192) (133)Additional allowance (45) (48)Amount used 35 49Amount reversed 50 29Closing balance (152) (103)
The total allowance in Table D includes the allowance for all types of trade and other receivables and contract assets, regardless of the method used in assessing the allowance. Impairment allowance related to accrued revenue and other receivables (not presented in Table C) amounted to $9 million.
3.3.2 Recognition and measurement
Trade and other receivables and contract assets are financial assets.
Trade and other receivables are initially recorded at fair value and subsequently measured at amortised cost using the effective interest method, with the exception of certain trade receivables from contracts with customers, which are subsequently measured at fair value. Refer to note 4.4.5 for further details on trade receivables from contracts with customers measured at fair value.
Contract assets arise from our contracts with customers and are initially recorded at the transaction price allocated as compensation for goods or services provided to customers for which the right to collect payment is subject to providing other goods or services under the same contract (or group of contracts) and/or we are yet to issue a valid invoice. Contract assets are subsequently measured to reflect relevant transaction price adjustments (where required) and are transferred to trade receivables when the right to payment becomes unconditional, i.e. when the other goods or services under the same contract (or group of contracts) have been transferred and/or a valid invoice has been issued.
(a) Lease receivables (Telstra as a lessor)
Refer to note 3.1.2 (c) for details about whether an arrangement contains a lease and the distinction between finance leases and operating leases.
Where we lease assets via a finance lease, a lease receivable is recognised at the beginning of the lease term and measured at the present value of the minimum lease payments receivable plus the present value of any unguaranteed residual value expected to accrue at the end of the lease term.
Finance lease receipts are allocated between finance income and a reduction of the lease receivable over the term of the lease in order to reflect a constant periodic rate of return on the net investment outstanding in respect of the lease.
Income from operating leases is recognised on a straight-line basis over the term of the relevant lease.
Section 3 - Our Core Assets and Working Capital.fm Page 116 Tuesday, August 27, 2019 8:25 AM
Notes to the financial statements (continued) Telstra Financial Report 2019
Section 3. Our core assets and working capital (continued)
Telstra Corporation Limited and controlled entities | 117
3.3 Trade and other receivables and contract assets (continued)3.3.2 Recognition and measurement (continued)
(b) Impairment of financial assets
We estimate the expected credit losses for our financial assets (including contract assets) measured at amortised cost on either of the following basis:
• a general approach, i.e. 12-month expected credit loss which results from all possible default events within the 12 months after the reporting date (applicable to accrued revenue and other receivables), or
• a simplified approach, i.e. lifetime expected credit loss which results from all possible default events over the expected life of a financial instrument (applicable to trade receivables from contracts with customer, contract assets and lease receivables).
If the credit risk of a financial asset at the reporting date has increased significantly since its initial recognition, loss allowance is calculated based on lifetime expected credit losses, rather than 12 months.
Any customer account with debt more than 90 days past due is considered to be in default.
Trade receivables and contract assets are written off against the allowance for doubtful debts or directly against their carrying amounts and expensed in the income statement when all collection efforts have been exhausted and the financial asset is considered uncollectable. Factors indicating there is no reasonable expectation of recovery include insolvency and significant time period since the last invoice was issued.
3.4 Inventories
Telstra Group As at 30 June
2019 2018 Restated
$m $mCurrentGoods for resale 369 422Raw materials and network inventory 72 55Right to recover products 7 15
448 492Non-currentNetwork inventory 35 19
35 19
Our inventory includes goods available for sale, materials, consumables and spare parts to be used within one year in constructing and maintaining our telecommunications network. We also purchase strategic inventories for use in maintenance of network assets beyond one year.
Right to recover products arises from sale with a right of return under certain contracts with customers as described in note 3.5.1.
3.4.1 Recognition and measurement
Inventories are valued at the lower of cost and net realisable value. For the majority of inventory items, we assign cost using the weighted average cost basis.
Net realisable value of items expected to be sold is the estimated selling price less estimated costs of completion and the estimated costs incurred in marketing, selling and distribution. It approximates fair value less costs to sell.
Estimating net realisable value
At the reporting date, we applied management judgement to determine net realisable value of inventories by making certain price assumptions to project selling prices into the future. We also made assumptions about current and future technologies.
Net realisable value of items expected to be consumed, for example used in the construction of another asset, is the net value expected to be earned through future use.
3.5 Trade and other payables
Telstra Group As at 30 June
2019 2018 Restated
$m $mCurrentTrade payables 849 1,588Accrued expenses 2,163 1,886Accrued capital expenditure 239 341Accrued interest 267 260Contingent consideration - 4Refund liabilities 11 37Other payables 999 412
4,528 4,528Non-currentOther payables 68 65
68 65
Trade payables and other payables are non-interest bearing liabilities. Our payment terms vary, however payments are generally made within 30 days to 90 days from the invoice date.
From time to time, Telstra’s suppliers utilise supply chain finance, i.e. they transfer their rights of the amounts due from Telstra to third parties. However, Telstra’s obligation is to pay for goods and services purchased from our suppliers on the original due date without any change in payment terms. As at 30 June 2019, the amount payable under this arrangement was $593 million (2018: $42 million) and we have reclassified it from ‘Trade payables’ to ‘Other payables’.
3.5.1 Recognition and measurement
Trade and other payables, including accruals, are recorded when we are required to make future payments as a result of purchases of assets or services. Trade and other payables are financial liabilities initially recognised at fair value and carried at amortised cost using the effective interest method.
Section 3 - Our Core Assets and Working Capital.fm Page 117 Tuesday, August 27, 2019 8:25 AM

Telstra Corporation Limited and controlled entities | 117
Notes to the financial statements (continued) Telstra Financial Report 2019Telstra Financial Report 2019Notes to the financial statements (continued) Telstra Financial Report 2019
Section 3. Our core assets and working capital (continued)
Telstra Corporation Limited and controlled entities | 117
3.3 Trade and other receivables and contract assets (continued)3.3.2 Recognition and measurement (continued)
(b) Impairment of financial assets
We estimate the expected credit losses for our financial assets (including contract assets) measured at amortised cost on either of the following basis:
• a general approach, i.e. 12-month expected credit loss which results from all possible default events within the 12 months after the reporting date (applicable to accrued revenue and other receivables), or
• a simplified approach, i.e. lifetime expected credit loss which results from all possible default events over the expected life of a financial instrument (applicable to trade receivables from contracts with customer, contract assets and lease receivables).
If the credit risk of a financial asset at the reporting date has increased significantly since its initial recognition, loss allowance is calculated based on lifetime expected credit losses, rather than 12 months.
Any customer account with debt more than 90 days past due is considered to be in default.
Trade receivables and contract assets are written off against the allowance for doubtful debts or directly against their carrying amounts and expensed in the income statement when all collection efforts have been exhausted and the financial asset is considered uncollectable. Factors indicating there is no reasonable expectation of recovery include insolvency and significant time period since the last invoice was issued.
3.4 Inventories
Telstra Group As at 30 June
2019 2018 Restated
$m $mCurrentGoods for resale 369 422Raw materials and network inventory 72 55Right to recover products 7 15
448 492Non-currentNetwork inventory 35 19
35 19
Our inventory includes goods available for sale, materials, consumables and spare parts to be used within one year in constructing and maintaining our telecommunications network. We also purchase strategic inventories for use in maintenance of network assets beyond one year.
Right to recover products arises from sale with a right of return under certain contracts with customers as described in note 3.5.1.
3.4.1 Recognition and measurement
Inventories are valued at the lower of cost and net realisable value. For the majority of inventory items, we assign cost using the weighted average cost basis.
Net realisable value of items expected to be sold is the estimated selling price less estimated costs of completion and the estimated costs incurred in marketing, selling and distribution. It approximates fair value less costs to sell.
Estimating net realisable value
At the reporting date, we applied management judgement to determine net realisable value of inventories by making certain price assumptions to project selling prices into the future. We also made assumptions about current and future technologies.
Net realisable value of items expected to be consumed, for example used in the construction of another asset, is the net value expected to be earned through future use.
3.5 Trade and other payables
Telstra Group As at 30 June
2019 2018 Restated
$m $mCurrentTrade payables 849 1,588Accrued expenses 2,163 1,886Accrued capital expenditure 239 341Accrued interest 267 260Contingent consideration - 4Refund liabilities 11 37Other payables 999 412
4,528 4,528Non-currentOther payables 68 65
68 65
Trade payables and other payables are non-interest bearing liabilities. Our payment terms vary, however payments are generally made within 30 days to 90 days from the invoice date.
From time to time, Telstra’s suppliers utilise supply chain finance, i.e. they transfer their rights of the amounts due from Telstra to third parties. However, Telstra’s obligation is to pay for goods and services purchased from our suppliers on the original due date without any change in payment terms. As at 30 June 2019, the amount payable under this arrangement was $593 million (2018: $42 million) and we have reclassified it from ‘Trade payables’ to ‘Other payables’.
3.5.1 Recognition and measurement
Trade and other payables, including accruals, are recorded when we are required to make future payments as a result of purchases of assets or services. Trade and other payables are financial liabilities initially recognised at fair value and carried at amortised cost using the effective interest method.
Section 3 - Our Core Assets and Working Capital.fm Page 117 Tuesday, August 27, 2019 8:25 AM

118 | Telstra Corporation Limited and controlled entities
Notes to the financial statements (continued)Notes to the financial statements (continued)
Section 3. Our core assets and working capital (continued)
118 | Telstra Corporation Limited and controlled entities
3.5 Trade and other payables (continued)3.5.1 Recognition and measurement (continued)
Some of our contracts with customers include a right of return, where the customer can return certain devices for specified reasons. Where this is the case, at contract inception we restrict the revenue recognised to the amounts of consideration we expect to be entitled to, i.e. we exclude the estimated refund amount. At the same time, we also recognise a refund liability (representing our obligation to provide a refund for the returned products), a right to recover products (presented as an inventory item and representing the estimate of the carrying value of the products to be recovered from customers) and a corresponding adjustment to the cost of sales. At each reporting period, we remeasure the refund liability (with a corresponding adjustment to revenue) and update the measurement of the right to recover products where required.
3.6 Contract liabilities and other revenue received in advanceContract liabilities arise from our contracts with customers and represent amounts paid (or due) to us by customers before receiving the goods and/or services promised under the contract.
We also recognise revenue received in advance for consideration received upfront under contracts giving rise to revenue from other sources or other income, for example from nbn disconnection fees or from sale of assets.
Table A presents customer payments received in advance under different types of our commercial arrangements.
Table A As at 30 June
Telstra Group 2019 2018 Restated
Note $m $m
Current
Contract liabilities 3.7 1,431 1,312
Other revenue received in advance 226 220
1,657 1,532
Non-current
Contract liabilities 3.7 1,006 1,316
Other revenue received in advance 265 365
1,271 1,681
3.7 Trade receivables from customer contracts, contract assets and contract liabilities3.7.1 Recognition of trade receivables, contract assets and contract liabilities
Trade receivables, contract assets and contract liabilities arise from our contracts with customers described in note 2.2.1.
The relationship between our performance and the customer’s payment will determine if trade receivables, contract assets or contract liabilities are recognised.
The timing of revenue recognition may differ from customer invoicing. Trade receivables from contracts with customers (refer note 3.3.1) represent an unconditional right to receive consideration (primarily cash), which normally arises when the goods and services promised to the customer have been transferred and/or a valid invoice has been issued.
By contrast, contract assets mainly refer to amounts allocated as consideration for goods or services provided to customers for which the right to collect payment is subject to providing other goods or services under the same contract (or group of contracts) and/or we are yet to issue a valid invoice.
Contract liabilities represent amounts paid (or due) to us by customers before receiving the goods and/or services promised in the contract.
Contract assets and contract liabilities also arise due to timing differences between invoicing and recognition of certain discounts, credits or other incentives, including those arising from our framework agreements. These items adjust revenue recognised in a given period but they can be invoiced upfront, over the contract term or when certain performance conditions have been met.
Customer contract assets and liabilities are presented, respectively, in current and non-current assets and current and non-current liabilities based on the amounts expected to be collected or recognised as revenue within or after 12 months from the reporting period end.
In general, we invoice customers in advance for services provided under our prepaid or fixed (usually monthly) fee contracts and in arrears for usage based contracts (e.g. carriage services under enterprise contracts) or excess charges in mass market contracts. In those cases we would recognise a contract liability and a contract asset respectively.
Under our mobile mass market long-term plans which offer a bundle of hardware and services, the customer enters into two separate legal contracts. Where these are combined for revenue recognition, we recognise a trade receivable for the device payment contract under which we have an unconditional right to payment despite the deferred payment terms resulting in invoicing over the extended term.
Under some of our fixed mass market long-term contracts, we also offer a bundle of hardware (delivered upfront) and services (delivered over the contract term). In this case, the excess of the amount allocated to the hardware over the amount invoiced at the time is recognised as a contract asset and transferred to trade receivables as the service is invoiced, i.e. under this legal contract our right to consideration is conditional on transfer of future services.
Under some of our fixed mass market plans, wholesale and enterprise arrangements, we charge upfront connection or other fees for contract fulfilment activities, which represent transaction price adjustments and at the time give rise to a contract liability given they have been collected before the goods and services have been transferred.
We also recognise a contract liability for our domestic and international network capacity arrangements, under which we receive upfront payments in advance of services which will be provided over an average contract term between 10 and 33 years.
Section 3 - Our Core Assets and Working Capital.fm Page 118 Tuesday, August 27, 2019 8:25 AM
Notes to the financial statements (continued) Telstra Financial Report 2019
Section 3. Our core assets and working capital (continued)
Telstra Corporation Limited and controlled entities | 119
3.7 Trade receivables from customer contracts, contract assets and contract liabilities (continued)3.7.2 Movements in net contract assets and contract liabilities
Our billing arrangements for goods and services as well as different types of discounts, credits or other incentives can vary depending on the type and nature of the contracts with customers. As a result, at times under the same accounting contract, we may recognise both a contract asset and a contract liability. At each reporting period, any balances arising from the same accounting contract are presented net in the statement of financial position as either a net contract asset or a net contract liability.
The net presentation mainly impacts our small business and enterprise framework arrangements offering loyalty programs and technology funds, and nbn DAs, where multiple legal contracts have been combined as one accounting contract.
Table A presents opening and closing balances of our current and non-current contract assets and contract liabilities and their total net movement for the period.
Table A As at 30 June As at
Telstra Group 2019 2018 Restated
1 July 2017
Restated
$m $m $mCurrent contract assets 1,188 1,446 1,213Non-current contract assets 137 113 54
Total contract assets 1,325 1,559 1,267Current contract liabilities 1,431 1,312 1,170Non-current contract liabilities 1,006 1,316 1,271
Total contract liabilities 2,437 2,628 2,441Total net contract (liabilities) (1,112) (1,069) (1,174)
(Decrease) / increase in net contract (liabilities) for the year
(43) 105 n/a
Generally, contract assets increase when we recognise revenue for goods and services transferred to the customer in advance of their invoicing and decrease when we invoice customers for goods and services provided previously (i.e. when contract assets are transferred to trade receivables).
On the other hand, contract liabilities increase when we receive consideration in advance of transferring the goods and services to the customer, and decrease when we recognise revenue for the goods and services previously prepaid by the customer.
Other changes in our contract assets and contract liabilities represent movements resulting from changes in the transaction prices due to timing of invoicing and recognition of discounts, credits and other incentives.
As at 30 June 2019, the net contract liabilities amounted to $1,112 million (2018: $1,069 million). The following selected movements contributed to the overall increase of $43 million (2018: $105 million decrease) in the net contract liabilities:
• $1,521 million (2018: $1,364 million) revenue recognised in the reporting period that was included in the contract liabilities balance at the beginning of the period
• $42 million (2018: $44 million) cumulative catch-up adjustments to revenue recognised in the prior reporting periods.
Refer to note 3.3.1 for details regarding impairment assessment and related movements in contract assets.
Section 3 - Our Core Assets and Working Capital.fm Page 119 Tuesday, August 27, 2019 8:25 AM

Telstra Corporation Limited and controlled entities | 119
Notes to the financial statements (continued) Telstra Financial Report 2019Telstra Financial Report 2019Notes to the financial statements (continued) Telstra Financial Report 2019
Section 3. Our core assets and working capital (continued)
Telstra Corporation Limited and controlled entities | 119
3.7 Trade receivables from customer contracts, contract assets and contract liabilities (continued)3.7.2 Movements in net contract assets and contract liabilities
Our billing arrangements for goods and services as well as different types of discounts, credits or other incentives can vary depending on the type and nature of the contracts with customers. As a result, at times under the same accounting contract, we may recognise both a contract asset and a contract liability. At each reporting period, any balances arising from the same accounting contract are presented net in the statement of financial position as either a net contract asset or a net contract liability.
The net presentation mainly impacts our small business and enterprise framework arrangements offering loyalty programs and technology funds, and nbn DAs, where multiple legal contracts have been combined as one accounting contract.
Table A presents opening and closing balances of our current and non-current contract assets and contract liabilities and their total net movement for the period.
Table A As at 30 June As at
Telstra Group 2019 2018 Restated
1 July 2017
Restated
$m $m $mCurrent contract assets 1,188 1,446 1,213Non-current contract assets 137 113 54
Total contract assets 1,325 1,559 1,267Current contract liabilities 1,431 1,312 1,170Non-current contract liabilities 1,006 1,316 1,271
Total contract liabilities 2,437 2,628 2,441Total net contract (liabilities) (1,112) (1,069) (1,174)
(Decrease) / increase in net contract (liabilities) for the year
(43) 105 n/a
Generally, contract assets increase when we recognise revenue for goods and services transferred to the customer in advance of their invoicing and decrease when we invoice customers for goods and services provided previously (i.e. when contract assets are transferred to trade receivables).
On the other hand, contract liabilities increase when we receive consideration in advance of transferring the goods and services to the customer, and decrease when we recognise revenue for the goods and services previously prepaid by the customer.
Other changes in our contract assets and contract liabilities represent movements resulting from changes in the transaction prices due to timing of invoicing and recognition of discounts, credits and other incentives.
As at 30 June 2019, the net contract liabilities amounted to $1,112 million (2018: $1,069 million). The following selected movements contributed to the overall increase of $43 million (2018: $105 million decrease) in the net contract liabilities:
• $1,521 million (2018: $1,364 million) revenue recognised in the reporting period that was included in the contract liabilities balance at the beginning of the period
• $42 million (2018: $44 million) cumulative catch-up adjustments to revenue recognised in the prior reporting periods.
Refer to note 3.3.1 for details regarding impairment assessment and related movements in contract assets.
Section 3 - Our Core Assets and Working Capital.fm Page 119 Tuesday, August 27, 2019 8:25 AM

120 | Telstra Corporation Limited and controlled entities
Notes to the financial statements (continued)Notes to the financial statements (continued)
Section 3. Our core assets and working capital (continued)
120 | Telstra Corporation Limited and controlled entities
3.8 Deferred contract costsCertain costs related to our contracts with customers and not accounted for under any other accounting standards are deferred in the statement of financial position and amortised on a basis consistent with the transfer of goods and services to which these costs relate.
Deferred contract costs comprise of deferred costs to obtain or fulfil an accounting customer contract. Table A provides movements in net book value of the deferred contract costs.
Table ATelstra GroupTelstra Group
Costs to obtain a contract
Costs to fulfil a contract Total deferred contract
costsCommis- sions
Set-up costs Costs of service
provider
Total costs to fulfil a contract
$m $m $m $m $mRestated net book value at 1 July 2017, including 856 56 191 247 1,103Current n/a - 106 106 106Non-current 856 56 85 141 997
Additions 639 31 576 607 1,246Amortisation expense (368) (26) (605) (631) (999)Impairment losses (101) - - - (101)Restated net book value at 30 June 2018, including 1,026 61 162 223 1,249Current n/a - 69 69 69Non-current 1,026 61 93 154 1,180
Restated net book value at 1 July 2018 1,026 61 162 223 1,249Current n/a - 69 69 69Non-current 1,026 61 93 154 1,180
Additions 553 25 586 611 1,164Amortisation expense (394) (29) (563) (592) (986)Impairment losses (100) - - - (100)Net book value at 30 June 2019, including 1,085 57 185 242 1,327Current n/a - 95 95 95Non-current 1,085 57 90 147 1,232
3.8.1 Recognition and measurement
We capitalise costs to obtain an accounting contract when the costs are incremental, i.e. would not have been incurred if the contract had not been obtained and are recoverable either directly via reimbursement by the customer or indirectly through the contract margin.
We elect to recognise the incremental costs of obtaining contracts as an expense when incurred if the amortisation period of the assets that we would have otherwise recognised would have been one year or less.
Costs to fulfil a contract are costs incurred in satisfying the performance obligations under a customer contract. These costs relate directly to an identified performance obligation or indirectly to other activities that are necessary under the contract but that do not result in a transfer of goods or services, i.e. they are fulfilment activities.
Costs to fulfil a contract include set-up costs and costs of a service provider, which represent the costs incurred in relation to services which will be transferred to our customers in the future reporting periods.
Section 3 - Our Core Assets and Working Capital.fm Page 120 Tuesday, August 27, 2019 8:25 AM
Notes to the financial statements (continued) Telstra Financial Report 2019
Section 3. Our core assets and working capital (continued)
Telstra Corporation Limited and controlled entities | 121
3.8 Deferred contract costs (continued)3.8.1 Recognition and measurement (continued)
We capitalise costs to fulfil a contract if all of the following apply:
• the costs are not required to be accounted for under another accounting standard
• the costs relate directly to a contract or a specifically identified anticipated contract (for example, costs relating to services to be provided under renewal of an existing contract)
• the costs generate or enhance resources that we control and will be used to satisfy future performance obligations under the contract
• we expect to recover the costs.
We amortise deferred contract costs over the term that reflects the expected period of benefit of the expense. This period may extend beyond the initial contract term to the estimated customer life or average customer life of the class of customers. We use the amortisation pattern consistent with the method used to measure progress and recognise revenue for the related goods or services.
We assess whether deferred contract costs are impaired whenever events or changes in circumstances indicate that the carrying amounts may not be recoverable.
Amortisation period of deferred
contract costs
We have applied management judgement to estimate the amortisation period of deferred contract costs to obtain a contract.
For sales commissions paid on acquisition of the initial contract which are not commensurate with recontracting commissions, the amortisation period reflects the average estimated customer life for respective types of contracts.
Section 3 - Our Core Assets and Working Capital.fm Page 121 Tuesday, August 27, 2019 8:25 AM
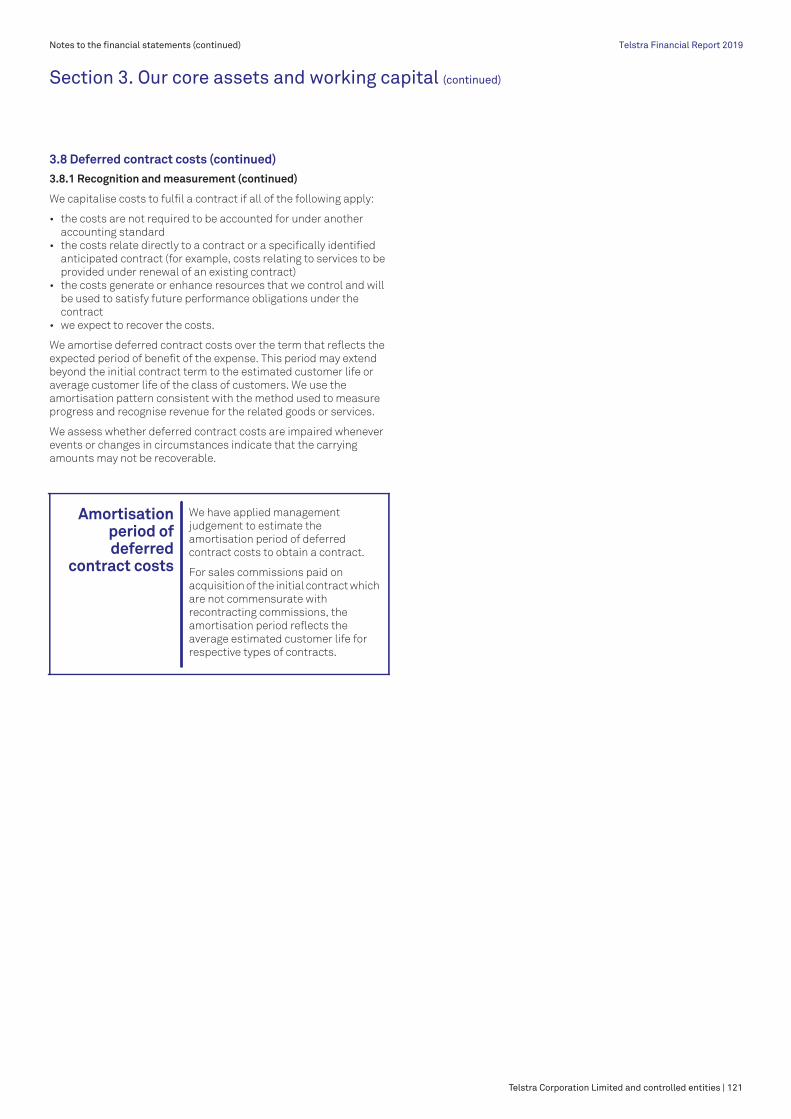
Telstra Corporation Limited and controlled entities | 121
Notes to the financial statements (continued) Telstra Financial Report 2019Telstra Financial Report 2019Notes to the financial statements (continued) Telstra Financial Report 2019
Section 3. Our core assets and working capital (continued)
Telstra Corporation Limited and controlled entities | 121
3.8 Deferred contract costs (continued)3.8.1 Recognition and measurement (continued)
We capitalise costs to fulfil a contract if all of the following apply:
• the costs are not required to be accounted for under another accounting standard
• the costs relate directly to a contract or a specifically identified anticipated contract (for example, costs relating to services to be provided under renewal of an existing contract)
• the costs generate or enhance resources that we control and will be used to satisfy future performance obligations under the contract
• we expect to recover the costs.
We amortise deferred contract costs over the term that reflects the expected period of benefit of the expense. This period may extend beyond the initial contract term to the estimated customer life or average customer life of the class of customers. We use the amortisation pattern consistent with the method used to measure progress and recognise revenue for the related goods or services.
We assess whether deferred contract costs are impaired whenever events or changes in circumstances indicate that the carrying amounts may not be recoverable.
Amortisation period of deferred
contract costs
We have applied management judgement to estimate the amortisation period of deferred contract costs to obtain a contract.
For sales commissions paid on acquisition of the initial contract which are not commensurate with recontracting commissions, the amortisation period reflects the average estimated customer life for respective types of contracts.
Section 3 - Our Core Assets and Working Capital.fm Page 121 Tuesday, August 27, 2019 8:25 AM

122 | Telstra Corporation Limited and controlled entities
Notes to the financial statements (continued)
122 | Telstra Corporation Limited and controlled entities
Notes to the financial statements (continued)
Section 4. Our capital and risk management
This section sets out the policies and procedures applied to manage our capital structure and the financial risks we are exposed to. Our total capital is defined as equity and net debt. We manage our capital structure in order to maximise shareholders’ return, maintain optimal cost of capital and provide flexibility for strategic investments.
SECTION 4. OUR CAPITAL AND RISK MANAGEMENT4.1 Dividend
We currently pay dividend to equity holders of Telstra Entity twice a year, an interim and a final dividend. Table A below provides details about dividends paid during the financial year 2019.
The Dividend Reinvestment Plan (DRP) will continue to operate for the final dividend in the financial year 2019. The election date for participation in the DRP is 30 August 2019.
On 15 August 2019, the Directors of Telstra Corporation Limited resolved to pay a fully franked final dividend for the financial year 2019 of 8 cents per ordinary share, comprising a final ordinary dividend of 5 cents and a final special dividend of 3 cents. The final dividend will be fully franked at a tax rate of 30 per cent. The record date for the final dividend will be 29 August 2019, with payment to be made on 26 September 2019. From 28 August 2019, shares will trade excluding entitlement to the dividend.
As at 30 June 2019, the final dividend for the financial year 2019 was not determined or publicly recommended by the Board, therefore no provision for the dividend has been raised in the statement of financial position. However, a provision for the final dividend payable amounting to $951 million has been raised as at the date of resolution.
There are no income tax consequences for the Telstra Group resulting from the resolution and payment of the final dividend, except for $408 million of franking debits arising from the payment of this dividend that will be adjusted in our franking account balance.
Table B provides information about franking credits available for use in subsequent reporting periods.
We believe that our current balance in the franking account, combined with the franking credits that will arise on income tax instalments expected to be paid in the financial year 2020, will be sufficient to fully frank our 2019 final dividend.
4.2 Equity
4.2.1 Share capital
This note includes dividend paid for the previous year final dividend and the current year interim dividend. From financial year 2018, our dividend comprises both ordinary and special dividends.
As the current year final dividend resolution was passed on 15 August 2019, no provision had been raised as at 30 June 2019.
Table A Year ended 30 June
Telstra Entity 2019 2018 2019 2018
$m $m cents centsPrevious year final dividend paid 1,308 1,842 11.0 15.5
Interim dividend paid 951 1,308 8.0 11.0
2,259 3,150 19.0 26.5
Table B Year ended 30 June
Telstra Group 2019 2018
$m $mFranking account balance 168 191Franking credits that will arise from the payment of income tax payable as at 30 June (at a tax rate of 30% on a tax paid basis)
87 115
255 306
This note provides information about our share capital and reserves presented in the statement of changes in equity.
We have established the Telstra Growthshare Trust (referred to as the Trust) to allocate and administer the Company's employee share schemes. The Trust is consolidated as it is controlled by us. Shares that are held within the Trust, known as treasury shares, are used to satisfy future vesting of entitlements in these employee share schemes. These treasury shares reduce our contributed equity.
Table A As at 30 June
Telstra Group 2019 2018
$m $mContributed equity 4,530 4,530Share loan to employees (10) (11)Shares held by employee share plans (50) (64)Net services received under employee share plans (23) (27)
4,447 4,428
Section 4 - Our Capital and Risk Management.fm Page 122 Tuesday, August 27, 2019 8:26 AM
Notes to the financial statements (continued) Telstra Financial Report 2019
Section 4. Our capital and risk management (continued)
Telstra Corporation Limited and controlled entities | 123
4.2 Equity (continued)4.2.1 Share capital (continued)
(a) Contributed equity
As at 30 June 2019, we have 11,893,297,855 (2018: 11,893,297,855) authorised fully paid ordinary shares on issue. Each of our fully paid ordinary shares carries the right to one vote at a meeting of the Company. Holders of our shares also have the right to receive dividends and to participate in the proceeds from sale of all surplus assets in proportion to the total shares issued in the event of the Company winding up.
(b) Shares held by employee share plans
As at 30 June 2019, the number of shares held by employee share plans totalled 10,200,395 (2018: 13,007,480).
(c) Net services received under employee share plans
We measure the fair value of services received under employee share plans by reference to the fair value of the equity instruments granted. The net services received under employee share plans represent the cumulative value of all instruments issued.
4.2.2 Reserves
Table B details our reserve balances.
The table below details the nature and purpose of our reserve balances.
Table BTelstra Group
Foreign currency transla-
tion reserve
Cash flow hedging reserve
Foreign currency
basis spread reserve
Fair value of equity instru- ments
reserve
General reserve
Total reserves
$m $m $m $m $m $mBalance at 1 July 2017 18 (143) 16 8 (4) (105)Restated other comprehensive income 52 (68) (22) 15 - (23)Transactions with non-controlling interests - - - - (3) (3)Restated balance at 30 June 2018 70 (211) (6) 23 (7) (131)Other comprehensive income 39 2 (15) 47 - 73Balance at 30 June 2019 109 (209) (21) 70 (7) (58)
Reserve Nature and purpose
Foreign currency translation reserve
Used to record exchange differences arising from the conversion of the non-Australian controlled entities’ financial statements into Australian dollars. This reserve is also used to record our percentage share of exchange differences arising from our equity accounted non-Australian investments in joint ventures and associated entities.
Cash flow hedging reserve
Represents the effective portion of gains or losses on remeasuring the fair value of hedge instruments, where a hedge qualifies for hedge accounting.
Foreign currency basis spread reserve
Used to record changes in the fair value of our derivative financial instruments attributable to movements in foreign currency basis spread. Currency basis is included in interest on borrowings in the income statement over the life of the borrowing.
Fair value of equity instruments reserve
Represents changes in fair value of equity instruments we have elected to measure at fair value through other comprehensive income.
General reserve Represents other items we have taken directly to equity.
Section 4 - Our Capital and Risk Management.fm Page 123 Tuesday, August 27, 2019 8:26 AM

Telstra Corporation Limited and controlled entities | 123
Notes to the financial statements (continued) Telstra Financial Report 2019Telstra Financial Report 2019Notes to the financial statements (continued) Telstra Financial Report 2019
Section 4. Our capital and risk management (continued)
Telstra Corporation Limited and controlled entities | 123
4.2 Equity (continued)4.2.1 Share capital (continued)
(a) Contributed equity
As at 30 June 2019, we have 11,893,297,855 (2018: 11,893,297,855) authorised fully paid ordinary shares on issue. Each of our fully paid ordinary shares carries the right to one vote at a meeting of the Company. Holders of our shares also have the right to receive dividends and to participate in the proceeds from sale of all surplus assets in proportion to the total shares issued in the event of the Company winding up.
(b) Shares held by employee share plans
As at 30 June 2019, the number of shares held by employee share plans totalled 10,200,395 (2018: 13,007,480).
(c) Net services received under employee share plans
We measure the fair value of services received under employee share plans by reference to the fair value of the equity instruments granted. The net services received under employee share plans represent the cumulative value of all instruments issued.
4.2.2 Reserves
Table B details our reserve balances.
The table below details the nature and purpose of our reserve balances.
Table BTelstra Group
Foreign currency transla-
tion reserve
Cash flow hedging reserve
Foreign currency
basis spread reserve
Fair value of equity instru- ments
reserve
General reserve
Total reserves
$m $m $m $m $m $mBalance at 1 July 2017 18 (143) 16 8 (4) (105)Restated other comprehensive income 52 (68) (22) 15 - (23)Transactions with non-controlling interests - - - - (3) (3)Restated balance at 30 June 2018 70 (211) (6) 23 (7) (131)Other comprehensive income 39 2 (15) 47 - 73Balance at 30 June 2019 109 (209) (21) 70 (7) (58)
Reserve Nature and purpose
Foreign currency translation reserve
Used to record exchange differences arising from the conversion of the non-Australian controlled entities’ financial statements into Australian dollars. This reserve is also used to record our percentage share of exchange differences arising from our equity accounted non-Australian investments in joint ventures and associated entities.
Cash flow hedging reserve
Represents the effective portion of gains or losses on remeasuring the fair value of hedge instruments, where a hedge qualifies for hedge accounting.
Foreign currency basis spread reserve
Used to record changes in the fair value of our derivative financial instruments attributable to movements in foreign currency basis spread. Currency basis is included in interest on borrowings in the income statement over the life of the borrowing.
Fair value of equity instruments reserve
Represents changes in fair value of equity instruments we have elected to measure at fair value through other comprehensive income.
General reserve Represents other items we have taken directly to equity.
Section 4 - Our Capital and Risk Management.fm Page 123 Tuesday, August 27, 2019 8:26 AM

124 | Telstra Corporation Limited and controlled entities
Notes to the financial statements (continued)Notes to the financial statements (continued)
Section 4. Our capital and risk management (continued)
124 | Telstra Corporation Limited and controlled entities
4.2 Equity (continued)4.2.3 Recognition and measurement
Issued and paid up capital is recognised at the fair value of the consideration received by the Telstra Entity.
Any transaction costs arising on the issue of ordinary shares are recognised directly in equity, net of income tax, as a reduction of the share proceeds received.
Services received under employee share plans (i.e. share-based payments) increase our share capital balance and vested employee share plans decrease the share capital balance resulting in a net movement in our equity. Non-recourse loans provided to employees to participate in these employee share plans are recorded as a reduction in share capital.
We also record the purchase of Telstra Entity shares underpinning our employee share plan as a reduction in share capital.
4.3 Capital management
4.3.1 Net debt
As part of our capital management, net debt and resulting gearing ratio are monitored.
Gearing ratio equals net debt divided by total capital, where:
• net debt equals total interest bearing financial liabilities and derivative financial instruments, less cash and cash equivalents
• total capital equals equity, as shown in the statement of financial position, plus net debt.
Net debt at 30 June 2019 was $14,727 million (2018: $14,739 million).
We undertake the following transactions when managing our net debt portfolio and associated financial risks:
• invest surplus cash in bank deposits and negotiable certificates of deposit
• issue commercial paper and have committed bank facilities in place to support working capital and short-term liquidity requirements
• issue long term debt including bank loans, private placements and public bonds both in the domestic and offshore markets
• use derivative financial instruments, including cross currency swaps, interest rate swaps and forward foreign currency contracts, to hedge foreign currency and interest rate risks.
Refer to note 4.4 for further discussion on financial risks.
Table A lists the carrying value of our net debt components.
No significant components of net debt are subject to any externally imposed capital requirements. With the exception of a minor ($13 million) breach in our subsidiary that was subsequently remedied, we did not have any defaults or breaches under any of our agreements with our lenders during the financial year 2019.
Table B summarises the key movements in net debt during the financial year and provides our gearing ratio.
This note provides information about components of our net debt and related finance costs, as well as our capital management policies.
We aim to provide returns for shareholders and benefits for other stakeholders, while:• safeguarding our ability to continue as a going concern• maintaining an optimal capital structure and cost of capital
that provides flexibility for strategic investments.
In order to maintain or adjust the capital structure, we may issue or repay debt, adjust the amount of dividend paid to shareholders, return capital to shareholders or issue new shares.
Table A As at 30 June
Telstra Group 2019 2018
$m $mBorrowings (17,253) (16,951)Derivative financial instruments 1,922 1,583Gross debt (15,331) (15,368)Cash and cash equivalents 604 629Net debt (14,727) (14,739)
Table B Year ended 30 June
Telstra Group 2019 2018 Restated
$m $mNet debt at 1 July (14,739) (15,280)Debt issuance (1,570) (718)Commercial paper (net) 537 809Revolving bank facilities (net) 200 -Debt repayments 801 862Finance lease repayments 79 120Net cash outflow 47 1,073Fair value (loss)/gain impacting:Equity (23) (128)Other expenses (10) 15Finance costs 19 40Other non-cash movementsFinance leases (5) (143)Total non-cash movements (19) (216)Total decrease in gross debt excluding bank overdraft 28 857
Net decrease in cash and cash equivalents net of bank overdraft (includes effects of foreign exchange rate changes)
(16) (316)
Total decrease in net debt 12 541Net debt at 30 June (14,727) (14,739)
Total equity (14,530) (14,619)Total capital (29,257) (29,358)
% %Gearing ratio 50.3% 50.2%
Section 4 - Our Capital and Risk Management.fm Page 124 Tuesday, August 27, 2019 8:26 AM
Notes to the financial statements (continued) Telstra Financial Report 2019
Section 4. Our capital and risk management (continued)
Telstra Corporation Limited and controlled entities | 125
4.3 Capital management (continued)4.3.1 Net debt (continued)
(a) Borrowings and repayment of debt
During the financial year 2019, we repaid $801 million of term debt (Australian dollar equivalent). This included:
• $500 million Australian dollar bond• $252 million Swiss franc bond• $10 million Australian dollar private placements.
We also repaid $9 million loans from associated entities and other loans of $30 million. The above also includes the cash settlement of derivative financial instruments, where applicable.
Debt issuance for the year of $1,570 million (Australian dollar equivalent), comprised:
• 10-year €600 million Euro bond ($959 million Australian dollar equivalent)
• 7-year $300 million bilateral facility • 1-year $300 million Australian dollar floating rate note• $11 million loans held by controlled entities.
At 30 June 2019, we have nil (2018: $200 million) drawn under our revolving bank facilities. All tranches drawn during the period have been repaid. Drawings under our bank facilities and commercial paper issues are shown on a gross basis in the statement of cash flows.
4.3.2 Borrowings
Table C details the carrying and fair values of borrowings included in the statement of financial position.
Table C As at 30 June 2019 As at 30 June 2018
Telstra Group Carrying value
Fair value Carrying value
Fair value
$m $m $m $mCurrent borrowingsDomestic borrowings (362) (366) (541) (543)Offshore borrowings (1,639) (1,696) (315) (315)Bank loans (4) (4) (2) (2)Bank overdraft - - (9) (9)Commercial paper (139) (139) (677) (684)Finance leases (78) (78) (91) (91)
(2,222) (2,283) (1,635) (1,644)Non-current borrowingsDomestic borrowings (2,123) (2,339) (2,182) (2,373)Offshore borrowings (11,885) (12,703) (12,147) (12,779)Bank loans (810) (852) (713) (735)Finance leases (213) (213) (274) (274)
(15,031) (16,107) (15,316) (16,161)Total borrowings (17,253) (18,390) (16,951) (17,805)
Section 4 - Our Capital and Risk Management.fm Page 125 Tuesday, August 27, 2019 8:26 AM

Telstra Corporation Limited and controlled entities | 125
Notes to the financial statements (continued) Telstra Financial Report 2019Telstra Financial Report 2019Notes to the financial statements (continued) Telstra Financial Report 2019
Section 4. Our capital and risk management (continued)
Telstra Corporation Limited and controlled entities | 125
4.3 Capital management (continued)4.3.1 Net debt (continued)
(a) Borrowings and repayment of debt
During the financial year 2019, we repaid $801 million of term debt (Australian dollar equivalent). This included:
• $500 million Australian dollar bond• $252 million Swiss franc bond• $10 million Australian dollar private placements.
We also repaid $9 million loans from associated entities and other loans of $30 million. The above also includes the cash settlement of derivative financial instruments, where applicable.
Debt issuance for the year of $1,570 million (Australian dollar equivalent), comprised:
• 10-year €600 million Euro bond ($959 million Australian dollar equivalent)
• 7-year $300 million bilateral facility • 1-year $300 million Australian dollar floating rate note• $11 million loans held by controlled entities.
At 30 June 2019, we have nil (2018: $200 million) drawn under our revolving bank facilities. All tranches drawn during the period have been repaid. Drawings under our bank facilities and commercial paper issues are shown on a gross basis in the statement of cash flows.
4.3.2 Borrowings
Table C details the carrying and fair values of borrowings included in the statement of financial position.
Table C As at 30 June 2019 As at 30 June 2018
Telstra Group Carrying value
Fair value Carrying value
Fair value
$m $m $m $mCurrent borrowingsDomestic borrowings (362) (366) (541) (543)Offshore borrowings (1,639) (1,696) (315) (315)Bank loans (4) (4) (2) (2)Bank overdraft - - (9) (9)Commercial paper (139) (139) (677) (684)Finance leases (78) (78) (91) (91)
(2,222) (2,283) (1,635) (1,644)Non-current borrowingsDomestic borrowings (2,123) (2,339) (2,182) (2,373)Offshore borrowings (11,885) (12,703) (12,147) (12,779)Bank loans (810) (852) (713) (735)Finance leases (213) (213) (274) (274)
(15,031) (16,107) (15,316) (16,161)Total borrowings (17,253) (18,390) (16,951) (17,805)
Section 4 - Our Capital and Risk Management.fm Page 125 Tuesday, August 27, 2019 8:26 AM
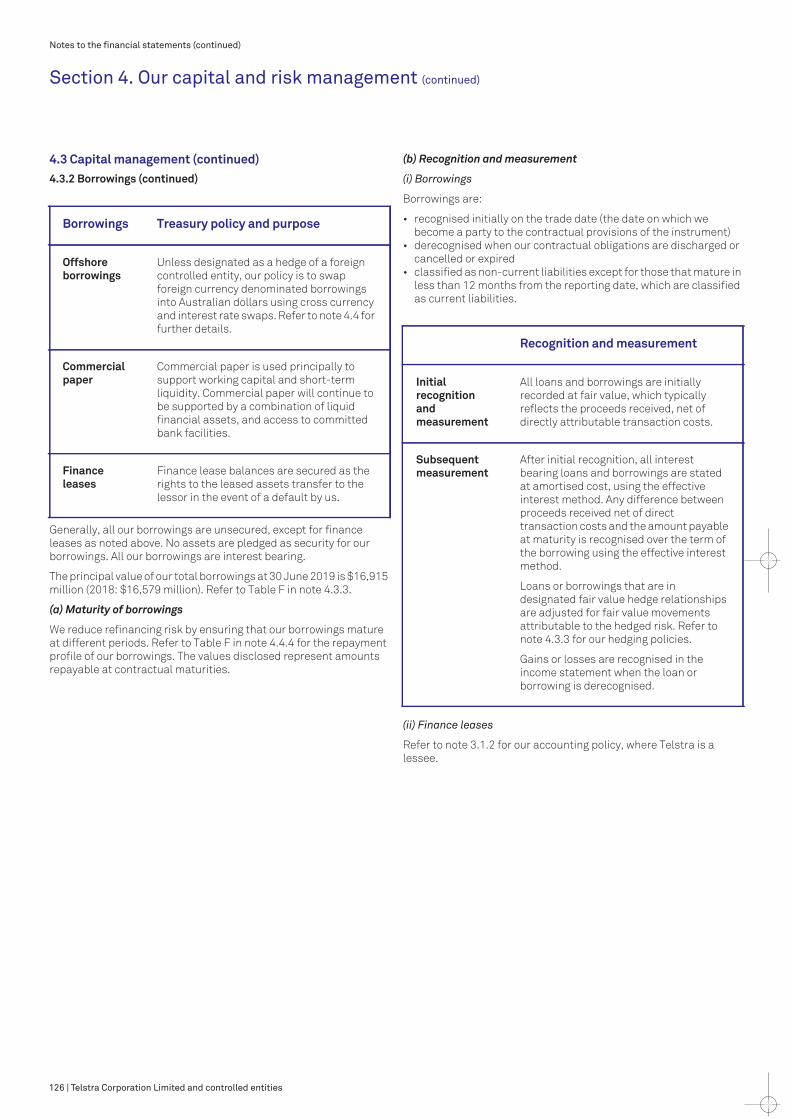
126 | Telstra Corporation Limited and controlled entities
Notes to the financial statements (continued)Notes to the financial statements (continued)
Section 4. Our capital and risk management (continued)
126 | Telstra Corporation Limited and controlled entities
4.3 Capital management (continued)4.3.2 Borrowings (continued)
Generally, all our borrowings are unsecured, except for finance leases as noted above. No assets are pledged as security for our borrowings. All our borrowings are interest bearing.
The principal value of our total borrowings at 30 June 2019 is $16,915 million (2018: $16,579 million). Refer to Table F in note 4.3.3.
(a) Maturity of borrowings
We reduce refinancing risk by ensuring that our borrowings mature at different periods. Refer to Table F in note 4.4.4 for the repayment profile of our borrowings. The values disclosed represent amounts repayable at contractual maturities.
(b) Recognition and measurement
(i) Borrowings
Borrowings are:
• recognised initially on the trade date (the date on which we become a party to the contractual provisions of the instrument)
• derecognised when our contractual obligations are discharged or cancelled or expired
• classified as non-current liabilities except for those that mature in less than 12 months from the reporting date, which are classified as current liabilities.
(ii) Finance leases
Refer to note 3.1.2 for our accounting policy, where Telstra is a lessee.
Borrowings Treasury policy and purpose
Offshore borrowings
Unless designated as a hedge of a foreign controlled entity, our policy is to swap foreign currency denominated borrowings into Australian dollars using cross currency and interest rate swaps. Refer to note 4.4 for further details.
Commercial paper
Commercial paper is used principally to support working capital and short-term liquidity. Commercial paper will continue to be supported by a combination of liquid financial assets, and access to committed bank facilities.
Finance leases
Finance lease balances are secured as the rights to the leased assets transfer to the lessor in the event of a default by us.
Recognition and measurement
Initial recognition and measurement
All loans and borrowings are initially recorded at fair value, which typically reflects the proceeds received, net of directly attributable transaction costs.
Subsequent measurement
After initial recognition, all interest bearing loans and borrowings are stated at amortised cost, using the effective interest method. Any difference between proceeds received net of direct transaction costs and the amount payable at maturity is recognised over the term of the borrowing using the effective interest method.
Loans or borrowings that are in designated fair value hedge relationships are adjusted for fair value movements attributable to the hedged risk. Refer to note 4.3.3 for our hedging policies.
Gains or losses are recognised in the income statement when the loan or borrowing is derecognised.
Section 4 - Our Capital and Risk Management.fm Page 126 Tuesday, August 27, 2019 8:26 AM
Notes to the financial statements (continued) Telstra Financial Report 2019
Section 4. Our capital and risk management (continued)
Telstra Corporation Limited and controlled entities | 127
4.3 Capital management (continued)4.3.2 Borrowings (continued)
(c) Finance costs
Table D presents our net finance costs for the year ended 30 June 2019. Interest on borrowings are net amounts after offsetting interest income and interest expense on associated derivative instruments. Our hedging strategies are discussed further in note 4.3.3.
Net gains on financial instruments included in remeasurements comprise unrealised valuation impacts on our borrowings and derivatives which are recorded in the income statement. These include net unrealised gains or losses which arise from changes in the fair value of derivative financial instruments to the extent that hedge accounting is not achieved or is not effective. These fair values increase or decrease because of changes in financial indices and prices over which we have no control.
Table D Year ended 30 June
Telstra Group 2019 2018 Restated
$m $mInterest income on cash, loans and finance lease receivable (33) (48)
Finance income from contracts with customers (197) (166)
Net interest income on defined benefit plan (8) (4)
Total finance income (238) (218)Interest expense on:Domestic borrowings 128 151Offshore borrowings 564 537Bank loans 46 31Commercial paper 23 30Finance leases 21 17Other 10 11Gross borrowing costs 792 777Finance costs from contracts with customers 217 182
Net gains on financial instruments included in remeasurements (36) (52)
181 130Interest capitalised (105) (101)Total finance costs 868 806Net finance costs 630 588
Section 4 - Our Capital and Risk Management.fm Page 127 Tuesday, August 27, 2019 8:26 AM

Telstra Corporation Limited and controlled entities | 127
Notes to the financial statements (continued) Telstra Financial Report 2019Telstra Financial Report 2019Notes to the financial statements (continued) Telstra Financial Report 2019
Section 4. Our capital and risk management (continued)
Telstra Corporation Limited and controlled entities | 127
4.3 Capital management (continued)4.3.2 Borrowings (continued)
(c) Finance costs
Table D presents our net finance costs for the year ended 30 June 2019. Interest on borrowings are net amounts after offsetting interest income and interest expense on associated derivative instruments. Our hedging strategies are discussed further in note 4.3.3.
Net gains on financial instruments included in remeasurements comprise unrealised valuation impacts on our borrowings and derivatives which are recorded in the income statement. These include net unrealised gains or losses which arise from changes in the fair value of derivative financial instruments to the extent that hedge accounting is not achieved or is not effective. These fair values increase or decrease because of changes in financial indices and prices over which we have no control.
Table D Year ended 30 June
Telstra Group 2019 2018 Restated
$m $mInterest income on cash, loans and finance lease receivable (33) (48)
Finance income from contracts with customers (197) (166)
Net interest income on defined benefit plan (8) (4)
Total finance income (238) (218)Interest expense on:Domestic borrowings 128 151Offshore borrowings 564 537Bank loans 46 31Commercial paper 23 30Finance leases 21 17Other 10 11Gross borrowing costs 792 777Finance costs from contracts with customers 217 182
Net gains on financial instruments included in remeasurements (36) (52)
181 130Interest capitalised (105) (101)Total finance costs 868 806Net finance costs 630 588
Section 4 - Our Capital and Risk Management.fm Page 127 Tuesday, August 27, 2019 8:26 AM

128 | Telstra Corporation Limited and controlled entities
Notes to the financial statements (continued)Notes to the financial statements (continued)
Section 4. Our capital and risk management (continued)
128 | Telstra Corporation Limited and controlled entities
4.3 Capital management (continued)4.3.3 Derivatives
Table E shows the carrying value of each class of derivative financial instruments.
The terms of a derivative contract are determined at inception, therefore any movements in the price of the underlying item over time will cause the contract value to constantly fluctuate, which is reflected in the fair value of the derivative. Derivatives which are in an asset position (i.e. the market has moved in our favour) are referred to as being ‘in the money’ and derivatives in a liability position as ‘out of the money’.
Both parties are therefore exposed to the credit quality of the counterparty. We are exposed to credit risk on derivative assets as a result of the potential failure of the counterparties to meet their contractual obligations. We do not have credit risk associated with derivatives that are out of the money.
Refer to note 4.4.3 for information about our credit risk policies.
(a) Recognition and measurement
Derivative financial instruments are:
• recognised on the date on which we commit to purchase or sell an asset or liability
• included as non-current assets or liabilities, except for those that mature in less than 12 months from the reporting date, which are classified as current assets or liabilities.
Derivatives are financial instruments that derive their value from the price of an underlying item such as interest rate, foreign currency exchange rate, credit spread or other index.
Table E As at 30 June 2019 As at 30 June 2018
Telstra Group Assets Liabilities Assets Liabilities
$m $m $m $mCurrent derivative financial instrumentsCross currency swaps 118 - 54 -Interest rate swaps 43 (54) 3 -Forward foreign exchange contracts 18 (3) 18 (1)
179 (57) 75 (1)Non-current derivative financial instrumentsCross currency swaps 1,738 (12) 1,462 (54)Interest rate swaps 345 (271) 435 (334)
2,083 (283) 1,897 (388)Total derivative financial instruments 2,262 (340) 1,972 (389)
Section 4 - Our Capital and Risk Management.fm Page 128 Tuesday, August 27, 2019 8:26 AM
Notes to the financial statements (continued) Telstra Financial Report 2019
Section 4. Our capital and risk management (continued)
Telstra Corporation Limited and controlled entities | 129
4.3 Capital management (continued)4.3.3 Derivatives (continued)
(a) Recognition and measurement (continued)
(b) Utilisation of derivatives to manage risks
We enter into derivative transactions in accordance with policies approved by the Board to manage our exposure to market risks and volatility of financial outcomes that arise as part of our normal business operations. We do not speculatively trade in derivative financial instruments.
Hedging refers to the way in which we use financial instruments, primarily derivatives, to manage our exposure to financial risks. The gain or loss on the underlying item (the ‘hedged item’) is expected to move in the opposite direction to the gain or loss on the derivative (the ‘hedging instrument’), therefore offsetting our risk position. Hedge accounting allows the matching of the gains and losses on hedged items and associated hedging instruments in the same accounting period to minimise volatility in the income statement. In order to qualify for hedge accounting, prospective hedge effectiveness testing must meet all of the following criteria:
• an economic relationship exists between the hedged item and hedging instrument
• the effect of credit risk does not dominate the value changes resulting from the economic relationship
• the hedge ratio is the same as that resulting from actual amounts of hedged items and hedging instruments for risk management.
Our major exposure to interest rate risk and foreign currency risk arises from our long-term borrowings. We also have translation foreign currency risk associated with investments in foreign operations and transactional foreign currency exposures such as purchases in foreign currencies. These risks are discussed further in note 4.4.
Recognition and measurement
Recognition and measurement
All derivatives are initially recognised at fair value and subsequently remeasured at fair value at each reporting date. Where the fair value of a derivative is positive, it is carried as an asset, and where negative, as a liability. Refer to note 4.4.5 for details on the determination of fair value.
Right to set-off We record derivative financial instruments on a net basis in our statement of financial position where we:
• have a legally recognised right to set-off the derivative asset and the derivative liability, and we intend to settle on a net basis or simultaneously
• enter into master netting arrangements relating to a number of financial instruments, have a legal right of set-off, and intend to exercise that right.
For our interest rate swaps, we do not offset the receivable or payable with the underlying financial asset or financial liability being hedged as the transactions are usually with different counterparties and are not generally settled on a net basis.
Derecognition Derivative assets are derecognised when the rights to receive cash flows from the derivative assets have expired or have been transferred and we have transferred substantially all the risks and rewards of ownership.
Derivative liabilities are derecognised when the contractual obligations are discharged, cancelled or expired.
Impact to the income statement
The method of recognising the resulting gain or loss depends on whether the derivative is designated as a hedging instrument and, if so, on the nature of the item being hedged.
Section 4 - Our Capital and Risk Management.fm Page 129 Tuesday, August 27, 2019 8:26 AM

Telstra Corporation Limited and controlled entities | 129
Notes to the financial statements (continued) Telstra Financial Report 2019Telstra Financial Report 2019Notes to the financial statements (continued) Telstra Financial Report 2019
Section 4. Our capital and risk management (continued)
Telstra Corporation Limited and controlled entities | 129
4.3 Capital management (continued)4.3.3 Derivatives (continued)
(a) Recognition and measurement (continued)
(b) Utilisation of derivatives to manage risks
We enter into derivative transactions in accordance with policies approved by the Board to manage our exposure to market risks and volatility of financial outcomes that arise as part of our normal business operations. We do not speculatively trade in derivative financial instruments.
Hedging refers to the way in which we use financial instruments, primarily derivatives, to manage our exposure to financial risks. The gain or loss on the underlying item (the ‘hedged item’) is expected to move in the opposite direction to the gain or loss on the derivative (the ‘hedging instrument’), therefore offsetting our risk position. Hedge accounting allows the matching of the gains and losses on hedged items and associated hedging instruments in the same accounting period to minimise volatility in the income statement. In order to qualify for hedge accounting, prospective hedge effectiveness testing must meet all of the following criteria:
• an economic relationship exists between the hedged item and hedging instrument
• the effect of credit risk does not dominate the value changes resulting from the economic relationship
• the hedge ratio is the same as that resulting from actual amounts of hedged items and hedging instruments for risk management.
Our major exposure to interest rate risk and foreign currency risk arises from our long-term borrowings. We also have translation foreign currency risk associated with investments in foreign operations and transactional foreign currency exposures such as purchases in foreign currencies. These risks are discussed further in note 4.4.
Recognition and measurement
Recognition and measurement
All derivatives are initially recognised at fair value and subsequently remeasured at fair value at each reporting date. Where the fair value of a derivative is positive, it is carried as an asset, and where negative, as a liability. Refer to note 4.4.5 for details on the determination of fair value.
Right to set-off We record derivative financial instruments on a net basis in our statement of financial position where we:
• have a legally recognised right to set-off the derivative asset and the derivative liability, and we intend to settle on a net basis or simultaneously
• enter into master netting arrangements relating to a number of financial instruments, have a legal right of set-off, and intend to exercise that right.
For our interest rate swaps, we do not offset the receivable or payable with the underlying financial asset or financial liability being hedged as the transactions are usually with different counterparties and are not generally settled on a net basis.
Derecognition Derivative assets are derecognised when the rights to receive cash flows from the derivative assets have expired or have been transferred and we have transferred substantially all the risks and rewards of ownership.
Derivative liabilities are derecognised when the contractual obligations are discharged, cancelled or expired.
Impact to the income statement
The method of recognising the resulting gain or loss depends on whether the derivative is designated as a hedging instrument and, if so, on the nature of the item being hedged.
Section 4 - Our Capital and Risk Management.fm Page 129 Tuesday, August 27, 2019 8:26 AM

130 | Telstra Corporation Limited and controlled entities
Notes to the financial statements (continued)Notes to the financial statements (continued)
Section 4. Our capital and risk management (continued)
130 | Telstra Corporation Limited and controlled entities
4.3 Capital management (continued)4.3.3 Derivatives (continued)
(b) Utilisation of derivatives to manage risks (continued)
To the extent permitted by Australian Accounting Standards, we formally designate and document our financial instruments by hedge type as follows:
Fair value hedges Cash flow hedges Net investment hedges
Objectives of this hedging arrangement
To hedge the exposure to changes in the fair value of borrowings which are issued at a fixed rate, or denominated in foreign currency, by converting to floating rate borrowings denominated in Australian dollars.
To hedge the exposure to changes in cash flows from borrowings that bear floating interest rates or are denominated in foreign currency. Cash flow hedging is also used to mitigate the foreign currency exposure arising from highly probable and committed future currency cash flows.
To offset the foreign exchange exposure arising from the translation of our foreign investments from their functional currency to Australian dollars.
Instruments used We enter into cross currency and interest rate swaps to mitigate our exposure to changes in the fair value of our long-term borrowings.
We enter into interest rate and cross currency swaps to hedge future cash flows arising from our borrowings.
We use forward foreign exchange contracts to hedge a portion of firm commitments and highly probable forecast transactions.
Where we choose to hedge our net investment exposures, we use forward foreign exchange contracts, cross currency swaps and/or borrowings in the relevant currency of the investment.
Economic relationships In all our hedge relationships, the critical terms of the hedging instrument and hedged item (including face values, cash flows and currency) are aligned.
Section 4 - Our Capital and Risk Management.fm Page 130 Tuesday, August 27, 2019 8:26 AM
Notes to the financial statements (continued) Telstra Financial Report 2019
Section 4. Our capital and risk management (continued)
Telstra Corporation Limited and controlled entities | 131
4.3 Capital management (continued)4.3.3 Derivatives (continued)
(b) Utilisation of derivatives to manage risks (continued)
Table F shows the carrying value and principal value of each component of our gross debt including derivative financial instruments categorised by hedge type. Principal value represents contractual obligations less future finance charges, excluding fair value remeasurements and for foreign denominated balances equates to the principal value in the underlying currency converted at the spot exchange rate as at 30 June 2019.
(i) Fair value hedges
All changes in the fair value of the underlying item relating to the hedged risk are recognised in the income statement together with the changes in the fair value of derivatives. The net difference is recorded in the income statement as ineffectiveness. The carrying value of borrowings in effective fair value hedge relationships is adjusted for gains or losses attributable to the risk(s) being hedged.
Table G outlines the cumulative amount of fair value hedge adjustments that are included in the carrying amount of borrowings in the statement of financial position.
Table H shows the ineffectiveness recognised in the income statement. We have excluded foreign currency basis spreads from our designated fair value and cash flow hedge relationships.
Table F As at 30 June 2019 As at 30 June 2018
Telstra Group Carrying value
Principal value
Carrying value
Principal value
$m $m $m $mBorrowings by hedge designationFair value hedges (4,320) (3,951) (4,751) (4,339)Cash flow hedges (9,045) (9,073) (7,766) (7,796)Not in a hedge relationship (3,597) (3,600) (4,070) (4,080)Finance leases (291) (291) (364) (364)Total borrowings (17,253) (16,915) (16,951) (16,579)Derivative assets by hedge designationFair value hedges 1,016 733 962 669Cash flow hedges 1,243 1,259 999 932Not in a hedge relationship 3 13 11 11Total derivative assets 2,262 2,005 1,972 1,612Derivative liabilities by hedge designationCash flow hedges (337) - (388) -Not in a hedge relationship (3) (11) (1) (1)Total derivative liabilities (340) (11) (389) (1)Total gross debt (15,331) (14,921) (15,368) (14,968)
Table G As at 30 June
Telstra Group 2019 2018
$m $mPrincipal value (3,951) (4,339)Unamortised discounts/premiums 9 12Amortised cost (3,942) (4,327)Cumulative fair value hedge adjustments (378) (424)
Carrying amount (4,320) (4,751)
Table H Year ended 30 June
Telstra Group 2019 2018
(Gain)/loss
(Gain)/loss
$m $mRe-measurement of hedged item used to measure ineffectiveness 92 161
Change in value of hedging instruments (115) (167)Net gain before tax from ineffectiveness (23) (6)
Net gain after tax (16) (4)
Section 4 - Our Capital and Risk Management.fm Page 131 Tuesday, August 27, 2019 8:26 AM

Telstra Corporation Limited and controlled entities | 131
Notes to the financial statements (continued) Telstra Financial Report 2019Telstra Financial Report 2019Notes to the financial statements (continued) Telstra Financial Report 2019
Section 4. Our capital and risk management (continued)
Telstra Corporation Limited and controlled entities | 131
4.3 Capital management (continued)4.3.3 Derivatives (continued)
(b) Utilisation of derivatives to manage risks (continued)
Table F shows the carrying value and principal value of each component of our gross debt including derivative financial instruments categorised by hedge type. Principal value represents contractual obligations less future finance charges, excluding fair value remeasurements and for foreign denominated balances equates to the principal value in the underlying currency converted at the spot exchange rate as at 30 June 2019.
(i) Fair value hedges
All changes in the fair value of the underlying item relating to the hedged risk are recognised in the income statement together with the changes in the fair value of derivatives. The net difference is recorded in the income statement as ineffectiveness. The carrying value of borrowings in effective fair value hedge relationships is adjusted for gains or losses attributable to the risk(s) being hedged.
Table G outlines the cumulative amount of fair value hedge adjustments that are included in the carrying amount of borrowings in the statement of financial position.
Table H shows the ineffectiveness recognised in the income statement. We have excluded foreign currency basis spreads from our designated fair value and cash flow hedge relationships.
Table F As at 30 June 2019 As at 30 June 2018
Telstra Group Carrying value
Principal value
Carrying value
Principal value
$m $m $m $mBorrowings by hedge designationFair value hedges (4,320) (3,951) (4,751) (4,339)Cash flow hedges (9,045) (9,073) (7,766) (7,796)Not in a hedge relationship (3,597) (3,600) (4,070) (4,080)Finance leases (291) (291) (364) (364)Total borrowings (17,253) (16,915) (16,951) (16,579)Derivative assets by hedge designationFair value hedges 1,016 733 962 669Cash flow hedges 1,243 1,259 999 932Not in a hedge relationship 3 13 11 11Total derivative assets 2,262 2,005 1,972 1,612Derivative liabilities by hedge designationCash flow hedges (337) - (388) -Not in a hedge relationship (3) (11) (1) (1)Total derivative liabilities (340) (11) (389) (1)Total gross debt (15,331) (14,921) (15,368) (14,968)
Table G As at 30 June
Telstra Group 2019 2018
$m $mPrincipal value (3,951) (4,339)Unamortised discounts/premiums 9 12Amortised cost (3,942) (4,327)Cumulative fair value hedge adjustments (378) (424)
Carrying amount (4,320) (4,751)
Table H Year ended 30 June
Telstra Group 2019 2018
(Gain)/loss
(Gain)/loss
$m $mRe-measurement of hedged item used to measure ineffectiveness 92 161
Change in value of hedging instruments (115) (167)Net gain before tax from ineffectiveness (23) (6)
Net gain after tax (16) (4)
Section 4 - Our Capital and Risk Management.fm Page 131 Tuesday, August 27, 2019 8:26 AM

132 | Telstra Corporation Limited and controlled entities
Notes to the financial statements (continued)Notes to the financial statements (continued)
Section 4. Our capital and risk management (continued)
132 | Telstra Corporation Limited and controlled entities
4.3 Capital management (continued)4.3.3 Derivatives (continued)
(b) Utilisation of derivatives to manage risks (continued)
(ii) Cash flow hedges
The portion of the gain or loss on the hedging instrument that is effective (offsets the movement on the hedged item) is recognised directly in the cash flow hedging reserve in equity and any ineffective portion is recognised within finance costs directly in the income statement.
Gains or losses deferred in the cash flow hedging reserve are subsequently:
• transferred to the income statement when the hedged transaction affects profit or loss (e.g. a forecast transaction occurs)
• included in the initial carrying amount when the hedged item is a non-financial asset or liability
• transferred immediately to the income statement if a forecast hedged transaction is no longer expected to occur.
Table I presents the hedge gains or losses transferred to and from the cash flow hedging reserve.
During the current and prior financial years, there was no material impact on profit or loss resulting from ineffectiveness of our cash flow hedges or from discontinuing hedge accounting for forecast transactions no longer expected to occur.
Table J shows when the cash flows are expected to occur with respect to items in cash flow hedges (i.e. notional cash outflows). These amounts are the undiscounted cash flows reported in Australian dollars and represent our foreign currency exposures at the reporting date.
Non-capital items will be recognised in the income statement in the same period in which the cash flows are expected to occur. For purchases of property, plant and equipment, the gains and losses on the associated hedging instrument are included in the measurement of the initial cost of the assets. The hedged assets affect the income statement as the assets are depreciated over their useful lives.
(iii) Derivatives not in a formal hedge relationship
Some derivatives may not qualify for hedge accounting or are specifically not designated as a hedge as natural offset achieves substantially the same accounting results. This includes forward foreign currency contracts that are used to economically hedge exchange rate fluctuations associated with trade payables or other liability and asset balances denominated in a foreign currency.
4.3.4 Other hedge accounting policies
(a) Discontinuation of hedge accounting
Hedge accounting is discontinued when a hedging instrument expires, is sold, terminated, or no longer meets the criteria for hedge accounting. At that time, any cumulative gains or losses relating to cash flow hedges recognised in equity are initially retained in equity and subsequently recognised in the income statement as the previously hedged item affects profit or loss. For fair value hedges, the cumulative adjustment recorded against the carrying value of the hedged item at the date hedge accounting ceases is amortised to the income statement using the effective interest method.
(b) Embedded derivatives
Derivatives embedded in host contracts that are financial assets are not separated from financial asset hosts and a hybrid contract is classified in its entirety at either amortised cost or fair value.
Derivatives embedded in other financial liabilities or other host contracts are treated as separate financial instruments when their risks and characteristics are not closely related to those of the host contracts and the host contracts are not measured at fair value through profit or loss.
Table I Year ended 30 June
Telstra Group 2019 2018
$m $mCash flow hedging reserveChanges in fair value of cash flow hedges 200 154
Changes in fair value transferred to other expenses (334) (409)
Changes in fair value transferred to goods and services purchased (12) 3
Changes in fair value transferred to finance costs 151 155
Changes in fair value transferred to property, plant and equipment (2) -
Income tax on movements in the cash flow hedging reserve (1) 29
2 (68)
Table J As at 30 June
Telstra Group 2019 2018
$m $mNon-capital itemsWithin 1 year (1,234) (422)Capital itemsWithin 1 year (97) -BorrowingsWithin 1 year (1,898) (251)Within 1 to 5 years (3,763) (3,700)After 5 years (4,554) (5,063)
(11,546) (9,436)
Section 4 - Our Capital and Risk Management.fm Page 132 Tuesday, August 27, 2019 8:26 AM
Notes to the financial statements (continued) Telstra Financial Report 2019
Section 4. Our capital and risk management (continued)
Telstra Corporation Limited and controlled entities | 133
4.4 Financial instruments and risk management
4.4.1 Managing our interest rate risk
We manage interest rate risk on our net debt portfolio by:
• setting our target ratio of fixed interest debt to variable interest debt, as required by our debt management policy
• ensuring access to diverse sources of funding• reducing risks of refinancing by establishing and managing our
target maturity profiles• entering into cross currency and interest rate swaps. Refer to note
4.3.3 for further details on derivatives.
(a) Exposure
Table C in note 4.3.2 sets out the carrying value of borrowings. The use of cross currency and interest rate swaps allows us to manage the level of exposure our borrowings have to interest rate risks. Table A below shows our fixed to floating ratio based on the carrying value of our borrowings pre and post-hedging.
For internal risk management purposes, we classify debt due to mature within 12 months as floating which is reflected in Table A below.
Our underlying business activities result in exposure to operational risks and a number of financial risks, including interest rate risk, foreign currency risk, credit risk and liquidity risk.
Our overall risk management program seeks to mitigate these risks in order to reduce volatility on our financial performance and to support the delivery of our financial targets. Financial risk management is carried out centrally by our treasury department under policies approved by the Board.
This note summarises how we manage these financial risks. There have been no material changes to our risk management policies since 30 June 2018.
Interest rate risk arises from changes in market interest rates. Borrowings issued at fixed rates expose us to fair value interest rate risk. Variable rate borrowings give rise to cash flow interest rate risk, which is partially offset by cash and cash equivalents balances held at variable rates.
Table A As at 30 June 2019 As at 30 June 2018
Telstra Group Pre-hedge borrowings
Post-hedge borrowings
Pre-hedge borrowings
Post-hedge borrowings
Note $m $m $m $m
Fixed rate (14,053) (9,733) (14,457) (10,220)
Floating rate (3,200) (7,520) (2,494) (6,731)
Total borrowings 4.3 (17,253) (17,253) (16,951) (16,951)
Section 4 - Our Capital and Risk Management.fm Page 133 Tuesday, August 27, 2019 8:26 AM
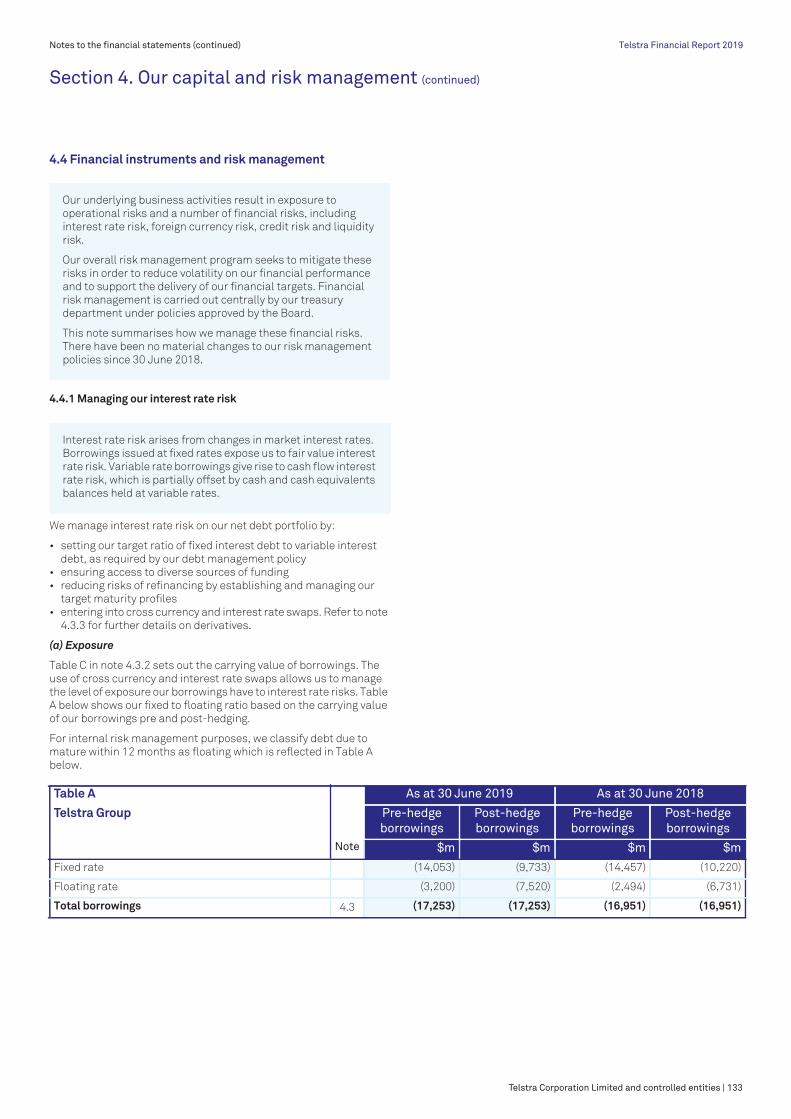
Telstra Corporation Limited and controlled entities | 133
Notes to the financial statements (continued) Telstra Financial Report 2019Telstra Financial Report 2019Notes to the financial statements (continued) Telstra Financial Report 2019
Section 4. Our capital and risk management (continued)
Telstra Corporation Limited and controlled entities | 133
4.4 Financial instruments and risk management
4.4.1 Managing our interest rate risk
We manage interest rate risk on our net debt portfolio by:
• setting our target ratio of fixed interest debt to variable interest debt, as required by our debt management policy
• ensuring access to diverse sources of funding• reducing risks of refinancing by establishing and managing our
target maturity profiles• entering into cross currency and interest rate swaps. Refer to note
4.3.3 for further details on derivatives.
(a) Exposure
Table C in note 4.3.2 sets out the carrying value of borrowings. The use of cross currency and interest rate swaps allows us to manage the level of exposure our borrowings have to interest rate risks. Table A below shows our fixed to floating ratio based on the carrying value of our borrowings pre and post-hedging.
For internal risk management purposes, we classify debt due to mature within 12 months as floating which is reflected in Table A below.
Our underlying business activities result in exposure to operational risks and a number of financial risks, including interest rate risk, foreign currency risk, credit risk and liquidity risk.
Our overall risk management program seeks to mitigate these risks in order to reduce volatility on our financial performance and to support the delivery of our financial targets. Financial risk management is carried out centrally by our treasury department under policies approved by the Board.
This note summarises how we manage these financial risks. There have been no material changes to our risk management policies since 30 June 2018.
Interest rate risk arises from changes in market interest rates. Borrowings issued at fixed rates expose us to fair value interest rate risk. Variable rate borrowings give rise to cash flow interest rate risk, which is partially offset by cash and cash equivalents balances held at variable rates.
Table A As at 30 June 2019 As at 30 June 2018
Telstra Group Pre-hedge borrowings
Post-hedge borrowings
Pre-hedge borrowings
Post-hedge borrowings
Note $m $m $m $m
Fixed rate (14,053) (9,733) (14,457) (10,220)
Floating rate (3,200) (7,520) (2,494) (6,731)
Total borrowings 4.3 (17,253) (17,253) (16,951) (16,951)
Section 4 - Our Capital and Risk Management.fm Page 133 Tuesday, August 27, 2019 8:26 AM

134 | Telstra Corporation Limited and controlled entities
Notes to the financial statements (continued)Notes to the financial statements (continued)
Section 4. Our capital and risk management (continued)
134 | Telstra Corporation Limited and controlled entities
4.4 Financial instruments and risk management (continued)4.4.1 Managing our interest rate risk (continued)
(b) Sensitivity
We have performed a sensitivity analysis based on the interest rate risk exposures of our financial instruments as at 30 June, showing the impact that a 10 per cent shift in interest rates would have on our profit after tax and on equity. In accordance with our policy to swap foreign currency borrowings into Australian dollars, interest rate sensitivity relates primarily to movements in Australian interest rates.
Table B shows the results of our sensitivity analysis.
A shift of 10 per cent has been selected as a reasonably possible change in interest rates based on the current level of both short-term and long-term interest rates. This is not a forecast or prediction of future market conditions.
The results of the sensitivity analysis are driven by the following main factors:
• any increase or decrease in interest rates will impact our net unhedged floating rate financial instruments and therefore will directly impact profit or loss
• changes in the fair value of derivatives which are part of effective cash flow hedge relationships are deferred in equity with no impact to profit or loss
• changes in the fair value of foreign currency basis spreads associated with our cross currency swaps are deferred in equity
• there is minimal net impact on profit or loss as a result of fair value movements on derivatives designated in effective fair value hedge relationships as there will be an offsetting adjustment to the underlying borrowing
• the analysis does not include the impact of any management action that might take place if a 10 per cent shift were to occur.
4.4.2 Managing our foreign currency risk
(a) Borrowings
We mitigate the foreign currency exposure on foreign currency denominated borrowings by:
• converting borrowings to Australian dollars using cross currency swaps
• holding borrowings to offset the translation of the net assets of a foreign controlled entity (we may also choose to hedge the foreign currency translation risk using derivatives). We have nil hedges in place for foreign currency translation risk associated with our investments in foreign operations (2018: nil).
Table C shows the carrying value of offshore borrowings by underlying currency. As at 30 June 2019, all offshore borrowings were swapped into Australian dollars (2018: all Australian dollars).
As at 30 June 2019, we also held $139 million of commercial paper at carrying value, including $50 million denominated in United States dollar ($71 million Australian dollar equivalent). At 30 June 2018, we held $677 million of commercial paper at carrying value, which included $100 million denominated in United States dollar ($135 million Australian dollar equivalent). Commercial paper denominated in United States dollar was converted into Australian dollars using foreign exchange swaps.
Table B As at 30 June
Telstra Group 2019 2018
Gain/(loss)
Net profit/(loss)
Equity Net profit/(loss)
Equity
$m $m $m $mInterest rates (+10%) (18) 24 (18) 32
Interest rates (-10%) 18 (25) 18 (33)
Foreign currency risk is our risk that the value of a financial commitment, forecast transaction, recognised asset or liability will fluctuate due to changes in foreign exchange rates. We issue debt offshore and operate internationally and hence we are exposed to foreign exchange risk from various currencies. However, our largest concentration of risk is attributable to the Euro and United States dollar.
This risk exposure arises primarily from:• borrowings denominated in foreign currencies• trade and other creditor balances denominated in foreign
currencies• firm commitments or highly probable forecast transactions
for receipts and payments settled in foreign currencies or with prices dependent on foreign currencies
• net investments in foreign controlled entities (foreign operations).
Table C As at 30 June
Telstra Group 2019 2018
$m $mEuro (9,555) (8,372)United States dollar (3,562) (3,391)Japanese yen (136) (126)Swiss franc - (311)Other (271) (262)Total offshore borrowings (13,524) (12,462)
Section 4 - Our Capital and Risk Management.fm Page 134 Tuesday, August 27, 2019 8:26 AM
Notes to the financial statements (continued) Telstra Financial Report 2019
Section 4. Our capital and risk management (continued)
Telstra Corporation Limited and controlled entities | 135
4.4 Financial instruments and risk management (continued)4.4.2 Managing our foreign currency risk (continued)
(b) Trading
We have some exposure to foreign currency risk from our operating (transactional) activities. We manage this risk by:
• hedging a proportion of the exposure of foreign exchange transaction risk arising from firm commitments or highly probable forecast transactions denominated in foreign currencies in accordance with our risk management policy. These transactions may be physically settled in a foreign currency or in Australian dollars but with direct reference to quoted currency rates in accordance with a contractual formula.
• economically hedging a proportion of foreign currency risk associated with trade and other asset and liability balances
• economically hedging the risk associated with our wholly owned controlled entities (‘WOCE’) that may be exposed to transactions, both forecast and committed, in currencies other than their functional currency, in accordance with our overall risk management policy.
We hedge the above risks using forward foreign exchange contracts. Table D summarises the impact of outstanding forward foreign exchange contracts that are hedging our transactional currency exposures.
(c) Natural offset
Our direct foreign exchange exposure arising from the impact of translation of the results of our foreign entities to Australian dollars is, in part, naturally offset at the Group level by foreign currency denominated operating and capital expenditure of business units, for which we do not have formal hedging in place.
Table D As at 30 June 2019 As at 30 June 2018
Telstra Group Exposure Forward foreign exchange contract receive/(pay)
Exposure Forward foreign exchange contract receive/(pay)
Local currency Austra- lian
dollars
Average exchange
rate
Local currency Austra- lian
dollars
Average exchange
rate
m m $m $ m m $m $Commercial paper borrowingsUnited States dollars (50) 50 (70) 0.72 (100) 100 (133) 0.75Transactions to and from WOCEBritish pounds sterling (24) 21 (38) 0.55 (18) 15 (26) 0.57United States dollars (345) 266 (380) 0.70 (174) 141 (186) 0.76Other (various currencies) - - (4) - - - (12) -Forecast transactionsUnited States dollars (904) 351 (487) 0.72 (257) 93 (121) 0.77Philippine peso (1,422) 1,138 (30) 38.24 (2,840) 2,272 (56) 40.35Other (various currencies) - - - - - - - -Other assets and liabilitiesUnited States dollars (91) 91 (130) 0.70 (46) 46 (61) 0.75Total in Australian dollars (1,139) (595)
Section 4 - Our Capital and Risk Management.fm Page 135 Tuesday, August 27, 2019 8:26 AM

Telstra Corporation Limited and controlled entities | 135
Notes to the financial statements (continued) Telstra Financial Report 2019Telstra Financial Report 2019Notes to the financial statements (continued) Telstra Financial Report 2019
Section 4. Our capital and risk management (continued)
Telstra Corporation Limited and controlled entities | 135
4.4 Financial instruments and risk management (continued)4.4.2 Managing our foreign currency risk (continued)
(b) Trading
We have some exposure to foreign currency risk from our operating (transactional) activities. We manage this risk by:
• hedging a proportion of the exposure of foreign exchange transaction risk arising from firm commitments or highly probable forecast transactions denominated in foreign currencies in accordance with our risk management policy. These transactions may be physically settled in a foreign currency or in Australian dollars but with direct reference to quoted currency rates in accordance with a contractual formula.
• economically hedging a proportion of foreign currency risk associated with trade and other asset and liability balances
• economically hedging the risk associated with our wholly owned controlled entities (‘WOCE’) that may be exposed to transactions, both forecast and committed, in currencies other than their functional currency, in accordance with our overall risk management policy.
We hedge the above risks using forward foreign exchange contracts. Table D summarises the impact of outstanding forward foreign exchange contracts that are hedging our transactional currency exposures.
(c) Natural offset
Our direct foreign exchange exposure arising from the impact of translation of the results of our foreign entities to Australian dollars is, in part, naturally offset at the Group level by foreign currency denominated operating and capital expenditure of business units, for which we do not have formal hedging in place.
Table D As at 30 June 2019 As at 30 June 2018
Telstra Group Exposure Forward foreign exchange contract receive/(pay)
Exposure Forward foreign exchange contract receive/(pay)
Local currency Austra- lian
dollars
Average exchange
rate
Local currency Austra- lian
dollars
Average exchange
rate
m m $m $ m m $m $Commercial paper borrowingsUnited States dollars (50) 50 (70) 0.72 (100) 100 (133) 0.75Transactions to and from WOCEBritish pounds sterling (24) 21 (38) 0.55 (18) 15 (26) 0.57United States dollars (345) 266 (380) 0.70 (174) 141 (186) 0.76Other (various currencies) - - (4) - - - (12) -Forecast transactionsUnited States dollars (904) 351 (487) 0.72 (257) 93 (121) 0.77Philippine peso (1,422) 1,138 (30) 38.24 (2,840) 2,272 (56) 40.35Other (various currencies) - - - - - - - -Other assets and liabilitiesUnited States dollars (91) 91 (130) 0.70 (46) 46 (61) 0.75Total in Australian dollars (1,139) (595)
Section 4 - Our Capital and Risk Management.fm Page 135 Tuesday, August 27, 2019 8:26 AM

136 | Telstra Corporation Limited and controlled entities
Notes to the financial statements (continued)Notes to the financial statements (continued)
Section 4. Our capital and risk management (continued)
136 | Telstra Corporation Limited and controlled entities
4.4 Financial instruments and risk management (continued)4.4.2 Managing our foreign currency risk (continued)
(d) Sensitivity
We have performed a sensitivity analysis based on our foreign currency risk exposures existing at balance date. Table E shows the impact that a 10 per cent shift in applicable exchange rates would have on our profit after tax and on equity.
A shift of 10 per cent has been selected as a reasonably possible change taking into account the current level of exchange rates and the volatility observed both on a historical basis and on market expectations of future movements. This is not a forecast or prediction of future market conditions.
We are exposed to equity impacts from foreign currency movements associated with our offshore investments and our derivatives in cash flow hedges of offshore borrowings. Foreign currency risk is spread over a number of currencies. We have disclosed the sensitivity analysis on a total portfolio basis and not separately by currency.
The translation of our foreign entities’ results into the Group’s presentation currency has not been included in the above sensitivity analysis as this represents translation risk rather than transaction risk.
Any unhedged foreign exchange positions associated with our transactional exposures will directly affect profit or loss as a result of foreign currency movements.
There is no significant impact on profit or loss from foreign currency movements associated with our borrowings portfolio in effective fair value or cash flow hedges as an offsetting entry will be recognised on the associated hedging instrument.
The analysis does not include the impact of any management action that might take place if these events occurred.
4.4.3 Managing our credit risk
We manage credit risk by:
• applying Board approved credit policies• monitoring exposure to high risk debtors• requiring collateral where appropriate• assigning credit limits to all financial counterparties.
We may also be subject to credit risk on transactions not included in the statement of financial position, such as when we provide a guarantee for another party. Details of our contingent liabilities are disclosed in note 7.3.2.
(a) Customer credit risk
Trade and other receivables and contract assets consist of a large number of customers, spread across the consumer, business, enterprise, government and international sectors. Other than nbn co, we do not have any significant credit risk exposure to a single customer or group of customers.
Ageing analysis and ongoing credit evaluation are performed on the financial condition of our customers and, where appropriate, an allowance for doubtful debts is raised. In addition, receivable balances and contract assets are monitored on an ongoing basis so that our exposure to bad debts is not significant.
Refer to note 3.3 for further details about our trade and other receivables and contract assets.
(b) Treasury credit risk
We are exposed to credit risk from the investment of surplus funds (primarily deposits) and from the use of derivative financial instruments.
We have a number of exposures to individual counterparties. To manage this risk, we have Board approved policies that limit the amount of credit exposure to any single counterparty. Counterparty credit ratings and market conditions are reviewed continually with limits being revised and utilisation adjusted where appropriate. We also manage our credit exposure using a value at risk (VaR) methodology, which is an industry standard measure that estimates the maximum potential exposure of our risk positions as a result of future movements in market rates. This helps to ensure that we do not underestimate credit exposure with any single counterparty. Using VaR analysis at 30 June 2019, 94 per cent (2018: 94 per cent) of our derivative credit exposure was with counterparties that have a credit rating of A- or better. Management does not expect any significant losses from non-performance by any of these counterparties.
Table E As at 30 June
Telstra Group 2019 2018
Gain/(loss)
Net profit/(loss)
Equity Net profit/(loss)
Equity
$m $m $m $mExchange rates (+10%) 45 (47) 6 (30)
Exchange rates (-10%) (55) 57 (8) 36
Credit risk is the risk that a counterparty will default on its contractual obligations resulting in a financial loss. We are exposed to credit risk from our operating activities (primarily customer credit risk) and financing activities.
Section 4 - Our Capital and Risk Management.fm Page 136 Tuesday, August 27, 2019 8:26 AM
Notes to the financial statements (continued) Telstra Financial Report 2019
Section 4. Our capital and risk management (continued)
Telstra Corporation Limited and controlled entities | 137
4.4 Financial instruments and risk management (continued)4.4.4 Managing our liquidity risk
Our objective is to maintain a balance between continuity and flexibility of funding through the use of liquid financial instruments, long-term and short-term borrowings, and committed available bank facilities.
We manage liquidity risk by:
• defining minimum levels of cash and cash equivalents• defining minimum levels of cash and cash equivalents plus
undrawn bank facilities
• closely monitoring rolling forecasts of liquidity reserves on the basis of expected business cash flows
• using instruments which trade in highly liquid markets with highly rated counterparties
• investing surplus funds within various types of liquid instruments.
We believe that our contractual obligations can be met through existing cash and cash equivalents, operating cash flows and other funding arrangements we reasonably expect to have available to us, including the use of committed bank facilities.
Table F shows our contractual cash flow maturities of financial liabilities including estimated interest payments. The amounts disclosed are undiscounted future cash flows and therefore do not reconcile to the amounts in the statement of financial position.
(a) Borrowing facilities
We have committed available bank facilities in place to support our liquidity requirements and our short-term and long-term borrowings. Table G shows our undrawn facilities as at 30 June.
Liquidity risk is the risk that we will be unable to meet our financial obligations as they fall due.
Table F Contractual maturity
Telstra Group As at 30 June 2019 As at 30 June 2018 Restated
Less than 1
year
1 to 2 years
2 to 5 years
More than 5 years
Total Less than 1
year
1 to 2 years
2 to 5 years
More than 5 years
Total
$m $m $m $m $m $m $m $m $m $mDomestic borrowings (366) (1,064) (1,013) (850) (3,293) (548) (60) (2,080) (750) (3,438)Offshore borrowings (1,641) (939) (6,219) (4,400) (13,199) (313) (1,580) (5,179) (5,030) (12,102)Commercial paper (139) - - - (139) (686) - - - (686)Interest on borrowings, excluding finance lease liabilities
(551) (459) (776) (301) (2,087) (721) (503) (450) (161) (1,835)
Finance lease liabilities (91) (62) (73) (116) (342) (102) (70) (106) (233) (511)Trade/other payables and accrued expenses (4,528) (7) (14) (47) (4,596) (4,528) (10) (14) (41) (4,593)
Derivative financial assets 3,345 1,283 6,638 4,621 15,887 1,402 1,963 5,779 5,251 14,395Derivative financial liabilities (3,332) (1,238) (5,393) (4,532) (14,495) (1,481) (2,035) (5,042) (4,928) (13,486)
Total (7,303) (2,486) (6,850) (5,625) (22,264) (6,977) (2,295) (7,092) (5,892) (22,256)
Table G As at 30 June
Telstra Group 2019 2018
$m $mFacilities available 3,200 3,200Facilities used - (200)Facilities unused 3,200 3,000
Section 4 - Our Capital and Risk Management.fm Page 137 Tuesday, August 27, 2019 8:26 AM

Telstra Corporation Limited and controlled entities | 137
Notes to the financial statements (continued) Telstra Financial Report 2019Telstra Financial Report 2019Notes to the financial statements (continued) Telstra Financial Report 2019
Section 4. Our capital and risk management (continued)
Telstra Corporation Limited and controlled entities | 137
4.4 Financial instruments and risk management (continued)4.4.4 Managing our liquidity risk
Our objective is to maintain a balance between continuity and flexibility of funding through the use of liquid financial instruments, long-term and short-term borrowings, and committed available bank facilities.
We manage liquidity risk by:
• defining minimum levels of cash and cash equivalents• defining minimum levels of cash and cash equivalents plus
undrawn bank facilities
• closely monitoring rolling forecasts of liquidity reserves on the basis of expected business cash flows
• using instruments which trade in highly liquid markets with highly rated counterparties
• investing surplus funds within various types of liquid instruments.
We believe that our contractual obligations can be met through existing cash and cash equivalents, operating cash flows and other funding arrangements we reasonably expect to have available to us, including the use of committed bank facilities.
Table F shows our contractual cash flow maturities of financial liabilities including estimated interest payments. The amounts disclosed are undiscounted future cash flows and therefore do not reconcile to the amounts in the statement of financial position.
(a) Borrowing facilities
We have committed available bank facilities in place to support our liquidity requirements and our short-term and long-term borrowings. Table G shows our undrawn facilities as at 30 June.
Liquidity risk is the risk that we will be unable to meet our financial obligations as they fall due.
Table F Contractual maturity
Telstra Group As at 30 June 2019 As at 30 June 2018 Restated
Less than 1
year
1 to 2 years
2 to 5 years
More than 5 years
Total Less than 1
year
1 to 2 years
2 to 5 years
More than 5 years
Total
$m $m $m $m $m $m $m $m $m $mDomestic borrowings (366) (1,064) (1,013) (850) (3,293) (548) (60) (2,080) (750) (3,438)Offshore borrowings (1,641) (939) (6,219) (4,400) (13,199) (313) (1,580) (5,179) (5,030) (12,102)Commercial paper (139) - - - (139) (686) - - - (686)Interest on borrowings, excluding finance lease liabilities
(551) (459) (776) (301) (2,087) (721) (503) (450) (161) (1,835)
Finance lease liabilities (91) (62) (73) (116) (342) (102) (70) (106) (233) (511)Trade/other payables and accrued expenses (4,528) (7) (14) (47) (4,596) (4,528) (10) (14) (41) (4,593)
Derivative financial assets 3,345 1,283 6,638 4,621 15,887 1,402 1,963 5,779 5,251 14,395Derivative financial liabilities (3,332) (1,238) (5,393) (4,532) (14,495) (1,481) (2,035) (5,042) (4,928) (13,486)
Total (7,303) (2,486) (6,850) (5,625) (22,264) (6,977) (2,295) (7,092) (5,892) (22,256)
Table G As at 30 June
Telstra Group 2019 2018
$m $mFacilities available 3,200 3,200Facilities used - (200)Facilities unused 3,200 3,000
Section 4 - Our Capital and Risk Management.fm Page 137 Tuesday, August 27, 2019 8:26 AM

138 | Telstra Corporation Limited and controlled entities
Notes to the financial statements (continued)Notes to the financial statements (continued)
Section 4. Our capital and risk management (continued)
138 | Telstra Corporation Limited and controlled entities
4.4 Financial instruments and risk management (continued)4.4.5 Valuation and disclosures within fair value hierarchy
Fair value hierarchy:
• level 1: quoted (unadjusted) market prices in active markets for identical assets or liabilities
• level 2: the lowest level input that is significant to the fair value measurement is directly (as prices) or indirectly (derived from prices) observable
• level 3: one or more key inputs for the instrument are not based on observable market data (unobservable inputs).
During the year ended 30 June 2019, there were no changes in valuation techniques for recurring fair value measurements of our financial instruments. There were also no transfers between fair value hierarchy levels.
The table below summaries the methods used to estimate the fair value of our financial instruments.
The financial instruments included in the statement of financial position are measured either at fair value or their carrying value approximates fair value, with the exception of borrowings, which are held at amortised cost.
To determine fair value, we use both observable and unobservable inputs. We classify the inputs used in the valuation of our financial instruments according to a three level hierarchy as shown below. The classification is based on the lowest level input that is significant to the fair value measurement as a whole.
Level Financial instrument Fair value
Level 1 Listed investments in equity instruments
Quoted prices in active markets.
Level 2 Borrowings, cross currency and interest rate swaps
Valuation techniques maximise the use of observable market data. Present value of the estimated future cash flows using appropriate market based yield curves, which are independently derived. Yield curves are sourced from readily available market data quoted for all major currencies.
Forward foreign exchange contracts
Quoted forward exchange rates at reporting date for contracts with similar maturity profiles.
Level 3 Trade receivables from contracts with customers
Trade receivables from contracts with customers measured at fair value are such where due to the variability of the contractual cash flows the instrument does not meet the classification requirements of financial assets at amortised cost.
A valuation technique is used where the estimated future cash flows are discounted to their present value using a discount rate that reflects current market assessments of the time value of money and the risks specific to the asset. Expected cash inflows are estimated based on the terms of the customer contract taking into account possible variations in the amount and timing of cash flows. Discount rate is determined using a risk free rate plus a risk adjustment reflecting the credit risk associated with the cash flow.
Unlisted investments in equity instruments
Valuation techniques (where one or more of the significant inputs is not based on observable market data) include reference to discounted cash flows and fair values of recent orderly sell transactions between market participants involving instruments that are substantially the same.
Contingent consideration Initial recognition: expectations of future performance of the business. Subsequent measurement: present value of the future expected cash flows.
Section 4 - Our Capital and Risk Management.fm Page 138 Tuesday, August 27, 2019 8:26 AM
Notes to the financial statements (continued) Telstra Financial Report 2019
Section 4. Our capital and risk management (continued)
Telstra Corporation Limited and controlled entities | 139
4.4 Financial instruments and risk management (continued)4.4.5 Valuation and disclosures within fair value hierarchy (continued)
Table H categorises our financial instruments which are measured at fair value, according to the valuation methodology applied.
Table I details movements in the level 3 unlisted security balances.
The remeasurement recognised in other comprehensive income in the financial year 2019 related to investments held by Telstra Ventures Pty Limited.
During the financial year, we have not received any dividends from our investments in these equity instruments and there have been no transfers to or from equity in relation to these investments.
Refer to note 6.2.1 for further information on contribution to Telstra Venture Fund II, L.P.
Our borrowings as per Table C in note 4.3.2 are classified as level 2 in the fair value hierarchy.
We originate trade receivables from contracts with customers as part of our ordinary activities. Settlements of those receivables from part of the receipts from customers in the operating cash flows. No material revaluation gains or losses were recognised during the year.
Table H As at 30 June 2019 As at 30 June 2018 (restated)
Telstra Group Level 1 Level 2 Level 3 Total Level 1 Level 2 Level 3 Total
$m $m $m $m $m $m $m $mAssetsTrade receivables from contracts with customers - - 1,506 1,506 - - 1,502 1,502
Derivative financial instruments - 2,262 - 2,262 - 1,972 - 1,972Investments in listed securities 9 - - 9 11 - - 11Investments in unlisted securities - - 16 16 - - 25 25
9 2,262 1,522 3,793 11 1,972 1,527 3,510LiabilitiesDerivative financial instruments - (340) - (340) - (389) - (389)Contingent consideration - - - - - - (4) (4)
- (340) - (340) - (389) (4) (393)Total 9 1,922 1,522 3,453 11 1,583 1,523 3,117
Table ITelstra Group
Unlisted securities
Level 3
$mOpening balance 1 July 2018 25Purchases 1Remeasurement recognised in other comprehensive income (net of tax) 1
Contribution to Telstra Ventures Fund II, L.P. (11)Closing balance 30 June 2019 16
Section 4 - Our Capital and Risk Management.fm Page 139 Tuesday, August 27, 2019 8:26 AM
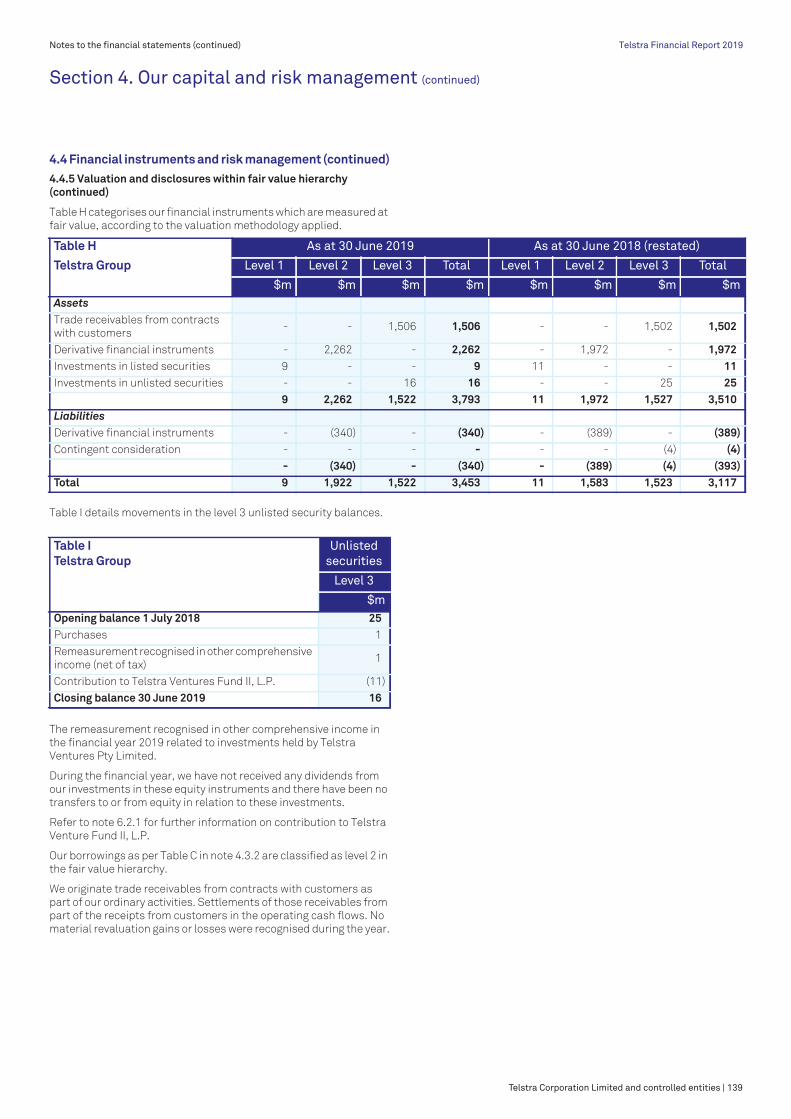
Telstra Corporation Limited and controlled entities | 139
Notes to the financial statements (continued) Telstra Financial Report 2019Telstra Financial Report 2019Notes to the financial statements (continued) Telstra Financial Report 2019
Section 4. Our capital and risk management (continued)
Telstra Corporation Limited and controlled entities | 139
4.4 Financial instruments and risk management (continued)4.4.5 Valuation and disclosures within fair value hierarchy (continued)
Table H categorises our financial instruments which are measured at fair value, according to the valuation methodology applied.
Table I details movements in the level 3 unlisted security balances.
The remeasurement recognised in other comprehensive income in the financial year 2019 related to investments held by Telstra Ventures Pty Limited.
During the financial year, we have not received any dividends from our investments in these equity instruments and there have been no transfers to or from equity in relation to these investments.
Refer to note 6.2.1 for further information on contribution to Telstra Venture Fund II, L.P.
Our borrowings as per Table C in note 4.3.2 are classified as level 2 in the fair value hierarchy.
We originate trade receivables from contracts with customers as part of our ordinary activities. Settlements of those receivables from part of the receipts from customers in the operating cash flows. No material revaluation gains or losses were recognised during the year.
Table H As at 30 June 2019 As at 30 June 2018 (restated)
Telstra Group Level 1 Level 2 Level 3 Total Level 1 Level 2 Level 3 Total
$m $m $m $m $m $m $m $mAssetsTrade receivables from contracts with customers - - 1,506 1,506 - - 1,502 1,502
Derivative financial instruments - 2,262 - 2,262 - 1,972 - 1,972Investments in listed securities 9 - - 9 11 - - 11Investments in unlisted securities - - 16 16 - - 25 25
9 2,262 1,522 3,793 11 1,972 1,527 3,510LiabilitiesDerivative financial instruments - (340) - (340) - (389) - (389)Contingent consideration - - - - - - (4) (4)
- (340) - (340) - (389) (4) (393)Total 9 1,922 1,522 3,453 11 1,583 1,523 3,117
Table ITelstra Group
Unlisted securities
Level 3
$mOpening balance 1 July 2018 25Purchases 1Remeasurement recognised in other comprehensive income (net of tax) 1
Contribution to Telstra Ventures Fund II, L.P. (11)Closing balance 30 June 2019 16
Section 4 - Our Capital and Risk Management.fm Page 139 Tuesday, August 27, 2019 8:26 AM

140 | Telstra Corporation Limited and controlled entities
Notes to the financial statements (continued)Notes to the financial statements (continued)
Section 4. Our capital and risk management (continued)
140 | Telstra Corporation Limited and controlled entities
4.4 Financial instruments and risk management (continued)4.4.6 Offsetting and netting arrangements
Table J presents financial assets and financial liabilities subject to offsetting, enforceable master netting arrangements or similar agreements. Following the adoption of the new accounting standard for revenue from contracts with customers, wordings of the respective line items have been updated as described in note 7.1.1.
Gross amounts not offset in the statement of financial position reflect amounts subject to conditional offsetting arrangements.
Gross amounts of financial instruments not offset in the statement of financial position, i.e. our rights of set-off that are not otherwise included in column B, related to:
• our inter-operative tariff arrangements with some of our international roaming partners, where we have executed agreements that allow the netting of amounts payable and receivable by us on cessation of the contract
• our wholesale customers, where we have executed Customer Relationship Agreements that allow for the netting of amounts payable and receivable by us in certain circumstances where there is a right to suspend the supply of services or on the expiration or termination of the agreement
• our derivative financial instruments, where we have executed master netting arrangements under our International Swaps and Derivatives Association agreements. These agreements allow for the netting of amounts payable and receivable by us or the counterparty in the event of default or a credit event. In line with contractual provisions, in the event of insolvency all derivatives with a positive or negative fair value that exist with the respective counterparty are offset against each other, leaving a net receivable or liability.
Table JTelstra Group
Gross amounts
Gross amounts
offset in the statement of
financial position
Net amounts presented in
the statement of
financial position
Gross amounts not offset in the statement of financial
position
Net amounts
Financial instruments
Collateral received or
pledged
$m $m $m $m $m $m
A B C=A-B D E F=C-D-E
As at 30 June 2019Trade and other receivables and contract assets 829 133 696 54 10 632
Trade and other payables (473) (133) (340) (54) - (286)Derivative financial assets 2,262 - 2,262 337 - 1,925Derivative financial liabilities (340) - (340) (337) - (3)Total 2,278 - 2,278 - 10 2,268
As at 30 June 2018 (restated)Trade and other receivables and contract assets 658 110 548 51 10 487
Trade and other payables (370) (110) (260) (51) - (209)Derivative financial assets 1,972 - 1,972 370 - 1,602Derivative financial liabilities (389) - (389) (370) - (19)Total 1,871 - 1,871 - 10 1,861
Section 4 - Our Capital and Risk Management.fm Page 140 Tuesday, August 27, 2019 8:26 AM
Telstra Corporation Limited and controlled entities | 141
Notes to the financial statements (continued)
Section 5. Our people
We are working to attract and retain employees with the skills and passion to best serve our markets. This section provides information about our employee benefits obligations. It also includes details of our employee share plans and compensation paid to key management personnel.
SECTION 5. OUR PEOPLE5.1 Employee benefits5.1.1 Aggregate employee benefits
Our employee related obligations include:
• liabilities for wages and salaries and related on-costs (presented within current trade and other payables)
• annual leave, long service leave and employee incentives (presented within employee benefits) and
• current redundancy provisions (presented within other provisions).
We apply estimates and judgement in measuring our provisions for employee benefits.
Table A provides a summary of all these employee obligations.
For the amounts of the provision presented as current, we do not have an unconditional right to defer settlement for any of these obligations. However, based on past experience, we do not expect all employees to take the full amount of accrued leave or require payment within the next 12 months. Amounts disclosed in Table B have been determined in accordance with an actuarial assessment and reflect leave that is not expected to be taken or paid within the next 12 months.
5.1.2 Recognition and measurement
The liabilities for employee benefits relating to wages and salaries, annual leave and other current employee benefits are accrued at their nominal amounts. These are calculated based on remuneration rates expected to be current at the settlement date and include related costs.
Certain employees who have been employed by Telstra for at least 10 years are entitled to long service leave of three months (or more depending on the actual length of employment). We accrue liabilities for long service leave not expected to be paid or settled within 12 months of reporting date at the present values of future amounts expected to be paid. This is based on projected increases in wage and salary rates over an average of 10 years, experience of employee departures and periods of service.
Provisions are recognised when:
• the Telstra Group has a present legal or constructive obligation to make a future sacrifice of economic benefits as a result of past transactions or events
• it is probable that a future sacrifice of economic benefits will arise• a reliable estimate can be made of the amount of the obligation.
We recognise a provision for redundancy costs when a detailed formal plan for the redundancies has been developed and a valid expectation has been created that the redundancies will be carried out in respect of those employees likely to be affected.
Table A As at 30 June
Telstra Group 2019 2018
$m $mCurrent employee benefits 804 868Non-current employee benefits 158 157Current redundancy provisions 1 5Accrued labour and on-costs 644 498
1,607 1,528
Long serviceleave provision
We applied management judgement to determine the following key assumptions used in the calculation of long service leave entitlements:
• 4.0 per cent (2018: 4.5 per cent) weighted average projected increases in salaries
• 2.7 per cent (2018: 3.9 per cent) discount rate.
The discount rate used to calculate the present value has been determined by reference to market yields at 30 June 2019 on 10 year (2018: 10 year) high quality corporate bonds which have due dates similar to those of our liabilities.
Table B As at 30 June
Telstra Group 2019 2018
$m $mLeave obligations expected to be settled after 12 months 495 524
Section 5 - Our People.fm Page 141 Tuesday, August 27, 2019 4:29 PM

Telstra Corporation Limited and controlled entities | 141
Notes to the financial statements (continued) Telstra Financial Report 2019Telstra Financial Report 2019
Telstra Corporation Limited and controlled entities | 141
Notes to the financial statements (continued)
Section 5. Our people
We are working to attract and retain employees with the skills and passion to best serve our markets. This section provides information about our employee benefits obligations. It also includes details of our employee share plans and compensation paid to key management personnel.
SECTION 5. OUR PEOPLE5.1 Employee benefits5.1.1 Aggregate employee benefits
Our employee related obligations include:
• liabilities for wages and salaries and related on-costs (presented within current trade and other payables)
• annual leave, long service leave and employee incentives (presented within employee benefits) and
• current redundancy provisions (presented within other provisions).
We apply estimates and judgement in measuring our provisions for employee benefits.
Table A provides a summary of all these employee obligations.
For the amounts of the provision presented as current, we do not have an unconditional right to defer settlement for any of these obligations. However, based on past experience, we do not expect all employees to take the full amount of accrued leave or require payment within the next 12 months. Amounts disclosed in Table B have been determined in accordance with an actuarial assessment and reflect leave that is not expected to be taken or paid within the next 12 months.
5.1.2 Recognition and measurement
The liabilities for employee benefits relating to wages and salaries, annual leave and other current employee benefits are accrued at their nominal amounts. These are calculated based on remuneration rates expected to be current at the settlement date and include related costs.
Certain employees who have been employed by Telstra for at least 10 years are entitled to long service leave of three months (or more depending on the actual length of employment). We accrue liabilities for long service leave not expected to be paid or settled within 12 months of reporting date at the present values of future amounts expected to be paid. This is based on projected increases in wage and salary rates over an average of 10 years, experience of employee departures and periods of service.
Provisions are recognised when:
• the Telstra Group has a present legal or constructive obligation to make a future sacrifice of economic benefits as a result of past transactions or events
• it is probable that a future sacrifice of economic benefits will arise• a reliable estimate can be made of the amount of the obligation.
We recognise a provision for redundancy costs when a detailed formal plan for the redundancies has been developed and a valid expectation has been created that the redundancies will be carried out in respect of those employees likely to be affected.
Table A As at 30 June
Telstra Group 2019 2018
$m $mCurrent employee benefits 804 868Non-current employee benefits 158 157Current redundancy provisions 1 5Accrued labour and on-costs 644 498
1,607 1,528
Long serviceleave provision
We applied management judgement to determine the following key assumptions used in the calculation of long service leave entitlements:
• 4.0 per cent (2018: 4.5 per cent) weighted average projected increases in salaries
• 2.7 per cent (2018: 3.9 per cent) discount rate.
The discount rate used to calculate the present value has been determined by reference to market yields at 30 June 2019 on 10 year (2018: 10 year) high quality corporate bonds which have due dates similar to those of our liabilities.
Table B As at 30 June
Telstra Group 2019 2018
$m $mLeave obligations expected to be settled after 12 months 495 524
Section 5 - Our People.fm Page 141 Tuesday, August 27, 2019 4:29 PM

142 | Telstra Corporation Limited and controlled entities
Notes to the financial statements (continued)Notes to the financial statements (continued)
Section 5. Our people (continued)
142 | Telstra Corporation Limited and controlled entities
5.2 Employee share plans
We have a number of employee share plans that are available to executives and employees as part of their remuneration packages. Active share plans are conducted through the Telstra Growthshare Trust (Growthshare). Telstra wholly owns Telstra Growthshare Pty Ltd, the corporate trustee for Growthshare (the Trustee). The results of the Trustee are consolidated into our Telstra Group Financial Report.
A transaction will be classified as share-based compensation where the Group receives services from employees and pays for these either in shares or similar equity instruments or in cash but the amounts due are based on the price of the equity instruments.
This note summarises the primary employee share plans conducted through Growthshare and the key events in the share-based payment arrangements during the financial year.
We have granted the following types of equity instruments as part of our equity-settled plans:
• restricted shares• performance rights• retention rights.
Restricted shares are Telstra shares that are subject to a restriction period.
Performance rights are rights to Telstra shares subject to the satisfaction of certain performance measures and service conditions over a defined performance period.
Retention rights are rights to Telstra shares if the retention rights vest.
Telstra retains the flexibility to settle performance rights granted under the Executive Variable Remuneration Plan (EVP) and retention rights in a cash amount equivalent to the value of the shares that would otherwise have been provided on vesting of the rights.
A summary of the key terms of our main equity-settled plans is presented in the tables below. Further information can be found in note 5.2.1.
The table below provides a summary of the restricted shares that were outstanding at any time during the financial year.
Table A @ Type Financial year granted
Restriction period Number of restricted shares allocated and outstanding at 30 June 2019
EVP restricted shares FY18
FY19
1 to 2 years from the end of the initial performance period
2 years from the end of the initial performance period
774,394
The restricted shares for FY19 will be allocated at the start of FY20
Short-term incentive (STI) restricted shares
FY16, FY17, FY18, FY19 1 to 3 years from the effective allocation date
5,453,091
Employee Share Plan (ESP) restricted shares
FY16, FY17, FY18 3 years from the actual allocation date
3,713,300
GE Telstra Wholesale restricted shares FY17 3 years from the effective allocation date
86,185
TESOP 99 restricted shares FY98, FY00 Until the loan has been paid in full
2,903,300
An effective allocation date is 1 July immediately after the financial year when the restricted shares were granted.
Section 5 - Our People.fm Page 142 Tuesday, August 27, 2019 8:26 AM
Notes to the financial statements (continued) Telstra Financial Report 2019
Section 5. Our people (continued)
Telstra Corporation Limited and controlled entities | 143
5.2 Employee share plans (continued)Table below provides a summary of the performance rights that existed at any time during the financial year.
Table B @Type Financial year granted
Date of testing against performance hurdles
Performance hurdles
Subsequent restriction period once the performance rights have become restricted shares
Number of performance rights allocated and outstanding at 30 June 2019
EVP performance rights
FY18
FY19
50% 30 Jun 2021 50% 30 Jun 2022
30 Jun 2023
Relative Total Shareholder Return (RTSR) for both FY18 and FY19
n/a 1,161,590
The performance rights for FY19 will be allocated at the start of FY20
Executive Long-term incentive (LTI) performance rights
FY17 30 Jun 2019 Free Cash Flow Return on Investment (FCF ROI)
RTSR (not applicable to former GE Telstra Wholesale)
1 year The performance rights lapsed
The definitions of RTSR and FCF ROI are set out in the Remuneration Report Glossary.
5.2.1 Description of share based payment arrangements
(a) Retention rights (equity-settled)
During the year, Telstra issued one-off retention rights to eligible employees. As at 30 June 2019, 13,032,150 retention rights were outstanding.
The retention rights were allocated in November 2018 in two tranches – 40 per cent of the retention rights will vest on 31 December 2019 and the remaining 60 per cent will vest on 30 June 2021. The retention rights are not subject to performance hurdles. There will be no dividends or dividend equivalent amounts paid during the vesting period. If the holder leaves Telstra other than for a permitted reason before the end of the relevant vesting period, the retention rights are forfeited.
(b) Executive Variable Remuneration Plan (EVP)
The EVP was implemented for the CEO and other eligible senior executives in financial year 2018. Under the EVP, the amount earned by an executive is determined at the end of an initial one year performance period based on Telstra’s performance against certain predetermined performance measures and subject to Board discretion to adjust based on its assessment of individual performance and whether the proposed outcome is appropriate in the context of Telstra’s performance, customer experience and shareholder expectations. A component of the amount earned under the EVP is provided in restricted shares and a component in performance rights.
The first allocation of restricted shares and performance rights under the EVP was made in financial year 2019. Shareholder approval will be sought at the 2019 Annual General Meeting for the CEO’s EVP equity grant.
(i) Restricted shares (equity-settled)
FY19 EVP restricted shares are subject to a two year restriction period following the initial one year performance period (FY18 EVP restricted shares had a restriction period of 1 or 2 years). No further performance hurdles will apply once the restricted shares are allocated. During the restriction period, executives are entitled to vote and earn dividends on their restricted shares from the actual allocation date. However, they are restricted from dealing with the shares during this period.
If an executive leaves Telstra other than for a permitted reason (the definition of which is set out in the Remuneration Report Glossary) before the end of the relevant restriction period, the restricted shares will be forfeited. Restricted shares may also be forfeited if certain clawback events occur during the restriction period.
(ii) Performance rights (equity-settled)
Once allocated, the performance rights will be tested against a Relative Total Shareholder Return (RTSR) measure over a five year period (FY18 EVP: 50% over four years and 50% over five years) inclusive of the initial one year performance period.
The performance rights will only vest if Telstra’s RTSR ranks at the 50th percentile or greater against a comparator group comprising the ASX100 (excluding resource companies) over the performance period. If the RTSR measure is not satisfied, all of the applicable performance rights in the relevant tranche will lapse.
Section 5 - Our People.fm Page 143 Tuesday, August 27, 2019 8:26 AM

Telstra Corporation Limited and controlled entities | 143
Notes to the financial statements (continued) Telstra Financial Report 2019Telstra Financial Report 2019Notes to the financial statements (continued) Telstra Financial Report 2019
Section 5. Our people (continued)
Telstra Corporation Limited and controlled entities | 143
5.2 Employee share plans (continued)Table below provides a summary of the performance rights that existed at any time during the financial year.
Table B @Type Financial year granted
Date of testing against performance hurdles
Performance hurdles
Subsequent restriction period once the performance rights have become restricted shares
Number of performance rights allocated and outstanding at 30 June 2019
EVP performance rights
FY18
FY19
50% 30 Jun 2021 50% 30 Jun 2022
30 Jun 2023
Relative Total Shareholder Return (RTSR) for both FY18 and FY19
n/a 1,161,590
The performance rights for FY19 will be allocated at the start of FY20
Executive Long-term incentive (LTI) performance rights
FY17 30 Jun 2019 Free Cash Flow Return on Investment (FCF ROI)
RTSR (not applicable to former GE Telstra Wholesale)
1 year The performance rights lapsed
The definitions of RTSR and FCF ROI are set out in the Remuneration Report Glossary.
5.2.1 Description of share based payment arrangements
(a) Retention rights (equity-settled)
During the year, Telstra issued one-off retention rights to eligible employees. As at 30 June 2019, 13,032,150 retention rights were outstanding.
The retention rights were allocated in November 2018 in two tranches – 40 per cent of the retention rights will vest on 31 December 2019 and the remaining 60 per cent will vest on 30 June 2021. The retention rights are not subject to performance hurdles. There will be no dividends or dividend equivalent amounts paid during the vesting period. If the holder leaves Telstra other than for a permitted reason before the end of the relevant vesting period, the retention rights are forfeited.
(b) Executive Variable Remuneration Plan (EVP)
The EVP was implemented for the CEO and other eligible senior executives in financial year 2018. Under the EVP, the amount earned by an executive is determined at the end of an initial one year performance period based on Telstra’s performance against certain predetermined performance measures and subject to Board discretion to adjust based on its assessment of individual performance and whether the proposed outcome is appropriate in the context of Telstra’s performance, customer experience and shareholder expectations. A component of the amount earned under the EVP is provided in restricted shares and a component in performance rights.
The first allocation of restricted shares and performance rights under the EVP was made in financial year 2019. Shareholder approval will be sought at the 2019 Annual General Meeting for the CEO’s EVP equity grant.
(i) Restricted shares (equity-settled)
FY19 EVP restricted shares are subject to a two year restriction period following the initial one year performance period (FY18 EVP restricted shares had a restriction period of 1 or 2 years). No further performance hurdles will apply once the restricted shares are allocated. During the restriction period, executives are entitled to vote and earn dividends on their restricted shares from the actual allocation date. However, they are restricted from dealing with the shares during this period.
If an executive leaves Telstra other than for a permitted reason (the definition of which is set out in the Remuneration Report Glossary) before the end of the relevant restriction period, the restricted shares will be forfeited. Restricted shares may also be forfeited if certain clawback events occur during the restriction period.
(ii) Performance rights (equity-settled)
Once allocated, the performance rights will be tested against a Relative Total Shareholder Return (RTSR) measure over a five year period (FY18 EVP: 50% over four years and 50% over five years) inclusive of the initial one year performance period.
The performance rights will only vest if Telstra’s RTSR ranks at the 50th percentile or greater against a comparator group comprising the ASX100 (excluding resource companies) over the performance period. If the RTSR measure is not satisfied, all of the applicable performance rights in the relevant tranche will lapse.
Section 5 - Our People.fm Page 143 Tuesday, August 27, 2019 8:26 AM

144 | Telstra Corporation Limited and controlled entities
Notes to the financial statements (continued)Notes to the financial statements (continued)
Section 5. Our people (continued)
144 | Telstra Corporation Limited and controlled entities
5.2 Employee share plans (continued)5.2.1 Description of share based payment arrangements (continued)
(b) Executive Variable Remuneration Plan (EVP) (continued)
(ii) Performance rights (equity-settled) (continued)
No dividends are paid on performance rights prior to vesting. For performance rights that do vest, a cash payment equivalent to dividends paid by Telstra during the period between allocation of the performance rights and vesting will be made at or around the time of vesting, subject to applicable taxation. This cash entitlement is not included in the grant date fair values of the performance rights as this is accounted for separately.
(iii) Cash rights (cash-settled)
Executives who ceased employment for a permitted reason, before the allocation of the FY18 EVP restricted shares and performance rights were granted cash rights in lieu of those restricted shares and performance rights. Those Executives were also eligible for a pro-rata FY19 EVP outcome based on the proportion of time employed during FY19 and will be allocated cash rights in lieu of FY19 EVP restricted shares and performance rights.
Those cash rights are subject to the same time conditions and performance measures as those applying to performance rights and restricted shares (except the cash rights granted to Will Irving (former GE Telstra Wholesale) in lieu of performance rights are not subject to an RTSR performance condition due to constraints under the Structural Separation Undertakings (SSU)).
We have recorded a liability of $4 million as at 30 June 2019 pertaining to the cash rights.
(c) STI restricted shares
Under the STI arrangements, 25 per cent of an eligible executive’s actual STI payment is provided as restricted shares with an effective allocation date of 1 July each financial year immediately after the end of the performance period. For the CEO and other senior executives who participated in these arrangements, up to financial year 2017, half of these shares were restricted for 12 months and half for 24 months from their effective allocation date. For other executives who continue to participate in these arrangements, these shares are restricted for three years from their effective allocation date.
Performance hurdles are applied in determining the number of restricted shares allocated to executives, and therefore, restricted shares are not subject to any other performance hurdles once they have been allocated. During the restriction period, from the actual grant date, executives are entitled to vote and earn dividends on their restricted shares. However, they are restricted from dealing with the shares during this period.
If an executive leaves Telstra other than for a permitted reason before the end of the relevant restriction period, the restricted shares are forfeited. Restricted shares may also be forfeited if certain clawback events occur during the restriction period.
(d) LTI share based payment arrangements
(i) Employee Share Plan (ESP) restricted shares (equity-settled)
Restricted shares provided under the ESP were allocated to certain eligible employees at no cost (executives were excluded from the ESP).
The restricted shares are held by the Trustee on behalf of employees until the restriction period ends. For Australian based employees, the shares are released from trust on the earlier of three years from the date of allocation or the date on which the participating employee ceases relevant employment. Although the Trustee holds the restricted shares in trust, the employees retain beneficial interest (dividends, voting rights, bonus issues and right issues) in these shares until the end of the restriction period.
There are no performance hurdles for these restricted shares.
(ii) Executive LTI performance rights (no longer offered) (equity-settled)
Executive LTI performance rights were offered up to financial year 2017 with the last allocation tested on 30 June 2019. Two types of performance rights were outstanding in financial year 2019:
• RTSR performance rights• FCF ROI performance rights.
In respect of the performance rights, an executive has no legal or beneficial interest in the underlying shares, no entitlement to receive dividend from the shares and no voting rights in relation to the shares unless the performance rights became restricted shares which happened if the performance hurdle was satisfied at the end of the applicable performance period. The restriction period applying to the restricted shares is approximately one year.
Although the Trustee holds the restricted shares in trust, the executive retains the beneficial interest (dividends, voting rights, bonus issues and rights issues) in these shares until they vest and are transferred to them, on the first day after the end of the restriction period that the executive is able to deal with the shares under Telstra's Securities Trading Policy (unless forfeited).
All the FY17 LTI performance rights lapsed fully because the RTSR performance hurdle was not met at the date of testing and, albeit the target would have been met, the Board applied its discretion not to vest the FCF ROI component.
(e) Other equity plans
(i) GE Telstra Wholesale restricted shares (no longer offered) (equity-settled)
Due to the SSU arising from the nbn transaction, the executive fulfilling the GE Telstra Wholesale role was prohibited from participating in the LTI plans. As a result, an alternative remuneration arrangement was provided to that executive.
The performance hurdles were applied in determining the number of restricted shares allocated under this plan. The last allocation was made in November 2017.
In accordance with the plan terms, GE Telstra Wholesale forfeited a pro rata number of restricted shares upon his departure from Telstra in financial year 2019.
(ii) TESOP99 (equity-settled)
As part of the Commonwealth's sale of its shareholding in the financial years 1998 and 2000, Telstra offered eligible employees the opportunity to buy ordinary shares of Telstra with an interest-free loan from Telstra. The shares are held by Telstra ESOP Trustee Pty Limited (TESOP Trustee) on behalf of the employee until the loan has been repaid in full. The Telstra Employee Share Ownership Plan II (TESOP 99) has 2,903,300 outstanding equity instruments as at 30 June 2019 (2018: 2,989,600) with a total fair value of $11 million (2018: $8 million). This plan did not have a material impact on our results.
Section 5 - Our People.fm Page 144 Tuesday, August 27, 2019 8:26 AM
Notes to the financial statements (continued) Telstra Financial Report 2019
Section 5. Our people (continued)
Telstra Corporation Limited and controlled entities | 145
5.2 Employee share plans (continued)5.2.1 Description of share based payment arrangements (continued)
(e) Other equity plans (continued)
(ii) TESOP99 (equity-settled) (continued)
The employee share loan balance as at 30 June 2019 was $10 million (2018: $11 million), the weighted average loan still to be repaid was $3.39 (2018: $3.54) per instrument.
5.2.2 Fair value measurement
(a) Equity-settled awards
Table A provides a weighted average of the inputs used in measuring the fair value of equity instruments at grant date.
Table A Perfor-mance rights
Reten-tion
rights
Restrict-ed
sharesMeasurement date Oct 2018 Aug 2018 Oct 2018Share price $3.11 $3.08 $3.11Risk free rate 2.26% 1.99% -Dividend yield 6.14% 5.84% -Expected life in years 4.7 years 2.3 years -Expected stock volatility 20% - -Fair value ($) $1.98 $2.71 $2.95
The expected stock volatility is a measure of the amount by which the price is expected to fluctuate during a period. This is based on an annualised historical daily volatility of closing share prices over a certain period to the measurement date.
(b) Cash-settled awards
Table B provides a weighted average of the inputs used in measuring the fair value of cash-settled equity instruments at grant date.
Table B Cash rights Measurement date Sep 2018Share price $3.18Risk free rate 2.04%Dividend yield 6.07%Expected life in years 2.4 yearsExpected stock volatility 20%Fair value ($) $1.94
Fair value of those instruments was remeasured as at the end of the reporting period.
5.2.3 Expense recognised in profit or loss
For details of the related employee benefit expenses, refer to note 2.3.
5.2.4 Recognition and measurement
For each of our equity-settled share plans, we measure the fair value of the equity instrument at grant date and recognise the expense over the relevant vesting period in the income statement with a corresponding increase in equity (i.e. share capital). The expense is adjusted to reflect actual and expected levels of vesting.
Grant date is the date when there is a shared understanding between employees and Telstra of the terms and conditions of the plan and the employees have accepted the offer. This often occurs prior to the allocation of equity instruments to the employees.
The fair values of our equity instruments are calculated by taking into account the terms and conditions of the individual plan and as follows:
Equity instrument Fair value approach
Restricted shares
Retention rights
Market value of Telstra’s share at grant date excluding estimated dividends lost between the grant date and the allocation date
Performance rights Black-Scholes methodology and utilises Monte Carlo simulations
A liability is recognised for the fair value of cash-settled transactions. The fair value is measured initially and at each reporting date up to and including the settlement date, with changes in fair value recognised in employee benefits expense in the income statement.
Section 5 - Our People.fm Page 145 Tuesday, August 27, 2019 8:26 AM

Telstra Corporation Limited and controlled entities | 145
Notes to the financial statements (continued) Telstra Financial Report 2019Telstra Financial Report 2019Notes to the financial statements (continued) Telstra Financial Report 2019
Section 5. Our people (continued)
Telstra Corporation Limited and controlled entities | 145
5.2 Employee share plans (continued)5.2.1 Description of share based payment arrangements (continued)
(e) Other equity plans (continued)
(ii) TESOP99 (equity-settled) (continued)
The employee share loan balance as at 30 June 2019 was $10 million (2018: $11 million), the weighted average loan still to be repaid was $3.39 (2018: $3.54) per instrument.
5.2.2 Fair value measurement
(a) Equity-settled awards
Table A provides a weighted average of the inputs used in measuring the fair value of equity instruments at grant date.
Table A Perfor-mance rights
Reten-tion
rights
Restrict-ed
sharesMeasurement date Oct 2018 Aug 2018 Oct 2018Share price $3.11 $3.08 $3.11Risk free rate 2.26% 1.99% -Dividend yield 6.14% 5.84% -Expected life in years 4.7 years 2.3 years -Expected stock volatility 20% - -Fair value ($) $1.98 $2.71 $2.95
The expected stock volatility is a measure of the amount by which the price is expected to fluctuate during a period. This is based on an annualised historical daily volatility of closing share prices over a certain period to the measurement date.
(b) Cash-settled awards
Table B provides a weighted average of the inputs used in measuring the fair value of cash-settled equity instruments at grant date.
Table B Cash rights Measurement date Sep 2018Share price $3.18Risk free rate 2.04%Dividend yield 6.07%Expected life in years 2.4 yearsExpected stock volatility 20%Fair value ($) $1.94
Fair value of those instruments was remeasured as at the end of the reporting period.
5.2.3 Expense recognised in profit or loss
For details of the related employee benefit expenses, refer to note 2.3.
5.2.4 Recognition and measurement
For each of our equity-settled share plans, we measure the fair value of the equity instrument at grant date and recognise the expense over the relevant vesting period in the income statement with a corresponding increase in equity (i.e. share capital). The expense is adjusted to reflect actual and expected levels of vesting.
Grant date is the date when there is a shared understanding between employees and Telstra of the terms and conditions of the plan and the employees have accepted the offer. This often occurs prior to the allocation of equity instruments to the employees.
The fair values of our equity instruments are calculated by taking into account the terms and conditions of the individual plan and as follows:
Equity instrument Fair value approach
Restricted shares
Retention rights
Market value of Telstra’s share at grant date excluding estimated dividends lost between the grant date and the allocation date
Performance rights Black-Scholes methodology and utilises Monte Carlo simulations
A liability is recognised for the fair value of cash-settled transactions. The fair value is measured initially and at each reporting date up to and including the settlement date, with changes in fair value recognised in employee benefits expense in the income statement.
Section 5 - Our People.fm Page 145 Tuesday, August 27, 2019 8:26 AM
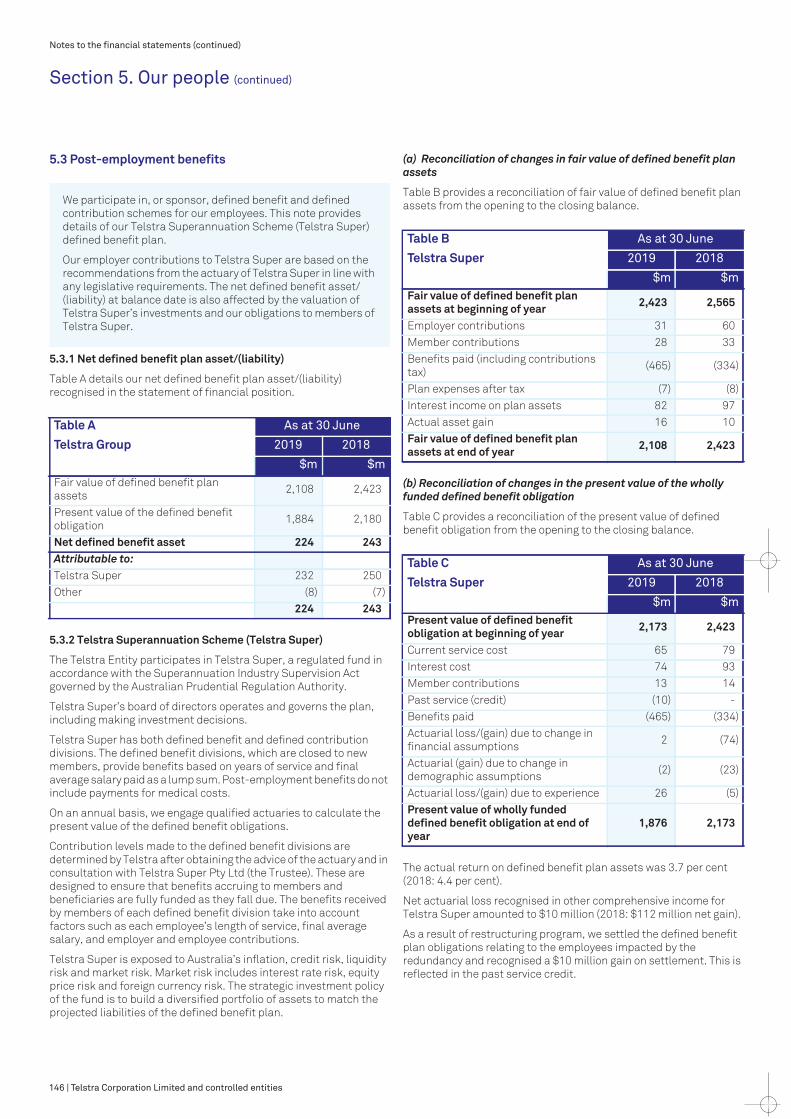
146 | Telstra Corporation Limited and controlled entities
Notes to the financial statements (continued)Notes to the financial statements (continued)
Section 5. Our people (continued)
146 | Telstra Corporation Limited and controlled entities
5.3 Post-employment benefits
We participate in, or sponsor, defined benefit and defined contribution schemes for our employees. This note provides details of our Telstra Superannuation Scheme (Telstra Super) defined benefit plan.
Our employer contributions to Telstra Super are based on the recommendations from the actuary of Telstra Super in line with any legislative requirements. The net defined benefit asset/(liability) at balance date is also affected by the valuation of Telstra Super’s investments and our obligations to members of Telstra Super.
5.3.1 Net defined benefit plan asset/(liability)
Table A details our net defined benefit plan asset/(liability) recognised in the statement of financial position.
Table A As at 30 June
Telstra Group 2019 2018
$m $mFair value of defined benefit plan assets 2,108 2,423
Present value of the defined benefit obligation 1,884 2,180
Net defined benefit asset 224 243Attributable to:Telstra Super 232 250Other (8) (7)
224 243
5.3.2 Telstra Superannuation Scheme (Telstra Super)
The Telstra Entity participates in Telstra Super, a regulated fund in accordance with the Superannuation Industry Supervision Act governed by the Australian Prudential Regulation Authority.
Telstra Super’s board of directors operates and governs the plan, including making investment decisions.
Telstra Super has both defined benefit and defined contribution divisions. The defined benefit divisions, which are closed to new members, provide benefits based on years of service and final average salary paid as a lump sum. Post-employment benefits do not include payments for medical costs.
On an annual basis, we engage qualified actuaries to calculate the present value of the defined benefit obligations.
Contribution levels made to the defined benefit divisions are determined by Telstra after obtaining the advice of the actuary and in consultation with Telstra Super Pty Ltd (the Trustee). These are designed to ensure that benefits accruing to members and beneficiaries are fully funded as they fall due. The benefits received by members of each defined benefit division take into account factors such as each employee’s length of service, final average salary, and employer and employee contributions.
Telstra Super is exposed to Australia’s inflation, credit risk, liquidity risk and market risk. Market risk includes interest rate risk, equity price risk and foreign currency risk. The strategic investment policy of the fund is to build a diversified portfolio of assets to match the projected liabilities of the defined benefit plan.
(a) Reconciliation of changes in fair value of defined benefit plan assets
Table B provides a reconciliation of fair value of defined benefit plan assets from the opening to the closing balance.
Table B As at 30 June
Telstra Super 2019 2018
$m $mFair value of defined benefit plan assets at beginning of year 2,423 2,565
Employer contributions 31 60Member contributions 28 33Benefits paid (including contributions tax) (465) (334)
Plan expenses after tax (7) (8)Interest income on plan assets 82 97Actual asset gain 16 10Fair value of defined benefit plan assets at end of year 2,108 2,423
(b) Reconciliation of changes in the present value of the wholly funded defined benefit obligation
Table C provides a reconciliation of the present value of defined benefit obligation from the opening to the closing balance.
Table C As at 30 June
Telstra Super 2019 2018
$m $mPresent value of defined benefit obligation at beginning of year 2,173 2,423
Current service cost 65 79Interest cost 74 93Member contributions 13 14Past service (credit) (10) -Benefits paid (465) (334)Actuarial loss/(gain) due to change in financial assumptions 2 (74)
Actuarial (gain) due to change in demographic assumptions (2) (23)
Actuarial loss/(gain) due to experience 26 (5)Present value of wholly funded defined benefit obligation at end of year
1,876 2,173
The actual return on defined benefit plan assets was 3.7 per cent (2018: 4.4 per cent).
Net actuarial loss recognised in other comprehensive income for Telstra Super amounted to $10 million (2018: $112 million net gain).
As a result of restructuring program, we settled the defined benefit plan obligations relating to the employees impacted by the redundancy and recognised a $10 million gain on settlement. This is reflected in the past service credit.
Section 5 - Our People.fm Page 146 Tuesday, August 27, 2019 8:26 AM
Notes to the financial statements (continued) Telstra Financial Report 2019
Section 5. Our people (continued)
Telstra Corporation Limited and controlled entities | 147
5.3 Post-employment benefits (continued)(c) Categories of plan assets
Table D details the weighted average allocation as a percentage of the fair value of total defined benefit plan assets by class based on their nature and risks.
Table D As at 30 June
Telstra Super 2019 2018
% %Asset allocationsEquity instrumentsAustralian equity ¹ 7 16International equity ¹ 8 18Private equity 3 4Debt instrumentsFixed interest ¹ 58 46
Property 8 7Cash and cash equivalents 11 4Other 5 5
100 100
1 These assets have quoted prices in active markets.
(i) Related party disclosures
As at 30 June 2019, Telstra Super owned 51,190,265 (2018: 41,973,318) shares in the Telstra Entity at a cost of $145 million (2018: $166 million) and a market value of $197 million (2018: $110 million). All these shares were fully paid at 30 June 2019. In the financial year 2019, we paid a dividend to Telstra Super of $8 million (2018: $10 million). We own 100 per cent of the equity of Telstra Super Pty Ltd, the Trustee of Telstra Super.
Telstra Super also holds promissory notes and bonds issued by the Telstra Entity. As at 30 June 2019, these securities had a cost of $14 million (2018: $61 million) and a market value of $15 million (2018: $61 million).
All purchases and sales of Telstra shares, promissory notes and bonds by Telstra Super are on an arm’s length basis and are determined by the Trustee and/or its investment managers on behalf of the members of Telstra Super.
(d) Actuarial assumptions and sensitivity analysis
Defined benefit plan
Management judgement was used to determine the following key assumptions used in the calculation of our defined benefit obligations:
• 2.5 per cent (2018: 3.0 per cent) average expected rate of increase in future salaries
• 2.4 per cent (2018: 3.7 per cent) discount rate.
We have used an eight year (2018: eight year) high quality corporate bond rate to determine the discount rate as the term matches closest to the term of the defined benefit obligations.
Our assumption for the salary inflation rate for Telstra Super reflects our long-term expectation for salary increases.
If the estimates prove to be different to actual experience, this may materially affect balances in the next reporting period.
Table E summarises how the defined benefit obligation as at 30 June 2019 would have increased/(decreased) as a result of a change in the respective assumptions by one percentage point (1pp).
Table E Defined benefit obligation
Telstra Super 1pp increase
1pp decrease
$m $mDiscount rate (135) 155Expected rate of increase in future salaries 94 (85)
(e) Employer contributions
During the year, we paid contributions totalling $31 million (2018: $60 million) at the average rate of eight per cent (2018: 15 per cent) to our defined benefit divisions, following recommendations from the actuary of Telstra Super.
We expect to contribute at the rate of five per cent to our defined benefit divisions for the financial year 2020. This contribution rate could change depending on market conditions and actuarial review during the financial year 2020.
Section 5 - Our People.fm Page 147 Tuesday, August 27, 2019 8:26 AM

Telstra Corporation Limited and controlled entities | 147
Notes to the financial statements (continued) Telstra Financial Report 2019Telstra Financial Report 2019Notes to the financial statements (continued) Telstra Financial Report 2019
Section 5. Our people (continued)
Telstra Corporation Limited and controlled entities | 147
5.3 Post-employment benefits (continued)(c) Categories of plan assets
Table D details the weighted average allocation as a percentage of the fair value of total defined benefit plan assets by class based on their nature and risks.
Table D As at 30 June
Telstra Super 2019 2018
% %Asset allocationsEquity instrumentsAustralian equity ¹ 7 16International equity ¹ 8 18Private equity 3 4Debt instrumentsFixed interest ¹ 58 46
Property 8 7Cash and cash equivalents 11 4Other 5 5
100 100
1 These assets have quoted prices in active markets.
(i) Related party disclosures
As at 30 June 2019, Telstra Super owned 51,190,265 (2018: 41,973,318) shares in the Telstra Entity at a cost of $145 million (2018: $166 million) and a market value of $197 million (2018: $110 million). All these shares were fully paid at 30 June 2019. In the financial year 2019, we paid a dividend to Telstra Super of $8 million (2018: $10 million). We own 100 per cent of the equity of Telstra Super Pty Ltd, the Trustee of Telstra Super.
Telstra Super also holds promissory notes and bonds issued by the Telstra Entity. As at 30 June 2019, these securities had a cost of $14 million (2018: $61 million) and a market value of $15 million (2018: $61 million).
All purchases and sales of Telstra shares, promissory notes and bonds by Telstra Super are on an arm’s length basis and are determined by the Trustee and/or its investment managers on behalf of the members of Telstra Super.
(d) Actuarial assumptions and sensitivity analysis
Defined benefit plan
Management judgement was used to determine the following key assumptions used in the calculation of our defined benefit obligations:
• 2.5 per cent (2018: 3.0 per cent) average expected rate of increase in future salaries
• 2.4 per cent (2018: 3.7 per cent) discount rate.
We have used an eight year (2018: eight year) high quality corporate bond rate to determine the discount rate as the term matches closest to the term of the defined benefit obligations.
Our assumption for the salary inflation rate for Telstra Super reflects our long-term expectation for salary increases.
If the estimates prove to be different to actual experience, this may materially affect balances in the next reporting period.
Table E summarises how the defined benefit obligation as at 30 June 2019 would have increased/(decreased) as a result of a change in the respective assumptions by one percentage point (1pp).
Table E Defined benefit obligation
Telstra Super 1pp increase
1pp decrease
$m $mDiscount rate (135) 155Expected rate of increase in future salaries 94 (85)
(e) Employer contributions
During the year, we paid contributions totalling $31 million (2018: $60 million) at the average rate of eight per cent (2018: 15 per cent) to our defined benefit divisions, following recommendations from the actuary of Telstra Super.
We expect to contribute at the rate of five per cent to our defined benefit divisions for the financial year 2020. This contribution rate could change depending on market conditions and actuarial review during the financial year 2020.
Section 5 - Our People.fm Page 147 Tuesday, August 27, 2019 8:26 AM

148 | Telstra Corporation Limited and controlled entities
Notes to the financial statements (continued)Notes to the financial statements (continued)
Section 5. Our people (continued)
148 | Telstra Corporation Limited and controlled entities
5.3 Post-employment benefits (continued)(e) Employer contributions (continued)
Table F shows the expected proportion of benefits paid from the defined benefit obligation in future years.
Table F Year ended 30 June
Telstra Super 2019 2018
% %Within 1 year 7 16Between 1 and 4 years 24 25Between 5 and 9 years 23 18Between 10 and 19 years 39 33After 20 years 7 8
100 100
The weighted average duration of the defined benefit plan obligations at the end of the reporting period was nine years (2018: eight years).
5.3.3 Other defined benefit schemes
Our controlled entities also participate in both funded and unfunded defined benefit schemes, which are individually and in aggregate immaterial.
5.3.4 Recognition and measurement
(a) Defined contribution plans
Our commitment to defined contribution plans is limited to making contributions in accordance with our minimum statutory requirements and other obligations. The contributions are recorded as an expense in the income statement as they become payable. We recognise a liability when we are required to make future payments as a result of employee services provided.
(b) Defined benefit plans
(i) Telstra Superannuation Scheme
We currently sponsor a post-employment defined benefit plan under the Telstra Superannuation Scheme.
At reporting date, where the fair value of the plan assets is less than the present value of the defined benefit obligations, the net deficit is recognised as a liability. In the reverse situation, the net surplus is recognised as an asset. We recognise the asset only when we have the ability to control this surplus to generate future funds that will be available to us in the form of reductions in future contributions or as a cash refund.
The actuaries use the projected unit credit method to estimate the present value of the defined benefit obligations of the plan. This method determines each year of service as giving rise to an additional unit of benefit entitlement. Each unit is measured separately to calculate the final obligation. The present value is determined by discounting the estimated future cash outflows using rates based on high quality corporate bonds.
We recognise all our defined benefit costs in the income statement, with the exception of actuarial gains and losses that are recognised directly in other comprehensive income.
Actuarial gains and losses are based on an actuarial valuation of each defined benefit plan at a reporting date. Actuarial gains and losses represent the differences between previous actuarial assumptions of future outcomes and the actual outcome, in addition to the effect of changes in actuarial assumptions.
5.4 Key management personnel compensation
Key management personnel (KMP) refer to those who have authority and responsibility for planning, directing and controlling the activities of the Telstra Group. KMP are deemed to include the following:
• the non-executive Directors of the Telstra Entity• certain executives in the Chief Executive Officer’s (CEO’s)
senior leadership team, including the CEO.
This note summarises the aggregate compensation of our KMP during the financial years 2019 and 2018, and provides information about other transactions with our KMP and their related parties.
5.4.1 KMP aggregate compensation
During the financial years 2019 and 2018, the aggregate compensation of our KMP was:
Telstra Group As at 30 June
2019 2018
$000 $000Short-term employee benefits 20,531 14,728Post-employment benefits 309 290Other long-term benefits 316 141Termination benefits 2,865 495Share-based payments 3,527 2,726
27,548 18,380
Refer to the Remuneration Report, which forms part of the Directors’ Report for further details regarding KMP remuneration.
5.4.2 Other transactions with our KMP and their related parties
During the financial years 2019 and 2018, apart from transactions trivial and domestic in nature and on normal commercial terms and conditions, there were no other transactions with our KMP and their related parties.
Section 5 - Our People.fm Page 148 Tuesday, August 27, 2019 8:26 AM
Telstra Corporation Limited and controlled entities | 149
Notes to the financial statements (continued)
Section 6. Our investments
This section outlines our group structure and includes information about our controlled entities, joint ventures and associated entities. It provides details of changes to these investments and their effect on our financial position and performance during the financial year. It also includes the results of our material joint ventures and associated entities.
SECTION 6. OUR INVESTMENTS6.1 Investments in controlled entities6.1.1 List of our investments in controlled entities
Table A sets out our material operating controlled entities as at 30 June 2019 (or ownership changes to such entities) based on a percentage of earnings before interest, income tax expense, depreciation and amortisation (EBITDA). The ownership percentages represent the relevant percentage of equity held by the subsidiary’s immediate and ultimate parent, respectively.
A complete list of our controlled entities is available online at www.telstra.com/investor.
Table ATelstra Group
% of equity held by immediate parent
% of equity held by ultimate parent
As at 30 June As at 30 June
2019 2018 2019 2018
Name of entity Country of incorporation
% % % %
Ultimate parent entity
Telstra Corporation Limited Australia
Controlled entities
Asia Global Crossing Finance Co. Ltd Bermuda 100.0 100.0 100.0 100.0
Asia Netcom Pacnet (Ireland) Limited Ireland 100.0 100.0 100.0 100.0
Bridge Point Communications Pty Ltd Australia 100.0 100.0 100.0 100.0
CloudMed Pty Ltd Australia 100.0 100.0 100.0 100.0
Telstra Health Pty Ltd Australia 100.0 100.0 100.0 100.0
Fred IT Group Pty Ltd 1, 2 Australia 50.0 50.0 50.0 50.0
Neto E-Commerce Solutions Pty Ltd 5 Australia 67.4 66.9 67.4 66.9
O2 Networks Pty Ltd Australia 100.0 100.0 100.0 100.0
Ooyala AB 6 Sweden - 100.0 - 97.0
Ooyala Holdings Inc. 4,5 United States 100.0 97.0 100.0 97.0
Ooyala Inc. 6 United States - 100.0 - 97.0
Pacific Business Solutions (China) 1, 2, 4 China 50.0 50.0 50.0 50.0
Pacnet Cable Limited Bermuda 100.0 100.0 100.0 100.0
Pacnet Internet (A) Pty Ltd Australia 100.0 100.0 100.0 100.0
Pacnet Internet (HK) Limited Hong Kong 100.0 100.0 100.0 100.0
Pacnet Limited Bermuda 100.0 100.0 100.0 100.0
Pacnet Network (Philippines) Inc. Philippines 100.0 100.0 100.0 100.0
Pacnet Network (UK) Limited United Kingdom 100.0 100.0 100.0 100.0
Pacnet Network Limited Bermuda 100.0 100.0 100.0 100.0
Pacnet Services (A) Pty. Ltd. Australia 100.0 100.0 100.0 100.0
Section 6 - Our Investments.fm Page 149 Tuesday, August 27, 2019 4:30 PM

Telstra Corporation Limited and controlled entities | 149
Notes to the financial statements (continued) Telstra Financial Report 2019Telstra Financial Report 2019
Telstra Corporation Limited and controlled entities | 149
Notes to the financial statements (continued)
Section 6. Our investments
This section outlines our group structure and includes information about our controlled entities, joint ventures and associated entities. It provides details of changes to these investments and their effect on our financial position and performance during the financial year. It also includes the results of our material joint ventures and associated entities.
SECTION 6. OUR INVESTMENTS6.1 Investments in controlled entities6.1.1 List of our investments in controlled entities
Table A sets out our material operating controlled entities as at 30 June 2019 (or ownership changes to such entities) based on a percentage of earnings before interest, income tax expense, depreciation and amortisation (EBITDA). The ownership percentages represent the relevant percentage of equity held by the subsidiary’s immediate and ultimate parent, respectively.
A complete list of our controlled entities is available online at www.telstra.com/investor.
Table ATelstra Group
% of equity held by immediate parent
% of equity held by ultimate parent
As at 30 June As at 30 June
2019 2018 2019 2018
Name of entity Country of incorporation
% % % %
Ultimate parent entity
Telstra Corporation Limited Australia
Controlled entities
Asia Global Crossing Finance Co. Ltd Bermuda 100.0 100.0 100.0 100.0
Asia Netcom Pacnet (Ireland) Limited Ireland 100.0 100.0 100.0 100.0
Bridge Point Communications Pty Ltd Australia 100.0 100.0 100.0 100.0
CloudMed Pty Ltd Australia 100.0 100.0 100.0 100.0
Telstra Health Pty Ltd Australia 100.0 100.0 100.0 100.0
Fred IT Group Pty Ltd 1, 2 Australia 50.0 50.0 50.0 50.0
Neto E-Commerce Solutions Pty Ltd 5 Australia 67.4 66.9 67.4 66.9
O2 Networks Pty Ltd Australia 100.0 100.0 100.0 100.0
Ooyala AB 6 Sweden - 100.0 - 97.0
Ooyala Holdings Inc. 4,5 United States 100.0 97.0 100.0 97.0
Ooyala Inc. 6 United States - 100.0 - 97.0
Pacific Business Solutions (China) 1, 2, 4 China 50.0 50.0 50.0 50.0
Pacnet Cable Limited Bermuda 100.0 100.0 100.0 100.0
Pacnet Internet (A) Pty Ltd Australia 100.0 100.0 100.0 100.0
Pacnet Internet (HK) Limited Hong Kong 100.0 100.0 100.0 100.0
Pacnet Limited Bermuda 100.0 100.0 100.0 100.0
Pacnet Network (Philippines) Inc. Philippines 100.0 100.0 100.0 100.0
Pacnet Network (UK) Limited United Kingdom 100.0 100.0 100.0 100.0
Pacnet Network Limited Bermuda 100.0 100.0 100.0 100.0
Pacnet Services (A) Pty. Ltd. Australia 100.0 100.0 100.0 100.0
Section 6 - Our Investments.fm Page 149 Tuesday, August 27, 2019 4:30 PM

150 | Telstra Corporation Limited and controlled entities
Notes to the financial statements (continued)Notes to the financial statements (continued)
Section 6. Our investments (continued)
150 | Telstra Corporation Limited and controlled entities
6.1 Investments in controlled entities (continued)6.1.1 List of our investments in controlled entities (continued)
Table A (continued) Telstra Group
% of equity held by immediate parent
% of equity held by ultimate parent
As at 30 June As at 30 June
2019 2018 2019 2018
Name of entity Country of incorporation
% % % %
Pacnet Services (Japan) Corp. 3 Japan 100.0 100.0 100.0 100.0
PT Teltranet Aplikasi Solusi 1, 4 Indonesia 49.0 49.0 49.0 49.0
Telstra Broadcast Services Pty Limited Australia 100.0 100.0 100.0 100.0
Telstra Cable (HK) Limited 7 Hong Kong 100.0 100.0 100.0 100.0
Telstra Global (HK) Limited 7 Hong Kong 100.0 100.0 100.0 100.0
Telstra Holdings Pty Ltd Australia 100.0 100.0 100.0 100.0
Telstra Inc. United States 100.0 100.0 100.0 100.0
Telstra International (Aus) Limited Australia 100.0 100.0 100.0 100.0
Telstra International Limited Hong Kong 100.0 100.0 100.0 100.0
Telstra International Philippines Inc. Philippines 100.0 100.0 100.0 100.0
Telstra Internet (S) Pte Ltd Singapore 100.0 100.0 100.0 100.0
Telstra iVision Pty Ltd Australia 100.0 100.0 100.0 100.0
Telstra Japan K.K. Japan 100.0 100.0 100.0 100.0
Telstra Limited United Kingdom 100.0 100.0 100.0 100.0
Telstra Multimedia Pty Limited Australia 100.0 100.0 100.0 100.0
Telstra Pay TV Pty Ltd Australia 100.0 100.0 100.0 100.0
Telstra ReadyCare Pty Ltd 5 Australia 100.0 90.5 100.0 90.5
Telstra Services (Taiwan) Inc. 3 Taiwan 100.0 100.0 100.0 100.0
Telstra Services (USA) Inc. United States 100.0 100.0 100.0 100.0
Telstra Services Asia Pacific (HK) Limited 7 Hong Kong 100.0 100.0 100.0 100.0
Telstra Singapore Pte Ltd Singapore 100.0 100.0 100.0 100.0
Sapio Pty Ltd (formerly Telstra SNP Monitoring Pty Ltd) 1 Australia 51.0 51.0 51.0 51.0
Telstra Telecommunications Private Limited 4 India 74.0 74.0 74.0 74.0
Telstra Web Holdings Inc. 3 Philippines 64.0 64.0 64.0 64.0
1 We have control over these companies through our decision making ability on the board.
2 These entities are audited, however not by Ernst & Young, our Australian statutory auditor.
3 The investment in these companies is held by various entities. The immediate parent percentage reflected represents the ultimate ownership by Telstra Corporation Limited.
4 These entities have a 31 December reporting date except for Telstra Telecommunications Private Limited which has a 31 March reporting date.
5 We increased our ownership interest in these entities via additional equity contributions during the year.
6 We disposed of these entities and their controlled entities during the year.
7 We transferred the ownership of these entities from Pacnet Cable Limited and Pacnet Services Corporation Limited to Telstra International Limited.
Section 6 - Our Investments.fm Page 150 Tuesday, August 27, 2019 8:27 AM
Notes to the financial statements (continued) Telstra Financial Report 2019
Section 6. Our investments (continued)
Telstra Corporation Limited and controlled entities | 151
6.1 Investments in controlled entities (continued)6.1.2 Deed of cross guarantee
Telstra Corporation Limited and each of the wholly-owned subsidiaries set out below (together the ‘Closed Group’), are party to a deed of cross guarantee (Deed), as defined in ASIC legislative instrument: ‘ASIC Corporations (Wholly-owned Companies) Instrument 2016/785’ (ASIC Instrument).
The effect of the Deed is that each entity in the Closed Group guarantees the payment in full of all debts of the other entities in the Closed Group in the event of their winding up.
Pursuant to the ASIC Instrument, the wholly-owned subsidiaries within the Closed Group are relieved from the requirement to prepare and lodge separate financial statements, directors’ reports and auditors’ reports.
The statement of comprehensive income and statement of financial position disclosed in this section present consolidated results of the Closed Group.
The following entities are party to the Deed and part of the Closed Group:
• Telstra Corporation Limited• Bridge Point Communications Pty Ltd• DCA eHealth Solutions Pty Ltd• iCareHealth Pty Ltd• Kloud Solutions (National) Pty Limited• Kloud Solutions Pty Ltd• Mobile Tracking and Data Pty Ltd• MSC Mobility Pty Ltd• MTData Holdings Pty Ltd• Network Design and Construction Limited• O2 Networks Pty Ltd• Pacnet Internet (A) Pty Ltd• Telstra Broadcast Services Pty Limited• Telstra Communications Limited• Telstra Digital Innovation Group Pty Ltd (formerly Readify Pty Ltd)• Telstra Health Pty Ltd• Telstra Holdings Pty Ltd• Telstra International (Aus) Limited• Telstra iVision Pty Ltd• Telstra Multimedia Pty Limited• Telstra Pay TV Pty Ltd• Telstra Plus Pty Ltd• Telstra Services Solutions Holdings Limited• Telstra Software Group Pty Ltd• Telstra Ventures Pty Limited• Virtual Machine Technology Pty Ltd
A revocation deed, which was lodged with ASIC in the 2018 financial year to revoke and release Prentice Management Consulting Pty. Ltd., Kelzone Pty. Ltd., Goodwin Enterprises (VIC) Pty. Ltd. and The Silver Lining Consulting Group Pty Ltd from the Deed, took effect on 18 December 2018 at which point these entities ceased being members of the Closed Group.
There are no other members of the Extended Closed Group (as defined in the ASIC Instrument). Telstra Finance Limited is trustee under the Deed. However, it is not a member of the Closed Group or the Extended Closed Group.
The consolidated statement of financial position and statement of comprehensive income of the entities that are members of the Closed Group are presented in Tables B and C respectively. This excludes Telstra Finance Limited. All transactions between members of the Closed Group have been eliminated.
Table B As at 30 June
Closed Group 2019 2018 Restated
$m $mCurrent assetsCash and cash equivalents 544 582Trade and other receivables and contract assets 4,597 4,789
Deferred contract costs 95 69Inventories 431 477Derivative financial assets 179 75Prepayments 412 384Total current assets 6,258 6,376Non-current assetsTrade and other receivables and contract assets 790 734
Deferred contract costs 1,232 1,180Inventories 35 19Investments – controlled entities 2,597 2,750Investments – accounted for using the equity method 1,306 1,228
Investments – other 19 32Property, plant and equipment 21,245 20,901Intangible assets 5,970 6,647Derivative financial assets 2,083 1,897Defined benefit asset 232 250Total non-current assets 35,509 35,638Total assets 41,767 42,014Current liabilitiesTrade and other payables 4,095 4,129Employee benefits 790 852Other provisions 102 88Borrowings 3,242 2,369Derivative financial liabilities 57 1Current tax payables 96 119Contract liabilities and other revenue received in advance 1,575 1,422
Total current liabilities 9,957 8,980Non-current liabilitiesOther payables 68 62Employee benefits 157 156Other provisions 145 156Borrowings 14,932 15,155Derivative financial liabilities 283 388Deferred tax liabilities 1,461 1,464Contract liabilities and other revenue received in advance 660 1,114
Total non-current liabilities 17,706 18,495Total liabilities 27,663 27,475Net assets 14,104 14,539
Section 6 - Our Investments.fm Page 151 Tuesday, August 27, 2019 8:27 AM

Telstra Corporation Limited and controlled entities | 151
Notes to the financial statements (continued) Telstra Financial Report 2019Telstra Financial Report 2019Notes to the financial statements (continued) Telstra Financial Report 2019
Section 6. Our investments (continued)
Telstra Corporation Limited and controlled entities | 151
6.1 Investments in controlled entities (continued)6.1.2 Deed of cross guarantee
Telstra Corporation Limited and each of the wholly-owned subsidiaries set out below (together the ‘Closed Group’), are party to a deed of cross guarantee (Deed), as defined in ASIC legislative instrument: ‘ASIC Corporations (Wholly-owned Companies) Instrument 2016/785’ (ASIC Instrument).
The effect of the Deed is that each entity in the Closed Group guarantees the payment in full of all debts of the other entities in the Closed Group in the event of their winding up.
Pursuant to the ASIC Instrument, the wholly-owned subsidiaries within the Closed Group are relieved from the requirement to prepare and lodge separate financial statements, directors’ reports and auditors’ reports.
The statement of comprehensive income and statement of financial position disclosed in this section present consolidated results of the Closed Group.
The following entities are party to the Deed and part of the Closed Group:
• Telstra Corporation Limited• Bridge Point Communications Pty Ltd• DCA eHealth Solutions Pty Ltd• iCareHealth Pty Ltd• Kloud Solutions (National) Pty Limited• Kloud Solutions Pty Ltd• Mobile Tracking and Data Pty Ltd• MSC Mobility Pty Ltd• MTData Holdings Pty Ltd• Network Design and Construction Limited• O2 Networks Pty Ltd• Pacnet Internet (A) Pty Ltd• Telstra Broadcast Services Pty Limited• Telstra Communications Limited• Telstra Digital Innovation Group Pty Ltd (formerly Readify Pty Ltd)• Telstra Health Pty Ltd• Telstra Holdings Pty Ltd• Telstra International (Aus) Limited• Telstra iVision Pty Ltd• Telstra Multimedia Pty Limited• Telstra Pay TV Pty Ltd• Telstra Plus Pty Ltd• Telstra Services Solutions Holdings Limited• Telstra Software Group Pty Ltd• Telstra Ventures Pty Limited• Virtual Machine Technology Pty Ltd
A revocation deed, which was lodged with ASIC in the 2018 financial year to revoke and release Prentice Management Consulting Pty. Ltd., Kelzone Pty. Ltd., Goodwin Enterprises (VIC) Pty. Ltd. and The Silver Lining Consulting Group Pty Ltd from the Deed, took effect on 18 December 2018 at which point these entities ceased being members of the Closed Group.
There are no other members of the Extended Closed Group (as defined in the ASIC Instrument). Telstra Finance Limited is trustee under the Deed. However, it is not a member of the Closed Group or the Extended Closed Group.
The consolidated statement of financial position and statement of comprehensive income of the entities that are members of the Closed Group are presented in Tables B and C respectively. This excludes Telstra Finance Limited. All transactions between members of the Closed Group have been eliminated.
Table B As at 30 June
Closed Group 2019 2018 Restated
$m $mCurrent assetsCash and cash equivalents 544 582Trade and other receivables and contract assets 4,597 4,789
Deferred contract costs 95 69Inventories 431 477Derivative financial assets 179 75Prepayments 412 384Total current assets 6,258 6,376Non-current assetsTrade and other receivables and contract assets 790 734
Deferred contract costs 1,232 1,180Inventories 35 19Investments – controlled entities 2,597 2,750Investments – accounted for using the equity method 1,306 1,228
Investments – other 19 32Property, plant and equipment 21,245 20,901Intangible assets 5,970 6,647Derivative financial assets 2,083 1,897Defined benefit asset 232 250Total non-current assets 35,509 35,638Total assets 41,767 42,014Current liabilitiesTrade and other payables 4,095 4,129Employee benefits 790 852Other provisions 102 88Borrowings 3,242 2,369Derivative financial liabilities 57 1Current tax payables 96 119Contract liabilities and other revenue received in advance 1,575 1,422
Total current liabilities 9,957 8,980Non-current liabilitiesOther payables 68 62Employee benefits 157 156Other provisions 145 156Borrowings 14,932 15,155Derivative financial liabilities 283 388Deferred tax liabilities 1,461 1,464Contract liabilities and other revenue received in advance 660 1,114
Total non-current liabilities 17,706 18,495Total liabilities 27,663 27,475Net assets 14,104 14,539
Section 6 - Our Investments.fm Page 151 Tuesday, August 27, 2019 8:27 AM

152 | Telstra Corporation Limited and controlled entities
Notes to the financial statements (continued)Notes to the financial statements (continued)
Section 6. Our investments (continued)
152 | Telstra Corporation Limited and controlled entities
6.1 Investments in controlled entities (continued)6.1.2 Deed of cross guarantee (continued)
Table B (continued) As at 30 June
Closed Group 2019 2018 Restated
$m $mEquityShare capital 4,447 4,428Reserves (47) (89)Retained profits 9,704 10,200Equity available to the closed group 14,104 14,539
Table C Year ended 30 June
Closed Group 2019 2018 Restated
$m $mIncomeRevenue (excluding finance income) 23,803 24,428Other income 2,534 2,987
26,337 27,415ExpensesLabour 4,843 4,706Goods and services purchased 8,307 7,605Net impairment losses on financial assets 179 202
Other expenses 5,686 4,92719,015 17,440
Share of net profit/(loss) from joint ventures and associated entities 8 (25)
19,007 17,465Earnings before interest, income tax expense, depreciation and amortisation (EBITDA)
7,330 9,950
Depreciation and amortisation 3,995 4,191Earnings before interest and income tax expense (EBIT) 3,335 5,759
Finance income 241 225Finance costs 804 754Net finance costs 563 529Profit before income tax expense 2,772 5,230Income tax expense 942 1,611Profit for the year 1,830 3,619
Table C (continued) As at 30 June
Closed Group 2019 2018 Restated
$m $mItems that will not be reclassified to the Closed Group income statementRetained profitsActuarial (loss)/gain on defined benefit plans (10) 112
Income tax on actuarial (loss)/gain on defined benefit plans 3 (34)
Fair value of equity instruments reserveGain/(loss) from investments in equity instruments designated at fair value through other comprehensive income
3 (16)
Share of other comprehensive income of equity accounted entities 66 29
Income tax on fair value movements for investments in equity instruments (22) 2
40 93Items that may be subsequently reclassified to the Closed Group income statementMovements in cash flow hedging reserve 3 (97)
Income tax on movements in the cash flow hedging reserve (1) 29
Changes in the value of the foreign currency basis spread (22) (31)
Income tax on movements in the foreign currency basis spread reserve 7 9
(13) (90)Total other comprehensive income for the Closed Group 27 3
Total comprehensive income for the year for the Closed Group 1,857 3,622
Section 6 - Our Investments.fm Page 152 Tuesday, August 27, 2019 8:27 AM
Notes to the financial statements (continued) Telstra Financial Report 2019
Section 6. Our investments (continued)
Telstra Corporation Limited and controlled entities | 153
6.1 Investments in controlled entities (continued)6.1.2 Deed of cross guarantee (continued)
Table D provides a reconciliation of retained profits of the Closed Group from the opening to the closing balance.
Table D Year ended 30 June
Closed Group 2019 2018 Restated
$m $mRetained profits at the beginning of the financial year available to the Closed Group
10,200 9,640
Effect on retained profits from addition of entities to the Closed Group - 13
Effect on retained profits arising from AASB 9 (60) -
Total comprehensive income recognised in retained profits 1,823 3,697
Dividend (2,259) (3,150)Retained profits at the end of the financial year available to the Closed Group
9,704 10,200
6.2 Investments in joint ventures and associated entities
We account for joint ventures and associated entities using the equity method. Under this method, we recognise the investment at cost and subsequently adjust it for our share of profits or losses, which are recognised in the income statement and our share of other comprehensive income, which is recognised in the statement of comprehensive income. Generally, dividend received reduce the carrying value of the investment.
The movements in the carrying amount of equity accounted investments in our joint ventures and associated entities are summarised in Table A.
Table A As at 30 June
Telstra Group Joint ventures Associated entities
2019 2018 2019 2018
$m $m $m $mCarrying amount of investments at beginning of year 296 2 941 192Additions 29 759 - 800Disposals - (485) - (1)Contribution to Telstra Ventures Fund II, L.P. - - - (26)Net impairment loss recognised in the income statement (2) - - (9)
323 276 941 956Share of net profit/(loss) (6) (16) 18 (6)Share of distributions (35) - (9) (9)Share of reserves 66 36 - -Carrying amount of investments at end of year 348 296 950 941
Section 6 - Our Investments.fm Page 153 Tuesday, August 27, 2019 8:27 AM

Telstra Corporation Limited and controlled entities | 153
Notes to the financial statements (continued) Telstra Financial Report 2019Telstra Financial Report 2019Notes to the financial statements (continued) Telstra Financial Report 2019
Section 6. Our investments (continued)
Telstra Corporation Limited and controlled entities | 153
6.1 Investments in controlled entities (continued)6.1.2 Deed of cross guarantee (continued)
Table D provides a reconciliation of retained profits of the Closed Group from the opening to the closing balance.
Table D Year ended 30 June
Closed Group 2019 2018 Restated
$m $mRetained profits at the beginning of the financial year available to the Closed Group
10,200 9,640
Effect on retained profits from addition of entities to the Closed Group - 13
Effect on retained profits arising from AASB 9 (60) -
Total comprehensive income recognised in retained profits 1,823 3,697
Dividend (2,259) (3,150)Retained profits at the end of the financial year available to the Closed Group
9,704 10,200
6.2 Investments in joint ventures and associated entities
We account for joint ventures and associated entities using the equity method. Under this method, we recognise the investment at cost and subsequently adjust it for our share of profits or losses, which are recognised in the income statement and our share of other comprehensive income, which is recognised in the statement of comprehensive income. Generally, dividend received reduce the carrying value of the investment.
The movements in the carrying amount of equity accounted investments in our joint ventures and associated entities are summarised in Table A.
Table A As at 30 June
Telstra Group Joint ventures Associated entities
2019 2018 2019 2018
$m $m $m $mCarrying amount of investments at beginning of year 296 2 941 192Additions 29 759 - 800Disposals - (485) - (1)Contribution to Telstra Ventures Fund II, L.P. - - - (26)Net impairment loss recognised in the income statement (2) - - (9)
323 276 941 956Share of net profit/(loss) (6) (16) 18 (6)Share of distributions (35) - (9) (9)Share of reserves 66 36 - -Carrying amount of investments at end of year 348 296 950 941
Section 6 - Our Investments.fm Page 153 Tuesday, August 27, 2019 8:27 AM
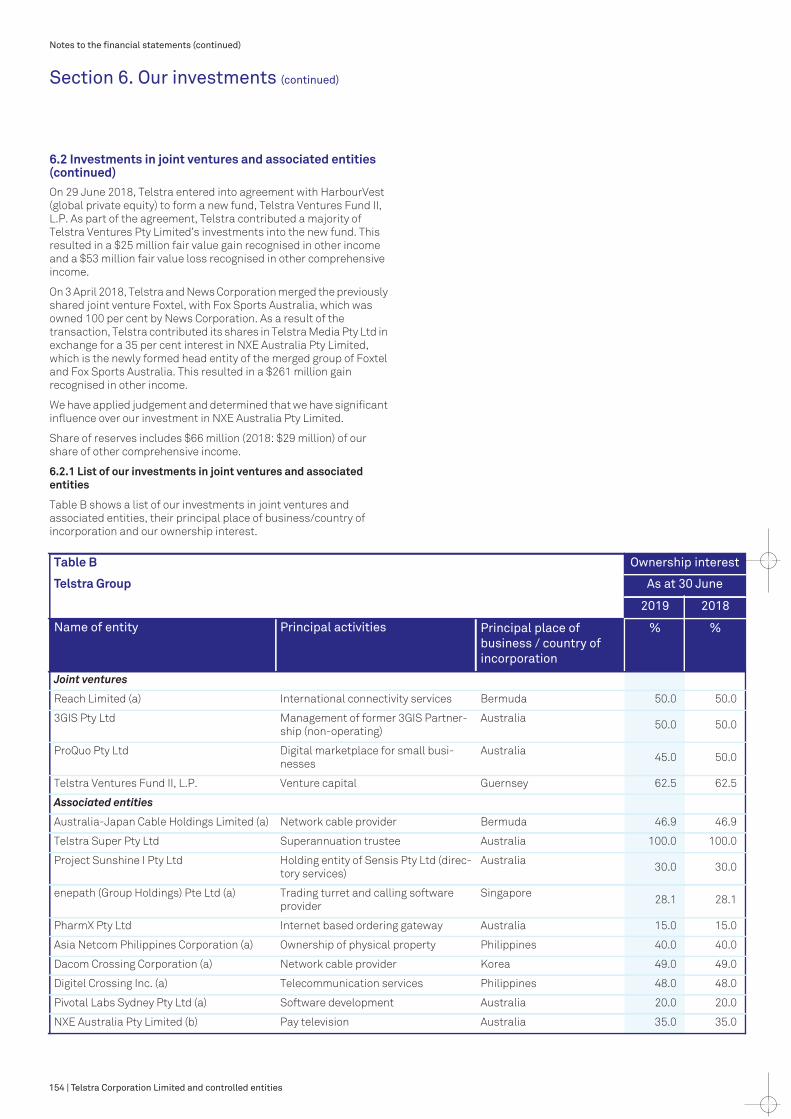
154 | Telstra Corporation Limited and controlled entities
Notes to the financial statements (continued)Notes to the financial statements (continued)
Section 6. Our investments (continued)
154 | Telstra Corporation Limited and controlled entities
6.2 Investments in joint ventures and associated entities (continued)On 29 June 2018, Telstra entered into agreement with HarbourVest (global private equity) to form a new fund, Telstra Ventures Fund II, L.P. As part of the agreement, Telstra contributed a majority of Telstra Ventures Pty Limited’s investments into the new fund. This resulted in a $25 million fair value gain recognised in other income and a $53 million fair value loss recognised in other comprehensive income.
On 3 April 2018, Telstra and News Corporation merged the previously shared joint venture Foxtel, with Fox Sports Australia, which was owned 100 per cent by News Corporation. As a result of the transaction, Telstra contributed its shares in Telstra Media Pty Ltd in exchange for a 35 per cent interest in NXE Australia Pty Limited, which is the newly formed head entity of the merged group of Foxtel and Fox Sports Australia. This resulted in a $261 million gain recognised in other income.
We have applied judgement and determined that we have significant influence over our investment in NXE Australia Pty Limited.
Share of reserves includes $66 million (2018: $29 million) of our share of other comprehensive income.
6.2.1 List of our investments in joint ventures and associated entities
Table B shows a list of our investments in joint ventures and associated entities, their principal place of business/country of incorporation and our ownership interest.
Table B Ownership interest
Telstra Group As at 30 June
2019 2018
Name of entity Principal activities Principal place of business / country of incorporation
% %
Joint ventures
Reach Limited (a) International connectivity services Bermuda 50.0 50.0
3GIS Pty Ltd Management of former 3GIS Partner-ship (non-operating)
Australia 50.0 50.0
ProQuo Pty Ltd Digital marketplace for small busi-nesses
Australia 45.0 50.0
Telstra Ventures Fund II, L.P. Venture capital Guernsey 62.5 62.5
Associated entities
Australia-Japan Cable Holdings Limited (a) Network cable provider Bermuda 46.9 46.9
Telstra Super Pty Ltd Superannuation trustee Australia 100.0 100.0
Project Sunshine I Pty Ltd Holding entity of Sensis Pty Ltd (direc-tory services)
Australia 30.0 30.0
enepath (Group Holdings) Pte Ltd (a) Trading turret and calling software provider
Singapore 28.1 28.1
PharmX Pty Ltd Internet based ordering gateway Australia 15.0 15.0
Asia Netcom Philippines Corporation (a) Ownership of physical property Philippines 40.0 40.0
Dacom Crossing Corporation (a) Network cable provider Korea 49.0 49.0
Digitel Crossing Inc. (a) Telecommunication services Philippines 48.0 48.0
Pivotal Labs Sydney Pty Ltd (a) Software development Australia 20.0 20.0
NXE Australia Pty Limited (b) Pay television Australia 35.0 35.0
Section 6 - Our Investments.fm Page 154 Tuesday, August 27, 2019 8:27 AM
Notes to the financial statements (continued) Telstra Financial Report 2019
Section 6. Our investments (continued)
Telstra Corporation Limited and controlled entities | 155
6.2 Investments in joint ventures and associated entities (continued)6.2.1 List of our investments in joint ventures and associated entities (continued)
Significant influence over
our investments
We applied management judgement to determine that we do not control Telstra Super Pty Ltd even though we own 100 per cent of its equity. Telstra Super Pty Ltd is a trustee for the Telstra Superannuation Scheme. We do not consolidate Telstra Super Pty Ltd as we do not control the board of directors. The board of directors consists of an equal number of employer and member representatives and an independent chairman. Our voting power over the relevant activities is 44 per cent, which is equivalent to our representation on the board. The entity is therefore classified as an associated entity as we have significant influence over it.
(a) Joint ventures and associated entities with different reporting dates
Several of our joint ventures and associated entities have reporting dates that differ from our reporting date of 30 June for the financial year 2019 as follows:
• Reach Limited – 31 December• Australia-Japan Cable Holdings Limited – 31 December• Asia Netcom Philippines Corporation – 31 December• Dacom Crossing Corporation – 31 December• Digitel Crossing Inc. – 31 December• enepath (Group Holdings) Pte Ltd – 31 March• Pivotal Labs Sydney Pty Ltd – 31 January.
The differences in reporting dates are due to jurisdictional requirements. Financial reports prepared as at 30 June are used for equity accounting purposes. Our ownership interest in joint ventures and associated entities with different reporting dates is the same at that reporting date as at 30 June unless otherwise noted.
Joint control of our
investments
We applied management judgement to determine that we have joint control of our investment in Telstra Ventures Fund II, L.P. While we hold 62.5 per cent of the partnership interest on a fully committed basis, key decisions for the entity require the unanimous approval of the Advisory Committee, on which we hold one of the two seats, or a majority of at least 75 per cent of the fully committed capital.
(b) NXE Australia Pty Limited
Telstra has a 35 percent interest in NXE Australia Pty Limited, an associate which provides subscription TV services. Telstra's interest in NXE Australia Pty Limited is accounted for using the equity method in the consolidated financial statements. Financial information of NXE Australia Pty Limited and its controlled entities for the 2019 financial year is summarised in Table C based on their consolidated management financial statements prepared in accordance with Australian Accounting Standards. The information disclosed reflects the amounts presented in the financial statements of NXE Australia Pty Limited and not Telstra’s share of those amounts. The management financial information has been adjusted to reflect adjustments made by Telstra when using the equity accounting method, including fair value adjustments and modifications for differences in accounting policy.
Table C Year ended 30 June
NXE Australia Pty Limited 2019 2018 Restated
$m $mCurrent assets 733 775Non-current assets 5,324 5,194Current liabilities (1,185) (1,336)Non-current liabilities (2,628) (2,384)Equity 2,244 2,249Telstra's share in equity 35% (2018: 35%) 785 787
Purchase price adjustments (20) (13)Telstra's carrying amount of the investment 765 774
Revenue 3,078 1,320Operating expenses (3,087) (1,661)Loss before tax (9) (341)Income tax expense 3 251Loss for the year (6) (90)Other comprehensive income (3) 33Total comprehensive income for the year (9) (57)
Purchase price adjustments (20) (13)Adjusted loss for the period (29) (70)Telstra's share of loss for the year (35%) (10) (25)
Revenue includes share of profits from associated entities.
The financial year 2018 has been restated to reflect the final balances as per the NXE Australia Pty Limited financial statements.
Section 6 - Our Investments.fm Page 155 Tuesday, August 27, 2019 8:27 AM

Telstra Corporation Limited and controlled entities | 155
Notes to the financial statements (continued) Telstra Financial Report 2019Telstra Financial Report 2019Notes to the financial statements (continued) Telstra Financial Report 2019
Section 6. Our investments (continued)
Telstra Corporation Limited and controlled entities | 155
6.2 Investments in joint ventures and associated entities (continued)6.2.1 List of our investments in joint ventures and associated entities (continued)
Significant influence over
our investments
We applied management judgement to determine that we do not control Telstra Super Pty Ltd even though we own 100 per cent of its equity. Telstra Super Pty Ltd is a trustee for the Telstra Superannuation Scheme. We do not consolidate Telstra Super Pty Ltd as we do not control the board of directors. The board of directors consists of an equal number of employer and member representatives and an independent chairman. Our voting power over the relevant activities is 44 per cent, which is equivalent to our representation on the board. The entity is therefore classified as an associated entity as we have significant influence over it.
(a) Joint ventures and associated entities with different reporting dates
Several of our joint ventures and associated entities have reporting dates that differ from our reporting date of 30 June for the financial year 2019 as follows:
• Reach Limited – 31 December• Australia-Japan Cable Holdings Limited – 31 December• Asia Netcom Philippines Corporation – 31 December• Dacom Crossing Corporation – 31 December• Digitel Crossing Inc. – 31 December• enepath (Group Holdings) Pte Ltd – 31 March• Pivotal Labs Sydney Pty Ltd – 31 January.
The differences in reporting dates are due to jurisdictional requirements. Financial reports prepared as at 30 June are used for equity accounting purposes. Our ownership interest in joint ventures and associated entities with different reporting dates is the same at that reporting date as at 30 June unless otherwise noted.
Joint control of our
investments
We applied management judgement to determine that we have joint control of our investment in Telstra Ventures Fund II, L.P. While we hold 62.5 per cent of the partnership interest on a fully committed basis, key decisions for the entity require the unanimous approval of the Advisory Committee, on which we hold one of the two seats, or a majority of at least 75 per cent of the fully committed capital.
(b) NXE Australia Pty Limited
Telstra has a 35 percent interest in NXE Australia Pty Limited, an associate which provides subscription TV services. Telstra's interest in NXE Australia Pty Limited is accounted for using the equity method in the consolidated financial statements. Financial information of NXE Australia Pty Limited and its controlled entities for the 2019 financial year is summarised in Table C based on their consolidated management financial statements prepared in accordance with Australian Accounting Standards. The information disclosed reflects the amounts presented in the financial statements of NXE Australia Pty Limited and not Telstra’s share of those amounts. The management financial information has been adjusted to reflect adjustments made by Telstra when using the equity accounting method, including fair value adjustments and modifications for differences in accounting policy.
Table C Year ended 30 June
NXE Australia Pty Limited 2019 2018 Restated
$m $mCurrent assets 733 775Non-current assets 5,324 5,194Current liabilities (1,185) (1,336)Non-current liabilities (2,628) (2,384)Equity 2,244 2,249Telstra's share in equity 35% (2018: 35%) 785 787
Purchase price adjustments (20) (13)Telstra's carrying amount of the investment 765 774
Revenue 3,078 1,320Operating expenses (3,087) (1,661)Loss before tax (9) (341)Income tax expense 3 251Loss for the year (6) (90)Other comprehensive income (3) 33Total comprehensive income for the year (9) (57)
Purchase price adjustments (20) (13)Adjusted loss for the period (29) (70)Telstra's share of loss for the year (35%) (10) (25)
Revenue includes share of profits from associated entities.
The financial year 2018 has been restated to reflect the final balances as per the NXE Australia Pty Limited financial statements.
Section 6 - Our Investments.fm Page 155 Tuesday, August 27, 2019 8:27 AM

156 | Telstra Corporation Limited and controlled entities
Notes to the financial statements (continued)Notes to the financial statements (continued)
Section 6. Our investments (continued)
156 | Telstra Corporation Limited and controlled entities
6.2 Investments in joint ventures and associated entities (continued)6.2.2 Other joint ventures and associated entities
Our share of the aggregate financial information (including joint ventures and associated entities where equity accounting has been suspended) is presented in Table D.
Table D Year ended/As at 30 June
Telstra Group Joint ventures Associated entities
2019 2018 2019 2018
$m $m $m $mCarrying amount of investment 348 296 950 941
Group's share of:Profit/(loss) (5) (14) 20 -Other comprehensive income
61 32 (1) (1)
Total comprehensive income
56 18 19 (1)
6.2.3 Suspension of equity accounting
Table E presents our unrecognised share of profits/(losses) for the period and cumulatively for our entities where equity accounting has ceased and the investment is recorded at zero due to losses made by these entities and/or reductions in the equity accounted carrying amount.
Table E Year ended 30 June
Telstra Group Period Cumula -tive
Period Cumula -tive
2019 2019 2018 2018
$m $m $m $mJoint venturesReach Limited 1 (547) 2 (548)Associated entitiesAustralia-Japan Cable Holdings Limited
3 (68) 6 (71)
4 (615) 8 (619)
6.2.4 Transactions with our joint ventures and associated entities
Table F details transactions with our joint ventures and associated entities recorded in the income statement and statement of financial position.
Table F Year ended/As at
Telstra Group 30 June
2019 2018 Restated
$m $mIncomeSale of goods and services 201 249Interest income from loans to joint ventures and associated entities - 13
ExpensesPurchase of goods and services 859 927Interest expense on loans from joint ventures and associated entities 8 6
Total amounts receivable as at 30 JuneCurrentJoint ventures and associated entities – receivables 41 36
Non-currentJoint ventures and associated entities – loans 8 7
Allowance for amounts owed by joint ventures and associated entities (8) (7)
- -Movement in allowance for amounts owed by joint ventures and associated entitiesOpening balance (7) (7)Foreign currency exchange differences (1) -Closing balance (8) (7)Total amounts payable as at 30 JuneCurrentJoint ventures and associated entities – payables 163 92
Non-currentJoint ventures and associated entities – loans 79 80
Section 6 - Our Investments.fm Page 156 Tuesday, August 27, 2019 8:27 AM
Notes to the financial statements (continued) Telstra Financial Report 2019
Section 6. Our investments (continued)
Telstra Corporation Limited and controlled entities | 157
6.2 Investments in joint ventures and associated entities (continued)6.2.4 Transactions with our joint ventures and associated entities (continued)
(a) Sale and purchase of goods and services
We sold and purchased goods and services, and received and paid interest from/to our joint ventures and associated entities. These transactions were in the ordinary course of business and on normal commercial terms and conditions.
Details of individually significant transactions with our joint ventures and associated entities during the financial year 2019 were as follows:
• we purchased pay television services amounting to $777 million (2018: $810 million) from Foxtel. The purchases were to enable the resale of Foxtel** services, including Pay TV content, to our existing customers as part of our ongoing product bundling initiatives.
• we made sales to Foxtel for our broadband system services of $35 million (2018: $61 million) and wholesale services of $55 million (2018: $58 million).
(b) Loans to joint ventures and associated entities
Loans provided to joint ventures and associated entities relate to Reach Limited of $8 million (2018: $7 million to Reach Limited).
The loan provided to Reach Limited is an interest-free loan and repayable upon the giving of 12 months’ notice by both PCCW Limited and us. We have fully provided for the non-recoverability of the loan as we do not consider that Reach Limited is in a position to be able to repay the loan amount in the medium term.
(c) Loans from joint ventures and associated entities
As at 30 June 2019, we had a loan payable amount of $79 million (2018: $80 million) under a loan agreement with an associated entity, Project Sunshine I Pty Ltd which includes capitalised interest. The loan has an interest rate of 9.5 per cent per annum and a maturity date of 31 December 2020.
(d) Commitments
We have no further purchase commitments to Project Sunshine I Pty Ltd for advertising services (2018: $8 million).
6.2.5 Recognition and measurement
(a) Investments in joint ventures
A joint venture is a joint arrangement whereby the parties that have joint control of the arrangement have rights to the net assets of the arrangement. Our interests in joint ventures are accounted for using the equity method of accounting.
(b) Investments in associated entities
These are investments in entities over which we have the ability to exercise significant influence but we do not control the decisions of the entity. Our interests in associated entities are accounted for using the equity method of accounting.
(c) Equity method of accounting
Investments in associated entities and joint ventures are carried in the consolidated balance sheet at cost plus post-acquisition changes in our share of the investment’s net assets and net of impairment loss. Goodwill relating to an investment in an associated entity or joint venture is included in the carrying value of the investment and is not amortised. When Telstra’s share of losses exceeds our investment in an associated entity or joint venture, the carrying amount of the investment is reduced to nil and no further losses are recognised.
The equity accounted investment in NXE Australia Pty Limited is assessed for impairment on an annual basis or when there are impairment indicators. We apply management judgement to determine the recoverable amount of the investment using a ‘value in use’ calculation for our impairment assessment. These judgements include selection of terminal growthrate and discount rate based on past experience and our expectations for the future.
Section 6 - Our Investments.fm Page 157 Tuesday, August 27, 2019 8:27 AM

Telstra Corporation Limited and controlled entities | 157
Notes to the financial statements (continued) Telstra Financial Report 2019Telstra Financial Report 2019Notes to the financial statements (continued) Telstra Financial Report 2019
Section 6. Our investments (continued)
Telstra Corporation Limited and controlled entities | 157
6.2 Investments in joint ventures and associated entities (continued)6.2.4 Transactions with our joint ventures and associated entities (continued)
(a) Sale and purchase of goods and services
We sold and purchased goods and services, and received and paid interest from/to our joint ventures and associated entities. These transactions were in the ordinary course of business and on normal commercial terms and conditions.
Details of individually significant transactions with our joint ventures and associated entities during the financial year 2019 were as follows:
• we purchased pay television services amounting to $777 million (2018: $810 million) from Foxtel. The purchases were to enable the resale of Foxtel** services, including Pay TV content, to our existing customers as part of our ongoing product bundling initiatives.
• we made sales to Foxtel for our broadband system services of $35 million (2018: $61 million) and wholesale services of $55 million (2018: $58 million).
(b) Loans to joint ventures and associated entities
Loans provided to joint ventures and associated entities relate to Reach Limited of $8 million (2018: $7 million to Reach Limited).
The loan provided to Reach Limited is an interest-free loan and repayable upon the giving of 12 months’ notice by both PCCW Limited and us. We have fully provided for the non-recoverability of the loan as we do not consider that Reach Limited is in a position to be able to repay the loan amount in the medium term.
(c) Loans from joint ventures and associated entities
As at 30 June 2019, we had a loan payable amount of $79 million (2018: $80 million) under a loan agreement with an associated entity, Project Sunshine I Pty Ltd which includes capitalised interest. The loan has an interest rate of 9.5 per cent per annum and a maturity date of 31 December 2020.
(d) Commitments
We have no further purchase commitments to Project Sunshine I Pty Ltd for advertising services (2018: $8 million).
6.2.5 Recognition and measurement
(a) Investments in joint ventures
A joint venture is a joint arrangement whereby the parties that have joint control of the arrangement have rights to the net assets of the arrangement. Our interests in joint ventures are accounted for using the equity method of accounting.
(b) Investments in associated entities
These are investments in entities over which we have the ability to exercise significant influence but we do not control the decisions of the entity. Our interests in associated entities are accounted for using the equity method of accounting.
(c) Equity method of accounting
Investments in associated entities and joint ventures are carried in the consolidated balance sheet at cost plus post-acquisition changes in our share of the investment’s net assets and net of impairment loss. Goodwill relating to an investment in an associated entity or joint venture is included in the carrying value of the investment and is not amortised. When Telstra’s share of losses exceeds our investment in an associated entity or joint venture, the carrying amount of the investment is reduced to nil and no further losses are recognised.
The equity accounted investment in NXE Australia Pty Limited is assessed for impairment on an annual basis or when there are impairment indicators. We apply management judgement to determine the recoverable amount of the investment using a ‘value in use’ calculation for our impairment assessment. These judgements include selection of terminal growthrate and discount rate based on past experience and our expectations for the future.
Section 6 - Our Investments.fm Page 157 Tuesday, August 27, 2019 8:27 AM

158 | Telstra Corporation Limited and controlled entities
Notes to the financial statements (continued)
158 | Telstra Corporation Limited and controlled entities
Notes to the financial statements (continued)
Section 7. Other information
This section provides other information and disclosures not included in the other sections, for example our external auditor’s remuneration, commitments and contingencies, parent entity disclosures and significant events occurring after reporting date.
SECTION 7. OTHER INFORMATION7.1 Other accounting policies7.1.1 Changes in accounting policies on adoption of the new accounting standards
We note the following new standards and amendments to the accounting standards which we have adopted in the financial year 2019:
• AASB 9 (2014): ‘Financial Instruments’ impairment sections• AASB 15 ‘Revenue from Contracts with Customers’ • AASB 2016-5 ‘Amendments to Australian Accounting Standards -
Classification and Measurement of Share-based Payment Transactions’
There was no significant impact on our financial results arising from AASB 2016-5.
Adoption of both AASB 15 and AASB 9 (2014) had a significant effect on our financial results. A summary of the key impacts and restatement of the financial statements previously reported are included in note 1.5.
Key changes in the accounting policies resulting from the adoption of the new accounting standards are detailed below and relate to revenue recognition, deferred contract costs and impairment of financial assets. These changes impacted our measurement, recognition and presentation of the relevant balances and transactions.
(a) Our contracts with customers
AASB 15 impacts differ depending on the type of customer contract. Refer to note 2.2.1 for details about our contracts with customers.
(b) Changes in the accounting policy for revenue from contracts with customers
AASB 15 establishes principles for reporting the nature, amount, timing and uncertainty of revenue and cash flows arising from an entity’s contracts with customers, and requires revenue to be recognised in a manner that depicts the transfer of promised goods or services to a customer and at an amount that reflects the consideration expected in exchange for transferring those goods or services. This is achieved by applying the following five steps:
• identify the contract with the customer• identify the performance obligations in the contract• determine the transaction price• allocate the transaction price to the performance obligations in
the contract based on their relative standalone selling prices• recognise revenue when (or as) performance obligations are
satisfied.
Refer to note 2.2.3 for our accounting policy for revenue recognition and measurement under AASB 15.
AASB 15 also provides guidance relating to the treatment of contract costs which are not in scope of other accounting standards, i.e. incremental costs of obtaining a contract and costs to fulfil the contract.
Refer to note 3.8.1 for our accounting policy for recognition and measurement of contract costs under AASB 15.
The adoption of the new revenue standard resulted in a number of accounting policy changes, a financial impact to our opening retained earnings as at 1 July 2017 and restatement of the financial performance for the year ended 30 June 2018.
Identified impacts primarily related to the timing of revenue recognition, the deferral of costs to obtain a contract with a customer, expensing some of the previously deferred expenditure to fulfil a contract and changes in the classification of revenue and related items in the financial statements. These changes are summarised below.
(i) Identifying customer contracts, their combinations and modifications
AASB 15 focuses on legal rights and obligations included in a contract (which may be a combined contract) when determining the contract level and its term for accounting purposes. AASB 15 guidance also assumes that the contract will not be cancelled, renewed or modified. Establishing the contract term for accounting purposes impacts determination of performance obligations and the transaction price to be allocated to goods and services. Therefore, the timing and amount of revenue recognised may be impacted.
Our mobile long-term contracts often offer a bundle of hardware (delivered upfront) and services (delivered over the contract term), where the customer pays a monthly fee and receives a discount, which is allocated between the hardware and services based on their relative selling prices. When determining the customer contract, AASB 15 requires us to assess the combination of two or more contracts entered into at or near the same time with the same customer. As a result, we have changed the accounting treatment of customer contracts sold via our dealer channel, where the previously applied substance over form principle has been overridden by the new contract combination rules. This precluded us from combining separate legal contracts, i.e. with the dealer for hardware and the customer for services. Consequently, no discounts have been allocated to hardware sold via dealer channel, which resulted in a higher hardware revenue at the time of its recognition and lower services revenue over the customer contract term.
Our nbn Definitive Agreements (nbn DAs) and related arrangements include a number of separate legal contracts with both nbn co and the Commonwealth Government (being related parties hence treated as the same customer for accounting purposes) which have been negotiated together with a common commercial objective. The nbn DAs were originally signed in 2011 and subsequently modified in 2014 and 2015. These separate legal contracts have been combined under the AASB 15 assessment. However, the combined nbn DAs and related arrangements include a number of out of scope elements.
This includes Telstra Universal Service Obligation Performance Agreement and the Retraining Deed, which have both been separately priced and continue to be accounted for as government grants. The Subscriber Agreement also continues to be separately accounted for as other income given the nbn disconnection fees do not relate to our ordinary activities and there is no price dependency on other nbn DAs.
Section 7 - Other Information.fm Page 158 Tuesday, August 27, 2019 8:40 AM
Notes to the financial statements (continued) Telstra Financial Report 2019
Section 7. Other information (continued)
Telstra Corporation Limited and controlled entities | 159
7.1 Other accounting policies (continued)7.1.1 Changes in accounting policies on adoption of the new accounting standards (continued)
(b) Changes in the accounting policy for revenue from contracts with customers (continued)
(i) Identifying customer contracts, their combinations and modifications (continued)
On the other hand, the additional payment received under the Information Campaign and Migration (ICM) Deed for the build of nbn related infrastructure, has been combined and accounted for together with the Infrastructure Services Agreement (ISA). ISA also includes payments for sale of our infrastructure assets, which are not in scope of AASB 15, however, the timing of control transfer for these assets and the amount of consideration to be included in the net gain on their disposal have been determined by reference to the AASB 15 principles. The combined accounting contract comprised of nbn DAs and related arrangements has a minimum fixed term of 30 years for accounting purposes.
Prior to the transition date, our accounting was largely aligned to the legal term of the contacts, which in some cases only provided general terms and conditions (including price lists) under which customers could order goods and services in the future. On adoption of AASB 15, the contract term for accounting purposes has changed for a number of our enterprise and government contracts, our wholesale contracts and commercial contracts with nbn co. This is because the five steps apply to goods or services ordered under each valid purchase order or a statement of work raised under the terms of these agreements.
AASB 15 gives far greater detail on how to account for contract modifications than the prior revenue accounting principles. Changes must be accounted for either as a retrospective cumulative change to revenue (creating either a catch up or deferral of past revenues for all performance obligations in the original contract), a prospective change to revenue with a reallocation of revenues amongst remaining performance obligations in the original contract, as a separate contract which will not require any reallocation to performance obligations in the original contract, or both a cumulative change and prospective change to revenue in the original contract.
Prior to the transition date, we accounted for any changes in our retail mass market contracts prospectively. Under AASB 15, we do not expect material impacts from modifications of these contracts because the standard terms and conditions of our homogeneous mass market contracts are normally not re-negotiated and the customers’ rights to move up and down within the plan family are included in each contract from its inception.
However, our bespoke contracts with small business, enterprise and wholesale customers are varied or re-negotiated from time to time. Prior to the transition date, depending on the nature and legal form of the negotiated changes, we have considered the specific facts and circumstances and we have determined the appropriate accounting treatment using the accounting principles that existed at the time. Since transition to AASB 15, the new rules impact any bespoke contract re-negotiations from financial year 2018 onwards. This is because we have elected to apply a transition practical expedient and reflected the aggregate effect of all of the modifications that have occurred before 1 July 2017 when arriving at the retained earnings adjustments. For the restatement of the financial year 2018, we have not identified material adjustments arising from contract modifications of our bespoke contracts.
(ii) Identifying performance obligations
AASB 15 provides guidance on determining if goods or services are distinct and therefore if revenue should be allocated and recognised when these goods have been delivered or the services performed (i.e. when the customer controls them). The new guidance has resulted in some changes to our prior accounting policy of identifying deliverables which have value to the customer on a standalone basis.
Under some of our enterprise and wholesale arrangements, we receive customer and developer contributions to extend, relocate or amend our network assets to ultimately enable delivery of telecommunication services to end users. Prior to the transition date, the contributed network assets (or cash for network construction activities) have been recognised as sales revenue over the period of the network construction activities if they were a separate deliverable under Interpretation 18: ‘Transfer of Assets from Customers’. Interpretation 18 has been superseded by AASB 15 and we have changed our accounting for these type of arrangements.
Depending on whether ongoing telecommunication services have also been purchased under the same arrangement, these contracts will be accounted for in a different way on transition to AASB 15.
Where the counterparty makes a contribution for network construction activities and purchases ongoing services under the same (or linked) contract(s), the arrangement is within the scope of AASB 15. The upfront contribution is added to the total transaction price of the customer contract and allocated to the distinct goods and services to be delivered under that contract. Compared to prior accounting, this resulted in a deferral of sales revenue due to the long term nature of these contracts.
However, where the counterparty does not purchase any ongoing services under the same (or linked) contract(s), the arrangement is neither within the scope of AASB 15 nor covered by any specific accounting guidance. Therefore, we continue to account for them consistently with our previous accounting treatment.
Section 7 - Other Information.fm Page 159 Tuesday, August 27, 2019 8:40 AM

Telstra Corporation Limited and controlled entities | 159
Notes to the financial statements (continued) Telstra Financial Report 2019Telstra Financial Report 2019Notes to the financial statements (continued) Telstra Financial Report 2019
Section 7. Other information (continued)
Telstra Corporation Limited and controlled entities | 159
7.1 Other accounting policies (continued)7.1.1 Changes in accounting policies on adoption of the new accounting standards (continued)
(b) Changes in the accounting policy for revenue from contracts with customers (continued)
(i) Identifying customer contracts, their combinations and modifications (continued)
On the other hand, the additional payment received under the Information Campaign and Migration (ICM) Deed for the build of nbn related infrastructure, has been combined and accounted for together with the Infrastructure Services Agreement (ISA). ISA also includes payments for sale of our infrastructure assets, which are not in scope of AASB 15, however, the timing of control transfer for these assets and the amount of consideration to be included in the net gain on their disposal have been determined by reference to the AASB 15 principles. The combined accounting contract comprised of nbn DAs and related arrangements has a minimum fixed term of 30 years for accounting purposes.
Prior to the transition date, our accounting was largely aligned to the legal term of the contacts, which in some cases only provided general terms and conditions (including price lists) under which customers could order goods and services in the future. On adoption of AASB 15, the contract term for accounting purposes has changed for a number of our enterprise and government contracts, our wholesale contracts and commercial contracts with nbn co. This is because the five steps apply to goods or services ordered under each valid purchase order or a statement of work raised under the terms of these agreements.
AASB 15 gives far greater detail on how to account for contract modifications than the prior revenue accounting principles. Changes must be accounted for either as a retrospective cumulative change to revenue (creating either a catch up or deferral of past revenues for all performance obligations in the original contract), a prospective change to revenue with a reallocation of revenues amongst remaining performance obligations in the original contract, as a separate contract which will not require any reallocation to performance obligations in the original contract, or both a cumulative change and prospective change to revenue in the original contract.
Prior to the transition date, we accounted for any changes in our retail mass market contracts prospectively. Under AASB 15, we do not expect material impacts from modifications of these contracts because the standard terms and conditions of our homogeneous mass market contracts are normally not re-negotiated and the customers’ rights to move up and down within the plan family are included in each contract from its inception.
However, our bespoke contracts with small business, enterprise and wholesale customers are varied or re-negotiated from time to time. Prior to the transition date, depending on the nature and legal form of the negotiated changes, we have considered the specific facts and circumstances and we have determined the appropriate accounting treatment using the accounting principles that existed at the time. Since transition to AASB 15, the new rules impact any bespoke contract re-negotiations from financial year 2018 onwards. This is because we have elected to apply a transition practical expedient and reflected the aggregate effect of all of the modifications that have occurred before 1 July 2017 when arriving at the retained earnings adjustments. For the restatement of the financial year 2018, we have not identified material adjustments arising from contract modifications of our bespoke contracts.
(ii) Identifying performance obligations
AASB 15 provides guidance on determining if goods or services are distinct and therefore if revenue should be allocated and recognised when these goods have been delivered or the services performed (i.e. when the customer controls them). The new guidance has resulted in some changes to our prior accounting policy of identifying deliverables which have value to the customer on a standalone basis.
Under some of our enterprise and wholesale arrangements, we receive customer and developer contributions to extend, relocate or amend our network assets to ultimately enable delivery of telecommunication services to end users. Prior to the transition date, the contributed network assets (or cash for network construction activities) have been recognised as sales revenue over the period of the network construction activities if they were a separate deliverable under Interpretation 18: ‘Transfer of Assets from Customers’. Interpretation 18 has been superseded by AASB 15 and we have changed our accounting for these type of arrangements.
Depending on whether ongoing telecommunication services have also been purchased under the same arrangement, these contracts will be accounted for in a different way on transition to AASB 15.
Where the counterparty makes a contribution for network construction activities and purchases ongoing services under the same (or linked) contract(s), the arrangement is within the scope of AASB 15. The upfront contribution is added to the total transaction price of the customer contract and allocated to the distinct goods and services to be delivered under that contract. Compared to prior accounting, this resulted in a deferral of sales revenue due to the long term nature of these contracts.
However, where the counterparty does not purchase any ongoing services under the same (or linked) contract(s), the arrangement is neither within the scope of AASB 15 nor covered by any specific accounting guidance. Therefore, we continue to account for them consistently with our previous accounting treatment.
Section 7 - Other Information.fm Page 159 Tuesday, August 27, 2019 8:40 AM

160 | Telstra Corporation Limited and controlled entities
Notes to the financial statements (continued)Notes to the financial statements (continued)
Section 7. Other information (continued)
160 | Telstra Corporation Limited and controlled entities
7.1 Other accounting policies (continued)7.1.1 Changes in accounting policies on adoption of the new accounting standards (continued)
(b) Changes in the accounting policy for revenue from contracts with customers (continued)
(ii) Identifying performance obligations (continued)
Another change to prior accounting relates to material rights, i.e. separate performance obligations in a customer contract which gives the customer an option to acquire additional goods or services at a discount or for free, i.e. these rights are beneficial. In principle, this concept is largely consistent with our prior accounting policy for non-cash sales incentives treated as separate deliverables. However, determination and measurement of material rights (including accounting for their breakage) differs from our past practice. As a result, revenue has been allocated to some of the goods and services we offer for free in our mass market plans or as part of the small business and enterprise loyalty programs and technology funds. However, we have not identified material adjustments on transition to AASB 15 because the value of material rights is usually insignificant compared to the total contract value.
Finally, within the nbn DAs, the build of nbn related infrastructure under the ICM Deed is not considered a separate performance obligation. As a result, on transition to AASB 15, the payment received, for which revenue had already been recognised between the financial years 2012 and 2014, has instead been treated as an advance receipt for performance obligations transferred over the ISA average contracted period of 35 years, leading to an opening retained earnings adjustment on transition of our nbn DAs and related arrangements.
(iii) Determining and allocating the transaction price
AASB 15 removed the requirement for a contingent consideration accounting policy. Prior to the transition date, in the arrangements with multiple deliverables, we limited revenue to the amount that was not contingent upon the delivery of additional items or meeting other specified performance conditions (non-contingent amount). Because our mobile long-term contracts, which offer a bundle of hardware and services, comprise of two legal contracts and under the terms of these contracts, the allocated hardware amount was not contingent on delivery of future services, in the past we recognised the hardware revenue on delivery of the handset. Therefore, on adoption of AASB 15, we did not identify an acceleration of hardware revenue in our mobiles business due to the removal of the contingent consideration rules. Also, we did not identify material adjustments to small business, enterprise or wholesale contracts as generally they have not been impacted by the contingent consideration rules.
In some of our mass market contracts, the amount of consideration can vary, resulting in variable consideration under AASB 15, because of a price concession offered when a customer agrees to an early upgrade of their contract. However, we have not identified a material adjustment for variable consideration in those contracts on transition to AASB 15.
Some of our contracts offer customers the ability to move up and down within the plan family under predefined terms, in which case at contract inception we should only allocate the lower amount we can contractually enforce and account for any excess amount when it is earned. However, due to the low volume of plan changes, we have not identified material adjustments resulting from this accounting change on transition to AASB 15.
If a customer receives any discount(s) when purchasing a bundle of goods or services under one accounting contract, AASB 15 requires a proportional allocation of the discount(s) to all performance obligations, unless the exception allocation criteria are met, in which case the discount(s) can be allocated to only one or some but not all performance obligations. This differs from our prior policy which allocated cash sales incentives to goods or services contributing towards the earning of the incentives. Meeting the allocation exemption criteria is expected to be rare. On transition to AASB 15, we identified some changes in timing of revenue recognition and product allocations in our mobile and fixed mass market contracts and product allocations in our wholesale contracts.
AASB 15 also provides new guidance on how to determine standalone selling prices, by reference to which the total transaction price gets allocated to goods and services within a contract. Despite the fact that our prior accounting policy used relative selling prices as an allocation basis, i.e. a concept similar to standalone selling prices, AASB 15 requires consideration of similar customer circumstances. As a result, we have identified an adjustment related to our mass market mobile contracts where a higher hardware revenue is recognised at the time of delivery of the hardware, and lower services revenue over the customer contract term. Furthermore, revenue allocation between the products in a bundle has changed.
For our bespoke contracts, no material impacts on transition to AASB 15 have been identified because in general, negotiated prices are aligned with the standalone selling prices of distinct goods and services promised under the contracts.
Under some of our mass market contracts, customers obtain a handset or another device on a device repayment plan, i.e. within deferred payment terms. Under AASB 15, Telstra is considered to provide financing to the customer. AASB 15 requires separate accounting for a significant financing component, measured at contract inception using a discount rate that would reflect the credit characteristics of the party receiving the financing in the contract, i.e. the customer. For our mass market customers, this rate is significantly higher than our past practice of using Telstra’s incremental borrowing rate. This change has resulted in a reduction of hardware revenue and a higher interest income being recognised over the contract term.
AASB 15 has also introduced accounting for a significant financing element for arrangements where customers pay for goods or services in advance of receiving them (i.e. Telstra receives financing from the customer). In those circumstances, revenue recognised over the contract term exceeds the cash payments received in advance of performance as interest expense has to be recorded. This change has impacted accounting for some of our domestic and international bespoke network capacity agreements, i.e. Indefeasible Right of Use, which include upfront prepayments and have an average legal contract term between 10 and 33 years.
AASB 15 requires accounting for a financing component only if it is assessed as significant in the context of a contract as a whole. As a result, we have ceased to account for the financing component in our nbn DAs and related arrangements because financing has not been considered significant in these agreements as a whole.
AASB 15 defines a concept of a sale with a right of return and provides clear guidance for accounting for refund liabilities and recognition of the products expected to be returned. We have not identified material impacts for this change but some of our contracts include a right of return and their revenue recognition, measurement and presentation on the balance sheet have been impacted.
Section 7 - Other Information.fm Page 160 Tuesday, August 27, 2019 8:40 AM
Notes to the financial statements (continued) Telstra Financial Report 2019
Section 7. Other information (continued)
Telstra Corporation Limited and controlled entities | 161
7.1 Other accounting policies (continued)7.1.1 Adoption of the new accounting standards (continued)
(b) Changes in the accounting policy for revenue from contracts with customers (continued)
(iv) Contract costs
AASB 15 provides accounting guidance for incremental costs of obtaining a contract and costs to fulfil a contract. Prior to the transition date, we accounted for these costs under our internal policy based on the Interpretation 1042: ‘Subscriber Acquisition Costs in the Telecommunications Industry’, which has been superseded by AASB 15. Contract costs which meet AASB 15 criteria to be recognised as an asset must be amortised on a basis consistent with the transfer of goods and services to which these costs relate under existing and anticipated customer contract(s) (for example, the customer can renew the contract for the same or subset of same goods and services).
Under prior accounting, incremental costs to obtain a contract, such as directly attributable sales commissions, have been recognised as assets in deferred expenditure and amortised on a straight line basis over the average customer contract term. Under AASB 15, we have identified a net increase in these capitalised costs due to a combination of factors. We have extended the amortisation periods for sales commissions paid on acquisition of the initial contract where these commissions are not commensurate with recontracting commissions. Therefore, the amortisation period for the initial commissions reflects the expected customer life rather than just an initial contract term. This impact has been partly offset by adjustments for early terminated contracts and commissions related to short term contracts (i.e. one year or less) which have been expensed as incurred under the practical expedient allowed by AASB 15. Under AASB 15, these costs are presented in the statement of financial position as deferred contract costs instead of intangible assets.
We have identified impacts in relation to costs to fulfil a contract. On adoption of AASB 15, we have expensed two major classes of deferred expenditure which were previously included in our intangible assets. These were costs associated with connection and activation activities related to our fixed network contracts and remediation costs related to our nbn DAs and related arrangements. These costs are assessed under AASB 116: ‘Property, plant and equipment’. We continue to recognise as assets and amortise over the contract term certain set up costs that relate to our large enterprise contracts. However, these costs are presented in the statement of financial position as deferred contract costs instead of intangible assets.
Our deferred expenditure also included certain balances related to cash and non-cash sales incentives which have been granted mainly to our small business, enterprise and wholesale customers at contract inception. Under prior accounting, both types of incentives reduced sales revenue over the term of the customer contract on a straight line basis. Under AASB 15, these amounts either represent a discount that should reduce the transaction price (if the incentive is cash) or a material right for additional goods or services (if the incentive is non-cash), which represents a separate performance obligation in the customer contract. Given our prior accounting is largely aligned with the new requirements, there are no material re-measurement adjustments related to these types of deferred expenditure. However, they have now been presented as part of a contract asset or contract liability under AASB 15.
(v) Presentation and classification
AASB 15 adoption also required changes to presentation and classification of items in the statement of financial position and in the income statement. This includes presentation in the statement of financial position of a contract asset or contract liability at the contract level, separate presentation of deferred contract costs and appropriate current and non-current classification of all relevant balance sheet line items. On adoption of AASB 15, a number of existing line items in the statement of financial position have been replaced by the new presentation of contract assets and contract liabilities and new line items have been created (e.g. refund liabilities).
AASB 15 also requires disclosure of disaggregated revenue which has been included in our segment disclosures in note 2.1.2.
We have revised presentation of multiple line items in the statement of financial position in order to comply with AASB 15 and best present the financial position going forward. The key presentation changes are summarised in the following table.
Section 7 - Other Information.fm Page 161 Tuesday, August 27, 2019 8:40 AM

Telstra Corporation Limited and controlled entities | 161
Notes to the financial statements (continued) Telstra Financial Report 2019Telstra Financial Report 2019Notes to the financial statements (continued) Telstra Financial Report 2019
Section 7. Other information (continued)
Telstra Corporation Limited and controlled entities | 161
7.1 Other accounting policies (continued)7.1.1 Adoption of the new accounting standards (continued)
(b) Changes in the accounting policy for revenue from contracts with customers (continued)
(iv) Contract costs
AASB 15 provides accounting guidance for incremental costs of obtaining a contract and costs to fulfil a contract. Prior to the transition date, we accounted for these costs under our internal policy based on the Interpretation 1042: ‘Subscriber Acquisition Costs in the Telecommunications Industry’, which has been superseded by AASB 15. Contract costs which meet AASB 15 criteria to be recognised as an asset must be amortised on a basis consistent with the transfer of goods and services to which these costs relate under existing and anticipated customer contract(s) (for example, the customer can renew the contract for the same or subset of same goods and services).
Under prior accounting, incremental costs to obtain a contract, such as directly attributable sales commissions, have been recognised as assets in deferred expenditure and amortised on a straight line basis over the average customer contract term. Under AASB 15, we have identified a net increase in these capitalised costs due to a combination of factors. We have extended the amortisation periods for sales commissions paid on acquisition of the initial contract where these commissions are not commensurate with recontracting commissions. Therefore, the amortisation period for the initial commissions reflects the expected customer life rather than just an initial contract term. This impact has been partly offset by adjustments for early terminated contracts and commissions related to short term contracts (i.e. one year or less) which have been expensed as incurred under the practical expedient allowed by AASB 15. Under AASB 15, these costs are presented in the statement of financial position as deferred contract costs instead of intangible assets.
We have identified impacts in relation to costs to fulfil a contract. On adoption of AASB 15, we have expensed two major classes of deferred expenditure which were previously included in our intangible assets. These were costs associated with connection and activation activities related to our fixed network contracts and remediation costs related to our nbn DAs and related arrangements. These costs are assessed under AASB 116: ‘Property, plant and equipment’. We continue to recognise as assets and amortise over the contract term certain set up costs that relate to our large enterprise contracts. However, these costs are presented in the statement of financial position as deferred contract costs instead of intangible assets.
Our deferred expenditure also included certain balances related to cash and non-cash sales incentives which have been granted mainly to our small business, enterprise and wholesale customers at contract inception. Under prior accounting, both types of incentives reduced sales revenue over the term of the customer contract on a straight line basis. Under AASB 15, these amounts either represent a discount that should reduce the transaction price (if the incentive is cash) or a material right for additional goods or services (if the incentive is non-cash), which represents a separate performance obligation in the customer contract. Given our prior accounting is largely aligned with the new requirements, there are no material re-measurement adjustments related to these types of deferred expenditure. However, they have now been presented as part of a contract asset or contract liability under AASB 15.
(v) Presentation and classification
AASB 15 adoption also required changes to presentation and classification of items in the statement of financial position and in the income statement. This includes presentation in the statement of financial position of a contract asset or contract liability at the contract level, separate presentation of deferred contract costs and appropriate current and non-current classification of all relevant balance sheet line items. On adoption of AASB 15, a number of existing line items in the statement of financial position have been replaced by the new presentation of contract assets and contract liabilities and new line items have been created (e.g. refund liabilities).
AASB 15 also requires disclosure of disaggregated revenue which has been included in our segment disclosures in note 2.1.2.
We have revised presentation of multiple line items in the statement of financial position in order to comply with AASB 15 and best present the financial position going forward. The key presentation changes are summarised in the following table.
Section 7 - Other Information.fm Page 161 Tuesday, August 27, 2019 8:40 AM

162 | Telstra Corporation Limited and controlled entities
Notes to the financial statements (continued)Notes to the financial statements (continued)
Section 7. Other information (continued)
162 | Telstra Corporation Limited and controlled entities
7.1 Other accounting policies (continued)7.1.1 Changes in the accounting policies on adoption of the new accounting standards (continued)
(b) Changes in the accounting policy for revenue from contracts with customers (continued)
(v) Presentation and classification (continued)
Previous pres-entation
New presentation Change
Trade and other receivables
Trade and other receivables and contract assets
Accrued revenue arising from contracts with customers has been presented as contract assets.
Inventories Inventories Right to recover products sold with a right of return has been added to the ‘inventories’ line.
Inventories
Prepayments
Trade and other receivables and contract assets
Deferred contract costs
Construction work in progress for long term construction contracts which exceeded progress billings has been reclassified from inventories to contract assets.
Costs of a service provider relating to the satisfaction of future performance obligations included in our inventory or prepayment balances have been reclassified to deferred contract costs.
Intangible assets Deferred contract costs
Deferred expenditure, a class of intangible asset, related to costs to obtain or fulfill a contract has been reclassified to deferred contract costs.
Trade and other payables
Contract liabilities and other revenue received in advance
Construction work in progress for long term construction contracts where progress billings exceeded construction work in progress has been reclassified from other payables to contract liabilities.
Other payables relating to loyalty funds allowing customers to obtain our goods or services for free have been reclassified to contract liabilities.
Trade and other payables
Trade and other payables
Refund liabilities have been added as part of ‘trade and other payables’ line.
Revenue received in advance
Contract liabilities and other revenue received in advance
Revenue received in advance arising from contracts with customers has been presented as contract liabilities.
Contract liabilities are separately disclosed from revenue received in advance arising from other types of arrangements (e.g. government grants) in note 3.6.
(c) Changes in the accounting policy for impairment of financial assets
AASB 9 requires us to estimate the expected credit losses for our financial assets measured at amortised cost or at fair value through other comprehensive income, except for investments in equity instruments, replacing the incurred credit loss model that we used previously. The new accounting policy has been disclosed in note 3.3.2.
Section 7 - Other Information.fm Page 162 Tuesday, August 27, 2019 8:40 AM
Notes to the financial statements (continued) Telstra Financial Report 2019
Section 7. Other information (continued)
Telstra Corporation Limited and controlled entities | 163
7.1 Other accounting policies (continued)7.1.2 Foreign currency translation
(a) Transactions and balances
Foreign currency transactions are translated into the relevant functional currency at the spot exchange rate at transaction date. At the reporting date, amounts receivable or payable denominated in foreign currencies are translated into the relevant functional currency at market exchange rates at reporting date. Any currency translation gains and losses that arise are included in our income statement.
Non-monetary items denominated in foreign currency that are measured at fair value (i.e. certain equity instruments not held for trading) are translated using the exchange rates at the date when the fair value was determined. The differences arising from the translation are reported as part of the fair value gain or loss in line with the recognition of the changes in the fair value of the non-monetary item.
(b) Financial reports of foreign operations that have a functional currency that is not Australian dollars
The financial statements of our foreign operations are translated into Australian dollars (our presentation currency) using the following method:
Foreign currency amount Exchange rate
Assets and liabilities including goodwill and fair value adjustments arising on consolidation
The reporting date rate
Equity items The initial investment date rate
Income statements Average rate (or the transaction date rate for significant identifiable transactions)
The exchange differences arising from the translation of financial statements of foreign operations are recognised in other comprehensive income.
7.1.3 New accounting standards to be applied in future reporting periods
The accounting standards that have not been early adopted for the financial year 2019 but will be applicable to the Telstra Group in future reporting periods are detailed below.
(a) New leasing standard
In February 2016, the AASB issued AASB 16: ‘Leases’, which replaces AASB 117: ‘Leases’, Interpretation 4 ‘Determining whether an Arrangement contains a Lease’, Interpretation 115 ‘Operating Leases - Incentives’ and Interpretation 127 ‘Evaluation the Substance of Transactions Involving the Legal Form of a Lease’. The new standard will apply to us from 1 July 2019.
The new standard requires the lessee to recognise its leases in the statement of financial position as an asset (the right to use the leased item) and a liability reflecting future lease payments. Depreciation of the right-of-use asset and interest on the lease liability will be recognised over the lease term. The lessee can utilise the practical expedients related to short-term and low-value leases, however, assets that are subject to subleases or are expected to be subleased do not qualify for the low-value exception.
AASB 16 substantially carries forward the lessor accounting requirements of AASB 117. Accordingly, a lessor continues to classify its leases and account for them as operating or finance leases.
As a lessee, we have a significant number of long-term non-cancellable property operating leases for our office buildings and network sites which will have a material impact when recognised in the statement of financial position. We also have a large volume of low value leases for mobile handsets which are subleased to our consumer and small business customers under our mobile bundles and which will also result in a material impact on transition to AASB 16. Other operating leases include motor vehicles, video conferencing equipment, personal computers and multifunctional devices. Our finance leases mainly relate to customer premise equipment which is subleased to our customers under sales type finance leases.
Lease liabilities recognised on adoption of AASB 16 will differ from our operating lease commitments disclosed in note 7.4.2 to the financial statements. The differences mostly arise from the effects of discounting the future lease payments and judgements regarding whether options to continue leasing the assets are reasonably certain. Our operating lease commitments include commitments for leases legally commencing after the transition date of 1 July 2019, some of which have also been included in the lease liability estimate as at the transition date because they represent a modification of a transitioning lease contract.
We will adopt AASB 16 from 1 July 2019 and apply the standard using a modified retrospective approach. Applying this method, the comparative information for the 2019 financial year will not be restated in our 30 June 2020 financial statements (or in 31 December 2019 half-year financial statements). Instead, the cumulative effect of initially applying this standard will be adjusted as at 1 July 2019 to amend the opening balance of retained earnings and the respective line items in the statement of financial position.
We have applied the relief provisions and we have not reassessed whether a contract is, or contains, a lease at the date of initial application of 1 July 2019. As such this standard will be applied to all open contracts that have been identified as leases under AASB 117 and Interpretation 4 before or as at 30 June 2019 (referred to as 'transitioning contracts').
Where Telstra Group is a lessee in the transitioning contracts, for leases currently classified as finance leases the carrying amount of the right-of-use asset and the lease liability at 1 July 2019 will equal the carrying amount of the lease asset and lease liability immediately before that date measured by applying AASB 117.
Where Telstra Group is a lessee in the transitioning contracts, for leases currently classified as operating leases we will recognise a lease liability (measured as present value of the remaining lease payments, discounted using our incremental borrowing rate as at 1 July 2019) and an equal amount of a right-of-use asset. Where relevant, we will also adjust the right-of-use asset by the amount of any prepaid or accrued lease payments relating to those leases and recognised in the statement of financial position as at 30 June 2019.
Section 7 - Other Information.fm Page 163 Tuesday, August 27, 2019 8:40 AM

Telstra Corporation Limited and controlled entities | 163
Notes to the financial statements (continued) Telstra Financial Report 2019Telstra Financial Report 2019Notes to the financial statements (continued) Telstra Financial Report 2019
Section 7. Other information (continued)
Telstra Corporation Limited and controlled entities | 163
7.1 Other accounting policies (continued)7.1.2 Foreign currency translation
(a) Transactions and balances
Foreign currency transactions are translated into the relevant functional currency at the spot exchange rate at transaction date. At the reporting date, amounts receivable or payable denominated in foreign currencies are translated into the relevant functional currency at market exchange rates at reporting date. Any currency translation gains and losses that arise are included in our income statement.
Non-monetary items denominated in foreign currency that are measured at fair value (i.e. certain equity instruments not held for trading) are translated using the exchange rates at the date when the fair value was determined. The differences arising from the translation are reported as part of the fair value gain or loss in line with the recognition of the changes in the fair value of the non-monetary item.
(b) Financial reports of foreign operations that have a functional currency that is not Australian dollars
The financial statements of our foreign operations are translated into Australian dollars (our presentation currency) using the following method:
Foreign currency amount Exchange rate
Assets and liabilities including goodwill and fair value adjustments arising on consolidation
The reporting date rate
Equity items The initial investment date rate
Income statements Average rate (or the transaction date rate for significant identifiable transactions)
The exchange differences arising from the translation of financial statements of foreign operations are recognised in other comprehensive income.
7.1.3 New accounting standards to be applied in future reporting periods
The accounting standards that have not been early adopted for the financial year 2019 but will be applicable to the Telstra Group in future reporting periods are detailed below.
(a) New leasing standard
In February 2016, the AASB issued AASB 16: ‘Leases’, which replaces AASB 117: ‘Leases’, Interpretation 4 ‘Determining whether an Arrangement contains a Lease’, Interpretation 115 ‘Operating Leases - Incentives’ and Interpretation 127 ‘Evaluation the Substance of Transactions Involving the Legal Form of a Lease’. The new standard will apply to us from 1 July 2019.
The new standard requires the lessee to recognise its leases in the statement of financial position as an asset (the right to use the leased item) and a liability reflecting future lease payments. Depreciation of the right-of-use asset and interest on the lease liability will be recognised over the lease term. The lessee can utilise the practical expedients related to short-term and low-value leases, however, assets that are subject to subleases or are expected to be subleased do not qualify for the low-value exception.
AASB 16 substantially carries forward the lessor accounting requirements of AASB 117. Accordingly, a lessor continues to classify its leases and account for them as operating or finance leases.
As a lessee, we have a significant number of long-term non-cancellable property operating leases for our office buildings and network sites which will have a material impact when recognised in the statement of financial position. We also have a large volume of low value leases for mobile handsets which are subleased to our consumer and small business customers under our mobile bundles and which will also result in a material impact on transition to AASB 16. Other operating leases include motor vehicles, video conferencing equipment, personal computers and multifunctional devices. Our finance leases mainly relate to customer premise equipment which is subleased to our customers under sales type finance leases.
Lease liabilities recognised on adoption of AASB 16 will differ from our operating lease commitments disclosed in note 7.4.2 to the financial statements. The differences mostly arise from the effects of discounting the future lease payments and judgements regarding whether options to continue leasing the assets are reasonably certain. Our operating lease commitments include commitments for leases legally commencing after the transition date of 1 July 2019, some of which have also been included in the lease liability estimate as at the transition date because they represent a modification of a transitioning lease contract.
We will adopt AASB 16 from 1 July 2019 and apply the standard using a modified retrospective approach. Applying this method, the comparative information for the 2019 financial year will not be restated in our 30 June 2020 financial statements (or in 31 December 2019 half-year financial statements). Instead, the cumulative effect of initially applying this standard will be adjusted as at 1 July 2019 to amend the opening balance of retained earnings and the respective line items in the statement of financial position.
We have applied the relief provisions and we have not reassessed whether a contract is, or contains, a lease at the date of initial application of 1 July 2019. As such this standard will be applied to all open contracts that have been identified as leases under AASB 117 and Interpretation 4 before or as at 30 June 2019 (referred to as 'transitioning contracts').
Where Telstra Group is a lessee in the transitioning contracts, for leases currently classified as finance leases the carrying amount of the right-of-use asset and the lease liability at 1 July 2019 will equal the carrying amount of the lease asset and lease liability immediately before that date measured by applying AASB 117.
Where Telstra Group is a lessee in the transitioning contracts, for leases currently classified as operating leases we will recognise a lease liability (measured as present value of the remaining lease payments, discounted using our incremental borrowing rate as at 1 July 2019) and an equal amount of a right-of-use asset. Where relevant, we will also adjust the right-of-use asset by the amount of any prepaid or accrued lease payments relating to those leases and recognised in the statement of financial position as at 30 June 2019.
Section 7 - Other Information.fm Page 163 Tuesday, August 27, 2019 8:40 AM

164 | Telstra Corporation Limited and controlled entities
Notes to the financial statements (continued)Notes to the financial statements (continued)
Section 7. Other information (continued)
164 | Telstra Corporation Limited and controlled entities
7.1 Other accounting policies (continued)7.1.3 New accounting standards to be applied in future reporting periods (continued)
(a) New leasing standard (continued)
When estimating the right-of-use asset and the lease liability as at 1 July 2019 for our transitioning operating leases where Telstra Group is a lessee, we have used the following practical expedients for all similar leases on a consistent basis (as opposed to on a lease-by-lease basis as allowed by the standard):
• we have applied a single discount rate to portfolios of leases with characteristics which we have assessed to be reasonably similar
• we have elected to rely on our assessment of whether leases are onerous under AASB 137 'Provisions, Contingent Liabilities and Contingent Assets' as at 30 June 2019 instead of conducting an impairment review
• for leases of our personal computers and multifunctional devices, for which the underlying assets are of low value, we have not made any adjustments on transition and as a result the lease payments under these contracts will generally continue to be recognised on a straight-line basis over the lease term as other operating expenses
• we have no initial direct costs included in the measurement of the right-of-use assets at initial application of the standard
• we have elected to utilise hindsight in determining the lease term for contracts that contain options for extension or termination of the lease.
Based on our transition approach and the practical expedients used, the initial application of AASB 16 as at 1 July 2019 is expected to result in recording in the statement of financial position right-of-use assets and lease liabilities ranging from $3.6 billion to $3.8 billion for our operating leases where Telstra Group is a lessee. This estimate includes more than $0.5 billion related to lease payments arising from new legal contracts executed before 30 June 2019 but effective after that date, which have been treated as lease modifications for accounting purposes (refer to Table B in note 7.4.2 to the financial statements for maturity profile of our operating lease commitments). The right-of-use assets will also be adjusted to reflect any prepaid and/or accrued lease payments. No adjustments have been identified for our finance leases where Telstra Group is a lessee.
Where Telstra Group is an intermediate lessor we have reassessed our operating leases and identified those that on 1 July 2019 will be recognised as finance leases. No significant adjustments have been estimated.
No adjustments have been identified for our operating or finance leases where Telstra is a lessor other than those related to intermediate lessor described above.
The transition estimates have been calculated based on our current interpretation of the new accounting requirements. However, there is still an ongoing global debate in regard to certain aspects of the application of the new standard and our final adjustments may differ from the current estimates should a different consensus be agreed globally.
We continue to assess the impact of the new leasing standard on our future financial results, in particular how the new lease identification requirements will change accounting for new contracts entered into after 1 July 2019. We also continue to identify changes to our accounting policies, internal and external reporting requirements, IT systems, business processes and controls which will be fully operationalised during the financial year 2020.
(b) Other
In March 2018, the International Accounting Standards Board (the IASB) issued a revised Conceptual Framework for Financial Reporting (‘Framework’) to be used immediately by the IASB but effective for Telstra from 1 July 2020. We do not expect the practical consequences of the new Framework to be significant in the short term. However, our assessment of the impact arising from the amendments is ongoing.
We do not expect any other recently issued accounting standard or amendment to have a material impact on our financial results upon adoption.
7.2 Auditor’s remuneration
Our external auditor of the Group is Ernst & Young (EY). In addition to the audit and review of our financial reports, EY provides other services throughout the year. This note shows the total fees to external auditors split between audit, audit-related and non-audit services.
Telstra Group Year ended 30 June
2019 2018
$m $mAudit feesEY fees for the audit and review of the financial reports 9.073 9.011
Assurance servicesAudit-related 2.120 1.455Other assurance 1.465 0.481Total assurance services provided by EY 3.585 1.936Non-audit servicesTax services 0.070 0.065Advisory services 0.067 0.050Total non-audit services provided by EY 0.137 0.115
Audit-related fees charged by EY are for services that are reasonably related to the performance of the audit or review of our financial reports and for other assurance engagements. These services include regulatory financial assurance services, services over debt raising prospectuses, additional control assessments, various accounting advice and additional audit services related to our controlled entities.
Other assurance fees charged by EY are for other assurance engagements, including IT security control assessments.
We have processes in place to maintain the independence of the external auditor, including the nature of expenditure on non-audit services. EY also has specific internal processes in place to ensure auditor independence.
Section 7 - Other Information.fm Page 164 Tuesday, August 27, 2019 8:40 AM
Notes to the financial statements (continued) Telstra Financial Report 2019
Section 7. Other information (continued)
Telstra Corporation Limited and controlled entities | 165
7.3 Parent entity disclosures
This note provides details of Telstra Entity financial performance and financial position as a standalone entity. The results include transactions with its controlled entities.
Tables A and B provide a summary of the financial information for the Telstra Entity.
Table A As at 30 June
Telstra Entity 2019 2018 Restated
$m $mStatement of financial positionTotal current assets 6,959 7,053Total non-current assets 38,194 38,215Total assets 45,153 45,268Total current liabilities 13,378 12,750Total non-current liabilities 17,625 18,406Total liabilities 31,003 31,156Share capital 4,447 4,428Cash flow hedging reserve (209) (211)Foreign currency basis spread reserve (21) (6)General reserve 201 201Retained profits 9,732 9,700Total equity 14,150 14,112
Table B Year ended 30 June
Telstra Entity 2019 2018 Restated
$m $mStatement of comprehensive incomeProfit for the year 2,358 3,584Total comprehensive income 2,337 3,547
Total non-current assets include $603 million (2018: $862 million) impact of impairment losses recognised during the year. Within that amount, impairment losses relating to the value of our investments in, and the amounts owed by, our controlled entities amounted to $104 million (2018: $545 million) and have been eliminated on consolidation of the Telstra Group. Refer to note 2.3 for impairment losses for property, plant and equipment and software.
7.3.1 Property, plant and equipment commitments
Table C provides details of our expenditure commitments for the acquisition of property, plant or equipment, which have been contracted for at balance date but not recognised in the financial statements.
Table C As at 30 June
Telstra Entity 2019 2018
$m $mTotal property, plant and equipment expenditure commitments 471 635
7.3.2 Contingent liabilities and guarantees
(a) Common law claims
Certain common law claims by employees and third parties are yet to be resolved. As at 30 June 2019, management believes that the resolution of these contingencies will not have a significant effect on the Telstra Entity’s financial results. The maximum amount of these contingent liabilities cannot be reliably estimated.
(b) Indemnities, performance guarantees and financial support
We have provided the following indemnities, performance guarantees and financial support through the Telstra Entity:
• indemnities to financial institutions to support bank guarantees to the value of $229 million (2018: $189 million) in respect of the performance of contracts
• indemnities to financial institutions and other third parties in respect of performance and other obligations of our controlled entities, with the maximum amount of our contingent liabilities of $135 million (2018: $133 million)
• letters of comfort to indicate support for certain controlled entities to the amount necessary to enable those entities to meet their obligations as and when they fall due, subject to certain conditions (including that the entity remains our controlled entity)
• during the financial year 1998, we resolved to provide IBM Global Services Australia Limited (IBMGSA) with guarantees issued on a several basis up to $210 million as a shareholder of IBMGSA. During the financial year 2000, we issued a guarantee of $68 million on behalf of IBMGSA. During the financial year 2004, we sold our shareholding in this entity. The $68 million guarantee, provided to support service contracts entered into by IBMGSA and third parties, was made with IBMGSA bankers or directly to IBMGSA customers. As at 30 June 2019, this guarantee remains unchanged and $142 million (2018: $142 million) of the $210 million guarantee facility remains unused. Upon sale of our shareholding in IBMGSA and under the deed of indemnity between shareholders, our liability under these performance guarantees has been indemnified for all guarantees that were in place at the time of sale. Therefore, the overall net exposure to any loss associated with a claim has effectively been offset.
(c) Other
In addition to the above matters, entities in the Telstra Group may be recipients of, or defendants in, certain claims, regulatory or legal proceedings and/or complaints made, commenced or threatened. At 30 June 2019, management believes that the resolution of these contingencies will not have a material effect on the financial position of the Telstra Group, or are not at a stage which supports a reasonable evaluation of the likely outcome of the matter.
7.3.3 Recognition and measurement
The accounting policies for the Telstra Entity are consistent with those of the Telstra Group, except for those noted below:• under our tax funding arrangements, amounts receivable (or
payable) recognised by the Telstra Entity for the current tax payable (or receivable) assumed from our Australian wholly-owned entities are booked as current assets or liabilities
• investments in controlled entities, included within non-current assets, are recorded at cost less impairment of the investment value. Where we hedge the value of our investment in an overseas controlled entity, the hedge is accounted for in accordance with note 4.3. Refer to note 6.1 for details on our investments in controlled entities.
• our interests in associated entities and joint ventures, including partnerships, are accounted for using the cost method of accounting and are included within non-current assets.
Section 7 - Other Information.fm Page 165 Tuesday, August 27, 2019 8:40 AM

Telstra Corporation Limited and controlled entities | 165
Notes to the financial statements (continued) Telstra Financial Report 2019Telstra Financial Report 2019Notes to the financial statements (continued) Telstra Financial Report 2019
Section 7. Other information (continued)
Telstra Corporation Limited and controlled entities | 165
7.3 Parent entity disclosures
This note provides details of Telstra Entity financial performance and financial position as a standalone entity. The results include transactions with its controlled entities.
Tables A and B provide a summary of the financial information for the Telstra Entity.
Table A As at 30 June
Telstra Entity 2019 2018 Restated
$m $mStatement of financial positionTotal current assets 6,959 7,053Total non-current assets 38,194 38,215Total assets 45,153 45,268Total current liabilities 13,378 12,750Total non-current liabilities 17,625 18,406Total liabilities 31,003 31,156Share capital 4,447 4,428Cash flow hedging reserve (209) (211)Foreign currency basis spread reserve (21) (6)General reserve 201 201Retained profits 9,732 9,700Total equity 14,150 14,112
Table B Year ended 30 June
Telstra Entity 2019 2018 Restated
$m $mStatement of comprehensive incomeProfit for the year 2,358 3,584Total comprehensive income 2,337 3,547
Total non-current assets include $603 million (2018: $862 million) impact of impairment losses recognised during the year. Within that amount, impairment losses relating to the value of our investments in, and the amounts owed by, our controlled entities amounted to $104 million (2018: $545 million) and have been eliminated on consolidation of the Telstra Group. Refer to note 2.3 for impairment losses for property, plant and equipment and software.
7.3.1 Property, plant and equipment commitments
Table C provides details of our expenditure commitments for the acquisition of property, plant or equipment, which have been contracted for at balance date but not recognised in the financial statements.
Table C As at 30 June
Telstra Entity 2019 2018
$m $mTotal property, plant and equipment expenditure commitments 471 635
7.3.2 Contingent liabilities and guarantees
(a) Common law claims
Certain common law claims by employees and third parties are yet to be resolved. As at 30 June 2019, management believes that the resolution of these contingencies will not have a significant effect on the Telstra Entity’s financial results. The maximum amount of these contingent liabilities cannot be reliably estimated.
(b) Indemnities, performance guarantees and financial support
We have provided the following indemnities, performance guarantees and financial support through the Telstra Entity:
• indemnities to financial institutions to support bank guarantees to the value of $229 million (2018: $189 million) in respect of the performance of contracts
• indemnities to financial institutions and other third parties in respect of performance and other obligations of our controlled entities, with the maximum amount of our contingent liabilities of $135 million (2018: $133 million)
• letters of comfort to indicate support for certain controlled entities to the amount necessary to enable those entities to meet their obligations as and when they fall due, subject to certain conditions (including that the entity remains our controlled entity)
• during the financial year 1998, we resolved to provide IBM Global Services Australia Limited (IBMGSA) with guarantees issued on a several basis up to $210 million as a shareholder of IBMGSA. During the financial year 2000, we issued a guarantee of $68 million on behalf of IBMGSA. During the financial year 2004, we sold our shareholding in this entity. The $68 million guarantee, provided to support service contracts entered into by IBMGSA and third parties, was made with IBMGSA bankers or directly to IBMGSA customers. As at 30 June 2019, this guarantee remains unchanged and $142 million (2018: $142 million) of the $210 million guarantee facility remains unused. Upon sale of our shareholding in IBMGSA and under the deed of indemnity between shareholders, our liability under these performance guarantees has been indemnified for all guarantees that were in place at the time of sale. Therefore, the overall net exposure to any loss associated with a claim has effectively been offset.
(c) Other
In addition to the above matters, entities in the Telstra Group may be recipients of, or defendants in, certain claims, regulatory or legal proceedings and/or complaints made, commenced or threatened. At 30 June 2019, management believes that the resolution of these contingencies will not have a material effect on the financial position of the Telstra Group, or are not at a stage which supports a reasonable evaluation of the likely outcome of the matter.
7.3.3 Recognition and measurement
The accounting policies for the Telstra Entity are consistent with those of the Telstra Group, except for those noted below:• under our tax funding arrangements, amounts receivable (or
payable) recognised by the Telstra Entity for the current tax payable (or receivable) assumed from our Australian wholly-owned entities are booked as current assets or liabilities
• investments in controlled entities, included within non-current assets, are recorded at cost less impairment of the investment value. Where we hedge the value of our investment in an overseas controlled entity, the hedge is accounted for in accordance with note 4.3. Refer to note 6.1 for details on our investments in controlled entities.
• our interests in associated entities and joint ventures, including partnerships, are accounted for using the cost method of accounting and are included within non-current assets.
Section 7 - Other Information.fm Page 165 Tuesday, August 27, 2019 8:40 AM

166 | Telstra Corporation Limited and controlled entities
Notes to the financial statements (continued)Notes to the financial statements (continued)
Section 7. Other information (continued)
166 | Telstra Corporation Limited and controlled entities
7.4 Commitments and contingencies
This note provides details of our commitments for capital expenditure, operating leases and finance leases arising from our contractual agreements.
This note also includes information about contingent liabilities for which no provisions have been recognised due to the uncertainty regarding the outcome of future events and/or inability to reliably measure such liabilities.
7.4.1 Capital expenditure commitments
Table A shows the capital expenditure commitments contracted for at balance date but not recorded in the financial statements.
Table A As at 30 June
Telstra Group 2019 2018
$m $mProperty, plant and equipment commitments 480 638
Intangible assets commitments 398 209
Property, plant and equipment commitments include the Telstra Entity capital expenditure commitments of $471 million (2018: $635 million) as disclosed in note 7.3.
7.4.2 Operating lease commitments
Table B shows future lease payments for non-cancellable operating leases (Telstra as a lessee) not recorded in the financial statements.
Table B As at 30 June
Telstra Group 2019 2018
$m $mWithin 1 year 947 1,008Within 1 to 5 years 1,455 1,467After 5 years 1,394 1,649
3,796 4,124
The above amounts represent contractual undiscounted future cash flows, which will not change on adoption of the new leasing standard on 1 July 2019. However, as described in note 7.1.3, for a number of reasons lease liabilities recognised on adoption of the new standard will differ from our operating lease commitments as at 30 June 2019.
In particular, transition provisions of AASB 16 mandate the use of Telstra's incremental borrowing rate as at 1 July 2019 to discount the remaining future cash flows. This discount rate is determined by reference to market indices and prices over which we have no control.
Furthermore, where relevant, measurement of lease liabilities will reflect judgements made about discounted future cash flows arising from reasonably certain extension options (at Telstra's discretion) and lease modifications, which must be reassessed should the circumstances change. Such cash flows are not contractually payable until the options have been legally exercised (if at all) and /or until the effective dates of already executed new contracts (some of which have effective dates beyond 1 July 2019).
Table C provides information about the assets under our operating leases and their weighted average lease terms.
Table CTelstra Group
Weighted average lease term (years)
As at 30 June
2019 2018Land and buildings 17 16Motor vehicles 3 2Light commercial vehicles (caravan huts and trailers) 4 3 - 4
Trucks and mechanical aids and heavy excavation equipment 6 - 7 5 - 7
Audio visual communications 5 5Personal computers, laptops, printers and other related equipment used in non-communications plant activities
3 - 4 3 - 4
Mobile handsets 2 2
The majority of our operating leases relate to land and buildings. We have several leases with future minimum lease receivable of $31 million (2018: $42 million) for the Telstra Group. Our property operating leases generally contain escalation clauses, which are fixed increases generally between three and five per cent, or increases subject to the consumer price index or market rate. We do not have any significant purchase options.
We also lease handsets which we then sublease to our retail customers in a back-to-back arrangement.
Table D sets out our future minimum lease receivables from retail customers under non-cancellable operating leases (Telstra as lessor).
Table D As at 30 June
Telstra Group 2019 2018
$m $mWithin 1 year 380 332Within 1 to 5 years 119 130
499 462
Refer to notes 3.1 and 3.3 for our lease accounting policy (Telstra as lessee and Telstra as a lessor, respectively). The accounting policy described in note 3.1 applies to both property, plant and equipment and other assets, including handsets.
Section 7 - Other Information.fm Page 166 Tuesday, August 27, 2019 8:40 AM
Notes to the financial statements (continued) Telstra Financial Report 2019
Section 7. Other information (continued)
Telstra Corporation Limited and controlled entities | 167
7.4 Commitments and contingencies (continued)
7.4.3 Finance lease commitments
Table E includes finance lease commitments of the Telstra Group as a lessee.
Table E As at 30 June
Telstra Group 2019 2018
$m $mFinance lease commitmentsWithin 1 year 91 102Within 1 to 5 years 135 176After 5 years 116 233Total minimum lease payments 342 511Future finance charges on finance leases (51) (146)
Present value of net future minimum lease payments 291 365
The present value of finance lease liabilities is as follows:Within 1 year 78 81Within 1 to 5 years 101 114After 5 years 112 170Total finance lease liabilities 291 365
Table F provides information about the assets under our finance leases and their weighted average remaining lease terms.
Table F Telstra Group
Weighted average lease term (years)
As at 30 June
2019 2018Property leases in our controlled entities 12 13Computer mainframes, processing equipment and other related equipment 5 6
We lease computer mainframes, processing equipment and other related equipment to our customers as part of the solutions management and outsourcing services. Refer to note 3.3 for further details on these finance leases.
Refer to note 3.1 for our lease accounting policy (Telstra as a lessee).
7.4.4 Commitments of our associated entities
Information about our share of our associated entities’ commitments is included in note 6.2.4.
7.4.5 Contingent liabilities and contingent assets
We have no significant contingent assets as at 30 June 2019. Other than the above, details and estimated maximum amounts (where reasonable estimates can be made) of contingent liabilities for the Telstra Entity are disclosed in note 7.3.2.
Other contingent liabilities identified for the Telstra Group relate to the ASIC deed of cross guarantee. A list of the companies that are part of the deed are included in note 6.1.2. Each of these companies (except Telstra Finance Limited) guarantees the payment in full of the debts of the other named companies in the event of their winding up.
7.5 Events after reporting dateWe are not aware of any matter or circumstance that has occurred since 30 June 2019 that, in our opinion, has significantly affected or may significantly affect in future years:
• our operations• the results of those operations • the state of our affairs
other than the following:
7.5.1 Final dividend
The details of the final dividend for the financial year 2019 are disclosed in note 4.1.
Section 7 - Other Information.fm Page 167 Tuesday, August 27, 2019 8:40 AM

Telstra Corporation Limited and controlled entities | 167
Notes to the financial statements (continued) Telstra Financial Report 2019Telstra Financial Report 2019Notes to the financial statements (continued) Telstra Financial Report 2019
Section 7. Other information (continued)
Telstra Corporation Limited and controlled entities | 167
7.4 Commitments and contingencies (continued)
7.4.3 Finance lease commitments
Table E includes finance lease commitments of the Telstra Group as a lessee.
Table E As at 30 June
Telstra Group 2019 2018
$m $mFinance lease commitmentsWithin 1 year 91 102Within 1 to 5 years 135 176After 5 years 116 233Total minimum lease payments 342 511Future finance charges on finance leases (51) (146)
Present value of net future minimum lease payments 291 365
The present value of finance lease liabilities is as follows:Within 1 year 78 81Within 1 to 5 years 101 114After 5 years 112 170Total finance lease liabilities 291 365
Table F provides information about the assets under our finance leases and their weighted average remaining lease terms.
Table F Telstra Group
Weighted average lease term (years)
As at 30 June
2019 2018Property leases in our controlled entities 12 13Computer mainframes, processing equipment and other related equipment 5 6
We lease computer mainframes, processing equipment and other related equipment to our customers as part of the solutions management and outsourcing services. Refer to note 3.3 for further details on these finance leases.
Refer to note 3.1 for our lease accounting policy (Telstra as a lessee).
7.4.4 Commitments of our associated entities
Information about our share of our associated entities’ commitments is included in note 6.2.4.
7.4.5 Contingent liabilities and contingent assets
We have no significant contingent assets as at 30 June 2019. Other than the above, details and estimated maximum amounts (where reasonable estimates can be made) of contingent liabilities for the Telstra Entity are disclosed in note 7.3.2.
Other contingent liabilities identified for the Telstra Group relate to the ASIC deed of cross guarantee. A list of the companies that are part of the deed are included in note 6.1.2. Each of these companies (except Telstra Finance Limited) guarantees the payment in full of the debts of the other named companies in the event of their winding up.
7.5 Events after reporting dateWe are not aware of any matter or circumstance that has occurred since 30 June 2019 that, in our opinion, has significantly affected or may significantly affect in future years:
• our operations• the results of those operations • the state of our affairs
other than the following:
7.5.1 Final dividend
The details of the final dividend for the financial year 2019 are disclosed in note 4.1.
Section 7 - Other Information.fm Page 167 Tuesday, August 27, 2019 8:40 AM

168 | Telstra Corporation Limited and controlled entities
Notes to the financial statements (continued)DIRECTORS’ DECLARATION
168 | Telstra Corporation Limited and controlled entities
Directors’ Declaration
This Directors’ Declaration is required by the Corporations Act 2001 of Australia.
The Directors of Telstra Corporation Limited have made a resolution that declared:
(a) in the Directors’ opinion, the financial statements and notes of the Telstra Group for the financial year ended 30 June 2019 as set out in the financial report:(i) comply with the Accounting Standards applicable in
Australia, International Financial Reporting Standards and Interpretations (as disclosed in note 1.1 to the financial statements), and Corporations Regulations 2001
(ii) give a true and fair view of the financial position of Telstra Corporation Limited and the Telstra Group as at 30 June 2019 and of the performance of Telstra Corporation Limited and the Telstra Group, for the year ended 30 June 2019
(iii) have been made out in accordance with the Corporations Act 2001.
(b) they have received declarations as required by section 295A of the Corporations Act 2001
(c) at the date of this declaration, in the Directors’ opinion, there are reasonable grounds to believe that Telstra Corporation Limited will be able to pay its debts as and when they become due and payable
(d) at the date of this declaration there are reasonable grounds to believe that the members of the extended closed group identified in note 6.1.2 to the financial statements, as parties to a Deed of Cross Guarantee, will be able to meet any liabilities to which they are, or may become, subject to because of the Deed of Cross Guarantee described in note 6.1.2.
For and on behalf of the board
John P MullenChairman
15 August 2019Melbourne, Australia
Andrew R PennChief Executive Officer and Managing Director
DirectorsDec.fm Page 168 Tuesday, August 27, 2019 8:27 AM
8 Exhibition StreetMelbourne VIC 3000 AustraliaGPO Box 67 Melbourne VIC 3001
Tel: +61 3 9288 8000Fax: +61 3 8650 7777ey.com/au
A member firm of Ernst & Young Global LimitedLiability limited by a scheme approved under Professional Standards Legislation 169
Independent Auditor’s Report to the Shareholders of Telstra Corporation Limited
Report on the Audit of the Financial Report
Opinion
We have audited the financial report of Telstra Corporation Limited (the Company) and its subsidiaries (collectively the Group), which comprises the consolidated statement of financial position as at 30 June 2019, the consolidated income statement, consolidated statement of comprehensive income, the consolidated statement of changes in equity and the consolidated statement of cash flows for the year then ended, notes to the financial statements, including a summary of significant accounting policies and the Directors’ Declaration.
In our opinion:
the accompanying financial report of the Group is in accordance with the Corporations Act 2001, including:
a. Giving a true and fair view of the consolidated financial position of the Group as at 30 June 2019 and of its consolidated financial performance for the year ended on that date; and
b. Complying with Australian Accounting Standards and the Corporations Regulations 2001.
Basis for Opinion
We conducted our audit in accordance with Australian Auditing Standards. Our responsibilities under those standards are further described in the Auditor’s Responsibilities for the Audit of the Financial Report section of our report. We are independent of the Group in accordance with the auditor independence requirements of the Corporations Act 2001 and the ethical requirements of the Accounting Professional and Ethical Standards Board’s APES110 Code of Ethics for Professional Accountants (the Code) that are relevant to our audit of the financial report in Australia. We have also fulfilled our other ethical responsibilities in accordance with the Code.
We believe that the audit evidence we have obtained is sufficient and appropriate to provide a basis for our opinion.
Key Audit Matters
Key audit matters are those matters that, in our professional judgment, were of most significance in our audit of the financial report of the current year. These matters were addressed in the context of our audit of the financial report as a whole, and in forming our opinion thereon, but we do not provide a separate opinion on these matters. For each matter below, our description of how our audit addressed the matter is provided in that context.
We have fulfilled the responsibilities described in the Auditor’s Responsibilities for the Audit of the Financial Report section of our report, including in relation to these matters. Accordingly, our audit included the performance of procedures designed to respond to our assessment of the risks of material misstatement of the financial report. The results of our audit procedures, including the procedures performed to address the matters below, provide the basis for our audit opinion on the accompanying financial report.
Key audit matter How our audit addressed the matterRevenue recognitionAustralian Accounting Standard AASB 15 Revenue from Contracts with Customers (AASB 15) applied to the Group from 1 July 2018. Upon adoption of AASB 15, there are five areas where the Group exercises significant judgment relating to revenue recognition:
• accounting for new products and plans including multiple element arrangements;
• accounting for large Network Application Services (NAS) contracts;
• accounting for NBN revenue under the revised Definitive Agreements (DAs) with nbn co and the Commonwealth Government;
• determination of standalone selling prices for products sold in multiple element arrangements; and
• assessment of significant financing components.
Disclosures relating to revenue recognition can be found at Notes 2.1 and 2.2 and disclosure of the impact of the adoption of the new revenue accounting standard can be found within Notes 1.5 and 7.1.
The accuracy and completeness of amounts recorded as revenue is an inherent industry risk due to the complexity of billing systems, the complexity of products and services, and the combination of products sold and price changes in the year.
We evaluated the effectiveness of key controls over the capture and measurement of revenue transactions across all material revenue streams, including evaluating the relevant IT systems and new process and controls implemented during the current year for the appropriate recognition of revenue under AASB 15.
We examined the process and controls over the capture and assessment of the timing of revenue recognised for new products and plans, as well as performed testing of a sample of new plans to supporting evidence.
For all key revenue streams, we obtained supporting evidence such as customer contracts, statements of work, invoices and service detail records to test the occurrence and measurement for a sample of revenue transactions.
For the major NAS contracts, we focused our work on those which we regarded as higher risk because of the nature of the contract, its stage of delivery or the quantum of the related assets and those which were significant by size.
SignOffs.fm Page 169 Tuesday, August 27, 2019 8:28 AM

Telstra Corporation Limited and controlled entities | 169
Notes to the financial statements (continued) Telstra Financial Report 2019
8 Exhibition StreetMelbourne VIC 3000 AustraliaGPO Box 67 Melbourne VIC 3001
Tel: +61 3 9288 8000Fax: +61 3 8650 7777ey.com/au
A member firm of Ernst & Young Global LimitedLiability limited by a scheme approved under Professional Standards Legislation 169
Independent Auditor’s Report to the Shareholders of Telstra Corporation Limited
Report on the Audit of the Financial Report
Opinion
We have audited the financial report of Telstra Corporation Limited (the Company) and its subsidiaries (collectively the Group), which comprises the consolidated statement of financial position as at 30 June 2019, the consolidated income statement, consolidated statement of comprehensive income, the consolidated statement of changes in equity and the consolidated statement of cash flows for the year then ended, notes to the financial statements, including a summary of significant accounting policies and the Directors’ Declaration.
In our opinion:
the accompanying financial report of the Group is in accordance with the Corporations Act 2001, including:
a. Giving a true and fair view of the consolidated financial position of the Group as at 30 June 2019 and of its consolidated financial performance for the year ended on that date; and
b. Complying with Australian Accounting Standards and the Corporations Regulations 2001.
Basis for Opinion
We conducted our audit in accordance with Australian Auditing Standards. Our responsibilities under those standards are further described in the Auditor’s Responsibilities for the Audit of the Financial Report section of our report. We are independent of the Group in accordance with the auditor independence requirements of the Corporations Act 2001 and the ethical requirements of the Accounting Professional and Ethical Standards Board’s APES110 Code of Ethics for Professional Accountants (the Code) that are relevant to our audit of the financial report in Australia. We have also fulfilled our other ethical responsibilities in accordance with the Code.
We believe that the audit evidence we have obtained is sufficient and appropriate to provide a basis for our opinion.
Key Audit Matters
Key audit matters are those matters that, in our professional judgment, were of most significance in our audit of the financial report of the current year. These matters were addressed in the context of our audit of the financial report as a whole, and in forming our opinion thereon, but we do not provide a separate opinion on these matters. For each matter below, our description of how our audit addressed the matter is provided in that context.
We have fulfilled the responsibilities described in the Auditor’s Responsibilities for the Audit of the Financial Report section of our report, including in relation to these matters. Accordingly, our audit included the performance of procedures designed to respond to our assessment of the risks of material misstatement of the financial report. The results of our audit procedures, including the procedures performed to address the matters below, provide the basis for our audit opinion on the accompanying financial report.
Key audit matter How our audit addressed the matterRevenue recognitionAustralian Accounting Standard AASB 15 Revenue from Contracts with Customers (AASB 15) applied to the Group from 1 July 2018. Upon adoption of AASB 15, there are five areas where the Group exercises significant judgment relating to revenue recognition:
• accounting for new products and plans including multiple element arrangements;
• accounting for large Network Application Services (NAS) contracts;
• accounting for NBN revenue under the revised Definitive Agreements (DAs) with nbn co and the Commonwealth Government;
• determination of standalone selling prices for products sold in multiple element arrangements; and
• assessment of significant financing components.
Disclosures relating to revenue recognition can be found at Notes 2.1 and 2.2 and disclosure of the impact of the adoption of the new revenue accounting standard can be found within Notes 1.5 and 7.1.
The accuracy and completeness of amounts recorded as revenue is an inherent industry risk due to the complexity of billing systems, the complexity of products and services, and the combination of products sold and price changes in the year.
We evaluated the effectiveness of key controls over the capture and measurement of revenue transactions across all material revenue streams, including evaluating the relevant IT systems and new process and controls implemented during the current year for the appropriate recognition of revenue under AASB 15.
We examined the process and controls over the capture and assessment of the timing of revenue recognised for new products and plans, as well as performed testing of a sample of new plans to supporting evidence.
For all key revenue streams, we obtained supporting evidence such as customer contracts, statements of work, invoices and service detail records to test the occurrence and measurement for a sample of revenue transactions.
For the major NAS contracts, we focused our work on those which we regarded as higher risk because of the nature of the contract, its stage of delivery or the quantum of the related assets and those which were significant by size.
SignOffs.fm Page 169 Tuesday, August 27, 2019 8:28 AM
A member firm of Ernst & Young Global LimitedLiability limited by a scheme approved under Professional Standards Legislation

170 | Telstra Corporation Limited and controlled entities
Notes to the financial statements (continued)
A member firm of Ernst & Young Global Limited170 Liability limited by a scheme approved under Professional Standards Legislation
Key audit matter How our audit addressed the matterThe complexity of the billing systems was also considered as part of the reliance on automated processes and controls Key Audit Matter below.
In performing this testing, we assessed the appropriateness of the assumptions and estimates underpinning the accounting for these major contracts as follows:
• We tested the effectiveness of controls that operate across the contract life cycle for major contracts.
• We obtained and read the relevant sections of certain contracts, to identify the contracted revenues, key provisions in the event of contract termination (such as penalties or the ability for the Group to recover costs) and other significant obligations.
• We ensured the future forecasts reflected the contract terms, testing any significant changes (such as new services) to contract amendments or other supporting documentation.
• We tested a sample of recorded revenue and cost transactions by agreeing them to supporting evidence, which for revenue included evidence of delivery and/or customer acceptance.
• We compared the historical forecast results of certain contracts with the actual results to assess the performance of the contract and the historical accuracy of forecasting.
• We considered the future forecast profitability and the contractual terms to assess the recoverability of the contract-specific assets and to determine if any contracts required loss provisions.
We assessed the appropriateness of the assumptions and estimates underpinning the accounting for the revised DAs including understanding the timing of disconnections, the progress of the NBN rollout and the transfer of the copper and Hybrid Fibre Coaxial (HFC) networks to nbn co.
We assessed the Group accounting policies as set out in Note 2.2, and the adequacy of disclosures for compliance with the revenue recognition requirements of Australian Accounting Standards.
Reliance on automated processes and controlsA significant part of the Group’s financial processes are heavily reliant on IT systems with automated processes and controls over the capturing, valuing and recording of transactions. This is a key part of our audit because of the:
• Complex IT environment supporting diverse business processes;
• Mix of manual and automated controls;
• Multiple internal and outsourced support arrangements; and
• Complexity of the billing systems which result in revenue being recognised.
Our IT specialists assessed the Group’s manual and automated controls relating to IT systems relevant to financial reporting, including the recognition of revenue. When testing controls was not considered an appropriate or efficient testing approach, alternative audit procedures were performed on the financial information being produced by systems.
The Group continues to enhance its IT systems and during the year implemented new systems which were significant to our audit.
Our IT specialists analysed the impact on our audit of new systems that are significant to our audit. This included assessing the design of relevant automated processes and controls.
We evaluated the effectiveness of the controls in the new systems.Impairment of goodwill and intangible assetsGiven the dynamic nature of the industry in which the Group operates, there is a risk that there could be material impairment to goodwill, other intangible asset balances, investments and other non-current assets.
We evaluated the Group’s impairment calculations including the testing of the recoverable amount of each CGU where there were indicators of impairment, or there were significant goodwill or indefinite life intangible asset balances.
SignOffs.fm Page 170 Tuesday, August 27, 2019 8:28 AM
A member firm of Ernst & Young Global LimitedLiability limited by a scheme approved under Professional Standards Legislation 171
Determination as to whether or not there is an impairment relating to an asset or Cash Generating Unit (CGU) involves significant judgment about the future cash flows and plans for these assets and CGUs.
Further disclosure regarding the Group’s impairment testing can be found in Note 3.2.
We evaluated the Group’s assessment of indicators of impairment or impairment reversal. Where we or the Group determined indicators existed, we evaluated the Group’s calculation of the recoverable amount of each CGU.
We assessed the reasonableness of the Board approved cash flow projections used in the impairment models as well as the reliability of the Group’s historical cash flow forecasts.
We involved our valuation specialists to assess the impairment models and evaluated the reasonableness of key assumptions including the discount rate, terminal growth rates and forecast growth assumptions. We also performed sensitivity analysis around the key drivers of the cash flow projections. Having determined the change in assumptions (individually or collectively) that would be required for the CGUs to be impaired, we considered the likelihood of such a movement in those key assumptions arising.
We evaluated the adequacy of impairments that had been recognised during the financial year.
We evaluated the adequacy of the disclosures included in Note 3.2.Capitalisation of assets, including useful lives, amortisation and impairmentThere are a number of areas where judgments significantly impact the carrying value of property, plant and equipment, software intangible assets and their respective depreciation and amortisation profiles. These areas are as follows:
• the decision to capitalise or expense costs;
• the annual asset life review;
• the timeliness of the transfer from assets in the course of construction; and
• significant changes that have taken place during the period or are expected to take place in the near future, which will impact the extent to which, or manner in which, an asset is used or is expected to be used.
Changes in these judgments have a significant impact on the results of the Group. Accordingly, this was considered a key audit matter.
Disclosures relating to the capitalisation and write-off of assets can be found at Notes 3.1 and 3.2.
Our audit procedures included the following:
• Assessed the effectiveness of the Group’s controls over the acquisition and disposal of fixed assets.
• Evaluated the appropriateness of capitalisation policies.
• Selected a sample of costs capitalised during the year to determine whether capitalisation was appropriate.
• Assessed the appropriateness of the date from which assets commenced being depreciated.
We assessed the application of the Group’s annual asset life review. This included assessing judgments made by the Group on:
• the nature of underlying costs capitalised; and
• the appropriateness of assets lives applied in the calculation of depreciation and amortisation.
We evaluated management’s impairment assessment of property, plant and equipment and software intangible assets. This included assessing judgments made by the Group on:
• the nature and impact of changes on the business from the Telstra 2022 (T22) strategy, including which specific assets are impacted;
• the extent of the impact of these changes on the carrying value of identified property, plant and equipment, software intangible assets; and
• the completeness of the listing of impacted assets.
We evaluated the adequacy of disclosures included in Notes 3.1 and 3.2.
Key audit matter How our audit addressed the matter
SignOffs.fm Page 171 Tuesday, August 27, 2019 8:28 AM
A member firm of Ernst & Young Global LimitedLiability limited by a scheme approved under Professional Standards Legislation

Telstra Corporation Limited and controlled entities | 171
Notes to the financial statements (continued) Telstra Financial Report 2019
A member firm of Ernst & Young Global LimitedLiability limited by a scheme approved under Professional Standards Legislation 171
Determination as to whether or not there is an impairment relating to an asset or Cash Generating Unit (CGU) involves significant judgment about the future cash flows and plans for these assets and CGUs.
Further disclosure regarding the Group’s impairment testing can be found in Note 3.2.
We evaluated the Group’s assessment of indicators of impairment or impairment reversal. Where we or the Group determined indicators existed, we evaluated the Group’s calculation of the recoverable amount of each CGU.
We assessed the reasonableness of the Board approved cash flow projections used in the impairment models as well as the reliability of the Group’s historical cash flow forecasts.
We involved our valuation specialists to assess the impairment models and evaluated the reasonableness of key assumptions including the discount rate, terminal growth rates and forecast growth assumptions. We also performed sensitivity analysis around the key drivers of the cash flow projections. Having determined the change in assumptions (individually or collectively) that would be required for the CGUs to be impaired, we considered the likelihood of such a movement in those key assumptions arising.
We evaluated the adequacy of impairments that had been recognised during the financial year.
We evaluated the adequacy of the disclosures included in Note 3.2.Capitalisation of assets, including useful lives, amortisation and impairmentThere are a number of areas where judgments significantly impact the carrying value of property, plant and equipment, software intangible assets and their respective depreciation and amortisation profiles. These areas are as follows:
• the decision to capitalise or expense costs;
• the annual asset life review;
• the timeliness of the transfer from assets in the course of construction; and
• significant changes that have taken place during the period or are expected to take place in the near future, which will impact the extent to which, or manner in which, an asset is used or is expected to be used.
Changes in these judgments have a significant impact on the results of the Group. Accordingly, this was considered a key audit matter.
Disclosures relating to the capitalisation and write-off of assets can be found at Notes 3.1 and 3.2.
Our audit procedures included the following:
• Assessed the effectiveness of the Group’s controls over the acquisition and disposal of fixed assets.
• Evaluated the appropriateness of capitalisation policies.
• Selected a sample of costs capitalised during the year to determine whether capitalisation was appropriate.
• Assessed the appropriateness of the date from which assets commenced being depreciated.
We assessed the application of the Group’s annual asset life review. This included assessing judgments made by the Group on:
• the nature of underlying costs capitalised; and
• the appropriateness of assets lives applied in the calculation of depreciation and amortisation.
We evaluated management’s impairment assessment of property, plant and equipment and software intangible assets. This included assessing judgments made by the Group on:
• the nature and impact of changes on the business from the Telstra 2022 (T22) strategy, including which specific assets are impacted;
• the extent of the impact of these changes on the carrying value of identified property, plant and equipment, software intangible assets; and
• the completeness of the listing of impacted assets.
We evaluated the adequacy of disclosures included in Notes 3.1 and 3.2.
Key audit matter How our audit addressed the matter
SignOffs.fm Page 171 Tuesday, August 27, 2019 8:28 AM
A member firm of Ernst & Young Global LimitedLiability limited by a scheme approved under Professional Standards Legislation

172 | Telstra Corporation Limited and controlled entities
Notes to the financial statements (continued)
A member firm of Ernst & Young Global Limited172 Liability limited by a scheme approved under Professional Standards Legislation
Information Other than the Financial Statements and Auditor's Report Thereon
The directors are responsible for the other information. The other information comprises the information included in the Group’s 2019 Annual Report other than the financial report and our auditor’s report thereon. We obtained the Directors’ Report that is to be included in the Annual Report, prior to the date of this auditor’s report, and we expect to obtain the remaining sections of the Annual Report after the date of this auditor’s report.
Our opinion on the financial report does not cover the other information and we do not and will not express any form of assurance conclusion thereon, with the exception of the Remuneration Report and our related assurance opinion.
In connection with our audit of the financial report, our responsibility is to read the other information and, in doing so, consider whether the other information is materially inconsistent with the financial report or our knowledge obtained in the audit or otherwise appears to be materially misstated.
If, based on the work we have performed on the other information obtained prior to the date of this auditor’s report, we conclude that there is a material misstatement of this other information, we are required to report that fact. We have nothing to report in this regard.
Responsibilities of the Directors for the Financial Report
The Directors of the Company are responsible for the preparation of the financial report that gives a true and fair view in accordance with Australian Accounting Standards and the Corporations Act 2001 and for such internal control as the Directors determine is necessary to enable the preparation of the financial report that gives a true and fair view and is free from material misstatement, whether due to fraud or error.
In preparing the financial report, the Directors are responsible for assessing the Group’s ability to continue as a going concern, disclosing, as applicable, matters related to going concern and using the going concern basis of accounting unless the Directors either intend to liquidate the Group or to cease operations, or have no realistic alternative but to do so.
Auditor’s Responsibilities for the Audit of the Financial Report
Our objectives are to obtain reasonable assurance about whether the financial report as a whole is free from material misstatement, whether due to fraud or error, and to issue an auditor’s report that includes our opinion. Reasonable assurance is a high level of assurance, but is not a guarantee that an audit conducted in accordance with the Australian Auditing Standards will always detect a material misstatement when it exists. Misstatements can arise from fraud or error and are considered material if, individually or in the aggregate, they could reasonably be expected to influence the economic decisions of users taken on the basis of this financial report.
As part of an audit in accordance with the Australian Auditing Standards, we exercise professional judgment and maintain professional scepticism throughout the audit. We also:
• Identify and assess the risks of material misstatement of the financial report, whether due to fraud or error, design and perform audit procedures responsive to those risks, and obtain audit evidence that is sufficient and appropriate to provide a basis for our opinion. The risk of not detecting a material misstatement resulting from fraud is higher than for one resulting from error, as fraud may involve collusion, forgery, intentional omissions, misrepresentations, or the override of internal control.
• Obtain an understanding of internal control relevant to the audit in order to design audit procedures that are appropriate in the circumstances, but not for the purpose of expressing an opinion on the effectiveness of the Group’s internal control.
• Evaluate the appropriateness of accounting policies used and the reasonableness of accounting estimates and related disclosures made by the Directors.
• Conclude on the appropriateness of the Directors’ use of the going concern basis of accounting and, based on the audit evidence obtained, whether a material uncertainty exists related to events or conditions that may cast significant doubt on the Group’s ability to continue as a going concern. If we conclude that a material uncertainty exists, we are required to draw attention in our auditor’s report to the related disclosures in the financial report or, if such disclosures are inadequate, to modify our opinion. Our conclusions are based on the audit evidence obtained up to the date of our auditor’s report. However, future events or conditions may cause the Group to cease to continue as a going concern.
• Evaluate the overall presentation, structure and content of the financial report, including the disclosures, and whether the financial report represents the underlying transactions and events in a manner that achieves fair presentation.
• Obtain sufficient appropriate audit evidence regarding the financial information of the entities or business activities within the Group to express an opinion on the financial report. We are responsible for the direction, supervision and performance of the Group audit. We remain solely responsible for our audit opinion.
We communicate with the Directors regarding, among other matters, the planned scope and timing of the audit and significant audit findings, including any significant deficiencies in internal control that we identify during our audit.
We also provide the Directors with a statement that we have complied with relevant ethical requirements regarding independence, and to communicate with them all relationships and other matters that may reasonably be thought to bear on our independence, and where applicable, related safeguards.
From the matters communicated to the Directors, we determine those matters that were of most significance in the audit of the financial report of the current year and are therefore the key audit matters. We describe these matters in our auditor’s report unless law or regulation precludes public disclosure about the matter or when, in extremely rare circumstances, we determine that a matter should not be communicated in our report because the adverse consequences of doing so would reasonably be expected to outweigh the public interest benefits of such communication.
SignOffs.fm Page 172 Tuesday, August 27, 2019 8:28 AM
A member firm of Ernst & Young Global LimitedLiability limited by a scheme approved under Professional Standards Legislation 173
Report on the Audit of the Remuneration Report
Opinion on the Remuneration Report
We have audited the Remuneration Report included in the Directors' Report for the year ended 30 June 2019.
In our opinion, the Remuneration Report of Telstra Corporation Limited for the year ended 30 June 2019, complies with section 300A of the Corporations Act 2001.
Responsibilities
The Directors of the Company are responsible for the preparation and presentation of the Remuneration Report in accordance with section 300A of the Corporations Act 2001. Our responsibility is to express an opinion on the Remuneration Report, based on our audit conducted in accordance with Australian Auditing Standards.
Ernst & Young
Andrew PricePartnerMelbourne15 August 2019
SignOffs.fm Page 173 Tuesday, August 27, 2019 8:28 AM
A member firm of Ernst & Young Global LimitedLiability limited by a scheme approved under Professional Standards Legislation

Telstra Corporation Limited and controlled entities | 173
Notes to the financial statements (continued) Telstra Financial Report 2019
A member firm of Ernst & Young Global LimitedLiability limited by a scheme approved under Professional Standards Legislation 173
Report on the Audit of the Remuneration Report
Opinion on the Remuneration Report
We have audited the Remuneration Report included in the Directors' Report for the year ended 30 June 2019.
In our opinion, the Remuneration Report of Telstra Corporation Limited for the year ended 30 June 2019, complies with section 300A of the Corporations Act 2001.
Responsibilities
The Directors of the Company are responsible for the preparation and presentation of the Remuneration Report in accordance with section 300A of the Corporations Act 2001. Our responsibility is to express an opinion on the Remuneration Report, based on our audit conducted in accordance with Australian Auditing Standards.
Ernst & Young
Andrew PricePartnerMelbourne15 August 2019
SignOffs.fm Page 173 Tuesday, August 27, 2019 8:28 AM
A member firm of Ernst & Young Global LimitedLiability limited by a scheme approved under Professional Standards Legislation

174
Title of class Identity of person of group Amount owned %
Listed shares Listed shareholders 11,893,297,855 100
Size of holding Number of shareholders % Number of shares %
1–1,000 610,068 47.05 335,756,450 2.82
1,001–5,000 466,584 35.99 1,115,540,930 9.38
5,001–10,000 115,441 8.90 826,020,462 6.95
10,001–100,000 100,952 7.79 2,435,716,637 20.48
100,001 and over 3,542 0.27 7,180,263,376 60.37
Total 1,296,587 100.00 11,893,297,855 100.00
The number of shareholders holding less than a marketable parcel of shares was 27,144 holding 2,045,407 shares (based on the closing market price on 26 July 2019).
Shareholder information
Listing information
Stock Exchange ListingsWe are listed, and our issued shares are quoted on the Australian Securities Exchange (ASX) and the New Zealand Stock Exchange (NZX).
Markets on which our debt securities are listedWe also have debt securities listed on the Australian Securities Exchange, the London Stock Exchange and the Singapore Stock Exchange.
Voting rights
Shareholders (whether residents or non-residents of Australia) may vote at a meeting of shareholders in person, directly or by proxy, attorney or representative, depending on whether the shareholder is an individual or a company.
Subject to any rights or restrictions attaching to our shares, on a show of hands each shareholder present in person or by proxy, attorney or representative has one vote and, on a poll, has one vote for each fully paid share held. Presently, we have only one class of fully paid ordinary shares and these do not have any voting restrictions. If shares are not fully paid, on a poll the number of votes attaching to the shares is pro-rated accordingly.
Distribution of securities and security holdings
The following table shows the number of listed shares on issue at 26 July 2019:
Distribution of shares
The following table summarises the distribution of our listed shares as at 26 July 2019:

175
Shareholder information | Telstra Annual Report 2019
Shareholder name Number of shares % of issued capital
1 HSBC CUSTODY NOMINEES (AUSTRALIA) LIMITED 2,679,912,881 22.53%
2 J P MORGAN NOMINEES AUSTRALIA LIMITED 1,464,962,267 12.32%
3 CITICORP NOMINEES PTY LIMITED 753,975,224 6.34%
4 BNP PARIBAS NOMINEES PTY LIMITED 526,820,942 4.43%
5 NATIONAL NOMINEES LIMITED 526,701,508 4.43%
6 ARGO INVESTMENTS LIMITED 41,014,800 0.34%
7 AUSTRALIAN FOUNDATION INVESTMENT COMPANY LIMITED 40,175,000 0.34%
8 UBS NOMINEES PTY LTD 37,739,027 0.32%
9 AMP LIFE LIMITED 34,207,280 0.29%
10 AUSTRALIAN EXECUTOR TRUSTEES LIMITED 25,970,597 0.22%
11 NETWEALTH INVESTMENTS LIMITED 24,094,429 0.20%
12 NULIS NOMINEES (AUSTRALIA) LIMITED 19,067,095 0.16%
13 NAVIGATOR AUSTRALIA LTD 18,115,697 0.15%
14 PACIFIC CUSTODIANS PTY LTD 17,551,335 0.15%
15 NETWORK INVESTMENT HOLDINGS 16,946,047 0.14%
16 MILTON CORPORATION LIMITED 15,236,961 0.13%
17 TELSTRA GROWTHSHARE PTY LTD 13,412,284 0.11%
18 BUTTONWOOD NOMINEES PTY LTD 9,803,930 0.08%
19 BKI INVESTMENT COMPANY LIMITED 9,234,451 0.08%
20 MUTUAL TRUST PTY LTD 8,520,564 0.07%
Total for Top 20 6,283,462,319 52.83%
Total other Investors 5,609,835,536 47.17%
Grand Total 11,893,297,855 100.00%
Substantial shareholders
As at 26 July 2019, we are not aware of any substantial shareholders.
Twenty largest shareholders as at 26 July 2019
The following table sets out the Top 20 holders of our shares (when multiple holdings are grouped together):

176
2018 has been restated for the impacts of AASB15.This table has been reviewed by our auditors.Reported EBITDA includes restructuring costs. FY19 guidance EBITDA excludes restructuring costs and impairments to core assets.
Note:There are a number of factors that have impacted our results this financial year. In the table above, we have adjusted the results for:
1. Mergers & Acquisitions (M&A adjustments): Adjustments relating to acquisition and disposals of controlled entities, joint ventures, associates and other investments and any associated net gains or losses and contingent consideration.
Joint ventures/Associates mainly include additional investments in our interest in the Telsta Ventures Fund II, LP.
During this period we disposed of our investment in Ooyala AB and their controlled entities, Orion Health Group Lts and VeloCloud. We also recieved deferred consideration from our disposal of 1300 Australia Pty Ltd and from the sell down of our interest in the Telstra Ventures Fund II, LP.
2. Restructuring adjustments: Adjustments for the strategic focus (T22 program) announced at last financial full year results to improve customer experience, simplify structure and cut costs. In addition to our normal business as usual redundancies for the period.
3. Asset impairment adjustments: Adjustments relating to an impairment and write downs for IT legacy assets and WIP.
4. Spectrum adjustments: Adjustment relating to the impact on free cashflow associated with our spectrum purchases and renewals for the period including: • $27m for renewal of spectrum licences in the 900
MHz band. • Payments for spectrum and apparatus licences in
various spectrum bands.
5. Asset impairment adjustments: Adjustments relating to an impairment and write downs for assets.
Reported Basis Adjustments June-19 June-18 Guidance Basis
Year ended 30 June M&AControlledEntities1
M&AJVs /
Associates1
M&AOther
Investments1
M&ADisposals1
Restructuring2 AssetImpairment3
Spectrum4 Asset Impairment5
Impairment6 Foxtel7 Spectrum8 M&A9 Restructuring10 Full year ended 30 June
2019 2018restated Growth 2019 2018
restated Growth
$m $m % $m $m $m $m $m $m $m $m $m $m $m $m $m $m $m %
Total revenue 25,259 25,848 (2.3%) (2) 0 0 (1) 0 0 0 0 0 (299) 0 0 0 25,256 25,549 (1.1%)
Total income (excl. finance income) 27,807 28,841 (3.6%) (2) 0 0 (1) 0 0 0 0 0 (299) 0 0 0 27,804 28,542 (2.6%)
Labour 5,279 5,207 1.4% 0 0 0 0 (529) 0 0 0 0 0 0 0 (53) 4,750 5,154 (7.8%)
Goods and services purchased
9,138 8,338 9.6% 0 0 0 0 0 0 0 0 0 0 0 0 0 9,138 8,338 9.6%
Other expenses 5,418 5,077 6.7% 0 (2) 0 (89) (272) (493) 0 (30) (297) 0 0 0 (233) 4,562 4,517 1.0%
Operating expenses 19,835 18,622 6.5% 0 (2) 0 (89) (801) (493) 0 (30) (297) 0 0 0 (286) 18,450 18,009 2.4%
Share of net gain/(loss) from joint ventures and associated entities
12 (22) n/m 0 0 0 0 0 0 0 0 0 57 0 0 0 12 35 (65.7%)
EBITDA 7,984 10,197 (21.7%) (2) 2 0 88 801 493 0 30 297 (242) 0 0 286 9,366 10,568 (11.4%)
Depreciation and amortisation
4,282 4,470 (4.2%) 0 0 0 0 0 0 0 0 0 0 0 0 0 4,282 4,470 (4.2%)
EBIT 3,702 5,727 (35.4%) (2) 2 0 88 801 493 0 30 297 (242) 0 0 286 5,084 6,098 (16.6%)
Net finance costs 630 588 7.1% 0 0 0 0 0 0 0 0 0 0 0 0 0 630 588 7.1%
Profit before income tax expense 3,072 5,139 (40.2%) (2) 2 0 88 801 493 0 30 297 (242) 0 0 286 4,454 5,510 (19.2%)
Income tax expense 923 1,582 (41.7%) 0 0 0 0 240 148 0 9 0 (11) 0 0 86 1,311 1,666 (21.3%)
Profit for the period 2,149 3,557 (39.6%) (2) 2 0 88 561 345 0 21 297 (231) 0 0 200 3,143 3,844 (18.2%)
Attributable to:
Equity holders of Telstra Entity
2,154 3,591 (40.0%) (2) 2 0 88 561 345 0 21 286 (231) 0 0 200 3,148 3,867 (18.6%)
Non-controlling interests (5) (34) 85.3% 0 0 0 0 0 0 0 0 11 0 0 0 0 (5) (23) 78.3%
Free cashflow 3,068 4,695 (34.7%) 5 21 1 62 0 0 29 0 0 51 113 14 0 3,186 4,873 (34.6%)
Guidance versus reported results
This schedule details the adjustments made to the reported results for the current and comparative period to reflect the performance of the business on the basis on which we provided guidance to the market. The results are based on the guidance statement for the current year. This guidance assumed wholesale product price stability and no impairments to investments or core assets, and excluded any proceeds on the sale of businesses, mergers and acquisitions and purchase of spectrum.
Reference tables
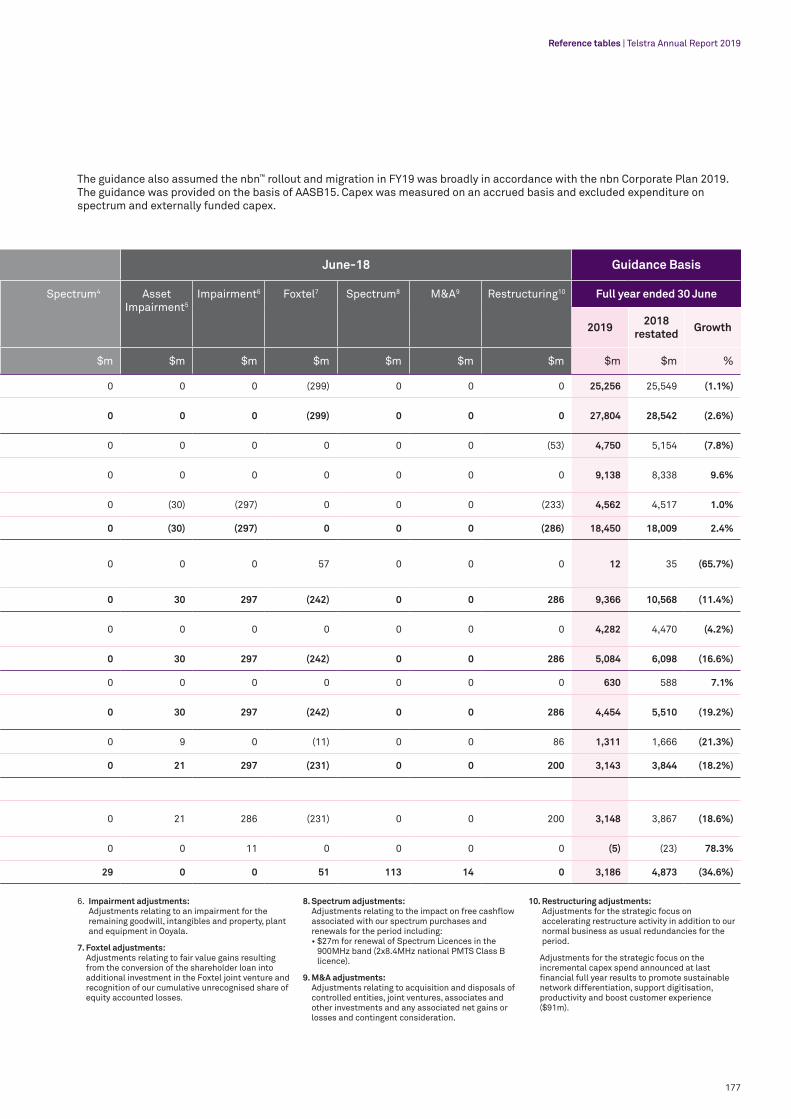
177
Reference tables | Telstra Annual Report 2019
6. Impairment adjustments: Adjustments relating to an impairment for the remaining goodwill, intangibles and property, plant and equipment in Ooyala.
7. Foxtel adjustments: Adjustments relating to fair value gains resulting from the conversion of the shareholder loan into additional investment in the Foxtel joint venture and recognition of our cumulative unrecognised share of equity accounted losses.
8. Spectrum adjustments: Adjustments relating to the impact on free cashflow associated with our spectrum purchases and renewals for the period including: • $27m for renewal of Spectrum Licences in the
900MHz band (2x8.4MHz national PMTS Class B licence).
9. M&A adjustments: Adjustments relating to acquisition and disposals of controlled entities, joint ventures, associates and other investments and any associated net gains or losses and contingent consideration.
10. Restructuring adjustments: Adjustments for the strategic focus on accelerating restructure activity in addition to our normal business as usual redundancies for the period.
Adjustments for the strategic focus on the incremental capex spend announced at last financial full year results to promote sustainable network differentiation, support digitisation, productivity and boost customer experience ($91m).
Reported Basis Adjustments June-19 June-18 Guidance Basis
Year ended 30 June M&AControlledEntities1
M&AJVs /
Associates1
M&AOther
Investments1
M&ADisposals1
Restructuring2 AssetImpairment3
Spectrum4 Asset Impairment5
Impairment6 Foxtel7 Spectrum8 M&A9 Restructuring10 Full year ended 30 June
2019 2018restated Growth 2019 2018
restated Growth
$m $m % $m $m $m $m $m $m $m $m $m $m $m $m $m $m $m %
Total revenue 25,259 25,848 (2.3%) (2) 0 0 (1) 0 0 0 0 0 (299) 0 0 0 25,256 25,549 (1.1%)
Total income (excl. finance income) 27,807 28,841 (3.6%) (2) 0 0 (1) 0 0 0 0 0 (299) 0 0 0 27,804 28,542 (2.6%)
Labour 5,279 5,207 1.4% 0 0 0 0 (529) 0 0 0 0 0 0 0 (53) 4,750 5,154 (7.8%)
Goods and services purchased
9,138 8,338 9.6% 0 0 0 0 0 0 0 0 0 0 0 0 0 9,138 8,338 9.6%
Other expenses 5,418 5,077 6.7% 0 (2) 0 (89) (272) (493) 0 (30) (297) 0 0 0 (233) 4,562 4,517 1.0%
Operating expenses 19,835 18,622 6.5% 0 (2) 0 (89) (801) (493) 0 (30) (297) 0 0 0 (286) 18,450 18,009 2.4%
Share of net gain/(loss) from joint ventures and associated entities
12 (22) n/m 0 0 0 0 0 0 0 0 0 57 0 0 0 12 35 (65.7%)
EBITDA 7,984 10,197 (21.7%) (2) 2 0 88 801 493 0 30 297 (242) 0 0 286 9,366 10,568 (11.4%)
Depreciation and amortisation
4,282 4,470 (4.2%) 0 0 0 0 0 0 0 0 0 0 0 0 0 4,282 4,470 (4.2%)
EBIT 3,702 5,727 (35.4%) (2) 2 0 88 801 493 0 30 297 (242) 0 0 286 5,084 6,098 (16.6%)
Net finance costs 630 588 7.1% 0 0 0 0 0 0 0 0 0 0 0 0 0 630 588 7.1%
Profit before income tax expense 3,072 5,139 (40.2%) (2) 2 0 88 801 493 0 30 297 (242) 0 0 286 4,454 5,510 (19.2%)
Income tax expense 923 1,582 (41.7%) 0 0 0 0 240 148 0 9 0 (11) 0 0 86 1,311 1,666 (21.3%)
Profit for the period 2,149 3,557 (39.6%) (2) 2 0 88 561 345 0 21 297 (231) 0 0 200 3,143 3,844 (18.2%)
Attributable to:
Equity holders of Telstra Entity
2,154 3,591 (40.0%) (2) 2 0 88 561 345 0 21 286 (231) 0 0 200 3,148 3,867 (18.6%)
Non-controlling interests (5) (34) 85.3% 0 0 0 0 0 0 0 0 11 0 0 0 0 (5) (23) 78.3%
Free cashflow 3,068 4,695 (34.7%) 5 21 1 62 0 0 29 0 0 51 113 14 0 3,186 4,873 (34.6%)
Guidance versus reported results
The guidance also assumed the nbn™ rollout and migration in FY19 was broadly in accordance with the nbn Corporate Plan 2019. The guidance was provided on the basis of AASB15. Capex was measured on an accrued basis and excluded expenditure on spectrum and externally funded capex.

178
Continuing operations
2019 20181 2017 2016 20152
$m $m $m $m $m
Total income (excluding finance income) 27,807 28,841 28,205 27,050 26,112
EBITDA3 7,984 10,197 10,679 10,465 10,533
EBIT 3,702 5,727 6,238 6,310 6,559
Profit for the year from continuing operations 2,149 3,557 3,874 3,832 4,114
Profit / (loss) for the year from discontinued operations4 – – – 2,017 191
Profit for the year from continuing and discontinued operations
2,149 3,557 3,874 5,849 4,305
Dividends declared per share (cents) 16.0 22.0 31.0 31.0 30.5
Total assets 42,589 42,634 42,133 43,286 40,445
Gross debt 15,331 15,368 16,218 16,009 14,962
Net debt 14,727 14,739 15,280 12,459 13,566
Total equity 14,530 14,556 14,560 15,907 14,510
Capital expenditure5 4,140 4,717 4,606 4,045 3,589
Free cashflow from continuing and discontinued operations
3,068 4,695 3,496 5,926 2,619
Earnings per share from continuing and discontinued operations (cents)
18.1 30.2 32.5 47.4 34.5
Dividend payout ratio (%)6 88 73 95 65 88
1. FY18 results have been restated to account for the adoption of AASB15 – refer to Note 1.5 in the Financial Report for further detail.2. Represented the Autohome Group being classified as a discontinued operation.3. Operating profit before interest, depreciation and amortisation and income tax expense. EBITDA is used as a measure of financial performance by excluding certain
variables that affect operating profits but which may not be directly related to all financial aspects of the operations of the company. EBITDA is not a measure of operating income, operating performance or liquidity under A-IFRS. Other companies may calculate EBITDA in a different manner to us.
4. Profit/(loss) for the year from discontinued operations for FY15 and FY16 included both Sensis and Autohome Group results.5. Capex is defined as additions to property, equipment and intangible assets including capital lease additions, excluding expenditure on spectrum, measured on an
accrued basis. Excludes externally funded capex.6. Dividend payout ratio from continuing and discontinued operations. Dividend payout ratio from continuing operations FY16: 98%.
Reference tables
nbn™, nbn co and other nbn™ logos and brands are trademarks of nbn co limited and used under licence.Fox Sports is a registered trademark of Twentieth Century Fox Film CorporationFoxtel is a registered trademark of Twentieth Century Fox Film Corporation.Ookla and Speedtest Awards are among some of the federally registered trademarks of Ookla, LLC in the US.All amounts are expressed in Australian dollars ($A) unless otherwise stated.Telstra Corporation Ltd, ABN 33 051 775 556

179
Glossary | Telstra Annual Report 2019Glossary
4G The fourth generation of wireless mobile networks, with typically faster download and upload speeds and better response times than previous generations.
4GXThe latest step in our 4G evolution. 4GX is capable of greater peak network speeds and adds another lane of capacity to the Telstra mobile broadband super highway.
5GThe fifth generation of wireless mobile networks, 5G will deliver a step change in typical network speeds, with reduced latency and much greater capacity to help address the explosion in wireless devices and data usage.
Access Virtual Circuit (AVC) chargeThe access charge that Retail Service Providers pay to nbn co per customer depending on the bandwidth allocated to the end-user premise.
Asymmetric Digital Subscriber Line (ADSL)A broadband technology that provides access to the internet at fast speeds. Data is carried over the copper network phone lines. These data speeds can enable the delivery of voice, data and video services.
Average Revenue Per User (ARPU)The measure of the average revenue generated per unit or user.
Big Data PlatformBig Data Platform enables you to collect, combine and explore data in one place.
BroadbandDescribes a class of internet access technologies, such as ADSL, HFC cable and WiFi, offering a data rate significantly higher than narrowband services. These services typically do not tie up a telephone line exclusively for data.
BundleA combination of products. For example, a customer can bundle a fixed-line home phone service and internet connection.
Capital expenditure (capex)Funds invested to purchase, upgrade or improve long-term assets such as property, infrastructure or equipment to create future benefit.
Cat M1An Internet of Things (IoT) technology, currently operating over Telstra’s 4GX coverage areas, that is suitable for applications requiring data with peak speeds of up to 1Mbps (typical speeds will be less). Cat M1 devices typically provide greater reach in distance and depth into buildings and extended battery life.
Connectivity Virtual Circuit (CVC) chargeA charge levied by nbn co on Retail Service Providers based on the capacity they acquire for retail customers’ use.
CloudThe provision of services, software, storage and security over the internet, typically on a pay-for-use basis. Cloud can allow access to information and programs on multiple devices in multiple locations.
Cyber security The safe use of information and telecommunications technology (including mobile phones) and the internet.
Customer relationship management (CRM)Technology for managing our relationships and interactions with customers and potential customers, such as processing transactions, managing an account or fault and recommending additional products and services.
Dark fibreAn optical fibre network used for data transmission.
Definitive AgreementThe documents that record the final, binding arrangements between Telstra, nbn co and the Commonwealth Government for Telstra’s participation in the nbn™ network rollout.
Dividend per share (DPS)A dividend is a payment of a portion of our earnings to our shareholders and is most often quoted in terms of the amount each share receives.
Earnings before interest, income tax expense, depreciation and amortisation (EBITDA)An indicator of a company’s operational profitability.
Earnings per share (EPS)The portion of profit allocated to each share.
Fibre to the Basement (FTTB)A broadband access solution that delivers fibre from an exchange facility to a location (eg the basement) in an apartment block or similar types of building, with the final connection to the end user customer premises being another access solution such as copper.
Fibre to the Node (FTTN)A broadband access solution that delivers fibre from an exchange facility to a street cabinet (the “node”), with the final connections to a premises being the copper network phone lines.
Fibre to the Premises (FTTP)A broadband access solution that delivers fibre from an exchange facility directly to the outside of a building, offering potentially faster internet speeds than FTTN solutions (see definition of FTTN).
Fixed line Refers to the delivery of telephone and/or internet services over a cable, rather than the mobile or wireless phone network. Fixed line is also a term used to describe a customer segment, for example ‘fixed line customers.’
Free cashflowThe cash that a company is able to generate from its operations after spending money required to maintain or expand its asset base.
Hybrid Fibre Coaxial (HFC)A way of delivering video, voice and data using both coaxial and fibre optic cables.
Infrastructure Service Agreement (ISA)An agreement between Telstra and nbn co that gives nbn co long-term access rights to certain types of Telstra infrastructure to enable the nbn™ network rollout, such as rack spaces in exchange buildings, ducts (and pits/manholes), dark fibre and certain poles.

180
Glossary
Internet of Things (IoT)The connectedness of ‘things’ (for example machinery, vehicles, appliances) to the internet via sensors and actuators that collect information about the state and condition of those things, and transmit that data to software platforms that can help people make sense of the information and take appropriate action.
Internet Protocol (IP)Part of the family of protocols describing software that identifies internet addresses, directs outgoing messages, and recognises incoming messages. Used in gateways to connect networks at a high level.
Live chatTelstra LiveChat is an application which allows visitors to Telstra.com the opportunity to communicate ‘live’ or in near to live interactions with a Telstra consultant. Customers can have their questions answered and/or purchase any number of products in one single chat session.
Megabit per second (MBps)A unit of measurement of transmission speeds equal to one million bits per second.
Mobile dataWireless internet access delivered over the mobile phone network to computers and other digital devices using portable modems.
Mobile Virtual Network Operator (MVNO) Mobile providers re-selling services via the Telstra wholesale mobile network.
Narrowband (NB) IoTA type of Internet of Things (IoT) technology that operates over Telstra’s 4GX coverage areas. Narrowband IoT is suited to stationary applications that send very small amounts of data infrequently and operate with longer battery life.
Net profit after tax (NPAT)The total revenue minus all expenses and taxes.
RoamingA service which allows customers to use their mobile phone while in a service area of another carrier.
Return on Invested Capital (ROIC)A measure of how efficiently a company is using capital to generate income. If ROIC is greater than a company’s weighted average cost of capital (WACC), value is being created for investors.
Software Defined Networking (SDN) A computer networking approach, comprised of multiple kinds of network technologies, designed to delivery greater flexibility and agility.
SpectrumWireless communications signals travel through the air via radio frequency, known also as spectrum. The government grants licences for dedicated use of portions (bands) of spectrum.
T22Telstra’s new strategy, announced on 20 June 2018, to lead the Australian market by simplifying its operations and product set, improving customer experience and reducing its cost base.
Universal service obligation (USO)Obligations placed on Telstra under the Telecommunications Act 1997 to ensure that standard telephone services, payphones and prescribed carriage services are reasonably accessible to all people in Australia on an equitable basis, wherever they reside or carry on business.
Wi-FiThe most prevalent form of wireless local area network (WLAN) technology. WLANs are small-scale wireless networks with a typical radius of several hundred feet.
Indicative financial calendar1
Half year results announcementThursday 13 February 2020
Ex-dividend share trading commencesWednesday 26 February 2020
Record date for interim dividendThursday 27 February 2020
DRP election dateFriday 28 February 2020
Interim dividend paidFriday 27 March 2020
Annual results announcementThursday 13 August 2020
Ex-dividend share trading commencesWednesday 26 August 2020
Record date for final dividendThursday 27 August 2020
DRP election dateFriday 28 August 2020
Final dividend paidThursday 24 September 2020
Annual General MeetingTuesday 13 October 2020
1. Timing of events may be subject to change. Any change will be notified to the Australian Securities Exchange (ASX).

Registered OfficeLevel 41, 242 Exhibition Street Melbourne, Victoria 3000 Australia Sue Laver Company Secretary Email: [email protected]
General Enquiries – Registered OfficeWebsite: telstra.com.au/aboutus/contactus Customer enquiries: 13 2200
Shareholder EnquiriesAustralian Share RegisterAustralia: 1300 88 66 77 All Other: +61 1300 88 66 77 Fax: +61 2 9287 0303 Email: [email protected] Website: linkmarketservices.com.au/telstra Link Market Services Limited PO Box A942, Sydney, South NSW 1234 Australia
New Zealand Share RegisterNew Zealand: 0800 835 787 All Other: +64 9 375 5998 Fax: +64 9 375 5990 Email: [email protected] Website: linkmarketservices.co.nz Link Market Services Limited PO Box 91976, Auckland 1142 New Zealand
Investor RelationsLevel 28, 242 Exhibition Street Melbourne, Victoria 3000 Australia Australia: 1800 880 679 All Other: +61 (3) 8647 4954 Email: [email protected]
SustainabilityLevel 39, 242 Exhibition Street Melbourne, Victoria 3000 AustraliaEmail: [email protected]
Online shareholder informationTelstra’s Investor Centre at telstra.com/investor has the latest news and information available for shareholders.
Shareholders can also easily manage their shareholding online at www.linkmarketservices.com.au/telstra
Shareholders require their SRN/HIN and postcode for access and then can view and update information under the following menus:
1. Holdings – transaction history, holding balance and value and latest closing share price.
2. Payment and Tax – dividend payment history, tax information, payment instructions and TFN details. Update bank details here.
3. Communication – become an e-Shareholder and update postal/email addresses and communication elections here.
Telstra Corporation LimitedABN 33 051 775 556 Incorporated in the Australian Capital Territory. Telstra is listed on Stock Exchanges in Australia and in New Zealand (Wellington).
WebsitesTelstra Investor Centre: telstra.com/investorTelstra Sustainability: exchange.telstra.com.au/sustainability/Telstra Corporate Governance: telstra.com/governanceTelstra Customer Enquiries: telstra.comContact Telstra: telstra.com.au/aboutus/contactus
Contact details
Keeping informedTo keep up to date with the latest news about Telstra:
• follow us on Twitter @Telstra_news
• follow us on Facebook
• subscribe to our media releases on our website at telstra.com.au/aboutus/media/rss-feeds
• subscribe to our sustainability newsletter at telstra.com/sustainability/subscribe
• visit Telstra Exchange at exchange.telstra.com.au

telstra.com/investor