Embed Size (px)
Citation preview
LEADERS’ QUEST ANNUAL REPORT: 2019 [PAGE 1]
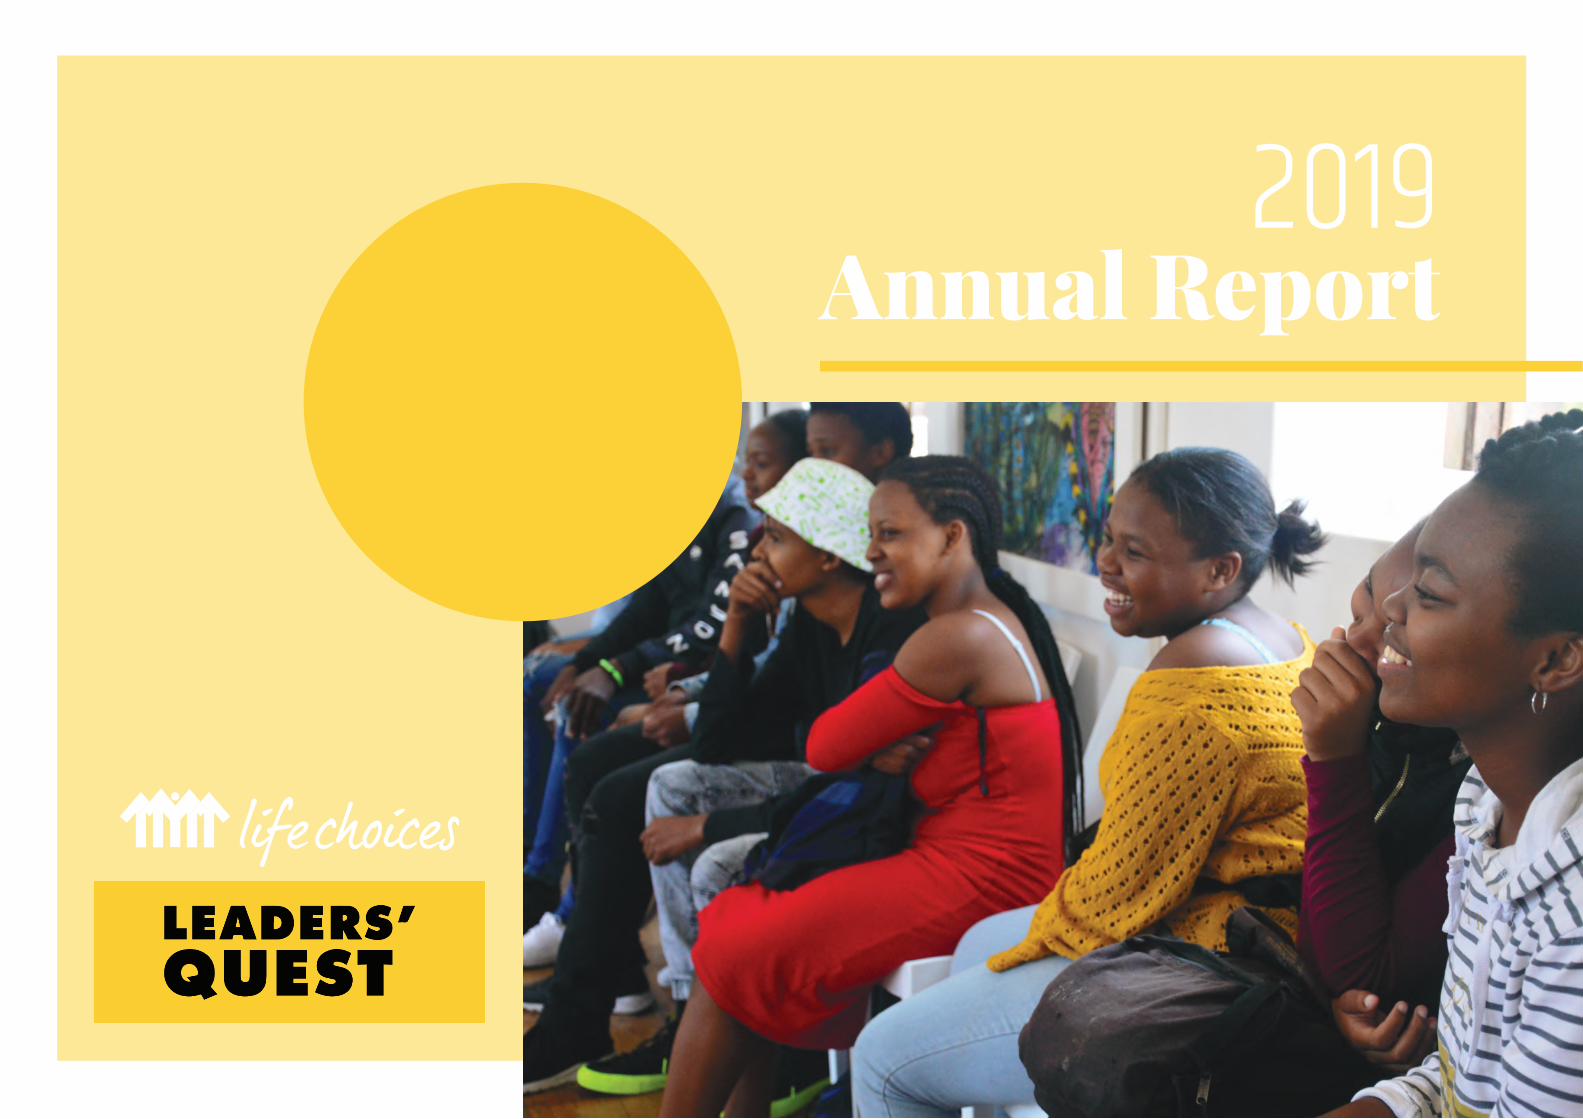
Annual Report2019
LEADERS’ QUEST ANNUAL REPORT: 2019 [PAGE 2]
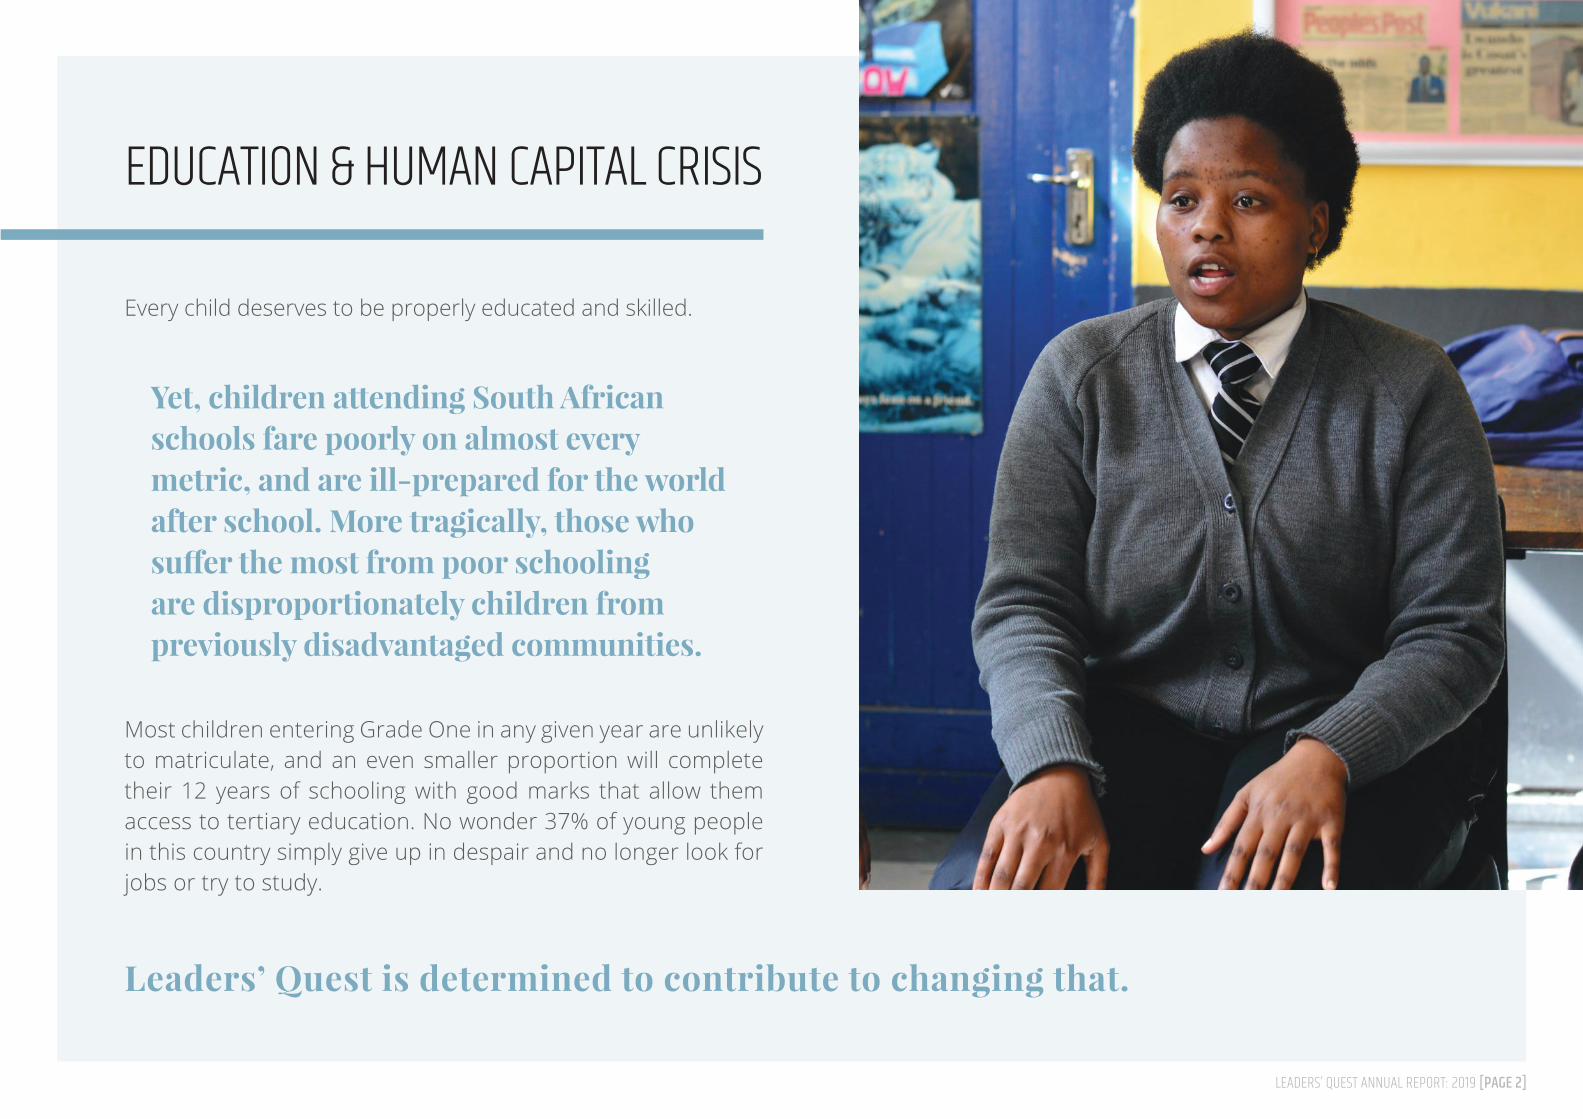
EDUCATION & HUMAN CAPITAL CRISIS
Every child deserves to be properly educated and skilled.
Most children entering Grade One in any given year are unlikely to matriculate, and an even smaller proportion will complete their 12 years of schooling with good marks that allow them access to tertiary education. No wonder 37% of young people in this country simply give up in despair and no longer look for jobs or try to study.
Yet, children attending South African schools fare poorly on almost every metric, and are ill-prepared for the world after school. More tragically, those who suffer the most from poor schooling are disproportionately children from previously disadvantaged communities.
Leaders’ Quest is determined to contribute to changing that.
LEADERS’ QUEST ANNUAL REPORT: 2019 [PAGE 3]
LEADERS’ QUEST GOAL
To mould a generation of young leaders from developing communities to become influential decision makers
for a greater South Africa
LEADERS’ QUEST ANNUAL REPORT: 2019 [PAGE 4]
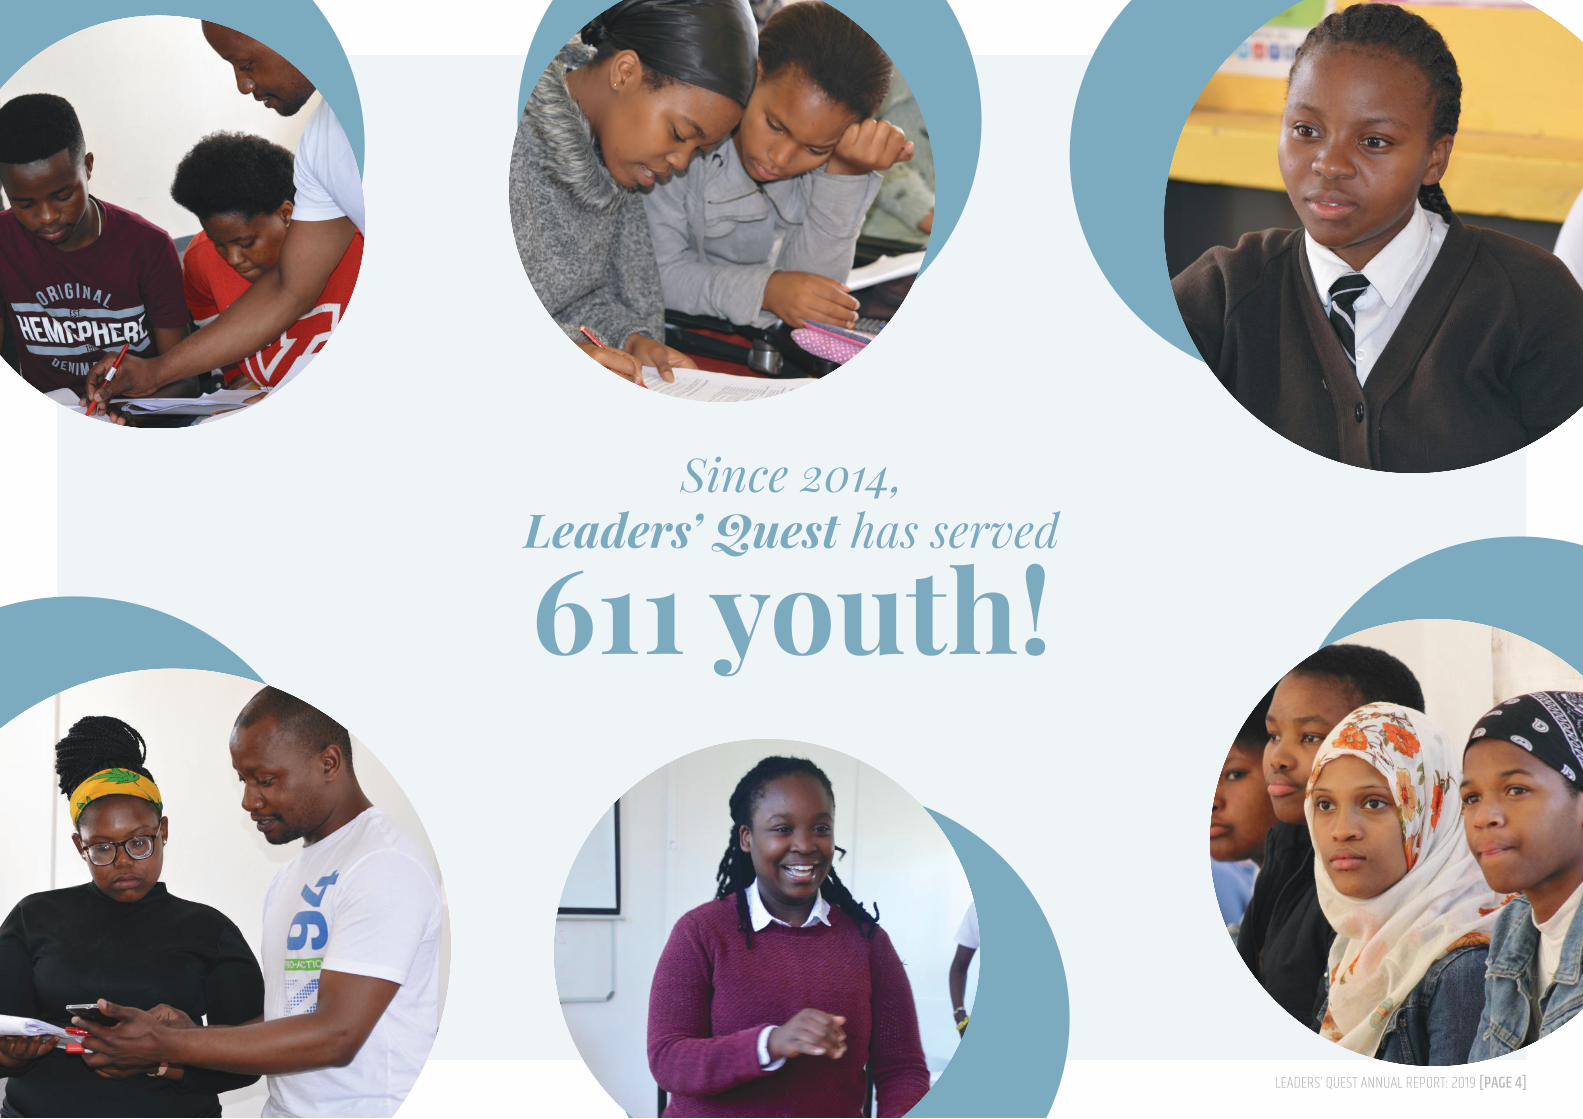
Since 2014, Leaders’ Quest has served
611 youth!
LEADERS’ QUEST ANNUAL REPORT: 2019 [PAGE 5]
OUR WORK IN2019
LEADERS’ QUEST ANNUAL REPORT: 2019 [PAGE 6]
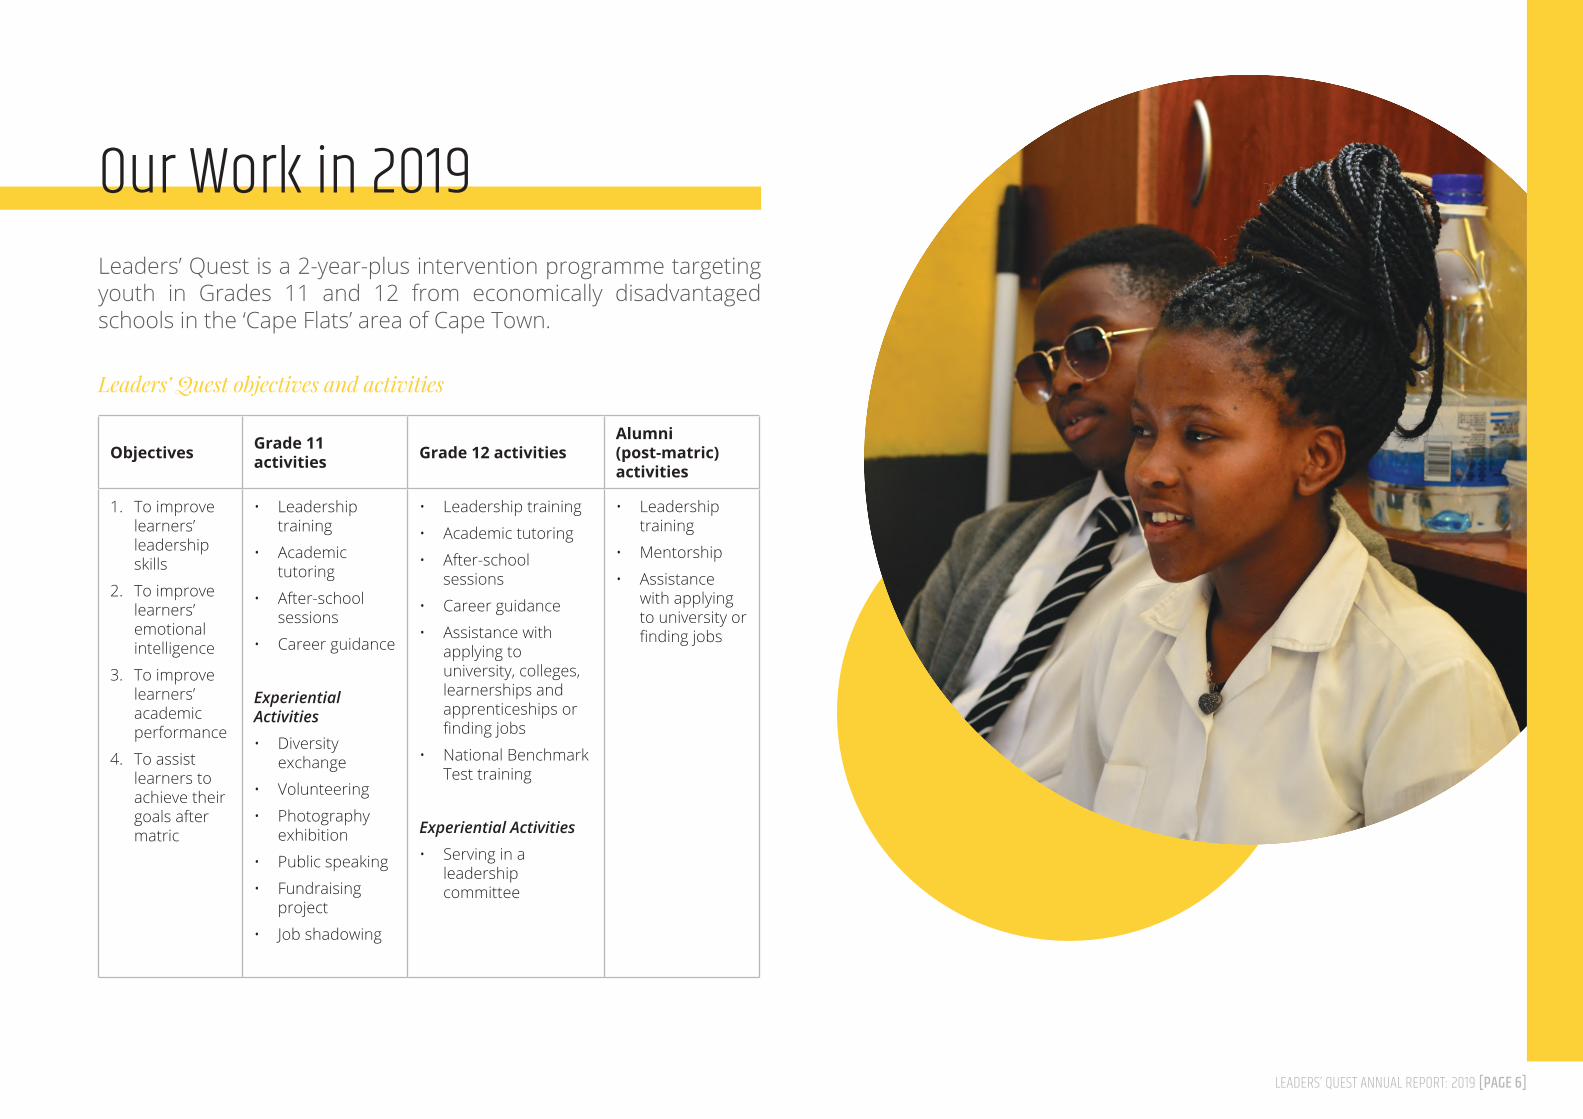
Our Work in 2019Leaders’ Quest is a 2-year-plus intervention programme targeting youth in Grades 11 and 12 from economically disadvantaged schools in the ‘Cape Flats’ area of Cape Town.
Objectives Grade 11 activities Grade 12 activities
Alumni (post-matric) activities
1. To improve learners’ leadership skills
2. To improve learners’ emotional intelligence
3. To improve learners’ academic performance
4. To assist learners to achieve their goals after matric
• Leadership training
• Academic tutoring
• After-school sessions
• Career guidance
Experiential Activities
• Diversity exchange
• Volunteering
• Photography exhibition
• Public speaking
• Fundraising project
• Job shadowing
• Leadership training
• Academic tutoring
• After-school sessions
• Career guidance
• Assistance with applying to university, colleges, learnerships and apprenticeships or finding jobs
• National Benchmark Test training
Experiential Activities
• Serving in a leadership committee
• Leadership training
• Mentorship
• Assistance with applying to university or finding jobs
Leaders’ Quest objectives and activities
LEADERS’ QUEST ANNUAL REPORT: 2019 [PAGE 7]
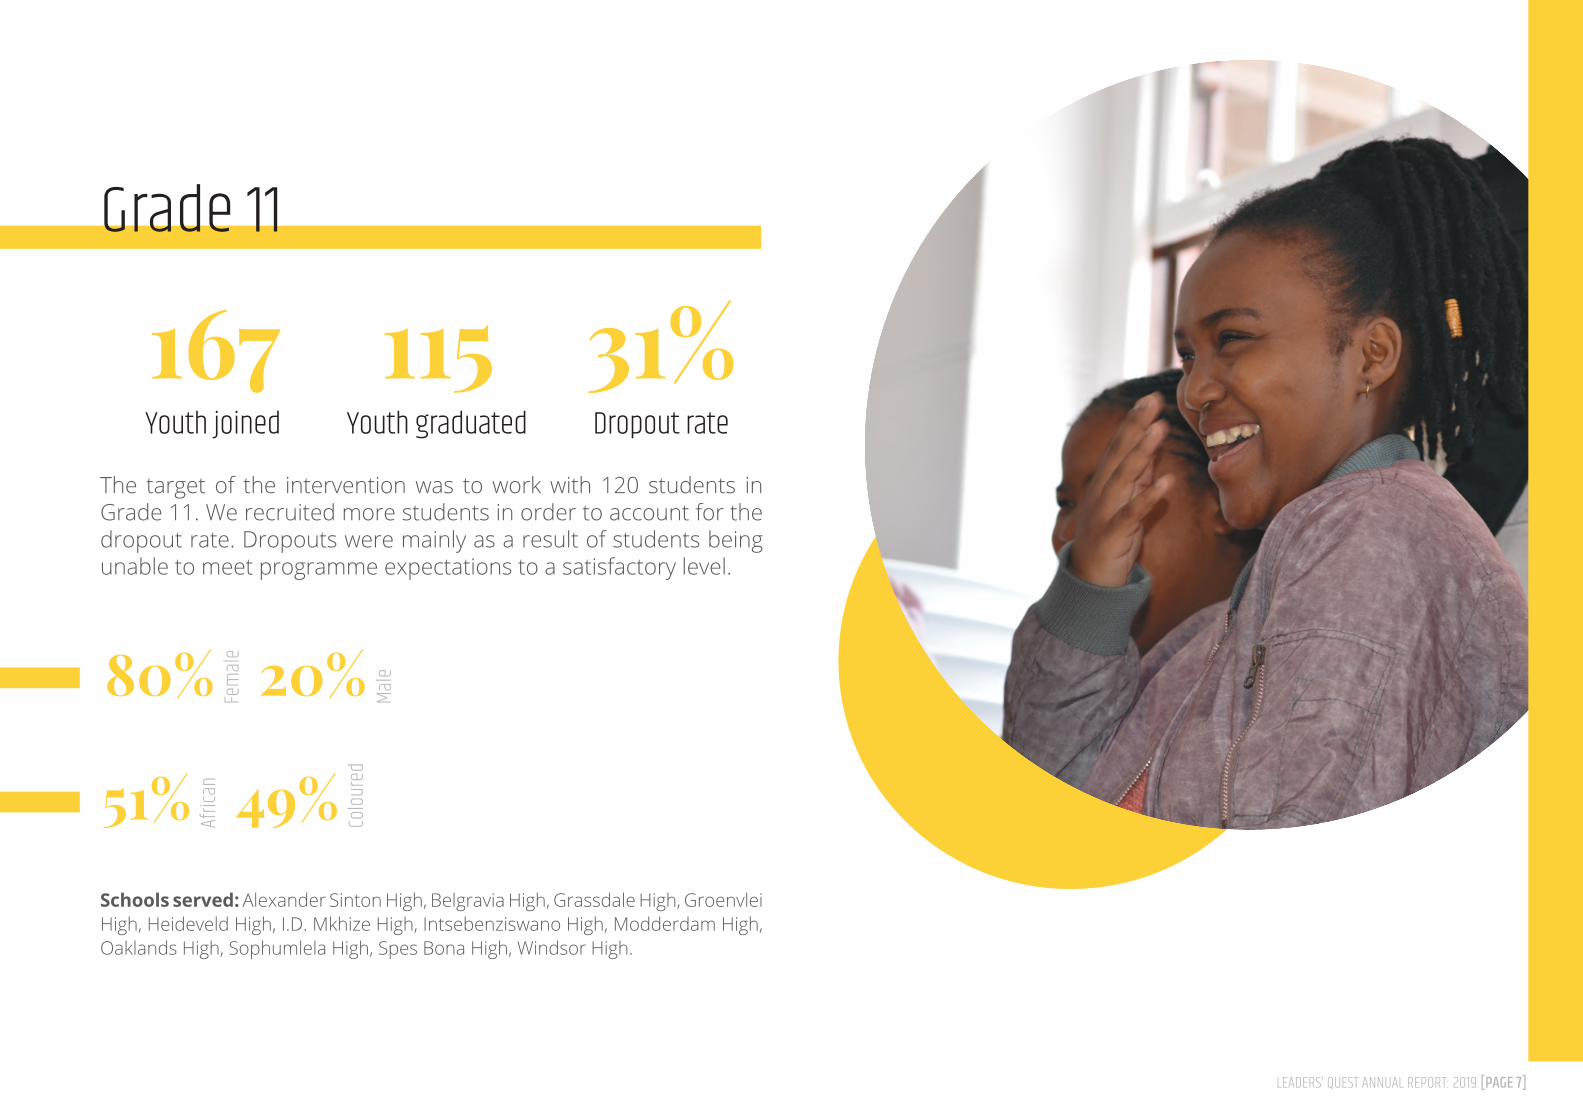
Grade 11
Youth joined Youth graduated Dropout rate
The target of the intervention was to work with 120 students in Grade 11. We recruited more students in order to account for the dropout rate. Dropouts were mainly as a result of students being unable to meet programme expectations to a satisfactory level.
Schools served: Alexander Sinton High, Belgravia High, Grassdale High, Groenvlei High, Heideveld High, I.D. Mkhize High, Intsebenziswano High, Modderdam High, Oaklands High, Sophumlela High, Spes Bona High, Windsor High.
167 115 31%Fe
male80%
Afric
an51% Colou
red
49%
Male20%
LEADERS’ QUEST ANNUAL REPORT: 2019 [PAGE 8]
Leadership Training
Hours of leadership training provided
Average attendance rate
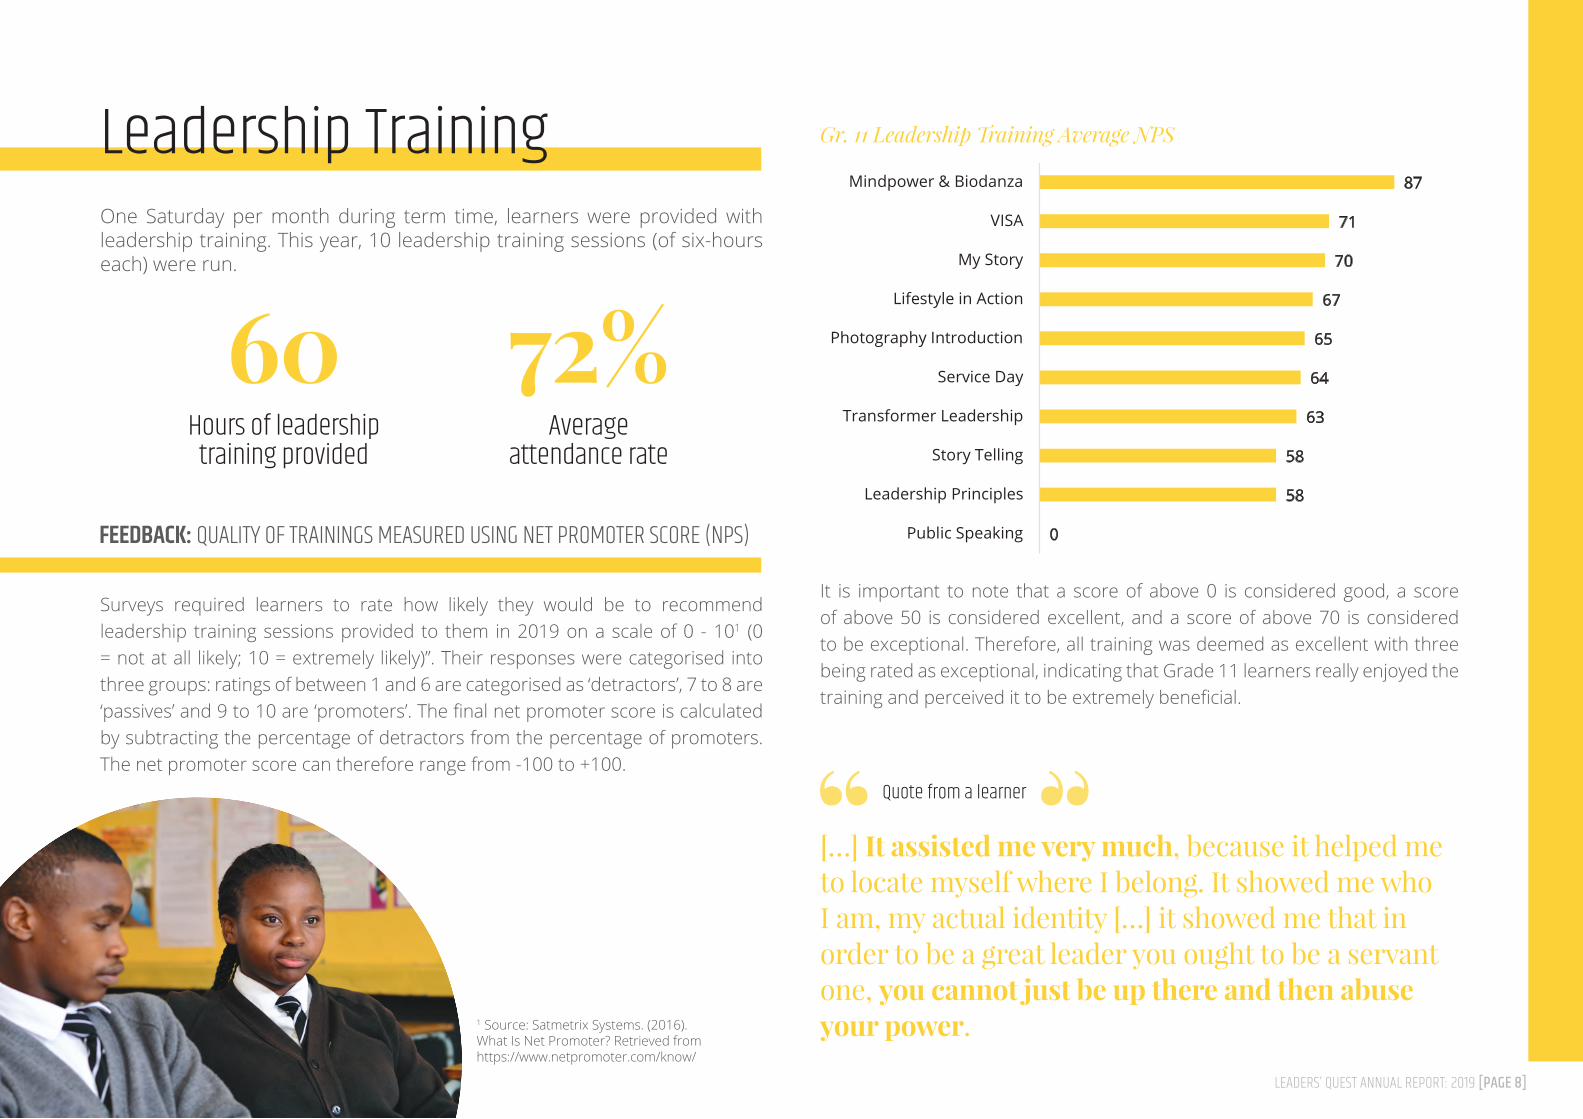
One Saturday per month during term time, learners were provided with leadership training. This year, 10 leadership training sessions (of six-hours each) were run.
Surveys required learners to rate how likely they would be to recommend leadership training sessions provided to them in 2019 on a scale of 0 - 101 (0 = not at all likely; 10 = extremely likely)”. Their responses were categorised into three groups: ratings of between 1 and 6 are categorised as ‘detractors’, 7 to 8 are ‘passives’ and 9 to 10 are ‘promoters’. The final net promoter score is calculated by subtracting the percentage of detractors from the percentage of promoters. The net promoter score can therefore range from -100 to +100.
1 Source: Satmetrix Systems. (2016). What Is Net Promoter? Retrieved from https://www.netpromoter.com/know/
It is important to note that a score of above 0 is considered good, a score of above 50 is considered excellent, and a score of above 70 is considered to be exceptional. Therefore, all training was deemed as excellent with three being rated as exceptional, indicating that Grade 11 learners really enjoyed the training and perceived it to be extremely beneficial.
60 72%
FEEDBACK: QUALITY OF TRAININGS MEASURED USING NET PROMOTER SCORE (NPS) 0
58
58
63
64
65
67
70
71
87
Public Speaking
Leadership Principles
Story Telling
Transformer Leadership
Service Day
Photography Introduction
Lifestyle in Action
My Story
VISA
Mindpower & Biodanza
Gr. 11 Leadership Training Average NPSGr. 11 Leadership Training Average NPS
[…] It assisted me very much, because it helped me to locate myself where I belong. It showed me who I am, my actual identity […] it showed me that in order to be a great leader you ought to be a servant one, you cannot just be up there and then abuse your power.
Quote from a learner
LEADERS’ QUEST ANNUAL REPORT: 2019 [PAGE 9]
After School Sessions
Hours of life skills training provided
Average attendance rate
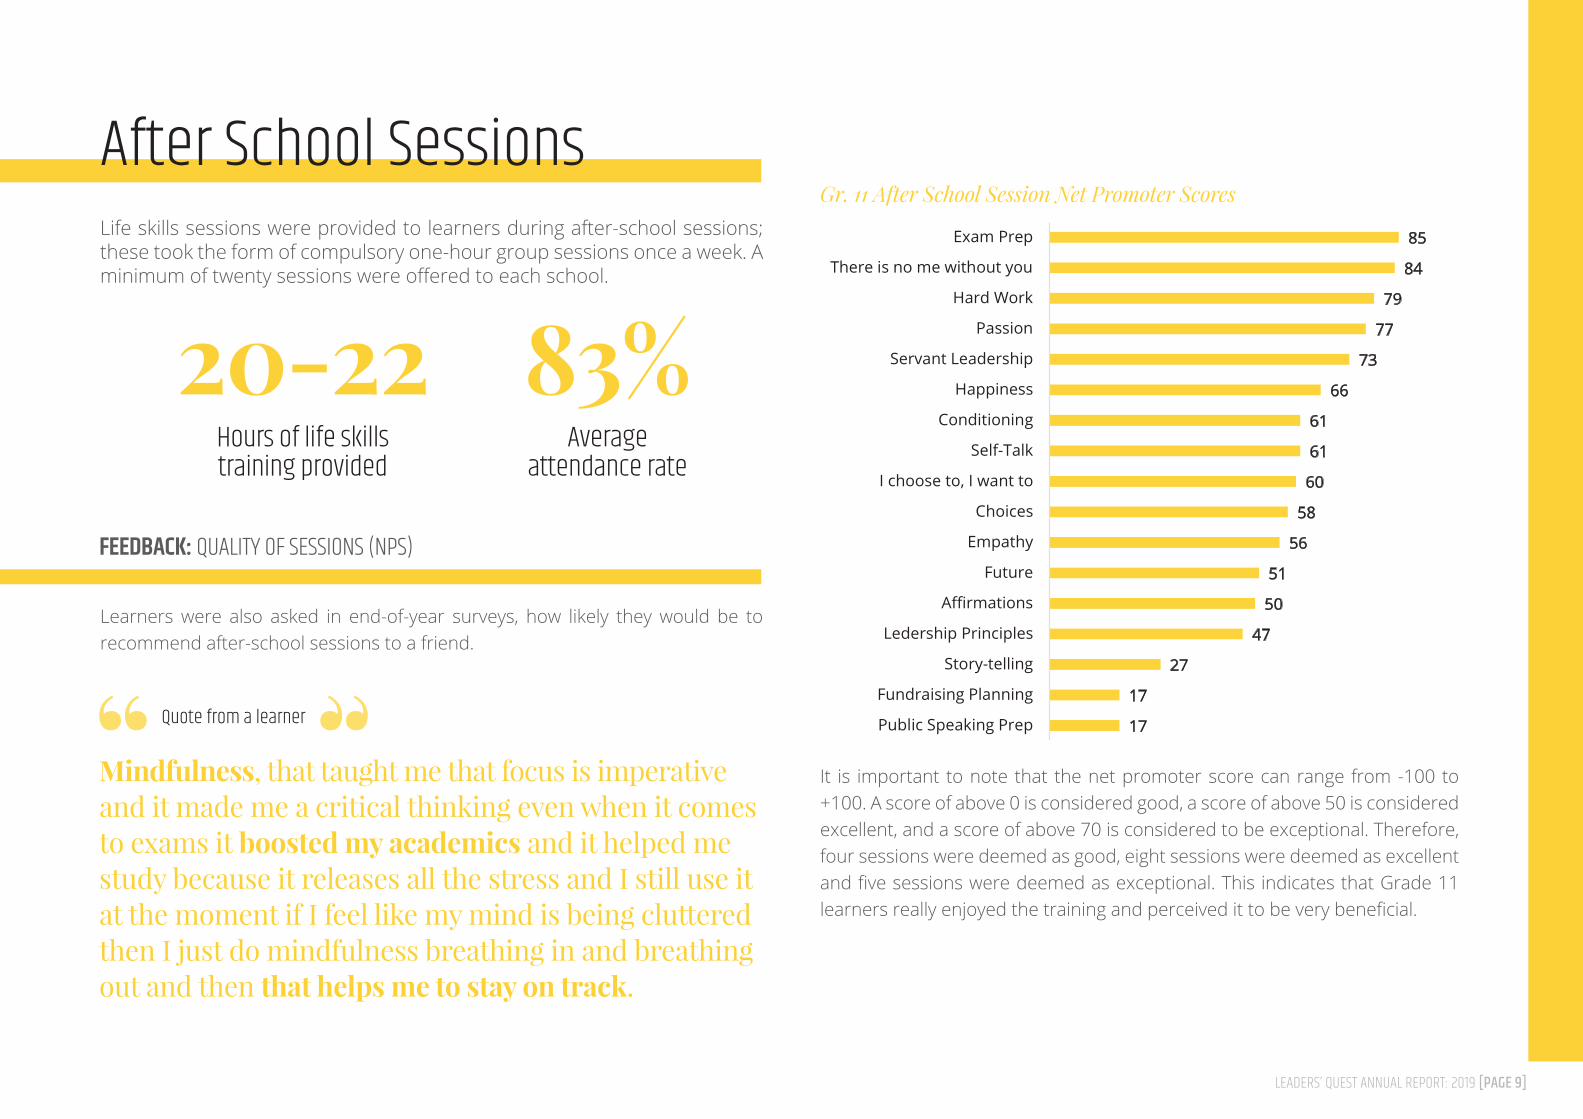
Life skills sessions were provided to learners during after-school sessions; these took the form of compulsory one-hour group sessions once a week. A minimum of twenty sessions were offered to each school.
Learners were also asked in end-of-year surveys, how likely they would be to recommend after-school sessions to a friend.
It is important to note that the net promoter score can range from -100 to +100. A score of above 0 is considered good, a score of above 50 is considered excellent, and a score of above 70 is considered to be exceptional. Therefore, four sessions were deemed as good, eight sessions were deemed as excellent and five sessions were deemed as exceptional. This indicates that Grade 11 learners really enjoyed the training and perceived it to be very beneficial.
20-22 83%
FEEDBACK: QUALITY OF SESSIONS (NPS)
17
17
27
47
50
51
56
58
60
61
61
66
73
77
79
84
85
Public Speaking Prep
Fundraising Planning
Story-telling
Ledership Principles
Affirmations
Future
Empathy
Choices
I choose to, I want to
Self-Talk
Conditioning
Happiness
Servant Leadership
Passion
Hard Work
There is no me without you
Exam Prep
Gr.11 After School Session Net Promote ScoresGr. 11 After School Session Net Promoter Scores
Mindfulness, that taught me that focus is imperative and it made me a critical thinking even when it comes to exams it boosted my academics and it helped me study because it releases all the stress and I still use it at the moment if I feel like my mind is being cluttered then I just do mindfulness breathing in and breathing out and then that helps me to stay on track.
Quote from a learner
LEADERS’ QUEST ANNUAL REPORT: 2019 [PAGE 10]
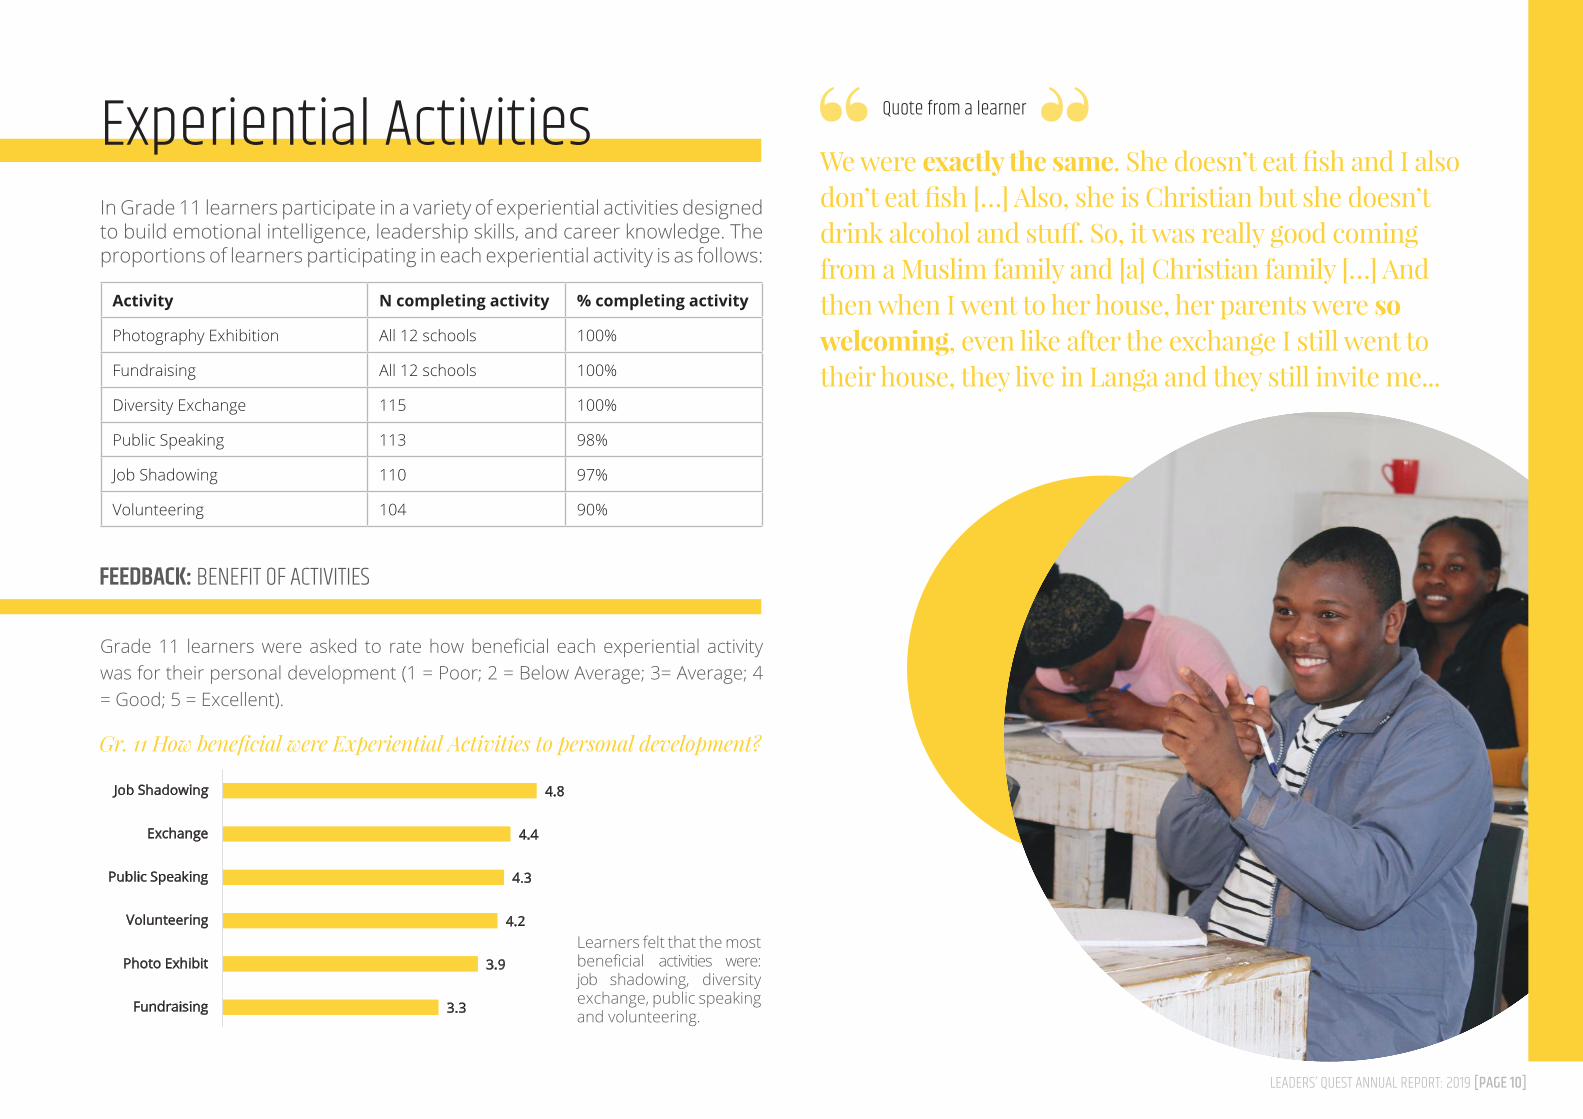
Experiential ActivitiesIn Grade 11 learners participate in a variety of experiential activities designed to build emotional intelligence, leadership skills, and career knowledge. The proportions of learners participating in each experiential activity is as follows:
Grade 11 learners were asked to rate how beneficial each experiential activity was for their personal development (1 = Poor; 2 = Below Average; 3= Average; 4 = Good; 5 = Excellent).
Learners felt that the most beneficial activities were: job shadowing, diversity exchange, public speaking and volunteering.
FEEDBACK: BENEFIT OF ACTIVITIES
4.8
4.4
4.3
4.2
3.9
3.3
Job Shadowing
Exchange
Public Speaking
Volunteering
Photo Exhibit
Fundraising
Gr. 11 How Beneficial were Experiential Activities to Personal Development?Gr. 11 How beneficial were Experiential Activities to personal development?
We were exactly the same. She doesn’t eat fish and I also don’t eat fish […] Also, she is Christian but she doesn’t drink alcohol and stuff. So, it was really good coming from a Muslim family and [a] Christian family […] And then when I went to her house, her parents were so welcoming, even like after the exchange I still went to their house, they live in Langa and they still invite me...
Quote from a learner
Activity N completing activity % completing activity
Photography Exhibition All 12 schools 100%
Fundraising All 12 schools 100%
Diversity Exchange 115 100%
Public Speaking 113 98%
Job Shadowing 110 97%
Volunteering 104 90%
LEADERS’ QUEST ANNUAL REPORT: 2019 [PAGE 11]
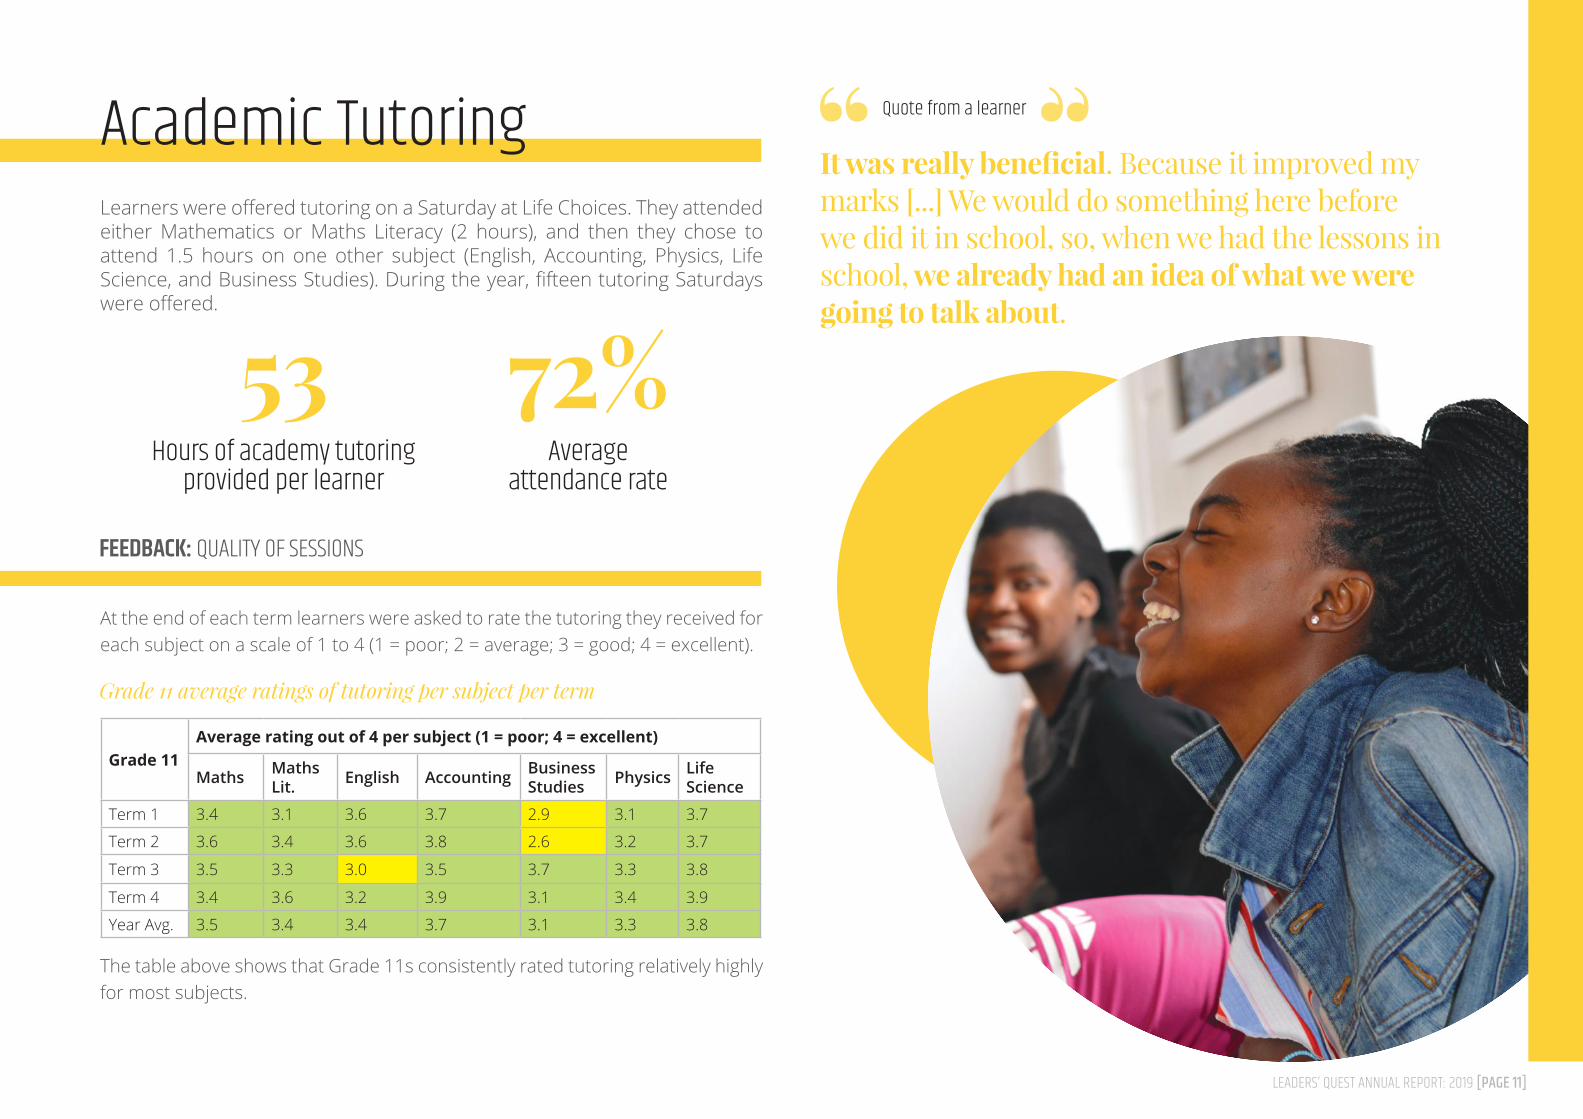
Academic TutoringLearners were offered tutoring on a Saturday at Life Choices. They attended either Mathematics or Maths Literacy (2 hours), and then they chose to attend 1.5 hours on one other subject (English, Accounting, Physics, Life Science, and Business Studies). During the year, fifteen tutoring Saturdays were offered.
At the end of each term learners were asked to rate the tutoring they received for each subject on a scale of 1 to 4 (1 = poor; 2 = average; 3 = good; 4 = excellent).
The table above shows that Grade 11s consistently rated tutoring relatively highly for most subjects.
FEEDBACK: QUALITY OF SESSIONS
Grade 11 average ratings of tutoring per subject per term
It was really beneficial. Because it improved my marks [...] We would do something here before we did it in school, so, when we had the lessons in school, we already had an idea of what we were going to talk about.
Quote from a learner
Grade 11Average rating out of 4 per subject (1 = poor; 4 = excellent)
Maths Maths Lit. English Accounting Business
Studies Physics Life Science
Term 1 3.4 3.1 3.6 3.7 2.9 3.1 3.7
Term 2 3.6 3.4 3.6 3.8 2.6 3.2 3.7
Term 3 3.5 3.3 3.0 3.5 3.7 3.3 3.8
Term 4 3.4 3.6 3.2 3.9 3.1 3.4 3.9
Year Avg. 3.5 3.4 3.4 3.7 3.1 3.3 3.8
Hours of academy tutoring provided per learner
Average attendance rate
53 72%
LEADERS’ QUEST ANNUAL REPORT: 2019 [PAGE 12]
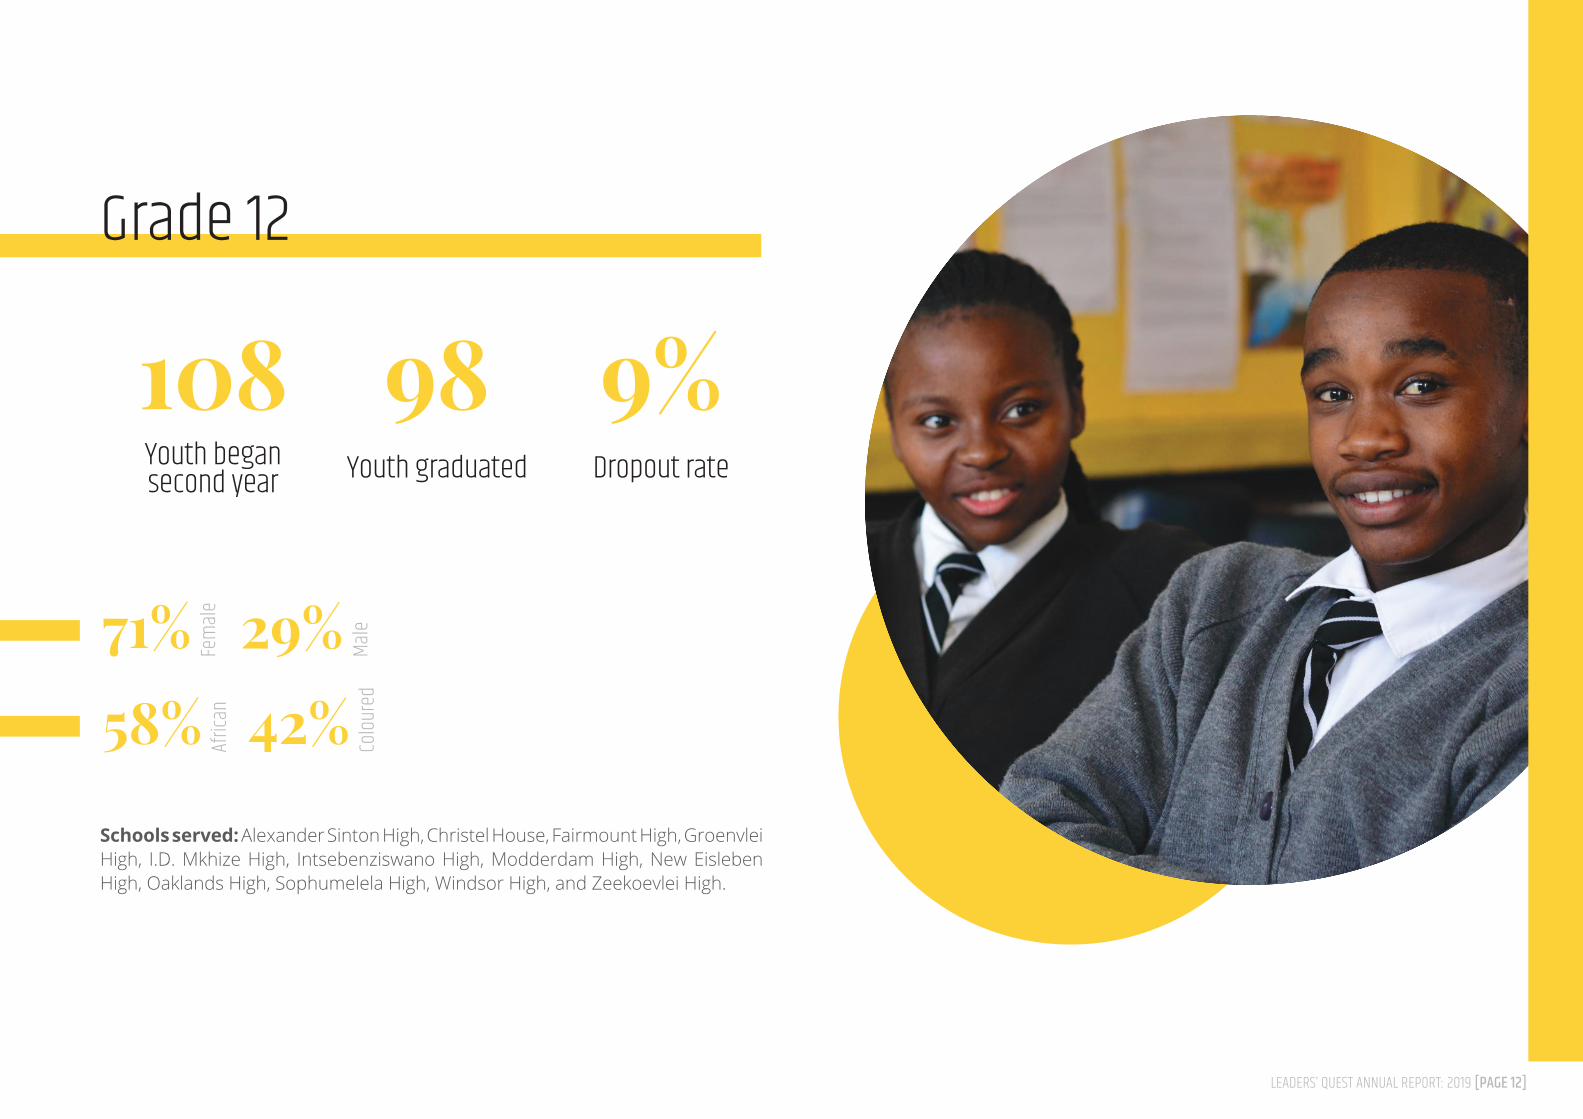
Grade 12
Youth began second year Youth graduated Dropout rate
Schools served: Alexander Sinton High, Christel House, Fairmount High, Groenvlei High, I.D. Mkhize High, Intsebenziswano High, Modderdam High, New Eisleben High, Oaklands High, Sophumelela High, Windsor High, and Zeekoevlei High.
108 98 9%
Fem
ale71%
Afric
an58% Colou
red
42%
Male29%
LEADERS’ QUEST ANNUAL REPORT: 2019 [PAGE 13]
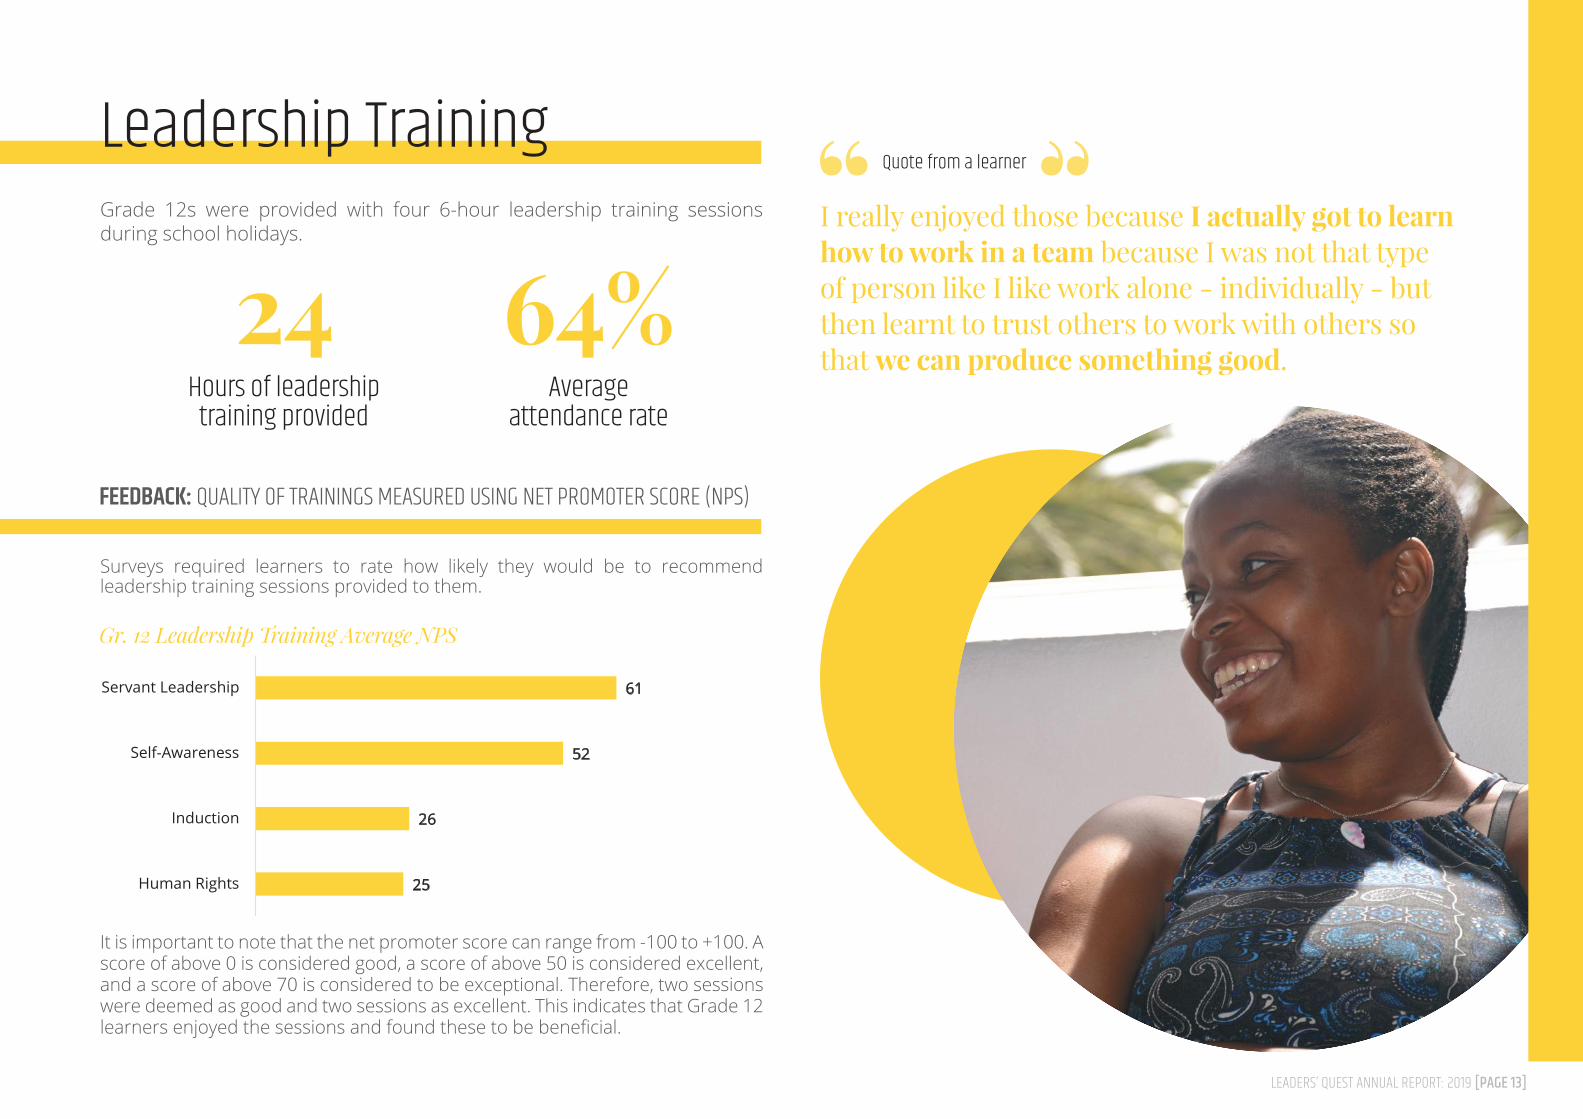
Leadership Training
Hours of leadership training provided
Average attendance rate
Grade 12s were provided with four 6-hour leadership training sessions during school holidays.
Surveys required learners to rate how likely they would be to recommend leadership training sessions provided to them.
It is important to note that the net promoter score can range from -100 to +100. A score of above 0 is considered good, a score of above 50 is considered excellent, and a score of above 70 is considered to be exceptional. Therefore, two sessions were deemed as good and two sessions as excellent. This indicates that Grade 12 learners enjoyed the sessions and found these to be beneficial.
24 64%
FEEDBACK: QUALITY OF TRAININGS MEASURED USING NET PROMOTER SCORE (NPS)
25
26
52
61
Human Rights
Induction
Self-Awareness
Servant Leadership
Gr.12 Leadership Training Average NPSGr. 12 Leadership Training Average NPS
I really enjoyed those because I actually got to learn how to work in a team because I was not that type of person like I like work alone - individually - but then learnt to trust others to work with others so that we can produce something good.
Quote from a learner
LEADERS’ QUEST ANNUAL REPORT: 2019 [PAGE 14]
Mini-Courses
Extra hours of leadership training
Average attendance rate
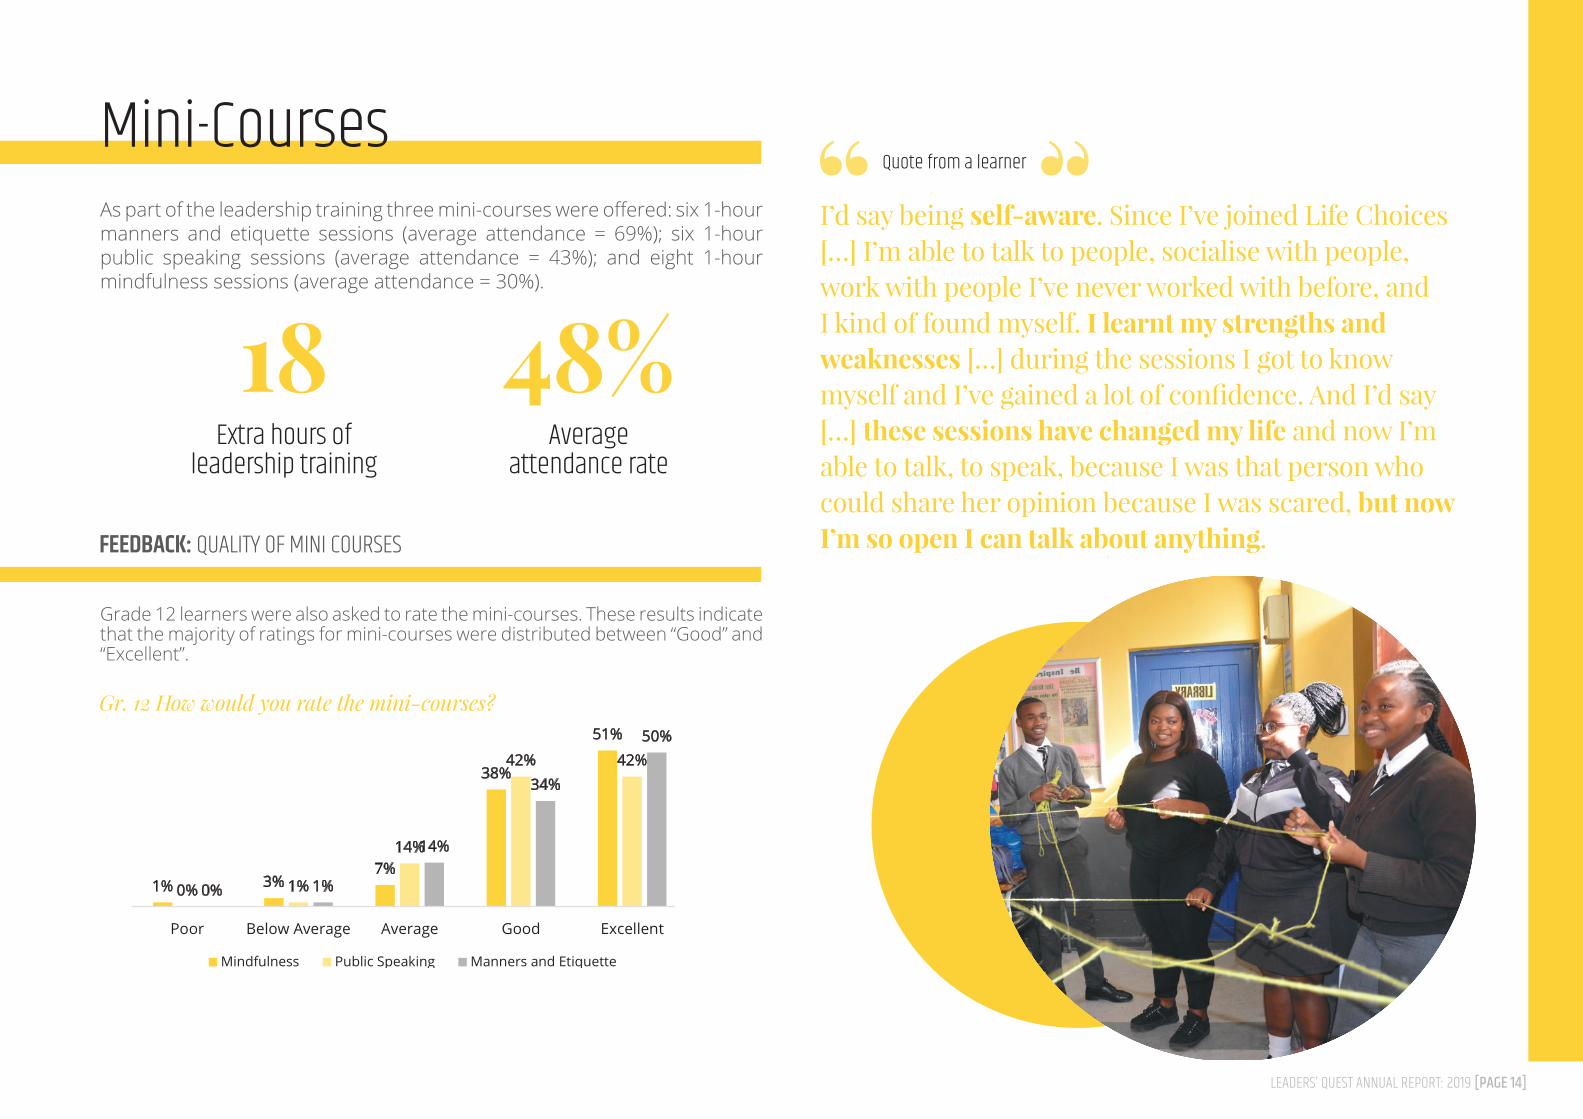
As part of the leadership training three mini-courses were offered: six 1-hour manners and etiquette sessions (average attendance = 69%); six 1-hour public speaking sessions (average attendance = 43%); and eight 1-hour mindfulness sessions (average attendance = 30%).
Grade 12 learners were also asked to rate the mini-courses. These results indicate that the majority of ratings for mini-courses were distributed between “Good” and “Excellent”.
18 48%
FEEDBACK: QUALITY OF MINI COURSES
1% 3%7%
38%
51%
0% 1%
14%
42% 42%
0% 1%
14%
34%
50%
Poor Below Average Average Good Excellent
Gr12. How Would You Rate the Mini-Courses?
Mindfulness Public Speaking Manners and Etiquette
Gr. 12 How would you rate the mini-courses?
I’d say being self-aware. Since I’ve joined Life Choices […] I’m able to talk to people, socialise with people, work with people I’ve never worked with before, and I kind of found myself. I learnt my strengths and weaknesses […] during the sessions I got to know myself and I’ve gained a lot of confidence. And I’d say […] these sessions have changed my life and now I’m able to talk, to speak, because I was that person who could share her opinion because I was scared, but now I’m so open I can talk about anything.
Quote from a learner

LEADERS’ QUEST ANNUAL REPORT: 2019 [PAGE 15]
After-School Sessions
Hours of life skills training provided
Average attendance rate
Life skills sessions were provided to learners during after-school sessions; these took the form of compulsory one-hour group sessions once a week. A minimum of twenty sessions were offered to each school.
Learners were also asked in end-of-year surveys, how likely they would be to recommend after-school sessions to a friend.
It is important to note that the net promoter score can range from -100 to +100. A score of above 0 is considered good, a score of above 50 is considered excellent, and a score of above 70 is considered to be exceptional. Therefore, six sessions were deemed as good, eight sessions were deemed as excellent and two sessions were deemed as exceptional. This indicates that Grade 12 learners really enjoyed the sessions and perceived these to be very beneficial.
17 80%
FEEDBACK: QUALITY OF SESSIONS (NPS)
71
70
68
65
63
61
61
61
54
54
49
49
48
48
45
30
Time Management
Social Management
Values in Leadership
Leadership as Choice
Communication and Listening
Goal Setting
Consistency
Self-Acceptance
Self-Management
Empathy
Attitude & Leadership
Planning
Self-Awareness
Servant Leader
Choices
Reflections
Gr.12 After-School Session Net Promoter ScoresGr. 12 After School Session Net Promoter Scores
What I’ve learnt most is working under pressure and dealing with time management because during the trial exams the timetable was very hectic and so we had to practice Maths then Monday its Physics and also I had to make time for everything, for my home chores and make time for also myself and also my studies. So, I learnt not to procrastinate and do my things on time.
Quote from a learner
LEADERS’ QUEST ANNUAL REPORT: 2019 [PAGE 16]
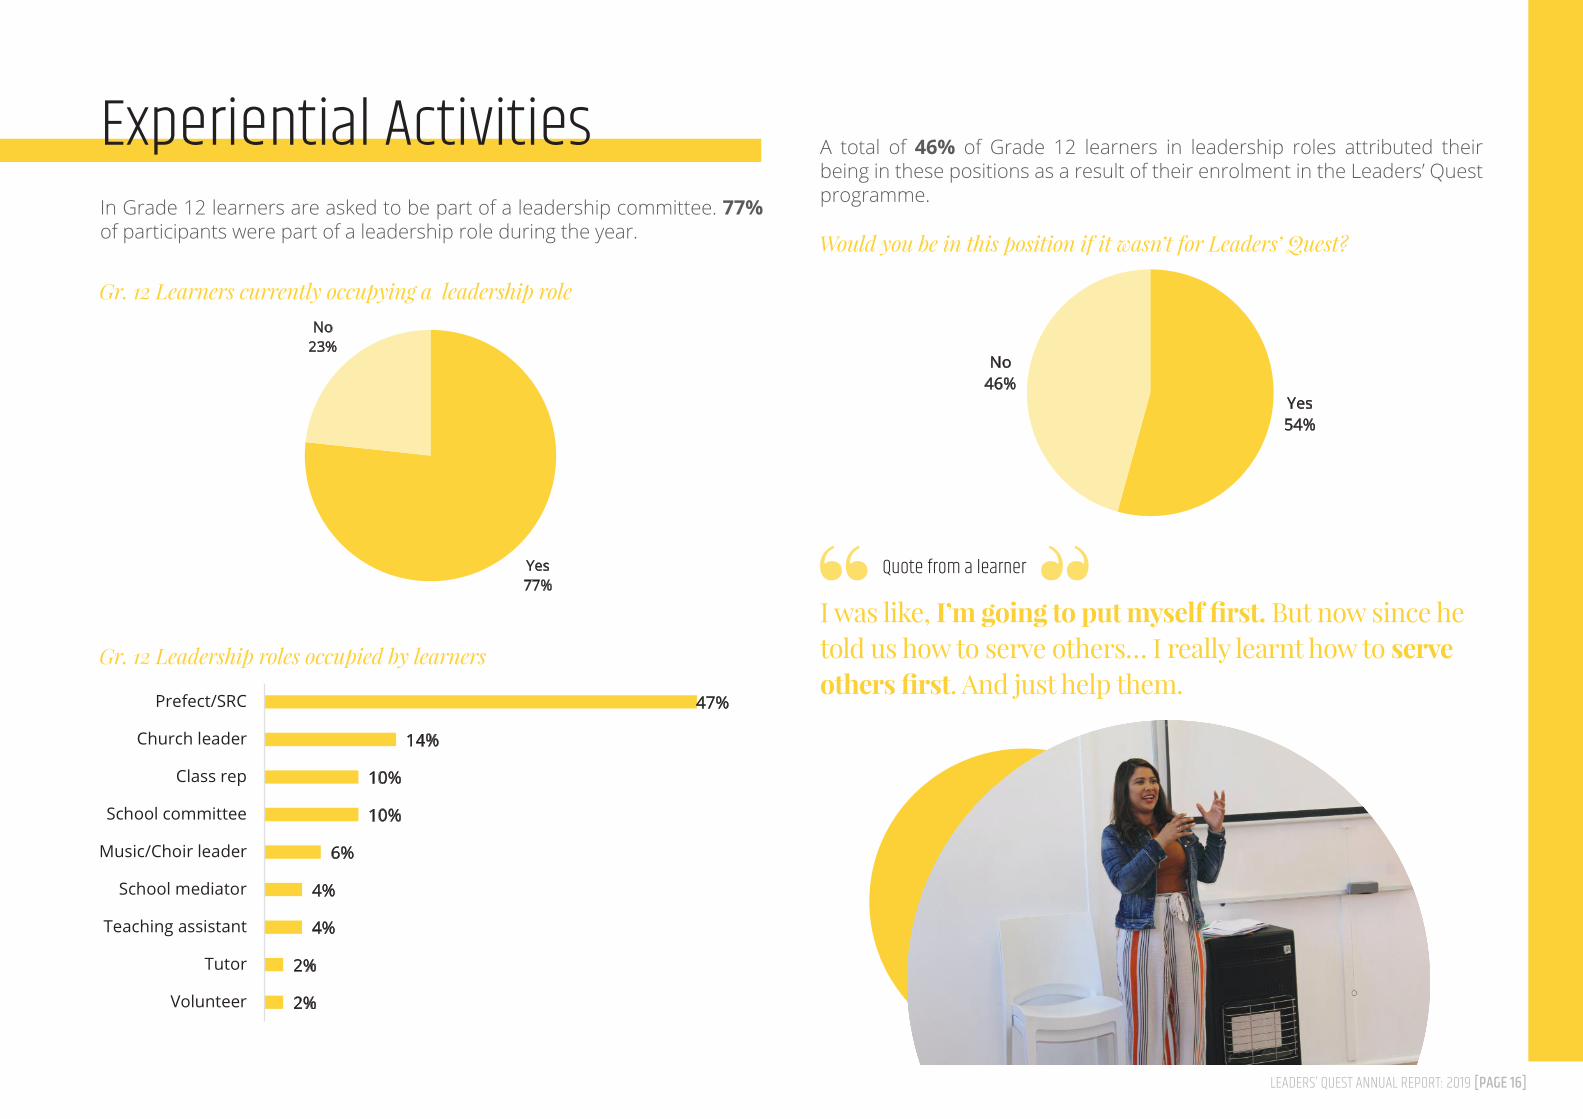
Experiential ActivitiesIn Grade 12 learners are asked to be part of a leadership committee. 77% of participants were part of a leadership role during the year.
A total of 46% of Grade 12 learners in leadership roles attributed their being in these positions as a result of their enrolment in the Leaders’ Quest programme.
Gr. 12 Learners currently occupying a leadership role
Would you be in this position if it wasn’t for Leaders’ Quest?
Gr. 12 Leadership roles occupied by learners
I was like, I’m going to put myself first. But now since he told us how to serve others… I really learnt how to serve others first. And just help them.
Quote from a learnerYes77%
No23%
GR. 12 Learners Currently Occupying a Leadership Role
Yes No
47%
14%
10%
10%
6%
4%
4%
2%
2%
Prefect/SRC
Church leader
Class rep
School committee
Music/Choir leader
School mediator
Teaching assistant
Tutor
Volunteer
Gr.12 Leadership Roles Occupied by Learners
Yes54%
No46%
Would you be in this position if it wasn't for Leaders' Quest?
Yes No
LEADERS’ QUEST ANNUAL REPORT: 2019 [PAGE 17]
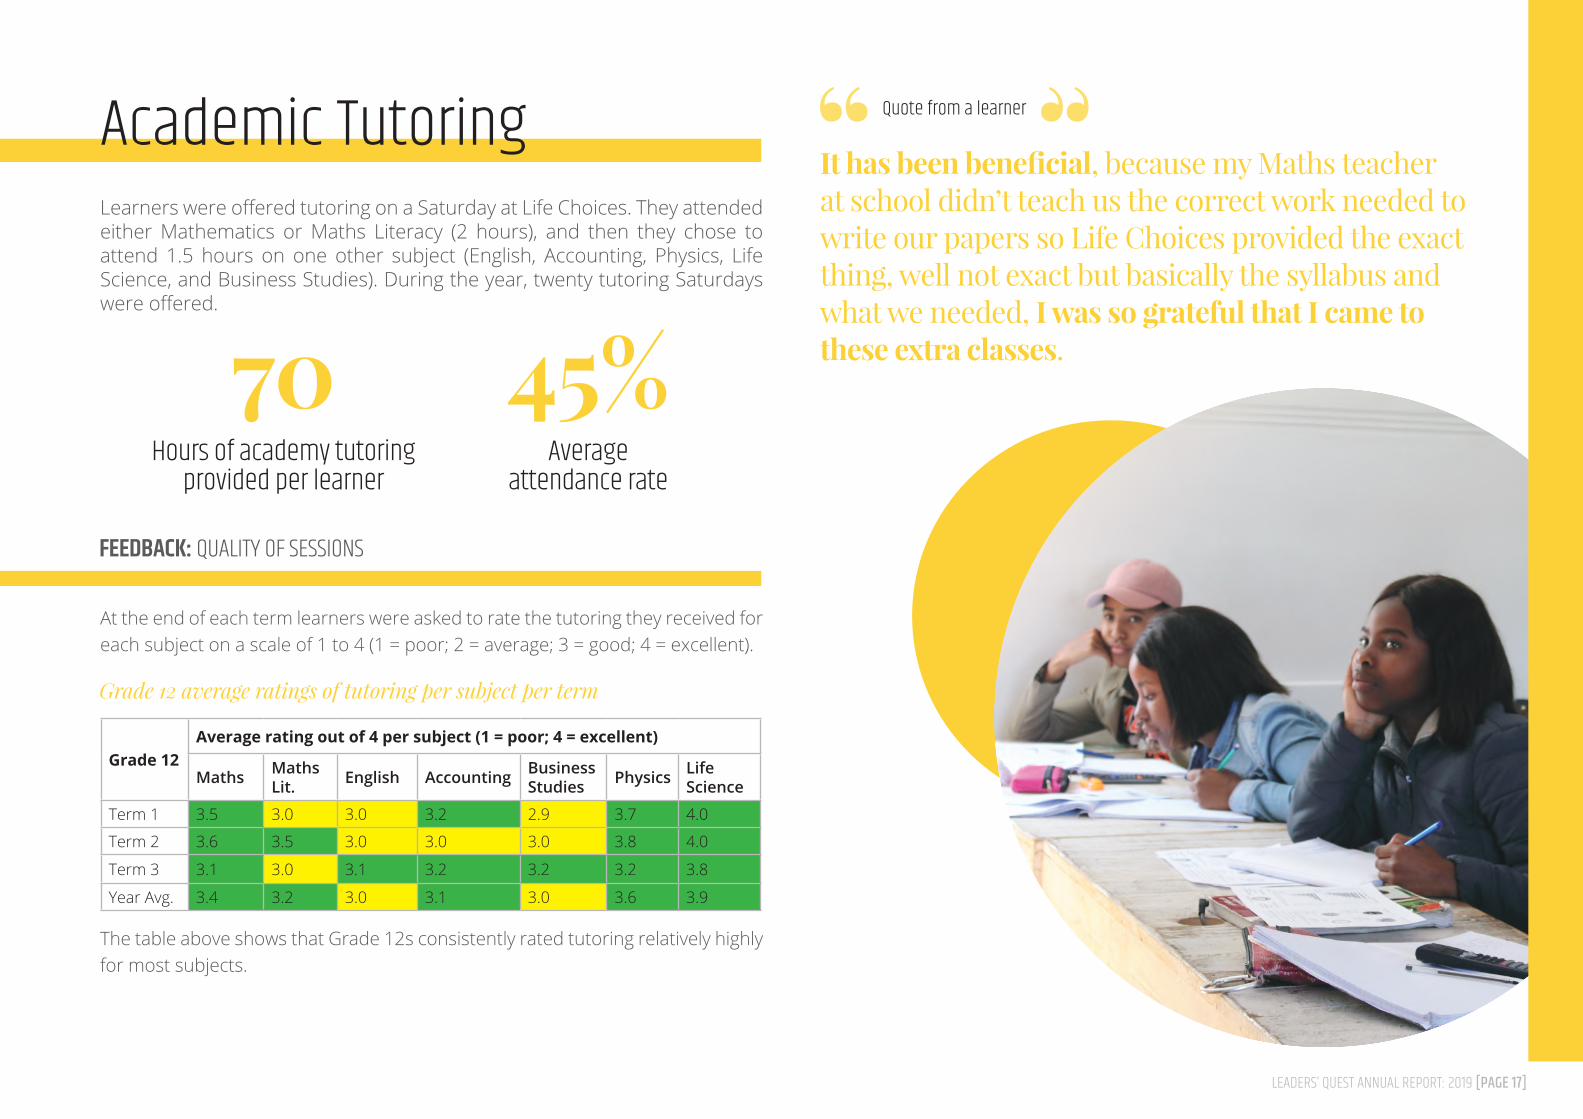
Academic TutoringLearners were offered tutoring on a Saturday at Life Choices. They attended either Mathematics or Maths Literacy (2 hours), and then they chose to attend 1.5 hours on one other subject (English, Accounting, Physics, Life Science, and Business Studies). During the year, twenty tutoring Saturdays were offered.
At the end of each term learners were asked to rate the tutoring they received for each subject on a scale of 1 to 4 (1 = poor; 2 = average; 3 = good; 4 = excellent).
The table above shows that Grade 12s consistently rated tutoring relatively highly for most subjects.
FEEDBACK: QUALITY OF SESSIONS
Grade 12 average ratings of tutoring per subject per term
It has been beneficial, because my Maths teacher at school didn’t teach us the correct work needed to write our papers so Life Choices provided the exact thing, well not exact but basically the syllabus and what we needed, I was so grateful that I came to these extra classes.
Quote from a learner
Grade 12Average rating out of 4 per subject (1 = poor; 4 = excellent)
Maths Maths Lit. English Accounting Business
Studies Physics Life Science
Term 1 3.5 3.0 3.0 3.2 2.9 3.7 4.0
Term 2 3.6 3.5 3.0 3.0 3.0 3.8 4.0
Term 3 3.1 3.0 3.1 3.2 3.2 3.2 3.8
Year Avg. 3.4 3.2 3.0 3.1 3.0 3.6 3.9
Hours of academy tutoring provided per learner
Average attendance rate
70 45%
LEADERS’ QUEST ANNUAL REPORT: 2019 [PAGE 18]
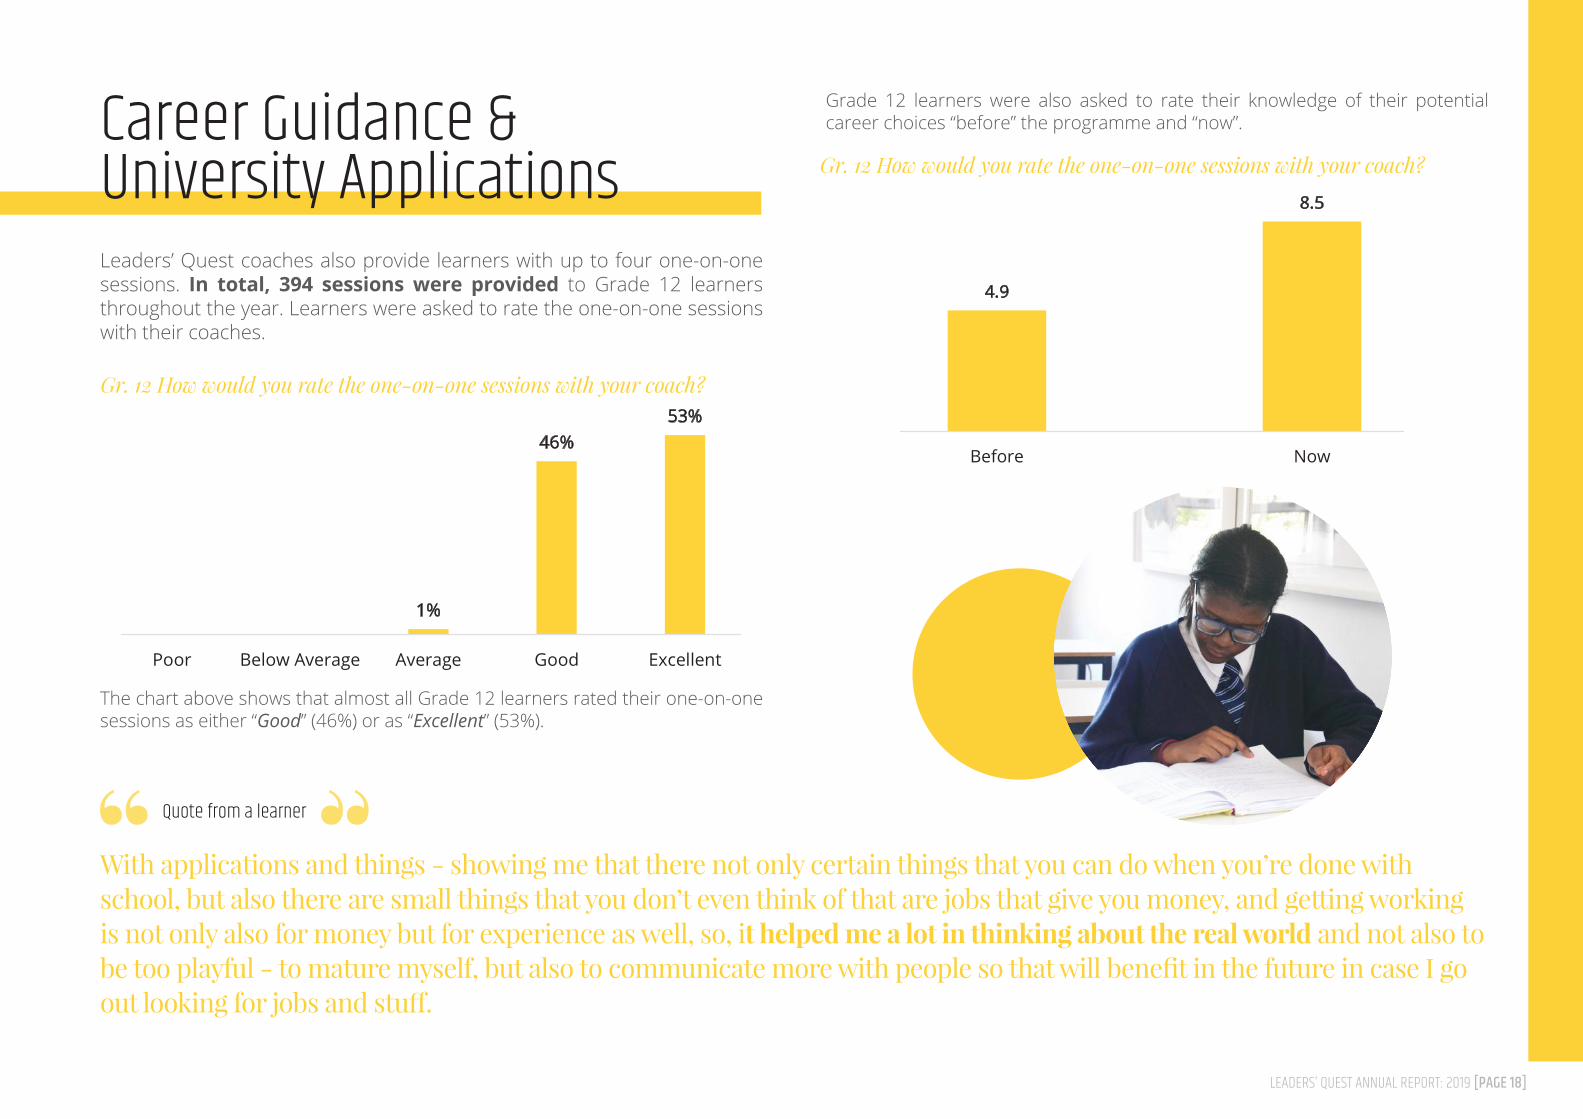
Career Guidance &University ApplicationsLeaders’ Quest coaches also provide learners with up to four one-on-one sessions. In total, 394 sessions were provided to Grade 12 learners throughout the year. Learners were asked to rate the one-on-one sessions with their coaches.
The chart above shows that almost all Grade 12 learners rated their one-on-one sessions as either “Good” (46%) or as “Excellent” (53%).
Grade 12 learners were also asked to rate their knowledge of their potential career choices “before” the programme and “now”.
Gr. 12 How would you rate the one-on-one sessions with your coach?
Gr. 12 How would you rate the one-on-one sessions with your coach?
With applications and things - showing me that there not only certain things that you can do when you’re done with school, but also there are small things that you don’t even think of that are jobs that give you money, and getting working is not only also for money but for experience as well, so, it helped me a lot in thinking about the real world and not also to be too playful - to mature myself, but also to communicate more with people so that will benefit in the future in case I go out looking for jobs and stuff.
Quote from a learner
1%
46%53%
Poor Below Average Average Good Excellent
Gr.12 How Would You Rate the One-on-One Sessions with Your Coach?
4.9
8.5
Before Now
Gr.12 Change in Knowledge of Potential Career Choices
LEADERS’ QUEST ANNUAL REPORT: 2019 [PAGE 19]
Alumni
LEADERS’ QUEST ANNUAL REPORT: 2019 [PAGE 20]
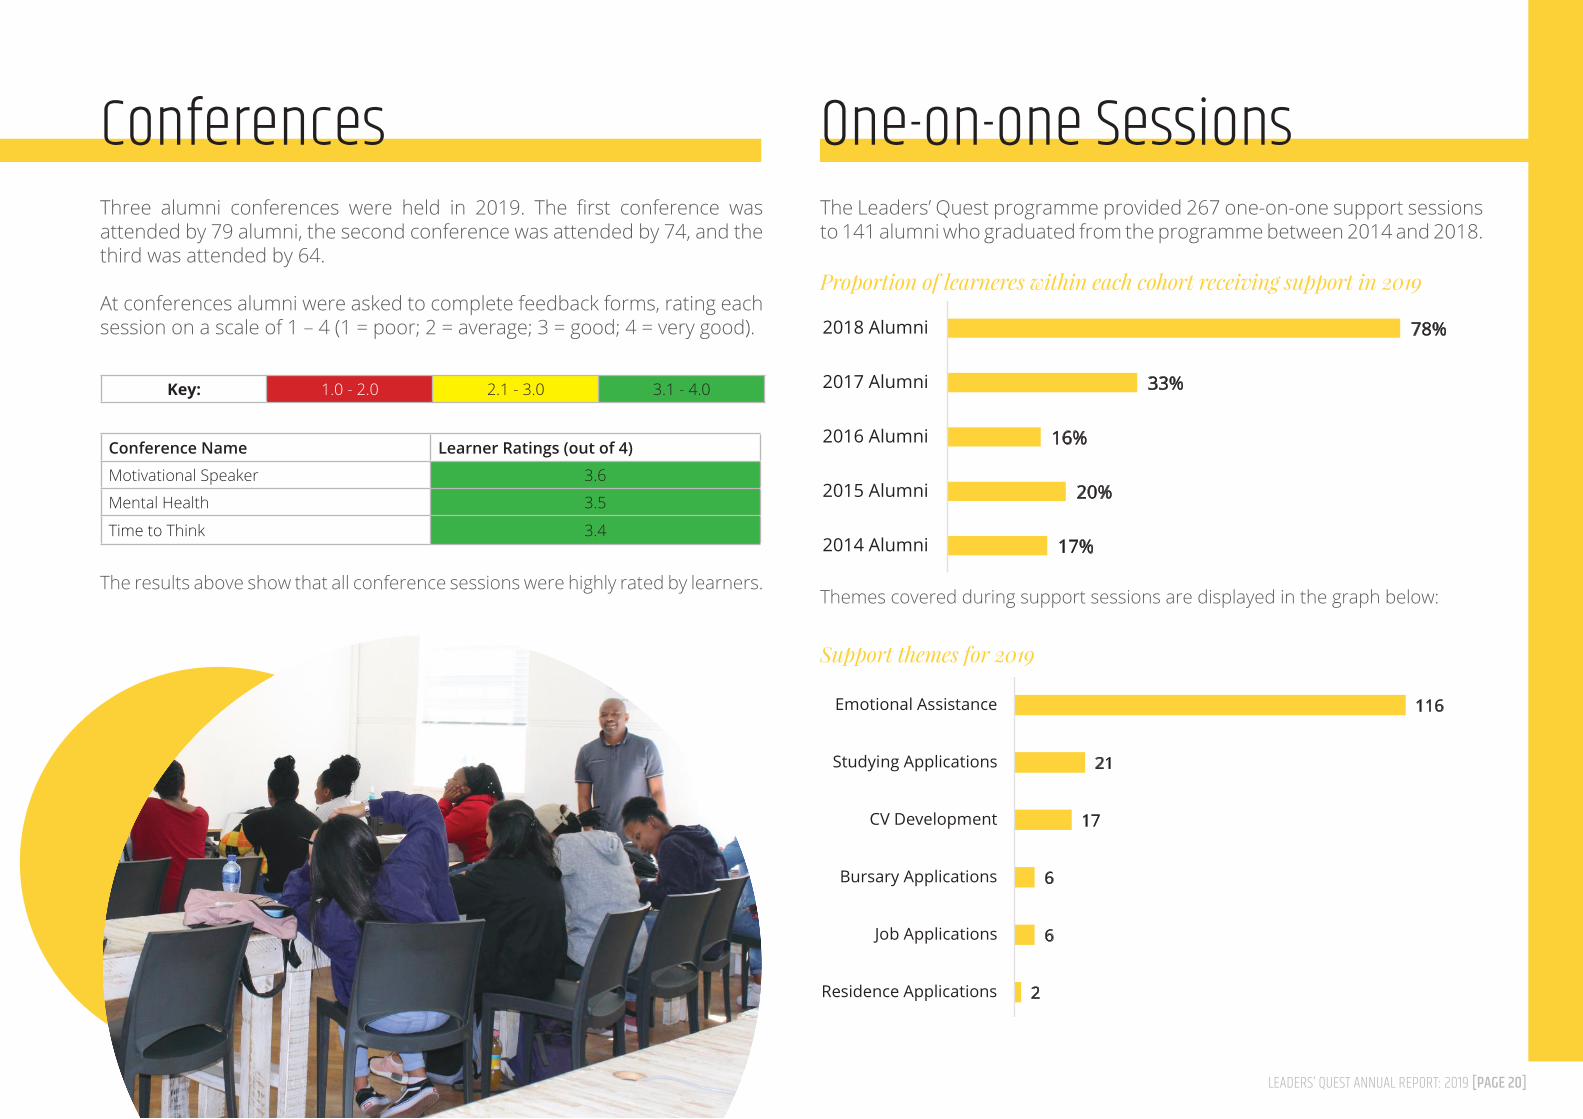
Conferences One-on-one SessionsThree alumni conferences were held in 2019. The first conference was attended by 79 alumni, the second conference was attended by 74, and the third was attended by 64.
At conferences alumni were asked to complete feedback forms, rating each session on a scale of 1 – 4 (1 = poor; 2 = average; 3 = good; 4 = very good).
The Leaders’ Quest programme provided 267 one-on-one support sessions to 141 alumni who graduated from the programme between 2014 and 2018.
The results above show that all conference sessions were highly rated by learners.Themes covered during support sessions are displayed in the graph below:
Conference Name Learner Ratings (out of 4)
Motivational Speaker 3.6
Mental Health 3.5
Time to Think 3.4
Key: 1.0 - 2.0 2.1 - 3.0 3.1 - 4.0
17%
20%
16%
33%
78%
2014 Alumni
2015 Alumni
2016 Alumni
2017 Alumni
2018 Alumni
Proportion of learners within each cohort receiving support in 2019 (%)
116
21
17
6
6
2
Emotional Assistance
Studying Applications
CV Development
Bursary Applications
Job Applications
Residence Applications
Support themes for 2019
Proportion of learneres within each cohort receiving support in 2019
Support themes for 2019
LEADERS’ QUEST ANNUAL REPORT: 2019 [PAGE 21]
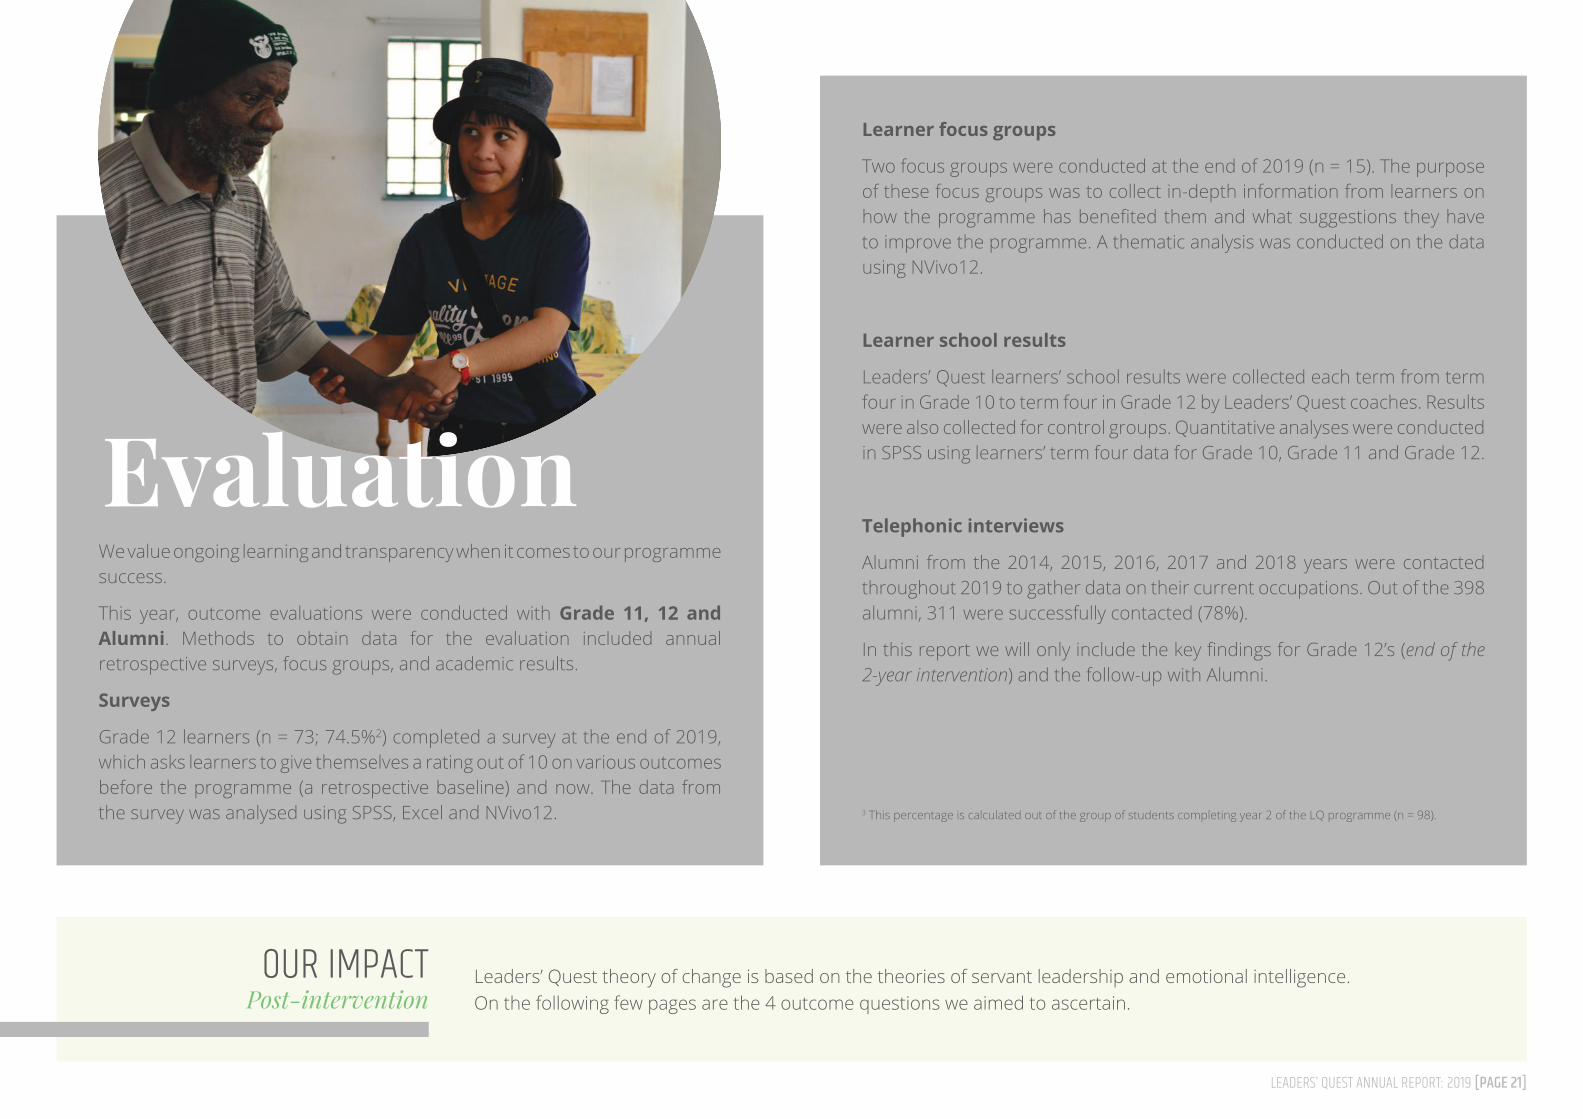
EvaluationWe value ongoing learning and transparency when it comes to our programme success.
This year, outcome evaluations were conducted with Grade 11, 12 and Alumni. Methods to obtain data for the evaluation included annual retrospective surveys, focus groups, and academic results.
Surveys
Grade 12 learners (n = 73; 74.5%2) completed a survey at the end of 2019, which asks learners to give themselves a rating out of 10 on various outcomes before the programme (a retrospective baseline) and now. The data from the survey was analysed using SPSS, Excel and NVivo12.
Learner focus groups
Two focus groups were conducted at the end of 2019 (n = 15). The purpose of these focus groups was to collect in-depth information from learners on how the programme has benefited them and what suggestions they have to improve the programme. A thematic analysis was conducted on the data using NVivo12.
Learner school results
Leaders’ Quest learners’ school results were collected each term from term four in Grade 10 to term four in Grade 12 by Leaders’ Quest coaches. Results were also collected for control groups. Quantitative analyses were conducted in SPSS using learners’ term four data for Grade 10, Grade 11 and Grade 12.
Telephonic interviews
Alumni from the 2014, 2015, 2016, 2017 and 2018 years were contacted throughout 2019 to gather data on their current occupations. Out of the 398 alumni, 311 were successfully contacted (78%).
In this report we will only include the key findings for Grade 12’s (end of the 2-year intervention) and the follow-up with Alumni.
Leaders’ Quest theory of change is based on the theories of servant leadership and emotional intelligence. On the following few pages are the 4 outcome questions we aimed to ascertain.
OUR IMPACTPost-intervention
3 This percentage is calculated out of the group of students completing year 2 of the LQ programme (n = 98).
LEADERS’ QUEST ANNUAL REPORT: 2019 [PAGE 22]
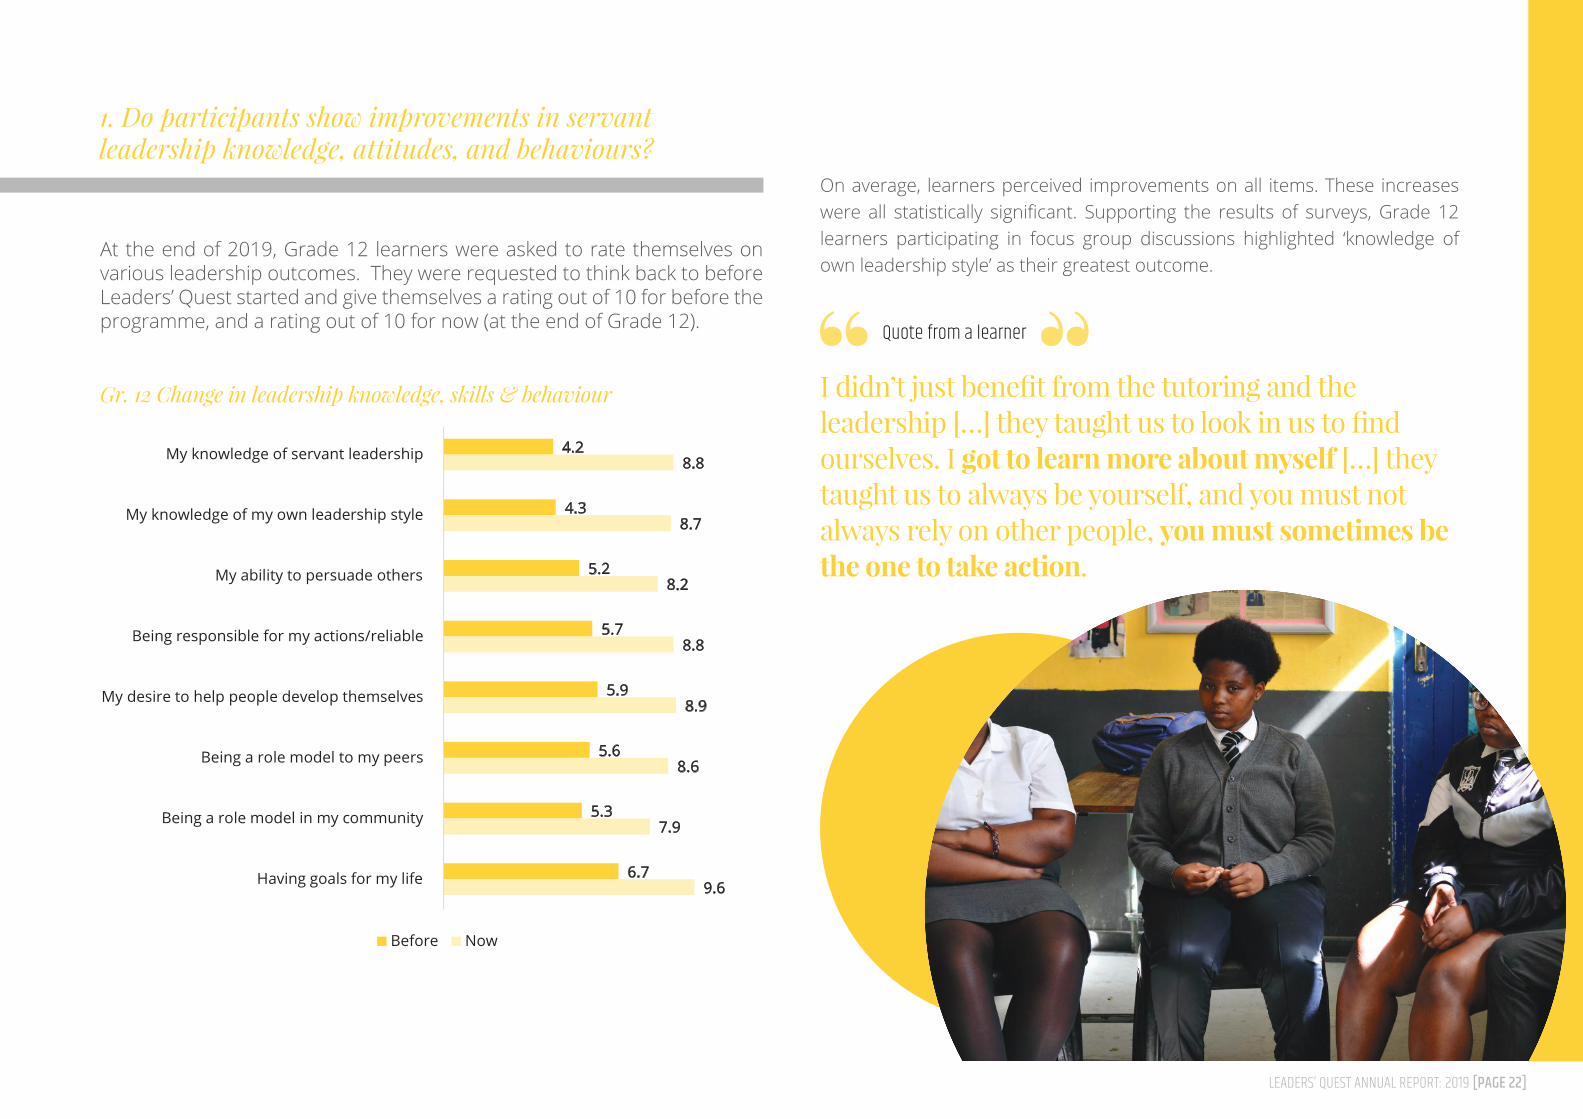
At the end of 2019, Grade 12 learners were asked to rate themselves on various leadership outcomes. They were requested to think back to before Leaders’ Quest started and give themselves a rating out of 10 for before the programme, and a rating out of 10 for now (at the end of Grade 12).
On average, learners perceived improvements on all items. These increases were all statistically significant. Supporting the results of surveys, Grade 12 learners participating in focus group discussions highlighted ‘knowledge of own leadership style’ as their greatest outcome.
Gr. 12 Change in leadership knowledge, skills & behaviour I didn’t just benefit from the tutoring and the leadership […] they taught us to look in us to find ourselves. I got to learn more about myself […] they taught us to always be yourself, and you must not always rely on other people, you must sometimes be the one to take action.
Quote from a learner
1. Do participants show improvements in servant leadership knowledge, attitudes, and behaviours?
4.2
4.3
5.2
5.7
5.9
5.6
5.3
6.7
8.8
8.7
8.2
8.8
8.9
8.6
7.9
9.6
My knowledge of servant leadership
My knowledge of my own leadership style
My ability to persuade others
Being responsible for my actions/reliable
My desire to help people develop themselves
Being a role model to my peers
Being a role model in my community
Having goals for my life
Gr.12 Change in Leadership Knowledge, Skills & Behaviour
Before Now
LEADERS’ QUEST ANNUAL REPORT: 2019 [PAGE 23]
When presenting the emotional intelligence outcomes, the results are divided into three subsections; intrapersonal outcomes, interpersonal outcomes, and resilience.
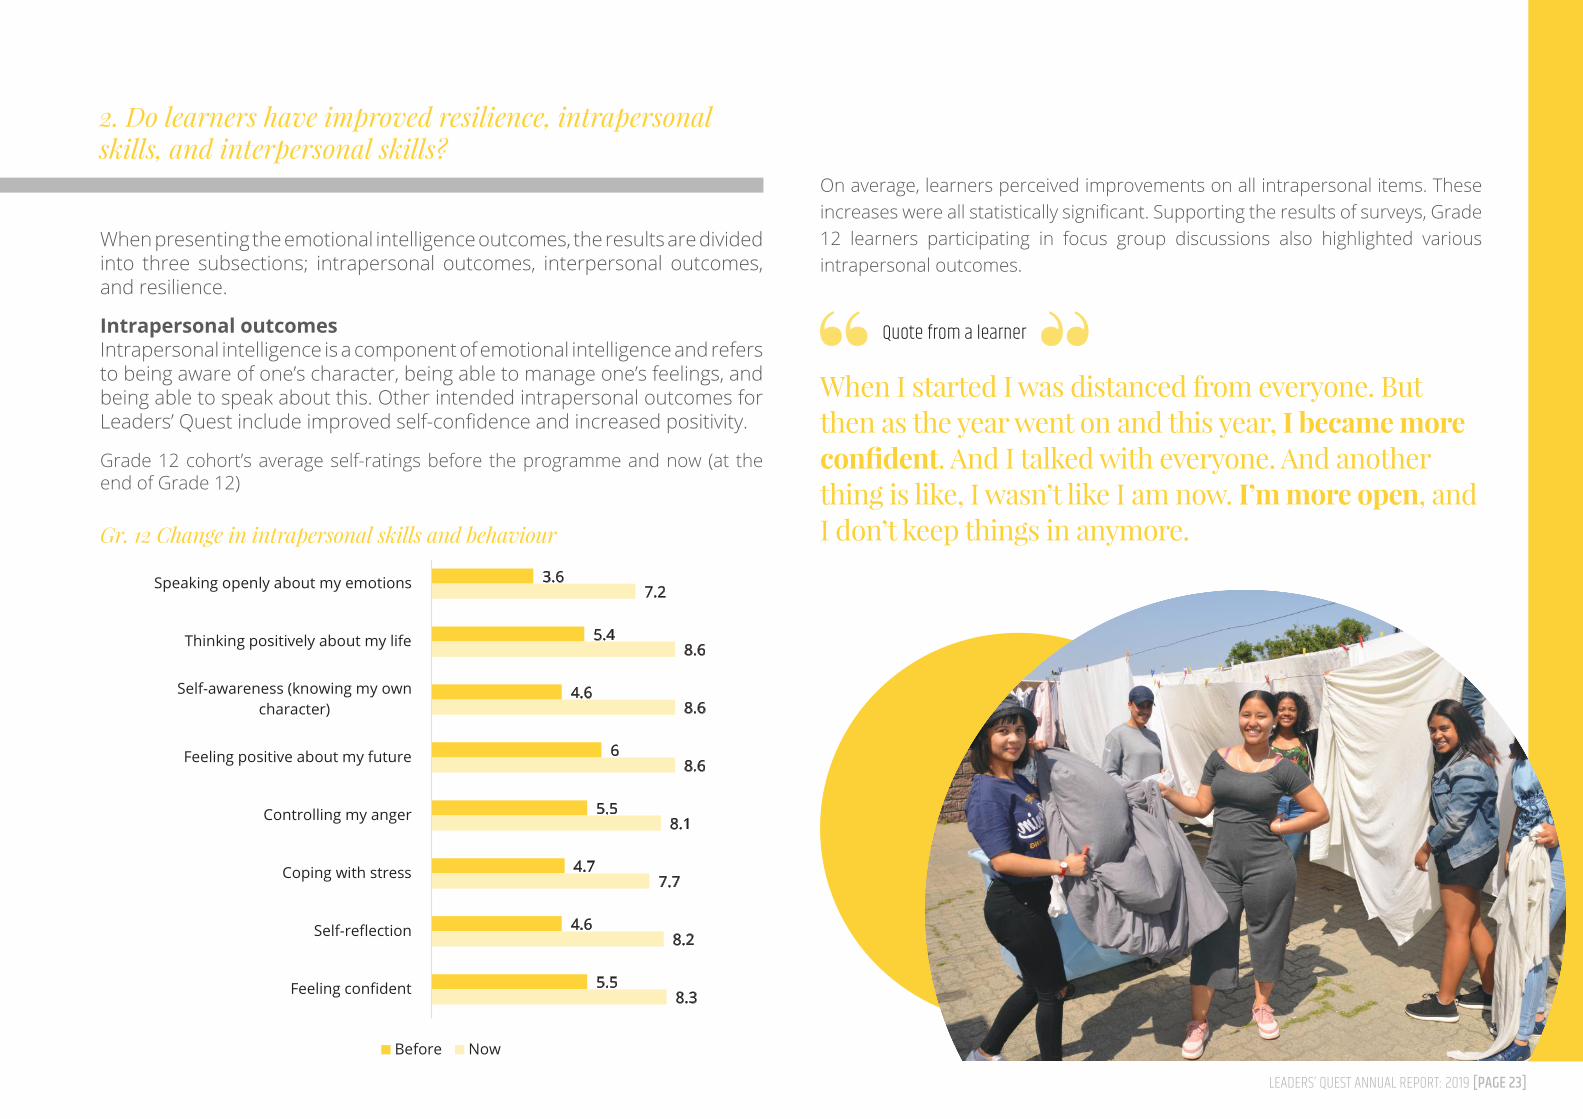
Intrapersonal outcomesIntrapersonal intelligence is a component of emotional intelligence and refers to being aware of one’s character, being able to manage one’s feelings, and being able to speak about this. Other intended intrapersonal outcomes for Leaders’ Quest include improved self-confidence and increased positivity.
Grade 12 cohort’s average self-ratings before the programme and now (at the end of Grade 12)
On average, learners perceived improvements on all intrapersonal items. These increases were all statistically significant. Supporting the results of surveys, Grade 12 learners participating in focus group discussions also highlighted various intrapersonal outcomes.
Gr. 12 Change in intrapersonal skills and behaviour
When I started I was distanced from everyone. But then as the year went on and this year, I became more confident. And I talked with everyone. And another thing is like, I wasn’t like I am now. I’m more open, and I don’t keep things in anymore.
Quote from a learner
2. Do learners have improved resilience, intrapersonal skills, and interpersonal skills?
3.6
5.4
4.6
6
5.5
4.7
4.6
5.5
7.2
8.6
8.6
8.6
8.1
7.7
8.2
8.3
Speaking openly about my emotions
Thinking positively about my life
Self-awareness (knowing my owncharacter)
Feeling positive about my future
Controlling my anger
Coping with stress
Self-reflection
Feeling confident
Gr.12 Change in Intrapersonal Skills and Behaviour
Before Now
LEADERS’ QUEST ANNUAL REPORT: 2019 [PAGE 24]
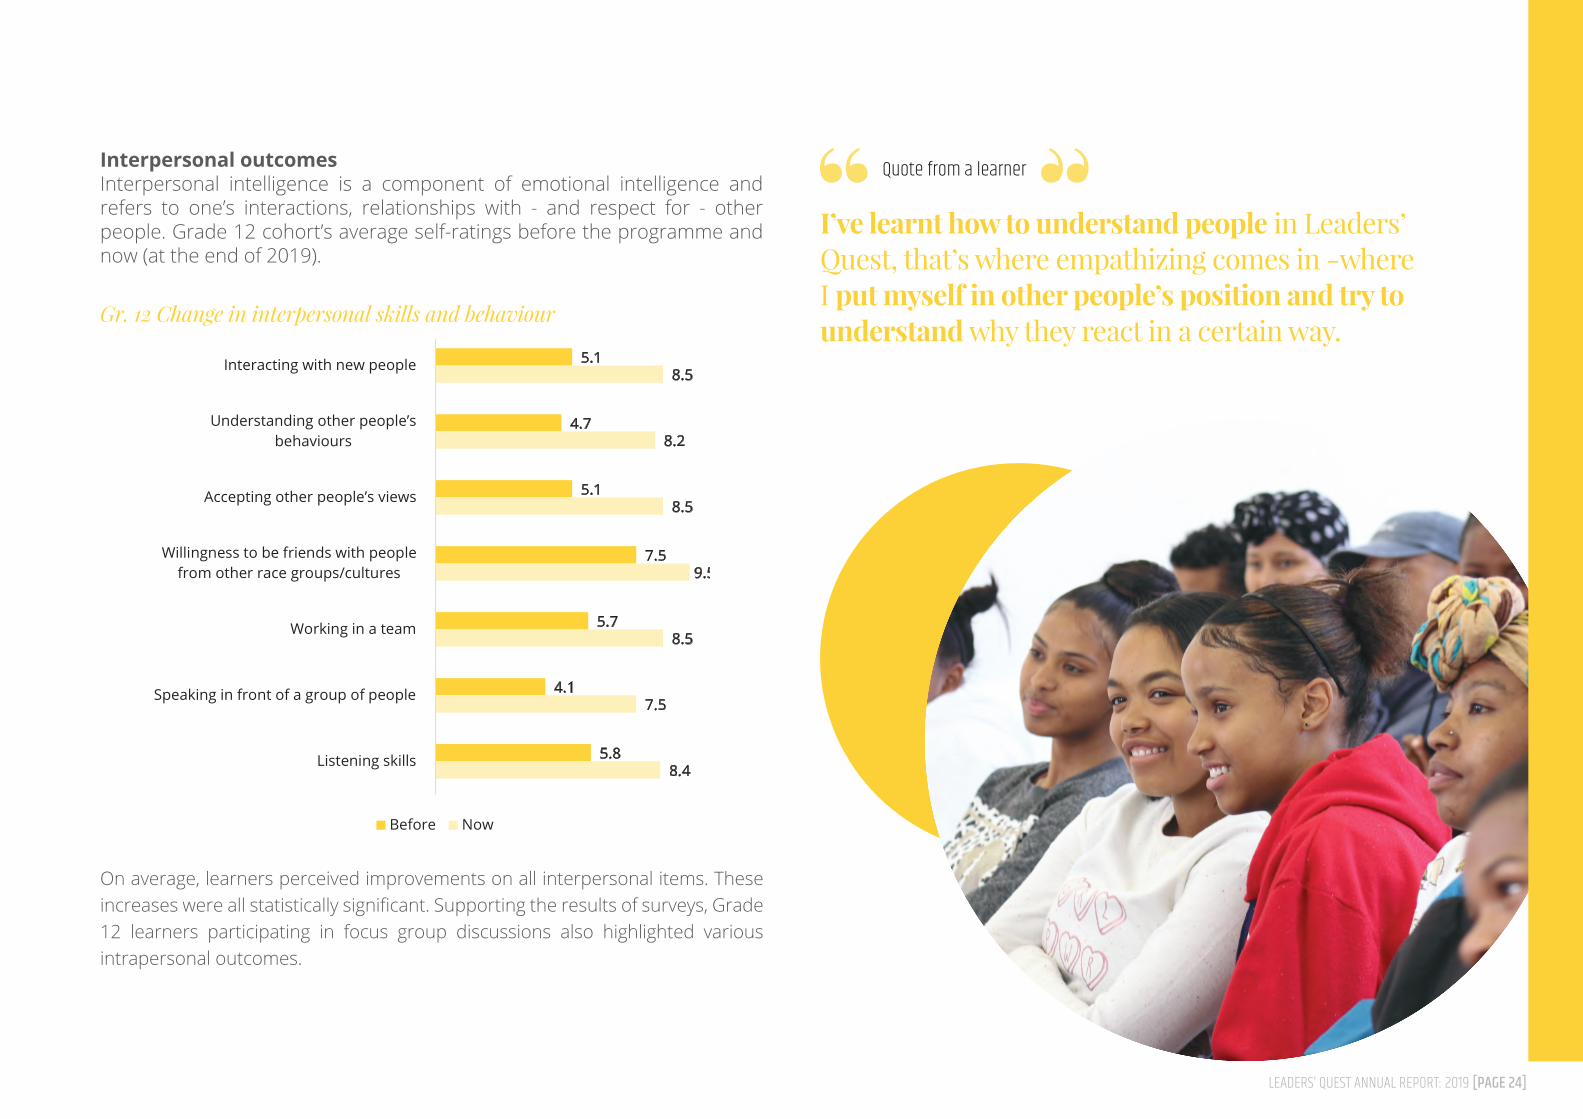
Interpersonal outcomesInterpersonal intelligence is a component of emotional intelligence and refers to one’s interactions, relationships with - and respect for - other people. Grade 12 cohort’s average self-ratings before the programme and now (at the end of 2019).
On average, learners perceived improvements on all interpersonal items. These increases were all statistically significant. Supporting the results of surveys, Grade 12 learners participating in focus group discussions also highlighted various intrapersonal outcomes.
Gr. 12 Change in interpersonal skills and behaviour
I’ve learnt how to understand people in Leaders’ Quest, that’s where empathizing comes in -where I put myself in other people’s position and try to understand why they react in a certain way.
Quote from a learner
5.1
4.7
5.1
7.5
5.7
4.1
5.8
8.5
8.2
8.5
9.5
8.5
7.5
8.4
Interacting with new people
Understanding other people’s behaviours
Accepting other people’s views
Willingness to be friends with peoplefrom other race groups/cultures
Working in a team
Speaking in front of a group of people
Listening skills
Gr.12 Change in Interpersonal Skills and Behaviour
Before Now
LEADERS’ QUEST ANNUAL REPORT: 2019 [PAGE 25]
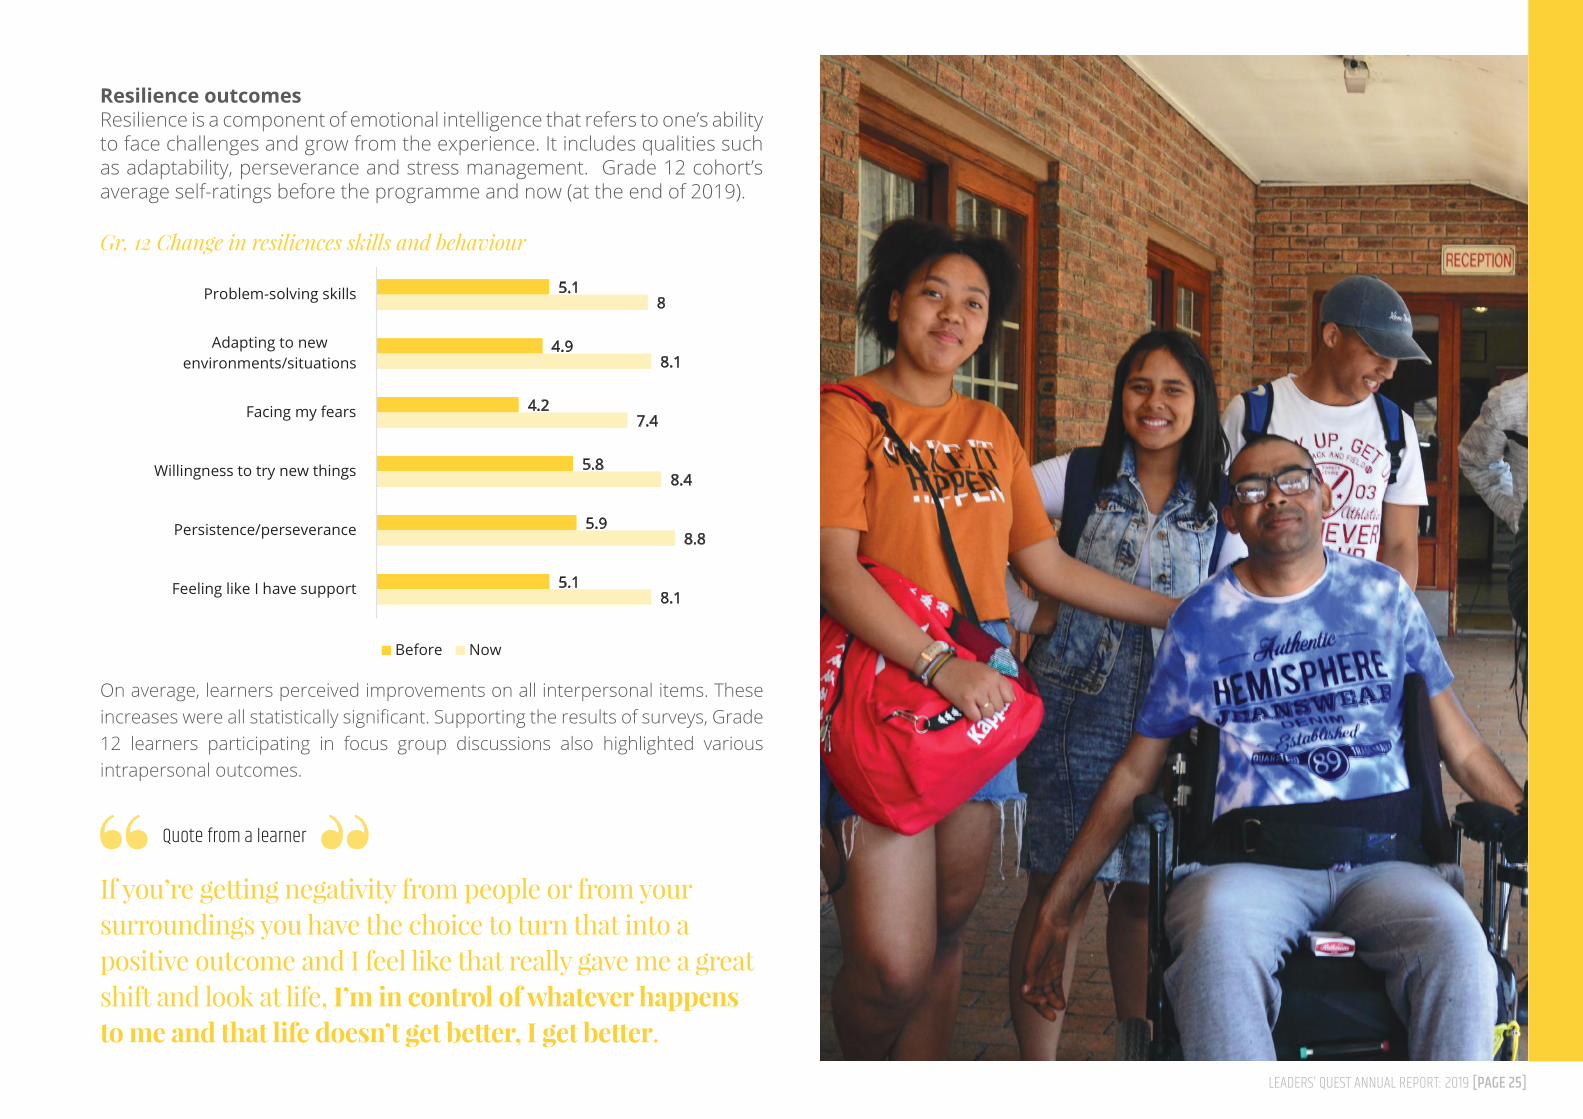
Resilience outcomesResilience is a component of emotional intelligence that refers to one’s ability to face challenges and grow from the experience. It includes qualities such as adaptability, perseverance and stress management. Grade 12 cohort’s average self-ratings before the programme and now (at the end of 2019).
On average, learners perceived improvements on all interpersonal items. These increases were all statistically significant. Supporting the results of surveys, Grade 12 learners participating in focus group discussions also highlighted various intrapersonal outcomes.
Gr. 12 Change in resiliences skills and behaviour
If you’re getting negativity from people or from your surroundings you have the choice to turn that into a positive outcome and I feel like that really gave me a great shift and look at life, I’m in control of whatever happens to me and that life doesn’t get better, I get better.
Quote from a learner
5.1
4.9
4.2
5.8
5.9
5.1
8
8.1
7.4
8.4
8.8
8.1
Problem-solving skills
Adapting to newenvironments/situations
Facing my fears
Willingness to try new things
Persistence/perseverance
Feeling like I have support
Gr.12 Change in Resilience Skills and Behaviour
Before Now

LEADERS’ QUEST ANNUAL REPORT: 2019 [PAGE 26]
The proportion of Leaders’ Quest learners passing matric and obtaining bachelors’ passes are presented below. The pass rates and bachelor pass rates are also presented for the control group, Leaders’ Quest schools (the schools from which the learners are selected), and the Western Cape Province.
Throughout 2019 alumni from 2014, 2015, 2016, 2017 and 2018 were contacted telephonically to determine what their current occupations are. Occupation information was obtained for 311 alumni out of 398 (78%) The results for information obtained are presented below:
The graphs above show that Leaders’ Quest learners were more likely than their peers at their school or youth in the province to pass Matric. The graphs also show that Leaders’ Quest participants were more likely to obtain a bachelors pass than the control group, their peers at their schools and overall youth in the province. 24.7% Leaders’ Quest learners received diploma pass meaning that 84% of Leaders’ Quest learners qualified to study further or at college or university.
As shown in the chart above, the majority of Leaders’ Quest Alumni (93.9%) who were contacted are in education, employment or training, 1% are on a gap year and only 5.1% are not employed, in education or training (NEET). This is substantially lower than the NEET figure from the last census for communities in which learners live.
Matric pass rate 2019 Alumni occupations in 2019Bachelor pass rate 2019
3. Do Leaders’ Quest participants perform better academically?
4. Do Leaders’ Quest Alumni perform better than other youth in their communities?
93%
89%
80%82%
Leaders' Quest Control LQ Schools Province
Matric Pass Rate 2019
59%55%
34%
44%
Leaders' Quest Control LQ Schools Province
Bachelor Pass Rate 2019
65.0%
21.5%
5.5%
4.5%
1.0%
1.9%
Studying (Student)
Working
Rewriting Individual Subjects
Unemployed
Gap Year
Internship
Alumni occupations in 2019
5.1%
37%
LQ Western Cape
Leaders' Quest alumni not in education, employment or training (NEET) compared to Western Cape youth
5.1%
37%
LQ Western Cape
Leaders' Quest alumni not in education, employment or training (NEET) compared to Western Cape youth
LEADERS’ QUEST ANNUAL REPORT: 2019 [PAGE 27]
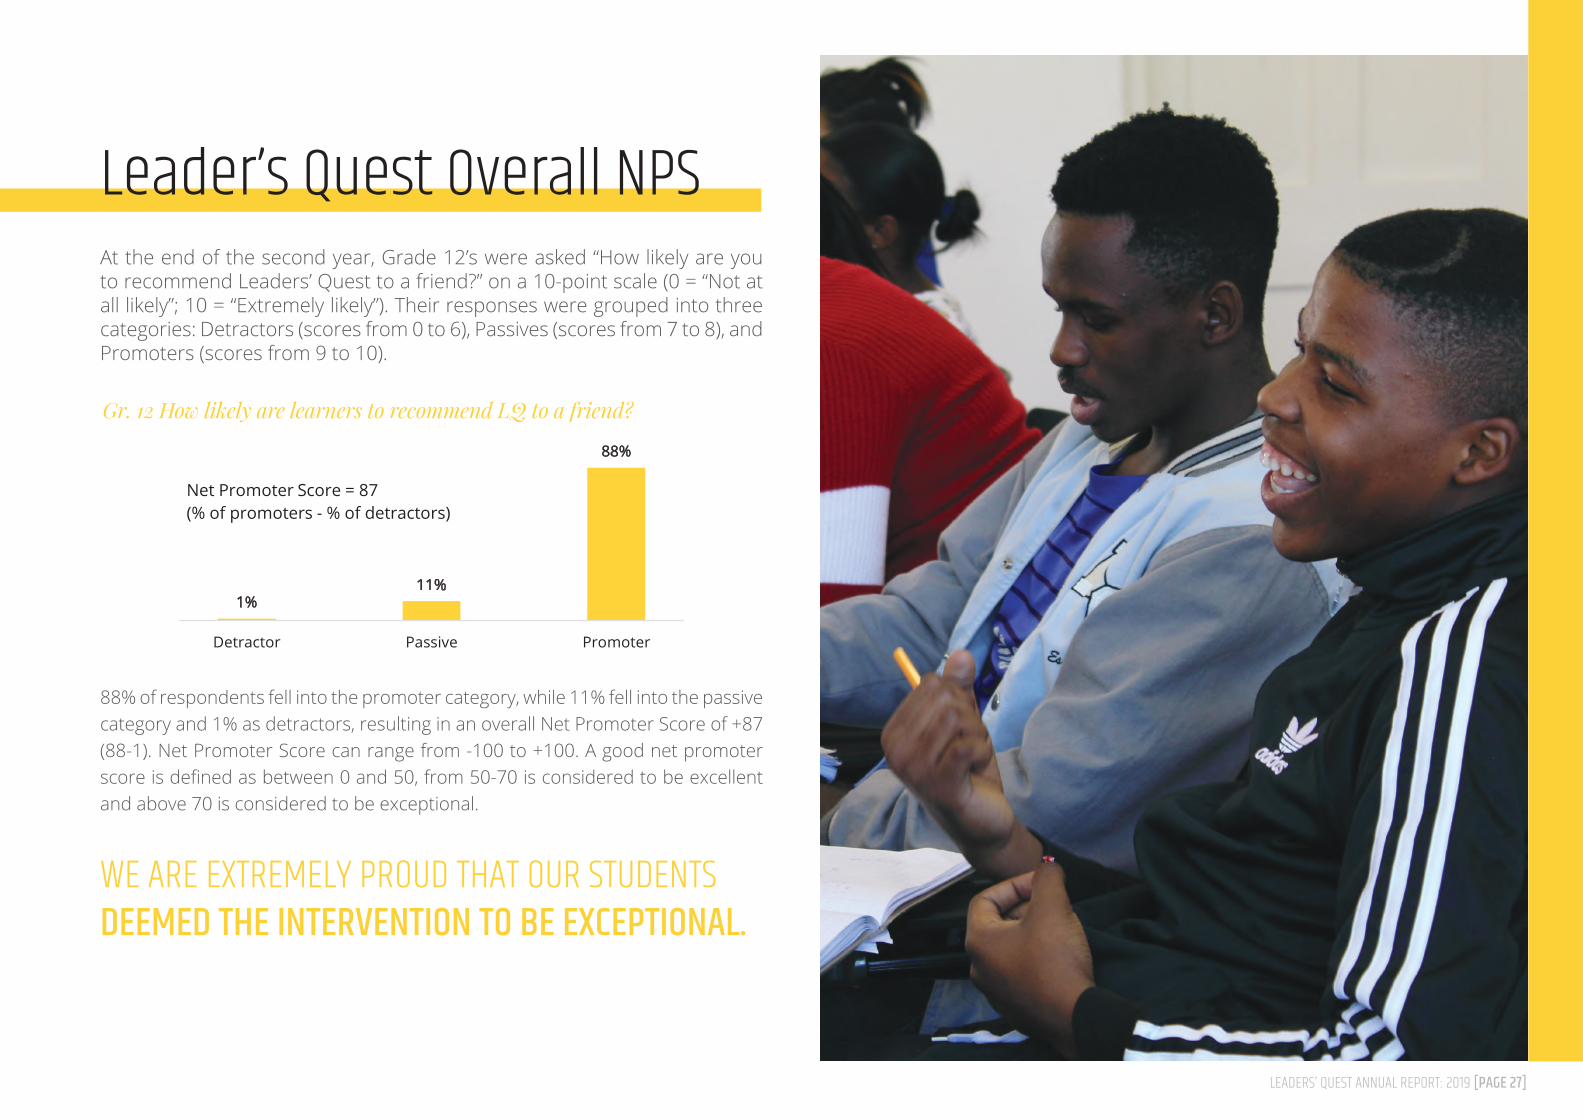
Leader’s Quest Overall NPS
WE ARE EXTREMELY PROUD THAT OUR STUDENTS DEEMED THE INTERVENTION TO BE EXCEPTIONAL.
At the end of the second year, Grade 12’s were asked “How likely are you to recommend Leaders’ Quest to a friend?” on a 10-point scale (0 = “Not at all likely”; 10 = “Extremely likely”). Their responses were grouped into three categories: Detractors (scores from 0 to 6), Passives (scores from 7 to 8), and Promoters (scores from 9 to 10).
88% of respondents fell into the promoter category, while 11% fell into the passive category and 1% as detractors, resulting in an overall Net Promoter Score of +87 (88-1). Net Promoter Score can range from -100 to +100. A good net promoter score is defined as between 0 and 50, from 50-70 is considered to be excellent and above 70 is considered to be exceptional.
Gr. 12 How likely are learners to recommend LQ to a friend?
1%11%
88%
Detractor Passive Promoter
Gr.12 How Likely Are Learners to Recommend LQ to a Friend?(0 = Not at all; 10 = Extremely likely)
Net Promoter Score = 87(% of promoters - % of detractors)
LEADERS’ QUEST ANNUAL REPORT: 2019 [PAGE 28]
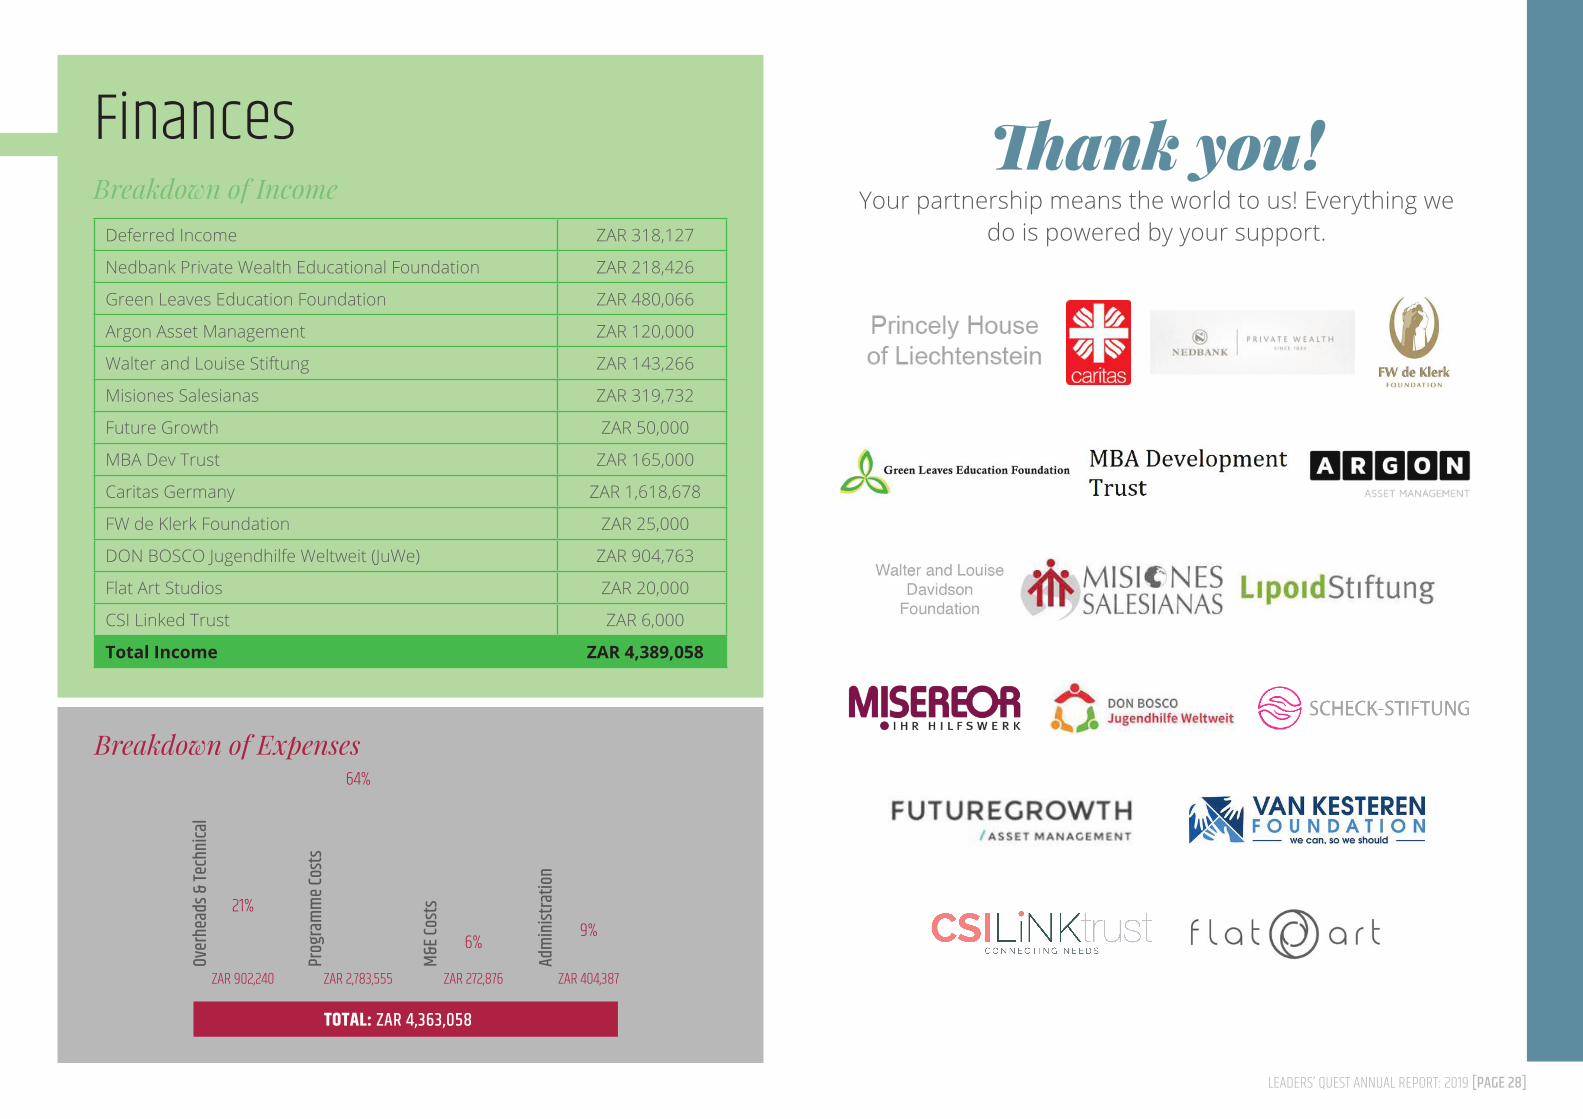
FinancesBreakdown of Income
Deferred Income ZAR 318,127
Nedbank Private Wealth Educational Foundation ZAR 218,426
Green Leaves Education Foundation ZAR 480,066
Argon Asset Management ZAR 120,000
Walter and Louise Stiftung ZAR 143,266
Misiones Salesianas ZAR 319,732
Future Growth ZAR 50,000
MBA Dev Trust ZAR 165,000
Caritas Germany ZAR 1,618,678
FW de Klerk Foundation ZAR 25,000
DON BOSCO Jugendhilfe Weltweit (JuWe) ZAR 904,763
Flat Art Studios ZAR 20,000
CSI Linked Trust ZAR 6,000
Total Income ZAR 4,389,058
Thank you!Your partnership means the world to us! Everything we
do is powered by your support.
Breakdown of Expenses
Over
head
s & Te
chnic
al
Prog
ram
me C
osts
TOTAL: ZAR 4,363,058
M&E C
osts
Adm
inistr
ation
21%
ZAR 902,240 ZAR 2,783,555 ZAR 272,876 ZAR 404,387
64%
6%9%
LEADERS’ QUEST ANNUAL REPORT: 2019 [PAGE 29]
- NELSON MANDELA
Education is the most powerful weapon which you can use to change the world.
lifechoices.co.za | facebook.com/SalesianLifeChoices