Embed Size (px)
Citation preview

2018 INTEGRATED TRANSMISSION PLANNING NEAR-TERM ASSESSMENT
July 31, 2018
ENGINEERING

Southwest Power Pool, Inc.
REVISION HISTORY
DATE AUTHOR CHANGE DESCRIPTION COMMENTS
6/21/2018 SPP staff Initial Draft
6/28/2018 SPP staff Incorporated member feedback TWG Approval
7/13/2018 SPP staff Incorporated additional NTC withdrawals in Section 6.2
Posted in Additional MOPC Background Materials
7/17/2018 SPP staff No changes MOPC Approval of Recommendation
7/18/2018 SPP staff Updated report cover Based on feedback from Communications
7/31/2018 SPP staff No changes SPP Board of Directors Approval
Southwest Power Pool, Inc.
CONTENTS
Revision History ......................................................................................................................................................................... i
Section 1: Executive Summary ........................................................................................................................................... 2
1.1: The ITPNT Process ............................................................................................................................. 2
1.2: The 2018 ITPNT ................................................................................................................................. 3
Section 2: Introduction ......................................................................................................................................................... 8
2.1: The ITP Near-Term ............................................................................................................................ 8
Goals ..................................................................................................................................................... 8
2.2: How to Read This Report .................................................................................................................. 9
SPP Footprint ........................................................................................................................................ 9
Supporting Documents ......................................................................................................................... 9
Confidentiality and Open Access .......................................................................................................... 9
Section 3: Stakeholder Collaboration ........................................................................................................................... 10
3.1: Planning Summits ............................................................................................................................ 10
Project Cost Overview ......................................................................................................................... 10
Section 4: Study Drivers .................................................................................................................................................... 12
4.1: Introduction .................................................................................................................................... 12
4.2: Model Development ....................................................................................................................... 12
Scenario 0 (S0) .................................................................................................................................... 12
Scenario 5 (S5) .................................................................................................................................... 12
Balancing Authority (BA) ..................................................................................................................... 12
Base Reliability (BR) ............................................................................................................................ 12
4.3: Load Outlook ................................................................................................................................... 13
Load Forecast ...................................................................................................................................... 13
Load Forecast Trends .......................................................................................................................... 13
4.4: Generation ...................................................................................................................................... 14
Section 5: Analysis ............................................................................................................................................................... 17
5.1: Steady-State Analysis ...................................................................................................................... 17
Project Screening ................................................................................................................................ 18
Project Selection ................................................................................................................................. 19
Project Staging .................................................................................................................................... 20

Southwest Power Pool, Inc.
5.2: Additional Analysis .......................................................................................................................... 20
Analysis of S5 Summer Needs ............................................................................................................. 21
Analysis of Scenario BA-only Needs .................................................................................................... 25
Analysis of Short-Term Needs ............................................................................................................. 26
Analysis of Transmission Operation Guides (TOGs) ............................................................................ 26
Analysis of Brookline High-voltage operational need ......................................................................... 29
Section 6: Project Summary ............................................................................................................................................. 30
6.1 Project Development Summary ........................................................................................................ 30
6.2: NTC Re-evaluation Results Summary .............................................................................................. 31
Blanchard 69-kV Capacitor Bank ......................................................................................................... 32
Ringwood 69-kV Capacitor Bank ......................................................................................................... 32
Dean Interchange 230/115-kV Station and Transformer ................................................................... 32
Jeffrey – Hoyt 345-kV Rebuild ............................................................................................................. 32
Welsh Reserve – Wilkes 138-kV Rebuild and Chapel Hill REC – Welsh Reserve 138-kV Rebuild ....... 32
6.3: Project Plan Breakdown .................................................................................................................. 33
6.4: Rate Impacts on Transmission Customers ...................................................................................... 37
Section 7: Project Descriptions ....................................................................................................................................... 41
7.1: Final Project Portfolio ...................................................................................................................... 41
New Lakeview 69-kV Substation and Capacitor Bank ......................................................................... 41
Reconductor Richland – Lewis 115-kV ................................................................................................ 42
Replace the Lawrence Hill 230/115-kV Transformer .......................................................................... 43
New Blue Valley – Crosstown 161-kV Line .......................................................................................... 45
Replace Terminal Equipment on Olathe – Switzer 161-kV and Brookridge – Overland Park 161-kV 47
New Brookline 345-kV Reactor ........................................................................................................... 48
Rebuild Nixa Downtown – Nixa Espy 69-kV ........................................................................................ 49
Rebuild Figure Five – VBI North 69-kV ................................................................................................ 51
New McDowell 230-kV Substation and Transformer ......................................................................... 52
Replace Terminal Equipment on Carlisle – Murphy 115-kV ............................................................... 53
Replace Terminal Equipment on Clauene – Terry County 115-kV ...................................................... 54
Replace the Sundown 230/115-kV Transformer ................................................................................ 55
7.2 South-Central Oklahoma Low Voltages ............................................................................................ 56
7.3 Final Reliability Assessment .............................................................................................................. 56
Section 8: 2018 ITPNT Project List ............................................................................................................................... 57

Southwest Power Pool, Inc.
FIGURES
Figure 1: 2018 ITPNT Voltage Needs and Solutions. ................................................................................................ 6 Figure 2: 2018 ITPNT Thermal Needs and Solutions ............................................................................................... 7 Figure 3: 2018 ITPNT Load Levels ................................................................................................................................. 13 Figure 4: SPP ITPNT Load Trends .................................................................................................................................. 14 Figure 5: Scenario 0 Generation Summary ................................................................................................................. 15 Figure 6: Scenario 5 Generation Summary ................................................................................................................. 15 Figure 7: Scenario BA Generation Summary .............................................................................................................. 16 Figure 8: Scenario BR Generation Summary .............................................................................................................. 16 Figure 9: 2018 ITPNT Unique Thermal Needs .......................................................................................................... 17 Figure 10: 2018 ITPNT Unique Voltage Needs .......................................................................................................... 18 Figure 11: Project Selection Methodology .................................................................................................................. 20 Figure 12: Scenario 5 Summer Analyses Comparison ........................................................................................... 22 Figure 13: Scenario 5 Summer Needs Overlap .......................................................................................................... 23 Figure 14: 2018 ITPNT Project Breakdown ............................................................................................................... 33 Figure 15: 2018 ITPNT Miles Rebuild/Reconductor by Voltage Class ............................................................ 34 Figure 16: 2018 ITPNT NTC Costs by Voltage Class .............................................................................................. 36 Figure 17: 2018 ITPNT Upgrades by Need Year and Total Dollars ................................................................. 36 Figure 18: 2018 ITPNT Cost Allocation -- Regional v. Zonal .............................................................................. 37 Figure 19: ATRR Cost Allocation Forecast by Zone of the 2018 ITPNT ......................................................... 38 Figure 20: Zonal and Regional ATRR Allocated in SPP ......................................................................................... 39 Figure 21: 2018 ITPNT Net Rate Impacts by Zone .................................................................................................. 40 Figure 22: New Lakeview 69-kV substation. New 14.4 MVAR switched shunt at Lakeview 69 kV ... 41 Figure 23: Reconductor 3 miles of 115-kV line from Richland - Lewis ......................................................... 42 Figure 24: Replace the 230/115-kV transformer at Lawrence Hill ................................................................. 43 Figure 25: Construct a new 5.6-mile, 161-kV line from Blue Valley – Crosstown ..................................... 45 Figure 26: Replace terminal equipment on the 161-kV line from Olathe – Switzer / Replace terminal equipment on the 161-kV line from Brookridge – Overland Park ................................................. 47 Figure 27: New 50 MVAR switched shunt at Brookline 345 kV. Brookline 345-kV Substation expansion .................................................................................................................................................................................. 48 Figure 28: Rebuild 1.25 miles of 69- kV line from Nixa Downtown – Nixa Espy ........................................ 49 Figure 29: Rebuild 4.2 miles of 69-kV line from Figure Five – VBI North..................................................... 51 Figure 30: McDowell 230/115-kV Transformer and Substation...................................................................... 52 Figure 31: Replace terminal equipment on the 115-kV line from Carlisle – Murphy .............................. 53 Figure 32: Replace terminal equipment on the 115-kV line at Clauene ......................................................... 54 Figure 33: Replace the 230/115-kV transformer at Sundown ........................................................................... 55

Southwest Power Pool, Inc.
2018 ITPNT Assessment 1
TABLES
Table 1: 2018 ITPNT Project List Breakdown – New and Rebuilt Line Miles by Voltage Class .............. 3 Table 2: 2018 ITPNT Project List Breakdown – New Transformer by Voltage Class ................................. 4 Table 3: 2018 ITPNT Projects ........................................................................................................................................... 5 Table 4: 2018 ITPNT Projects ......................................................................................................................................... 31 Table 5: NTC Re-evaluation Summary ......................................................................................................................... 31 Table 6: 2018 ITPNT Projects by State ........................................................................................................................ 35 Table 7: 2018 ITPNT Net Investment by State ......................................................................................................... 35 Table 8: Highway Byway Cost Allocation ................................................................................................................... 37

Southwest Power Pool, Inc.
2018 ITPNT Assessment 2
SECTION 1: EXECUTIVE SUMMARY
The ITP process promotes transmission investment that will meet reliability, economic and public policy needs1 intended to create a cost-effective, flexible and robust transmission network that will improve access to the region’s diverse generating resources. The ITP Near-Term assessment is performed annually and assesses system upgrades, at all applicable voltage levels, required in the near-term planning horizon to address reliability needs. This report documents the ITP Near-Term (ITPNT) assessment that concludes in July 2018.
The 2018 ITPNT differs from previous ITPNT assessments in several specific areas. These areas include significant generation retirements [~1.7 gigawatts (GW)], implementation of the base reliability (BR) model methodology, addition of the Brookline high-voltage operational need, inclusion of DC-tie sensitivity cases modeling the northern DC ties with an opposite powerflow bias, and additional scrutiny of scenario 5 summer needs. This report provides insight to the additional analysis and considerations discussed through our stakeholder process to be evaluated with the collaboration from our stakeholders to determine the most optimal project.
1.1: THE ITPNT PROCESS The ITPNT assessment generates a cost effective near-term plan for the SPP regional transmission organization (RTO) planning region by identifying solutions to reliability criteria exceedances for system intact and contingency conditions.
The ITPNT assesses:
• Regional upgrades required to maintain reliability in the near-term horizon in accordance with SPP Criteria and the North American Electric Reliability Corporation
1 The highway/byway cost allocation approving order is Sw. Power Pool, Inc., 131 FERC ¶ 61,252 (2010). The approving order for ITP is Sw. Power Pool, Inc., 132 FERC ¶ 61,042 (2010).

Southwest Power Pool, Inc.
2018 ITPNT Assessment 3
(NERC) Reliability Standard TPL-001-4 planning events that do not allow for non-consequential load loss (NCLL) or interruption of firm transmission service (IFTS).
• Zonal upgrades required to maintain reliability in accordance with company-specific local planning criteria in the near-term horizon.
• Coordinated projects with neighboring transmission providers.
ITPNT projects are reviewed and approved by SPP’s Transmission Working Group (TWG) and the Markets and Operations Policy Committee (MOPC) and approved by the SPP Board of directors (Board). Upon Board approval, staff will issue NTC letters for upgrades that require a financial commitment within the next four-year timeframe.
1.2: THE 2018 ITPNT The 2018 ITPNT included four separate scenario models — Scenarios 0 (S0), Scenario 5 (S5), SPP balancing authority (BA) and base reliability (BR) — built across multiple years and seasons to evaluate power flows across the grid and account for various system assumptions. The S0, S5 and BR models allow only resources with firm transmission service to be dispatched with the preferred order submitted by SPP members, while the BA model allows for resources without firm transmission service to be dispatched in addition to firm resources subject to system constraints similar to the SPP Integrated Marketplace.
SPP’s transmission system performance was assessed from different perspectives designed to identify solutions necessary to accomplish the reliability objectives of the SPP RTO:
• Avoid exposure to NERC Reliability Standard TPL-001-4 planning events that do not allow for NCLL or IFTS during the operation of the system under high stresses
• Contribute to the voltage stability of the system
• Reduce congestion associated with persistent operational issues
Voltage Class (kV) New Line (miles) Rebuild/Reconductor (miles)
345 0 0
230 0 0
161 5.6 0
138 0 0
115 0 3
69 0 5.5 Table 1: 2018 ITPNT Project List Breakdown – New and Rebuilt Line Miles by Voltage Class

Southwest Power Pool, Inc.
2018 ITPNT Assessment 4
Voltage Class (kV) New Transformer
345/230 0
345/138 0
345/115 0
345/69 0
230/115 3
138/69 0
115/69 0 Table 2: 2018 ITPNT Project List Breakdown – New Transformer by Voltage Class
New projects identified in the 2018 ITPNT assessment account for a total of $47.4 million. Select projects previously issued a notification to construct (NTC) were re-evaluated in this assessment and resulted in a total reduction of $84.6 million for withdrawn NTCs. The estimated net total cost of the 2018 ITPNT project plan is estimated to be a reduction of $37.2 million due to NTCs withdrawals produced by the study.
Reliability Project(s) Project Area(s)
Cost Need Date
New Lakeview 69-kV substation. New 14.4 MVAR switched shunt capacitor at Lakeview 69-kV
EREC $5,617,000 6/1/2019
Reconductor 3 miles of 115-kV line from Richland to Lewis
WAPA/Basin $105,0002 6/1/2019
Replace the 230/115-kV transformer at Lawrence Hill
WERE $4,896,108 6/1/2019
Construct a new 5.6 mile 161-kV line from Blue Valley to Crosstown
KCPL $8,951,824 6/1/2020
Replace terminal equipment on the 161-kV line from Olathe to Switzer
KCPL $1,088,000 6/1/2019
Replace terminal equipment on the 161-kV line from Brookridge to Overland Park
KCPL $538,000 6/1/2019
2The total MDU, WAPA, and Basin estimated cost is $1,105,001.

Southwest Power Pool, Inc.
2018 ITPNT Assessment 5
New 50 MVAR switched shunt reactor at Brookline 345-kV. Brookline 345-kV Substation expansion
SPRM $4,175,203 6/1/2019
Rebuild 1.25 miles of 69-kV line from Nixa Downtown to Nixa Espy
SWPA $1,108,561 6/1/2019
Rebuild 4.2 miles of 69-kV line from VBI North to Figure Five
AEP $3,409,700 6/1/2019
Tap Moore-Potter 230-kV line and Exell Tap-Fain 115- kV line and tie into a new substation at McDowell
Install a new 230/115-kV transformer at McDowell
SPS $13,204,182 6/1/2019
Replace terminal equipment on the 115-kV line from Carlisle to Murphy
SPS $319,760 6/1/2022
Replace terminal equipment on the 115-kV line from Clauene to Terry County
SPS $520,574 6/1/2019
Replace the 230/115-kV transformer at Sundown
SPS $3,434,979 6/1/2019
Table 3: 2018 ITPNT Projects

Southwest Power Pool, Inc.
2018 ITPNT Assessment 6
Figure 1: 2018 ITPNT Voltage Needs and Solutions. The needs in southern Oklahoma are being mitigated through TO action instead of a project in the area. See Section 7.2 for further details

Southwest Power Pool, Inc.
2018 ITPNT Assessment 7
Figure 2: 2018 ITPNT Thermal Needs and Solutions

Southwest Power Pool, Inc.
2018 ITPNT Assessment 8
SECTION 2: INTRODUCTION
2.1: THE ITP NEAR-TERM The ITPNT is designed to evaluate the near-term reliability of the SPP transmission system and identify needed upgrades through stakeholder collaboration. The ITPNT focuses primarily on solutions required to meet the reliability criteria defined in the SPP Open Access Transmission Tariff (tariff), Attachment O, Section III.6. The process coordinates the ITP 20-Year assessment (ITP20), 10-Year assessment (ITP10), Aggregate Transmission Service Studies (ATSS), Attachment AQ Studies (AQ) and the Generator Interconnection (GI) transmission plans by communicating potential solutions between processes and using common solutions when appropriate.
The 2018 ITPNT process produces a reliable near-term plan for the SPP footprint by identifying solutions to potential issues for system intact and contingency conditions.
The ITPNT process is open and transparent, allowing for stakeholder input throughout the assessment. Study results are coordinated with other entities, including those embedded within the SPP footprint and neighboring first-tier entities.
GOALS The goals of the ITPNT are to:
• Focus on local, regional and interregional needs.
• Evaluate the response of the system to NERC Reliability Standard TPL-001-4 planning events that do not allow for NCLL or IFTS, with respect to SPP and company-specific criteria.
• Identify and analyze transmission-system needs over the five-year horizon.
• Identify cost-effective 69 kilovolt (kV) and above solutions that achieve, but are not limited to, the following:
o Resolve reliability criteria needs
o Improve access to markets
o Improve interconnections with SPP’s neighbors
o Meet expected load-growth demands
o Facilitate or respond to expected facility retirements
o Synergize with the GI, ATSS and AQ processes and the ITP10 and ITP20 assessments
o Address persistent operational issues as defined in the scope
The 2018 ITPNT is intended to provide solutions to ensure the reliability of the transmission system during the study horizon, which includes modeling of the transmission system five years out (i.e., 2022). The specific near-term requirements of Attachment O are:
• The transmission provider shall perform the near-term assessment on an annual basis

Southwest Power Pool, Inc.
2018 ITPNT Assessment 9
• The near-term assessment will be performed on a shorter planning horizon than the 10-year assessment and shall focus primarily on identifying solutions required to meet the reliability criteria defined in Section III.6
• The assessment study scope shall specify the methodology, criteria, assumptions and data to be used to develop the list of proposed near-term upgrades
• The transmission provider, in consultation with the stakeholder working groups, shall finalize the assessment study scope. The study scope shall take into consideration the input requirements described in Section III.6
• The assessment study scope shall be posted on the SPP website and will be included in the published annual SPP Transmission Expansion Plan (STEP) report
• In accordance with the assessment study scope, the transmission provider shall analyze potential solutions, including those upgrades approved by the Board from the most recent 20-year and 10-year assessments, following the process set forth in Section III.8
2.2: HOW TO READ THIS REPORT This report focuses on the years 2019 and 2022 and is divided into multiple sections.
• Sections 2 through 5 address the concepts behind this study’s approach, key procedural steps in development of the analysis and overarching assumptions used in the study
• Sections 6 through 8 address the specific results, describe the projects that merit consideration and contain recommendations and costs
SPP FOOTPRINT Within this study, any reference to the SPP footprint refers to the set of legacy BAs and transmission owners (TO) whose transmission facilities are under the functional control of the SPP RTO, unless otherwise noted.
SUPPORTING DOCUMENTS The development of this study was guided by the supporting documents noted below. These documents provide structure for this assessment:
• SPP 2018 ITPNT Scope
• SPP ITP Manual
All referenced reports and documents contained in this report are available on SPP.org.
CONFIDENTIALITY AND OPEN ACCESS Proprietary information is frequently exchanged between SPP and its stakeholders in the course of any study and is extensively used during the ITP development process. This report does not contain confidential marketing data, pricing information, marketing strategies or other data considered not acceptable for release into the public domain. This report does disclose planning and operational matters, including the outcome of certain contingencies, operating transfer capabilities and plans for new facilities that are considered non-sensitive data.
Southwest Power Pool, Inc.
2018 ITPNT Assessment 10
SECTION 3: STAKEHOLDER COLLABORATION
Assumptions and procedures for the 2018 ITPNT analysis were developed through SPP stakeholder meetings that took place in 2016, 2017 and 2018. The assumptions were presented and discussed through a series of meetings with members, liaison members, industry specialists and consultants to facilitate a thorough evaluation. Groups involved in this development included the following:
• TWG
• MOPC
• Board
SPP staff members served as facilitators for these groups and worked closely with each group’s chairman to ensure all views were heard and SPP’s member-driven value proposition was followed.
The TWG provided technical guidance and review for inputs, assumptions and findings. Policy-level considerations were tendered to appropriate organizational groups including the MOPC. Stakeholder feedback was instrumental in the selection of the 2018 ITPNT projects.
The TWG was responsible for technical oversight of the load forecasts, transmission-topology inputs, constraint-selection criteria, reliability assessments, transmission projects and the study report.
3.1: PLANNING SUMMITS In addition to the standard working group meetings, multiple transmission planning summits were conducted to elicit further input and provide stakeholders with a chance to interact with SPP staff members on all related planning topics.
PROJECT COST OVERVIEW Conceptual estimates were prepared by SPP staff members and were based on historical cost information submitted by TOs through the project-tracking process. Refined cost estimates expected to be accurate within a ±30 percent bandwidth were prepared by a third-party vendor and incumbent TOs. All cost estimates utilized in the 2018 ITPNT were developed in accordance with SPP Business Practice 7060, NTC and Project Cost Estimating Processes effective Jan. 1, 2012, and SPP Business Practice 7660, Upgrade Determination and Short-Term Reliability Project Process.
Stakeholder Collaboration
TWG
MOPCBOARD

Southwest Power Pool, Inc.
2018 ITPNT Assessment 11
If a project meets the requirements in Attachment Y, Sections I and II to be a competitive upgrade, SPP is responsible for providing the cost estimates for the project via a third party. If the project did not meet the requirements in Attachment Y, Sections I and II, SPP requests cost estimate information from the incumbent TO.

Southwest Power Pool, Inc.
2018 ITPNT Assessment 12
SECTION 4: STUDY DRIVERS
4.1: INTRODUCTION Drivers for the 2018 ITPNT were discussed and developed through the stakeholder process in accordance with the 2018 ITPNT Scope and involved stakeholders from several diverse groups. Stakeholder load, generation and transmission were carefully considered in determining the need for, and design of, transmission solutions.
4.2: MODEL DEVELOPMENT
SCENARIO 0 (S0) S0 assumes projected usage of long-term firm transmission service between SPP customers and dispatches each entity’s generation to meet their load and obligations. S0 emphasizes high conventional generation commitment and dispatch. Renewable generation is set to match the Model Development Working Group (MDWG) 2017 models.
SCENARIO 5 (S5) S5 expands on S0 by maximizing long-term firm transmission service. S5 emphasizes higher wind transfers by dispatching all wind generation to maximum long-term firm service amounts. All remaining reservations are set to maximum firm service, not to exceed forecasted load. In the event forecasted load is not enough to maximize use of all inter-customer transmission service commitments, those reservations are generally scaled down on a pro-rata basis.
BALANCING AUTHORITY (BA) To account for the impacts of the Integrated Marketplace on the SPP footprint, a BA scenario model was developed as part of the 2018 ITPNT assessment. The BA scenario modeled SPP as a single BA while assuming no change to power transfers across the SPP seams.
To simulate changes that will occur to the SPP portion of the NERC Book of Flowgates due to upgrades coming into service during the defined study period of the 2018 ITPNT assessment, a constraint assessment was completed to determine if any system constraints should be added, removed or modified before the economic dispatch (SCED) cases were created.
Making use of the economic data from the 2017 ITP10, PowerGEM software, TARA, was used to perform a DC SCED with AC verification on the SPP footprint to deliver the most economical power to load, dispatching around SPP base case and N-1 constraints 69 kV and above.
BASE RELIABILITY (BR) The base reliability scenario assumes expected usage of long-term firm transmission service usage. Renewable resources are dispatched at each facility's latest five-year average for the SPP coincident summer peak, not to exceed each facility's firm service amount.

Southwest Power Pool, Inc.
2018 ITPNT Assessment 13
4.3: LOAD OUTLOOK
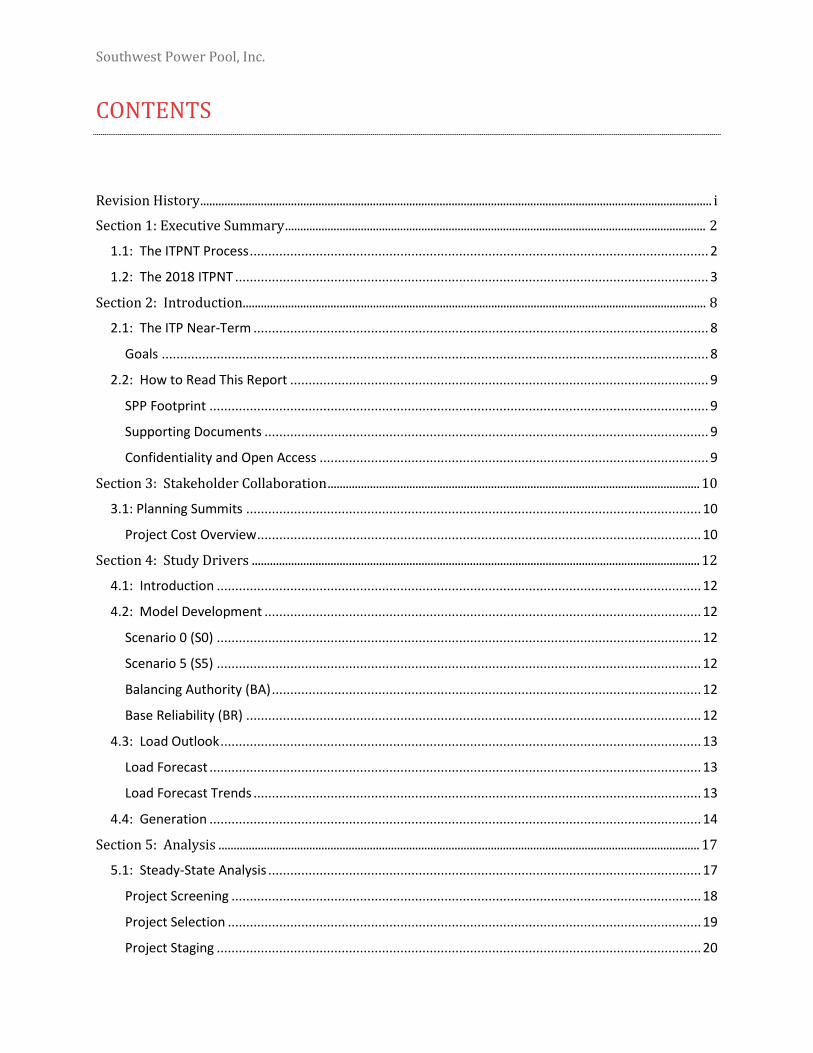
LOAD FORECAST Future energy usage was forecasted by utilities in the SPP footprint and collected and reviewed through the efforts of the MDWG. This assessment used summer peak (SP), winter peak (WP) and light load (LL) seasons to assess the performance of the grid in peak and off-peak conditions. Figure 3 shows the SPP regional load amounts for each analyzed season.
Figure 3: 2018 ITPNT Load Levels
LOAD FORECAST TRENDS While load forecasts continue to show an average growth of 0.9 percent per year for the SPP region, yearly updates to those projections have continued to trend downward when compared to previous studies. Figure 4 shows the load forecast trends since the 2015 ITPNT.
53
42
23
55
43
0
10
20
30
40
50
60
2019 Summer 2019 Winter 2022 Light Load 2022 Summer 22 Winter
GW
Season
2018 ITPNT Load Levels

Southwest Power Pool, Inc.
2018 ITPNT Assessment 14
Figure 4: SPP ITPNT Load Trends
4.4: GENERATION The four figures below show the difference in generation dispatch between the S0, S5, BA and BR scenario models for each season. Note the significant difference in the wind output for the S5 models. The BA scenario dispatch methodology is discussed earlier in this report.
55,017
54,225
53,683
52,832
55,837
54,744
54,052
53,401
58,561
56,795
55,169
54,646
49,000
50,000
51,000
52,000
53,000
54,000
55,000
56,000
57,000
58,000
59,000
2015 ITPNT 2016 ITPNT 2017 ITPNT 2018 ITPNT
SPP ITPNT Load Trends
Year-1 Year-2 Year-5

Southwest Power Pool, Inc.
2018 ITPNT Assessment 15
Figure 5: Scenario 0 Generation Summary
Figure 6: Scenario 5 Generation Summary
0
5
10
15
20
25
30
Gas Coal Hydro Nuclear Renewable Other
GW
Fuel Type
Scenario 0 Generation Summary
2019 Summer 02019 Winter 02022 Light 02022 Summer 02022 Winter 0
0
5
10
15
20
25
Gas Coal Hydro Nuclear Renewable Other
GW
Fuel Type
Scenario 5 Generation Summary
2019 Summer 5
2019 Winter 5
2022 Light 5
2022 Summer 5
2022 Winter 5

Southwest Power Pool, Inc.
2018 ITPNT Assessment 16
Figure 7: Scenario BA Generation Summary
Figure 8: Scenario BR Generation Summary
0
5
10
15
20
25
Gas Coal Hydro Nuclear Renewable Other
GW
Fuel Type
Scenario BA Generation Summary
2019 Summer BA2019 Winter BA2022 Light BA2022 Summer BA2022 Winter BA
0
5
10
15
20
25
Gas Coal Hydro Nuclear Renewable Other
GW
Fuel Type
Scenario BR Generation Summary
2019 Summer BR2022 Summer BR

Southwest Power Pool, Inc.
2018 ITPNT Assessment 17
SECTION 5: ANALYSIS
5.1: STEADY-STATE ANALYSIS Analysis of the transmission system under system-intact and contingencies of SPP facilities at 69 kV and greater and at 100 kV and greater for first-tier control areas was performed on the 2018 ITPNT violations. The specific contingencies and the scenarios they were assessed against are defined in the study scope document. Reliability needs are identified for facilities with greater than 100 percent thermal loading or voltage below 0.9 or greater than 1.05 per unit for under-contingency conditions and voltage below 0.95 per unit for base-case conditions. Company-specific planning criteria also were considered to identify transmission needs, when more stringent than SPP criteria. All facilities in first-tier control areas were monitored at 100 kV and above for informational purposes and potential seams project opportunities. After performing the initial reliability assessment to identify the transmission system issues, thermal and voltage needs were posted on the GlobalScape and TrueShare sites for stakeholder accessibility.
During the course of the needs assessment, potential violations were solved or marked invalid through methods such as reactive device setting adjustments, model adjustments, and identification of invalid contingencies, non-load-serving buses, and facilities not under functional control of SPP via Attachment AI of the SPP Tariff. Figure 9 summarizes the number of remaining thermal needs (unique monitored facility) that were unable to be mitigated during the screening process.
Figure 9: 2018 ITPNT Unique Thermal Needs
4
18
4 4
0 0 0 0
2
0
8
14
4
11
0
21
0
2
4
6
8
10
12
14
16
18
20
Num
ber
of N
eed
s
Model Season and Scenario
2018 ITPNT Unique Thermal Needs

Southwest Power Pool, Inc.
2018 ITPNT Assessment 18
Figure 10 summarizes the number of remaining voltage needs (unique monitored facility) by year, season and scenario.
Figure 10: 2018 ITPNT Unique Voltage Needs
PROJECT SCREENING Stakeholders submitted 310 Detailed Project Proposals (DPP) through the Order 1000 process, which included 48 modeling corrections, 18 non-transmission solutions and 10 transmission operating guides. In addition to the DPPs and other submissions, 157 SPP staff solutions and mitigations were considered to address the reliability needs. Altogether, 467 solutions were evaluated.
SPP Staff evaluated all submitted and created projects that would solve identified reliability needs. Further, each individual project’s ability to mitigate each reliability need identified in the needs assessment was assessed using PSS®E.
A conceptual cost estimate also was developed for each project to utilize during screening. SPP staff members developed a standardized conceptual cost template for assigning project costs to all stakeholder-submitted and SPP staff-developed projects.
Once a project was identified as solving a reliability need and assigned a conceptual cost, a set of reliability metrics was calculated. The reliability metrics (metrics) were developed by SPP staff and stakeholders and approved by the TWG for use as a tool to aid in project selection. The metrics coincide with thermal and voltage reliability needs. The first metric is cost per loading relief (CLR), which relates the amount of thermal loading relief for the cost of a project for a need. The second
14
19
15
18 18
28
18
0 0 0
14 14 1413
18
31
18
1
0
5
10
15
20
25
30
35
Num
ber
of N
eed
s
Model Season and Scenario
2018 ITPNT Unique Voltage Needs

Southwest Power Pool, Inc.
2018 ITPNT Assessment 19
metric is cost per voltage relief (CVR), which relates the amount of voltage support for the cost of a project for a need.
After the metrics were calculated, the projects were ranked for each need by the lowest CLR or CVR. The project with the highest ranking (lowest CLR or CVR) was identified as the most optimal project to address the particular need.
PROJECT SELECTION To perform a comparison of the metric results for an extensive number of projects, SPP staff utilized a programmatic solution. Using this project selection software, a subset of projects was generated by considering project cost as related to the amount of targeted relief the project could provide. Displacement of lower-voltage projects by higher-voltage projects occurred when a higher-voltage project solved needs at a lower voltage level. During this activity, SPP staff applied engineering judgment to begin development of a draft list of selected and high-performing alternate solutions with regard to the metrics. SPP stakeholders posted this draft project list for review and study-level cost estimates were requested from either the incumbent TO or the third-party cost estimator. As staff received feedback from members on the draft project list, including the study-level cost estimates, the draft project list was reviewed using this new information.
During the planning summit on May 3, 2018, staff discussed the first draft portfolio of projects to address the needs of the 2018 ITPNT with the stakeholders. This discussion included system characteristics driving the need and how the draft portfolio project addresses those issues. Once the summit was completed, staff issued a second request for study-level cost estimates and considered feedback from the stakeholder to develop a final recommended portfolio to cost-effectively address the needs observed in the 2018 ITPNT assessment.

Southwest Power Pool, Inc.
2018 ITPNT Assessment 20
Figure 11: Project Selection Methodology
PROJECT STAGING Need dates for the selected projects were determined using linear interpolation of percent line loading or per-unit voltage between model years 2019 and 2022. For example, to determine a need date for a solution due to a 2022 potential overload, SPP interpolated percent line loadings between the 2019 and 2022 models to determine the year when the loading is projected to exceed 100 percent. The day and month of the need date coincide with the definition of the start of the season in which the need was identified. Projects only addressing needs resulting from the additional P2, P3, P4 and P5 events were given a need date of the season in which the violation was observed for the year 2022.
5.2: ADDITIONAL ANALYSIS As part of staff’s effort to provide the most cost-effective set of solutions to address needs in the 2018 ITPNT assessment, additional analysis and consideration were evaluated during the project selection phase of the study. Some facilities were identified in the needs assessment meeting multiple of the criteria below for additional consideration. As each of these issues was discussed, the recommendation to move forward or move on from a specific need or project was discussed relevant to that topic. For example, assume a transmission facility was observed to be overloaded in 2019 and 2022 summer peak S5 and the 2019 summer peak BR models. As discussed below, after the TWG determined the S5 summer models should be removed from consideration in the 2018
Develop conceptual
cost estimates
Rank projects based on CLR
or CVR
Run Displacement
Algorithm
Ensure validdisplacement

Southwest Power Pool, Inc.
2018 ITPNT Assessment 21
ITPNT assessment, the remaining violation occurred in 2019 summer of the BR model. Once the TWG made the determination not to move forward with needs observed only in 2019, there was no longer a remaining need to address an issue on the transmission facility in question.
ANALYSIS OF S5 SUMMER NEEDS In July 2017, the Board added the consideration of the S5 summer models to the scope of the 2018 ITPNT assessment. For any projects driven by needs that were unique to the S5 summer models, SPP staff sought additional merits to support the need for the project. These additional merits analyzed by SPP staff included each project’s ability to address historical and/or projected market congestion3, potential economic benefit4 due to congestion relief, and ability to address auction revenue rights (ARR) feasibility issues. During the needs review, staff identified 22 unique thermal needs and one unique voltage need present only in the S5 summer models.
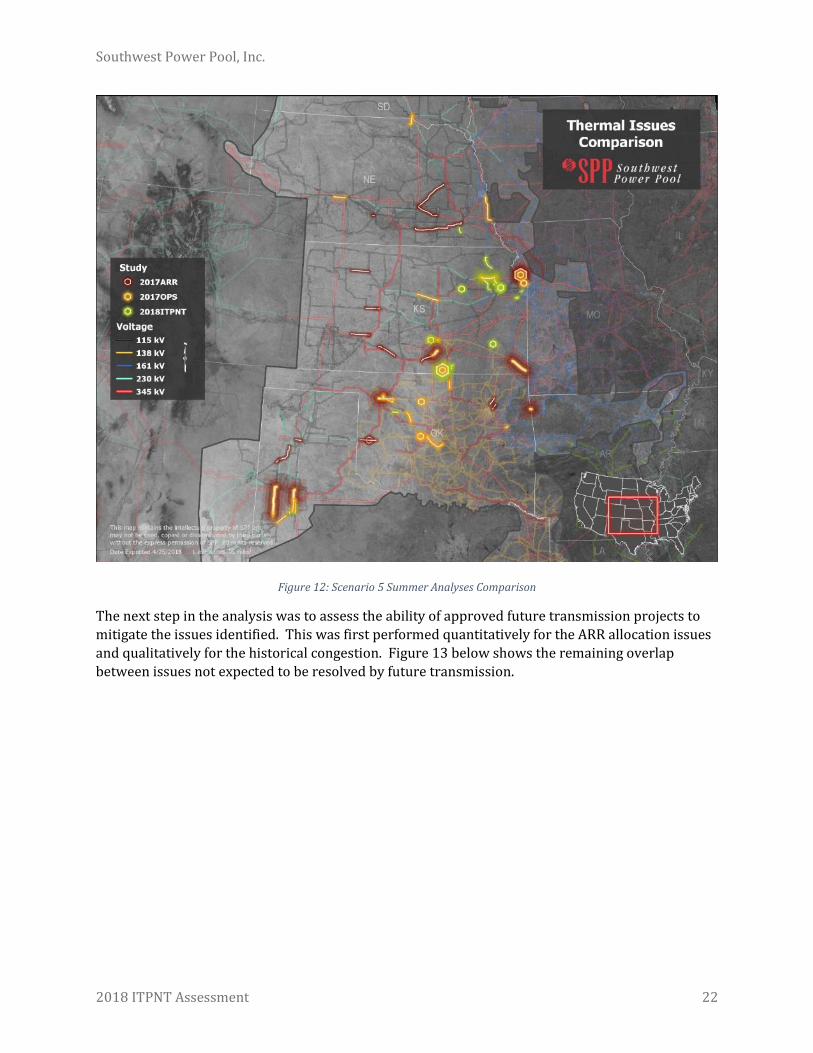
The first step in this analysis was to identify areas of geographical or electrical overlap between the thermal violations unique to S5 summer and congestion seen either historically in the SPP Integrated Market, or in models utilized for the annual auction of SPP’s congestion hedging process. The historical congestion of interest was identified utilizing one of the criteria approved to define persistent operational needs in the new ITP process which consisted of flowgates with a total congestion cost of $10M or greater over the last 24 months. The time period defined for this analysis was 2016-2017. The congestion of interest in the ARR analysis was identified from the June and winter 2017 on peak models used for round 1 of the 2017 annual ARR allocation. Figure 12 shows the initial comparison between the issues identified from the three different sources.
3 In all of the models used in the different analyses described in this section, congestion is created when
power flows must be reduced or rerouted in order to protect a defined flowgate against thermal violation. Historical congestion is based on real-time operational data from situations occurring in the past while congestion in ARR analyses the planning horizon and are projected and driven by modeling assumptions.
4 Economic benefit generally equates to energy cost savings for these assessments. In the operational assessment it is the savings that could have actually been realized by lowering generator production costs calculated based on market bids. In the planning assessment it is potential future Adjusted Production Cost (APC) savings calculated by the methodology defined here: https://www.spp.org/Documents/36481/2017%20ITP10%20APC%20Calculation%20(2-29-2016).pdf
Southwest Power Pool, Inc.
2018 ITPNT Assessment 22
Figure 12: Scenario 5 Summer Analyses Comparison
The next step in the analysis was to assess the ability of approved future transmission projects to mitigate the issues identified. This was first performed quantitatively for the ARR allocation issues and qualitatively for the historical congestion. Figure 13 below shows the remaining overlap between issues not expected to be resolved by future transmission.

Southwest Power Pool, Inc.
2018 ITPNT Assessment 23
Figure 13: Scenario 5 Summer Needs Overlap
As shown in the figure above, limited synergies between the needs present in the 2018 ITPNT assessment and the other issues evaluated remain. After determining that the only overlap between the S5 summer and other issues were with historical congestion in Kansas, SPP staff began discussions with the TWG to focus the evaluation of additional merit to the Wichita, Kansas and northeast Kansas area. After obtaining agreement from the TWG to focus on those two geographical areas, staff quantitatively analyzed the ability of potential transmission projects to alleviate historically congested flowgates. SPP operations staff developed models based on historical snapshots where congestion occurred and performed a reliability analysis of selected projects to determine if the congestion was relieved and the project did not create additional issues on the transmission system. Models were developed for the following flowgates:
Wichita 345/138-kV
JEC – Hoyt 345-kV
Hawthorne 345/161-kV
Nashua 345/161-kV

Southwest Power Pool, Inc.
2018 ITPNT Assessment 24
Two projects were tested in the model developed for the Wichita 345/138-kV transformer: a replacement of the existing transformers and a new project to add a new source into Wichita by installing a substation and 345/138-kV transformer at Buffalo Flatts and converting the existing 69-kV feed into Cowskin to 138-kV. Both solutions were able to address the congestion and did not create any additional violations. However, SPP staff believes that a project’s ability to relieve congestion alone, without weighting its cost against potential economic benefits is not enough to justify approval for construction.
Due to the location of the Hawthorne and Nashua transformers to S5 summer needs, a large solution was evaluated for its ability to address the three remaining issues. A new line from JEC to Iatan 345-kV was tested and found to address the JEC – Hoyt 345-kV congestion but did not resolve loading on the two transformers. A second project was tested to address the JEC – Hoyt 345-kV line, a rebuild of the existing line as a double circuit. This project was found to address the historical congestion but created a new issue on the 345/115-kV transformer at Hoyt under a contingency of the Hoyt – Stranger 345-kV line.
The second phase of operational analysis was intended to be a quantification of potential economic benefit of a new project through its ability to resolve historical congestion, but technical limitations proved this analysis infeasible at this time.5 Due to the inability to quantify economic benefit of these projects from an operational perspective, SPP Staff determined there was insufficient data to determine if a new transmission project was needed.
Analysis was also performed to evaluate potential future economic benefit that could be realized from the ability of new transmission to relieve congestion in the planning horizon. The latest available economic planning models were those from the 2017 ITP10 assessment, of which the 2020 and 2025 future 3 (reference case future) models were deemed most applicable. The following projects were tested to determine these potential benefits:
Replace both 345/138-kV transformers at Wichita
New Wolf Creek – Emporia 345-kV
Tap JEC – Morris and build a new line from the tap to Swissvale 345-kV
New JEC – Iatan 345-kV
Auburn – JEC – Swissvale 230-kV rebuild to 345-kV specifications
Rebuild Buffalo Flatts – Goddard – Cowskin 69-kV at 138-kV, and install 345/138-kV and 138/69-kV transformers at Buffalo Flatts
New Viola – Rose Hill 345-kV
New JEC – Hoyt 345-kV second circuit
5 These limitations will be discussed with the Economic Studies Working Group for a future resolution.

Southwest Power Pool, Inc.
2018 ITPNT Assessment 25
Rebuild JEC – Hoyt 345-kV as a double circuit
All of these solutions were found to have limited economic benefit from congestion relief.6 Based on these and the previous results, SPP staff was unable to identify additional potential merits to address the needs unique to the S5 summer models.
As an additional merit for consideration of these needs, Westar Energy staff brought further analysis to staff and the TWG to consider the improvement in fault-induced voltage recovery in the Wichita area, where Westar energy is expected to retire generation later in 2018, with the implementation of the aforementioned Buffalo Flatts solution.
After thorough deliberation, the TWG approved the removal of the needs resulting from S5 summer models from consideration in the 2018 ITPNT assessment.
ANALYSIS OF SCENARIO BA-ONLY NEEDS The BA powerflow models were added to the near-term assessments to simulate the effects of the Integrated Market on the SPP footprint. During the course of the 2018 ITPNT, SPP staff identified potential issues with utilization of the BA models for this type of assessment that generated concerns with addressing the needs from these models with new transmission. This included technical limitations of the process to achieve the goal of fully simulating the effects of the Integrated Market, as well as potential policy concerns with the needs generated from this analysis.
The technical limitations center around two key aspects of the Integrated Market that are not able to be fully replicated in an assessment of this type. The first is the inability to redispatch external non-SPP generation to help alleviate potential violations on the SPP seam. The current process to develop the BA powerflow models is limited in that only SPP generation is redispatched to alleviate SPP issues. While this may have not specifically driven all violations seen in the BA models, all of the violations identified were near the eastern seam of SPP and potentially could have been mitigated by external generation redispatch. The other technical issue is the inability to fully replicate a security-constrained unit commitment. While generators are able to be turned on or off during the security-constrained economic dispatch, this action is limited and does not fully account for generator startup costs or variables in the time domain such as generator ramp rates or forecasted system demand that would be accounted for in the Integrated Market.
The policy concern is in regards to performing regional reliability analysis on a model that contains non-firm generation. These models contain a certain level of generation that has not been studied in the SPP ATSS process to gain firm transmission service. The other scenario models of the near-term assessment only dispatch generation that has been studied through the aforementioned process in order to confirm capacity and energy deliverability of firm resources backed by network and point-to-point service. One goal of the regional planning study is to maintain the rights of long-term firm resources by identifying new transmission to support the continued deliverability of firm
6 These results are specific to the futures developed for the 2017 ITP10 and do not guarantee that potential
APC benefit will not warrant proposed construction in future ITP studies

Southwest Power Pool, Inc.
2018 ITPNT Assessment 26
resources. While non-firm resources may not be directly driving the needs seen in the BA models, they are displacing other firm generation that could be used to potentially alleviate those issues.
Due to these and other issues, SPP opted to perform further analysis on needs appearing only in BA models to gain additional justification for any projects. The approach was to couple the issues with other dispatch scenarios and information that will be used in future studies. A subset of these thermal needs were facilities identified as highly loaded in other dispatch scenarios or expected to be a future need in another dispatch scenario based on changing model assumptions. As a result of this analysis, the following projects were included in the recommended portfolio and are discussed in more detail in 7.1: Final Project Portfolio:
• Rebuild 4.2 miles of 69-kV line from VBI North to Figure Five
• Rebuild 1.25 miles of 69-kV line from Nixa Downtown – Nixa Espy
Two other needs were identified to be unique to the BA models but were not highly loaded in other dispatch scenarios and are not expected to be a future issue. Therefore, these thermal issues were deemed invalid for this study:
• Figure Five – Cedarville Tap 69-kV
• Baldwin – Woodlawn 69-kV
ANALYSIS OF SHORT-TERM NEEDS SPP staff identified several projects to address needs only present in the 2019 models. Both staff and stakeholders expressed concerns about issuing NTCs for needs that show to be mitigated within the model set. SPP staff recommended not moving forward with projects that only solve early-year issues. The TWG approved staff’s recommendation not to move forward with projects to solve thermal violations on the following facilities because the issues could be mitigated via system changes in later years:
• Prairie Lee – Blue Springs 161-kV line
• Blue Springs East – Blue Springs South 161-kV line
• Circleville – King Hill – Kelly 115-kV line
• Wichita 345/138-kV transformer
• Ainsworth 115-kV bus
ANALYSIS OF TRANSMISSION OPERATION GUIDES (TOGS) TOGs are tools used to mitigate issues in the daily management of the transmission grid. TOGs may be used as alternatives to planned projects. Staff is required to evaluate TOGs in accordance with Attachment O of the OATT and Appendix B of the ITP Manual. TOGs were evaluated in the ITPNT process to determine effectiveness in addressing thermal and voltage needs. During the course of the 2018 ITPNT assessment, staff discussed the use of TOGs with the TWG and the transmission owner/operator.

Southwest Power Pool, Inc.
2018 ITPNT Assessment 27
The TWG, in agreement with the transmission owner/operator, voted to approve the use of TOGs to address the following issues:
• Watford 230/115-kV Transformer
• Low Voltage in Rugby/Rollette Area
• Richland – Fairview 115-kV
• Morrill – Gering 115-kV
• Georgia 115/69-kV Transformer
• Lawrence Park – Georgia 69-kV
The TWG, in agreement with the transmission owner/operator citing real-time issues and ineffectiveness7 of the TOGs, voted in favor of transmission solutions in the 2018 ITPNT instead of the use of TOGs. This vote the resulted in the following projects8:
• Replace the 230/115-kV transformer at Lawrence Hill
• Construct a new 5.6-mile 161-kV line from Blue Valley to Crosstown
The TWG and the transmission owner/operator were not in agreement on the use of a TOG for one facility, the Wolf Creek 345/69-kV transformer located at the Wolf Creek Plant. A set of TOGs have been developed to reduce the MW output of the plant when any of the 345-kV lines are outaged for any reason. The TOGs were developed to protect the system from angular stability issues that occur under N-1-1 contingency conditions when more than one of the 345-kV lines leaving the plant are outaged. These angular stability issues have been observed in various studies. The rating of the Wolf Creek 345/69-kV transformer is found to be in violation in the 2019 and 2022 winter peak S5 models, in which the Wolf Creek Plant and the Waverly wind farm are both dispatched at almost full output. A large portion of the energy from these generators flows from west to east across the Waverly - LaCygne 345 kV-line. When that line is outaged, almost 800 MVA of energy is redirected across the remaining facilities connected to the Wolf Creek 345-kV bus. This redirection of flow causes loading on the 345/69-kV transformer at Wolf Creek to surpass its emergency limit.
The transmission owner recommended to the TWG a long-term Extra High Voltage (EHV) solution was necessary to address the both thermal loading and angular stability issues around Wolf Creek. The need for the EHV solution was because the TOG did not include a short-term emergency rating and the angular stability margins around Wolf Creek have been steadily declining as more renewable generation has been installed and dispatched in the SPP Integrated Market.
Staff completed additional analysis to address the violation on the Wolf Creek transformer to provide the TWG with as much information as possible to make an informed decision. This included analysis of a higher-rated replacement transformer and a new 345-kV line from Wolf
7 See Appendix B of the 2016 ITP Manual.
8 More information regarding specifics of the project can be found in Section 7 of this report

Southwest Power Pool, Inc.
2018 ITPNT Assessment 28
Creek to Emporia Energy Center. Analysis completed by staff for consideration by the TWG included:
• Steady state assessment to determine if either the larger transformer or new 345-kV line causes new violations on the system
• Transient stability analysis on a new 345-kV line from Wolf Creek to Emporia Energy Center to determine if angular stability limitations were improved
• Economic analysis on a new 345-kV line from Wolf Creek to Emporia Energy Center to determine potential APC savings
The steady state assessment on the possible solutions of the larger transformer and new 345-kV line were done in similar fashion to the Final Reliability Assessment as discussed in Section 7.3 of this report. The recommended portfolio was applied to the model with and without either of the aforementioned solutions. Contingency analysis was completed equivalent to the needs assessment. The implementation of either project in conjunction with the recommended portfolio resulted in no new potential violations on the transmission system.
Transient analysis was performed to determine the effect of a new 345-kV line from Wolf Creek to Emporia on the existing angular stability limit for the Wolf Creek Plant under different contingency conditions. The analysis was performed on the 2017 MDWG Dynamics cases being used in SPP’s 2018 TPL-001 Planning Assessment to give an indicative result of the increase in angular stability margin the new line would be able to provide. Analysis showed an increase in the angular stability margin near Wolf Creek. However, a new limit could not be confirmed.
Lastly, economic analysis was performed to evaluate the potential adjusted production cost savings of the removal of the TOG over the course of an entire year. To evaluate this an 8,760 hour economic assessment was done using approved Future 3 2017 ITP10 economic models. A comparison between a base case and change case was done to determine the potential APC savings. The base case was updated to reflect an increased usage of the TOG which reduces the available generation from the Wolf Creek Plant due the decreasing angular stability margins, while the change case removed the use of the TOG and added the 345-kV line from Wolf Creek to Emporia Energy Center. Indicative APC savings observed in the economic analysis resulted in a 1-year benefit-to-cost (B/C) ratio of ~0.59. This savings is a result of the increased availability of low cost energy to the SPP footprint by not mandating a reduction in availability of the Wolf Creek Plant. No APC savings as a result of decreased congestion were observed.
After much discussion, the TWG approved a motion in disagreement with the host transmission owner, determining the TOG should be used to address issues observed in the 2018 ITPNT. The motion included an acknowledgment of the current angular stability and thermal loading issues around the Wolf Creek and requested continued discussion of how to evaluate the issues around Wolf Creek.
9 The 1 year B/C ratio criteria project must meet to be considered an economic project is 0.9 B/C as noted the
2017 ITP10 Scope.

Southwest Power Pool, Inc.
2018 ITPNT Assessment 29
ANALYSIS OF BROOKLINE HIGH-VOLTAGE OPERATIONAL NEED In 2016, SPP and Associated Electric Cooperatives, Inc. (AECI) performed a Joint Coordinated System Plan (JCSP) study to evaluate potential seams projects. During the course of that study, a persistent high-voltage need was identified in the Brookline area; however, prior to being issued an NTC, an SPP tariff study must have identified the need and recommended solution for SPP Board approval. As a result, the MOPC directed staff to confirm the Brookline high voltage issue meets the criteria for a persistent operational need for inclusion in the study. The need was found to still be valid, which led to the evaluation of solutions for the Brookline high voltage need in the 2018 ITPNT assessment.

Southwest Power Pool, Inc.
2018 ITPNT Assessment 30
SECTION 6: PROJECT SUMMARY
6.1 PROJECT DEVELOPMENT SUMMARY Transmission upgrades submitted through the Order 890 and Order 1000 processes were analyzed, and SPP staff members developed projects to address potential reliability issues that were not mitigated by corrective actions plans or operating guides. Table 4 presents the full list of projects in the 2018 ITPNT.
Reliability Project(s) Project Area(s) Cost Need Date
New Lakeview 69-kV substation. New 14.4 MVAR switched shunt capacitor at Lakeview 69 kV
EREC $5,617,000 6/1/2019
Reconductor 3 miles of 115-kV line from Richland to Lewis WAPA/Basin $105,00010 6/1/2019
Replace the 230/115-kV transformer at Lawrence Hill WERE $4,896,108 6/1/2019
Construct a new 5.6 mile 161-kV line from Blue Valley to Crosstown KCPL $8,951,824 6/1/2020
Replace terminal equipment on the 161-kV line from Olathe to Switzer KCPL $1,088,000 6/1/2019
Replace terminal equipment on the 161-kV line from Brookridge to Overland Park
KCPL $538,000 6/1/2019
New 50 MVAR switched shunt reactor at Brookline 345 kV. Brookline 345-kV Substation expansion
SPRM $4,175,203 6/1/2019
Rebuild 1.25 miles of 69-kV line from Nixa Downtown - Nixa Espy SWPA $1,108,561 6/1/2019
Rebuild 4.2 miles of 69-kV line from VBI North to Figure Five AEPW $3,409,700 6/1/2019
Tap Moore-Potter 230-kV line and Exell Tap-Fain 115-kV line and tie into a new substation at McDowell
Install a new 230/115-kV transformer at McDowell
SPS $13,204,182 6/1/2019
10 The total MDU, WAPA, and Basin estimated cost is $1,105,001.

Southwest Power Pool, Inc.
2018 ITPNT Assessment 31
Reliability Project(s) Project Area(s) Cost Need Date
Replace terminal equipment on the 115-kV line from Carlisle to Murphy SPS $319,760 6/1/2022
Replace terminal equipment on the 115-kV line from Clauene to Terry County
SPS $520,574 6/1/2019
Replace the 230/115-kV transformer at Sundown SPS $3,434,979 6/1/2019
Table 4: 2018 ITPNT Projects
6.2: NTC RE-EVALUATION RESULTS SUMMARY In accordance with Business Practice 7160 Notice to Construct Re-evaluation Review, applicable ITP assessment for NTC re-evaluation: Any NTC meeting the re-evaluation criteria will be reviewed during the next ITP assessment. Each project, except for the Jeffrey – Hoyt 345-kV rebuild, originated from the 2016 ITPNT assessment. The Jeffrey – Hoyt 345-kV rebuild originated from the ATSS (2016-AG1-AFS-3). Each of the projects listed in Table 5: NTC Re-evaluation Summary was re-evaluated to determine if the project is still required and is the most cost effective project to address the identified needs. The recommendation and justification for each re-evaluated project is found below.
Project Name Owner Cost Source Study Comments
Blanchard 69-kV Capacitor Bank WFEC $950K 2016 ITPNT Recommend NTC withdrawal
Ringwood 69-kV Capacitor Bank WFEC $4.5M 2016 ITPNT Recommend NTC withdrawal
Dean Interchange 230/115-kV Station and Transformer
SPS $12.7M 2016 ITPNT Recommend NTC withdrawal
Jeffrey – Hoyt 345-kV Rebuild WERE $34.9M 2016-AG1–AFS-
3 Recommend NTC
withdrawal
Welsh Reserve – Wilkes 138-kV Rebuild
AEP $24.9M 2014 ITPNT Recommend NTC withdrawal
Chapel Hill REC – Welsh Reserve 138-kV Rebuild
AEP $6.7M 2014 ITPNT Recommend NTC withdrawal
Table 5: NTC Re-evaluation Summary

Southwest Power Pool, Inc.
2018 ITPNT Assessment 32
BLANCHARD 69-KV CAPACITOR BANK The Blanchard 69-kV capacitor bank was issued to address the low voltages at the Blanchard 69-kV bus for the loss of Blanchard – Oklahoma University SW 69-kV Ckt 1 and for the loss of Oklahoma University SW 138/69/13.8-kV transformer. The needs observed at the Blanchard 69-kV bus were still present in the 2018 ITPNT posted needs. The recommendation for withdrawal is based on resolution of the observed needs with the issuance of SPP-NTC-C-210485. This NTC-C involves conversion of 69-kV lines to 138-kV lines and the 69-kV capacitor bank is no longer feasible.
RINGWOOD 69-KV CAPACITOR BANK The Ringwood 69-kV capacitor bank was issued to address the low voltages at the Ringwood 69-kV bus for the loss of Fairview – Okeene 69-kV Ckt 1, Alva – Cherokee SW 69-kV Ckt 1 and Cleo – Junction – Ringwood 69-kV Ckt 1. The contingency that caused the worst per-unit (p.u.) voltage was the loss of Fairview – Okeene 69-kV Ckt 1. In the 2018 ITPNT assessment, no needs were observed at the Ringwood 69-kV bus due to load forecast changes. The recommendation for withdrawal is based on the fact that the need no longer exists.
DEAN INTERCHANGE 230/115-KV STATION AND TRANSFORMER The Dean Interchange 230/115-kV station and transformer was issued to address the overloads on facilities in the southern part of the Texas Panhandle near Sundown. Due to a slight decrease in load forecast assumptions and the impact of other transmission projects in the area, this project was requested to be re-evaluated. During this evaluation, an alternative project to replace the Sundown 230/115-kV transformer was selected as the preferred solution to address needs in the area. This evaluation and the selected project are discussed in more detail in Section 7: Project Descriptions. Due to this evaluation, the NTC for the Dean Interchange project is being recommended withdrawal.
JEFFREY – HOYT 345-KV REBUILD The Jeffrey Energy Center – Hoyt 345-kV line was a result of the 2016-AG1-AFS3 study and was determined to be out of bandwidth for its cost estimate prior to the 2018 ITPNT assessment. The transmission service (TS) process determined that the line was no longer needed due to the removal of the S5 summer model from the TS process, and the re-evaluation for the ITP process was determined to be done in the 2018 ITPNT. Overloads for the Jeffrey Energy Center – Hoyt 345-kV line were observed for numerous contingencies; however, these issues were observed only in the S5 summer models. Due to the additional analysis described in Section 5.2, a determination was made to remove the needs identified in the S5 summer models from the 2018 ITPNT assessment; therefore, the recommendation for this project is for an NTC withdrawal.
WELSH RESERVE – WILKES 138-KV REBUILD AND CHAPEL HILL REC – WELSH RESERVE 138-KV REBUILD The Chapel Hill REC – Welsh Reserve – Wilkes 138-kV rebuild project was needed for the outage of the Lone Star South-Pittsburg 138-kV line. The flow on the Wilkes-Welsh Reserve-Chapel Hill REC 138-kV line is most affected by the load in the Mt. Pleasant and Mt. Pleasant NTEC zones. The primary system conditions in the east Texas area that changed are the forecasted loads for both the AEP and NTEC zones. In the 2014 ITPNT 19S, the combined load of the Mt. Pleasant and Mt.

Southwest Power Pool, Inc.
2018 ITPNT Assessment 33
Pleasant NTEC zone loads was 753 MW (410 MW + 343 MW). In 2018 ITP 22S, the combined load of the Mt. Pleasant and Mt. Pleasant NTEC zone loads was 655 MW (361 MW + 294 MW).
In the 2018 ITPNT 22S0, for the loss of Lone Star South-Pittsburg 138-kV, the line sections of Wilkes-Welsh Reserve-Chapel Hill REC 138-kV loading is 80% and 78% of the 272 MVA emergency rating respectively. With the upgrades removed, no issues were found in the 2018 ITPNT study.
6.3: PROJECT PLAN BREAKDOWN The figures below show a breakdown of the 2018 ITPNT project plan. There are 21 proposed upgrades making up 13 projects in the project plan. All of the proposed projects will be recommended for issuance of new NTCs. No projects have been identified as needing a modified NTC. Figure 14 shows the breakdown of projects recommended for issuance or withdrawal of an NTC.
Figure 14: 2018 ITPNT Project Breakdown
13
6
2018 ITPNT Project BreakdownProjects by NTC Status
NewWithdrawn

Southwest Power Pool, Inc.
2018 ITPNT Assessment 34
Figure 15 illustrates how many miles of existing transmission line that will require a rebuild or reconductor. There are 8.5 miles of rebuild/reconductor in the 2018 ITPNT project plan.
Figure 15: 2018 ITPNT Miles Rebuild/Reconductor by Voltage Class
Zonal reliability projects are required to meet local planning criteria that is more stringent than SPP criteria. There were no projects of this classification identified in this study.
Table 6 shows the cost of new and modified projects of the 2018 ITPNT identified by state.
5.5
3
Miles of Rebuild / Reconductor by Voltage Class
69 kV
115 kV

Southwest Power Pool, Inc.
2018 ITPNT Assessment 35
Table 6: 2018 ITPNT Projects by State
Table 7 shows the net investment amount of new and withdrawn projects of the 2018 ITPNT identified by state.
Table 7: 2018 ITPNT Net Investment by State
State New NTC
MT $105,000 MN $0 ND $0 SD $5,617,000 NE $0 WY $0 IA $0 KS $6,522,108 MO $14,235,588 OK $0 AR $3,409,700 TX $17,479,495 NM $0 LA $0
Subtotals: $47,368,891
State New NTC Withdrawn NTC Net Investment
MT $105,000 $0 $105,000 MN $0 $0 $0 ND $0 $0 $0 SD $5,617,000 $0 $5,617,000 NE $0 $0 $0 WY $0 $0 $0 IA $0 $0 $0 KS $6,522,108 ($34,900,000) ($28,377,892) MO $14,235,588 $0 $14,235,588 OK $0 ($5,400,000) ($5,400,000) AR $3,409,700 $0 $3,409,700 TX $17,479,495 ($44,262,281) ($26,782,786) NM $0 $0 $0 LA $0 $0 $0
Total $47,368,891 ($84,562,281) ($37,193,390)

Southwest Power Pool, Inc.
2018 ITPNT Assessment 36
Figure 16 is a representation of the cost of recommended new and withdrawn NTCs from the 2018 ITPNT portfolio by voltage class.
Figure 16: 2018 ITPNT NTC Costs by Voltage Class
Figure 17 shows the 2018 ITPNT projects represented two ways. The blue column represents the number of upgrades by year. The orange column represents the estimated dollars that will be invested to place the projects in service.
Figure 17: 2018 ITPNT Upgrades by Need Year and Total Dollars
Figure 18 shows the cost allocation of upgrades recommended for new NTCs and withdrawn NTCs by regional and zonal reliability.
$4$0
$11
$0
$22
$10
-$35 -$36
-$13
-$1
-$40
-$30
-$20
-$10
$0
$10
$20
$30
345 230 161 138 115 69
Dol
lars
($M
)
Voltage Class (kV)
2018 ITPNT NTC Costs
New NTCWithdrawn NTC
38
9
0.3
16
32
0
10
20
$0
$5
$10
$15
$20
$25
$30
$35
$40
6/1/2019 6/1/2020 6/1/2022
Num
ber
of N
ew U
pg
rad
es
Dol
lars
($M
)
2018 ITPNT UpgradesNeed Year and Total Dollars
Total Dollars Number of Upgrades

Southwest Power Pool, Inc.
2018 ITPNT Assessment 37
Figure 18: 2018 ITPNT Cost Allocation -- Regional v. Zonal
6.4: RATE IMPACTS ON TRANSMISSION CUSTOMERS The projected impact of the project plan on the energy bill of a typical residential customer within the SPP region was calculated and reported on a $/kWh basis. The first step in this process is to estimate the zonal cost allocation of the Annual Transmission Revenue Requirement (ATRR). This cost-allocated ATRR is calculated specifically for the ITPNT upgrades using the ATRR forecast (forecast). The forecast allocated 2018 ITPNT upgrade costs to the zones using the highway/byway cost-allocation method. This method allocates costs to the individual zones and to the region based on the voltage level of the upgrade. Transformer costs were allocated based on the low-side voltage. Regional ATRRs are summed and allocated to the zones based on their individual load ratio share percentages.
Highway Byway Cost Allocation
Voltage (kV) Regional Zonal
300 and above 100% 0%
100 – 299 33% 67%
Below 100 0% 100% Table 8: Highway Byway Cost Allocation
The following inputs and assumptions were required to generate the forecast:
• Initial investment of each upgrade
• TO’s estimated individual annual carrying charge percent
• Voltage level of each upgrade
• In-service year of each upgrade
$15
$32
-$51
-$33-$36
-$1
-$60
-$50
-$40
-$30
-$20
-$10
$0
$10
$20
$30
$40
Regional Zonal
Dol
lars
($M
)2018 ITPNT Cost Allocation
New NTC
Withdrawn NTC
Net Total

Southwest Power Pool, Inc.
2018 ITPNT Assessment 38
• 2.5 percent annual straight-line rate-base depreciation
• 2.5 percent construction price inflation applied to 2018 base-year estimates
• Mid-year in-service convention
The 2018 ITPNT upgrades were evaluated in the SPP Cost Allocation Forecast model and the peak ATRR impact year was shown to be 2022.
Figure 19: ATRR Cost Allocation Forecast by Zone of the 2018 ITPNT
As shown in the following chart, the majority of the 2018 ITPNT projects will be cost allocated to the zone hosting the upgrade with a smaller amount being cost allocated to the SPP region through the regional rate for all years, 2019-2025:
$0.0
$0.2
$0.4
$0.6
$0.8
$1.0
$1.2
$1.4
$1.6
$1.8
$M
SPP ATRR Cost Allocation Forecast by Zone 2018-2024
2018 2019 2020 2021 2022 2023 2024

Southwest Power Pool, Inc.
2018 ITPNT Assessment 39
Figure 20: Zonal and Regional ATRR Allocated in SPP
The peak-year ATRR is converted into a monthly impact on a typical 1000 kWh per month retail residential ratepayer. This is done by dividing the ATRR zonal impact by the zonal energy usage as adjusted for typical losses.
$0.2
$1.2
$2.3$2.5 $2.5 $2.4 $2.3
$0.3
$2.1
$4.5
$5.3 $5.2 $5.0 $4.9
$0.0
$1.0
$2.0
$3.0
$4.0
$5.0
$6.0
2018 2019 2020 2021 2022 2023 2024 2025
ATR
R (
$M/y
r)M
illio
ns2018 ITPNT SPP Zonal and Regional ATRR
Base Plan Reg ATRR Base Plan Zonal ATRR

Southwest Power Pool, Inc.
2018 ITPNT Assessment 40
Figure 21: 2018 ITPNT Net Rate Impacts by Zone11
11 The rate calculation for SPA only includes a portion of the load in that zone. Approximately 20% of the load
takes long-term network service from SPP.
-$0.06
-$0.02
-$0.02
-$0.01
$0.05
-$0.02
-$0.02
-$0.02
-$0.02
-$0.02
-$0.02
$0.17
-$0.02-$0.01
-$0.02
$0.03
$0.00
-$0.09
$0.00
-$0.10
-$0.05
$0.00
$0.05
$0.10
$0.15
$0.20
Est.
Mon
thly
Bill
Incr
ease
2018 ITPNT Net Rate Impacts by Zone 1000 kWh per Month Retail Residential Consumer
(2022$ per month)

Southwest Power Pool, Inc.
2018 ITPNT Assessment 41
SECTION 7: PROJECT DESCRIPTIONS
7.1: FINAL PROJECT PORTFOLIO
NEW LAKEVIEW 69-KV SUBSTATION AND CAPACITOR BANK
Figure 22: New Lakeview 69-kV substation. New 14.4 MVAR switched shunt at Lakeview 69 kV
Low voltages on the transmission system in the area around Madison, South Dakota, are due to 5 radial loads larger than 6 MW on the 69-kV system concentrated in the Madison area. Updates and corrections to load, specifically the city of Madison, were identified at the end of the 2017 ITPNT and were included in the 2018 ITPNT models. These updates are now causing the low voltages in the Madison area, even under system-intact conditions. The recommended project to add a 14.4 MVAR capacitor bank that will raise voltage in the area will require a new substation about 3.5 miles north of the Madison Southeast substation at the Lakeview Motor-Operated-Switch (MOS).

Southwest Power Pool, Inc.
2018 ITPNT Assessment 42
RECONDUCTOR RICHLAND – LEWIS 115-KV
Figure 23: Reconductor 3 miles of 115-kV line from Richland - Lewis
Overloads on the Richland - Lewis & Clark 115-kV line were only identified in the S5 models and are due to power importing from the Miles City DC Tie [~140 megawatts (MW)]. The previous ITPNT assumed power exporting (~135 MW). This change in DC tie flows from export to import resulted in a net change of 270 MW of flow from west to east across the DC tie. The power is flowing north to help feed a major load pocket in North Dakota. The proposed project to reconductor the line, adjust the current transformer (CT) taps to 1200/5 and replace structures as needed increases the line rating.
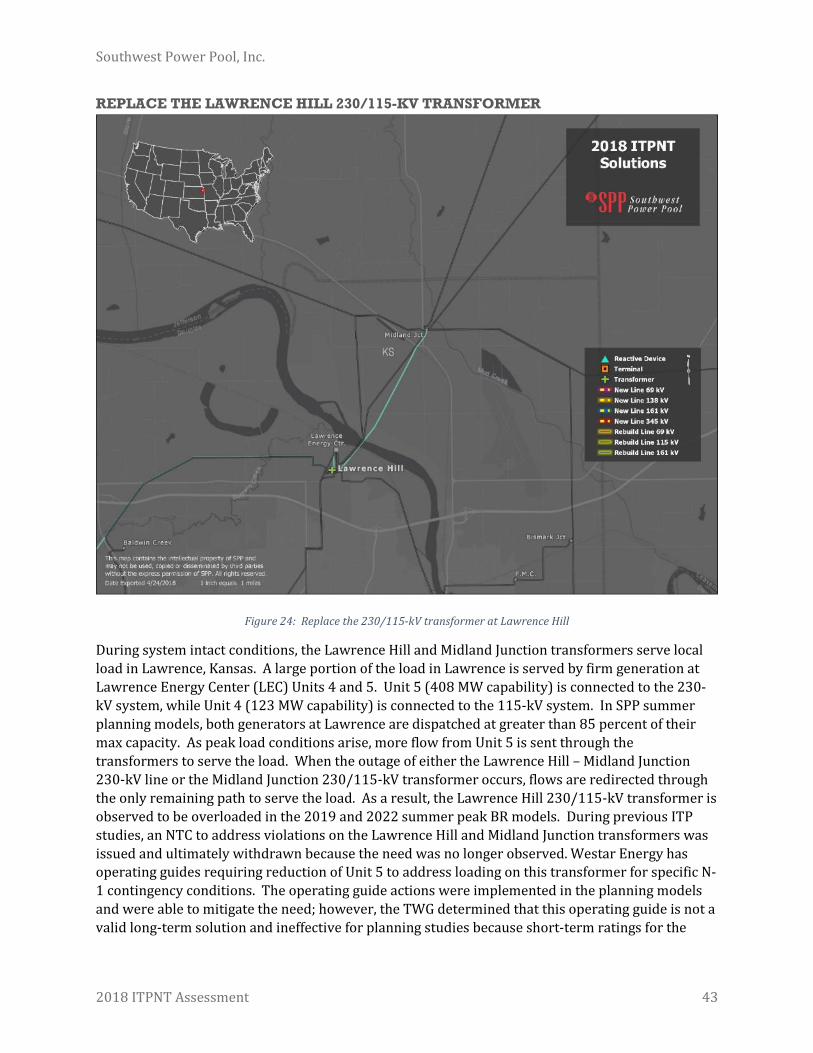
Southwest Power Pool, Inc.
2018 ITPNT Assessment 43
REPLACE THE LAWRENCE HILL 230/115-KV TRANSFORMER
Figure 24: Replace the 230/115-kV transformer at Lawrence Hill
During system intact conditions, the Lawrence Hill and Midland Junction transformers serve local load in Lawrence, Kansas. A large portion of the load in Lawrence is served by firm generation at Lawrence Energy Center (LEC) Units 4 and 5. Unit 5 (408 MW capability) is connected to the 230-kV system, while Unit 4 (123 MW capability) is connected to the 115-kV system. In SPP summer planning models, both generators at Lawrence are dispatched at greater than 85 percent of their max capacity. As peak load conditions arise, more flow from Unit 5 is sent through the transformers to serve the load. When the outage of either the Lawrence Hill – Midland Junction 230-kV line or the Midland Junction 230/115-kV transformer occurs, flows are redirected through the only remaining path to serve the load. As a result, the Lawrence Hill 230/115-kV transformer is observed to be overloaded in the 2019 and 2022 summer peak BR models. During previous ITP studies, an NTC to address violations on the Lawrence Hill and Midland Junction transformers was issued and ultimately withdrawn because the need was no longer observed. Westar Energy has operating guides requiring reduction of Unit 5 to address loading on this transformer for specific N-1 contingency conditions. The operating guide actions were implemented in the planning models and were able to mitigate the need; however, the TWG determined that this operating guide is not a valid long-term solution and ineffective for planning studies because short-term ratings for the

Southwest Power Pool, Inc.
2018 ITPNT Assessment 44
facilities in violation are not included in the operating guide. As a result, the proposed project is to replace the existing 230/115-kV transformer at Lawrence Hill with a larger transformer.

Southwest Power Pool, Inc.
2018 ITPNT Assessment 45
NEW BLUE VALLEY – CROSSTOWN 161-KV LINE
Figure 25: Construct a new 5.6-mile, 161-kV line from Blue Valley – Crosstown
In June 2017, Kansas City Power & Light (KCPL) announced the retirement of six units at three power plants12. The retirements of two units at Montrose and three units at Sibley, totaling 340 MW and 463 MW respectively, are set to be effective by Dec. 31, 2018. Due to these retirements, there are units being dispatched in the 2018 ITPNT models that historically have not been. Specifically, the units at Northeast Station are dispatched and create additional north-to-south flow through Kansas City. Overloads on the 161-kV system on the north side of Kansas City were identified for the loss of either the Northeast – Grand Avenue – Navy 161-kV line or the Northeast – Grand Avenue West 161-kV lines that provide a large portion of outlet for the Northeast Station plant. The proposed project is to construct a new 161-kV line from Crosstown to Blue Valley. This project will create a new feed onto the 161-kV system to the south and relieve loading on the 161-kV lines Northeast – Grand Avenue, Grand Avenue – Navy, and Navy – Crosstown. Several alternative 12 https://www.kcpl.com/about-kcpl/media-center/2017/june/kcpl-continues-sustainability-commitment-by-announcing-retirement-of-six-units-at-three-power-plants

Southwest Power Pool, Inc.
2018 ITPNT Assessment 46
projects were considered, including rebuilds of the overloaded lines, a new 161-kV line from Navy to the North Kansas City bus, as well as utilizing an existing operating guide. These options requiring construction of new transmission were determined to be infeasible due to the lack of available space in the substations at Navy and Grand Avenue, as well as added challenges and cost to perform major work on the existing lines because they are underground. Implementation of the actions in the operating guide mitigates the need; however, the TWG determined this operating guide is not a valid long-term solution and ineffective due to multiple factors identified by KCPL. The justification provided by KCPL was that the operating guide does not specify an emergency rating, usage of the operating guide would result in a single feed into the high load downtown Kansas City area, as well as operational issues due to loop flows in this area when neighboring utilities are importing regardless of the generation output from the Northeast units.

Southwest Power Pool, Inc.
2018 ITPNT Assessment 47
REPLACE TERMINAL EQUIPMENT ON OLATHE – SWITZER 161-KV AND BROOKRIDGE – OVERLAND PARK 161-KV
Figure 26: Replace terminal equipment on the 161-kV line from Olathe – Switzer / Replace terminal equipment on the 161-
kV line from Brookridge – Overland Park
In the 2019 and 2022 summer cases, the Olathe – Switzer 161-kV and Brookridge – Overland Park 161-kV lines overload for the loss of each other. In previous studies, these lines were rated 557/557 MVA but were de-rated in the 2018 ITPNT models to 348/348 MVA. The limiting element on the Olathe - Switzer line are the CTs at the Olathe sub, so the project being selected is to replace the CTs to achieve a higher rating. The limiting element on the Overland Park – Brookridge line is the 1200 amp breaker switches at the Overland Park sub, so the project being selected is to replace the breaker switches to achieve a higher rating.

Southwest Power Pool, Inc.
2018 ITPNT Assessment 48
NEW BROOKLINE 345-KV REACTOR
Figure 27: New 50 MVAR switched shunt at Brookline 345 kV. Brookline 345-kV Substation expansion
In real-time operations during lightly loaded seasons, SPP persistently identifies high-voltage issues on the 345-kV transmission system around the Brookline substation in southern Missouri. Agreements have been in place between AECI, City Utilities of Springfield (CU) and American Electric Power (AEP) to reconfigure the transmission system to avoid high voltage since the line existed due to the absence of transmission options. Two occurrences of the historical high voltage were captured in a model and previously studied during the 2016 JCSP with AECI. The 50 MVAR switched shunt reactor proposed to address the high voltage was reaffirmed in the 2018 ITPNT assessment.

Southwest Power Pool, Inc.
2018 ITPNT Assessment 49
REBUILD NIXA DOWNTOWN – NIXA ESPY 69-KV
Figure 28: Rebuild 1.25 miles of 69- kV line from Nixa Downtown – Nixa Espy
Near the city of Nixa, Missouri, the Nixa Downtown - Nixa Espy 69-kV line overloads for the loss of the James River 5 unit just south of Springfield, Missouri. This generating plant provides counterflow on the 69-kV system against flows from the 161-kV system stepping down just to the west. This overload was placed under additional scrutiny because it was only identified in the BA model scenario.13 Based on information provided by CUS at the Engineering Planning Summit and data submitted for the 2019 ITP assessment, the remaining steam gas units (4 and 5) at the James River plant will be retired by early 2019. To support issues expected by CUS, a second James River 161/69-kV transformer will be installed and the 69-kV bus will be split by a normally open breaker. These upgrades and the retirement expectations were not included as an assumption in the 2018 ITPNT model set. The second James River 161/69-kV autotransformer was tested and found to reduce the overloads in the 2018 ITPNT model set but does not solve all the issues, which are expected to get worse under any scenario with the unit retirements. While alternative projects
13 See Section 5.2 for a discussion on the concerns with the BA model scenario.

Southwest Power Pool, Inc.
2018 ITPNT Assessment 50
were considered, such as a new 69-kV line from Nixa Tracker to AECI’s Jamesville substation, the preferred project was ultimately found to be to rebuild the Nixa Downtown – Nixa Espy 69-kV line.

Southwest Power Pool, Inc.
2018 ITPNT Assessment 51
REBUILD FIGURE FIVE – VBI NORTH 69-KV
Figure 29: Rebuild 4.2 miles of 69-kV line from Figure Five – VBI North
In the 2019 and 2022 summer BA cases, the Van Buren (VBI) North – Figure Five-69kV line overloads for the loss of the Chamber Springs – Clarksville 345-kV line. These overloads are due to the generation dispatch in the BA series of models as well as a slight increase in load in the area to the north. The VBI North – Figure Five is loaded at 99 percent in the scenario 0 model and appears to be an issue in future models. The project selected is to rebuild the VBI North – Figure Five 69-kV line, including an upgrade of Arkansas Electric Cooperative Corporations (AECC) station conductor at VBI North to achieve a higher rating.

Southwest Power Pool, Inc.
2018 ITPNT Assessment 52
NEW MCDOWELL 230-KV SUBSTATION AND TRANSFORMER
Figure 30: McDowell 230/115-kV Transformer and Substation
The load at Rita Blanca's Stokes and Sheldon (RBSS) substation previously was analyzed through SPP’s Attachment AQ delivery-point study process and included in the base model sets. The forecast for the load, primarily oil and gas, has since increased and is now causing low voltage on the 115-kV system north of Nichols when the source from Moore is lost. Initially, a capacitor bank at Dumas was evaluated to raise the system voltage under the Moore – RBSS 115-kV contingency. While this solution was sufficient to address the low voltages defined as needs in this assessment, additional investigation was performed to determine if this was the best long-term solution since the size of capacitor bank necessary to withstand any additional load growth would have been large. It was determined that the better long-term solution was to provide a new source by building a new substation where the Moore – Potter 230-kV line and Exell Tap – Fain 115-kV line cross and installing a step-down transformer. This solution is able to support additional load growth and limits the length of the radial 115-kV line created under the Moore – RBSS outage.

Southwest Power Pool, Inc.
2018 ITPNT Assessment 53
REPLACE TERMINAL EQUIPMENT ON CARLISLE – MURPHY 115-KV
Figure 31: Replace terminal equipment on the 115-kV line from Carlisle – Murphy
A small 115-kV network near Lubbock, Texas, serves load at multiple delivery points. Loads along the 115-kV line from the west at Carlisle to the Allen sub on the south have increased slightly from previous summer peak forecasts. When the feed from the east between Allen and Lubbock South is lost, the load becomes radially served from the west, causing a slight overload on the Carlisle-to-Murphy line. Replacing terminal equipment on this line is sufficient to address the violation.

Southwest Power Pool, Inc.
2018 ITPNT Assessment 54
REPLACE TERMINAL EQUIPMENT ON CLAUENE – TERRY COUNTY 115-KV
Figure 32: Replace terminal equipment on the 115-kV line at Clauene
The Texas panhandle experiences high north-to-south flows under high-wind, low-load conditions, serving a portion of the load in the south down into New Mexico with wind from north of the SPS system. Under these system conditions, much of the conventional generation to the south is offline compared to higher load conditions. The Clauene - Terry-County 115-kV line is in the middle of the north-south corridor and begins to overload when it has to pick up additional flows from the loss of the Wolfforth - Terry County 115-kV line or the Sundown - Amoco 230-kV line. This issue was further aggravated by a more accurate change in assumptions for the light load model in this study that resulted in the solar generation to the south, which was providing counterflow in previous studies, being turned offline. Replacing terminal equipment on the Clauene – Terry County line is sufficient to address the overload.

Southwest Power Pool, Inc.
2018 ITPNT Assessment 55
REPLACE THE SUNDOWN 230/115-KV TRANSFORMER
Figure 33: Replace the 230/115-kV transformer at Sundown
Much of the load on the 115-kV and 69-kV systems in the southern part of the Texas panhandle near Sundown is served through the 230-kV transformers at Lamb County, Sundown and Yoakum. When loads are high in the summer peak and the source from Lamb County is lost or the 115-kV loop is severed between Lea County Plains and Yoakum, the Sundown transformer becomes overloaded. This project is an alternative for the Dean Interchange project under re-evaluation that would have created a new 230-kV source in the area. It was selected because it is less costly, performs better, the load forecast in the surrounding area has remained stagnant and the existing transformer is rated well below the standard 230/115-kV transformers in the SPS zone.

Southwest Power Pool, Inc.
2018 ITPNT Assessment 56
7.2 SOUTH-CENTRAL OKLAHOMA LOW VOLTAGES The load forecast for the member cooperatives of Western Farmers in south-central Oklahoma has increased from the 2017 ITPNT projections. The initial needs assessment produced significant base-case low voltages in all seasons that only worsened when the line from Caney Creek – Texoma Junction 138 kV was lost. During the solution evaluation phase of the study, it was identified that the power factors of the loads in Red River Valley Electric Cooperatives were incorrect. This update resolved the base-case low-voltage violations, but the violations are still present under contingency. Based on new information from Western Farmers, further analysis will be needed based on the most recent forecast and model corrections for this area. In order to determine the best solution for this area, Western Farmers will need to resolve the modeling concerns in a future study. In the interim, Western Farmers has agreed to provide mitigations for the observed 2018 ITPNT low voltages in this area.
7.3 FINAL RELIABILITY ASSESSMENT All projects in the 2018 ITPNT portfolio were incorporated into the powerflow models and a steady state N-1 contingency analysis of equivalent scope to the analysis described in Section 5 of this document was performed to see if the selected projects caused any new reliability issues. Some needs appeared in the East River area, but those needs were mitigated through a transformer tap change. Therefore, the final reliability assessment showed no needs caused by portfolio projects that would require additional construction.

Southwest Power Pool, Inc.
2018 ITPNT Assessment 57
SECTION 8: 2018 ITPNT PROJECT LIST
The 2018 ITPNT project list is posted as a separate document at the following location: https://www.spp.org/engineering/transmission-planning/