Embed Size (px)
Citation preview

2018 Insurance Market Briefing -Germany
Hotel Pullman, Cologne – 27 September 2018
2018 Insurance Market Briefing - Germany
Welcome
Nick Charteris-BlackManaging Director, Market Development – EMEA
William MillsDirector, Market Development
Brexit
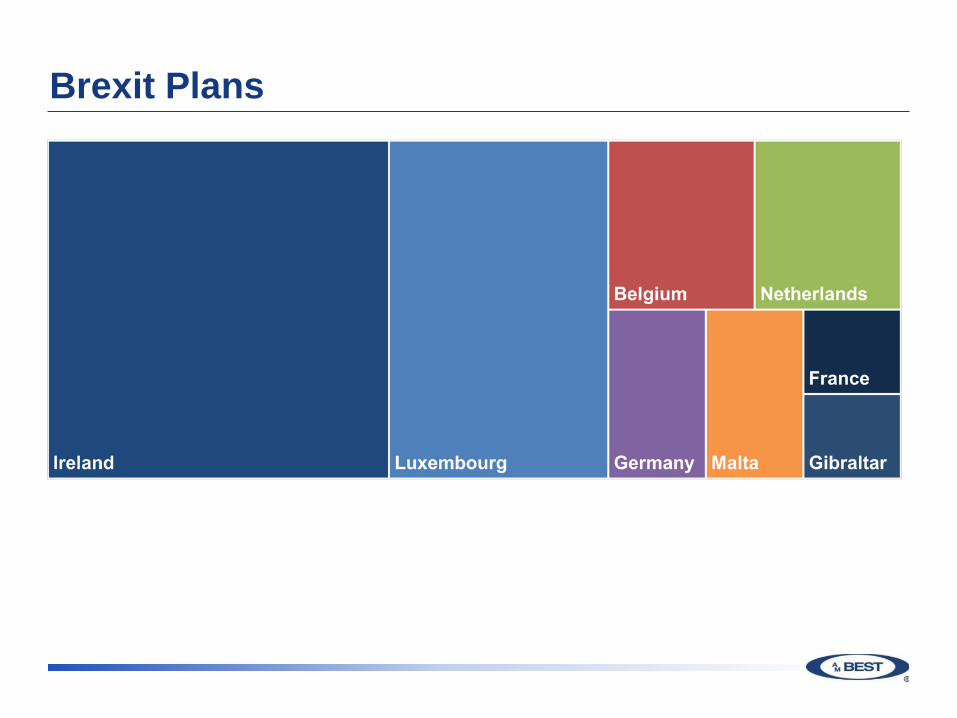
Brexit Plans
Brexit
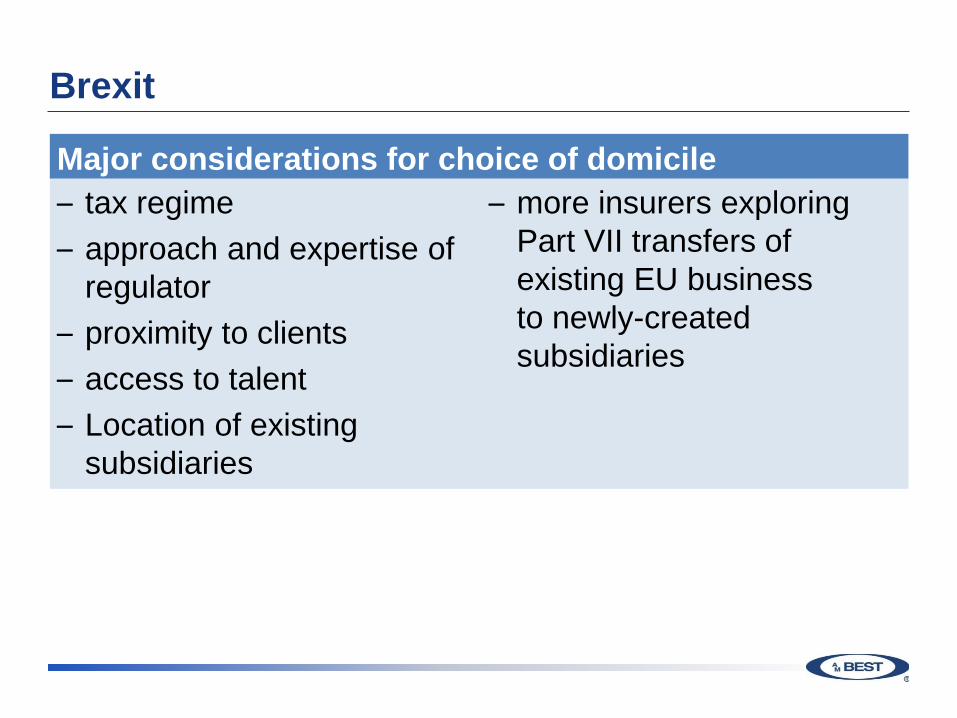
Major considerations for choice of domicile– tax regime– approach and expertise of
regulator– proximity to clients– access to talent– Location of existing
subsidiaries
– more insurers exploring Part VII transfers of existing EU businessto newly-created subsidiaries
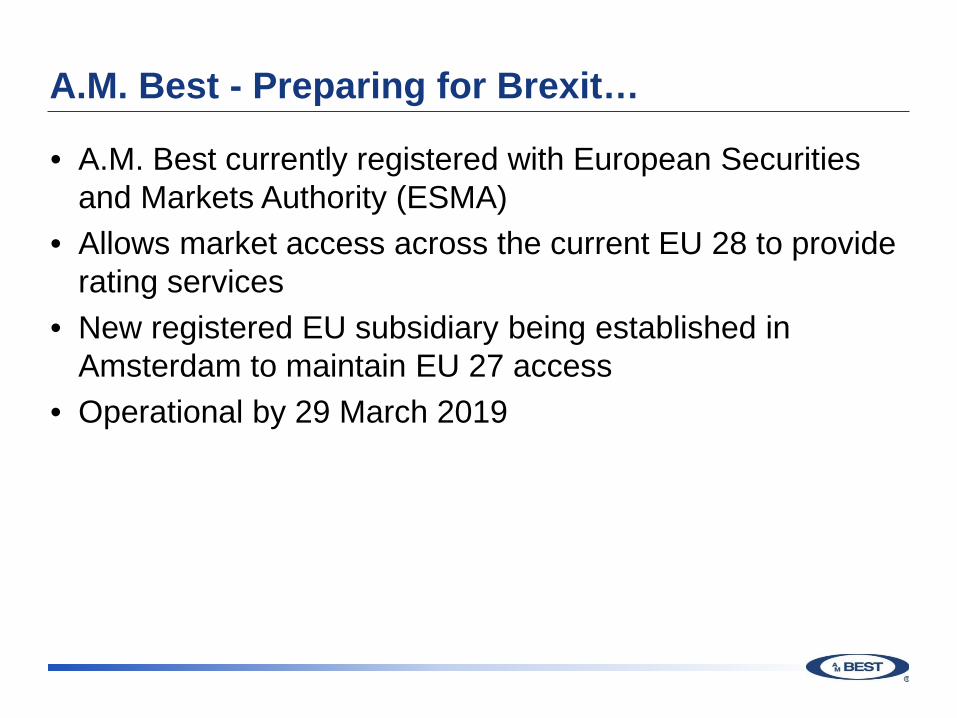
A.M. Best - Preparing for Brexit…
• A.M. Best currently registered with European Securities and Markets Authority (ESMA)
• Allows market access across the current EU 28 to provide rating services
• New registered EU subsidiary being established in Amsterdam to maintain EU 27 access
• Operational by 29 March 2019
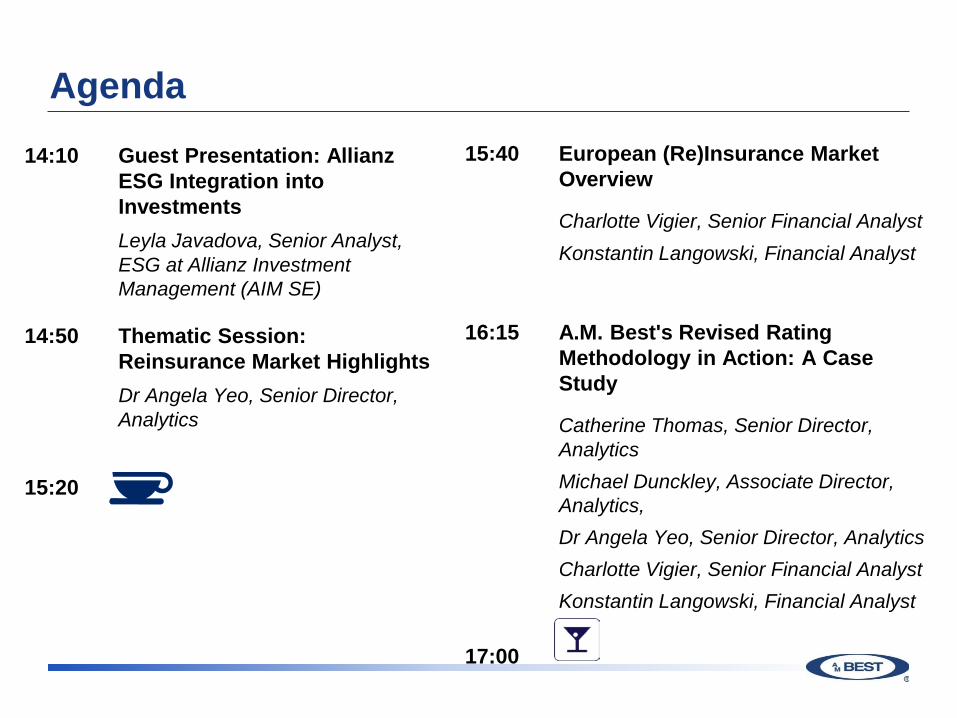
Agenda14:10 Guest Presentation: Allianz
ESG Integration into InvestmentsLeyla Javadova, Senior Analyst, ESG at Allianz Investment Management (AIM SE)
14:50 Thematic Session: Reinsurance Market HighlightsDr Angela Yeo, Senior Director, Analytics
15:20
15:40 European (Re)Insurance Market Overview
Charlotte Vigier, Senior Financial AnalystKonstantin Langowski, Financial Analyst
16:15 A.M. Best's Revised Rating Methodology in Action: A Case Study
Catherine Thomas, Senior Director, AnalyticsMichael Dunckley, Associate Director, Analytics,Dr Angela Yeo, Senior Director, AnalyticsCharlotte Vigier, Senior Financial AnalystKonstantin Langowski, Financial Analyst
17:00
Disclaimer © AM Best Company (AMB) and/or its licensors and affiliates. All rights reserved. ALL INFORMATION CONTAINED HEREIN ISPROTECTED BY COPYRIGHT LAW AND NONE OF SUCH INFORMATION MAY BE COPIED OR OTHERWISEREPRODUCED, REPACKAGED, FURTHER TRANSMITTED, TRANSFERRED, DISSEMINATED, REDISTRIBUTED ORRESOLD, OR STORED FOR SUBSEQUENT USE FOR ANY SUCH PURPOSE, IN WHOLE OR IN PART, IN ANY FORM ORMANNER OR BY ANY MEANS WHATSOEVER, BY ANY PERSON WITHOUT AMB’s PRIOR WRITTEN CONSENT. Allinformation contained herein is obtained by AMB from sources believed by it to be accurate and reliable. Because of thepossibility of human or mechanical error as well as other factors, however, all information contained herein is provided “AS IS”without warranty of any kind. Under no circumstances shall AMB have any liability to any person or entity for (a) any loss ordamage in whole or in part caused by, resulting from, or relating to, any error (negligent or otherwise) or other circumstance orcontingency within or outside the control of AMB or any of its directors, officers, employees or agents in connection with theprocurement, collection, compilation, analysis, interpretation, communication, publication or delivery of any such information, or(b) any direct, indirect, special, consequential, compensatory or incidental damages whatsoever (including without limitation, lostprofits), even if AMB is advised in advance of the possibility of such damages, resulting from the use of or inability to use, anysuch information. The credit ratings, financial reporting analysis, projections, and other observations, if any, constituting part ofthe information contained herein are, and must be construed solely as, statements of opinion and not statements of fact orrecommendations to purchase, sell or hold any securities, insurance policies, contracts or any other financial obligations, nordoes it address the suitability of any particular financial obligation for a specific purpose or purchaser. Credit risk is the risk thatan entity may not meet its contractual, financial obligations as they come due. Credit ratings do not address any other risk,including but not limited to, liquidity risk, market value risk or price volatility of rated securities. NO WARRANTY, EXPRESS ORIMPLIED, AS TO THE ACCURACY, TIMELINESS, COMPLETENESS, MERCHANTABILITY OR FITNESS FOR ANYPARTICULAR PURPOSE OF ANY SUCH RATING OR OTHER OPINION OR INFORMATION IS GIVEN OR MADE BY AMB INANY FORM OR MANNER WHATSOEVER. Each credit rating or other opinion must be weighed solely as one factor in anyinvestment or purchasing decision made by or on behalf of any user of the information contained herein, and each such usermust accordingly make its own study and evaluation of each security or other financial obligation and of each issuer andguarantor of, and each provider of credit support for, each security or other financial obligation that it may consider purchasing,holding or selling.
Disclaimer US Securities Laws explicitly prohibit the issuance or maintenance of a credit rating where a person involvedin the sales or marketing of a product or service of the CRA also participates in determining or monitoring thecredit rating, or developing or approving procedures or methodologies used for determining the credit rating.
No part of this presentation amounts to sales / marketing activity and A.M. Best’s Rating Divisionemployees are prohibited from participating in commercial discussions.
Any queries of a commercial nature should be directed to A.M. Best’s Market Development function.
© Copyright Allianz SE
Allianz Investment Management SE
Leyla Javadova
September 2018
ALLIANZ ESGINTEGRATION INTOINVESTMENTS
© Copyright Allianz SE
CONTENT
11
ALLIANZ CORPORATE RESPONSIBILITY AT A GLANCE
ABOUT AIM SE
AIM ESG APPROACH
© Copyright Allianz SE 12
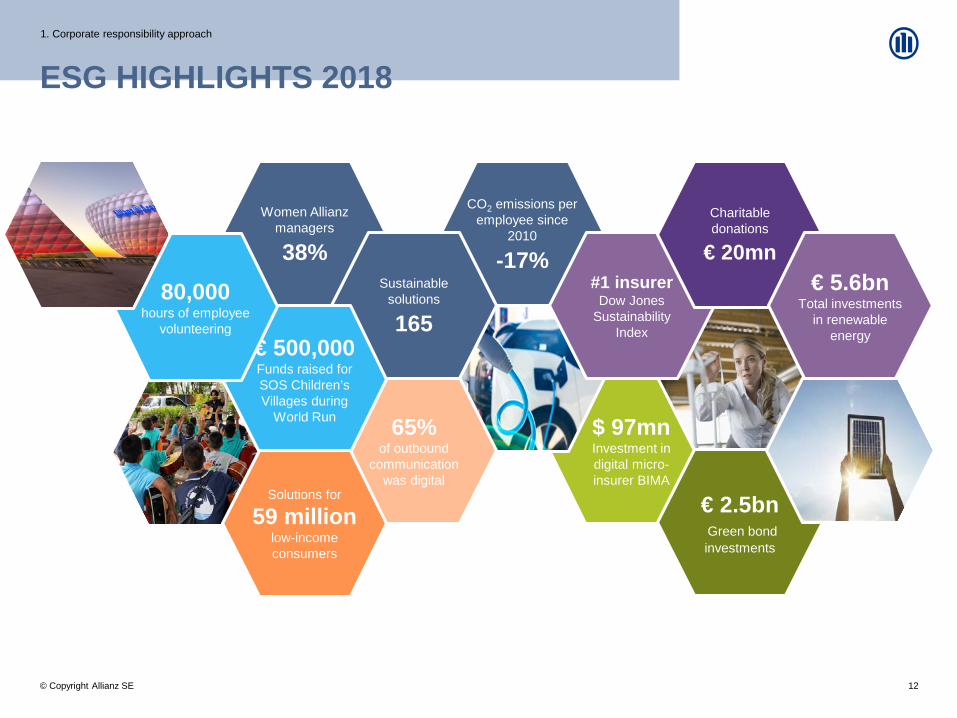
Women Allianz managers
38%
$ 97mnInvestment in digital micro-insurer BIMA
CO2 emissions per employee since
2010
-17%
65%of outbound
communication was digital
Sustainable solutions
165€ 500,000Funds raised for SOS Children’s Villages during
World Run
#1 insurerDow Jones
Sustainability Index
€ 2.5bnGreen bond investments
Solutions for
59 million low-income consumers
80,000hours of employee
volunteering
Charitable donations
€ 20mn€ 5.6bn
Total investments in renewable
energy
ESG HIGHLIGHTS 20181. Corporate responsibility approach
© Copyright Allianz SE 13
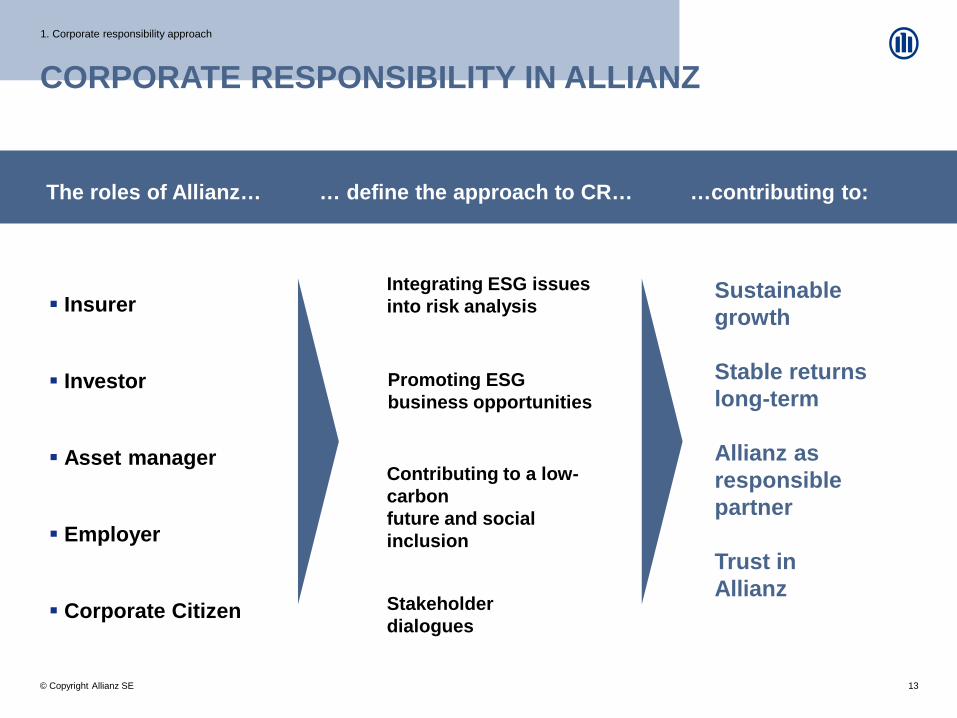
CORPORATE RESPONSIBILITY IN ALLIANZ1. Corporate responsibility approach
Integrating ESG issuesinto risk analysis
Promoting ESG business opportunities
Contributing to a low-carbonfuture and social inclusion
Stakeholder dialogues
Insurer
Investor
Asset manager
Employer
Corporate Citizen
The roles of Allianz… … define the approach to CR… …contributing to:
Sustainable growth
Stable returns long-term
Allianz as responsible partner
Trust in Allianz
© Copyright Allianz SE 14
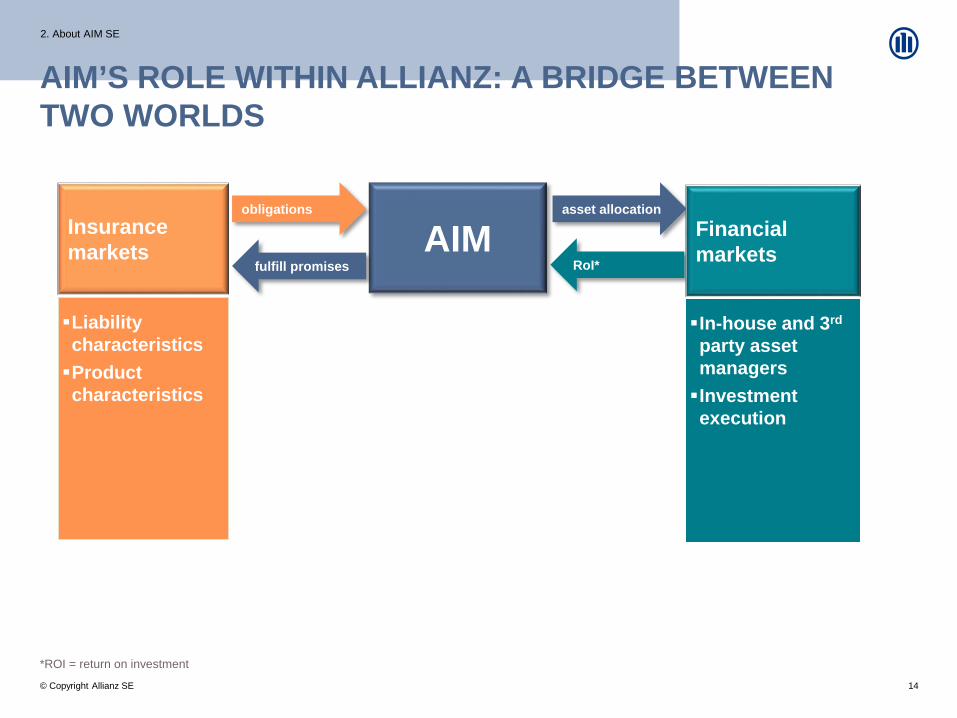
AIM’S ROLE WITHIN ALLIANZ: A BRIDGE BETWEEN TWO WORLDS
2. About AIM SE
AIM
In-house and 3rd
party asset managersInvestment execution
Liability characteristicsProduct characteristics
obligations asset allocation
fulfill promises RoI*
Insurancemarkets
Financialmarkets
*ROI = return on investment
© Copyright Allianz SE 15
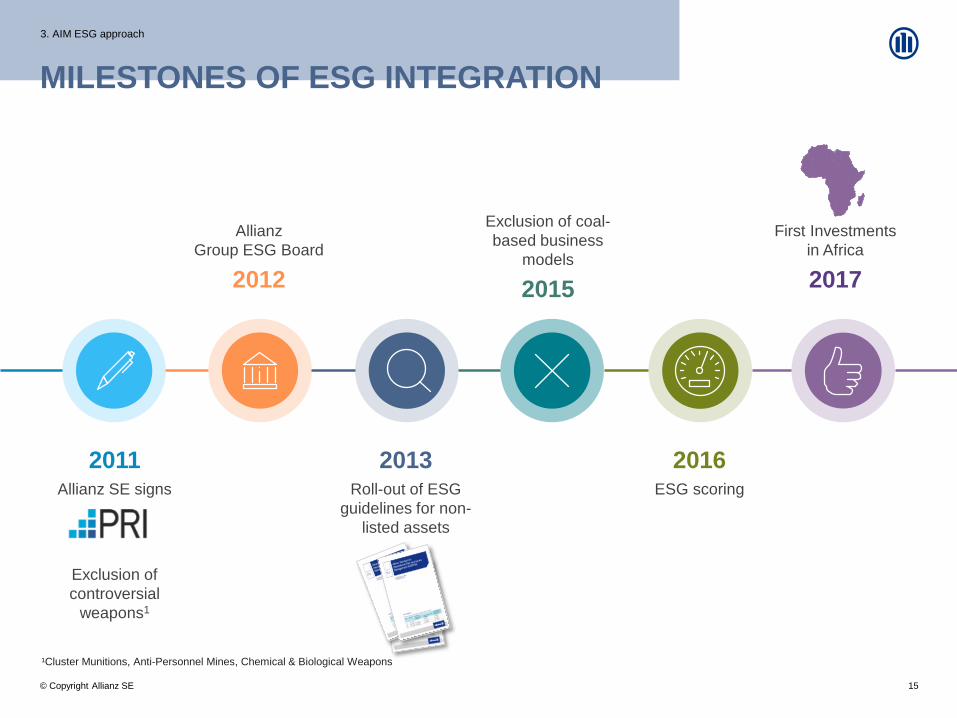
MILESTONES OF ESG INTEGRATION3. AIM ESG approach
Organization
2011Allianz SE signs
Exclusion of controversial
weapons1
2013Roll-out of ESG
guidelines for non-listed assets
2016ESG scoring
Allianz Group ESG Board
2012
Exclusion of coal-based business
models
2015
First Investments in Africa
2017
¹Cluster Munitions, Anti-Personnel Mines, Chemical & Biological Weapons
© Copyright Allianz SE 16
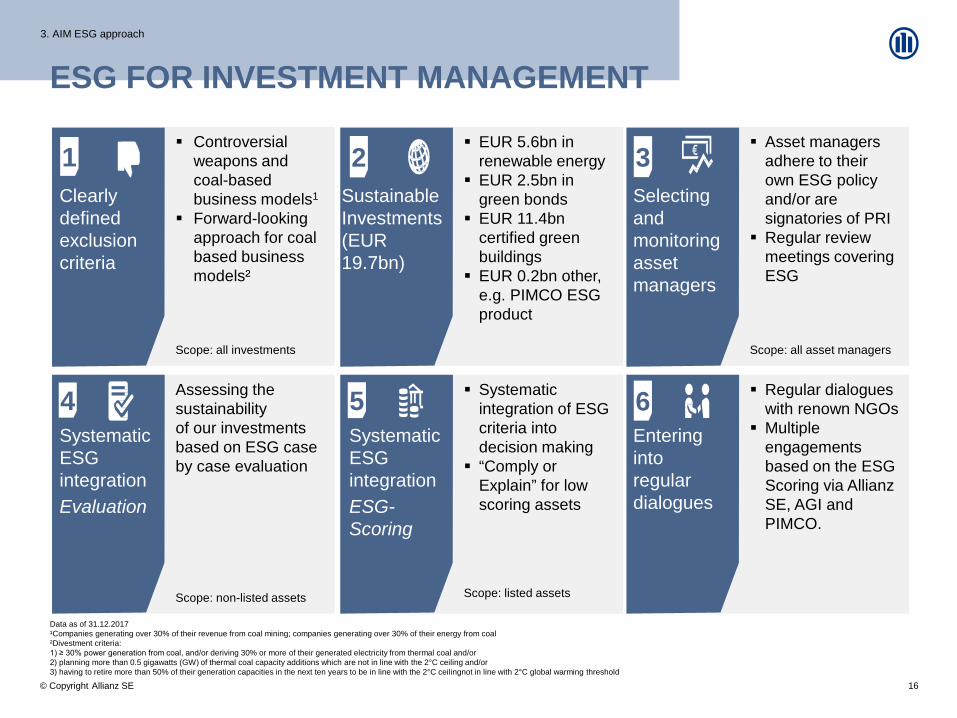
ESG FOR INVESTMENT MANAGEMENT3. AIM ESG approach
Controversial weapons and coal-based business models1
Forward-looking approach for coal based business models²
Scope: all investments
Assessing the sustainabilityof our investments based on ESG case by case evaluation
Scope: non-listed assets
Asset managers adhere to their own ESG policy and/or are signatories of PRI
Regular review meetings covering ESG
Scope: all asset managers
Regular dialogues with renown NGOs
Multiple engagements based on the ESG Scoring via Allianz SE, AGI and PIMCO.
Systematic integration of ESG criteria into decision making
“Comply or Explain” for low scoring assets
Scope: listed assets
Systematic ESG integrationEvaluation
Selecting and monitoring asset managers
3Clearly defined exclusion criteria
1
Entering into regular dialogues
64
EUR 5.6bn in renewable energy
EUR 2.5bn in green bonds
EUR 11.4bn certified green buildings
EUR 0.2bn other, e.g. PIMCO ESG product
Sustainable Investments(EUR 19.7bn)
2
Systematic ESG integrationESG-Scoring
5
Data as of 31.12.2017¹Companies generating over 30% of their revenue from coal mining; companies generating over 30% of their energy from coal²Divestment criteria:1) ≥ 30% power generation from coal, and/or deriving 30% or more of their generated electricity from thermal coal and/or2) planning more than 0.5 gigawatts (GW) of thermal coal capacity additions which are not in line with the 2°C ceiling and/or3) having to retire more than 50% of their generation capacities in the next ten years to be in line with the 2°C ceilingnot in line with 2°C global warming threshold
© Copyright Allianz SE 17
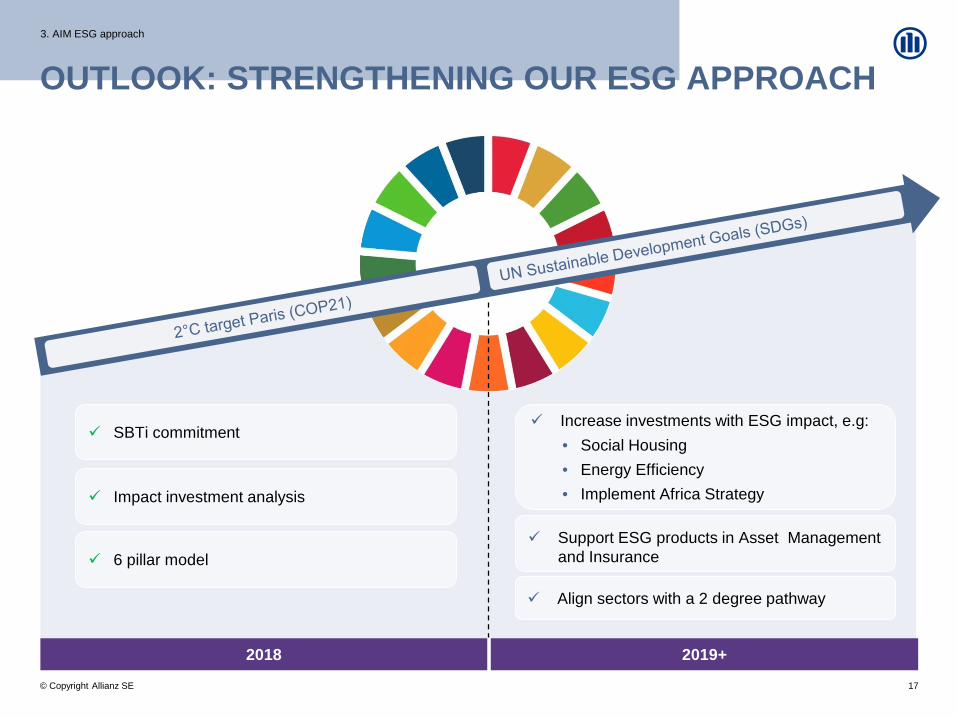
OUTLOOK: STRENGTHENING OUR ESG APPROACH
SBTi commitment
2018 2019 +
3. AIM ESG approach
2019+
Impact investment analysis
6 pillar model
Increase investments with ESG impact, e.g:• Social Housing• Energy Efficiency• Implement Africa Strategy
Support ESG products in Asset Management and Insurance
Align sectors with a 2 degree pathway

© Copyright Allianz SE 18
THANK YOU!4. Thank you
QUESTIONS?
2018 Insurance Market Briefing - Germany
Thematic Session: Reinsurance Market Highlights
Dr Angela YeoSenior Director, Analytics
2018 Insurance Market Briefing - Germany
2018 Überblick über den globalen Rückversicherungsmarkt
Dr. Angela YeoSenior Director, Analytics
Discussion Outline
Global Reinsurance Results and Trends
Global Reinsurance Market Capacity
Global Reinsurance Market Evolution
Global Reinsurance Sector Outlook
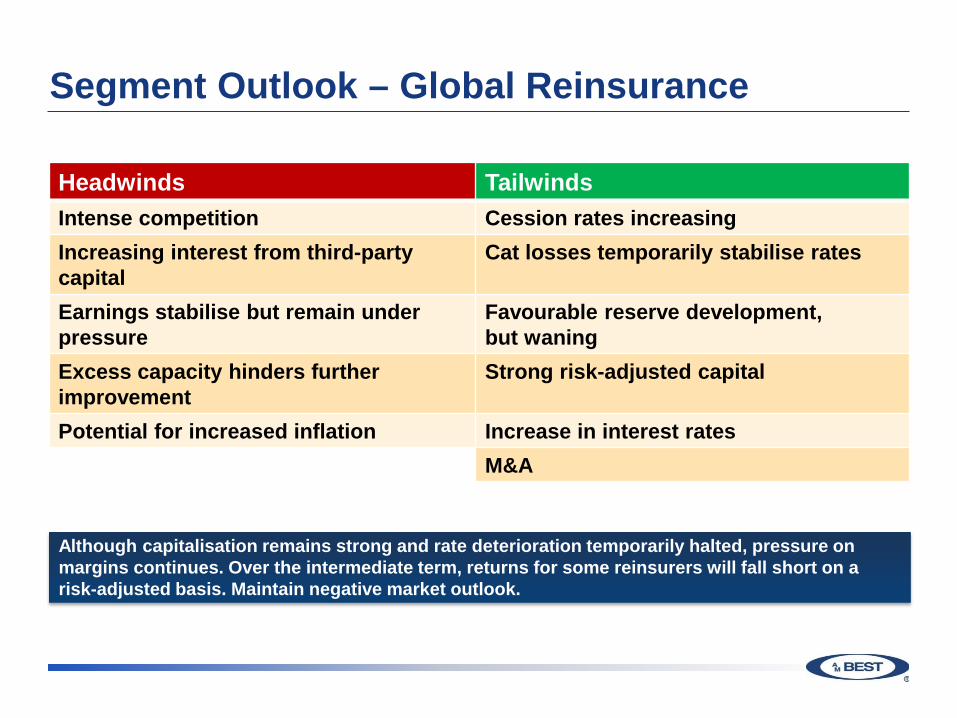
Segment Outlook – Global Reinsurance
Headwinds TailwindsIntense competition Cession rates increasingIncreasing interest from third-party capital
Cat losses temporarily stabilise rates
Earnings stabilise but remain under pressure
Favourable reserve development,but waning
Excess capacity hinders further improvement
Strong risk-adjusted capital
Potential for increased inflation Increase in interest ratesM&A
Although capitalisation remains strong and rate deterioration temporarily halted, pressure on margins continues. Over the intermediate term, returns for some reinsurers will fall short on a risk-adjusted basis. Maintain negative market outlook.
Global ReinsuranceResults and Trends
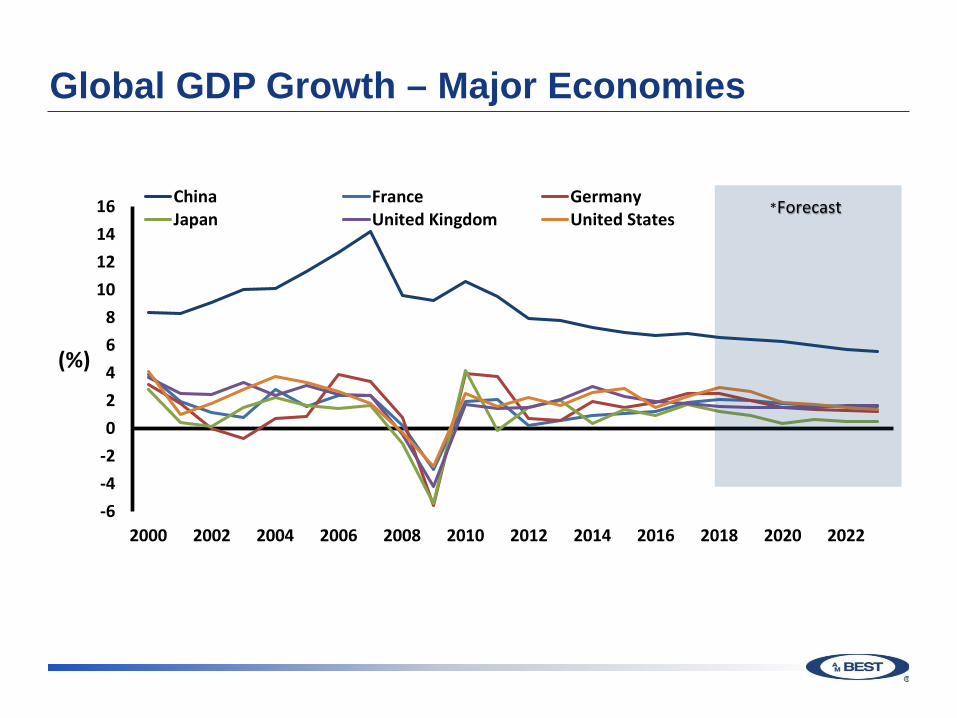
Global GDP Growth – Major Economies
-6-4-202468
10121416
2000 2002 2004 2006 2008 2010 2012 2014 2016 2018 2020 2022
(%)
China France GermanyJapan United Kingdom United States
*Forecast
Global Reinsurance Market Trends
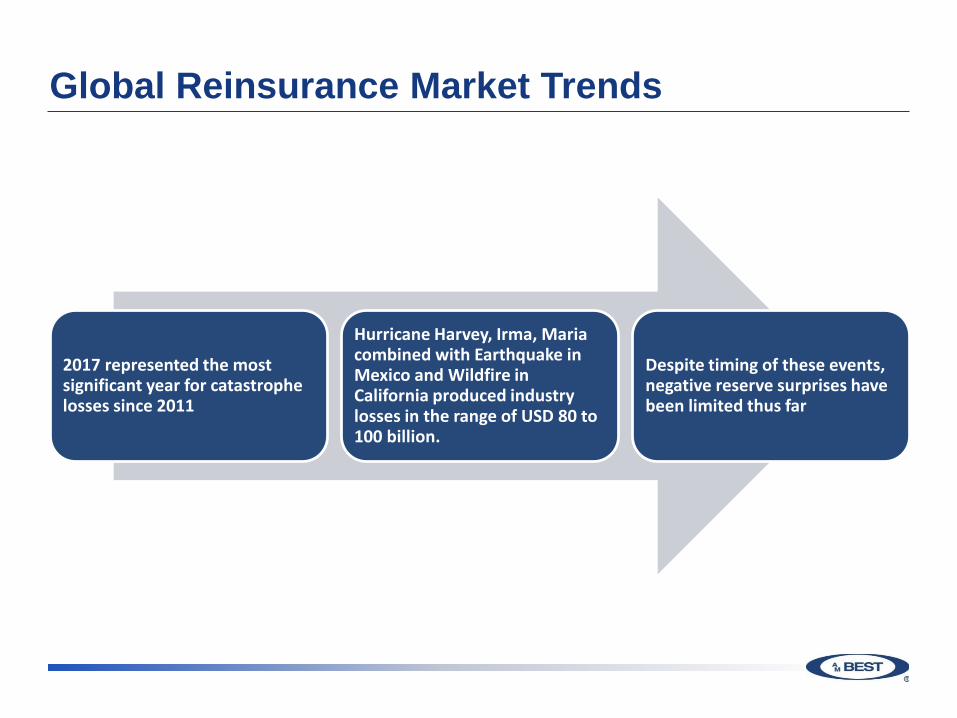
2017 represented the most significant year for catastrophe losses since 2011
Hurricane Harvey, Irma, Maria combined with Earthquake in Mexico and Wildfire in California produced industry losses in the range of USD 80 to 100 billion.
Despite timing of these events, negative reserve surprises have been limited thus far
Global Reinsurance Market Trends
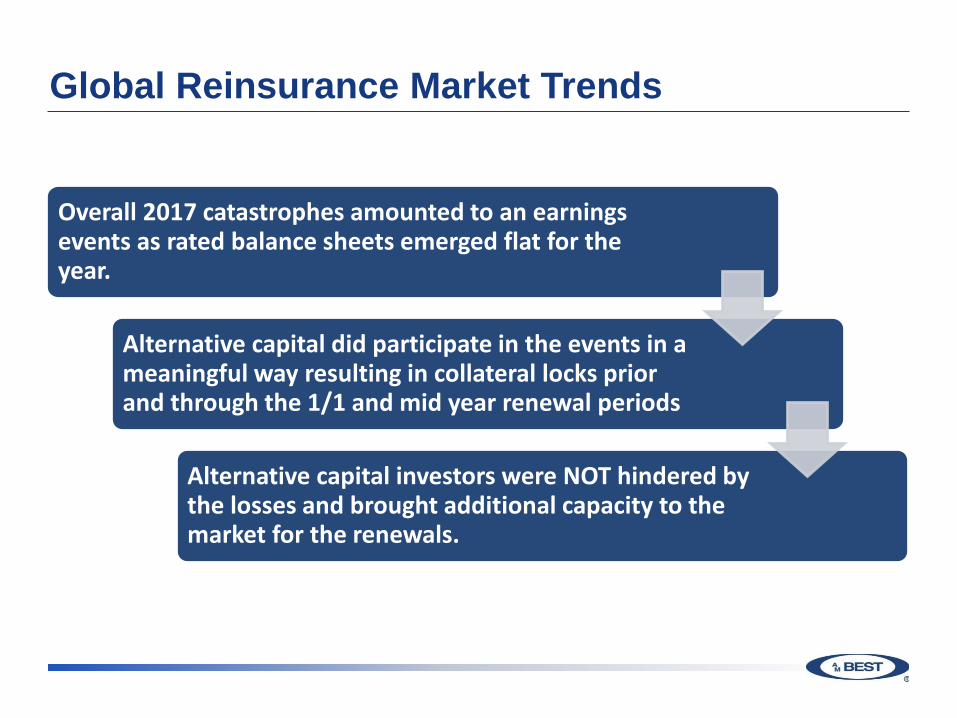
Overall 2017 catastrophes amounted to an earnings events as rated balance sheets emerged flat for the year.
Alternative capital did participate in the events in a meaningful way resulting in collateral locks prior and through the 1/1 and mid year renewal periods
Alternative capital investors were NOT hindered by the losses and brought additional capacity to the market for the renewals.
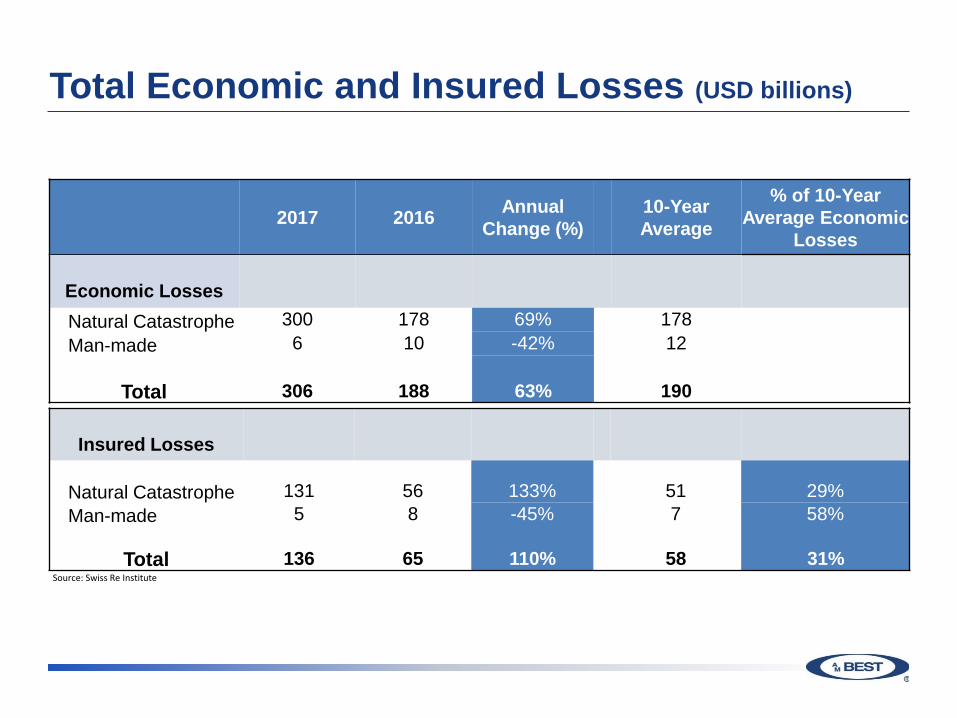
Total Economic and Insured Losses (USD billions)
Source: Swiss Re Institute
2017 2016 Annual Change (%)
10-YearAverage
% of 10-Year Average Economic
Losses
Economic LossesNatural Catastrophe 300 178 69% 178Man-made 6 10 -42% 12
Total 306 188 63% 190
Insured Losses
Natural Catastrophe 131 56 133% 51 29%Man-made 5 8 -45% 7 58%
Total 136 65 110% 58 31%
Global Reinsurance Market Trends
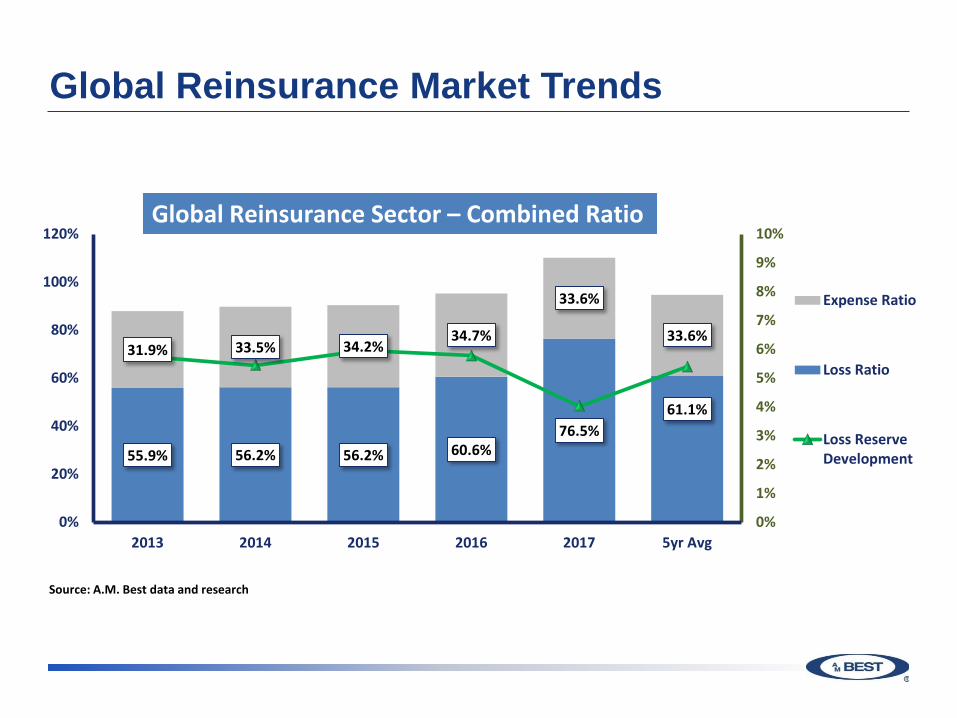
55.9% 56.2% 56.2% 60.6%76.5%
61.1%
31.9% 33.5% 34.2%34.7%
33.6%
33.6%
0%
1%
2%
3%
4%
5%
6%
7%
8%
9%
10%
0%
20%
40%
60%
80%
100%
120%
2013 2014 2015 2016 2017 5yr Avg
Expense Ratio
Loss Ratio
Loss ReserveDevelopment
Source: A.M. Best data and research
Global Reinsurance Sector – Combined Ratio
Global Reinsurance Market Trends
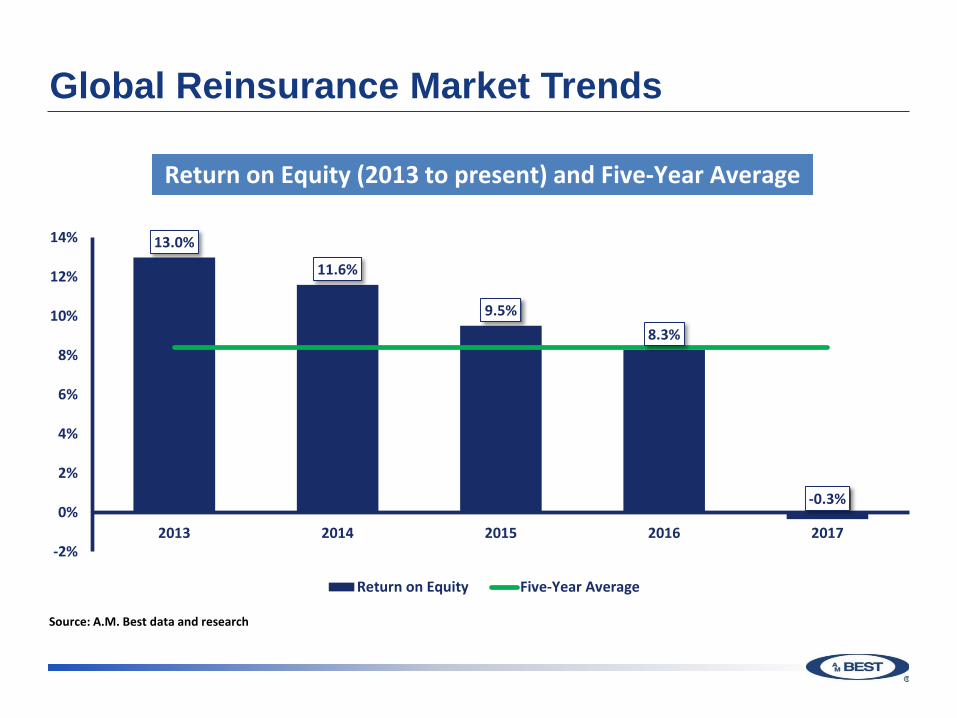
13.0%
11.6%
9.5%8.3%
-0.3%
-2%
0%
2%
4%
6%
8%
10%
12%
14%
2013 2014 2015 2016 2017
Return on Equity Five-Year Average
Source: A.M. Best data and research
Return on Equity (2013 to present) and Five-Year Average
Global Reinsurance Market Trends
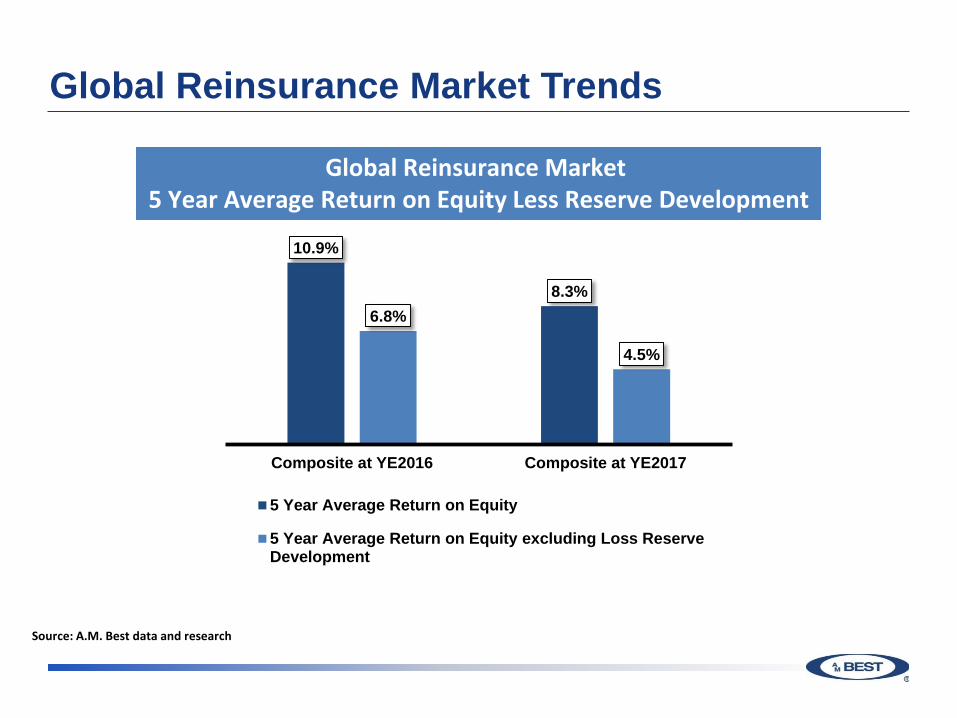
Global Reinsurance Market 5 Year Average Return on Equity Less Reserve Development
Source: A.M. Best data and research
10.9%
8.3%6.8%
4.5%
Composite at YE2016 Composite at YE2017
5 Year Average Return on Equity
5 Year Average Return on Equity excluding Loss ReserveDevelopment
Global ReinsuranceMarket Capacity
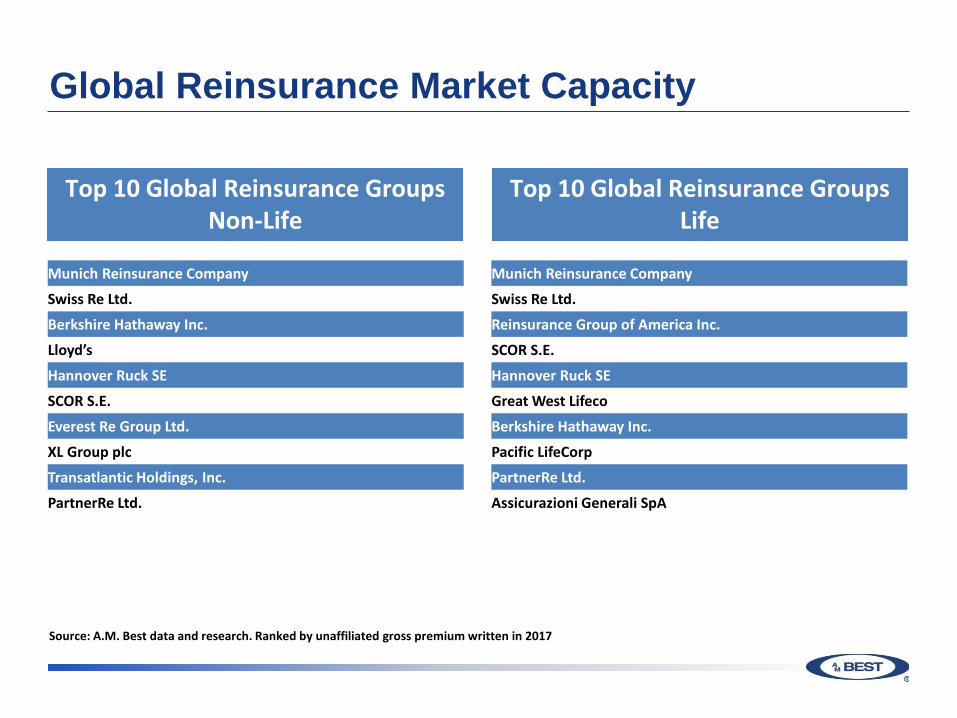
Global Reinsurance Market Capacity
Top 10 Global Reinsurance Groups Non-Life
Top 10 Global Reinsurance Groups Life
Munich Reinsurance Company
Swiss Re Ltd.
Berkshire Hathaway Inc.
Lloyd’s
Hannover Ruck SE
SCOR S.E.
Everest Re Group Ltd.
XL Group plc
Transatlantic Holdings, Inc.
PartnerRe Ltd.
Munich Reinsurance Company
Swiss Re Ltd.
Reinsurance Group of America Inc.
SCOR S.E.
Hannover Ruck SE
Great West Lifeco
Berkshire Hathaway Inc.
Pacific LifeCorp
PartnerRe Ltd.
Assicurazioni Generali SpA
Source: A.M. Best data and research. Ranked by unaffiliated gross premium written in 2017
Global Reinsurance Market Capacity
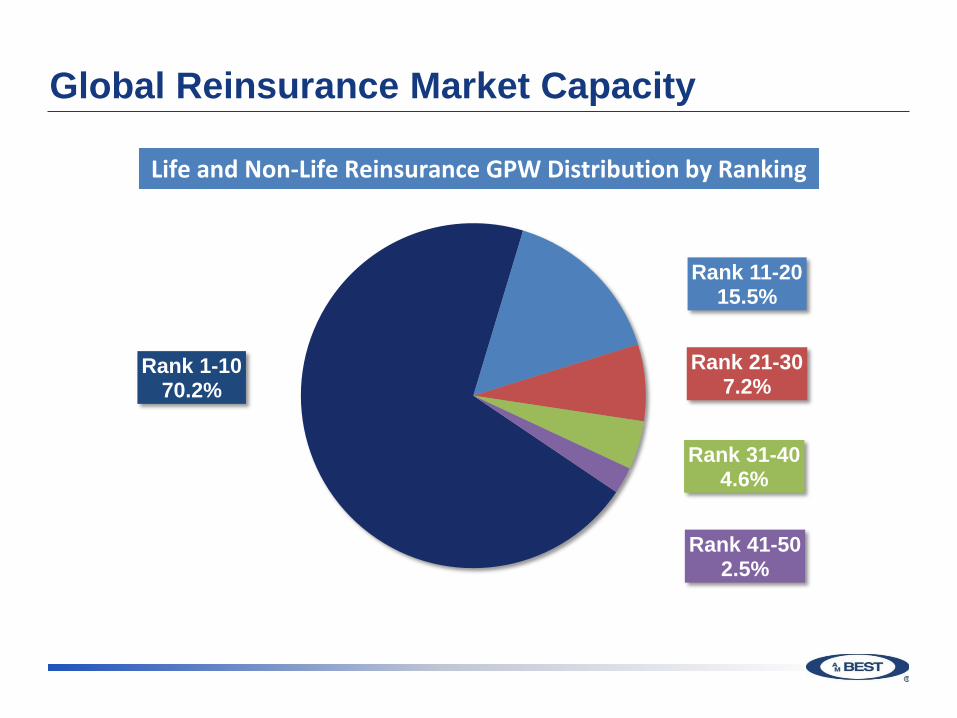
Life and Non-Life Reinsurance GPW Distribution by Ranking
Rank 1-1070.2%
Rank 11-2015.5%
Rank 21-307.2%
Rank 31-404.6%
Rank 41-502.5%
Global Reinsurance Market Capital
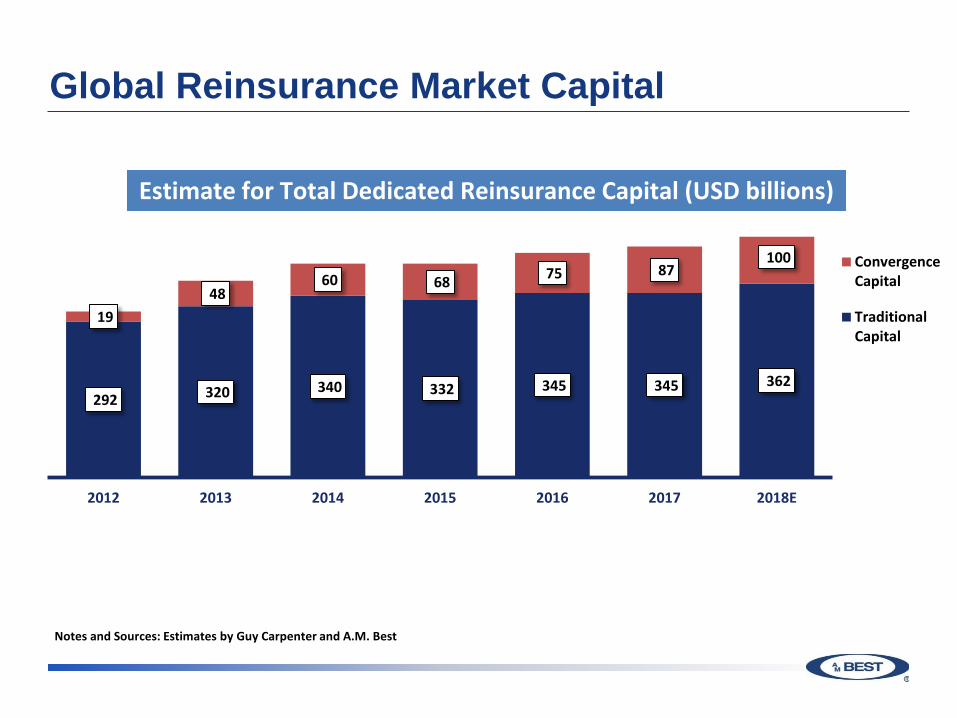
292 320 340 332 345 345 362
19 48
60 68 75 87 100
2012 2013 2014 2015 2016 2017 2018E
ConvergenceCapital
TraditionalCapital
Estimate for Total Dedicated Reinsurance Capital (USD billions)
Notes and Sources: Estimates by Guy Carpenter and A.M. Best
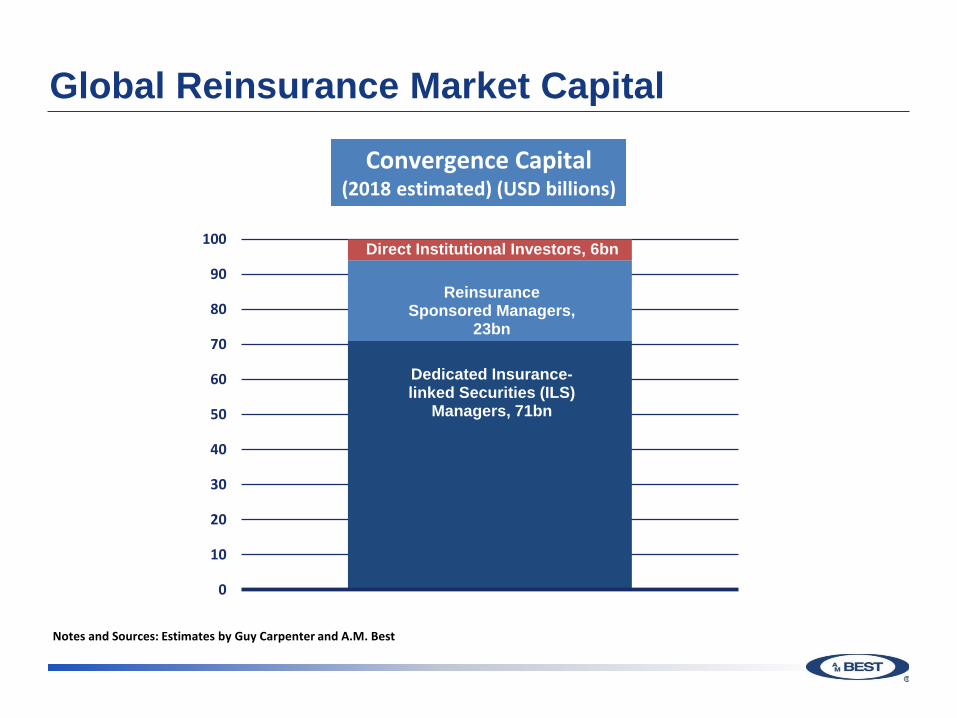
Global Reinsurance Market Capital
Dedicated Insurance-linked Securities (ILS)
Managers, 71bn
Reinsurance Sponsored Managers,
23bn
Direct Institutional Investors, 6bn
0
10
20
30
40
50
60
70
80
90
100
Convergence Capital(2018 estimated) (USD billions)
Notes and Sources: Estimates by Guy Carpenter and A.M. Best
Global Market Evolution
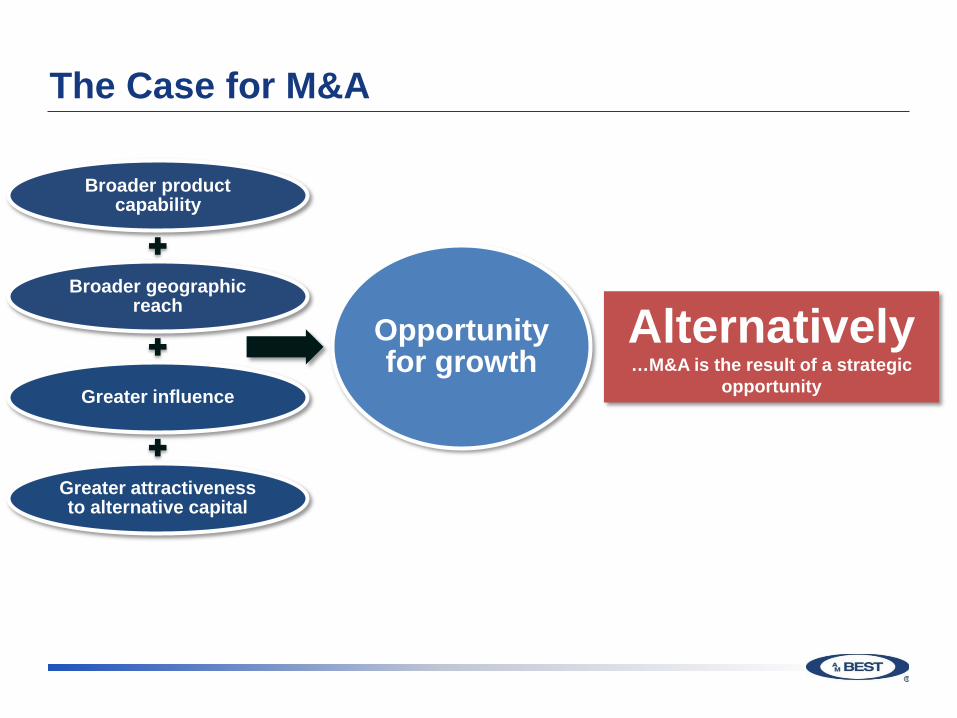
The Case for M&A
Broader product capability
Broader geographic reach
Greater influence
Greater attractiveness to alternative capital
Opportunity for growth
Alternatively…M&A is the result of a strategic
opportunity
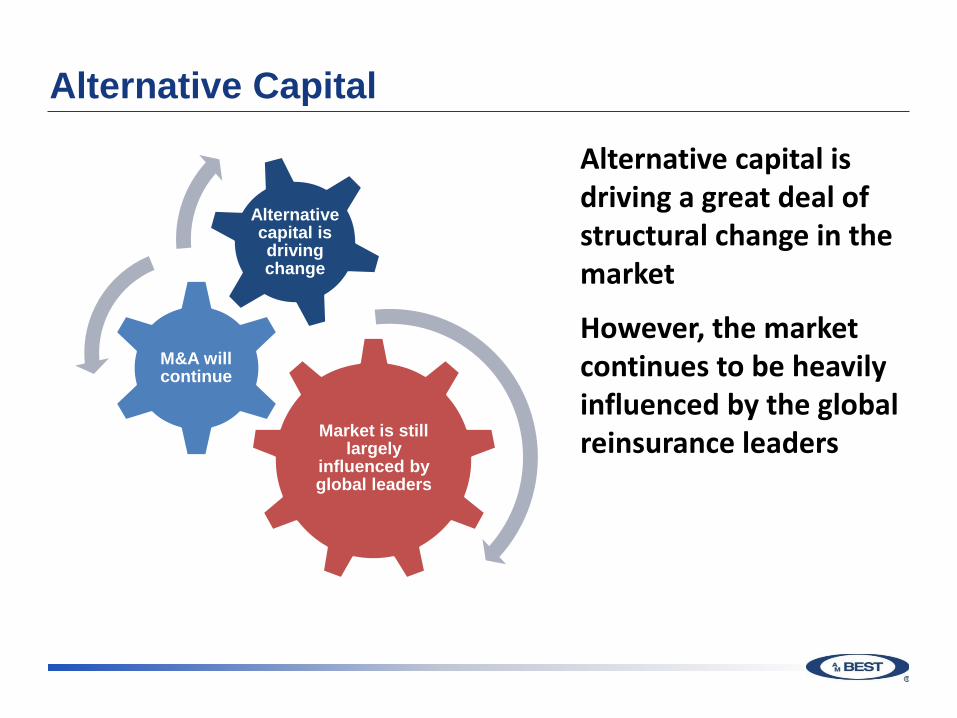
Alternative Capital
Market is still largely
influenced by global leaders
M&A will continue
Alternative capital is driving change
Alternative capital is driving a great deal of structural change in the market
However, the market continues to be heavily influenced by the global reinsurance leaders
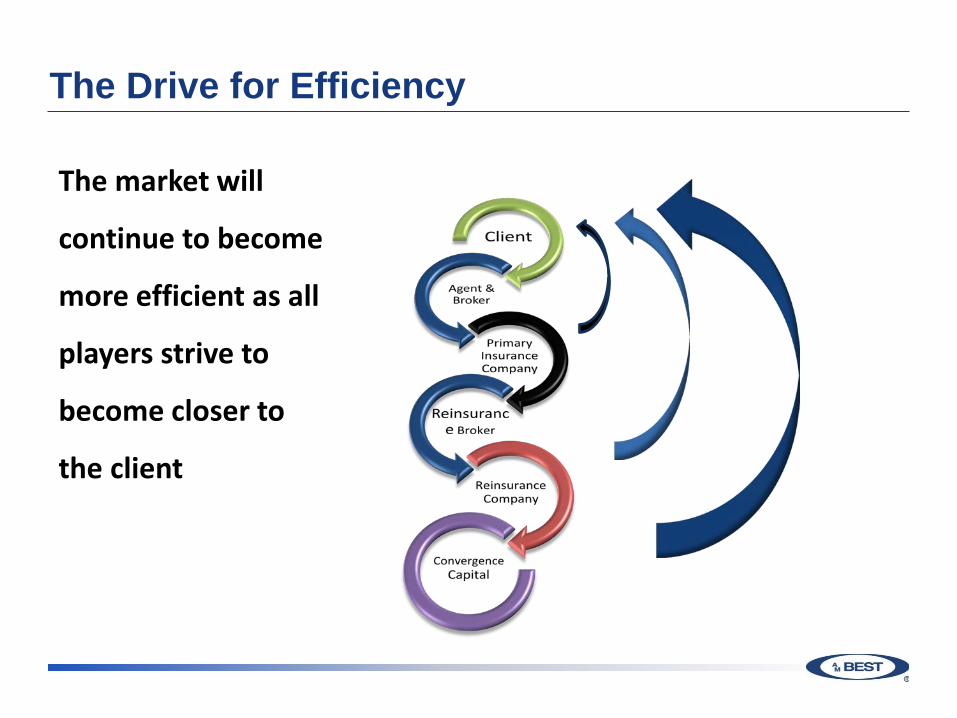
The Drive for Efficiency
The market will
continue to become
more efficient as all
players strive to
become closer to
the client
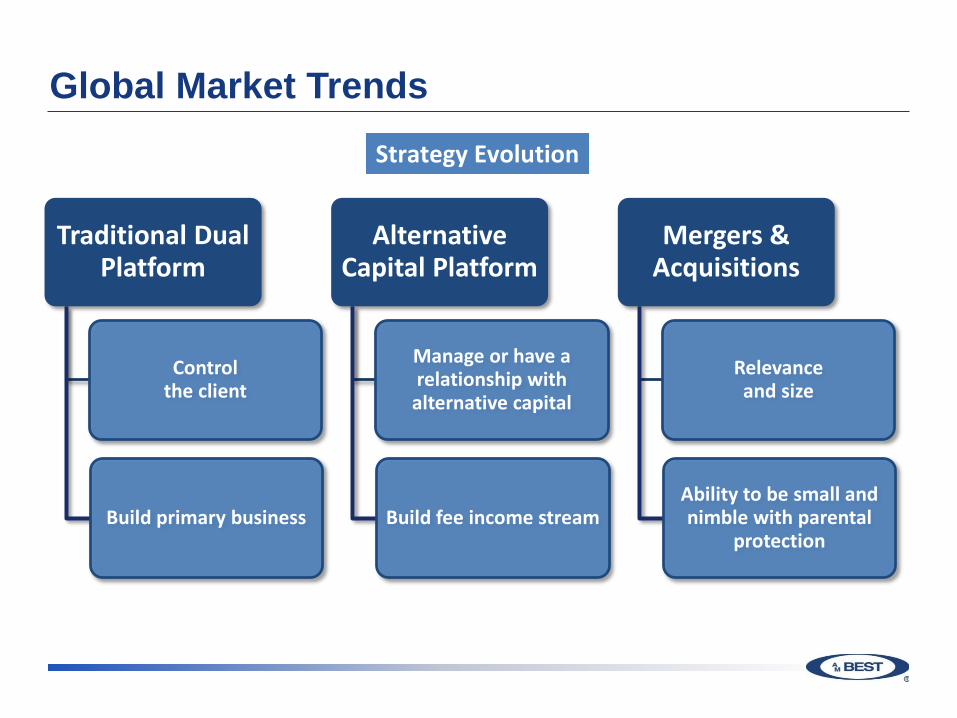
Global Market Trends
Traditional Dual Platform
Controlthe client
Build primary business
Alternative Capital Platform
Manage or have a relationship with
alternative capital
Build fee income stream
Mergers &Acquisitions
Relevanceand size
Ability to be small and nimble with parental
protection
Strategy Evolution
Global Market Trends
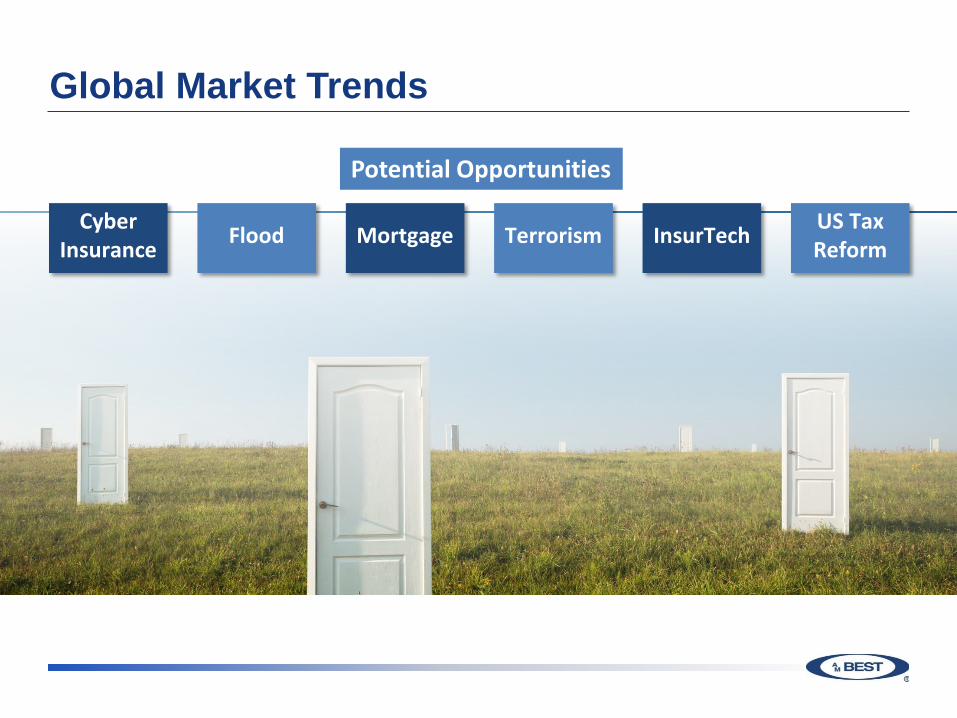
Potential Opportunities
Cyber Insurance Flood Mortgage Terrorism InsurTech US Tax
Reform
2018 Insurance Market Briefing - Germany
European (Re)Insurance Market Overview
Charlotte VigierSenior Financial Analyst
Konstantin LangowskiFinancial Analyst
Market Segment Outlooks
Examine the current trends in particular segments of the insurance industry over the next 12 months
Typical factors considered include current and forecast economic conditions; the regulatory environment and potential changes; emerging product developments; and competitive issues that could impact the success of the companies operating in the segment
A Best’s Market Segment Outlook, like a Best’s Credit Rating Outlook for a company, can be positive, negative, or stable
Many segments covered internationally
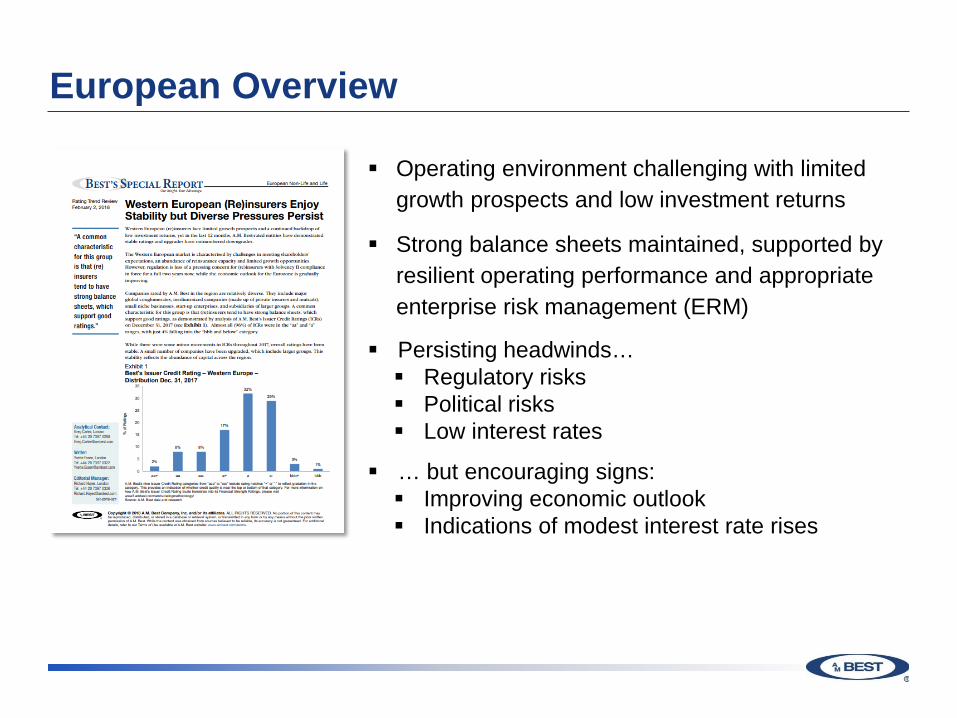
European Overview
Operating environment challenging with limited growth prospects and low investment returns
Strong balance sheets maintained, supported by resilient operating performance and appropriate enterprise risk management (ERM)
Persisting headwinds… Regulatory risks Political risks Low interest rates
… but encouraging signs: Improving economic outlook Indications of modest interest rate rises
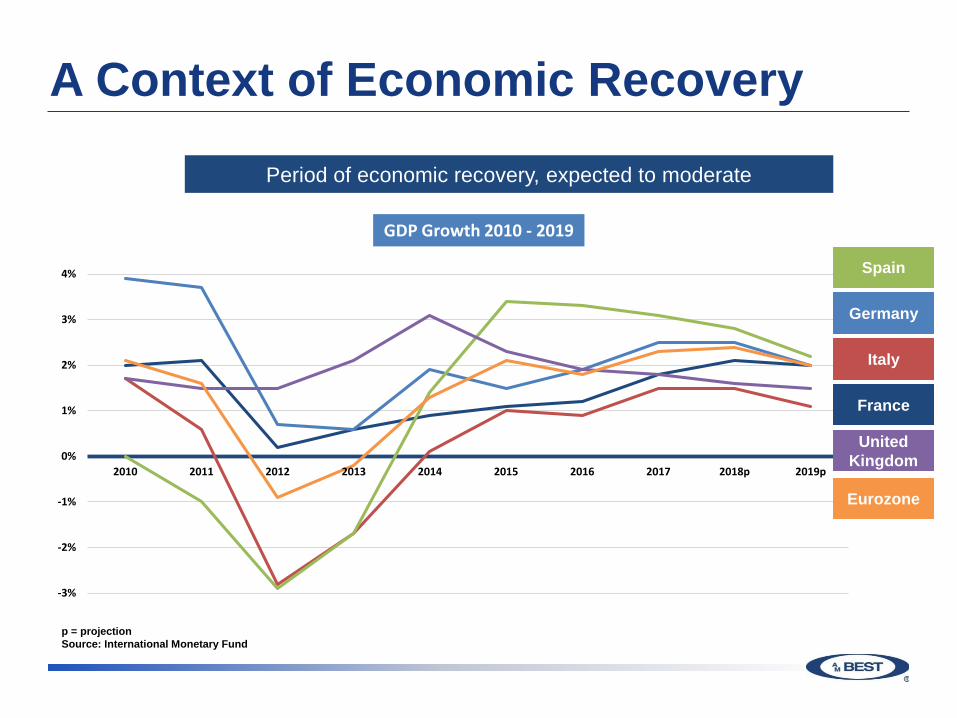
A Context of Economic Recovery
p = projectionSource: International Monetary Fund
Period of economic recovery, expected to moderate
GDP Growth 2010 - 2019
-3%
-2%
-1%
0%
1%
2%
3%
4%
2010 2011 2012 2013 2014 2015 2016 2017 2018p 2019p
Spain
Italy
France
United Kingdom
Germany
Eurozone
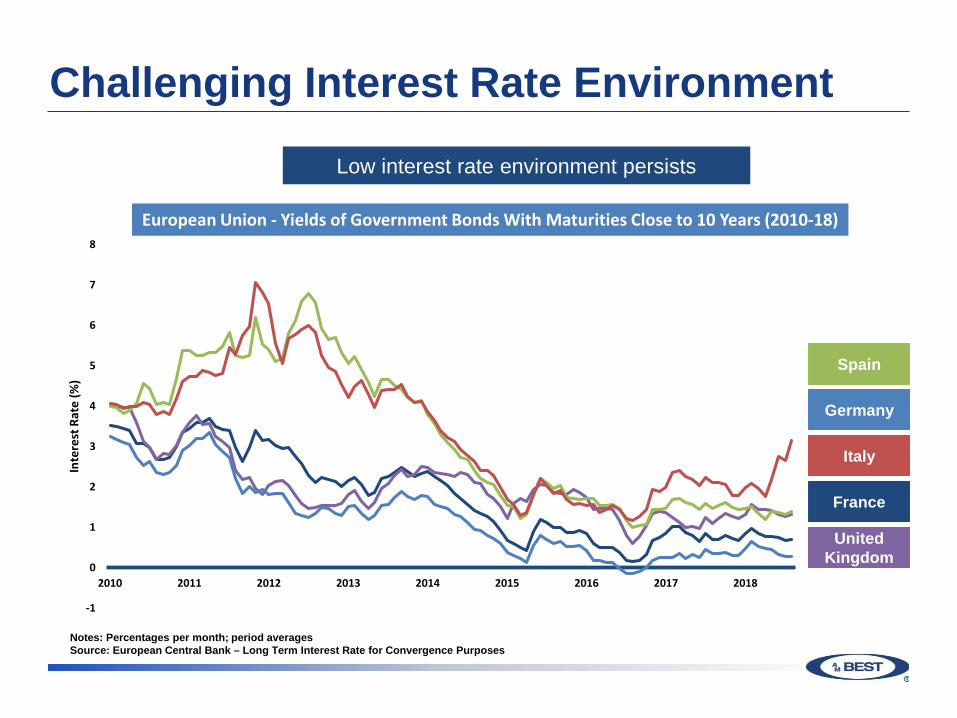
Challenging Interest Rate Environment
Low interest rate environment persists
European Union - Yields of Government Bonds With Maturities Close to 10 Years (2010-18)
-1
0
1
2
3
4
5
6
7
8
2010 2011 2012 2013 2014 2015 2016 2017 2018
Inte
rest
Rat
e (%
)
Spain
Italy
France
United Kingdom
Germany
Notes: Percentages per month; period averagesSource: European Central Bank – Long Term Interest Rate for Convergence Purposes
European Segment Outlooks
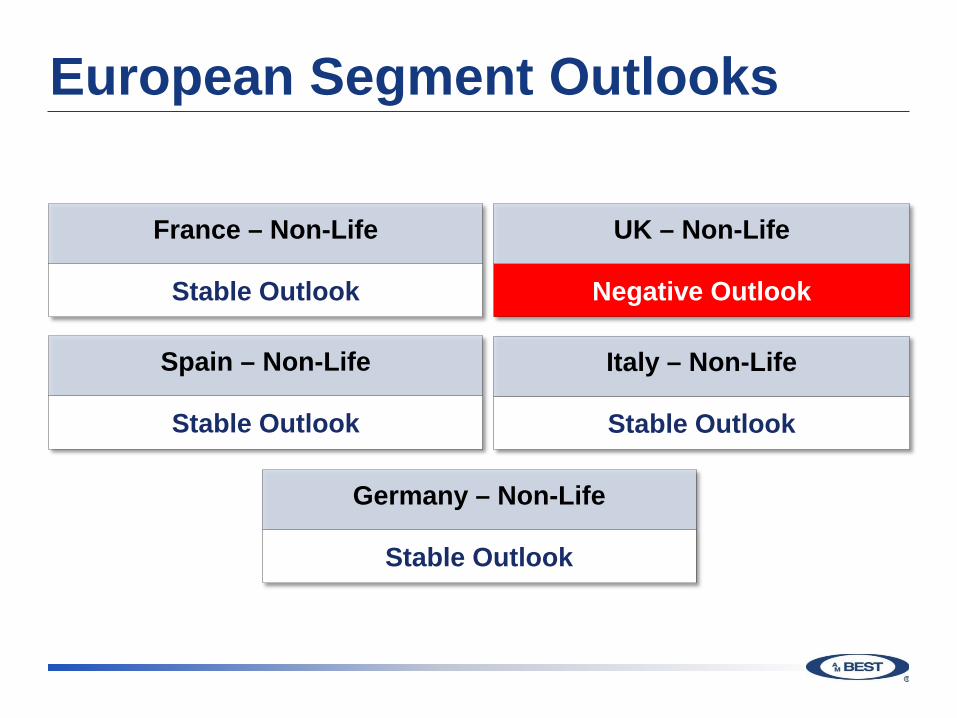
European Segment Outlooks
Stable Outlook
France – Non-Life
Stable Outlook
Spain – Non-Life
Negative Outlook
UK – Non-Life
Stable Outlook
Italy – Non-Life
Stable Outlook
Germany – Non-Life
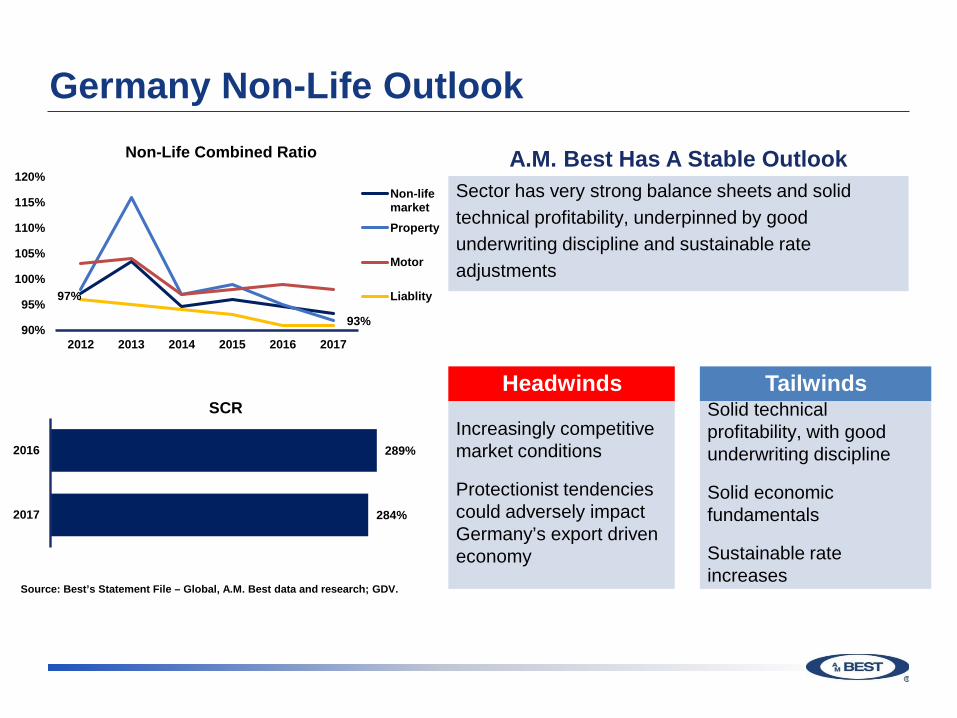
Germany Non-Life Outlook
A.M. Best Has A Stable OutlookSector has very strong balance sheets and solid technical profitability, underpinned by good underwriting discipline and sustainable rate adjustments
Headwinds
Increasingly competitive market conditions
Protectionist tendencies could adversely impact Germany’s export driven economy
TailwindsSolid technical profitability, with good underwriting discipline
Solid economic fundamentals
Sustainable rate increases
Source: Best’s Statement File – Global, A.M. Best data and research; GDV.
97%
93%90%
95%
100%
105%
110%
115%
120%
2012 2013 2014 2015 2016 2017
Non-Life Combined Ratio
Non-lifemarketProperty
Motor
Liablity
284%
289%
2017
2016
SCR
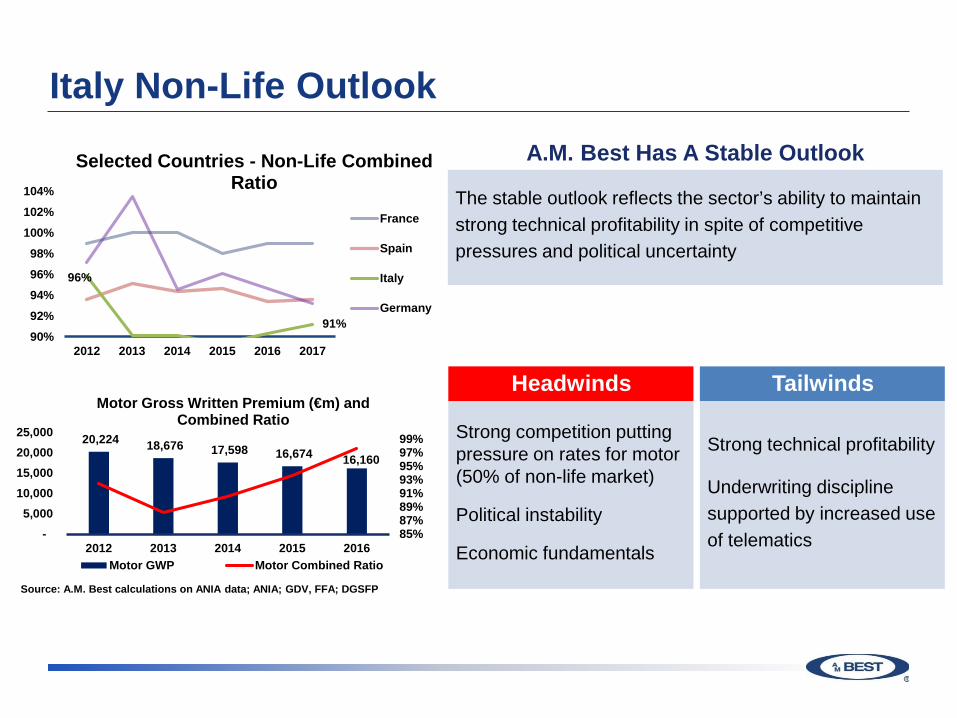
Italy Non-Life OutlookA.M. Best Has A Stable Outlook
The stable outlook reflects the sector’s ability to maintain strong technical profitability in spite of competitive pressures and political uncertainty
Headwinds
Strong competition putting pressure on rates for motor (50% of non-life market)
Political instability
Economic fundamentals
Tailwinds
Strong technical profitability
Underwriting discipline supported by increased use of telematics
Source: A.M. Best calculations on ANIA data; ANIA; GDV, FFA; DGSFP
20,224 18,676 17,598 16,674 16,160
85%87%89%91%93%95%97%99%
- 5,000
10,000 15,000 20,000 25,000
2012 2013 2014 2015 2016
Motor Gross Written Premium (€m) and Combined Ratio
Motor GWP Motor Combined Ratio
96%
91%90%92%94%96%98%
100%102%104%
2012 2013 2014 2015 2016 2017
Selected Countries - Non-Life Combined Ratio
France
Spain
Italy
Germany
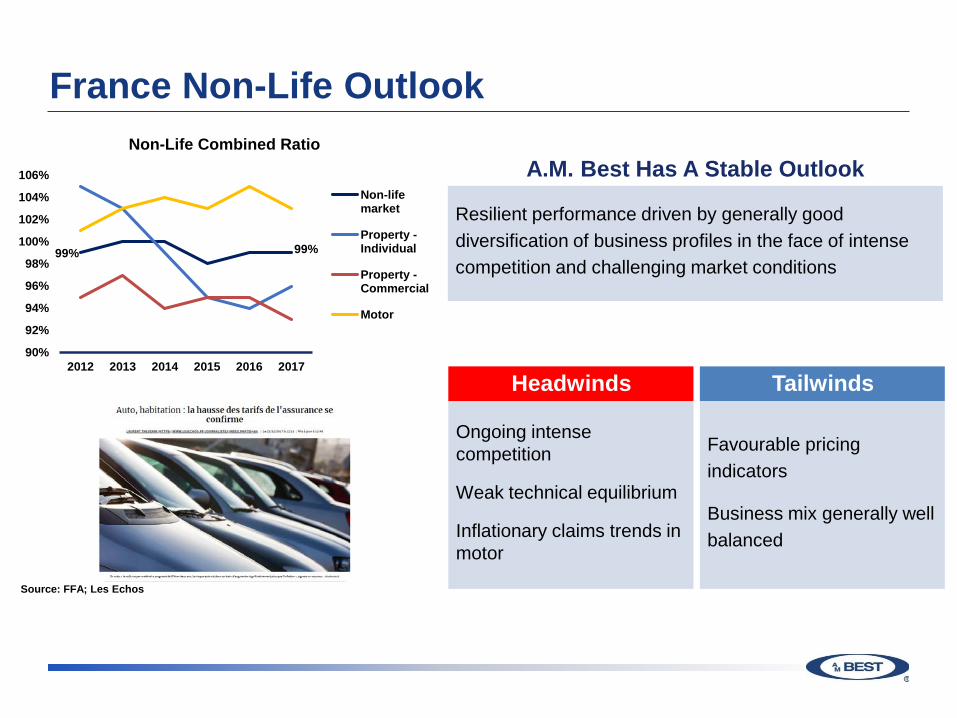
France Non-Life Outlook
A.M. Best Has A Stable Outlook
Resilient performance driven by generally good diversification of business profiles in the face of intense competition and challenging market conditions
Headwinds
Ongoing intense competition
Weak technical equilibrium
Inflationary claims trends in motor
Tailwinds
Favourable pricing indicators
Business mix generally well balanced
Source: FFA; Les Echos
99% 99%
90%
92%
94%
96%
98%
100%
102%
104%
106%
2012 2013 2014 2015 2016 2017
Non-Life Combined Ratio
Non-lifemarket
Property -Individual
Property -Commercial
Motor
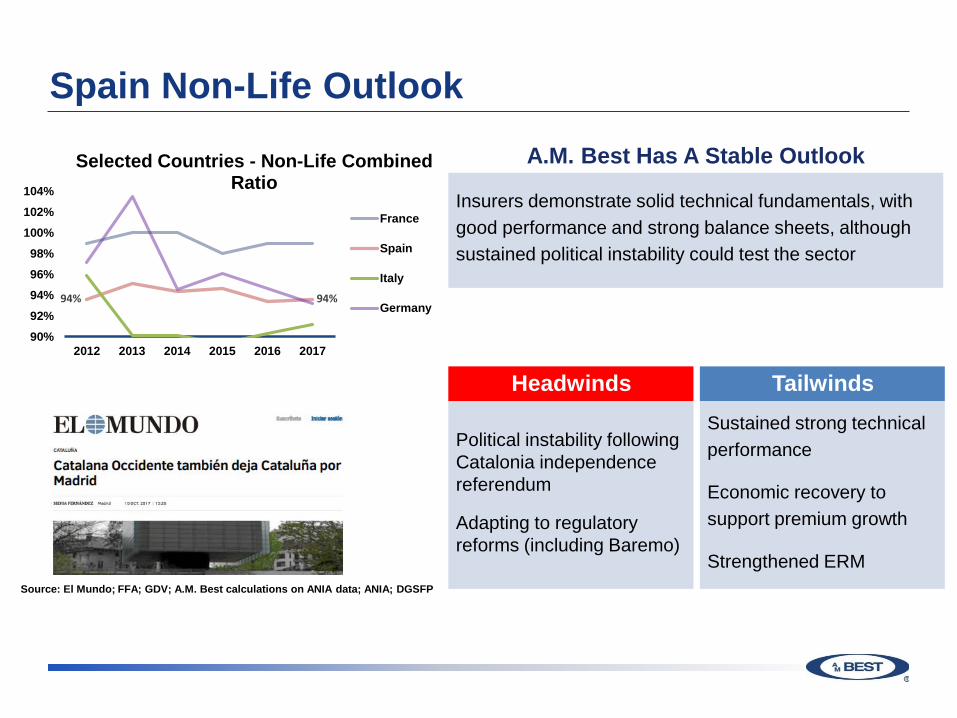
Spain Non-Life OutlookA.M. Best Has A Stable Outlook
Insurers demonstrate solid technical fundamentals, with good performance and strong balance sheets, although sustained political instability could test the sector
Headwinds
Political instability following Catalonia independence referendum
Adapting to regulatory reforms (including Baremo)
TailwindsSustained strong technical performance
Economic recovery to support premium growth
Strengthened ERMSource: El Mundo; FFA; GDV; A.M. Best calculations on ANIA data; ANIA; DGSFP
94% 94%
90%92%94%96%98%
100%102%104%
2012 2013 2014 2015 2016 2017
Selected Countries - Non-Life Combined Ratio
France
Spain
Italy
Germany
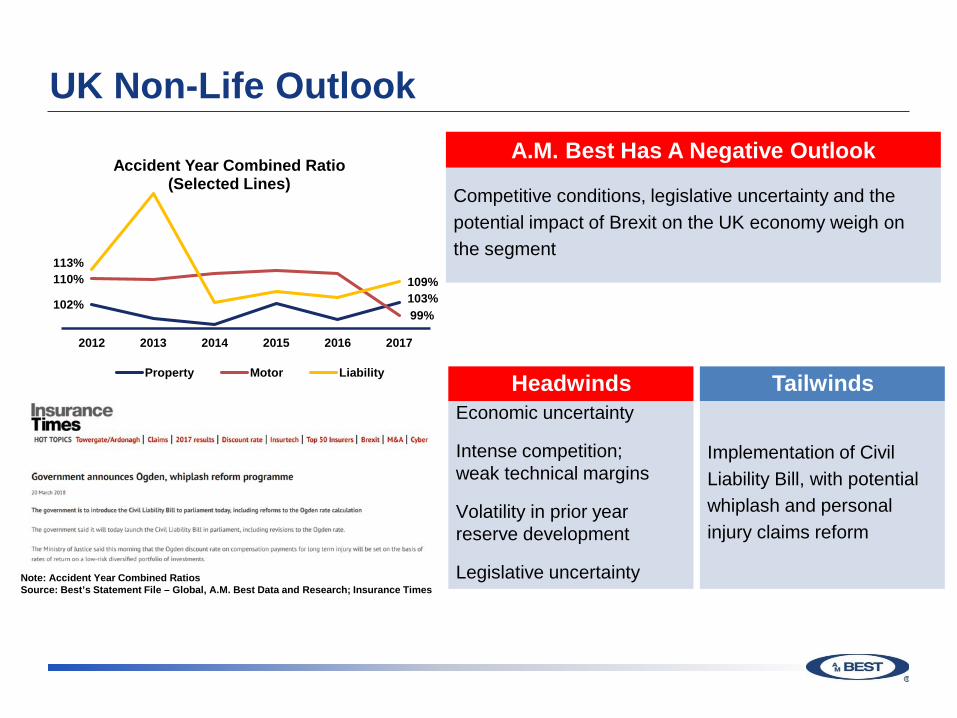
UK Non-Life OutlookA.M. Best Has A Negative Outlook
Competitive conditions, legislative uncertainty and the potential impact of Brexit on the UK economy weigh on the segment
HeadwindsEconomic uncertainty
Intense competition; weak technical margins
Volatility in prior year reserve development
Legislative uncertainty
Tailwinds
Implementation of Civil Liability Bill, with potential whiplash and personal injury claims reform
Note: Accident Year Combined RatiosSource: Best’s Statement File – Global, A.M. Best Data and Research; Insurance Times
102% 103%110%
99%
113%109%
2012 2013 2014 2015 2016 2017
Accident Year Combined Ratio (Selected Lines)
Property Motor Liability

Looking Forward
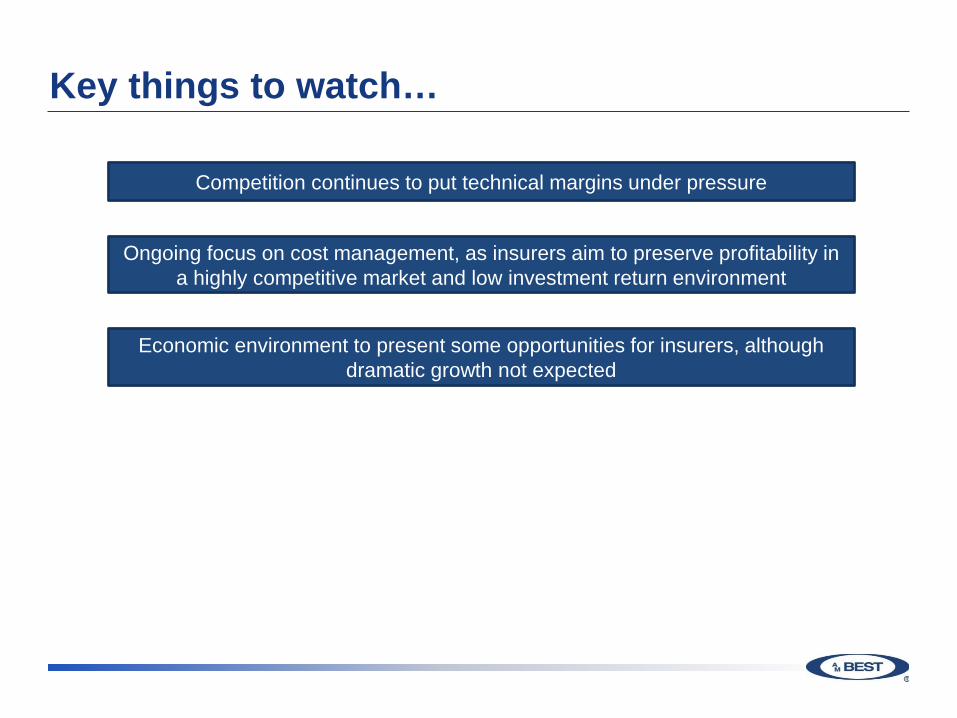
Key things to watch…
Competition continues to put technical margins under pressure
Ongoing focus on cost management, as insurers aim to preserve profitability in a highly competitive market and low investment return environment
Economic environment to present some opportunities for insurers, although dramatic growth not expected
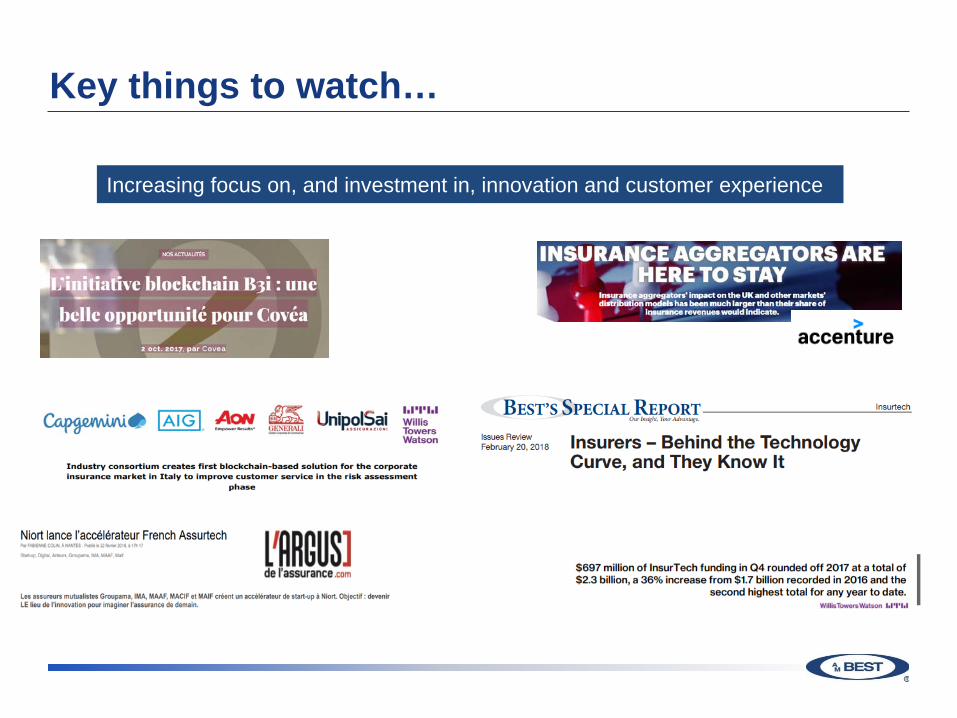
Key things to watch…
Increasing focus on, and investment in, innovation and customer experience
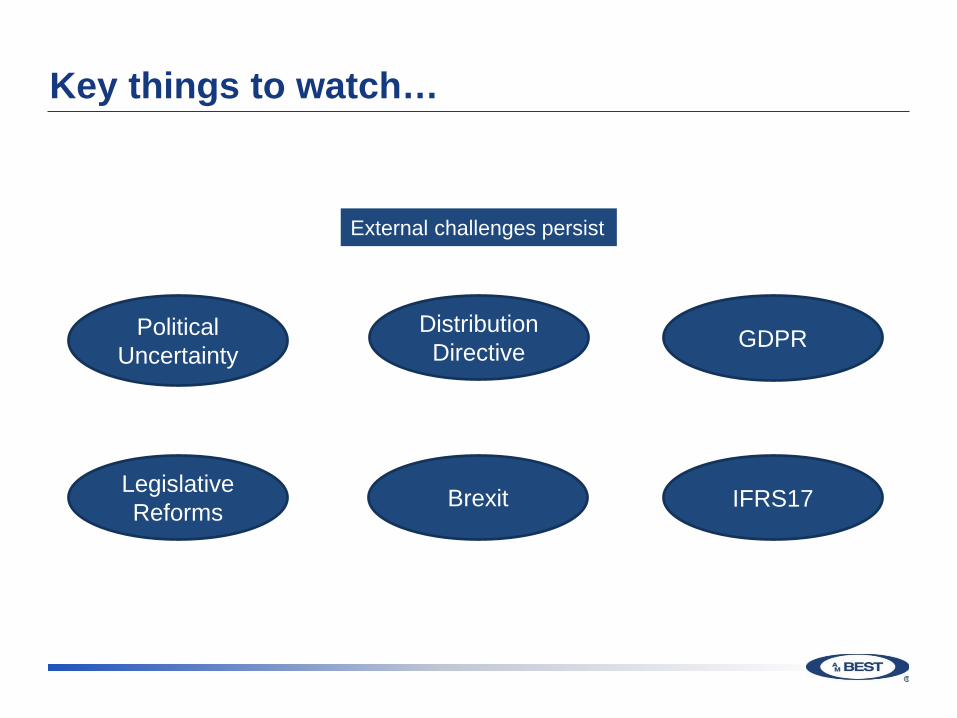
Key things to watch…
Political Uncertainty
GDPR
IFRS17Legislative Reforms
Distribution Directive
External challenges persist
Brexit
2018 Insurance Market Briefing - Germany
A.M. Best's Revised Rating Methodology in Action:
A Case Study
Michael DunckleyAssociate Director,
Analytics
Catherine ThomasSenior Director,
Analytics
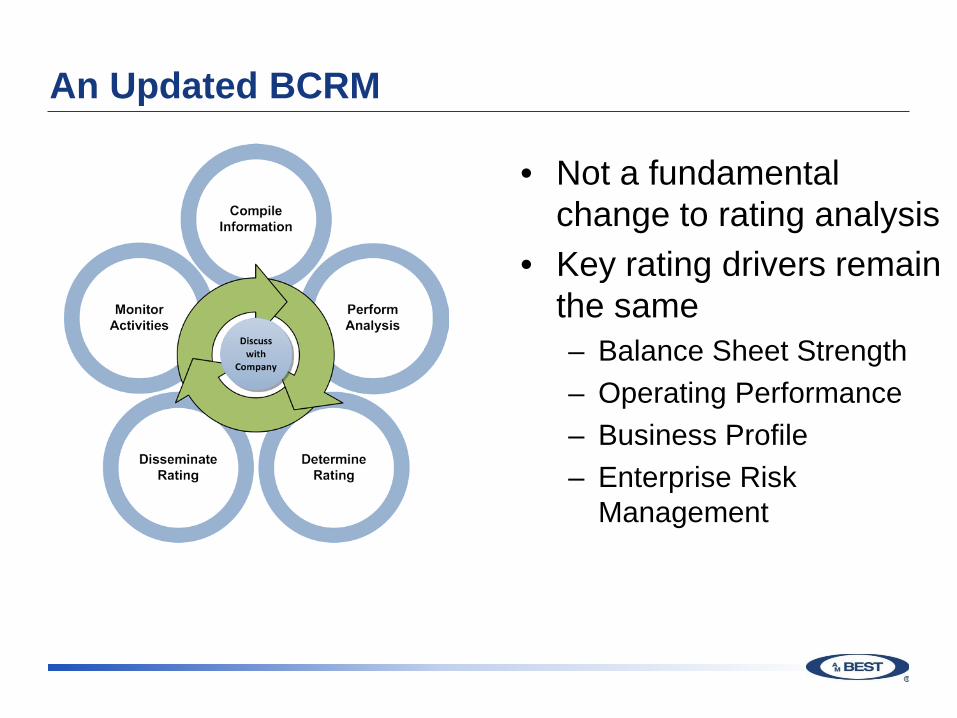
An Updated BCRM
• Not a fundamental change to rating analysis
• Key rating drivers remain the same– Balance Sheet Strength– Operating Performance– Business Profile– Enterprise Risk
Management
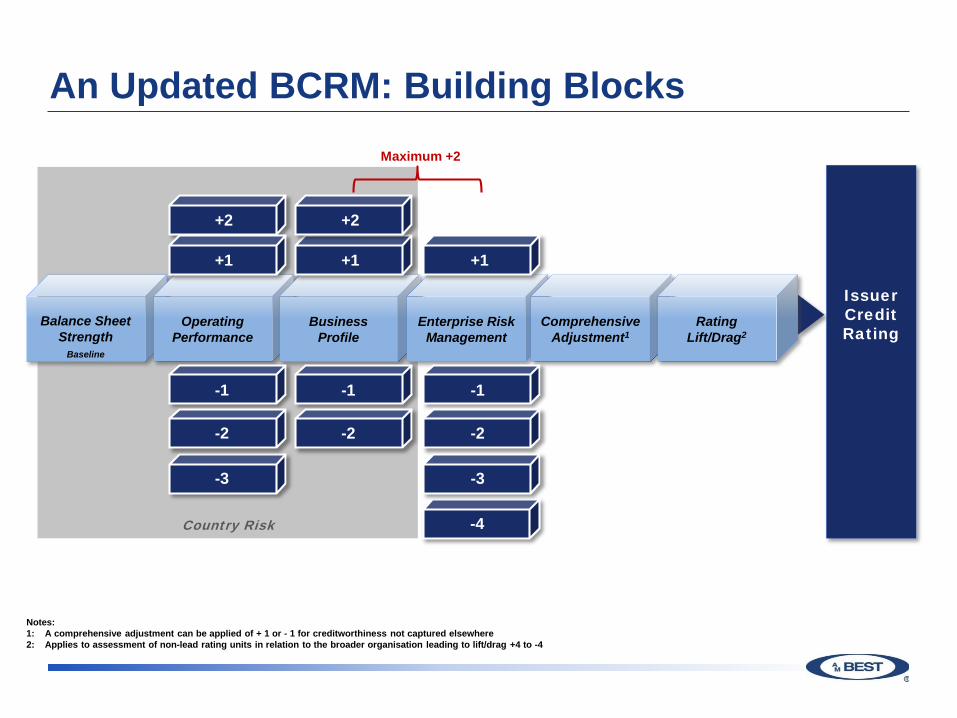
An Updated BCRM: Building Blocks
Balance Sheet Strength
Baseline
Operating Performance
BusinessProfile
Enterprise Risk Management
Comprehensive Adjustment1
RatingLift/Drag2
Issuer Credit Rating
Country Risk
+2
+1 +1 +1
-1
-2
-3
-1
-2
-3
-1
-2
+2
Maximum +2
-4
Notes:1: A comprehensive adjustment can be applied of + 1 or - 1 for creditworthiness not captured elsewhere2: Applies to assessment of non-lead rating units in relation to the broader organisation leading to lift/drag +4 to -4
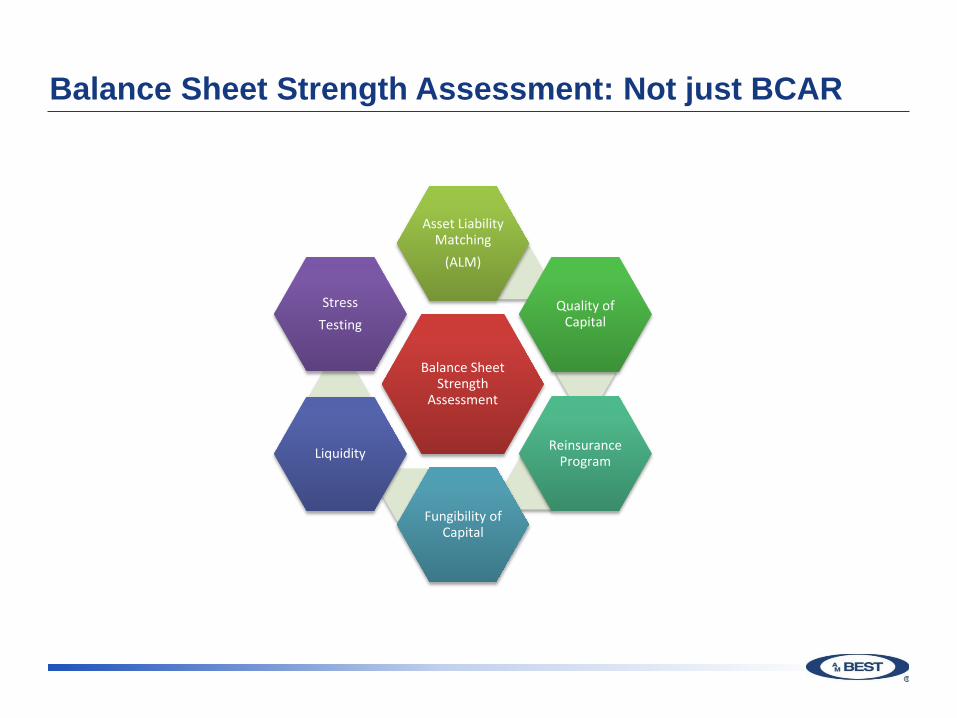
Balance Sheet Strength Assessment: Not just BCAR
A.M. Best - An Introduction 20 March 2018
Balance Sheet Strength
Assessment
Asset Liability Matching
(ALM)
Quality of Capital
Reinsurance Program
Fungibility of Capital
Liquidity
StressTesting
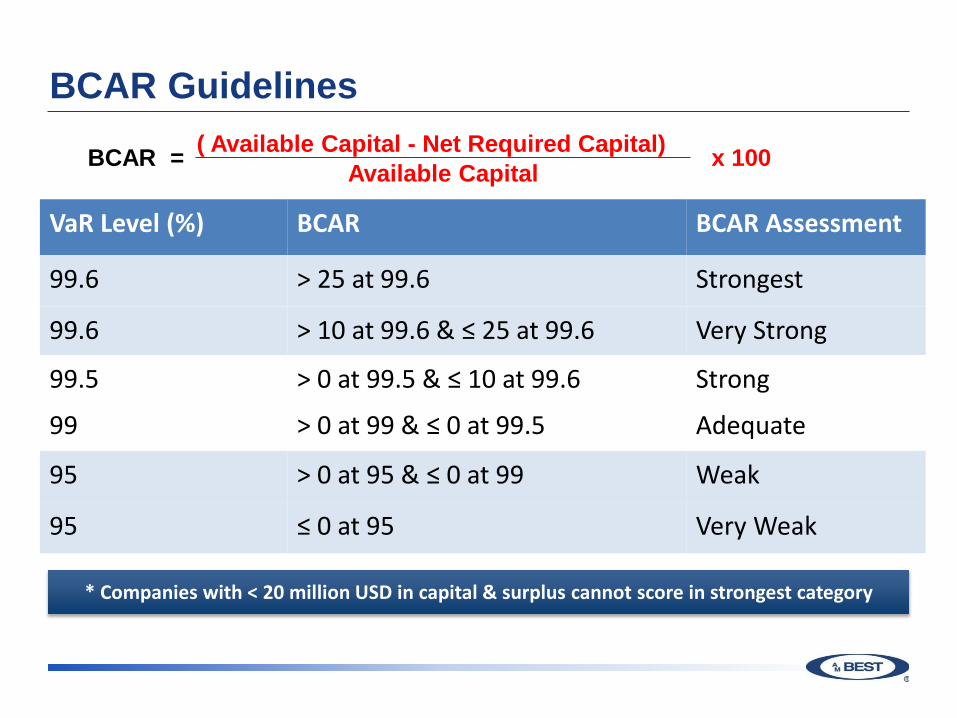
BCAR Guidelines
VaR Level (%) BCAR BCAR Assessment
99.6 > 25 at 99.6 Strongest
99.6 > 10 at 99.6 & ≤ 25 at 99.6 Very Strong
99.5 > 0 at 99.5 & ≤ 10 at 99.6 Strong
99 > 0 at 99 & ≤ 0 at 99.5 Adequate
95 > 0 at 95 & ≤ 0 at 99 Weak
95 ≤ 0 at 95 Very Weak
* Companies with < 20 million USD in capital & surplus cannot score in strongest category
BCAR = ( Available Capital - Net Required Capital) x 100Available Capital
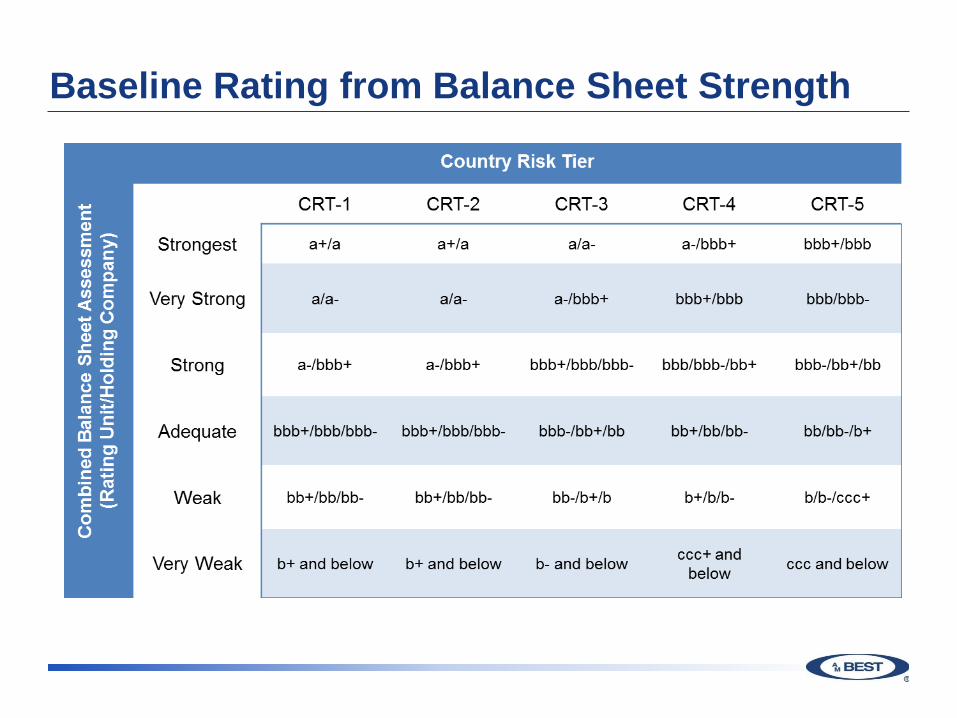
Baseline Rating from Balance Sheet Strength
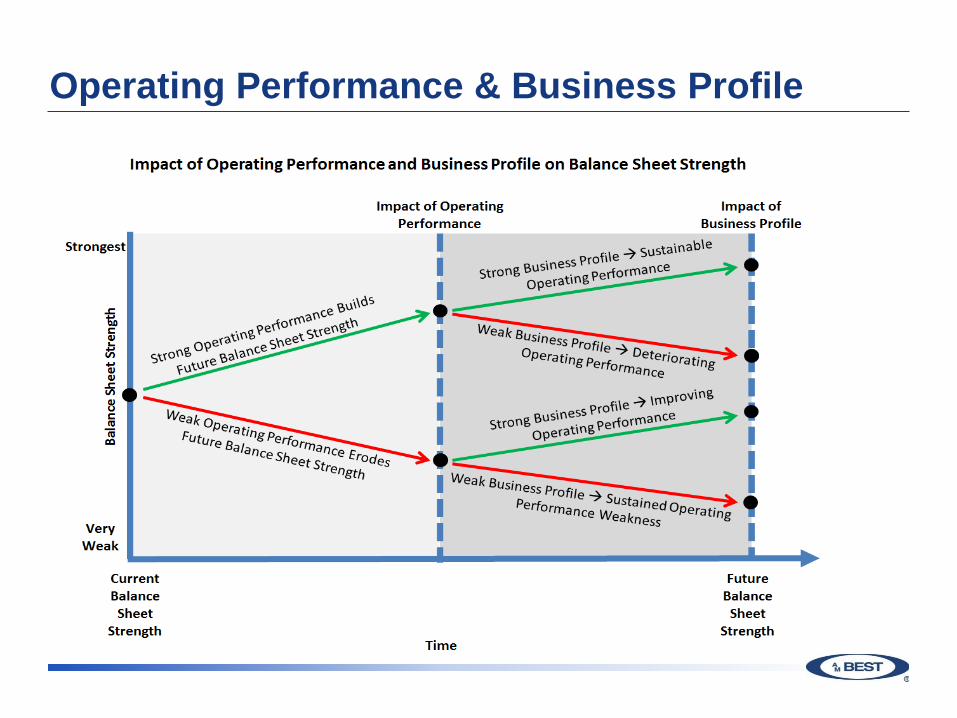
Operating Performance & Business Profile
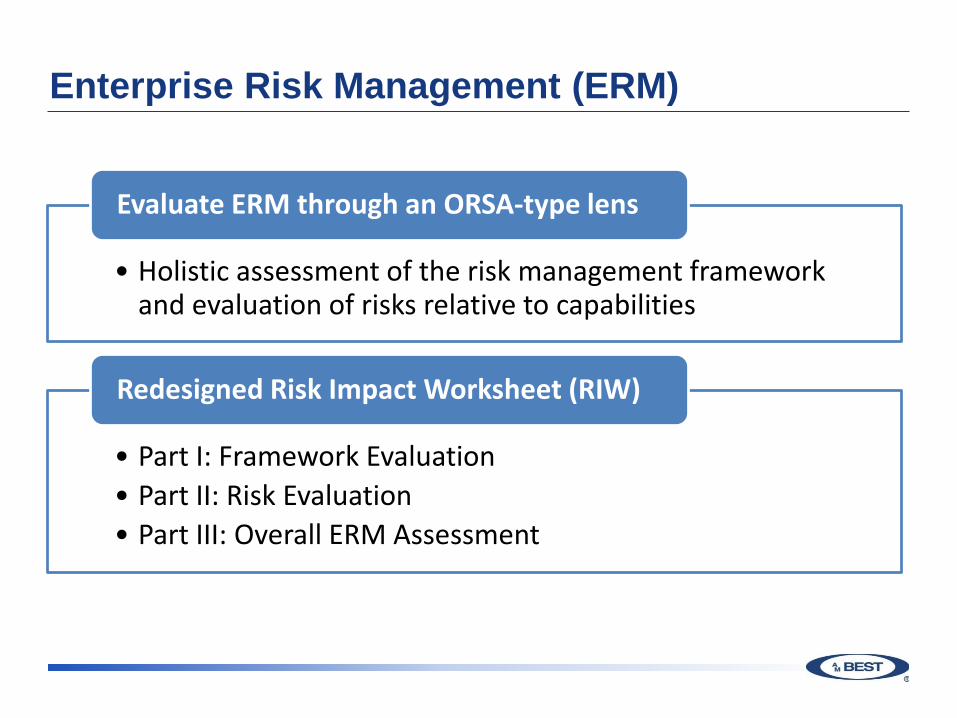
Enterprise Risk Management (ERM)
• Holistic assessment of the risk management framework and evaluation of risks relative to capabilities
Evaluate ERM through an ORSA-type lens
• Part I: Framework Evaluation• Part II: Risk Evaluation• Part III: Overall ERM Assessment
Redesigned Risk Impact Worksheet (RIW)
Rating Committee Introduction
• A.M. Best rating actions determined by rating committee
• Lead analyst produces rating package and proposes rating action
• Rating committee deliberates on the proposed action and determines the rating action
• Voting quorum – minimum of six members, including at least two senior members
Rating Committee Members
• Michael Dunckley, Associate Director (lead analyst)
• Angela Yeo, Senior Director (reviewer)
• Catherine Thomas, Senior Director (chair)
• Charlotte Vigier, Senior Financial Analyst
• Konstantin Langowski, Financial Analyst
Rating Committee Voting
• Voting quorum – minimum of six members, including at least two senior members
• Simple majority vote is acceptable for the approval of any rating action
• Chair can break tie or refer the decision to a higher committee
• Voting members must have no conflicts of interest, but must have relevant experience and have passed compliance requirements
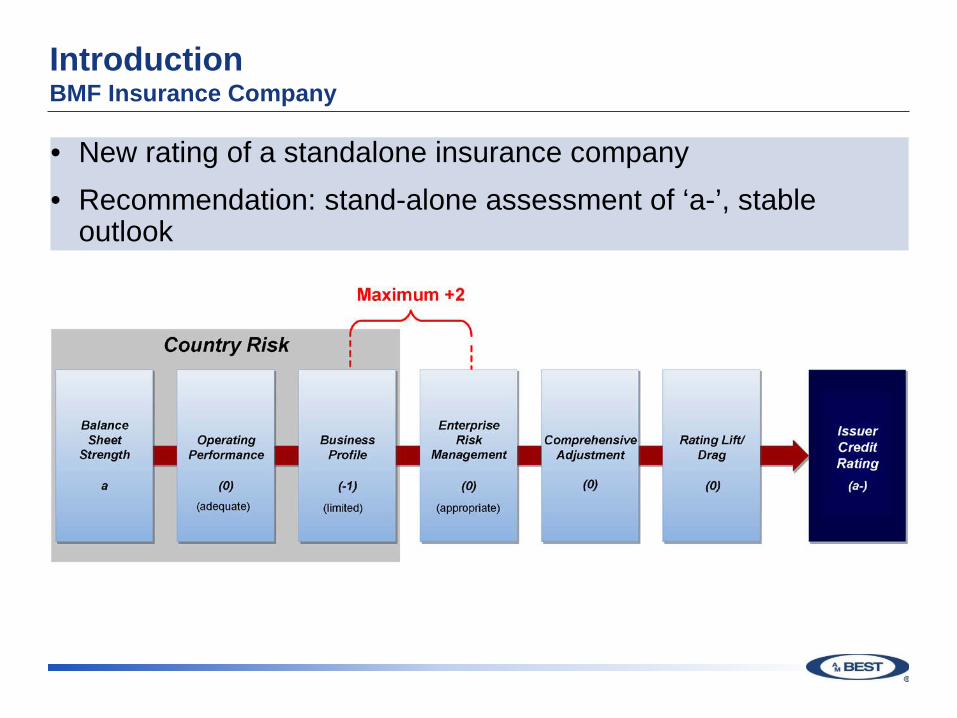
IntroductionBMF Insurance Company
• New rating of a standalone insurance company• Recommendation: stand-alone assessment of ‘a-’, stable
outlook
Overview - BMF Insurance CompanyOverview
• Domiciled in a small European country• Country Risk Tier 2 – stable operating environment• BMF Insurance Company (BMF) established 70 years
ago and is a private company• Fifth-largest insurer in its country of domicile • Management have in-depth knowledge and experience
of the local market
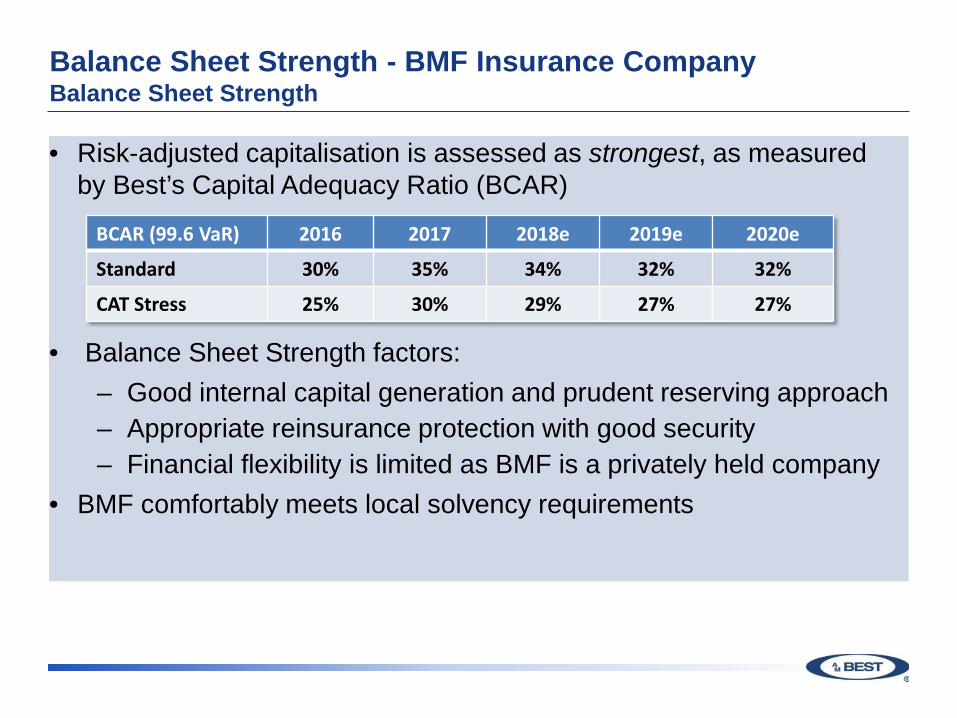
Balance Sheet Strength - BMF Insurance CompanyBalance Sheet Strength
• Risk-adjusted capitalisation is assessed as strongest, as measured by Best’s Capital Adequacy Ratio (BCAR)
• Balance Sheet Strength factors:– Good internal capital generation and prudent reserving approach– Appropriate reinsurance protection with good security– Financial flexibility is limited as BMF is a privately held company
• BMF comfortably meets local solvency requirements
BCAR (99.6 VaR) 2016 2017 2018e 2019e 2020e
Standard 30% 35% 34% 32% 32%
CAT Stress 25% 30% 29% 27% 27%
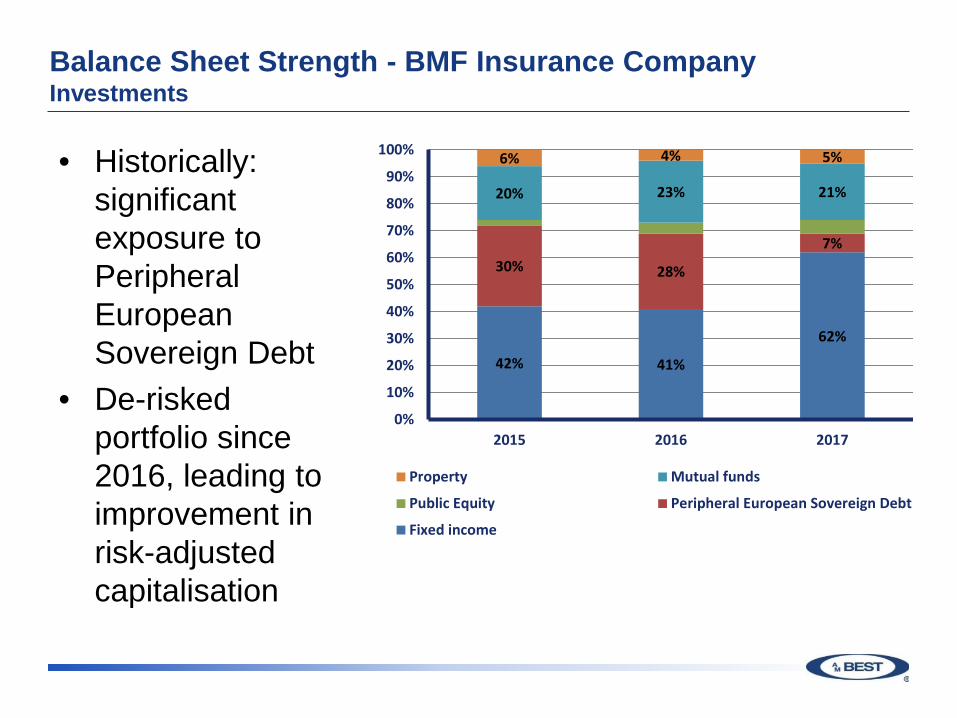
Balance Sheet Strength - BMF Insurance CompanyInvestments
• Historically: significant exposure to Peripheral European Sovereign Debt
• De-risked portfolio since 2016, leading to improvement in risk-adjusted capitalisation
42% 41%
62%
30% 28%
7%
20% 23% 21%
6% 4% 5%
0%
10%
20%
30%
40%
50%
60%
70%
80%
90%
100%
2015 2016 2017
Property Mutual funds
Public Equity Peripheral European Sovereign Debt
Fixed income
Balance Sheet Strength - BMF Insurance CompanyReserving
• Reserves are reviewed by an internal actuary quarterly and by an external actuary annually
• Small margin in held reserves over external actuaries best estimate
• Loss triangles for the past 10 years indicate stability
• Modest reserve releases in each of the past three years
Balance Sheet Strength - BMF Insurance CompanyReinsurance
• Reinsurance includes both proportional and non-proportional arrangements
• 92% of reinsurers are rated “A-” or above• Limited cat risk in local market, earthquake risk is
borne by state reinsurer
Balance Sheet Strength - BMF Insurance CompanyKey factors
• BCAR scores in the ‘strongest’ range
• Good internal capital generation to support planned growth
• Stable reserve development
• Limited CAT risk
• Comprehensive reinsurance with high quality panel
• Limited financial flexibility• Sovereign risk exposure
has reduced• CRT-2 domicile
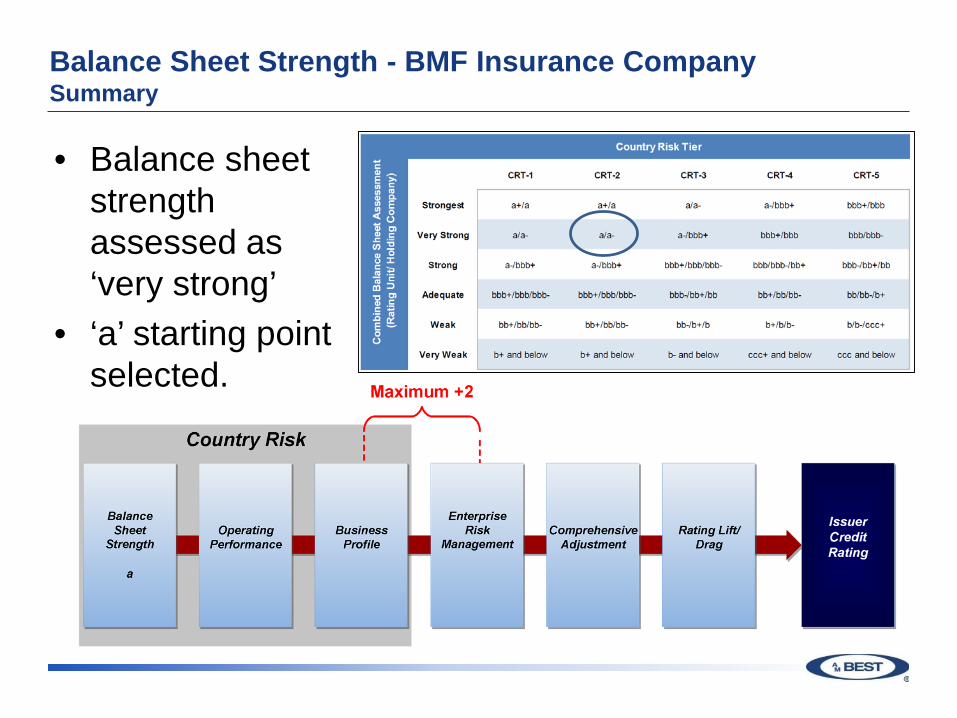
Balance Sheet Strength - BMF Insurance CompanySummary
• Balance sheet strength assessed as ‘very strong’
• ‘a’ starting point selected.
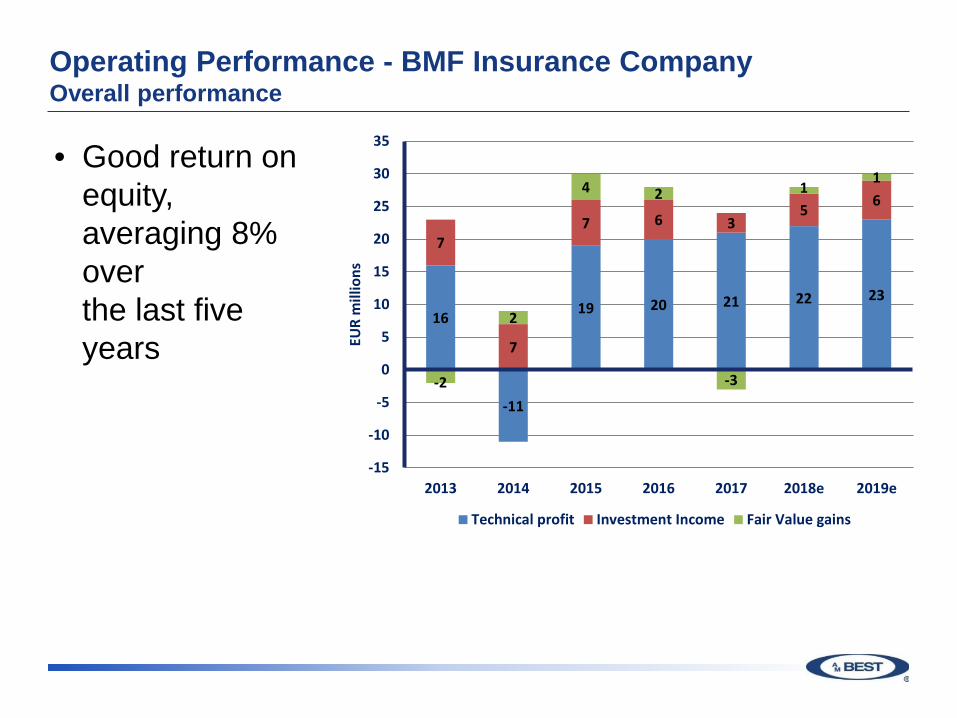
Operating Performance - BMF Insurance CompanyOverall performance
• Good return on equity, averaging 8% over the last five years
16
-11
19 20 21 22 23
7
7
7 6 35 6
-2
2
4 2
-3
11
-15
-10
-5
0
5
10
15
20
25
30
35
2013 2014 2015 2016 2017 2018e 2019e
EUR
mill
ions
Technical profit Investment Income Fair Value gains
Operating Performance - BMF Insurance CompanyUnderwriting
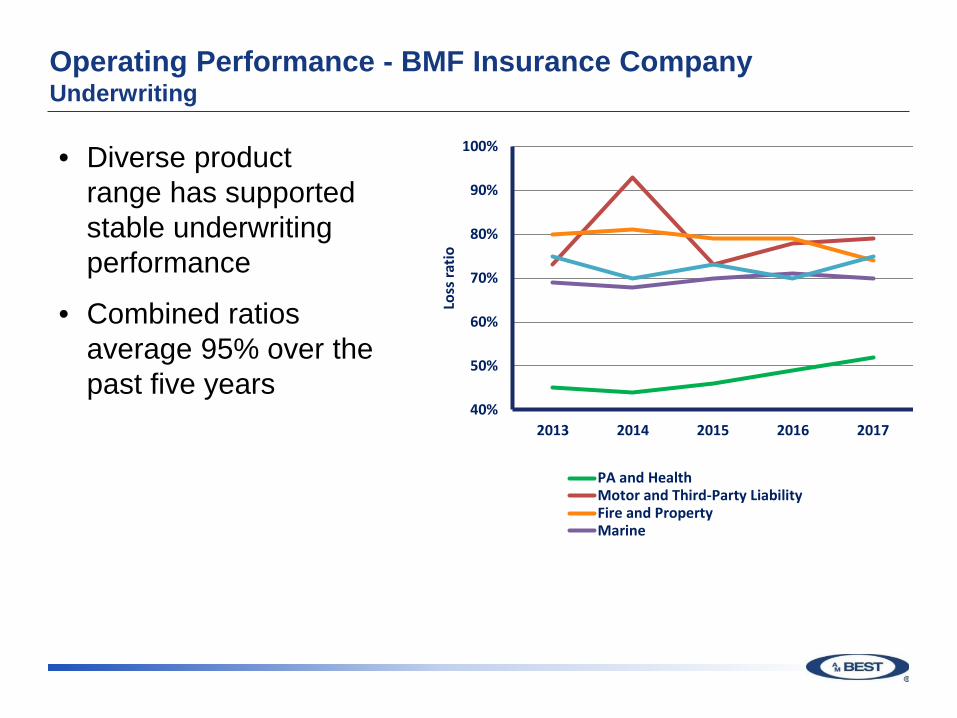
• Diverse product range has supported stable underwriting performance
• Combined ratios average 95% over the past five years
40%
50%
60%
70%
80%
90%
100%
2013 2014 2015 2016 2017Lo
ss ra
tio
PA and HealthMotor and Third-Party LiabilityFire and PropertyMarine
Operating Performance - BMF Insurance CompanyUnderwriting
2013 2014 2015 2016 2017 2018e 2019e
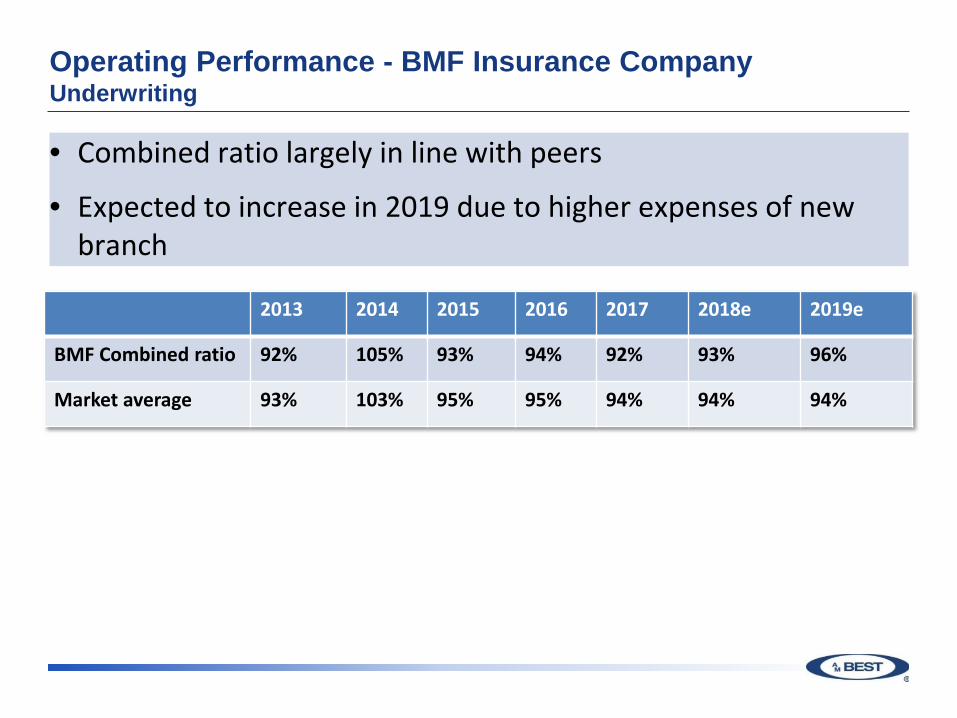
BMF Combined ratio 92% 105% 93% 94% 92% 93% 96%
Market average 93% 103% 95% 95% 94% 94% 94%
• Combined ratio largely in line with peers
• Expected to increase in 2019 due to higher expenses of new branch
Operating Performance - BMF Insurance CompanyInvestment income
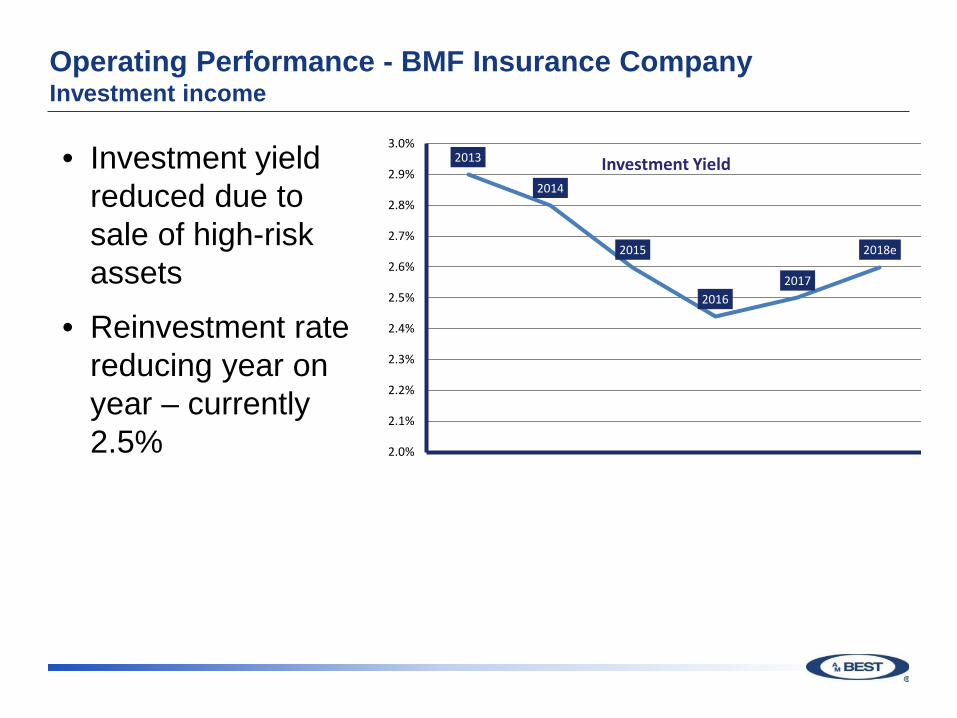
• Investment yield reduced due to sale of high-risk assets
• Reinvestment rate reducing year on year – currently 2.5%
2013
2014
2015
20162017
2018e
2.0%
2.1%
2.2%
2.3%
2.4%
2.5%
2.6%
2.7%
2.8%
2.9%
3.0%
Investment Yield
Operating Performance - BMF Insurance CompanySummary
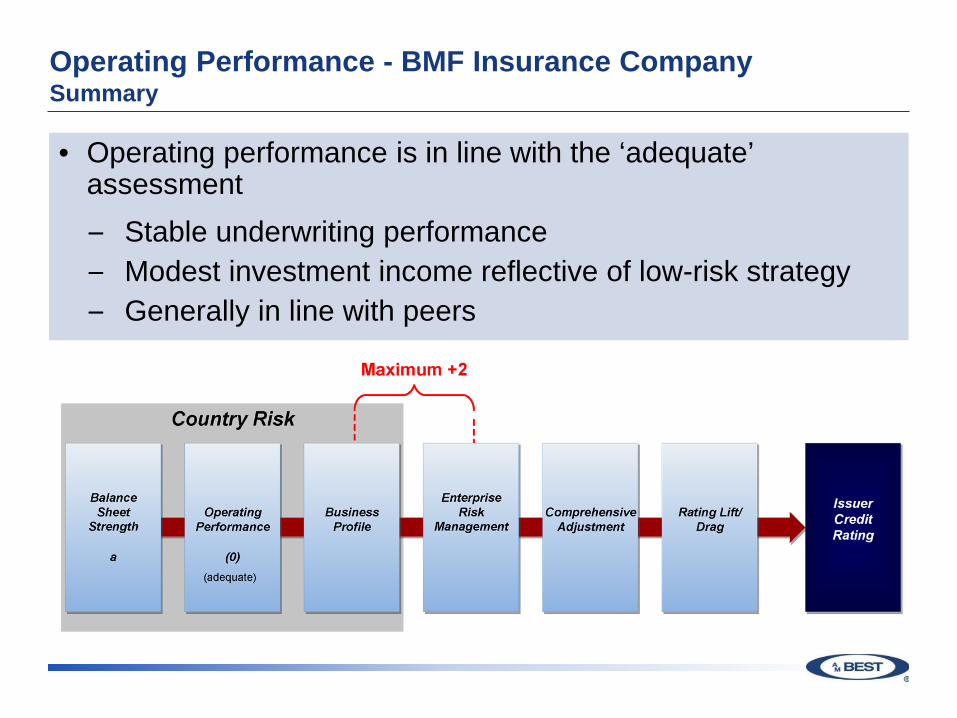
• Operating performance is in line with the ‘adequate’ assessment– Stable underwriting performance– Modest investment income reflective of low-risk strategy– Generally in line with peers
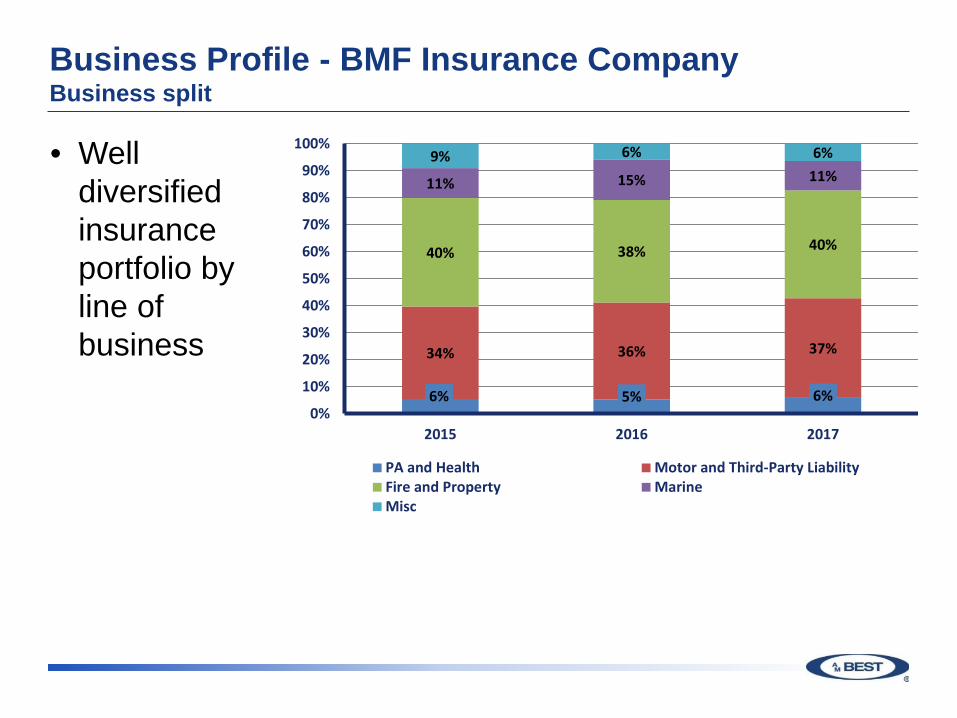
Business Profile - BMF Insurance CompanyBusiness split
• Well diversified insurance portfolio by line of business
6% 5% 6%
34% 36% 37%
40% 38% 40%
11% 15% 11%9% 6% 6%
0%
10%
20%
30%
40%
50%
60%
70%
80%
90%
100%
2015 2016 2017
PA and Health Motor and Third-Party LiabilityFire and Property MarineMisc
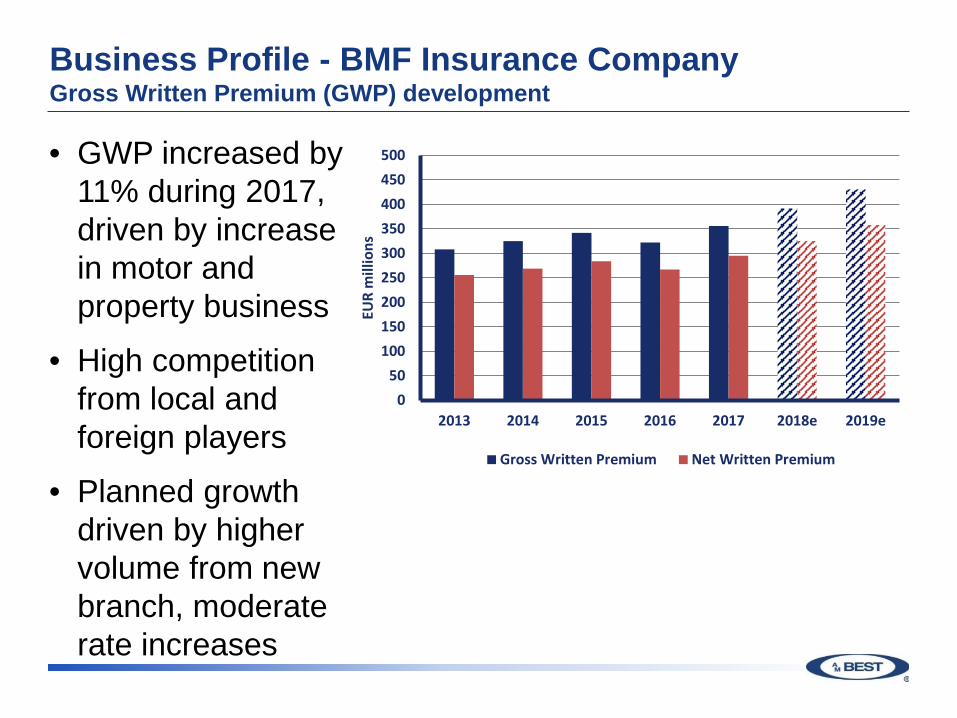
Business Profile - BMF Insurance CompanyGross Written Premium (GWP) development
• GWP increased by 11% during 2017, driven by increase in motor and property business
• High competition from local and foreign players
• Planned growth driven by higher volume from new branch, moderate rate increases
050
100150200250300350400450500
2013 2014 2015 2016 2017 2018e 2019e
EUR
mill
ions
Gross Written Premium Net Written Premium
Business Profile - BMF Insurance CompanyBusiness plans
• Geographically concentrated, only writing local business
• Plans to open a branch in a neighbouring country in 2019 to diversify geographically
• Growth of 10 - 15% expected over each of the next three years, includes growth via new branch
• New branch represents execution risk
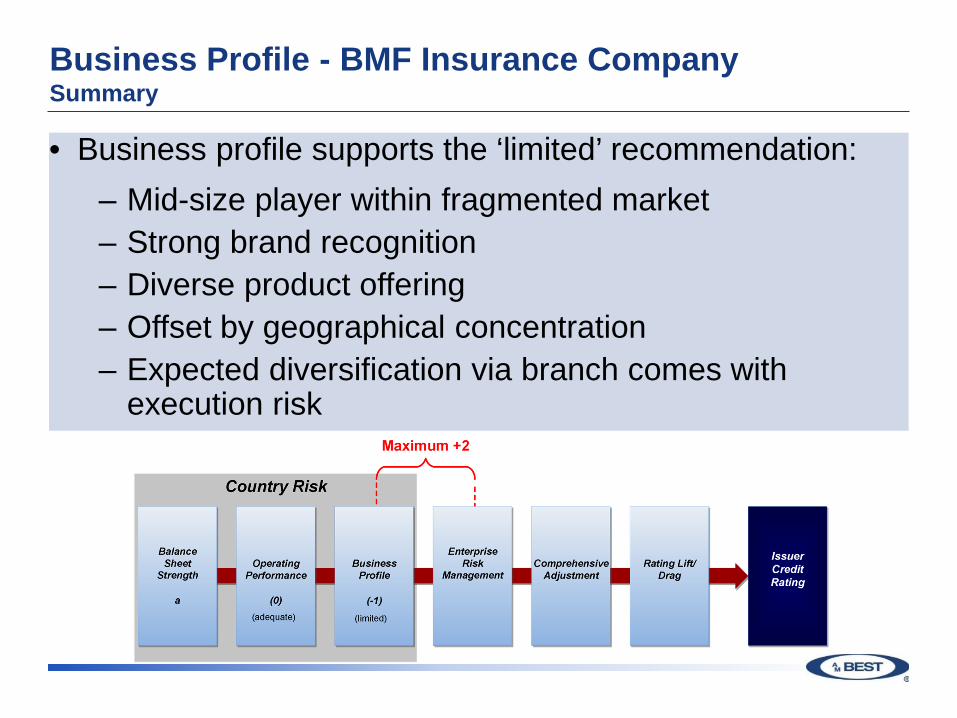
Business Profile - BMF Insurance CompanySummary
• Business profile supports the ‘limited’ recommendation: – Mid-size player within fragmented market– Strong brand recognition– Diverse product offering– Offset by geographical concentration– Expected diversification via branch comes with
execution risk
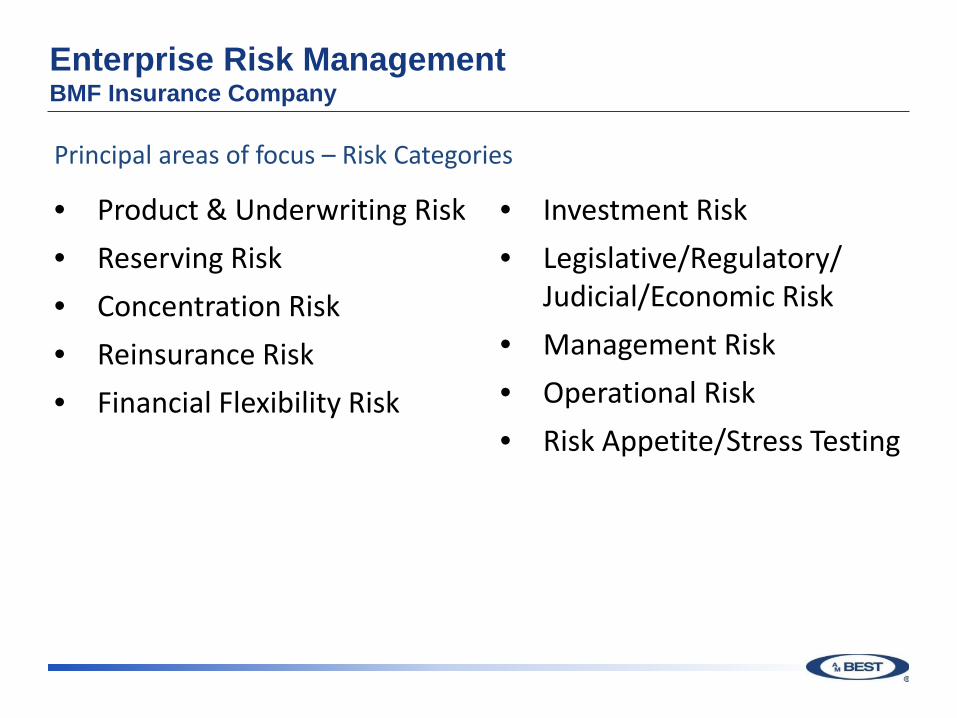
Enterprise Risk ManagementBMF Insurance Company
Principal areas of focus – Risk Categories
• Product & Underwriting Risk• Reserving Risk• Concentration Risk• Reinsurance Risk• Financial Flexibility Risk
• Investment Risk• Legislative/Regulatory/
Judicial/Economic Risk• Management Risk• Operational Risk• Risk Appetite/Stress Testing
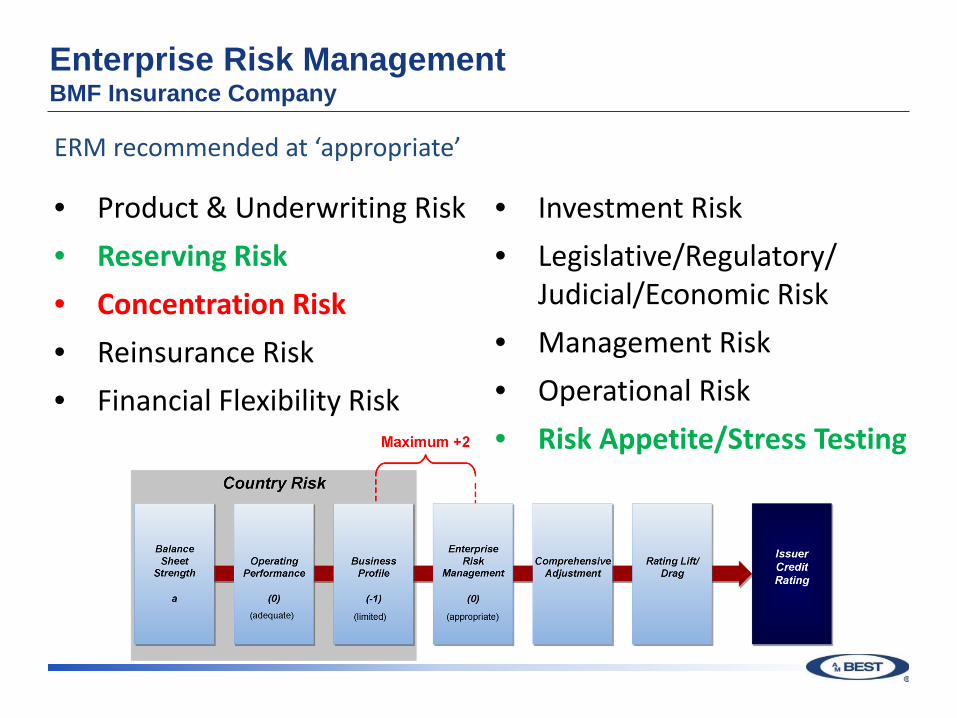
Enterprise Risk ManagementBMF Insurance Company
• Product & Underwriting Risk• Reserving Risk• Concentration Risk• Reinsurance Risk• Financial Flexibility Risk
• Investment Risk• Legislative/Regulatory/
Judicial/Economic Risk• Management Risk• Operational Risk• Risk Appetite/Stress Testing
ERM recommended at ‘appropriate’
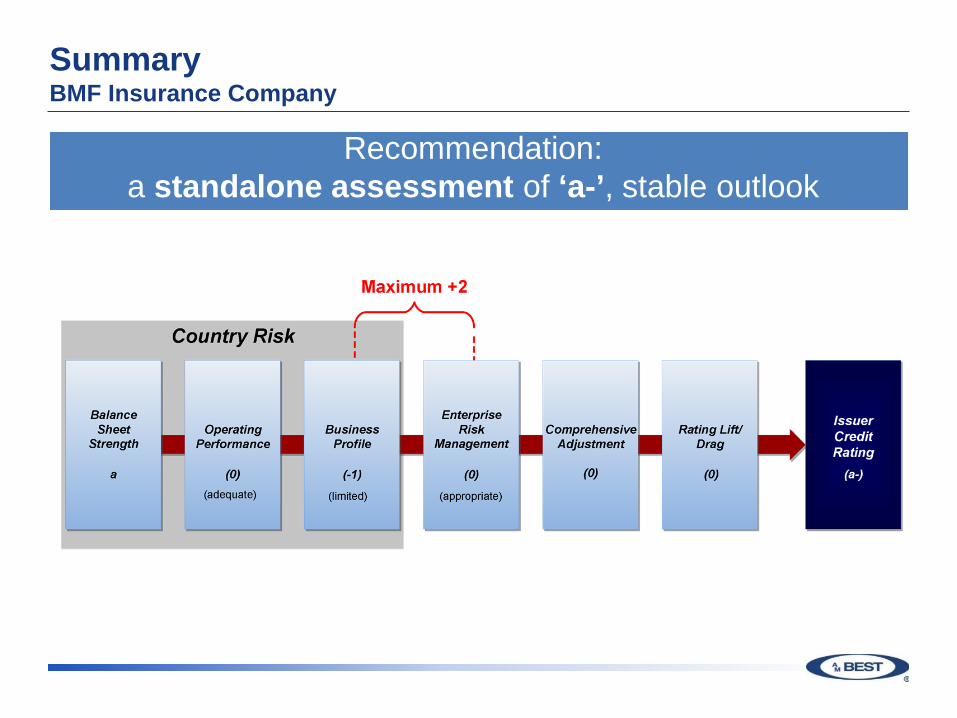
SummaryBMF Insurance Company
Recommendation: a standalone assessment of ‘a-’, stable outlook

Q&A
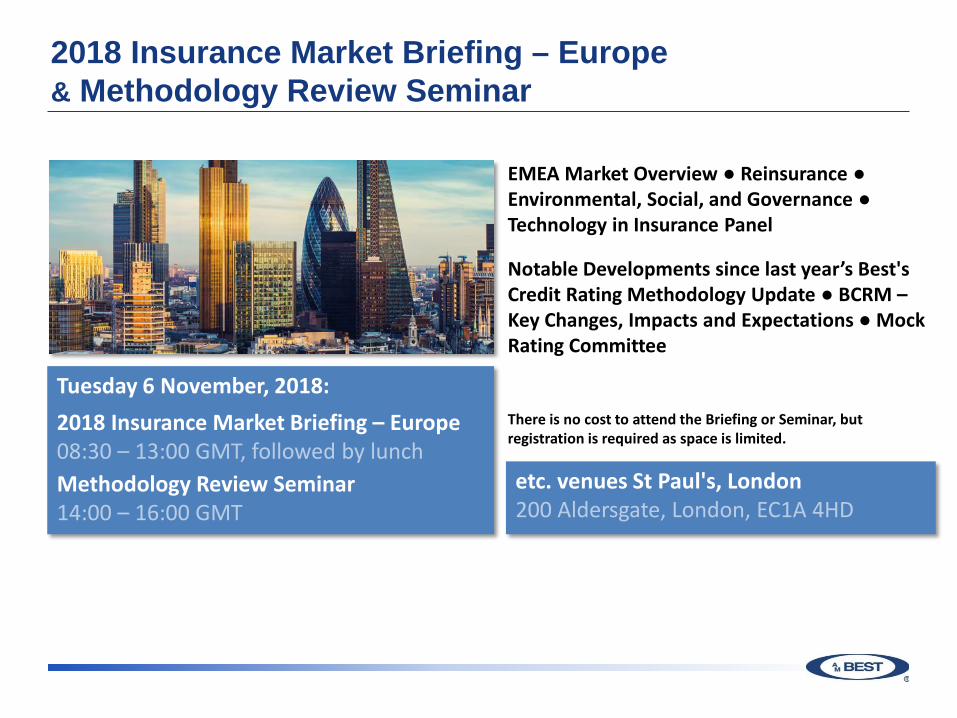
2018 Insurance Market Briefing – Europe& Methodology Review Seminar
Tuesday 6 November, 2018:2018 Insurance Market Briefing – Europe08:30 – 13:00 GMT, followed by lunchMethodology Review Seminar14:00 – 16:00 GMT
etc. venues St Paul's, London200 Aldersgate, London, EC1A 4HD
EMEA Market Overview ● Reinsurance ●Environmental, Social, and Governance ●Technology in Insurance Panel
Notable Developments since last year’s Best's Credit Rating Methodology Update ● BCRM –Key Changes, Impacts and Expectations ● Mock Rating Committee
There is no cost to attend the Briefing or Seminar, but registration is required as space is limited.

2018 Insurance Market Briefing -Germany
Hotel Pullman, Cologne – 27 September 2018