Embed Size (px)
Citation preview
2006
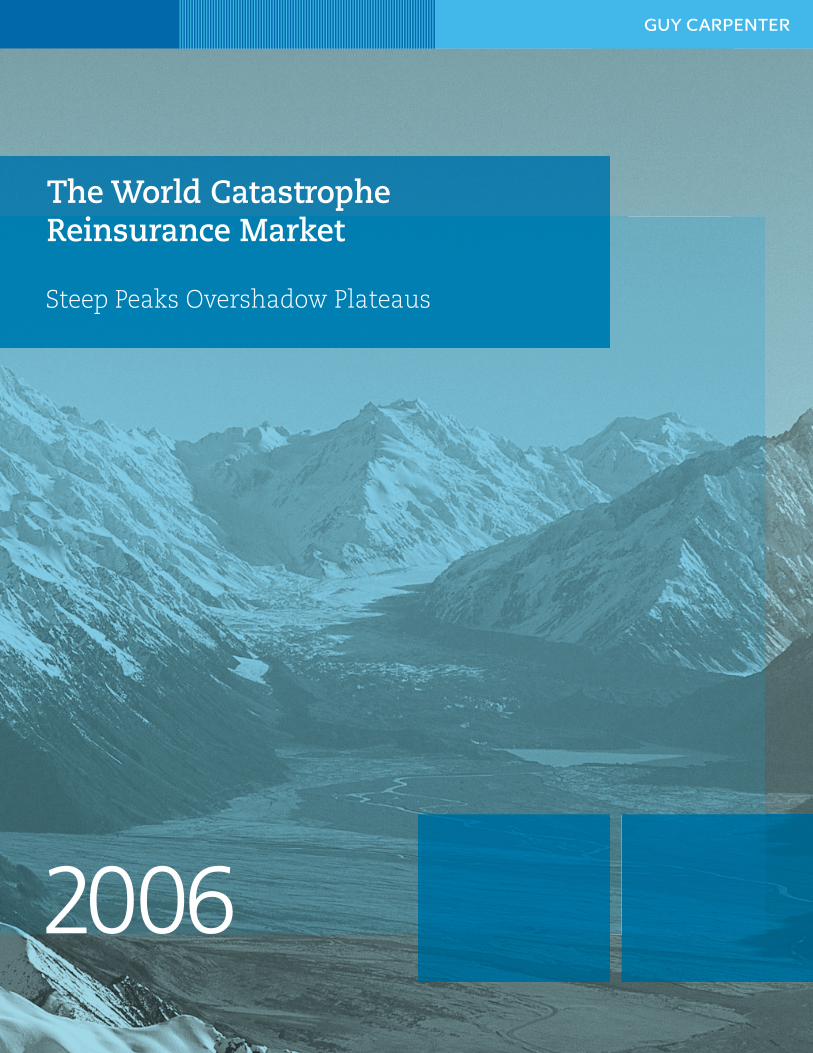
The World CatastropheReinsurance Market
Steep Peaks Overshadow Plateaus
1 Foreword
2 Executive Summary
3 Introduction
9 North America
10 United States
20 Canada
23 Asia Pacific
24 Japan
30 Australia and New Zealand
33 Southeast Asia
37 Republic of Korea
39 Taiwan
43 Europe
45 United Kingdom
51 France
54 Germany
57 Austria
59 Italy
61 Nordic Region
63 The Netherlands
66 Belgium
69 Switzerland
71 Central and Eastern Europe
74 Portugal
77 Turkey
79 Latin America and Caribbean
80 Mexico
82 Chile
83 Peru
85 Caribbean Region
88 Africa
89 South Africa
93 Namibia
95 The Last Word
96 Appendix A: Government Catastrophe Programs for Natural Hazards
103 Appendix B: Global Terror Insurance Market Survey
109 Appendix C: Summary of Catastrophe Bond Transactions
114 Recent Guy Carpenter Publications of Note
Contents
Contents
The World Catastrophe Reinsurance Market is a study of property catastrophe reinsurance marketsin 22 countries and four regions, representing more than 90 percent of the worldwide marketfor catastrophe reinsurance.
Each chapter reviews catastrophe exposures and the availability of insurance from eitherprivate or government sources to cover losses from catastrophes. We also summarize respectivemarket conditions in catastrophe reinsurance. This report takes into account natural catastro-phes caused by such perils as typhoons and earthquakes, as well as the major new peril of theearly 21st century, namely terrorist acts.
This past year was one for the record books, with insured losses reaching USD83 billion – about70 percent higher than the prior record of USD48 billion in 2004. It was also a year of extremelyhard market conditions for some cedents. One promising development in 2006 has been theway in which the market differentiated between highly exposed zones from Mexico to Maine,and most other regions of the world. Rather than rush to the exits from the catastrophereinsurance picture show, reinsurers in most parts of the globe stood their ground. Theydistinguished between areas where there was clear evidence of increased risk and areas whereperceived risks remained relatively stable. In brief, the market generally reacted in a highlyintelligent and discerning manner. Such a measured approach on the part of the industry isunique in itself and a hopeful sign for the future.
In preparing this document, we engage the services of our colleagues around the globe, and wegratefully acknowledge their contributions. We also thank the organizations that graciouslyallowed us to reproduce their material.
Each year that we publish this report, we endeavor to deliver more insightful research. We hopethis new issue provides added value to those interested in the global reinsurance catastrophemarketplace, and we welcome your comments and suggestions for future reports.
David SpillerPresident and Chief Executive Officer
Foreword
Foreword
1
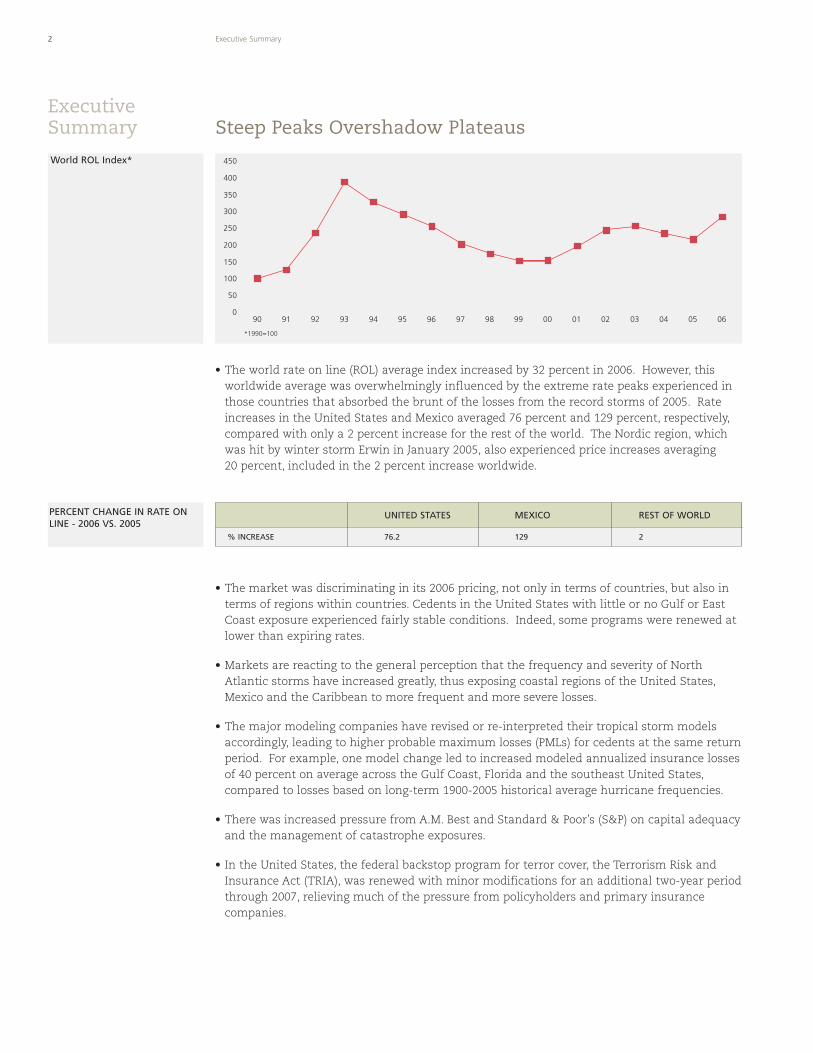
• The world rate on line (ROL) average index increased by 32 percent in 2006. However, thisworldwide average was overwhelmingly influenced by the extreme rate peaks experienced inthose countries that absorbed the brunt of the losses from the record storms of 2005. Rateincreases in the United States and Mexico averaged 76 percent and 129 percent, respectively,compared with only a 2 percent increase for the rest of the world. The Nordic region, whichwas hit by winter storm Erwin in January 2005, also experienced price increases averaging20 percent, included in the 2 percent increase worldwide.
• The market was discriminating in its 2006 pricing, not only in terms of countries, but also interms of regions within countries. Cedents in the United States with little or no Gulf or EastCoast exposure experienced fairly stable conditions. Indeed, some programs were renewed atlower than expiring rates.
• Markets are reacting to the general perception that the frequency and severity of NorthAtlantic storms have increased greatly, thus exposing coastal regions of the United States,Mexico and the Caribbean to more frequent and more severe losses.
• The major modeling companies have revised or re-interpreted their tropical storm modelsaccordingly, leading to higher probable maximum losses (PMLs) for cedents at the same returnperiod. For example, one model change led to increased modeled annualized insurance lossesof 40 percent on average across the Gulf Coast, Florida and the southeast United States,compared to losses based on long-term 1900-2005 historical average hurricane frequencies.
• There was increased pressure from A.M. Best and Standard & Poor’s (S&P) on capital adequacyand the management of catastrophe exposures.
• In the United States, the federal backstop program for terror cover, the Terrorism Risk andInsurance Act (TRIA), was renewed with minor modifications for an additional two-year periodthrough 2007, relieving much of the pressure from policyholders and primary insurancecompanies.
2 Executive Summary
ExecutiveSummary
*1990=100
450
400
350
300
250
200
150
100
50
090 9291 93 94 95 96 97 98 99 00 01 02 03 04 05 06
UNITED STATES MEXICO REST OF WORLD
% INCREASE 76.2 129 2
PERCENT CHANGE IN RATE ONLINE - 2006 VS. 2005
Steep Peaks Overshadow Plateaus
World ROL Index*
3Introduction
Introduction
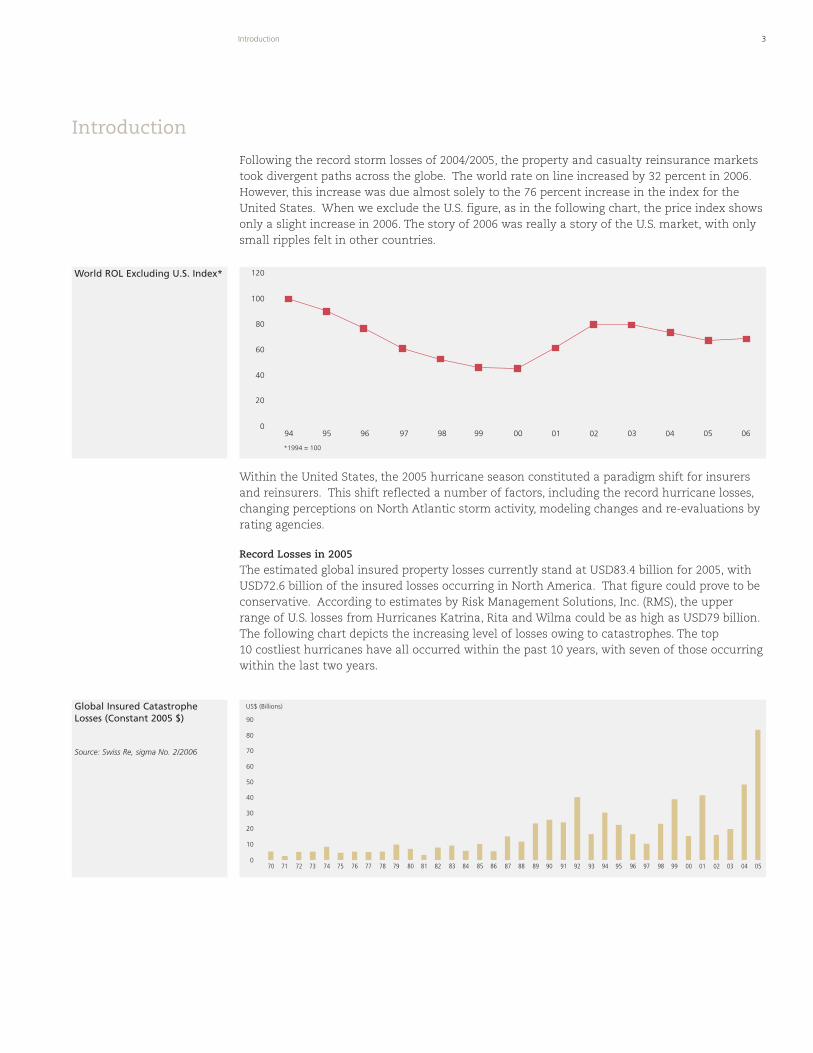
Following the record storm losses of 2004/2005, the property and casualty reinsurance marketstook divergent paths across the globe. The world rate on line increased by 32 percent in 2006.However, this increase was due almost solely to the 76 percent increase in the index for theUnited States. When we exclude the U.S. figure, as in the following chart, the price index showsonly a slight increase in 2006. The story of 2006 was really a story of the U.S. market, with onlysmall ripples felt in other countries.
Within the United States, the 2005 hurricane season constituted a paradigm shift for insurersand reinsurers. This shift reflected a number of factors, including the record hurricane losses,changing perceptions on North Atlantic storm activity, modeling changes and re-evaluations byrating agencies.
Record Losses in 2005
The estimated global insured property losses currently stand at USD83.4 billion for 2005, withUSD72.6 billion of the insured losses occurring in North America. That figure could prove to beconservative. According to estimates by Risk Management Solutions, Inc. (RMS), the upperrange of U.S. losses from Hurricanes Katrina, Rita and Wilma could be as high as USD79 billion.The following chart depicts the increasing level of losses owing to catastrophes. The top10 costliest hurricanes have all occurred within the past 10 years, with seven of those occurringwithin the last two years.
120
100
80
60
40
20
094
*1994 = 100
95 96 97 98 99 00 01 02 03 04 05 06
World ROL Excluding U.S. Index*
0
10
20
30
40
50
60
70
80
90
US$ (Billions)
70 71 72 73 74 75 76 77 78 79 80 81 82 83 84 85 86 87 88 89 90 91 92 93 94 95 96 97 98 99 00 01 02 03 04 05
Global Insured CatastropheLosses (Constant 2005 $)
Source: Swiss Re, sigma No. 2/2006
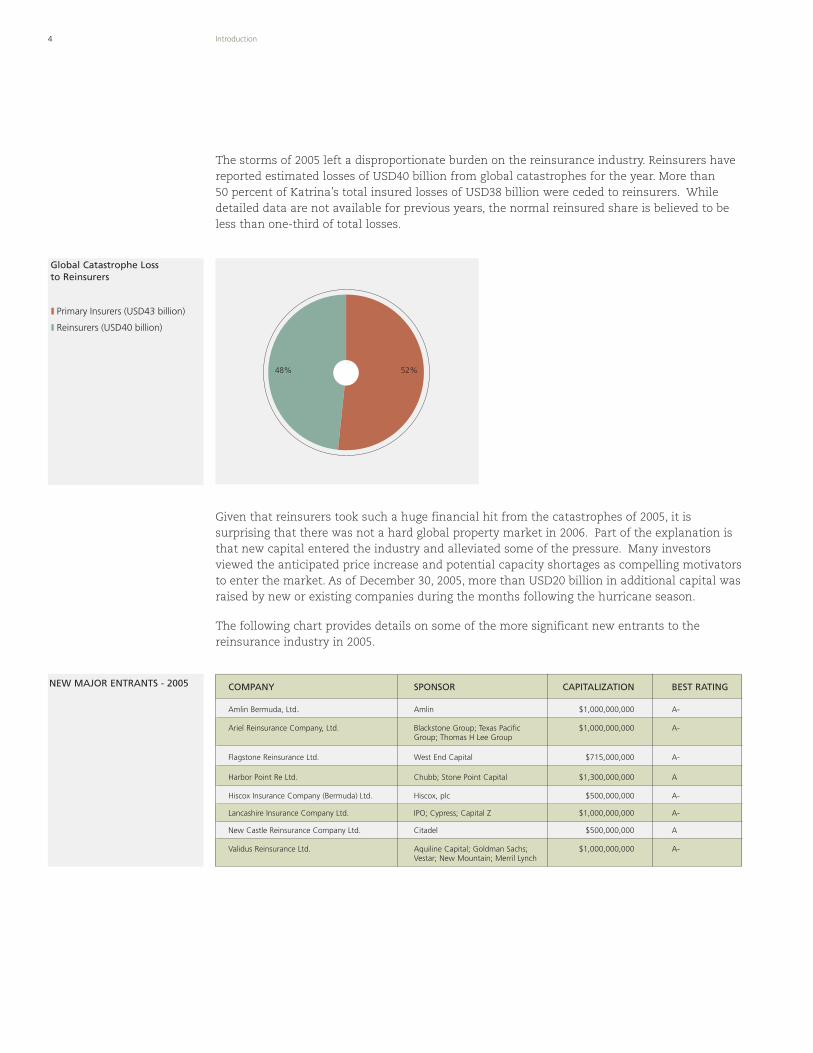
The storms of 2005 left a disproportionate burden on the reinsurance industry. Reinsurers havereported estimated losses of USD40 billion from global catastrophes for the year. More than50 percent of Katrina’s total insured losses of USD38 billion were ceded to reinsurers. Whiledetailed data are not available for previous years, the normal reinsured share is believed to beless than one-third of total losses.
Given that reinsurers took such a huge financial hit from the catastrophes of 2005, it issurprising that there was not a hard global property market in 2006. Part of the explanation isthat new capital entered the industry and alleviated some of the pressure. Many investorsviewed the anticipated price increase and potential capacity shortages as compelling motivatorsto enter the market. As of December 30, 2005, more than USD20 billion in additional capital wasraised by new or existing companies during the months following the hurricane season.
The following chart provides details on some of the more significant new entrants to thereinsurance industry in 2005.
Global Catastrophe Loss to Reinsurers
4 Introduction
Primary Insurers (USD43 billion)
Reinsurers (USD40 billion)
52%48%
NEW MAJOR ENTRANTS - 2005 COMPANY SPONSOR CAPITALIZATION BEST RATING
Amlin Bermuda, Ltd. Amlin $1,000,000,000 A-
Ariel Reinsurance Company, Ltd. Blackstone Group; Texas Pacific $1,000,000,000 A-Group; Thomas H Lee Group
Flagstone Reinsurance Ltd. West End Capital $715,000,000 A-
Harbor Point Re Ltd. Chubb; Stone Point Capital $1,300,000,000 A
Hiscox Insurance Company (Bermuda) Ltd. Hiscox, plc $500,000,000 A-
Lancashire Insurance Company Ltd. IPO; Cypress; Capital Z $1,000,000,000 A-
New Castle Reinsurance Company Ltd. Citadel $500,000,000 A
Validus Reinsurance Ltd. Aquiline Capital; Goldman Sachs; $1,000,000,000 A-Vestar; New Mountain; Merril Lynch
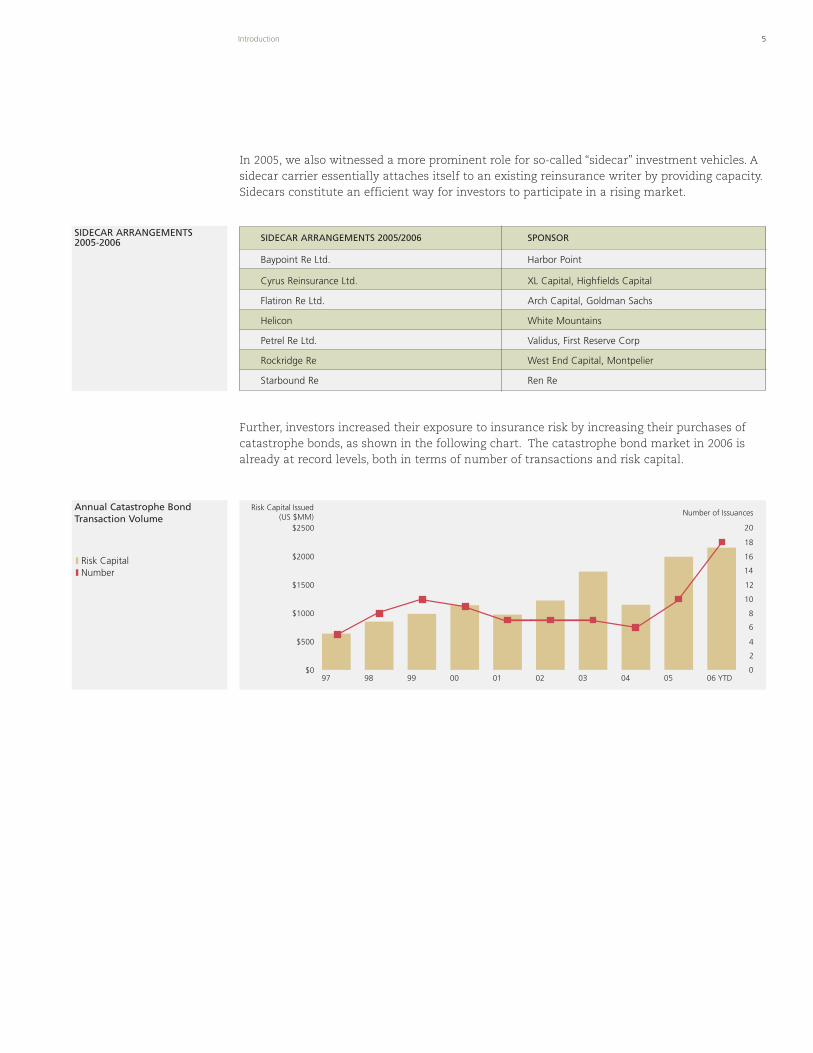
In 2005, we also witnessed a more prominent role for so-called “sidecar” investment vehicles. Asidecar carrier essentially attaches itself to an existing reinsurance writer by providing capacity.Sidecars constitute an efficient way for investors to participate in a rising market.
Further, investors increased their exposure to insurance risk by increasing their purchases ofcatastrophe bonds, as shown in the following chart. The catastrophe bond market in 2006 isalready at record levels, both in terms of number of transactions and risk capital.
Annual Catastrophe BondTransaction Volume
5Introduction
SIDECAR ARRANGEMENTS 2005-2006
$0
$500
$1000
$1500
$2000
$2500
97 98 99 00 01 02 03 04 05 06 YTD
Risk Capital Issued(US $MM)
0
2
4
6
8
10
12
14
16
18
20
Number of Issuances
Risk Capital Number
SIDECAR ARRANGEMENTS 2005/2006 SPONSOR
Baypoint Re Ltd. Harbor Point
Cyrus Reinsurance Ltd. XL Capital, Highfields Capital
Flatiron Re Ltd. Arch Capital, Goldman Sachs
Helicon White Mountains
Petrel Re Ltd. Validus, First Reserve Corp
Rockridge Re West End Capital, Montpelier
Starbound Re Ren Re
6 Introduction
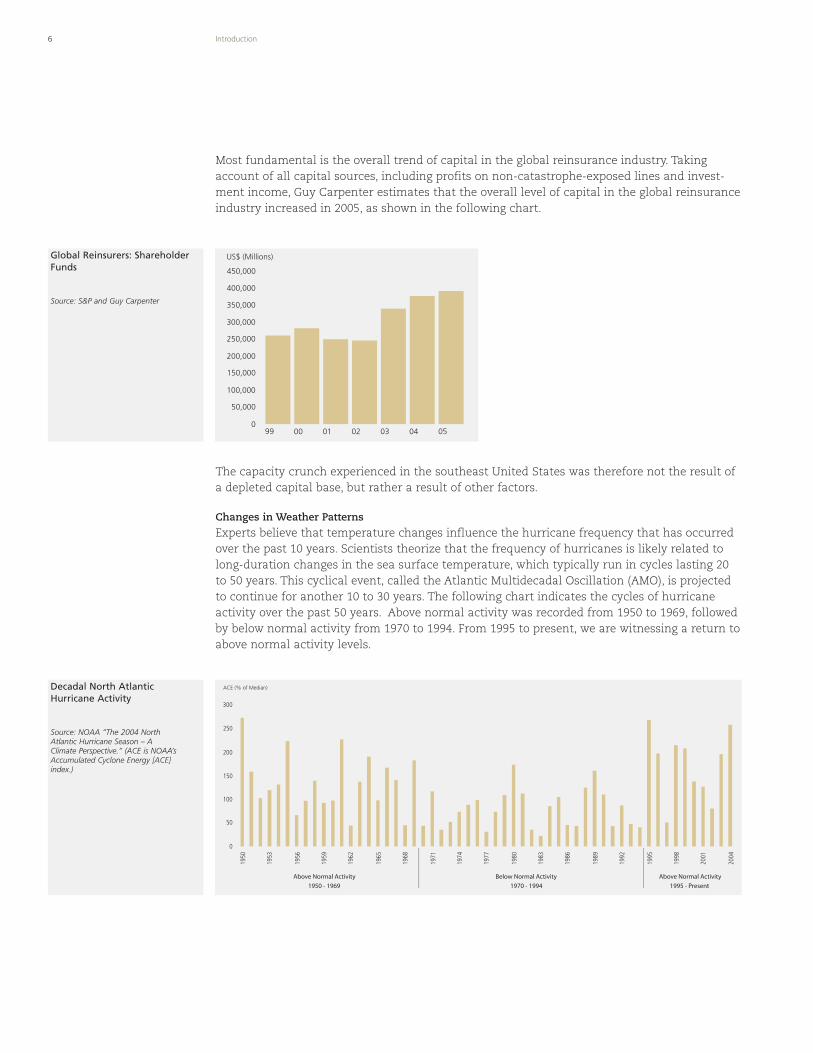
Most fundamental is the overall trend of capital in the global reinsurance industry. Takingaccount of all capital sources, including profits on non-catastrophe-exposed lines and invest-ment income, Guy Carpenter estimates that the overall level of capital in the global reinsuranceindustry increased in 2005, as shown in the following chart.
The capacity crunch experienced in the southeast United States was therefore not the result ofa depleted capital base, but rather a result of other factors.
Changes in Weather Patterns
Experts believe that temperature changes influence the hurricane frequency that has occurredover the past 10 years. Scientists theorize that the frequency of hurricanes is likely related tolong-duration changes in the sea surface temperature, which typically run in cycles lasting 20to 50 years. This cyclical event, called the Atlantic Multidecadal Oscillation (AMO), is projectedto continue for another 10 to 30 years. The following chart indicates the cycles of hurricaneactivity over the past 50 years. Above normal activity was recorded from 1950 to 1969, followedby below normal activity from 1970 to 1994. From 1995 to present, we are witnessing a return toabove normal activity levels.
450,000
400,000
300,000
250,000
200,000
150,000
100,000
50,000
099 00 01 02 03 04 05
350,000
US$ (Millions)
0
50
100
150
200
250
300
ACE (% of Median)
1950
1953
1956
1959
1962
1965
1968
1971
1974
1977
1980
1983
1986
1989
1992
1995
1998
2001
2004
Above Normal Activity Below Normal Activity Above Normal Activity
1950 - 1969 1970 - 1994 1995 - Present
Global Reinsurers: ShareholderFunds
Source: S&P and Guy Carpenter
Decadal North AtlanticHurricane Activity
Source: NOAA “The 2004 NorthAtlantic Hurricane Season – AClimate Perspective.” (ACE is NOAA’sAccumulated Cyclone Energy [ACE]index.)
7Introduction
Modeling Changes
On March 23, 2006, RMS announced that it will begin using a five-year, forward-looking view ofrisk for estimating potential catastrophe losses instead of a long-term historical average base-line in its modeling. This is being done to address the perception that there will likely be aperiod of elevated frequency and intensity of storms “driven by higher sea surface temperaturesin the tropical North Atlantic and by associated changes in atmospheric circulation.” As aresult, the RMS U.S. hurricane model will increase modeled annualized insurance losses by40 percent on average across the Gulf Coast, Florida and the southeast United States, and by25 percent to 30 percent in the Middle Atlantic and northeast coastal regions, relative to thosederived using long-term 1900-2005 historical average hurricane frequencies.
AIR Worldwide Corporation (AIR) did not change its model but emphasized its existingcustomizing tool, which allows users to adopt a more severe storm forecast than is in itsstandard model.
EQECAT agrees that weather cycles greatly influence the short-term frequency of hurricanesand will be providing a near-term frequency perspective as an alternative to the long-term riskmodel. A short-term, or near-term, risk view of 10 to 15 years will be a supplemental view in2006. These frequency settings will be based on the multidecadal oscillation theory. EQECATanticipates that loss results could more than double based on this perspective.
Rating Agencies
Rating agencies also changed their methodologies as a result of the severe hurricane season. Inthe fall of 2005, A.M. Best announced that it would continue to use the Best’s Capital AdequacyRatio (BCAR) but will update the underwriting risks to reflect current environmental factors.The currently published BCAR subtracts the after-tax impact of one net catastrophe PML(one-in-100 wind event or one-in-250 earthquake event). In mid-2005, A.M. Best introduced astress test to monitor the impact of a second catastrophe event on the BCAR for all insurers.Until now, A.M. Best had used a one-in-50 wind event or a one-in-100 quake event; it nowintends to use a one-in-100 wind event or a one-in-100 quake event as a secondary catastropheevent. According to A.M. Best, ratings downgrades are unlikely. However, reinsurers areresponding to this by reducing limits in high catastrophe zones, as well as attempting to moveexposures to retrocession, sidecars or catastrophe bonds.
On March 21, 2006, Standard & Poor’s reiterated that its criteria for measuring catastrophe riskfor primary insurers will be revised. The revised criteria will include an exposure-based catas-trophe capital charge for insurers, similar to the capital charges for reinsurers. This charge willbe based on the net expected annual aggregate property losses for all perils at the one-in-250return period level.
Companies could face negative rating actions if the new criteria reveal previously uncaptured orpoorly managed catastrophe risk. There will be a six- to twelve-month phase-in period to allowcompanies to adjust their risk profiles. The criteria for reinsurers are not changing. Themajority of unfavorable rating changes resulting solely from this criteria change will occur in2007 for companies that do not manage their risks to a level consistent with their currentratings.
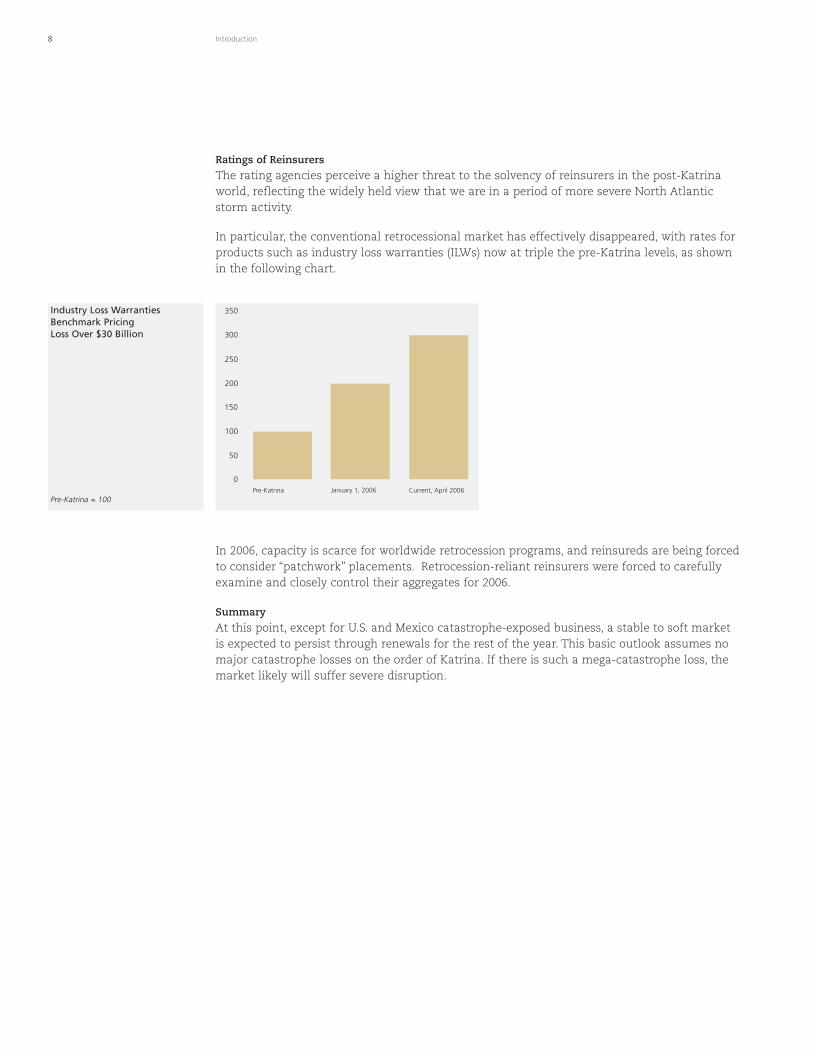
Industry Loss WarrantiesBenchmark PricingLoss Over $30 Billion
Pre-Katrina = 100
8 Introduction
Ratings of Reinsurers
The rating agencies perceive a higher threat to the solvency of reinsurers in the post-Katrinaworld, reflecting the widely held view that we are in a period of more severe North Atlanticstorm activity.
In particular, the conventional retrocessional market has effectively disappeared, with rates forproducts such as industry loss warranties (ILWs) now at triple the pre-Katrina levels, as shownin the following chart.
In 2006, capacity is scarce for worldwide retrocession programs, and reinsureds are being forcedto consider “patchwork” placements. Retrocession-reliant reinsurers were forced to carefullyexamine and closely control their aggregates for 2006.
Summary
At this point, except for U.S. and Mexico catastrophe-exposed business, a stable to soft marketis expected to persist through renewals for the rest of the year. This basic outlook assumes nomajor catastrophe losses on the order of Katrina. If there is such a mega-catastrophe loss, themarket likely will suffer severe disruption.
Current, April 2006
0
50
100
150
200
350
300
250
Pre-Katrina January 1, 2006
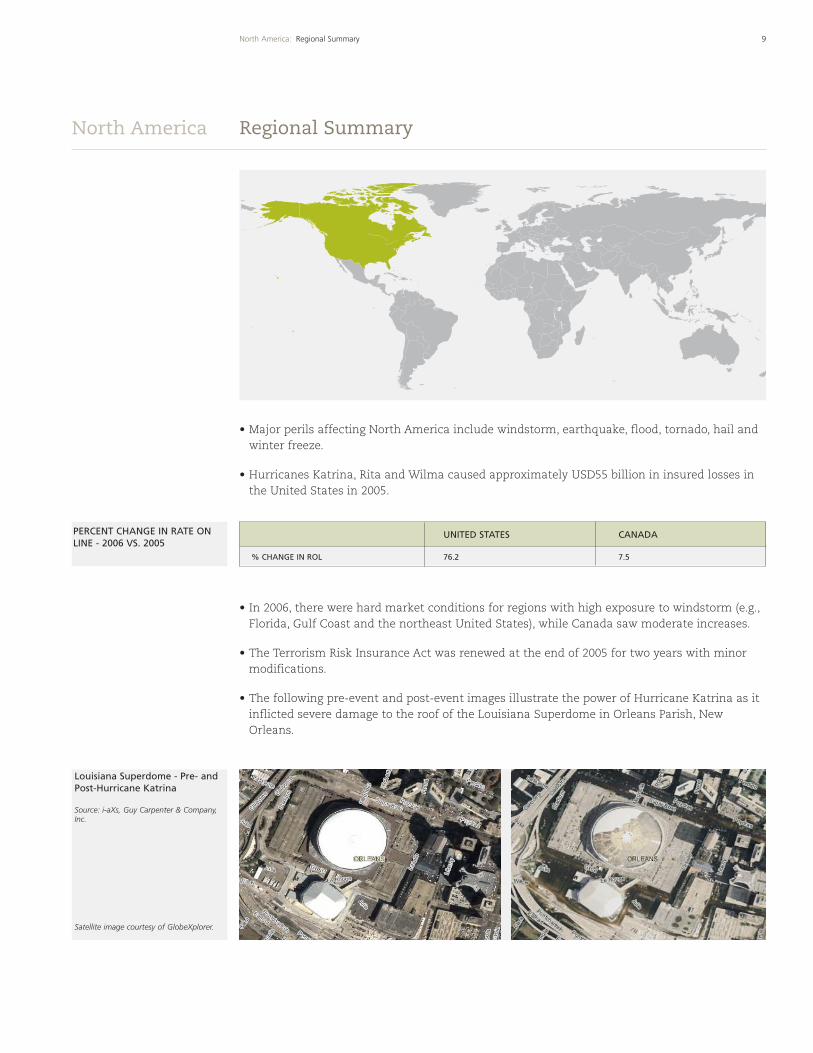
• Major perils affecting North America include windstorm, earthquake, flood, tornado, hail andwinter freeze.
• Hurricanes Katrina, Rita and Wilma caused approximately USD55 billion in insured losses inthe United States in 2005.
• In 2006, there were hard market conditions for regions with high exposure to windstorm (e.g.,Florida, Gulf Coast and the northeast United States), while Canada saw moderate increases.
• The Terrorism Risk Insurance Act was renewed at the end of 2005 for two years with minormodifications.
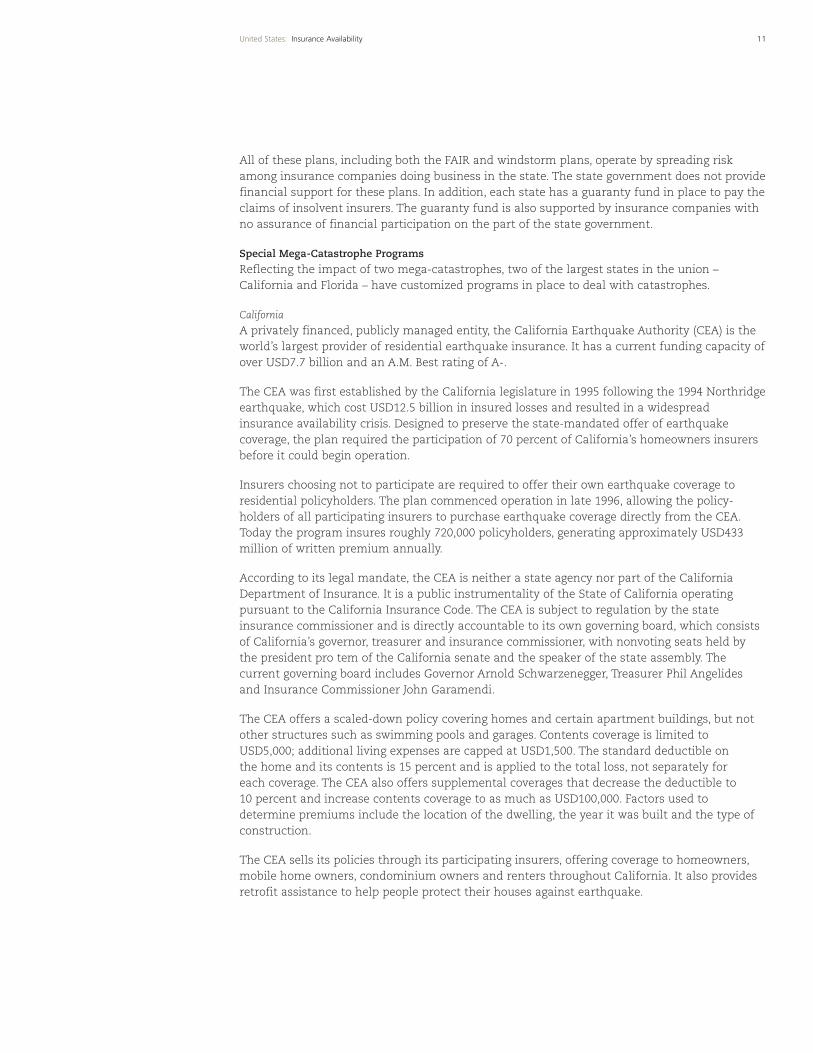
• The following pre-event and post-event images illustrate the power of Hurricane Katrina as itinflicted severe damage to the roof of the Louisiana Superdome in Orleans Parish, NewOrleans.
9North America: Regional Summary
Regional Summary
UNITED STATES CANADA
% CHANGE IN ROL 76.2 7.5
PERCENT CHANGE IN RATE ONLINE - 2006 VS. 2005
North America
Louisiana Superdome - Pre- andPost-Hurricane Katrina
Source: i-aXs, Guy Carpenter & Company,Inc.
Satellite image courtesy of GlobeXplorer.
10 United States: Catastrophe Exposure
United States
Catastrophe Exposure
Insurance Availability
The United States is exposed to the major hazards of earthquake, windstorm, tornado, wildfire,hail and flood. The Hawaiian Islands and both mainland coasts face the risk of tsunami. Overthe past decade, terrorism has caused enormous losses, most notably in the Oklahoma Citybombing of 1995 and the attacks on the World Trade Center in 1993 and on September 11, 2001.The losses from the terrorist attacks of September 11, 2001, surpassed all insured catastrophiclosses from the previous decade combined.
Most property policies, both residential and commercial, are written on an all-risk basis. Asopposed to named peril coverage, this means that they cover the majority of perils, including,but not limited to, tornado and hurricane as well as fire and explosion. Flood and earthquakeperils are normally excluded. In most states, earthquake cover is available as an endorsementor separate cover. A special program underwritten by the federal government covers the floodperil up to USD250,000 in insured value for residential exposures and USD500,000 for nonresi-dential exposures.
Over the years, there have been a number of problems with the availability of propertyinsurance. As far back as 1963, there was a pullback of insurance in the Los Angeles canyonsfollowing a major brushfire in Bel Air. Availability crises of this kind have led to a wide variety ofstate programs designed to improve availability in hazard-prone regions.
Prior to the events of September 11, 2001, terrorism was not excluded from the all-risk form. In2001 and 2002, insurers filed forms in all states to exclude the terror peril from most majorinsurance policies. The majority of states approved these filings. Notable exceptions were themajor states of California, New York and Florida.
In November 2002, the U.S. federal government set up a special program to cover the terrorperil, with the passage of the Terrorism Risk Insurance Act of 2002 (TRIA, or the “Act”). The Actmandates that commercial lines insurance companies offer terrorism cover to policyholders.Under the program, the federal government provides reinsurance to insurers for terrorismlosses in excess of relatively high retentions, which are set by the law. At year-end 2005, TRIAwas renewed for two years with minor modifications.
Catastrophe Programs in the United States
In the United States, a number of programs are in place to address the issue of “uninsurablerisks.” Uninsurable risks are risks that cannot get coverage from the “voluntary market” ofprivate insurance companies. For property risks, 31 states have Fair Access to InsuranceRequirements (FAIR) plans. These plans are mainly used to provide property insurance in innercities. However, in a number of states, they are used to cover other “hard to insure” exposures.In California, for example, the FAIR plan covers homes in certain areas exposed to brushfire; inNew York, the plan covers beachfront homes on Long Island.
Six southern states have windstorm plans, which provide coverage for wind peril alone. Until2002, Florida operated a windstorm plan, known as the Florida Windstorm UnderwritingAssociation (FWUA). In July 2002, the FWUA became part of Citizens Property InsuranceCorporation, as explained in the following Florida section.
All of these plans, including both the FAIR and windstorm plans, operate by spreading riskamong insurance companies doing business in the state. The state government does not providefinancial support for these plans. In addition, each state has a guaranty fund in place to pay theclaims of insolvent insurers. The guaranty fund is also supported by insurance companies withno assurance of financial participation on the part of the state government.
Special Mega-Catastrophe Programs
Reflecting the impact of two mega-catastrophes, two of the largest states in the union –California and Florida – have customized programs in place to deal with catastrophes.
California
A privately financed, publicly managed entity, the California Earthquake Authority (CEA) is theworld’s largest provider of residential earthquake insurance. It has a current funding capacity ofover USD7.7 billion and an A.M. Best rating of A-.
The CEA was first established by the California legislature in 1995 following the 1994 Northridgeearthquake, which cost USD12.5 billion in insured losses and resulted in a widespreadinsurance availability crisis. Designed to preserve the state-mandated offer of earthquakecoverage, the plan required the participation of 70 percent of California’s homeowners insurersbefore it could begin operation.
Insurers choosing not to participate are required to offer their own earthquake coverage toresidential policyholders. The plan commenced operation in late 1996, allowing the policy-holders of all participating insurers to purchase earthquake coverage directly from the CEA.Today the program insures roughly 720,000 policyholders, generating approximately USD433million of written premium annually.
According to its legal mandate, the CEA is neither a state agency nor part of the CaliforniaDepartment of Insurance. It is a public instrumentality of the State of California operatingpursuant to the California Insurance Code. The CEA is subject to regulation by the stateinsurance commissioner and is directly accountable to its own governing board, which consistsof California’s governor, treasurer and insurance commissioner, with nonvoting seats held bythe president pro tem of the California senate and the speaker of the state assembly. Thecurrent governing board includes Governor Arnold Schwarzenegger, Treasurer Phil Angelidesand Insurance Commissioner John Garamendi.
The CEA offers a scaled-down policy covering homes and certain apartment buildings, but notother structures such as swimming pools and garages. Contents coverage is limited toUSD5,000; additional living expenses are capped at USD1,500. The standard deductible onthe home and its contents is 15 percent and is applied to the total loss, not separately foreach coverage. The CEA also offers supplemental coverages that decrease the deductible to10 percent and increase contents coverage to as much as USD100,000. Factors used todetermine premiums include the location of the dwelling, the year it was built and the type ofconstruction.
The CEA sells its policies through its participating insurers, offering coverage to homeowners,mobile home owners, condominium owners and renters throughout California. It also providesretrofit assistance to help people protect their houses against earthquake.
11United States: Insurance Availability
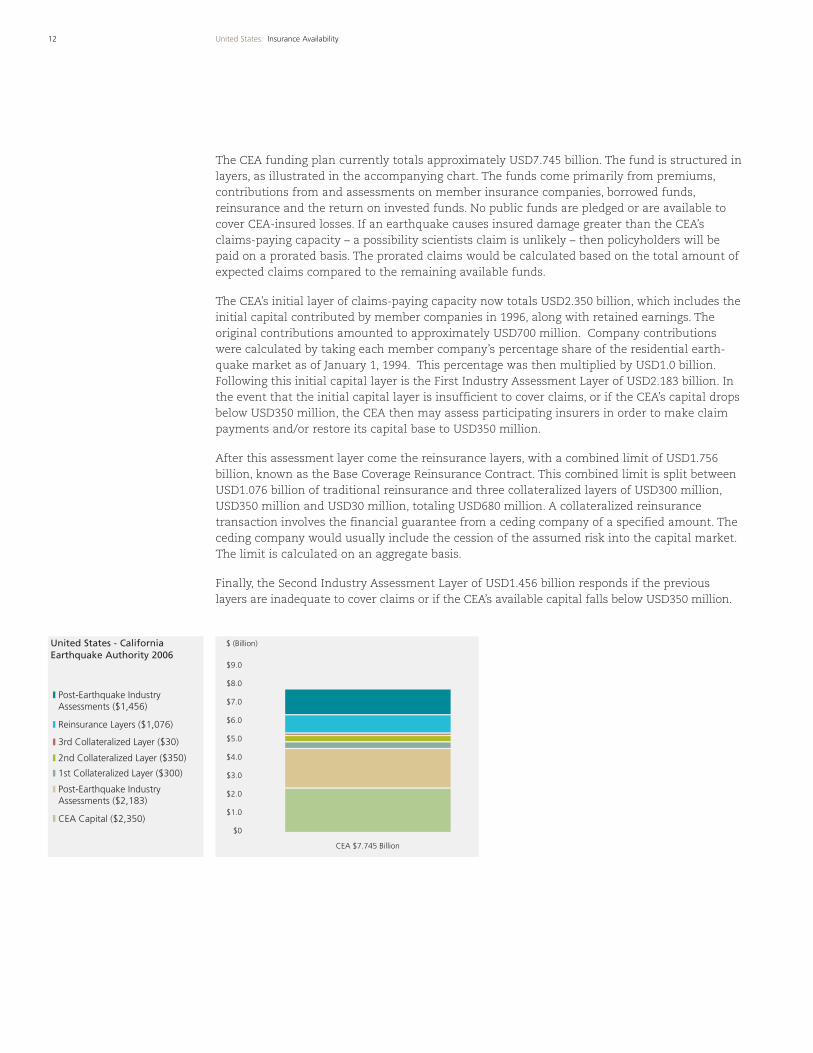
United States - CaliforniaEarthquake Authority 2006
12 United States: Insurance Availability
The CEA funding plan currently totals approximately USD7.745 billion. The fund is structured inlayers, as illustrated in the accompanying chart. The funds come primarily from premiums,contributions from and assessments on member insurance companies, borrowed funds,reinsurance and the return on invested funds. No public funds are pledged or are available tocover CEA-insured losses. If an earthquake causes insured damage greater than the CEA’sclaims-paying capacity – a possibility scientists claim is unlikely – then policyholders will bepaid on a prorated basis. The prorated claims would be calculated based on the total amount ofexpected claims compared to the remaining available funds.
The CEA’s initial layer of claims-paying capacity now totals USD2.350 billion, which includes theinitial capital contributed by member companies in 1996, along with retained earnings. Theoriginal contributions amounted to approximately USD700 million. Company contributionswere calculated by taking each member company’s percentage share of the residential earth-quake market as of January 1, 1994. This percentage was then multiplied by USD1.0 billion.Following this initial capital layer is the First Industry Assessment Layer of USD2.183 billion. Inthe event that the initial capital layer is insufficient to cover claims, or if the CEA’s capital dropsbelow USD350 million, the CEA then may assess participating insurers in order to make claimpayments and/or restore its capital base to USD350 million.
After this assessment layer come the reinsurance layers, with a combined limit of USD1.756billion, known as the Base Coverage Reinsurance Contract. This combined limit is split betweenUSD1.076 billion of traditional reinsurance and three collateralized layers of USD300 million,USD350 million and USD30 million, totaling USD680 million. A collateralized reinsurancetransaction involves the financial guarantee from a ceding company of a specified amount. Theceding company would usually include the cession of the assumed risk into the capital market.The limit is calculated on an aggregate basis.
Finally, the Second Industry Assessment Layer of USD1.456 billion responds if the previouslayers are inadequate to cover claims or if the CEA’s available capital falls below USD350 million.
3rd Collateralized Layer ($30)
CEA Capital ($2,350)
Post-Earthquake Industry Assessments ($2,183)
1st Collateralized Layer ($300)
Post-Earthquake Industry Assessments ($1,456)
Reinsurance Layers ($1,076)
2nd Collateralized Layer ($350)
$0
$1.0
$2.0
$3.0
$4.0
$5.0
$6.0
$9.0
$8.0
$7.0
$ (Billion)
CEA $7.745 Billion
13United States: Insurance Availability
Florida
Florida has a number of programs in place to alleviate the availability problems that developedin the state following Hurricane Andrew in 1992. These mechanisms were severely tested duringthe 2004 hurricane season, with The Office of Insurance Regulation reporting 1.7 million claims,encompassing all 67 counties in the state and causing an estimated USD21.8 billion in losses forthe four major storms.
The state-sponsored Florida Residential Property and Casualty Joint Underwriting Association(FRPCJUA), the residential insurance pool that was established after Hurricane Andrew toprovide insurance to Florida residents having difficulty obtaining coverage, grew to almost onemillion policies after Andrew. This entity became the “relief valve” for business as carriersnonrenewed business (within the guidelines of the state-imposed moratorium on cancellation)and established more appropriate PMLs. It also provided the opportunity for new capital to“jump start” an insurance operation by assuming some of the available volume under theFRPCJUA’s depopulation (or policy take-out) program.
In 2002, the Florida legislature passed a law that combined the FRPCJUA and the FloridaWindstorm Underwriting Association (FWUA), which offered policies covering “wind-only” alongthe coast. This resulted in the creation of Citizens Property Insurance Corporation (Citizens), atax-exempt entity that provides insurance to homeowners and commercial residentialproperties, as well as to commercial businesses in coastal high-risk areas and others whocannot find coverage in the open, private insurance market. The combined entity has againseen substantial growth after the 2004 hurricane season. Citizens is currently required bystatute to reduce its exposure by 2010.
Citizens operates like an insurance company in terms of issuing policies and paying claims. IfCitizens has a deficit, it is covered by assessments against insurers based on their market sharein the state. The assessments are ultimately passed on to policyholders, thereby distributing thecost to all policyholders in the state.
In 2004, the year of the four Florida hurricanes, Citizens had a deficit of USD516 million. Asurcharge of 6.8 percent on every residential policyholder was set to recover the 2004 deficit. In2005, Hurricanes Dennis, Katrina and Wilma added to this shortfall, with a deficit estimated atUSD1.77 billion. The state, however, appropriated USD715 million of general revenue to reducethis deficit to USD1.05 billion. By this and other financial means, including repaying part of thedeficit over a period of ten years, the surcharge on policyholders for the 2005 deficit wasreduced to a 2.07 percent regular assessment and a 1.2 percent emergency assessment.
Because its cash has been greatly reduced by the storms of 2004/2005, Citizens developed aliquidity facility of USD3.05 billion to enable it to pay claims on a timely basis in the currenthurricane season. Citizens Board has also approved an additional line of credit expected to totalUSD700 million.
The Florida Hurricane Catastrophe Fund (FHCF) is a state-run catastrophe reinsurance programdesigned to support insurers writing in the Florida marketplace. It was created followingHurricane Andrew to alleviate concerns about the availability of property reinsurance. Admittedinsurers who write residential and commercial residential business in the state (currently 237companies) are required to purchase reinsurance protection from the FHCF based on theirexposure to hurricane losses.
14 United States: 2006 Reinsurance Market Position
2006 Reinsurance MarketPosition
The FHCF is exempt from federal income taxes, which enables it to accumulate funds fasterthan a private sector reinsurer. The FHCF can borrow through tax-free bonds to pay losses. Thisborrowing capacity reflects the long-term nature of the fund. In effect, the FHCF has the powerto “tax” primary insurance companies and surplus lines insureds through an assessment mech-anism to service debt. Insurance carriers are allowed to pass on this charge to policyholders.
In 2005, the Florida legislature passed Senate Bill 1486, which addressed the aggregation oflosses in multiple storms. The total capacity of the FHCF remained unchanged at USD15 billion.The subsequent-season provision, which is also USD15 billion, ensures that capacity will beavailable on a continuing basis to avoid disruption in the market when companies go to renewtheir reinsurance programs after a year following a major event.
The FHCF’s authority to levy emergency assessments to service any bond issue is capped at6 percent in a single season. For multiple seasons, the total amount of assessments cannotexceed 10 percent.
The FHCF played an important role in the 2004 season in terms of stabilizing the privatemarket, although overall recoveries were not as great due to the size of the storms in relation tothe attachment point of the FHCF coverage. The fund paid out an estimated USD3.75 billion inlosses. Of the total insurers covered by the fund, about 140 triggered coverage from FHCF and asmany as 60 are believed to have exhausted their FHCF limit.
Payments for the storms of 2005, estimated at USD4.5 billion, are expected to lead to a deficit ofUSD1.4 billion for the FHCF at year-end. To help finance this deficit, the FHCF is expected toissue a bond of USD1.2 billion, financed by a 1 percent assessment on all property/casualtypremiums (excluding workers compensation and medical malpractice).
Given its weakened cash position, FHCF has issued a pre-event financing document of USD2.8billion, calculated as sufficient to pay claims for storms of return periods that are less than50 years. Assuming no major losses, the income from cash generated by this financing wouldgreatly offset its servicing cost. In addition, the rapid cash buildup based on a 25 percentincrease in premium will add an estimated USD200 million to the fund.
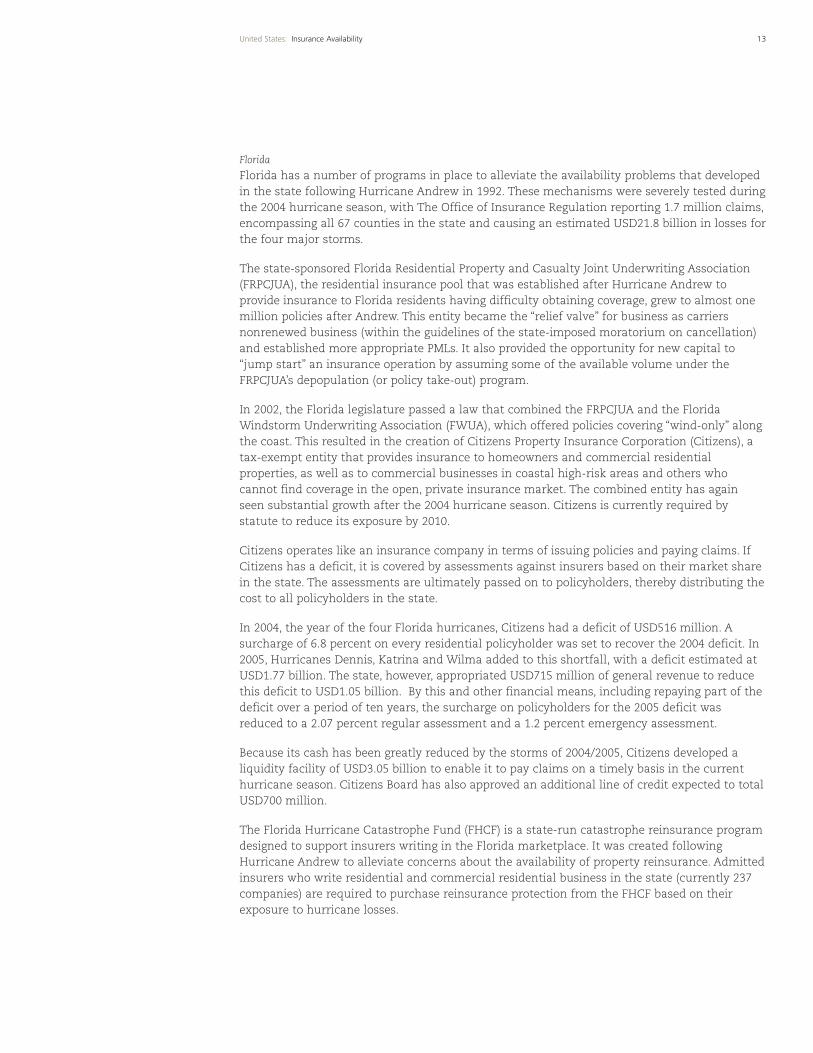
2006 was a difficult year for property catastrophe cedents in the United States. To provide thesame perspective on the price increases of the upper catastrophe layers, we have utilized thebenchmark of 1 percent loss on line (LOL). Taking January 2005 as a base of 100, the correspon-ding ROLs are plotted for the next three major renewal dates. As expected, the index dropped inJuly 2005, reflecting the softening market pre-Katrina, Rita and Wilma. Rates practicallydoubled at January 2006 renewals and continued to increase through the renewal cycle, withthe index rate at July 2006 renewals more than double the level of the prior year.
15United States: 2006 Reinsurance Market Position
In our report last year, we lauded the stabilizing impact of catastrophe modeling on pricing:“Where the historical market reaction in the wake of large loss activity would have been tomake a universal adjustment, today’s lead reinsurers are exposure underwriters. This meansthat without a compelling reason to support the fact that the world is riskier, the presence ofloss activity does not change their perception of the risks.”
Given the record losses of 2005, there was a compelling reason to believe that the world wasriskier – more than USD80 billion reasons. More to the point, the large losses of 2005 changedperceptions. Insurers, reinsurers, rating agencies and modelers practically all changed theirviews on the frequency and severity of storms in the North Atlantic.
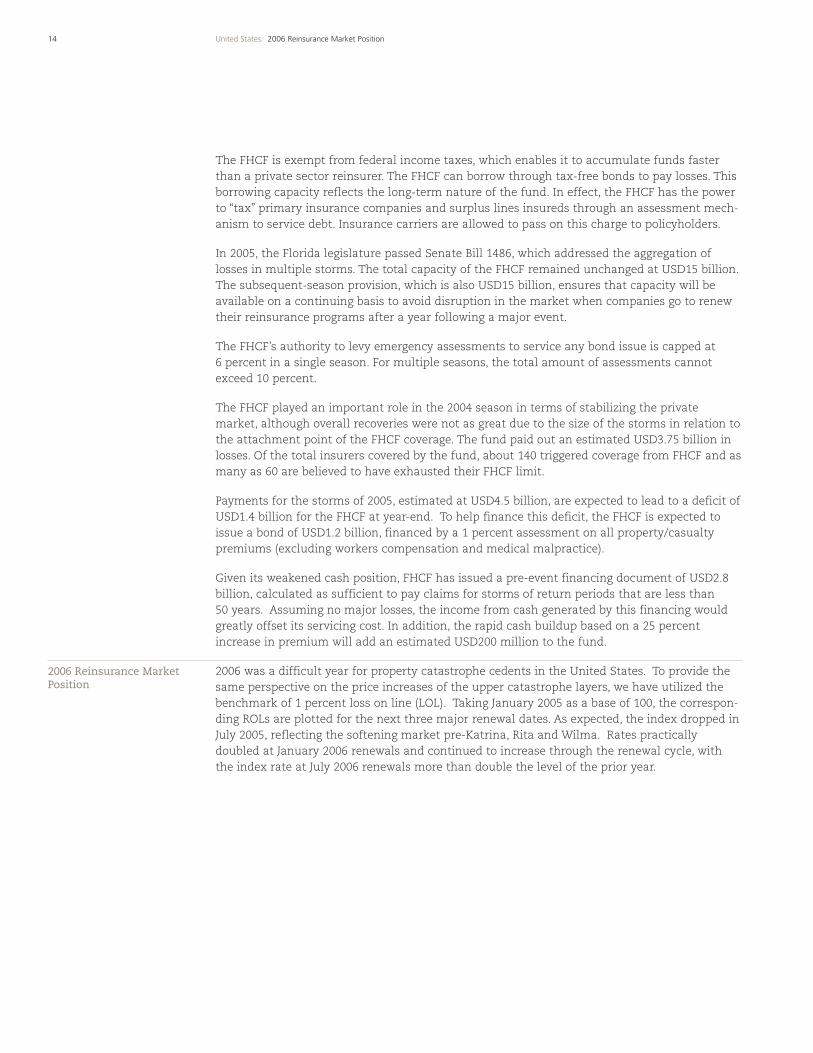
Retention and Limit
The following charts illustrate the movement in total program retention and limit over the past18 years, with 1989 as the base year set to 100. Guy Carpenter has prepared these charts basedon a select index of companies tracked consistently over an 18-year period.
As the chart below shows, retentions jumped by 40 percent in 2006, as cedents strove to controltheir spending by retaining more net. Programs on average are attaching at around the 15-yearreturn period level.
600
500
400
300
200
100
089 90 91 92 93 94 95 96 97 98 99 00 01 02 03 04 0605
*1989=100
200
ROL
180
160
120
140
80
100
40
60
20
0January 2005
*January 2005 = 100
July 2005 January 2006 July 2006
United States - CatastrophePricing Index*: Rate on LineBenchmark Pricing for Loss onLine of 1%
United States - AverageRetention Per Program Index*
16 United States: 2006 Reinsurance Market Position
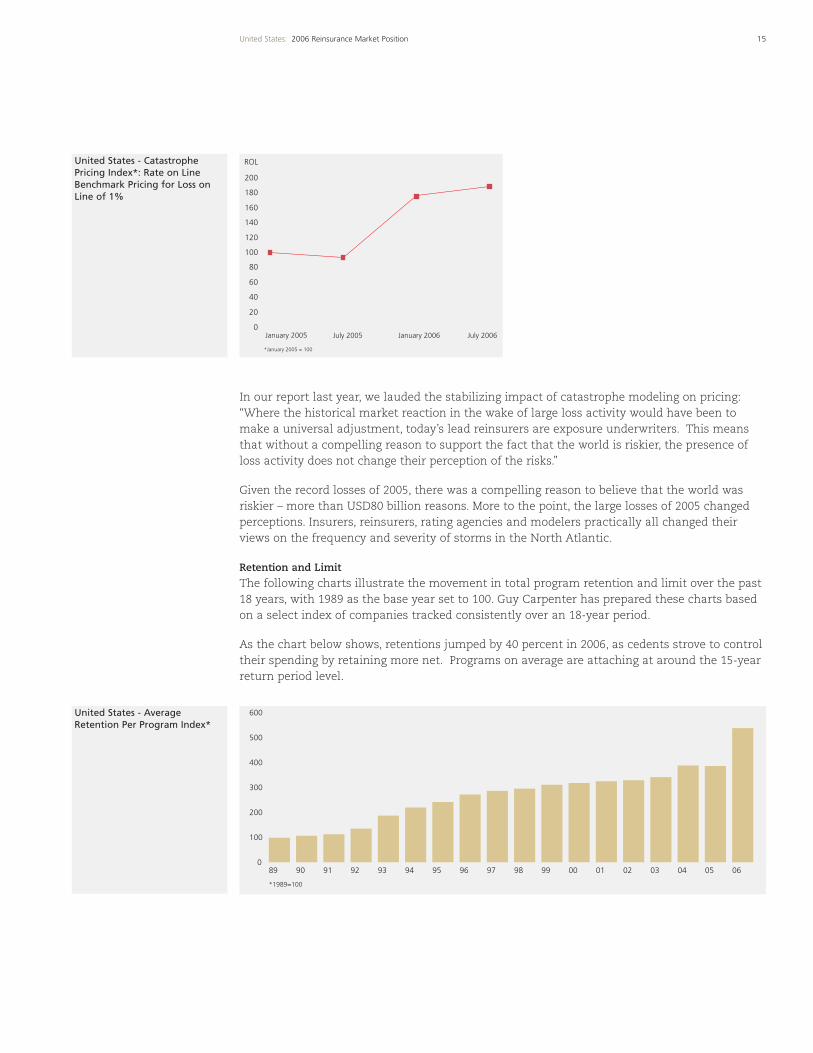
As shown in the following chart, average limit has increased by 11.4 percent in 2006 over 2005.
The increase in limit is a result of a number of factors:
• Increased model-generated PMLs.
• Continued pressure from A.M. Best/S&P on capital adequacy and the management of catas-trophe exposures.
• Growth in population and values across the United States, particularly in catastrophe-proneareas. This is a longer-term factor.
• Heightened awareness on catastrophic loss potential as a result of the 2004/2005 hurricaneseasons.
Despite the factors cited above, the increase in limit in 2006 was in line with increases in recentyears. We believe that the year-over-year increases would have been much more substantial ifprices had not increased as dramatically or if capacity had been more plentiful.
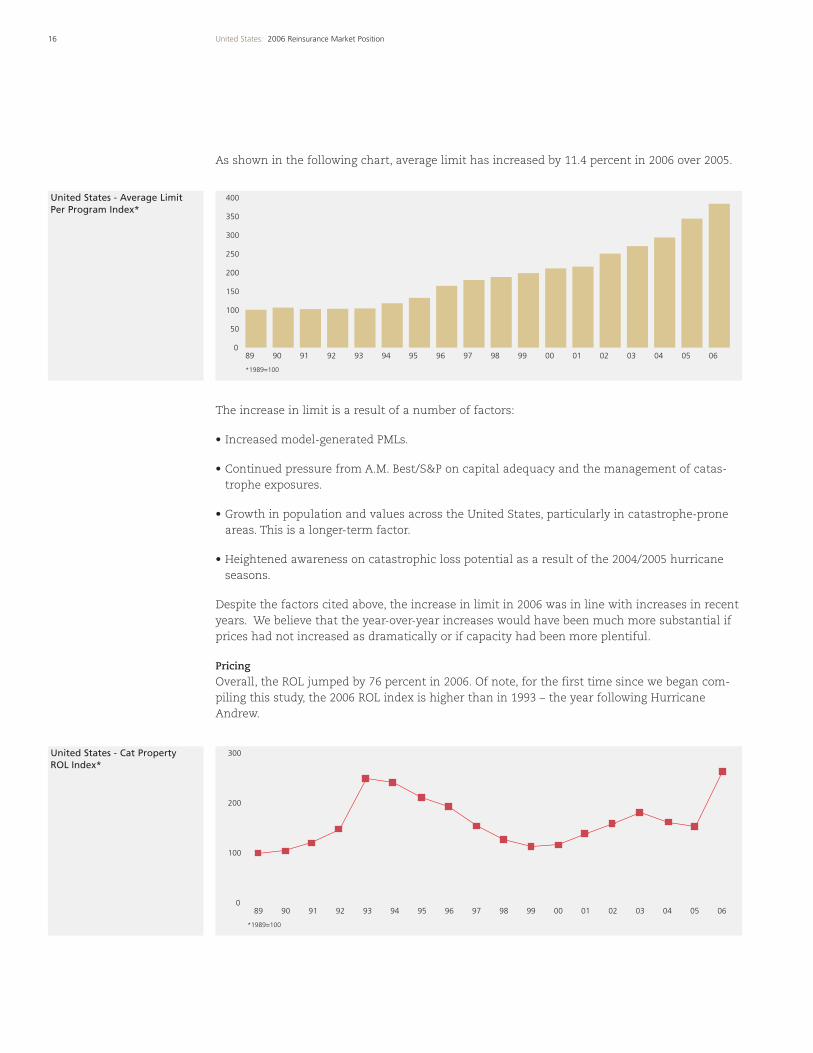
Pricing
Overall, the ROL jumped by 76 percent in 2006. Of note, for the first time since we began com-piling this study, the 2006 ROL index is higher than in 1993 – the year following HurricaneAndrew.
089 90 91 92 93 94 95 96 97 98 99 00 01 02 03 04 0605
*1989=100
300
200
100
089 90 91 92 93 94 95 96 97 98 99 00 01 02 03 04 0605
*1989=100
400
350
300
250
200
100
150
50
United States - Average Limit Per Program Index*
United States - Cat Property ROL Index*
United States - ROL vs. LOL
17United States: 2006 Reinsurance Market Position
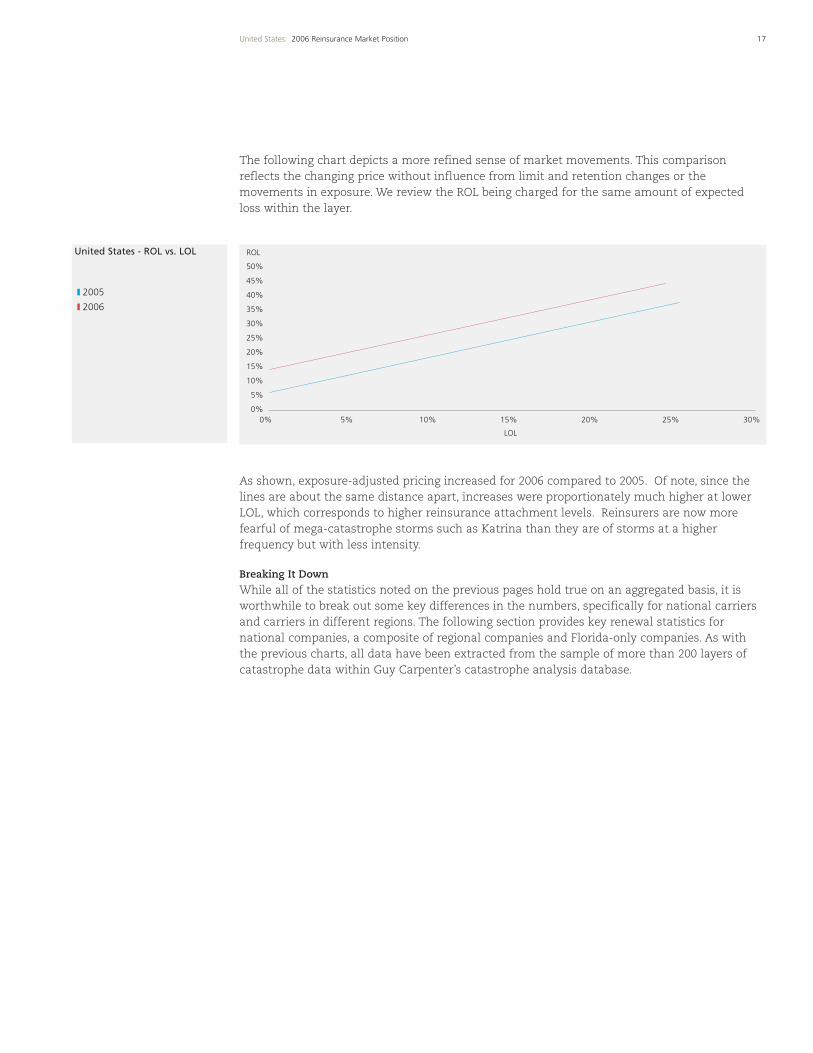
The following chart depicts a more refined sense of market movements. This comparisonreflects the changing price without influence from limit and retention changes or themovements in exposure. We review the ROL being charged for the same amount of expectedloss within the layer.
As shown, exposure-adjusted pricing increased for 2006 compared to 2005. Of note, since thelines are about the same distance apart, increases were proportionately much higher at lowerLOL, which corresponds to higher reinsurance attachment levels. Reinsurers are now morefearful of mega-catastrophe storms such as Katrina than they are of storms at a higherfrequency but with less intensity.
Breaking It Down
While all of the statistics noted on the previous pages hold true on an aggregated basis, it isworthwhile to break out some key differences in the numbers, specifically for national carriersand carriers in different regions. The following section provides key renewal statistics fornational companies, a composite of regional companies and Florida-only companies. As withthe previous charts, all data have been extracted from the sample of more than 200 layers ofcatastrophe data within Guy Carpenter’s catastrophe analysis database.
2005
2006
0%
5%
10%
15%
20%
25%
35%
30%
40%
45%
50%
ROL
0% 5% 10% 15% 20% 25% 30%
LOL
United States - NationalCompanies
United States - RegionalCompanies
2005 Regional, Indexed to 100
2006
18 United States: 2006 Reinsurance Market Position
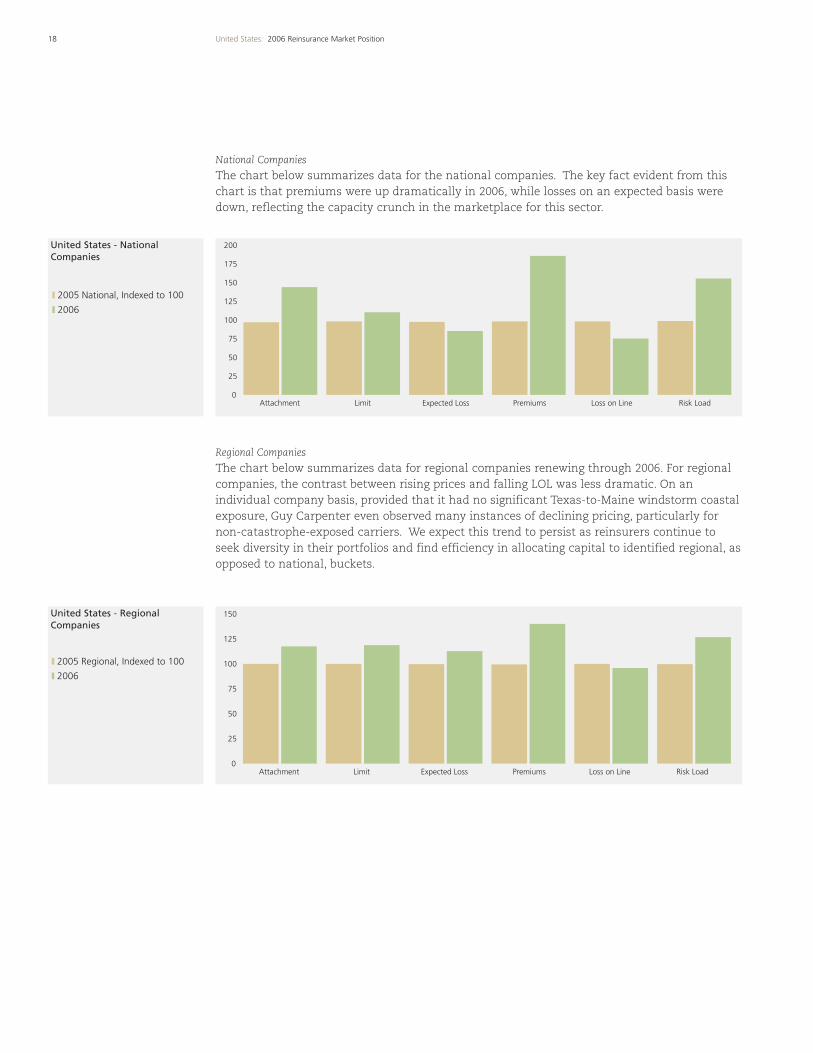
National Companies
The chart below summarizes data for the national companies. The key fact evident from thischart is that premiums were up dramatically in 2006, while losses on an expected basis weredown, reflecting the capacity crunch in the marketplace for this sector.
Regional Companies
The chart below summarizes data for regional companies renewing through 2006. For regionalcompanies, the contrast between rising prices and falling LOL was less dramatic. On anindividual company basis, provided that it had no significant Texas-to-Maine windstorm coastalexposure, Guy Carpenter even observed many instances of declining pricing, particularly fornon-catastrophe-exposed carriers. We expect this trend to persist as reinsurers continue toseek diversity in their portfolios and find efficiency in allocating capital to identified regional, asopposed to national, buckets.
2005 National, Indexed to 100
2006
200
100
125
150
175
75
25
50
0Attachment Limit Expected Loss Premiums Loss on Line Risk Load
150
125
100
75
25
50
0Attachment Limit Expected Loss Premiums Loss on Line Risk Load
United States - Florida Companies
United States - Return Period ofAttachment and Exhaustion
19United States: 2006 Reinsurance Market Position
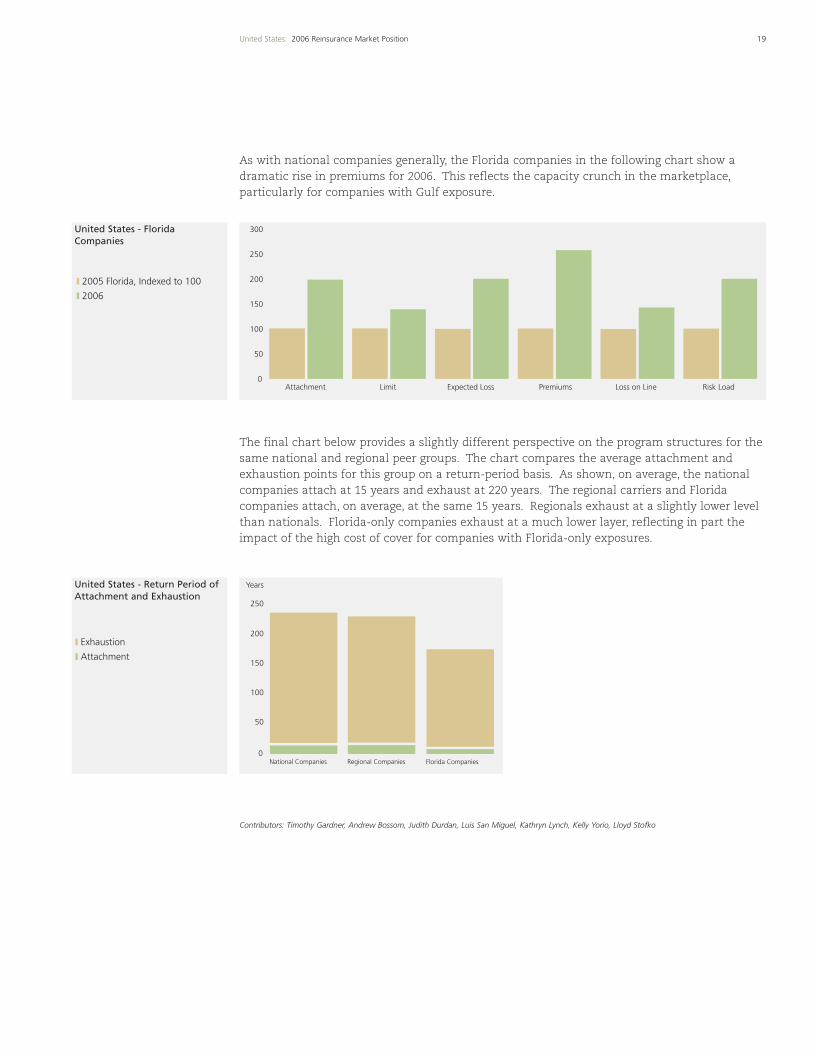
As with national companies generally, the Florida companies in the following chart show adramatic rise in premiums for 2006. This reflects the capacity crunch in the marketplace,particularly for companies with Gulf exposure.
The final chart below provides a slightly different perspective on the program structures for thesame national and regional peer groups. The chart compares the average attachment andexhaustion points for this group on a return-period basis. As shown, on average, the nationalcompanies attach at 15 years and exhaust at 220 years. The regional carriers and Floridacompanies attach, on average, at the same 15 years. Regionals exhaust at a slightly lower levelthan nationals. Florida-only companies exhaust at a much lower layer, reflecting in part theimpact of the high cost of cover for companies with Florida-only exposures.
Contributors: Timothy Gardner, Andrew Bossom, Judith Durdan, Luis San Miguel, Kathryn Lynch, Kelly Yorio, Lloyd Stofko
2005 Florida, Indexed to 100
2006
300
250
200
150
50
100
0Attachment Limit Expected Loss Premiums Loss on Line Risk Load
Exhaustion
Attachment
250
200
150
100
50
0
Years
National Companies Regional Companies Florida Companies
Canada is the world’s second-largest country in terms of landmass, and its largest city, Toronto,is the seventh-largest city in North America. The country is exposed to a number of climatichazards, including windstorm, tornado, flood, hail and freezing, as well as the geologicalhazards of earthquake and related fire.
Approximately 90 percent of Canadians reside within 100 miles of the U.S. border. While thereare significant climatic and geological hazards north of this area, they cause relatively littlefinancial loss, given the limited population densities. However, the concentration of exposuresin and around major Canadian cities such as Toronto, Montreal, Vancouver, Ottawa-Hull,Edmonton, Calgary, Winnipeg and Quebec City create the potential for major losses.
Damaging coastal winds, inland windstorms and tornadoes occur in Canada, although windspeeds north of the 49th parallel do not generally reach the velocities often seen in the UnitedStates. Tropical cyclones or hurricanes, for example, normally diminish in intensity to the levelof storms before reaching the Canadian border.
Historically, damage from hurricanes has been rare. In 1954, however, Hurricane Hazel causedsevere damage in southern Ontario, primarily as a result of flooding. If Hurricane Hazeloccurred today, the potential damage could exceed anything ever experienced in Canada. InSeptember 2003, Hurricane Juan, aided by rare conditions, reached the Canadian MaritimeProvinces as a Category 2 storm, causing insured losses estimated at over CAD100 million.
Hail damage occurs regularly, particularly in the Prairie Provinces of Alberta, Manitoba andSaskatchewan. Flood and sewer backup damage also can occur, especially in spring, due tomelting winter snow and Canada’s abundance of lakes and rivers. In the past, flooding hascaused the greatest aggregate amount of property damage in Canada, but private insurancecompanies generally do not cover flood losses to residential properties. Commercial risks areoften insured against flood damage under all-risk policies.
Earthquake damage in Canada has been minor in modern times. However, seismologists at theGeological Survey of Canada have found evidence of seismic activity in the past on a scale, ifnot a frequency, comparable to other earthquake-prone areas of the world. Southwestern BritishColumbia on the west coast and the St. Lawrence and Ottawa river valley areas in the easternprovinces of Quebec and Ontario are believed to be especially vulnerable.
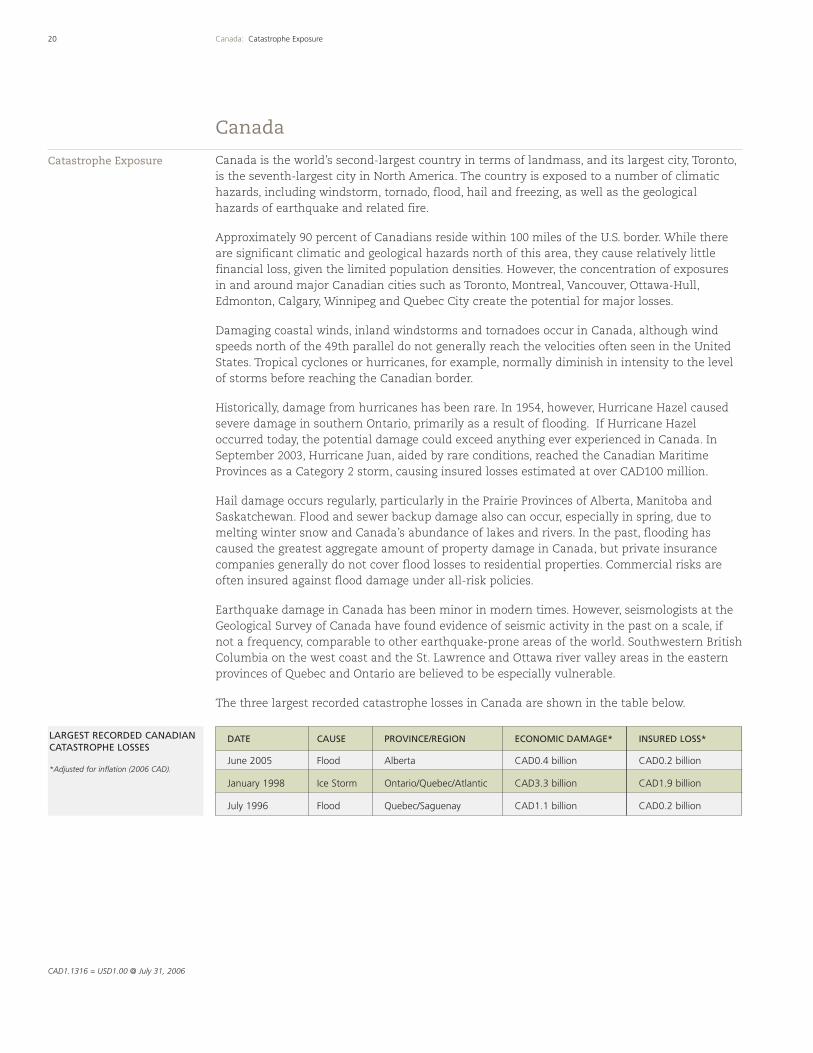
The three largest recorded catastrophe losses in Canada are shown in the table below.
20 Canada: Catastrophe Exposure
Canada
Catastrophe Exposure
DATE CAUSE PROVINCE/REGION ECONOMIC DAMAGE* INSURED LOSS*
June 2005 Flood Alberta CAD0.4 billion CAD0.2 billion
January 1998 Ice Storm Ontario/Quebec/Atlantic CAD3.3 billion CAD1.9 billion
July 1996 Flood Quebec/Saguenay CAD1.1 billion CAD0.2 billion
LARGEST RECORDED CANADIANCATASTROPHE LOSSES
*Adjusted for inflation (2006 CAD).
CAD1.1316 = USD1.00 @ July 31, 2006
21Canada: Insurance Availability
The ice storm of 1998, which affected both Canada and the northeast United States, was, at thetime it occurred, one of the 30 largest worldwide losses ever recorded by the insurance industry.Still the largest Canadian loss on record, the storm left millions of people without power in themiddle of winter and caused extensive property damage. While the average insurance claimwas small, the total number of claims submitted to Canadian insurers was nearly 800,000 –more than the combined claims generated by Hurricane Andrew.
Yet claims from these three events pale in comparison to the claims and losses that could arisefrom a major earthquake and related fires in British Columbia or Quebec and eastern Ontario.The potential economic damage from a major seismic event in British Columbia is estimated atCAD30 billion, and insured losses could reach as high as CAD15 billion – not all of which wouldbe reinsured. The insurance loss estimate for a major earthquake in Quebec and easternOntario is CAD5 billion.
In 2005, Canadian natural catastrophes, while minor when considered in the context of recordworld events, did include two relatively sizable events. The first of significance has beendescribed as a “one-in-200-year” flood that left a trail of destruction throughout large parts ofcentral and southern Alberta. Occurring over the period of June 6-8 and June 17-19, the eventconsisted of heavy rains and flooding and eventually caused an insured loss of CAD300 million.
A second event of note occurred on August 19, 2005. In what first appeared to be a typicalsummer storm, it was to become the highest insured loss in the history of southern Ontario,estimated to cost more than CAD500 million. Spanning a broad area of 150 kilometers,approximately 153 to 170 millimeters of rain fell during a three-hour period. The damagesincluded wind damage, washed-out infrastructure, flooded cars and buildings.
This deceptively powerful storm raised awareness of the exposures found in large urban areasand highlighted that catastrophic losses are not just confined to earthquake zones. Additionalstudy may be required to fully appreciate the concentration of values in these nonearthquakeurban zones. Moreover, increasingly higher values are situated below ground level, so thedegree of exposure to water damage may be greater than originally estimated.
Canadian insurance coverage for climatic and seismic hazards is readily available and afford-able. In all provinces except Quebec, the basic fire policy covers fire loss from most causes,including earthquake and terror. In Quebec, about 55 percent of commercial businesses buyearthquake cover, but fewer than 10 percent of homeowners policies are endorsed for earth-quake ground-shaking. In British Columbia, where earthquake risk is relatively high, insurershave sought to exclude fire-following for an earthquake from the property policy and to offer aseparate ground-shaking and fire-following policy. To date, these efforts have not beensuccessful.
In 2005, a worrisome dichotomy developed between the primary and secondary insurancemarkets. Early results and analysis of the primary insurance markets show that across all linesof property and casualty business, overall, insurers posted a profitable combined ratio of93 percent – albeit a 2.5 percent deterioration in results from the previous year.
Insurance Availability
2006 Reinsurance Market Position
In contrast, the combined ratio for the reinsurance market on the whole came in at 103 per-cent, a deterioration of almost 10 percent from a year earlier. It appears that a large part of thisdecline can be attributed to the two large catastrophe losses noted above, plus the Suncor oilrefinery loss, which was heavily reinsured with local and overseas capacity. For reinsurers,despite poor local and record world loss events, the effects on January 1, 2006, Canadian catas-trophe pricing is estimated to have increased, on average, only about 7.5 percent, with manytreaties renewing as-is. Only the few that bore the brunt of the catastrophes are carrying aheavier load of the price increase.
Current anecdotal evidence clearly points to increasingly competitive pressures across all linesof business at the primary level at the same time that reinsurers (both facultative and treaty)are attempting to maintain or increase prices. Canadian domiciled reinsurance markets also arefacing increased pressure from overseas capacity, which is aggressively targeting Canadianexposures to provide them with a worldwide spread of risk on their portfolios – especially as acounterbalance to any southern U.S. exposures.
While the British Columbia courts ruled in 2003 that fire following a catastrophic event couldbe excluded under multi-peril policies, insurers were not fully convinced that, after a loss event,political pressure would not be exerted to reverse this decision. The British Columbia provincialgovernment now has opened legislative level discussions to clarify this issue.
At the request of the Office of the Superintendent of Financial Institutions (OSFI), the InsuranceBureau of Canada is “undertaking a comprehensive review of the P&C insurance industry’s stateof financial preparedness for a major earthquake in an urban area.” Given the recent changesto modeling techniques and further advances in science and industry practices, OSFI isinterested in obtaining the most current PML estimate for an earthquake in British Columbia orMontreal. Depending on the results, it could precipitate a change in the buying patterns ofearthquake coverage.
Contributors: Jonathan Stephenson, George Socha
22 Canada: New Issues and Updates in 2006
New Issues and Updates in2006
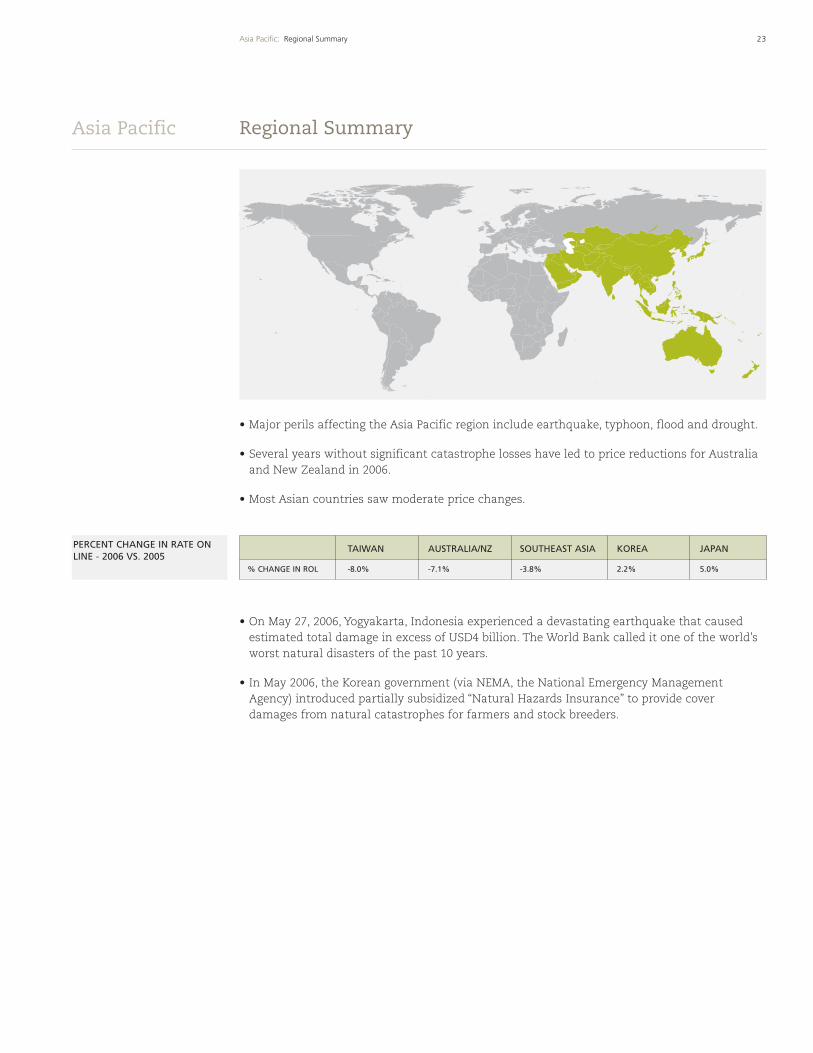
• Major perils affecting the Asia Pacific region include earthquake, typhoon, flood and drought.
• Several years without significant catastrophe losses have led to price reductions for Australiaand New Zealand in 2006.
• Most Asian countries saw moderate price changes.
• On May 27, 2006, Yogyakarta, Indonesia experienced a devastating earthquake that causedestimated total damage in excess of USD4 billion. The World Bank called it one of the world’sworst natural disasters of the past 10 years.
• In May 2006, the Korean government (via NEMA, the National Emergency ManagementAgency) introduced partially subsidized “Natural Hazards Insurance” to provide coverdamages from natural catastrophes for farmers and stock breeders.
23Asia Pacific: Regional Summary
Regional Summary
PERCENT CHANGE IN RATE ONLINE - 2006 VS. 2005
TAIWAN AUSTRALIA/NZ SOUTHEAST ASIA KOREA JAPAN
% CHANGE IN ROL -8.0% -7.1% -3.8% 2.2% 5.0%
Asia Pacific
24 Japan: Catastrophe Exposure
The major catastrophe exposures in Japan arise from earthquakes and typhoons. In the 1990s,Japan suffered its worst run of natural catastrophes in recent history, including the Kobeearthquake (1995) and Typhoons Mireille (1991) and Bart (1999), which were the first- andsecond-costliest typhoons on record. In 2004, Japan was hit by a record 10 typhoons, withinsured losses totaling USD6 billion. The largest insured loss was for Typhoon Songda at USD3.6billion. In 2004, the country was also hit by a significant earthquake in Niigata, with an insuredloss of USD600 million.
Japan is also exposed to other significant perils, many of which are linked to earthquake andtyphoon, including flood, volcanic eruption, tsunami and winter storm.
In general, property policies provide coverage for windstorm but not for earthquake shock orfire following an earthquake. However, with the exception of warehouse policies, all propertypolicies automatically include Earthquake Fire Expense Insurance (EFEI), which provides for asmall expense for damage caused by fire following an earthquake.
The limits provided per policy type under the EFEI are as follows:
• Dwelling Risks: 5 percent of total sum insured (maximum JPY3 million)
• Commercial Risks: 5 percent of total sum insured (maximum JPY3 million)
• Industrial Risks: 5 percent of total sum insured (maximum JPY20 million)
Insurance companies buy reinsurance protection for their EFEI exposures in the commercialreinsurance market, usually on an excess of loss basis.
Residential Earthquake Risk
Residential policyholders can purchase earthquake shock and fire-following insurance fromlocal insurance companies. Coverage is added by way of endorsement, and an additionalpremium is payable. Following the provisions of the Japanese earthquake program establishedin 1966, insurance companies cede 100 percent of their dwelling earthquake exposures to theJapanese Earthquake Reinsurance Company (JER). The JER then retrocedes some of the risk backto the original direct insurers and Toa Re, Japan’s leading domestic reinsurer.
Traditionally, the market penetration of residential earthquake coverage has been very low. In1992, for example, just 7 percent of policyholders were purchasing earthquake coverage. Sincethat low, however, the take-up rate has been steadily rising and now stands at 37.4 percent, itshighest level since 1969.
Coverage is also available under commercial policies for earthquake shock and fire-followingearthquake. Historically, the earthquake endorsement gave limited coverage for industrial andcommercial risks, mainly on a reduced indemnity basis. However, there has been a recent trendtoward the issuance of first-loss (no penalty for underinsurance) or layered coverage on bothsingle- and multiple-location policies. It is now estimated that three-quarters of all commercialand industrial earthquake cover is provided on a first-loss basis.
Japan
Catastrophe Exposure
Insurance Availability
JPY114.6500 = USD1.00 @ July 31, 2006
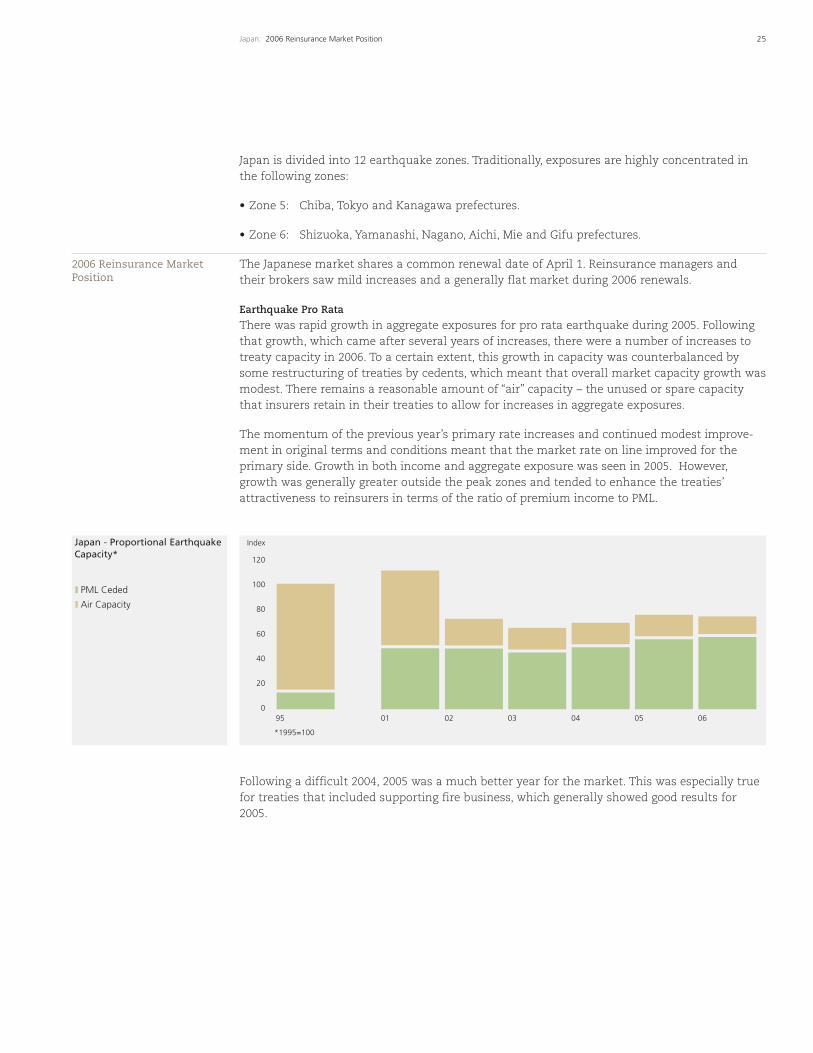
Japan - Proportional EarthquakeCapacity*
25Japan: 2006 Reinsurance Market Position
Japan is divided into 12 earthquake zones. Traditionally, exposures are highly concentrated inthe following zones:
• Zone 5: Chiba, Tokyo and Kanagawa prefectures.
• Zone 6: Shizuoka, Yamanashi, Nagano, Aichi, Mie and Gifu prefectures.
The Japanese market shares a common renewal date of April 1. Reinsurance managers andtheir brokers saw mild increases and a generally flat market during 2006 renewals.
Earthquake Pro Rata
There was rapid growth in aggregate exposures for pro rata earthquake during 2005. Followingthat growth, which came after several years of increases, there were a number of increases totreaty capacity in 2006. To a certain extent, this growth in capacity was counterbalanced bysome restructuring of treaties by cedents, which meant that overall market capacity growth wasmodest. There remains a reasonable amount of “air” capacity – the unused or spare capacitythat insurers retain in their treaties to allow for increases in aggregate exposures.
The momentum of the previous year’s primary rate increases and continued modest improve-ment in original terms and conditions meant that the market rate on line improved for theprimary side. Growth in both income and aggregate exposure was seen in 2005. However,growth was generally greater outside the peak zones and tended to enhance the treaties’attractiveness to reinsurers in terms of the ratio of premium income to PML.
Following a difficult 2004, 2005 was a much better year for the market. This was especially truefor treaties that included supporting fire business, which generally showed good results for2005.
2006 Reinsurance MarketPosition
PML Ceded
Air Capacity
0
20
40
60
80
100
120
Index
95 01 02 03 04 05 06
*1995=100
26 Japan: 2006 Reinsurance Market Position
Commission terms were generally held level, though occasional increases were seen.
Available reinsurer capacity was marginally greater in 2005, with some of the new playerswilling to offer shares in order to access excess of loss cover (ELC) business and some of themajor participants offering increased capacity.
Industrial/Commercial Earthquake Excess of Loss
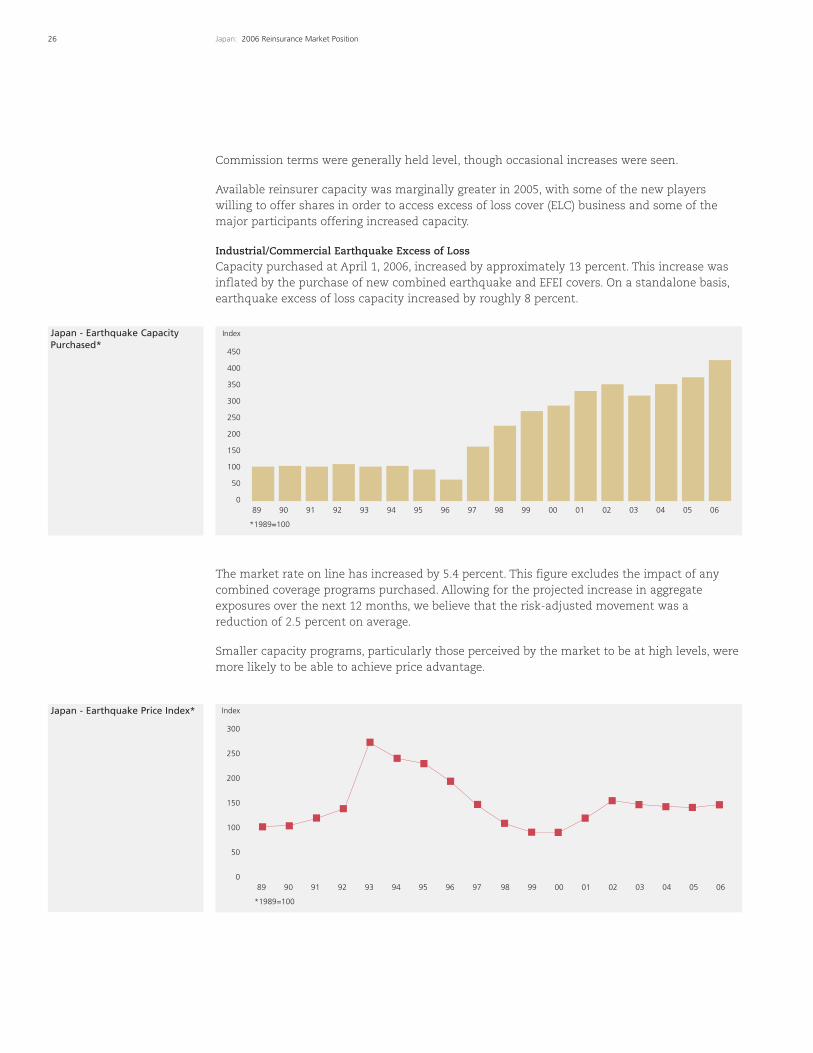
Capacity purchased at April 1, 2006, increased by approximately 13 percent. This increase wasinflated by the purchase of new combined earthquake and EFEI covers. On a standalone basis,earthquake excess of loss capacity increased by roughly 8 percent.
The market rate on line has increased by 5.4 percent. This figure excludes the impact of anycombined coverage programs purchased. Allowing for the projected increase in aggregateexposures over the next 12 months, we believe that the risk-adjusted movement was areduction of 2.5 percent on average.
Smaller capacity programs, particularly those perceived by the market to be at high levels, weremore likely to be able to achieve price advantage.
0
50
100
150
250
200
350
300
450
400
Index
89 90 91 92 93 94 01009998979695 02 03 04 05 06
*1989=100
0
50
100
150
250
200
300
Index
89 90 91 92 93 94 01009998979695 02 03 04 05 06
*1989=100
Japan - Earthquake CapacityPurchased*
Japan - Earthquake Price Index*
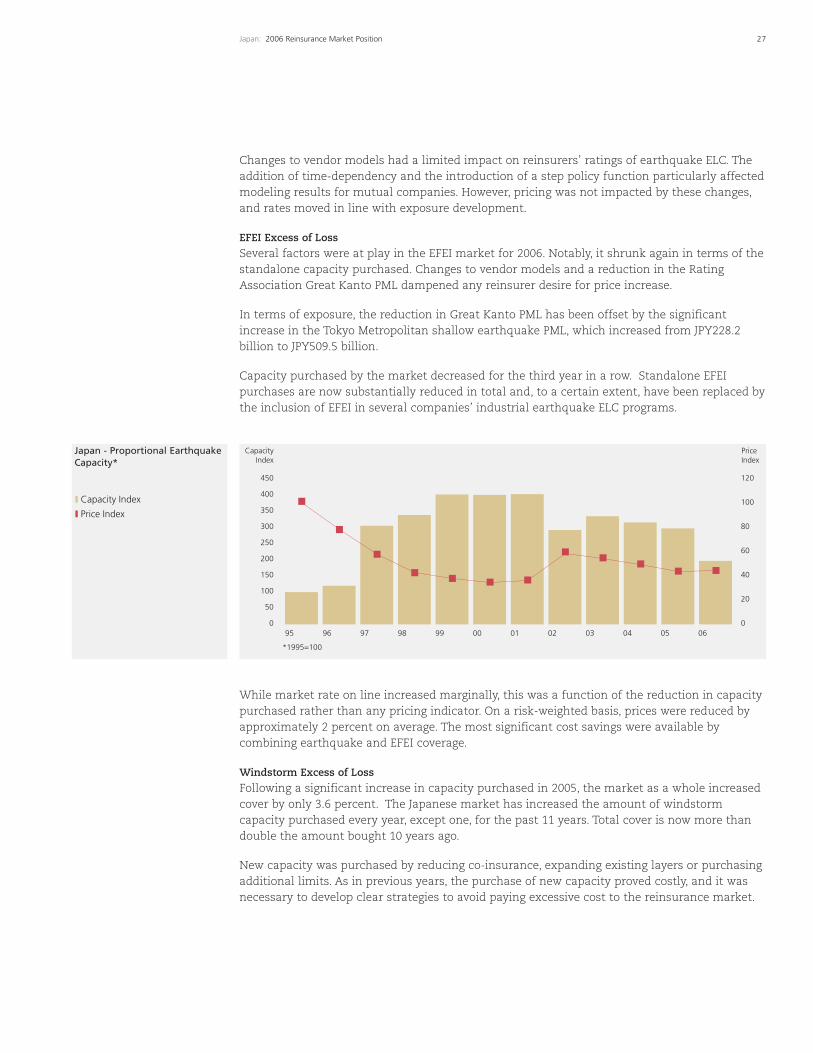
Japan - Proportional EarthquakeCapacity*
27Japan: 2006 Reinsurance Market Position
Changes to vendor models had a limited impact on reinsurers’ ratings of earthquake ELC. Theaddition of time-dependency and the introduction of a step policy function particularly affectedmodeling results for mutual companies. However, pricing was not impacted by these changes,and rates moved in line with exposure development.
EFEI Excess of Loss
Several factors were at play in the EFEI market for 2006. Notably, it shrunk again in terms of thestandalone capacity purchased. Changes to vendor models and a reduction in the RatingAssociation Great Kanto PML dampened any reinsurer desire for price increase.
In terms of exposure, the reduction in Great Kanto PML has been offset by the significantincrease in the Tokyo Metropolitan shallow earthquake PML, which increased from JPY228.2billion to JPY509.5 billion.
Capacity purchased by the market decreased for the third year in a row. Standalone EFEIpurchases are now substantially reduced in total and, to a certain extent, have been replaced bythe inclusion of EFEI in several companies’ industrial earthquake ELC programs.
While market rate on line increased marginally, this was a function of the reduction in capacitypurchased rather than any pricing indicator. On a risk-weighted basis, prices were reduced byapproximately 2 percent on average. The most significant cost savings were available bycombining earthquake and EFEI coverage.
Windstorm Excess of Loss
Following a significant increase in capacity purchased in 2005, the market as a whole increasedcover by only 3.6 percent. The Japanese market has increased the amount of windstormcapacity purchased every year, except one, for the past 11 years. Total cover is now more thandouble the amount bought 10 years ago.
New capacity was purchased by reducing co-insurance, expanding existing layers or purchasingadditional limits. As in previous years, the purchase of new capacity proved costly, and it wasnecessary to develop clear strategies to avoid paying excessive cost to the reinsurance market.
Capacity Index
Price Index
0
50
100
150
250
200
350
300
450
400
0
40
20
60
80
100
120
CapacityIndex
PriceIndex
95 010099989796 02 03 04 05 06
*1995=100
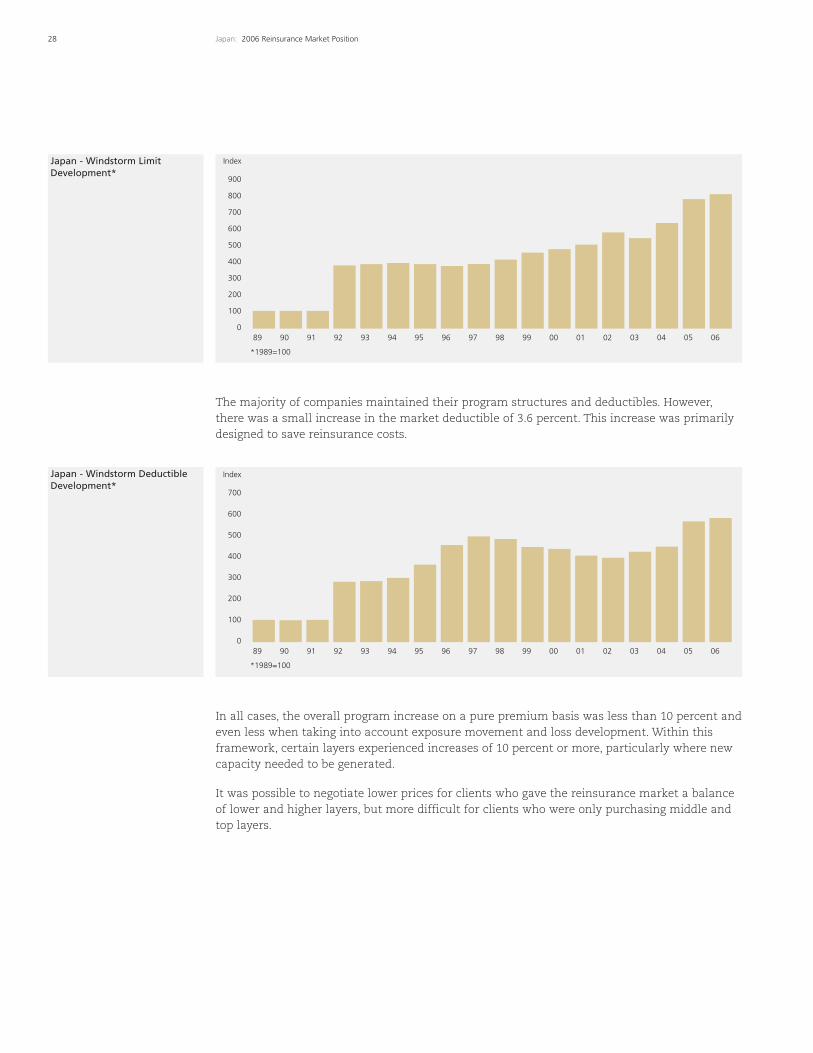
Japan - Windstorm LimitDevelopment*
28 Japan: 2006 Reinsurance Market Position
The majority of companies maintained their program structures and deductibles. However,there was a small increase in the market deductible of 3.6 percent. This increase was primarilydesigned to save reinsurance costs.
In all cases, the overall program increase on a pure premium basis was less than 10 percent andeven less when taking into account exposure movement and loss development. Within thisframework, certain layers experienced increases of 10 percent or more, particularly where newcapacity needed to be generated.
It was possible to negotiate lower prices for clients who gave the reinsurance market a balanceof lower and higher layers, but more difficult for clients who were only purchasing middle andtop layers.
0
100
200
300
500
400
700
600
900
800
Index
89 90 91 92 93 94 01009998979695 02 03 04 05 06
*1989=100
0
200
100
300
400
600
500
700
Index
89 90 91 92 93 94 01009998979695 02 03 04 05 06
*1989=100
Japan - Windstorm DeductibleDevelopment*
Japan - Price Change by ROLBand
29Japan: 2006 Reinsurance Market Position
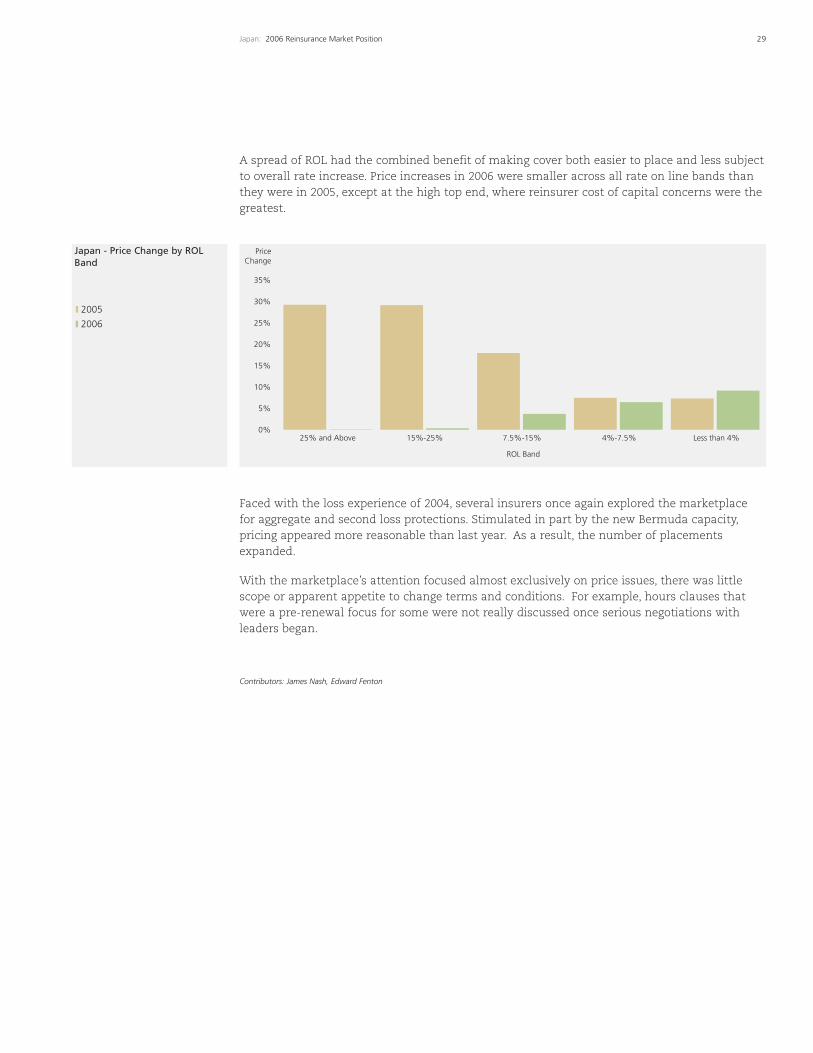
A spread of ROL had the combined benefit of making cover both easier to place and less subjectto overall rate increase. Price increases in 2006 were smaller across all rate on line bands thanthey were in 2005, except at the high top end, where reinsurer cost of capital concerns were thegreatest.
Faced with the loss experience of 2004, several insurers once again explored the marketplacefor aggregate and second loss protections. Stimulated in part by the new Bermuda capacity,pricing appeared more reasonable than last year. As a result, the number of placementsexpanded.
With the marketplace’s attention focused almost exclusively on price issues, there was littlescope or apparent appetite to change terms and conditions. For example, hours clauses thatwere a pre-renewal focus for some were not really discussed once serious negotiations withleaders began.
Contributors: James Nash, Edward Fenton
2005
2006
PriceChange
ROL Band
35%
30%
25%
10%
5%
15%
20%
0%25% and Above 15%-25% 7.5%-15% 4%-7.5% Less than 4%
30 Australia and New Zealand: Catastrophe Exposure
With a land area of approximately 7.7 million square kilometers, Australia comprises 5 percentof the world’s total land surface and is the world’s sixth-largest country. In addition to being theplanet’s smallest continent, Australia is also the lowest, flattest and, apart from Antarctica, thedriest. It has a risk profile that includes earthquake, flood, drought, cyclone, thunderstorm, hail,tidal surge and bushfire.
By contrast, New Zealand has a land area of approximately 270,000 square kilometers. Situatedon the boundary of the Pacific and Indo-Australian tectonic plates, New Zealand’s North andSouth Islands are prone to frequent earthquake, volcanic eruption and landslip, in addition tostorm and flooding.
The Sydney hailstorm of April 1999 traditionally has been viewed as Australia’s costliest event,with an original loss estimate of approximately AUD1.7 billion.
Recent research by Risk Frontiers, however, suggests that a different indexation approach,taking into account such factors as changes in insurance penetration, building code standardsand land use, may be more appropriate. By applying this new methodology to the InsuranceCouncil of Australia’s (ICA) Natural Disaster Event List, the largest current loss (as of 2004)becomes the Newcastle earthquake (1989) at AUD3.6 billion, followed by Tropical Cyclone Tracy(1974) at AUD3.3 billion.
The most significant catastrophic event during the past 12 months was Tropical Cyclone Larry,which made landfall south of Innisfail, Queensland, in March 2006. Insured losses from thisevent are currently estimated to be between AUD350 million and AUD500 million. While windspeeds and storm size were comparable to Tracy, losses and damage statistics from Larry weremuch lower. This is testament to the improved building design that has been implemented towithstand cyclonic events.
New Zealand’s costliest event remains the Bay of Plenty earthquake in 1987. This event cost theinsurance industry approximately NZD392 million (adjusted to 2004 figures). In the 2005/2006period, we saw neither the frequency nor the severity of loss activity experienced in NewZealand during the 2004/2005 period, when weather-related perils caused considerable damagethroughout both the North and South Islands.
Private insurance coverage is available for most Australian perils, with the notable exception ofsubsidence, which is excluded from residential policies. According to the ICA, flooding accountsfor one-third of the average AUD1 billion in damage each year from natural disasters inAustralia. Cover for flood remains limited as a result of both availability and affordability. Theindustry continues to work towards a solution that will make flood cover universally availableat an affordable price. To assist with the assessment of insured flood exposures, Guy Carpenteris working with a strategic partner to build a model that will allow users to carry out proba-bilistic flood analysis on a river-by-river basis in Australia.
In New Zealand, the Earthquake Commission (EQC) provides cover for homes, residential landand personal possessions for those who have taken out traditional fire insurance. The perilscovered are earthquake, landslip, tsunami, volcanic eruption, hydrothermal activity, storm orflood damage (to land only) and fire following any of these perils. Recent catastrophic events inNew Zealand have also highlighted the issue of underinsurance among many householders.
Australia and New Zealand
Catastrophe Exposure
AUD1.3050 = USD1.00 @ July 31, 2006NZD1.6194 = USD1.00 @ July 31, 2006
Insurance Availability
Australia and New Zealand -Cat Property ROL Index*
31Australia and New Zealand: 2006 Reinsurance Market Position
Australia and New Zealand are attractive marketplaces for global reinsurers, as they provide fordiversification of catastrophe portfolios. Over the last few years, the insurance industry in bothcountries has undergone extensive consolidation through mergers, acquisitions and marketexits, resulting in a market dominated by a handful of major companies.
The five dominant companies purchase in excess of AUD10 billion of property catastrophecapacity, representing approximately 60 percent to 70 percent of the total Australian/NewZealand catastrophe reinsurance cover. These larger buyers increasingly employ their ownindividual purchasing strategies to provide greater internal pricing transparency, marketingadvantage and more efficient purchases in relation to their exposures.
Typically, the larger catastrophe reinsurance programs cover both Australian and New Zealandexposures. Catastrophe program limits continue to be driven by the Maximum Event Retention(MER) guidelines issued by the Australian Prudential Regulation Authority (APRA), which specifya one-in-250-year return period. Most companies adopt a conservative approach and structuretheir programs to respond on a multiperil/multizone basis.
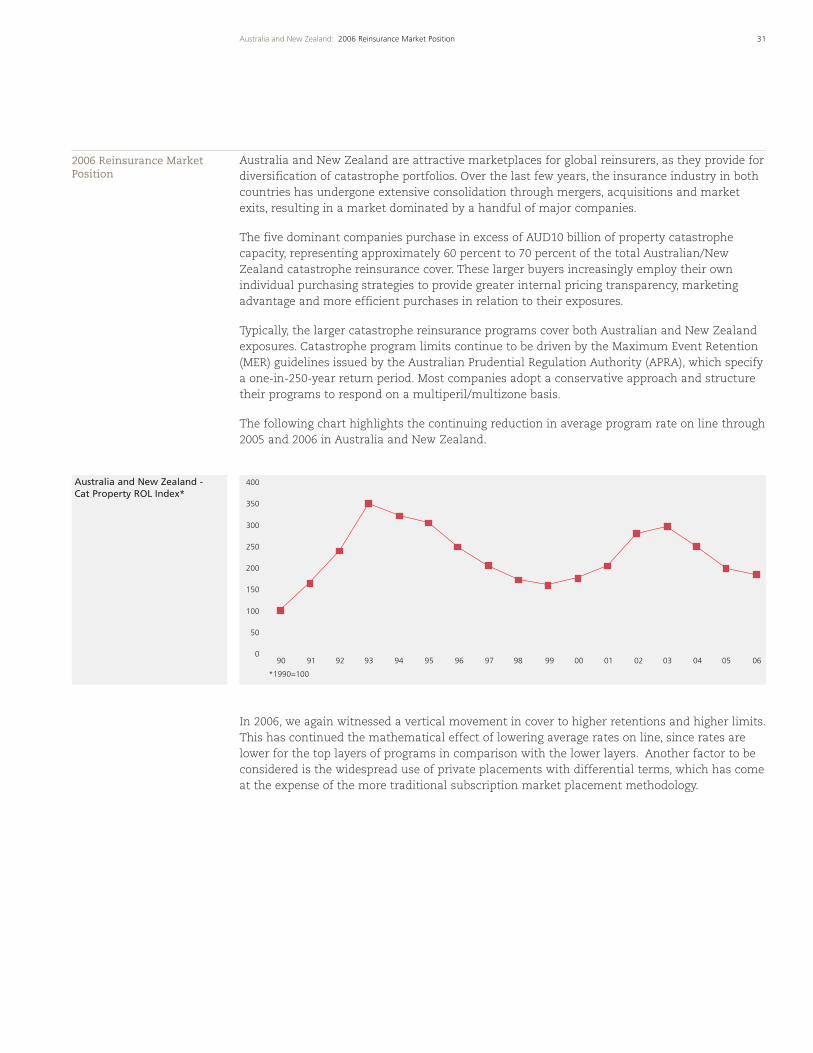
The following chart highlights the continuing reduction in average program rate on line through2005 and 2006 in Australia and New Zealand.
In 2006, we again witnessed a vertical movement in cover to higher retentions and higher limits.This has continued the mathematical effect of lowering average rates on line, since rates arelower for the top layers of programs in comparison with the lower layers. Another factor to beconsidered is the widespread use of private placements with differential terms, which has comeat the expense of the more traditional subscription market placement methodology.
2006 Reinsurance MarketPosition
0
50
100
150
200
250
300
350
400
90
*1990=100
91 92 93 94 95 96 97 98 99 00 01 02 03 04 05 06
Australia and New Zealand -ROL vs. LOL
32 Australia and New Zealand: 2006 Reinsurance Market Position
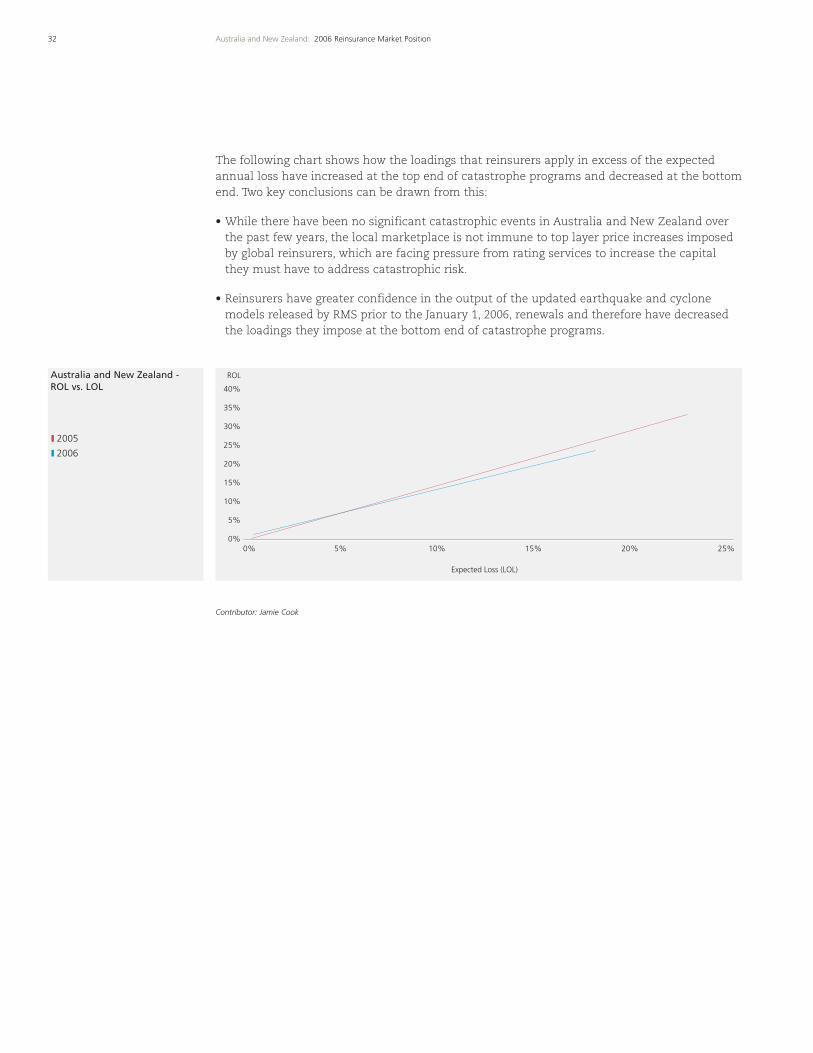
The following chart shows how the loadings that reinsurers apply in excess of the expectedannual loss have increased at the top end of catastrophe programs and decreased at the bottomend. Two key conclusions can be drawn from this:
• While there have been no significant catastrophic events in Australia and New Zealand overthe past few years, the local marketplace is not immune to top layer price increases imposedby global reinsurers, which are facing pressure from rating services to increase the capitalthey must have to address catastrophic risk.
• Reinsurers have greater confidence in the output of the updated earthquake and cyclonemodels released by RMS prior to the January 1, 2006, renewals and therefore have decreasedthe loadings they impose at the bottom end of catastrophe programs.
Contributor: Jamie Cook
0%
5%
10%
15%
20%
25%
30%
35%
40%
0% 5% 10% 15% 20% 25%
Expected Loss (LOL)
ROL
2005
2006
The Southeast Asian region comprises 10 independent countries: Brunei, Cambodia, Indonesia,Laos, Malaysia, Myanmar, the Philippines, Singapore, Thailand and Vietnam. PeninsularSoutheast Asia is a rugged region traversed by many mountains and drained by great riverssuch as the Thanlwin, Ayeyarwady, Chao Phraya and Mekong. Insular Southeast Asia is made upof numerous volcanic islands. In particular, Indonesia and the Philippines are situated along thePacific “Ring of Fire” – a zone of frequent earthquake and volcanic eruptions that encircles thebasin of the Pacific Ocean.
In terms of property insurance premium, the most significant natural perils exposures in thelarger Southeast Asian countries are listed below:
• Indonesia: earthquake, volcanic eruption and flood.
• Malaysia: flood.
• Philippines: earthquake, volcanic eruption and typhoon/flood.
• Thailand: flood.
Compared to the rest of the world, countries in Asia have low insurance penetration. In 2005,overall catastrophe losses for the region were USD21.7 billion, whereas insured lossesaccounted for only USD1.1 billion.1
The Yogyakarta Earthquake
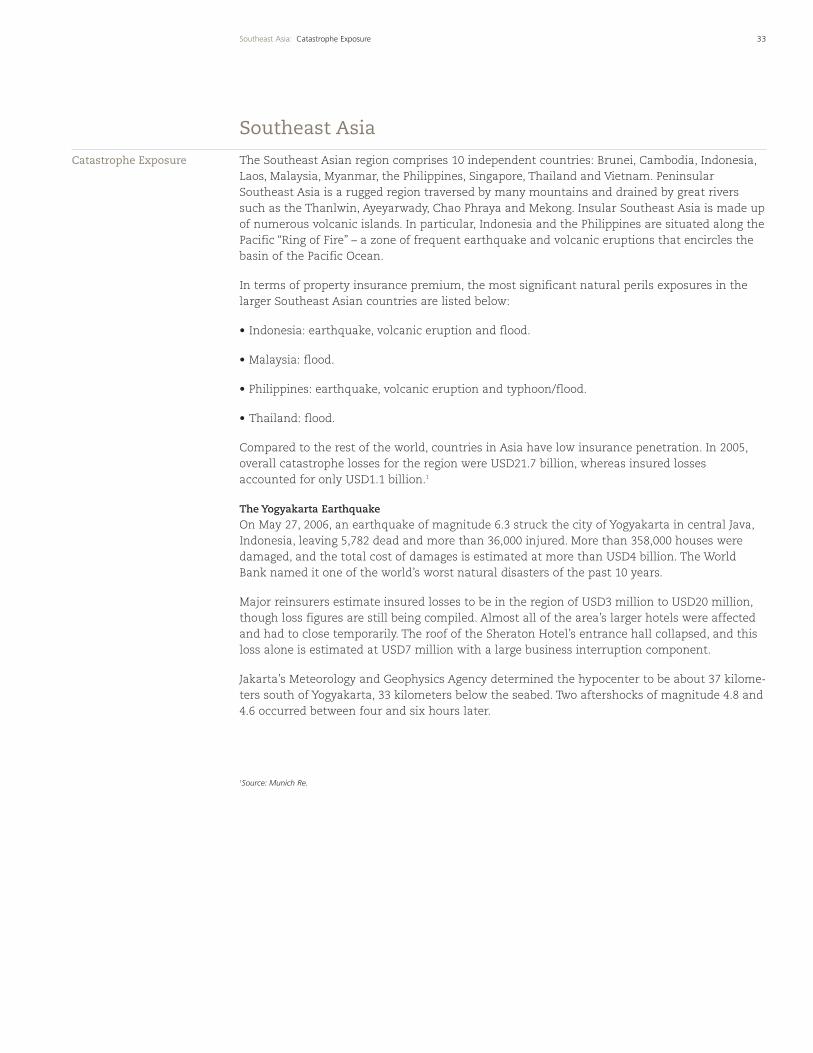
On May 27, 2006, an earthquake of magnitude 6.3 struck the city of Yogyakarta in central Java,Indonesia, leaving 5,782 dead and more than 36,000 injured. More than 358,000 houses weredamaged, and the total cost of damages is estimated at more than USD4 billion. The WorldBank named it one of the world’s worst natural disasters of the past 10 years.
Major reinsurers estimate insured losses to be in the region of USD3 million to USD20 million,though loss figures are still being compiled. Almost all of the area’s larger hotels were affectedand had to close temporarily. The roof of the Sheraton Hotel’s entrance hall collapsed, and thisloss alone is estimated at USD7 million with a large business interruption component.
Jakarta’s Meteorology and Geophysics Agency determined the hypocenter to be about 37 kilome-ters south of Yogyakarta, 33 kilometers below the seabed. Two aftershocks of magnitude 4.8 and4.6 occurred between four and six hours later.
33Southeast Asia: Catastrophe Exposure
Southeast Asia
Catastrophe Exposure
1Source: Munich Re.
34 Southeast Asia: Insurance Availability
Insurance Availability Insurance rates in Southeast Asia continue to show a downward trend, and the markets remainvery competitive. This is further compounded by the absence of any market losses in 2005, asnatural peril losses were confined to only a few companies.
Indonesia
Indonesia is currently the only country in Southeast Asia with a catastrophe pool. The MAIPARKearthquake pool was formed in 2003, and all general insurance companies must join the poolboth as risk-takers and ceding companies. Applicable tariff rates vary between 0.104 percentand 0.33 percent. Cession to the pool is on the following basis:
• 5 percent of total sums insured (TSI), or a maximum of USD2.5 million, for risks in West Java,Banten and Jakarta.
• 25 percent of TSI, or a maximum of USD2.5 million, for risks in all other Indonesian locations.
Policies also cover flood and riot, strike and malicious damage. In most cases, separate ratesare not shown.
Malaysia
Tariff rates apply in Malaysia for sums insured less than MYR300 million (or USD80 million).Common policies cover earthquake, volcanic eruption, storm and flood. Insureds can choose notto buy these perils, as separate rates apply. Prices for large and specialized risks, or risks withsum insured more than MYR300 million, are non-tariff and depend on market forces. Theseall-risk policies are rated on a combined basis and typically cover natural perils.
Southeast Asia – May 27, 2006Earthquake – Yogyakarta,Indonesia
Source: United States Agency forInternational Development (USAID)
Earthquake exposure in Malaysia is low. Rates are 0.01 percent, and no deductible applies. Floodexposure is more significant. The rate charged is 0.086 percent with a MYR2,500 (USD659)deductible. Nevertheless, flood cover is still purchased by almost all insureds.
Philippines
Named-peril policies cover earthquake and typhoon/flood. Volcanic eruption is not covered butcan be purchased additionally. For industrial all-risk policies, volcanic eruption is covered unlessspecifically excluded. A 2 percent deductible applies for all natural perils losses.
In an effort to ensure that insurance companies charge premiums that are risk commensurate,and to help curtail the declining rates on policies due to stiff competition, the InsuranceCommission has issued a circular for strict implementation of minimum rates for earthquake(0.1 percent) and typhoon/flood (0.05 percent) cover, effective as of August 1, 2006.
Thailand
Since the Indian Ocean Tsunami in December 2004 and some flooding in northern andsouthern Thailand in 2005, more insurance companies are monitoring their flood accumulation.
Standard fire policies, covering fire, lightning and explosion, would not automatically includenatural perils like earthquake and flood. Such cover can be included with an additionalpremium. Deductibles are not mandatory and are more commonly seen in all-risk rather thannamed-peril policies.
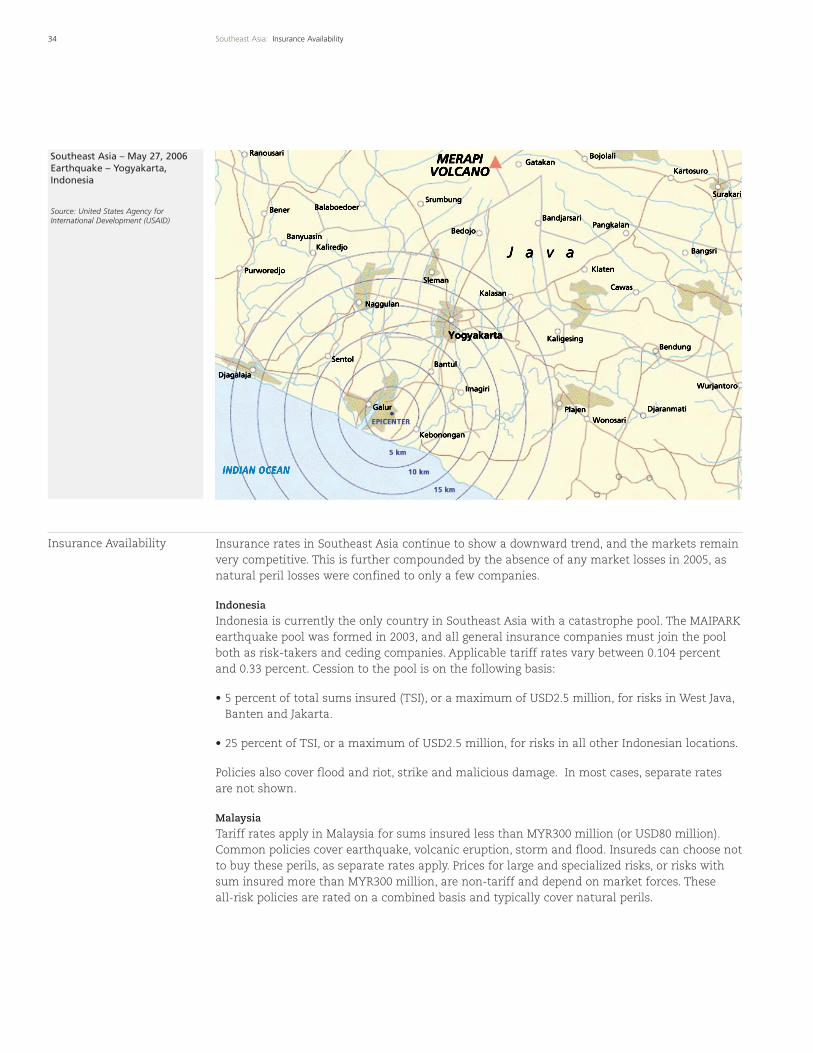
The following table summarizes the average ROL and year-on-year rate changes. In Indonesiaand the Philippines, any increase was due to higher natural perils accumulation figures.Retentions and limits were mostly unchanged. Thailand showed the greatest increase due toflood and tsunami losses.
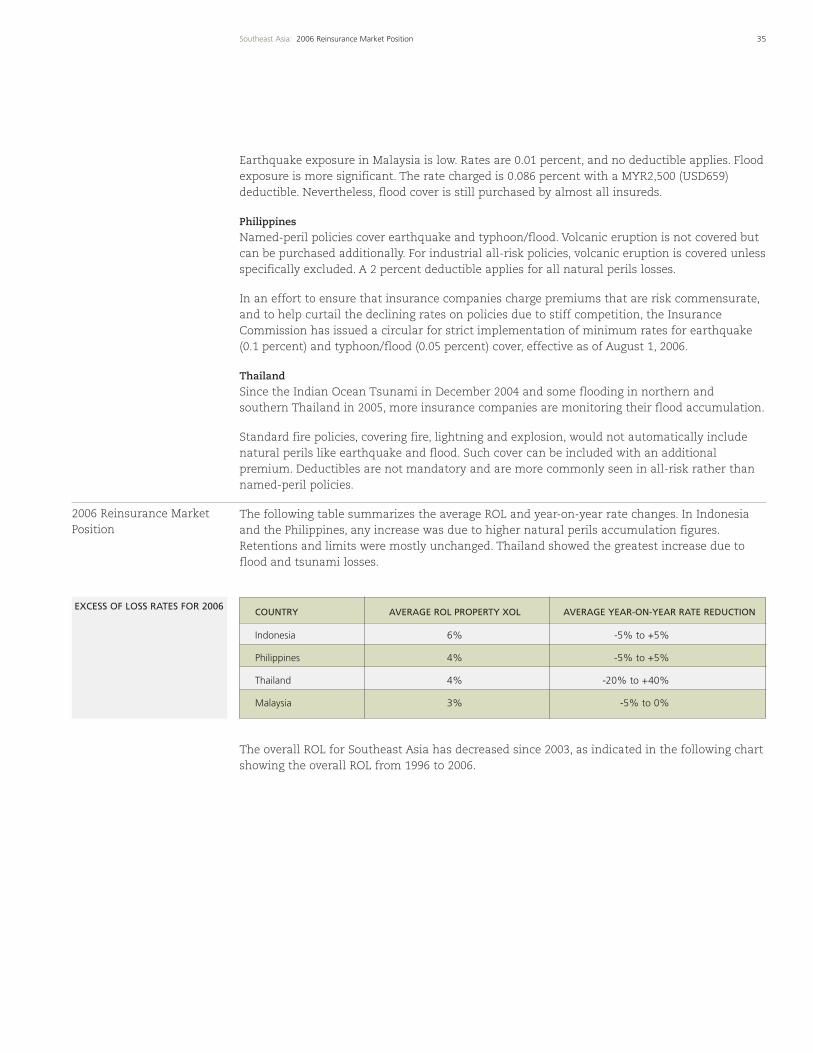
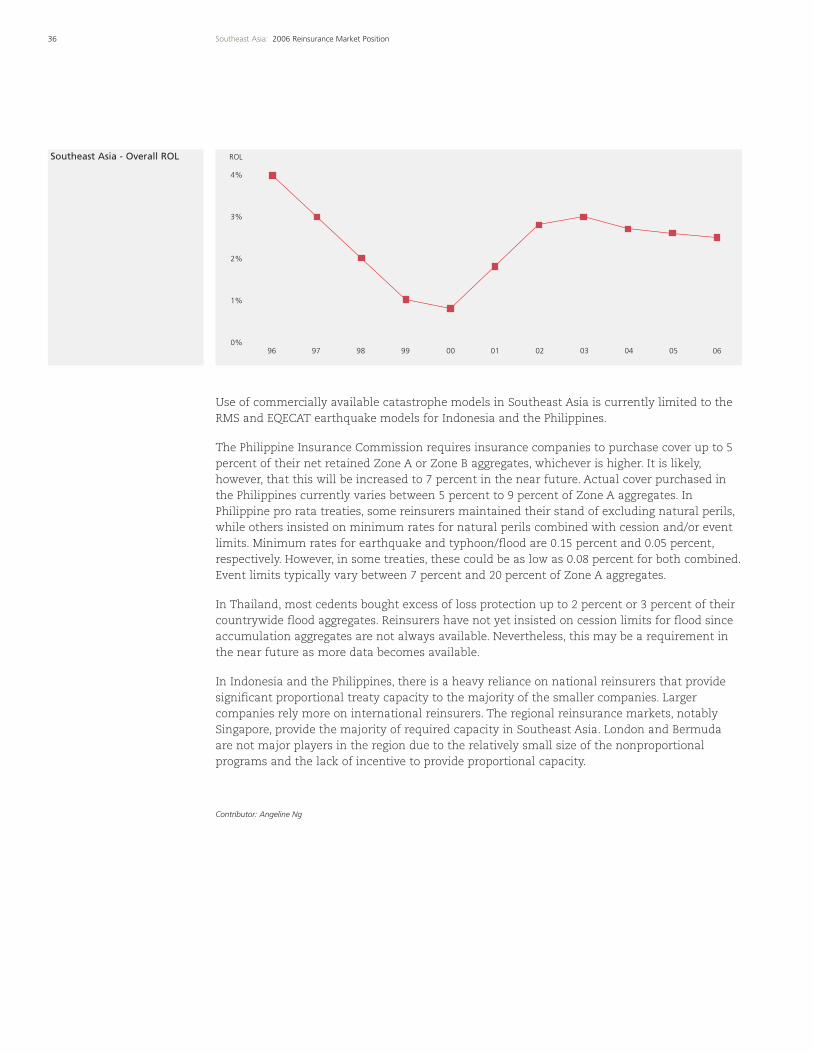
The overall ROL for Southeast Asia has decreased since 2003, as indicated in the following chartshowing the overall ROL from 1996 to 2006.
35Southeast Asia: 2006 Reinsurance Market Position
2006 Reinsurance MarketPosition
EXCESS OF LOSS RATES FOR 2006COUNTRY AVERAGE ROL PROPERTY XOL AVERAGE YEAR-ON-YEAR RATE REDUCTION
Indonesia 6% -5% to +5%
Philippines 4% -5% to +5%
Thailand 4% -20% to +40%
Malaysia 3% -5% to 0%
Use of commercially available catastrophe models in Southeast Asia is currently limited to theRMS and EQECAT earthquake models for Indonesia and the Philippines.
The Philippine Insurance Commission requires insurance companies to purchase cover up to 5percent of their net retained Zone A or Zone B aggregates, whichever is higher. It is likely,however, that this will be increased to 7 percent in the near future. Actual cover purchased inthe Philippines currently varies between 5 percent to 9 percent of Zone A aggregates. InPhilippine pro rata treaties, some reinsurers maintained their stand of excluding natural perils,while others insisted on minimum rates for natural perils combined with cession and/or eventlimits. Minimum rates for earthquake and typhoon/flood are 0.15 percent and 0.05 percent,respectively. However, in some treaties, these could be as low as 0.08 percent for both combined.Event limits typically vary between 7 percent and 20 percent of Zone A aggregates.
In Thailand, most cedents bought excess of loss protection up to 2 percent or 3 percent of theircountrywide flood aggregates. Reinsurers have not yet insisted on cession limits for flood sinceaccumulation aggregates are not always available. Nevertheless, this may be a requirement inthe near future as more data becomes available.
In Indonesia and the Philippines, there is a heavy reliance on national reinsurers that providesignificant proportional treaty capacity to the majority of the smaller companies. Largercompanies rely more on international reinsurers. The regional reinsurance markets, notablySingapore, provide the majority of required capacity in Southeast Asia. London and Bermudaare not major players in the region due to the relatively small size of the nonproportionalprograms and the lack of incentive to provide proportional capacity.
Contributor: Angeline Ng
36 Southeast Asia: 2006 Reinsurance Market Position
0%
1%
2%
3%
4%
ROL
96 97 98 99 00 01 02 03 04 05 06
Southeast Asia - Overall ROL
37Republic of Korea: Catastrophe Exposure
The Republic of Korea is exposed to the major hazards of typhoon and associated flood. Thecountry experiences one to three storms per year on average, with most events occurring inAugust and September. In 2004 and 2005, Korea had relatively quiet years with almost no lossfrom typhoons or heavy rain. Typhoon Maemi, the worst catastrophe in the nation’s recent past,struck the southeastern part of the Korean Peninsula in 2003, causing insured losses of KRW650billion. Typhoon Rusa, the nation’s second-worst recent catastrophe, hit Korea in 2002 andresulted in insured losses of KRW150 billion.
Frequent rains also occur due to the East Asian monsoon. This weather system usually lasts for20 days, during which time heavy rains and flash floods may result in extensive flood damage.
Korea’s exposure to earthquake is relatively low, as is its exposure to terrorism. Although NorthKorean agents have been disruptive in the past, it is considered unlikely that the Pyongyanggovernment would use terrorist acts to disrupt Korean society.
Rates for windstorm and flood cover are based on loss cost estimates calculated by the KoreaInsurance Development Institute (KIDI). Under the current system, introduced in April 2002,rates are based on building type, area and construction class. There are three building types(residential, commercial and industrial), seven geographic areas and four construction classes.A small compulsory deductible has also been introduced.
Wind damage and the subsequent inflow of rainwater are covered by the extended coverageendorsement to the standard fire policy. This endorsement does not provide flood coverage. Analternative wind and water damage clause covers windstorm, flood and tidal wave. A growingpercentage of insured property is covered on a property all-risk basis, which automaticallyincludes windstorm.
While terrorism coverage is being curtailed, most insureds are not disturbed by its withdrawalsince Korea is perceived to have a low exposure to terrorism threats. Terrorism coverage isabsent in both property and commercial lines, and capacity for terrorism coverage is perceivedto be generally unavailable. Terrorism coverage can be purchased as a coverage extension, butonly a small number of insureds have done so.
Natural Hazards Insurance
In May 2006, the Korean government’s National Emergency Management Agency (NEMA)introduced natural hazards insurance to substitute for an ad hoc disaster relief fund, which hasbeen raised and subsidized by the government whenever natural disasters occur. For the initialthree-year trial period, the new insurance-based system will apply to farmers and stockbreeders from nine local designated areas. It will provide cover for the loss of, or damage to,farmhouses, greenhouses and barns arising from natural hazards like typhoon, flood, heavyrainfall, gale, wave, tidal wave and heavy snowfall. This program is also being subsidized up to50 percent of net premium by both central and local government.
Proportional Treaties
Virtually all property surplus treaties in the market have imposed event limits, typically one tofour times the single-risk limit. These event limits were maintained at 2006 renewals. Co-insur-ance clauses with per risk cession limits also remained a feature.
Republic of Korea
Insurance Availability
2006 Reinsurance MarketPosition
Catastrophe Exposure
KRW955.2000= USD1.00 @ July 31, 2006
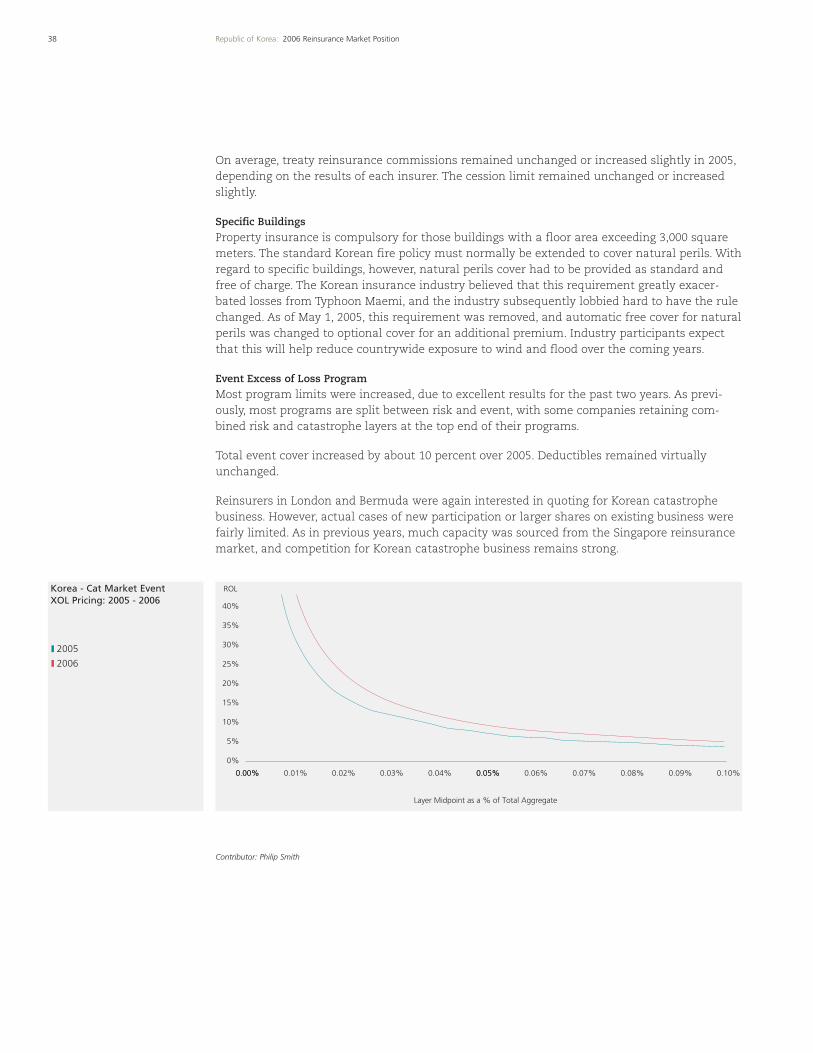
Korea - Cat Market Event XOL Pricing: 2005 - 2006
38 Republic of Korea: 2006 Reinsurance Market Position
On average, treaty reinsurance commissions remained unchanged or increased slightly in 2005,depending on the results of each insurer. The cession limit remained unchanged or increasedslightly.
Specific Buildings
Property insurance is compulsory for those buildings with a floor area exceeding 3,000 squaremeters. The standard Korean fire policy must normally be extended to cover natural perils. Withregard to specific buildings, however, natural perils cover had to be provided as standard andfree of charge. The Korean insurance industry believed that this requirement greatly exacer-bated losses from Typhoon Maemi, and the industry subsequently lobbied hard to have the rulechanged. As of May 1, 2005, this requirement was removed, and automatic free cover for naturalperils was changed to optional cover for an additional premium. Industry participants expectthat this will help reduce countrywide exposure to wind and flood over the coming years.
Event Excess of Loss Program
Most program limits were increased, due to excellent results for the past two years. As previ-ously, most programs are split between risk and event, with some companies retaining com-bined risk and catastrophe layers at the top end of their programs.
Total event cover increased by about 10 percent over 2005. Deductibles remained virtuallyunchanged.
Reinsurers in London and Bermuda were again interested in quoting for Korean catastrophebusiness. However, actual cases of new participation or larger shares on existing business werefairly limited. As in previous years, much capacity was sourced from the Singapore reinsurancemarket, and competition for Korean catastrophe business remains strong.
Contributor: Philip Smith
0%
5%
10%
15%
20%
25%
30%
35%
40%
0.00%0.00% 0.01% 0.02% 0.03% 0.04% 0.05%0.05% 0.06% 0.07% 0.08% 0.09% 0.10%
Layer Midpoint as a % of Total Aggregate
ROL
2005
2006
39Taiwan: Catastrophe Exposure
Taiwan is exposed to the major hazards of earthquake, windstorm and typhoon. The countryhas experienced two catastrophic events in recent years that significantly impacted theinsurance industry. The Chi Chi earthquake in September 1999 damaged more than 50,000properties, causing an insured loss of TWD23.8 billion. Typhoon Nari, which struck Taiwan fromthe northwest in September 2001, caused the most severe floods in the country’s history, withan insured loss of TWD17.3 billion.
Basic commercial property forms cover fire, lightning and fire following explosion. These formscan be endorsed to cover additional perils, including earthquake, typhoon/flood and terrorism.A comprehensive commercial property policy is also available. This is written on an all-riskbasis and provides full coverage for earthquake and typhoon/flood. Both forms are approved bythe Insurance Bureau, and tariff rates apply, except for risks:
• with sum insured values exceeding TWD3 billion; or
• with multilocations with total sum insured values exceeding TWD5 billion; or
• of the same group with total sum insured values exceeding TWD10 billion.
For the larger industrial and commercial risks, coverage for earthquake and typhoon/flood isavailable by endorsement to the all-risk policy forms used in the international market, mainlythe Association of British Insurers or the Munich Re forms.
On April 1, 2002, a new version of the residential fire and earthquake policy form was intro-duced by the Insurance Bureau. The residential fire section can be extended to cover additionalperils, including typhoon/flood. Coverage for earthquake is provided up to a maximum insuredvalue of TWD1.2 million, with contingent living expenses of TWD180,000. This coverage willonly respond to a total constructive loss. Subject to final approval by the Taiwanese authorities,the coverage will be extended as of January 1, 2007, to include total constructive loss caused bytsunami following earthquake. Long-term residential fire policies issued prior to April 1, 2002,will be phased out but can be endorsed to cover earthquake within the mortgage period.
Coverage for terrorism is available by endorsement to both the residential fire and the basiccommercial property policy forms. Tariff rates are 0.02 percent for residential and 0.012 percentfor commercial. Due to a lack of reinsurance support, local insurers generally do not offer thiscoverage to the commercial sector. Public demand for the coverage is limited.
On January 1, 2004, an insurance pool was formed to provide terrorism coverage for personalaccident business up to a maximum insured amount of TWD2 million per person. This pool isadministered by the Non-Life Insurance Association in Taiwan and was created to shareterrorism risk for personal accident business among private insurance companies and theCentral Reinsurance Corporation in Taiwan. The pool has a cap amount of TWD1 billion. Iflosses exceed that amount, claims would be paid on a pro rata basis.
Taiwan
Insurance Availability
Catastrophe Exposure
TWD32.7440 = USD1.00 @ July 31, 2006
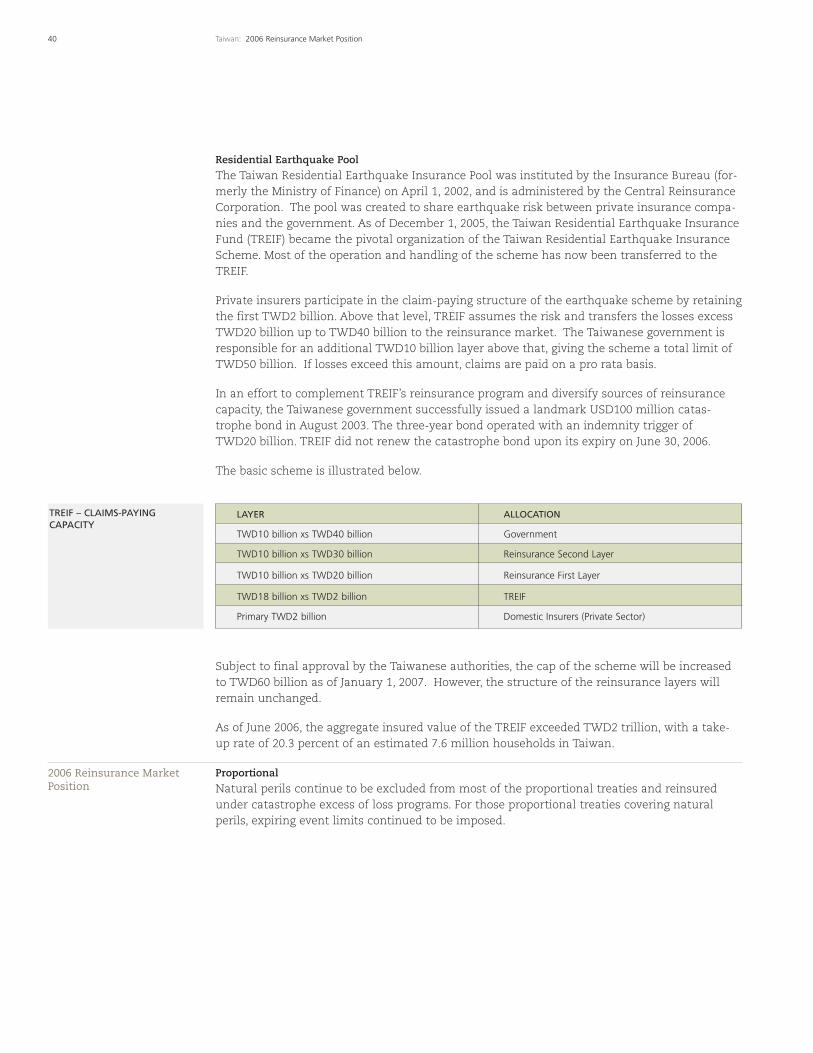
Residential Earthquake Pool
The Taiwan Residential Earthquake Insurance Pool was instituted by the Insurance Bureau (for-merly the Ministry of Finance) on April 1, 2002, and is administered by the Central ReinsuranceCorporation. The pool was created to share earthquake risk between private insurance compa-nies and the government. As of December 1, 2005, the Taiwan Residential Earthquake InsuranceFund (TREIF) became the pivotal organization of the Taiwan Residential Earthquake InsuranceScheme. Most of the operation and handling of the scheme has now been transferred to theTREIF.
Private insurers participate in the claim-paying structure of the earthquake scheme by retainingthe first TWD2 billion. Above that level, TREIF assumes the risk and transfers the losses excessTWD20 billion up to TWD40 billion to the reinsurance market. The Taiwanese government isresponsible for an additional TWD10 billion layer above that, giving the scheme a total limit ofTWD50 billion. If losses exceed this amount, claims are paid on a pro rata basis.
In an effort to complement TREIF’s reinsurance program and diversify sources of reinsurancecapacity, the Taiwanese government successfully issued a landmark USD100 million catas-trophe bond in August 2003. The three-year bond operated with an indemnity trigger ofTWD20 billion. TREIF did not renew the catastrophe bond upon its expiry on June 30, 2006.
The basic scheme is illustrated below.
Subject to final approval by the Taiwanese authorities, the cap of the scheme will be increasedto TWD60 billion as of January 1, 2007. However, the structure of the reinsurance layers willremain unchanged.
As of June 2006, the aggregate insured value of the TREIF exceeded TWD2 trillion, with a take-up rate of 20.3 percent of an estimated 7.6 million households in Taiwan.
Proportional
Natural perils continue to be excluded from most of the proportional treaties and reinsuredunder catastrophe excess of loss programs. For those proportional treaties covering naturalperils, expiring event limits continued to be imposed.
LAYER ALLOCATION
TWD10 billion xs TWD40 billion Government
TWD10 billion xs TWD30 billion Reinsurance Second Layer
TWD10 billion xs TWD20 billion Reinsurance First Layer
TWD18 billion xs TWD2 billion TREIF
Primary TWD2 billion Domestic Insurers (Private Sector)
40 Taiwan: 2006 Reinsurance Market Position
2006 Reinsurance Market Position
TREIF – CLAIMS-PAYINGCAPACITY
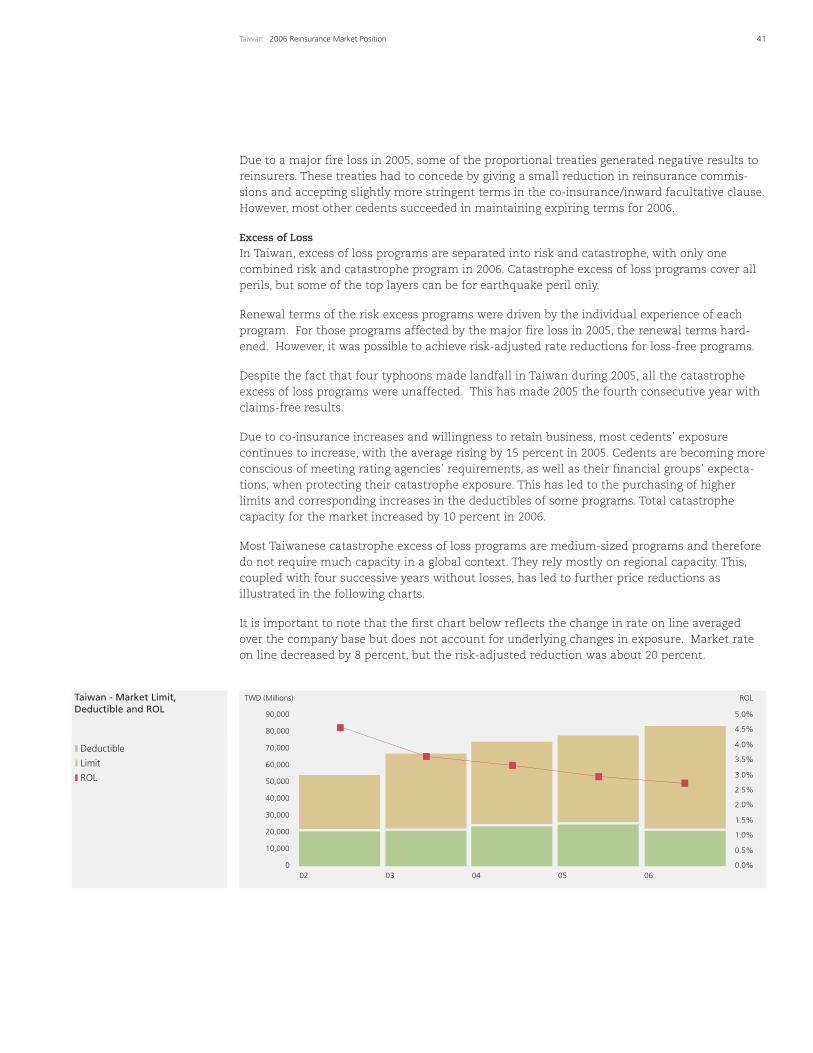
Taiwan - Market Limit,Deductible and ROL
41Taiwan: 2006 Reinsurance Market Position
Due to a major fire loss in 2005, some of the proportional treaties generated negative results toreinsurers. These treaties had to concede by giving a small reduction in reinsurance commis-sions and accepting slightly more stringent terms in the co-insurance/inward facultative clause.However, most other cedents succeeded in maintaining expiring terms for 2006.
Excess of Loss
In Taiwan, excess of loss programs are separated into risk and catastrophe, with only onecombined risk and catastrophe program in 2006. Catastrophe excess of loss programs cover allperils, but some of the top layers can be for earthquake peril only.
Renewal terms of the risk excess programs were driven by the individual experience of eachprogram. For those programs affected by the major fire loss in 2005, the renewal terms hard-ened. However, it was possible to achieve risk-adjusted rate reductions for loss-free programs.
Despite the fact that four typhoons made landfall in Taiwan during 2005, all the catastropheexcess of loss programs were unaffected. This has made 2005 the fourth consecutive year withclaims-free results.
Due to co-insurance increases and willingness to retain business, most cedents’ exposurecontinues to increase, with the average rising by 15 percent in 2005. Cedents are becoming moreconscious of meeting rating agencies’ requirements, as well as their financial groups’ expecta-tions, when protecting their catastrophe exposure. This has led to the purchasing of higherlimits and corresponding increases in the deductibles of some programs. Total catastrophecapacity for the market increased by 10 percent in 2006.
Most Taiwanese catastrophe excess of loss programs are medium-sized programs and thereforedo not require much capacity in a global context. They rely mostly on regional capacity. This,coupled with four successive years without losses, has led to further price reductions asillustrated in the following charts.
It is important to note that the first chart below reflects the change in rate on line averagedover the company base but does not account for underlying changes in exposure. Market rateon line decreased by 8 percent, but the risk-adjusted reduction was about 20 percent.
Deductible
Limit
ROL
ROL
0
10,000
20,000
30,000
40,000
50,000
60,000
70,000
80,000
90,000
02 03 04 05 06
TWD (Millions)
0.0%
0.5%
1.0%
1.5%
2.0%
2.5%
3.0%
3.5%
4.0%
4.5%
5.0%
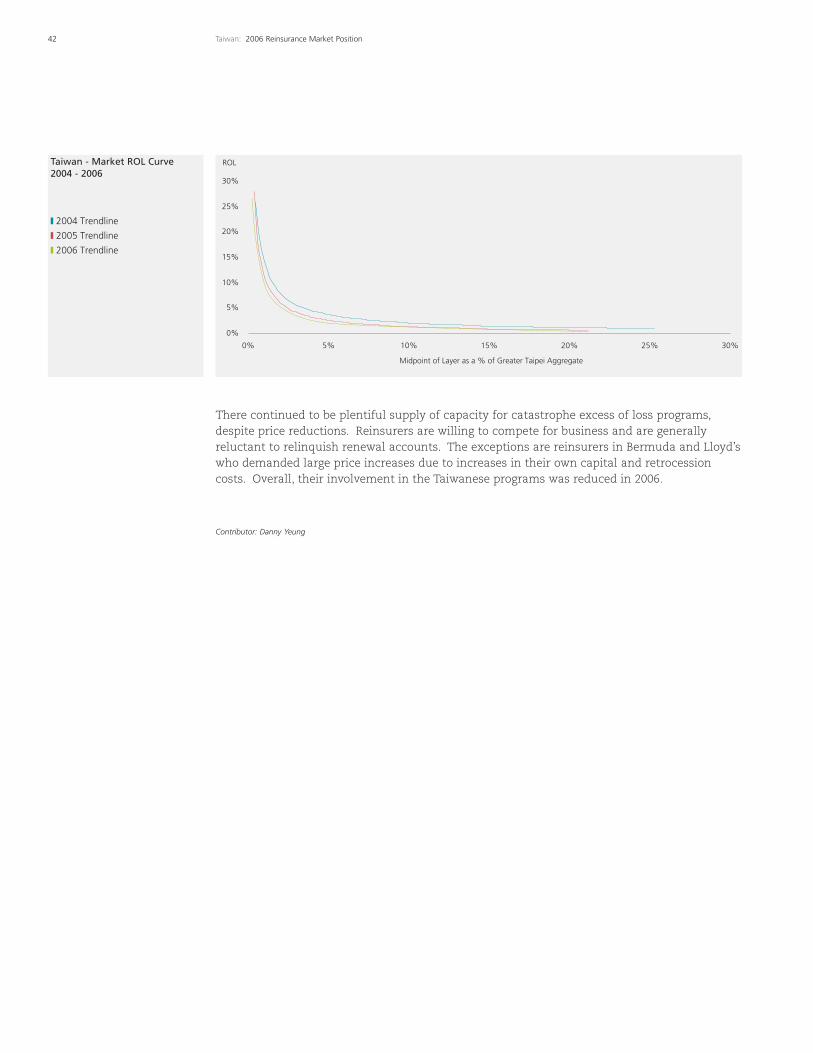
Taiwan - Market ROL Curve2004 - 2006
42 Taiwan: 2006 Reinsurance Market Position
There continued to be plentiful supply of capacity for catastrophe excess of loss programs,despite price reductions. Reinsurers are willing to compete for business and are generallyreluctant to relinquish renewal accounts. The exceptions are reinsurers in Bermuda and Lloyd’swho demanded large price increases due to increases in their own capital and retrocessioncosts. Overall, their involvement in the Taiwanese programs was reduced in 2006.
Contributor: Danny Yeung
2004 Trendline
2005 Trendline
2006 Trendline
0%
5%
10%
15%
20%
25%
30%
0% 5% 10% 15% 20% 25% 30%
Midpoint of Layer as a % of Greater Taipei Aggregate
ROL
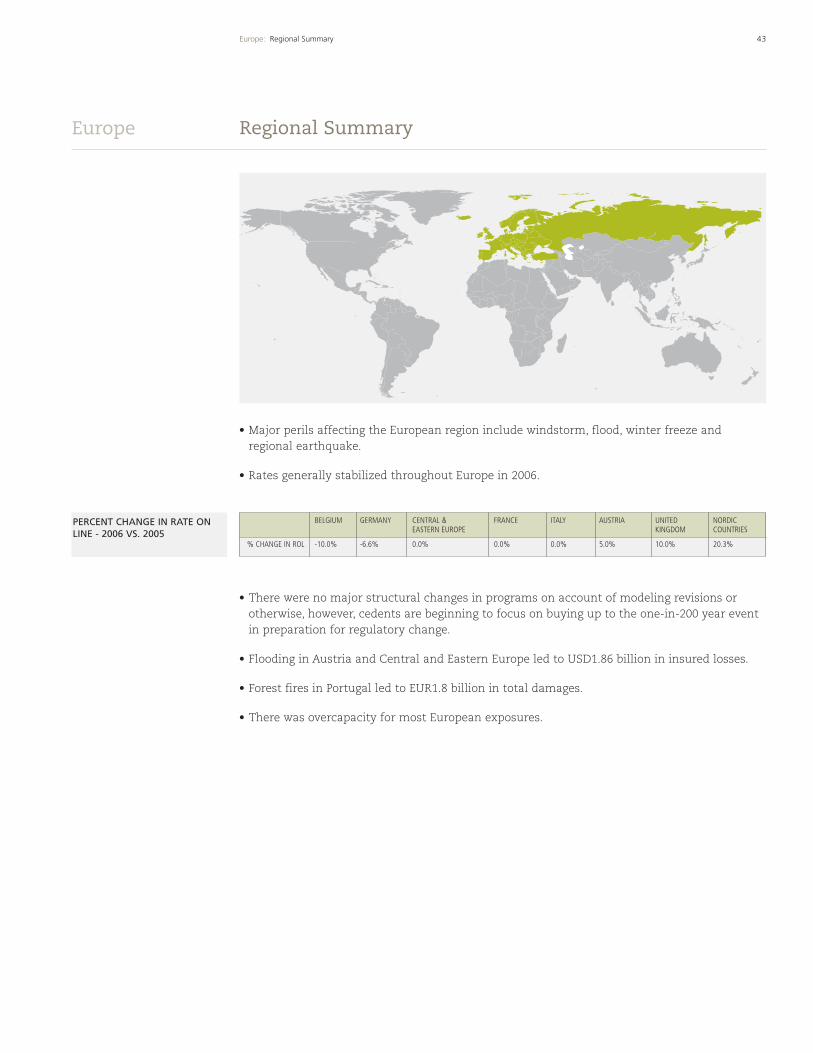
43Europe: Regional Summary
Regional SummaryEurope
• Major perils affecting the European region include windstorm, flood, winter freeze andregional earthquake.
• Rates generally stabilized throughout Europe in 2006.
• There were no major structural changes in programs on account of modeling revisions orotherwise, however, cedents are beginning to focus on buying up to the one-in-200 year eventin preparation for regulatory change.
• Flooding in Austria and Central and Eastern Europe led to USD1.86 billion in insured losses.
• Forest fires in Portugal led to EUR1.8 billion in total damages.
• There was overcapacity for most European exposures.
PERCENT CHANGE IN RATE ONLINE - 2006 VS. 2005
BELGIUM GERMANY CENTRAL & FRANCE ITALY AUSTRIA UNITED NORDICEASTERN EUROPE KINGDOM COUNTRIES
% CHANGE IN ROL -10.0% -6.6% 0.0% 0.0% 0.0% 5.0% 10.0% 20.3%
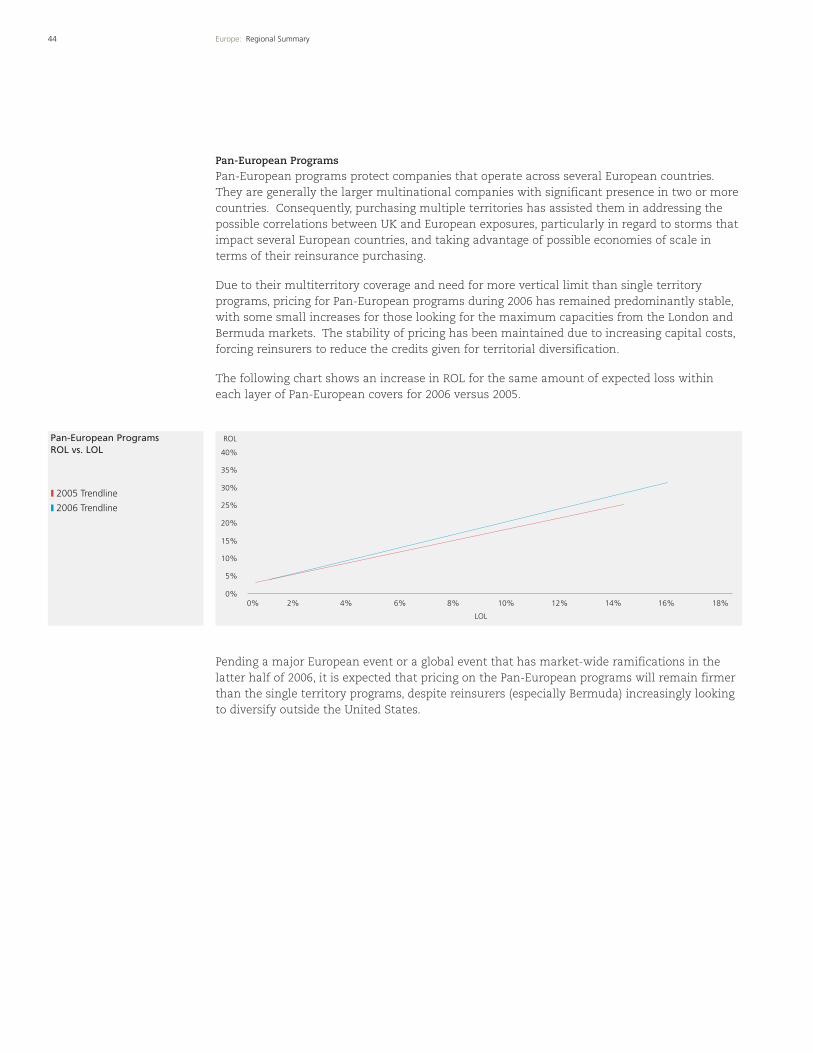
Pan-European ProgramsROL vs. LOL
44 Europe: Regional Summary
Pan-European Programs
Pan-European programs protect companies that operate across several European countries.They are generally the larger multinational companies with significant presence in two or morecountries. Consequently, purchasing multiple territories has assisted them in addressing thepossible correlations between UK and European exposures, particularly in regard to storms thatimpact several European countries, and taking advantage of possible economies of scale interms of their reinsurance purchasing.
Due to their multiterritory coverage and need for more vertical limit than single territoryprograms, pricing for Pan-European programs during 2006 has remained predominantly stable,with some small increases for those looking for the maximum capacities from the London andBermuda markets. The stability of pricing has been maintained due to increasing capital costs,forcing reinsurers to reduce the credits given for territorial diversification.
The following chart shows an increase in ROL for the same amount of expected loss withineach layer of Pan-European covers for 2006 versus 2005.
Pending a major European event or a global event that has market-wide ramifications in thelatter half of 2006, it is expected that pricing on the Pan-European programs will remain firmerthan the single territory programs, despite reinsurers (especially Bermuda) increasingly lookingto diversify outside the United States.
2005 Trendline
2006 Trendline
0%
5%
10%
15%
20%
25%
30%
35%
40%
ROL
0% 2% 4% 6% 10% 14% 18%8%
LOL
12% 16%
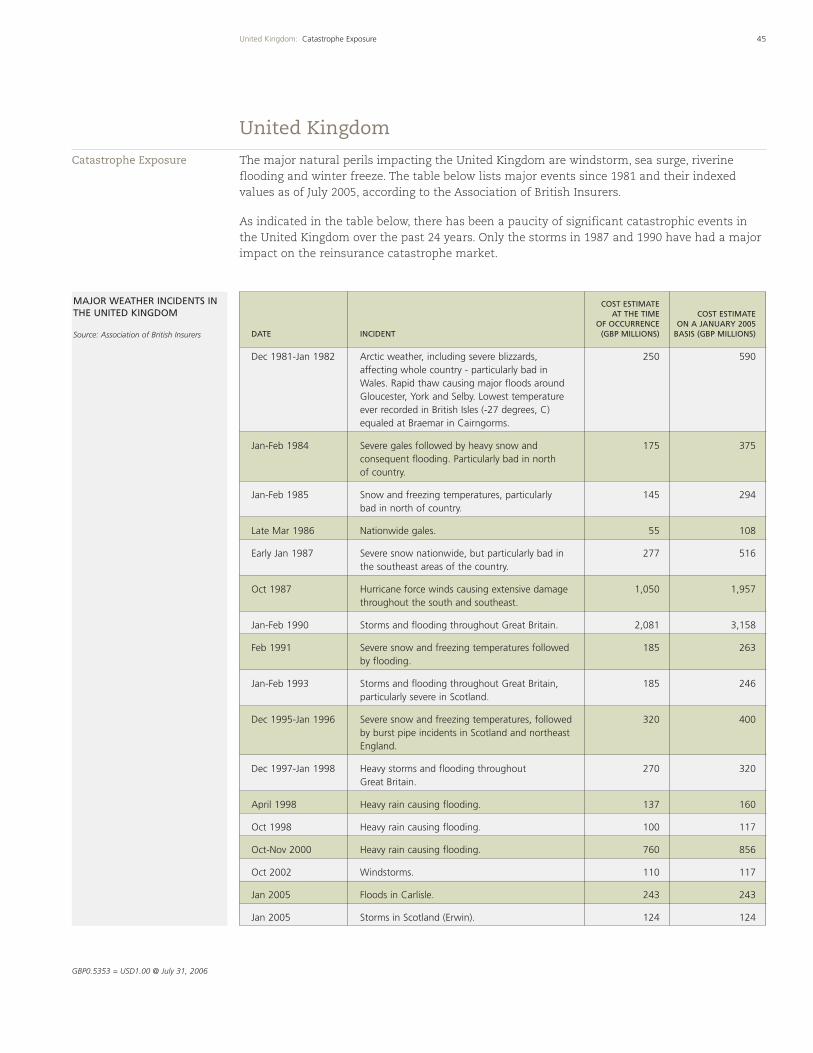
COST ESTIMATE AT THE TIME COST ESTIMATE
OF OCCURRENCE ON A JANUARY 2005 DATE INCIDENT (GBP MILLIONS) BASIS (GBP MILLIONS)
Dec 1981-Jan 1982 Arctic weather, including severe blizzards, 250 590affecting whole country - particularly bad in Wales. Rapid thaw causing major floods around Gloucester, York and Selby. Lowest temperature ever recorded in British Isles (-27 degrees, C) equaled at Braemar in Cairngorms.
Jan-Feb 1984 Severe gales followed by heavy snow and 175 375consequent flooding. Particularly bad in north of country.
Jan-Feb 1985 Snow and freezing temperatures, particularly 145 294bad in north of country.
Late Mar 1986 Nationwide gales. 55 108
Early Jan 1987 Severe snow nationwide, but particularly bad in 277 516the southeast areas of the country.
Oct 1987 Hurricane force winds causing extensive damage 1,050 1,957throughout the south and southeast.
Jan-Feb 1990 Storms and flooding throughout Great Britain. 2,081 3,158
Feb 1991 Severe snow and freezing temperatures followed 185 263by flooding.
Jan-Feb 1993 Storms and flooding throughout Great Britain, 185 246particularly severe in Scotland.
Dec 1995-Jan 1996 Severe snow and freezing temperatures, followed 320 400by burst pipe incidents in Scotland and northeast England.
Dec 1997-Jan 1998 Heavy storms and flooding throughout 270 320Great Britain.
April 1998 Heavy rain causing flooding. 137 160
Oct 1998 Heavy rain causing flooding. 100 117
Oct-Nov 2000 Heavy rain causing flooding. 760 856
Oct 2002 Windstorms. 110 117
Jan 2005 Floods in Carlisle. 243 243
Jan 2005 Storms in Scotland (Erwin). 124 124
45United Kingdom: Catastrophe Exposure
The major natural perils impacting the United Kingdom are windstorm, sea surge, riverineflooding and winter freeze. The table below lists major events since 1981 and their indexedvalues as of July 2005, according to the Association of British Insurers.
As indicated in the table below, there has been a paucity of significant catastrophic events inthe United Kingdom over the past 24 years. Only the storms in 1987 and 1990 have had a majorimpact on the reinsurance catastrophe market.
United Kingdom
Catastrophe Exposure
MAJOR WEATHER INCIDENTS INTHE UNITED KINGDOM
Source: Association of British Insurers
GBP0.5353 = USD1.00 @ July 31, 2006
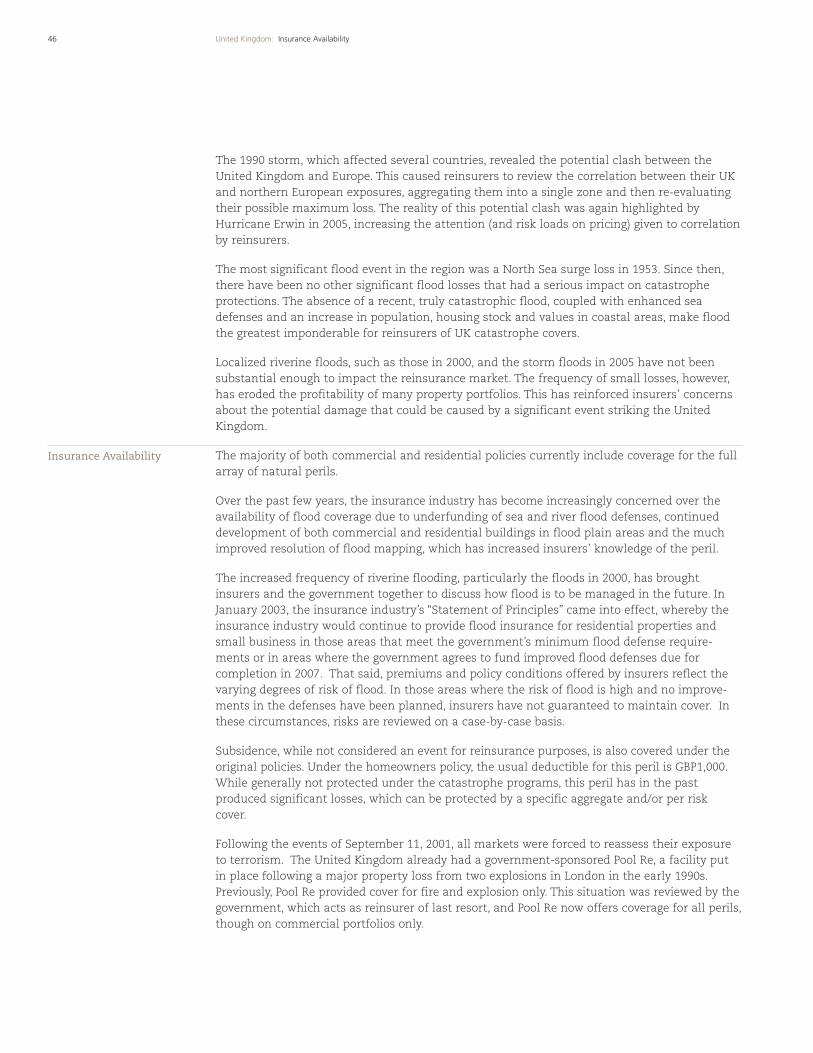
46 United Kingdom: Insurance Availability
The 1990 storm, which affected several countries, revealed the potential clash between theUnited Kingdom and Europe. This caused reinsurers to review the correlation between their UKand northern European exposures, aggregating them into a single zone and then re-evaluatingtheir possible maximum loss. The reality of this potential clash was again highlighted byHurricane Erwin in 2005, increasing the attention (and risk loads on pricing) given to correlationby reinsurers.
The most significant flood event in the region was a North Sea surge loss in 1953. Since then,there have been no other significant flood losses that had a serious impact on catastropheprotections. The absence of a recent, truly catastrophic flood, coupled with enhanced seadefenses and an increase in population, housing stock and values in coastal areas, make floodthe greatest imponderable for reinsurers of UK catastrophe covers.
Localized riverine floods, such as those in 2000, and the storm floods in 2005 have not beensubstantial enough to impact the reinsurance market. The frequency of small losses, however,has eroded the profitability of many property portfolios. This has reinforced insurers’ concernsabout the potential damage that could be caused by a significant event striking the UnitedKingdom.
The majority of both commercial and residential policies currently include coverage for the fullarray of natural perils.
Over the past few years, the insurance industry has become increasingly concerned over theavailability of flood coverage due to underfunding of sea and river flood defenses, continueddevelopment of both commercial and residential buildings in flood plain areas and the muchimproved resolution of flood mapping, which has increased insurers’ knowledge of the peril.
The increased frequency of riverine flooding, particularly the floods in 2000, has broughtinsurers and the government together to discuss how flood is to be managed in the future. InJanuary 2003, the insurance industry’s “Statement of Principles” came into effect, whereby theinsurance industry would continue to provide flood insurance for residential properties andsmall business in those areas that meet the government’s minimum flood defense require-ments or in areas where the government agrees to fund improved flood defenses due forcompletion in 2007. That said, premiums and policy conditions offered by insurers reflect thevarying degrees of risk of flood. In those areas where the risk of flood is high and no improve-ments in the defenses have been planned, insurers have not guaranteed to maintain cover. Inthese circumstances, risks are reviewed on a case-by-case basis.
Subsidence, while not considered an event for reinsurance purposes, is also covered under theoriginal policies. Under the homeowners policy, the usual deductible for this peril is GBP1,000.While generally not protected under the catastrophe programs, this peril has in the pastproduced significant losses, which can be protected by a specific aggregate and/or per riskcover.
Following the events of September 11, 2001, all markets were forced to reassess their exposureto terrorism. The United Kingdom already had a government-sponsored Pool Re, a facility putin place following a major property loss from two explosions in London in the early 1990s.Previously, Pool Re provided cover for fire and explosion only. This situation was reviewed by thegovernment, which acts as reinsurer of last resort, and Pool Re now offers coverage for all perils,though on commercial portfolios only.
Insurance Availability
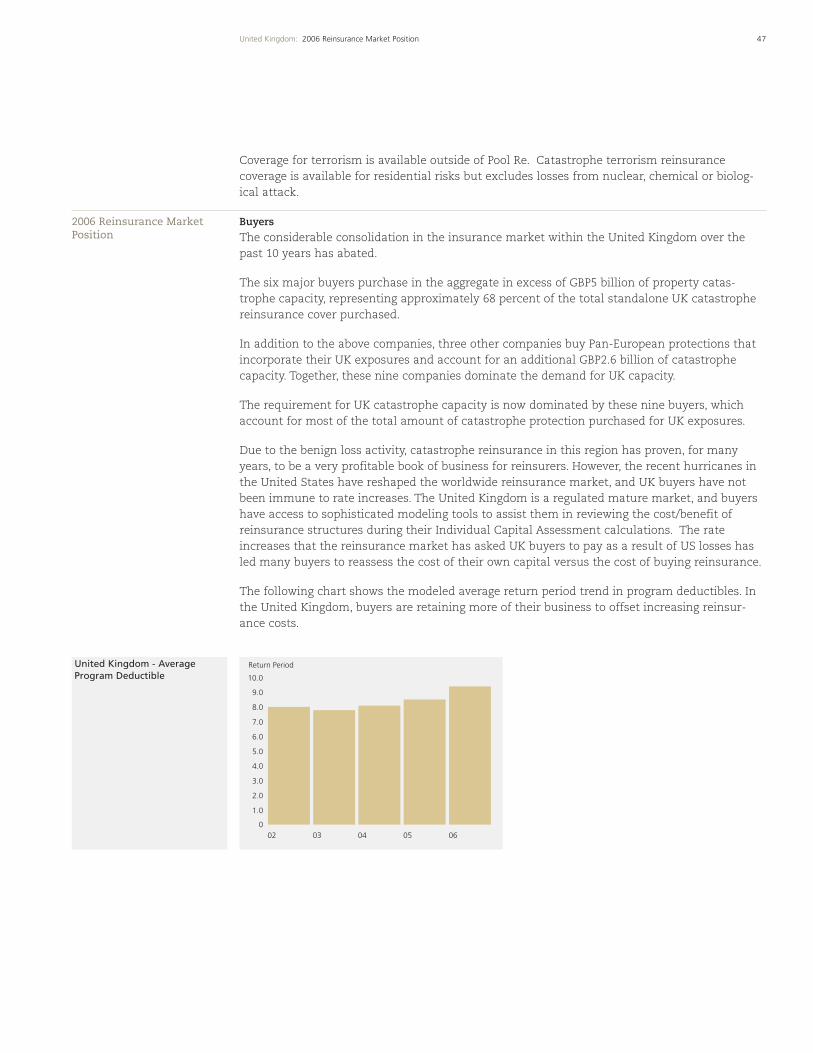
47United Kingdom: 2006 Reinsurance Market Position
Coverage for terrorism is available outside of Pool Re. Catastrophe terrorism reinsurancecoverage is available for residential risks but excludes losses from nuclear, chemical or biolog-ical attack.
Buyers
The considerable consolidation in the insurance market within the United Kingdom over thepast 10 years has abated.
The six major buyers purchase in the aggregate in excess of GBP5 billion of property catas-trophe capacity, representing approximately 68 percent of the total standalone UK catastrophereinsurance cover purchased.
In addition to the above companies, three other companies buy Pan-European protections thatincorporate their UK exposures and account for an additional GBP2.6 billion of catastrophecapacity. Together, these nine companies dominate the demand for UK capacity.
The requirement for UK catastrophe capacity is now dominated by these nine buyers, whichaccount for most of the total amount of catastrophe protection purchased for UK exposures.
Due to the benign loss activity, catastrophe reinsurance in this region has proven, for manyyears, to be a very profitable book of business for reinsurers. However, the recent hurricanes inthe United States have reshaped the worldwide reinsurance market, and UK buyers have notbeen immune to rate increases. The United Kingdom is a regulated mature market, and buyershave access to sophisticated modeling tools to assist them in reviewing the cost/benefit ofreinsurance structures during their Individual Capital Assessment calculations. The rateincreases that the reinsurance market has asked UK buyers to pay as a result of US losses hasled many buyers to reassess the cost of their own capital versus the cost of buying reinsurance.
The following chart shows the modeled average return period trend in program deductibles. Inthe United Kingdom, buyers are retaining more of their business to offset increasing reinsur-ance costs.
2006 Reinsurance MarketPosition
0
1.0
2.0
3.0
4.0
5.0
6.0
7.0
8.0
9.0
10.0
02 03 04 0605
Return PeriodUnited Kingdom - AverageProgram Deductible
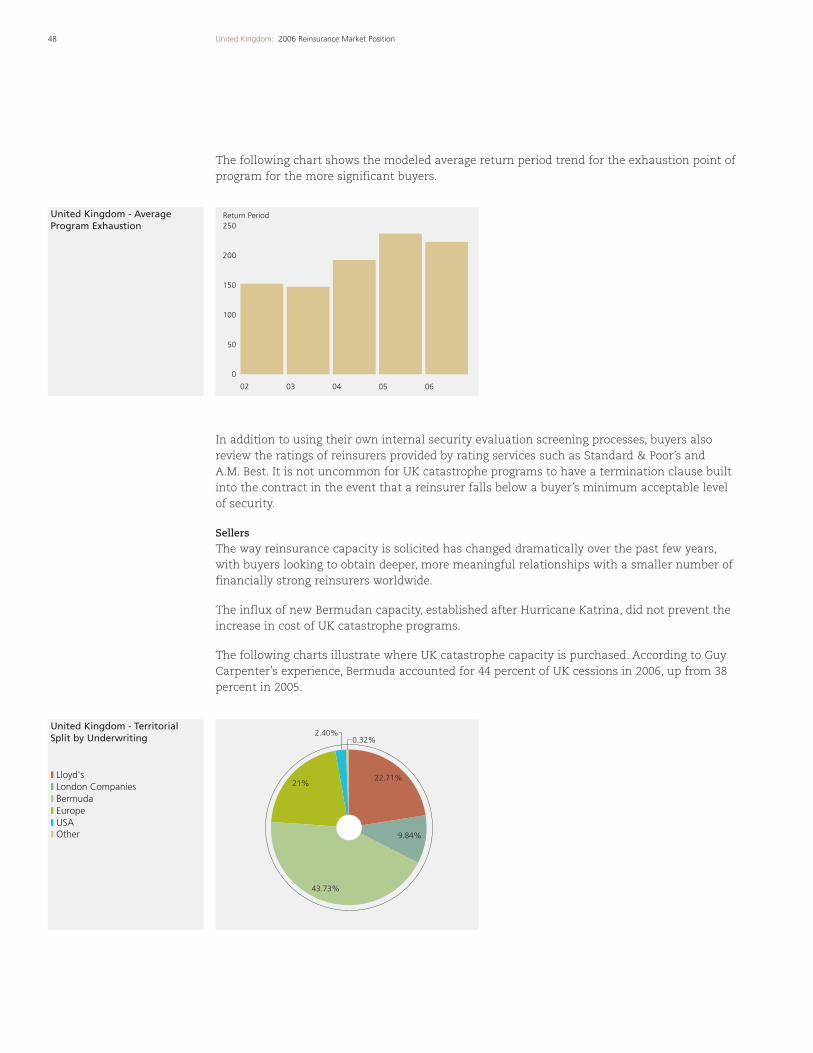
United Kingdom - Territorial Split by Underwriting
48 United Kingdom: 2006 Reinsurance Market Position
The following chart shows the modeled average return period trend for the exhaustion point ofprogram for the more significant buyers.
In addition to using their own internal security evaluation screening processes, buyers alsoreview the ratings of reinsurers provided by rating services such as Standard & Poor’s andA.M. Best. It is not uncommon for UK catastrophe programs to have a termination clause builtinto the contract in the event that a reinsurer falls below a buyer’s minimum acceptable levelof security.
Sellers
The way reinsurance capacity is solicited has changed dramatically over the past few years,with buyers looking to obtain deeper, more meaningful relationships with a smaller number offinancially strong reinsurers worldwide.
The influx of new Bermudan capacity, established after Hurricane Katrina, did not prevent theincrease in cost of UK catastrophe programs.
The following charts illustrate where UK catastrophe capacity is purchased. According to GuyCarpenter’s experience, Bermuda accounted for 44 percent of UK cessions in 2006, up from 38percent in 2005.
0
50
100
150
200
250
02 03 04 0605
Return PeriodUnited Kingdom - AverageProgram Exhaustion
Lloyd's London Companies Bermuda Europe USA Other
14%22.71%
9.84%
21%
43.73%
2.40%0.32%
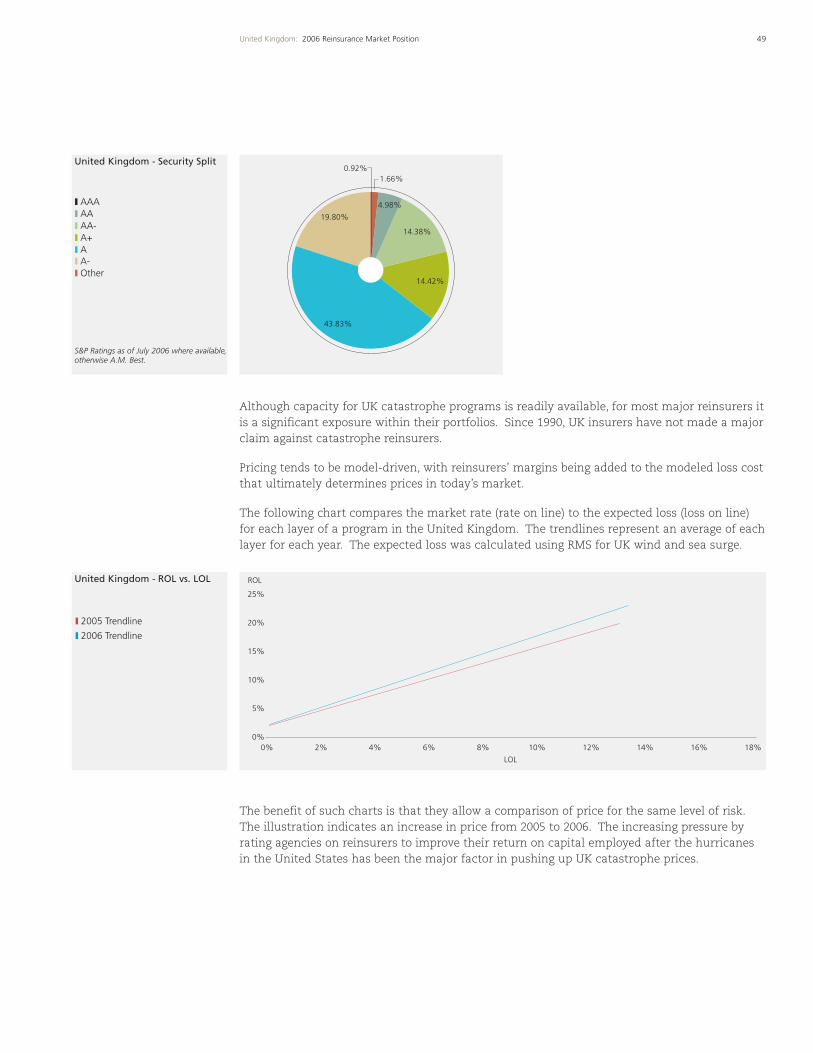
United Kingdom - ROL vs. LOL
United Kingdom - Security Split
S&P Ratings as of July 2006 where available,otherwise A.M. Best.
49United Kingdom: 2006 Reinsurance Market Position
Although capacity for UK catastrophe programs is readily available, for most major reinsurers itis a significant exposure within their portfolios. Since 1990, UK insurers have not made a majorclaim against catastrophe reinsurers.
Pricing tends to be model-driven, with reinsurers’ margins being added to the modeled loss costthat ultimately determines prices in today’s market.
The following chart compares the market rate (rate on line) to the expected loss (loss on line)for each layer of a program in the United Kingdom. The trendlines represent an average of eachlayer for each year. The expected loss was calculated using RMS for UK wind and sea surge.
The benefit of such charts is that they allow a comparison of price for the same level of risk.The illustration indicates an increase in price from 2005 to 2006. The increasing pressure byrating agencies on reinsurers to improve their return on capital employed after the hurricanesin the United States has been the major factor in pushing up UK catastrophe prices.
AAA AA AA- A+ A A- Other
43.83%
19.80%
4.98%
14.38%
14.42%
0.92%1.66%
2005 Trendline
2006 Trendline
0%
5%
10%
15%
20%
25%
ROL
0% 2% 4% 6% 10% 14% 18%8% 12% 16%
LOL
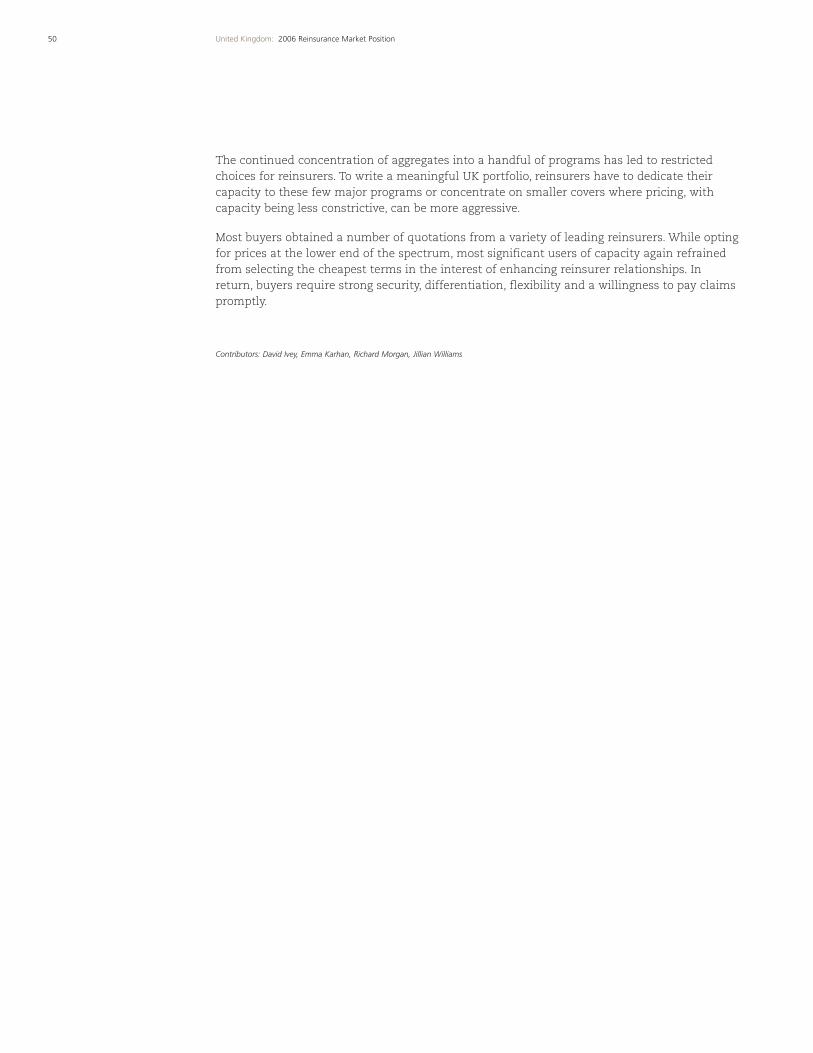
50 United Kingdom: 2006 Reinsurance Market Position
The continued concentration of aggregates into a handful of programs has led to restrictedchoices for reinsurers. To write a meaningful UK portfolio, reinsurers have to dedicate theircapacity to these few major programs or concentrate on smaller covers where pricing, withcapacity being less constrictive, can be more aggressive.
Most buyers obtained a number of quotations from a variety of leading reinsurers. While optingfor prices at the lower end of the spectrum, most significant users of capacity again refrainedfrom selecting the cheapest terms in the interest of enhancing reinsurer relationships. Inreturn, buyers require strong security, differentiation, flexibility and a willingness to pay claimspromptly.
Contributors: David Ivey, Emma Karhan, Richard Morgan, Jillian Williams
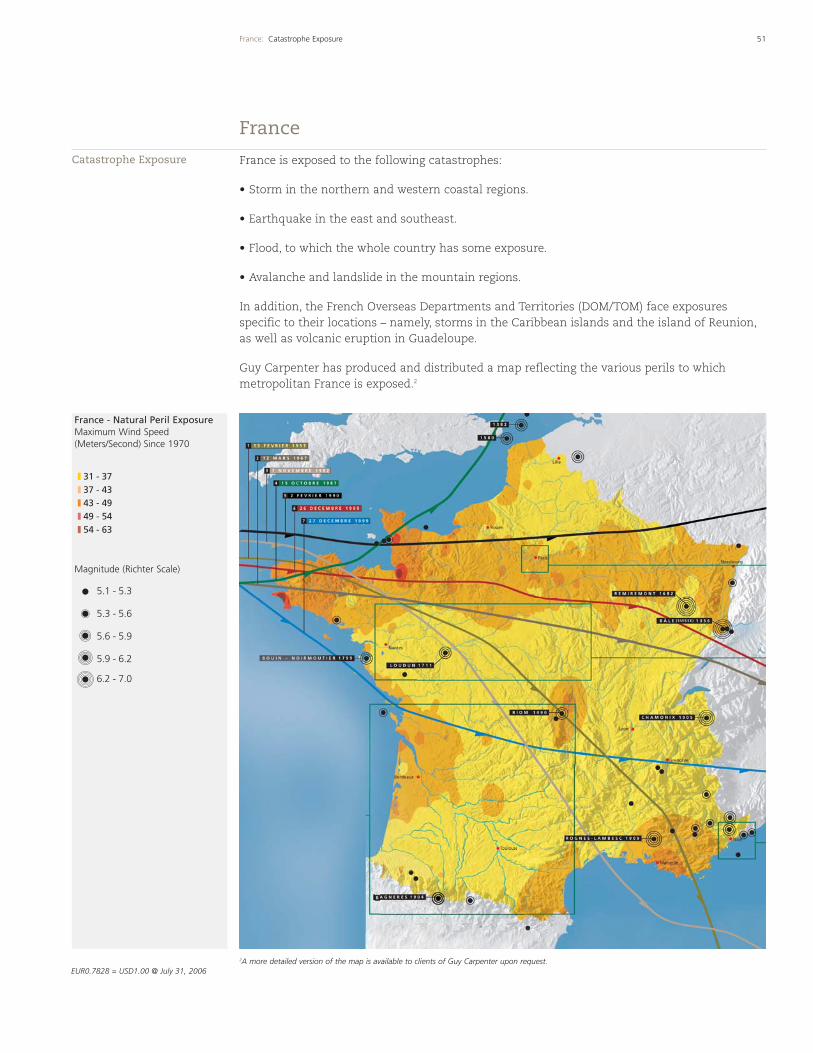
France - Natural Peril ExposureMaximum Wind Speed(Meters/Second) Since 1970
51France: Catastrophe Exposure
France is exposed to the following catastrophes:
• Storm in the northern and western coastal regions.
• Earthquake in the east and southeast.
• Flood, to which the whole country has some exposure.
• Avalanche and landslide in the mountain regions.
In addition, the French Overseas Departments and Territories (DOM/TOM) face exposuresspecific to their locations – namely, storms in the Caribbean islands and the island of Reunion,as well as volcanic eruption in Guadeloupe.
Guy Carpenter has produced and distributed a map reflecting the various perils to whichmetropolitan France is exposed.2
France
31 - 3737 - 4343 - 4949 - 5454 - 63
5.1 - 5.3
5.3 - 5.6
5.6 - 5.9
5.9 - 6.2
6.2 - 7.0
Magnitude (Richter Scale)
2A more detailed version of the map is available to clients of Guy Carpenter upon request.EUR0.7828 = USD1.00 @ July 31, 2006
Catastrophe Exposure
52 France: Insurance Availability
Storm coverage is included in almost every homeowners contract and in mostcommercial/industrial contracts. Flood, earthquake and subsidence are covered by theCatastrophe Naturelles (Cat Nat), a special program reinsured mainly by the government-ownedreinsurer, Caisse Centrale de Réassurance (CCR), with some additional participation from theglobal reinsurance market. The Cat Nat plan has been modified to cover all damage caused bymajor cyclones affecting tropical regions, without distinction between damage that is caused bywind and that caused by water. Insurance companies are permitted to establish two differenttax-deductible reserves for losses from storms and those from Cat Nat. These reserves, knownas equalization reserves, are designed to stabilize financial results over a period of several years.
Subsidence
Subsidence is the second most costly peril in France covered by the national Cat Nat insurancescheme. Between 1989 and 2000, subsidence claims were estimated by the CCR to have cost theFrench insurance market approximately EUR3.3 billion.
Subsidence is caused by ground movement during periods of drought followed by wetterconditions and occurs principally on clay-rich soils. Subsidence damage is most typically seenin the formation of cracks within building walls, the eventual severity of which can depend onadditional factors such as construction quality and the proximity of vegetation.
Even though the reinsurance provided by CCR covers this peril, there remains a significantretention at the cedent’s level that may require appropriate protection.
Despite the cost of subsidence claims to the French insurance market, there is a general lack ofexpertise in the subject available to the insurance industry. Consequently, identifying the mosteffective reinsurance treatment for this complex peril is difficult and problematic.
Guy Carpenter recently developed a Subsidence Information Tool (SIT) for France to fill thesubsidence expertise gap. The SIT will enable French insurers to accurately assess theirexposure to the peril of subsidence, facilitating more informed decision making with regards toreinsurance and subsequent portfolio management for this complex peril.
On March 31, 2004, the International Accounting Standards Board (IASB) issued InternationalFinancial Reporting Standard (IFRS) 4, Insurance Contracts. Under IFRS 4, reserves for possibleclaims under insurance contracts that are not in existence at the reporting date, such asequalization reserves, are prohibited. In the European Union (EU), any company listed on apublic securities exchange will be required to use IFRS rules to prepare its financial statements,effective January 1, 2005.
It is important to note that international financial reporting standards are different fromregulatory reporting rules. Equalization reserves are promulgated by insurance regulations.Accordingly, an insurance company in France will report the equalization reserves in itsfinancial statements submitted to the regulators, but not on its financial statements asprepared under international financial reporting standards. If tax authorities follow regulatoryreporting, tax deductibility will not be immediately impacted by the IFRS 4 rules.
The Lothar and Martin storms of 1999 remain the main drivers of rate levels on the Frenchmarket. The overall cost of those events was approximately EUR9 billion for Europe as a whole,with France accounting for around EUR7 billion. Seventy percent of the loss was attributable toLothar.
Insurance Availability
2006 Reinsurance MarketPosition
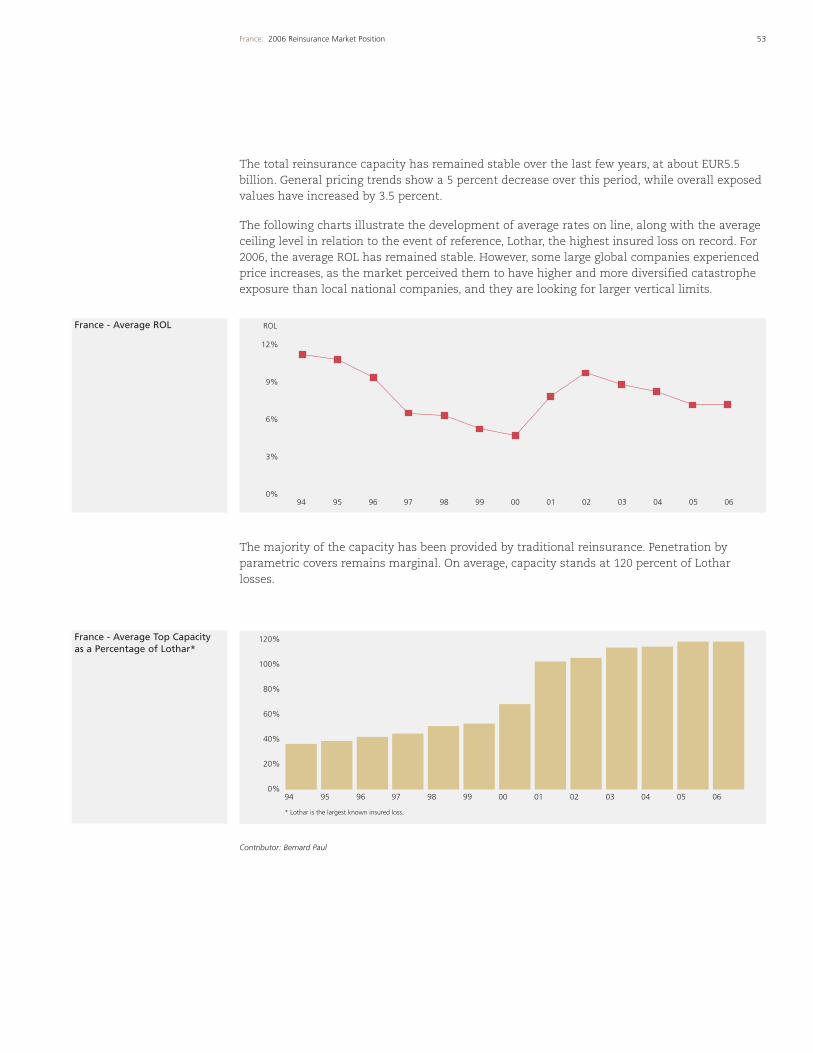
53France: 2006 Reinsurance Market Position
The total reinsurance capacity has remained stable over the last few years, at about EUR5.5billion. General pricing trends show a 5 percent decrease over this period, while overall exposedvalues have increased by 3.5 percent.
The following charts illustrate the development of average rates on line, along with the averageceiling level in relation to the event of reference, Lothar, the highest insured loss on record. For2006, the average ROL has remained stable. However, some large global companies experiencedprice increases, as the market perceived them to have higher and more diversified catastropheexposure than local national companies, and they are looking for larger vertical limits.
The majority of the capacity has been provided by traditional reinsurance. Penetration byparametric covers remains marginal. On average, capacity stands at 120 percent of Lotharlosses.
Contributor: Bernard Paul
12%
9%
6%
3%
0%
ROL
94 989695 9997 00 01 02 03 04 05 06
120%
80%
40%
0%
100%
60%
20%
94
* Lothar is the largest known insured loss.
989695 9997 00 01 02 03 04 05 06
France - Average ROL
France - Average Top Capacity as a Percentage of Lothar*
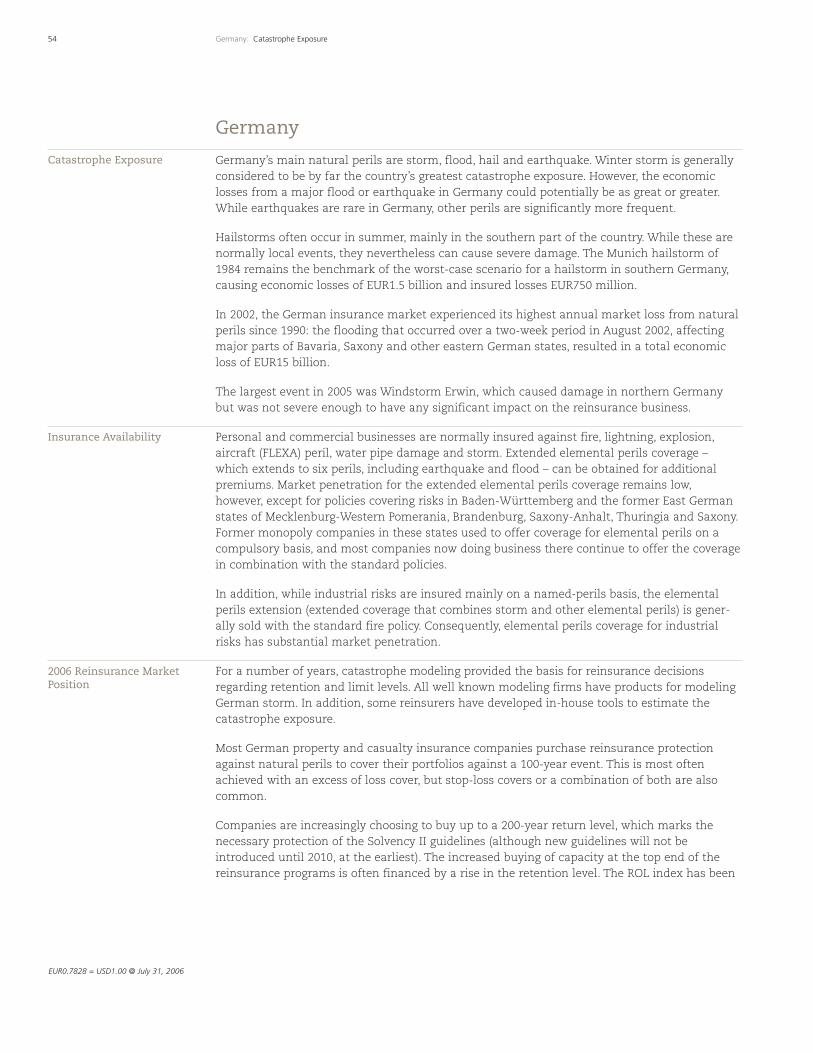
54 Germany: Catastrophe Exposure
Germany’s main natural perils are storm, flood, hail and earthquake. Winter storm is generallyconsidered to be by far the country’s greatest catastrophe exposure. However, the economiclosses from a major flood or earthquake in Germany could potentially be as great or greater.While earthquakes are rare in Germany, other perils are significantly more frequent.
Hailstorms often occur in summer, mainly in the southern part of the country. While these arenormally local events, they nevertheless can cause severe damage. The Munich hailstorm of1984 remains the benchmark of the worst-case scenario for a hailstorm in southern Germany,causing economic losses of EUR1.5 billion and insured losses EUR750 million.
In 2002, the German insurance market experienced its highest annual market loss from naturalperils since 1990: the flooding that occurred over a two-week period in August 2002, affectingmajor parts of Bavaria, Saxony and other eastern German states, resulted in a total economicloss of EUR15 billion.
The largest event in 2005 was Windstorm Erwin, which caused damage in northern Germanybut was not severe enough to have any significant impact on the reinsurance business.
Personal and commercial businesses are normally insured against fire, lightning, explosion,aircraft (FLEXA) peril, water pipe damage and storm. Extended elemental perils coverage –which extends to six perils, including earthquake and flood – can be obtained for additionalpremiums. Market penetration for the extended elemental perils coverage remains low,however, except for policies covering risks in Baden-Württemberg and the former East Germanstates of Mecklenburg-Western Pomerania, Brandenburg, Saxony-Anhalt, Thuringia and Saxony.Former monopoly companies in these states used to offer coverage for elemental perils on acompulsory basis, and most companies now doing business there continue to offer the coveragein combination with the standard policies.
In addition, while industrial risks are insured mainly on a named-perils basis, the elementalperils extension (extended coverage that combines storm and other elemental perils) is gener-ally sold with the standard fire policy. Consequently, elemental perils coverage for industrialrisks has substantial market penetration.
For a number of years, catastrophe modeling provided the basis for reinsurance decisionsregarding retention and limit levels. All well known modeling firms have products for modelingGerman storm. In addition, some reinsurers have developed in-house tools to estimate thecatastrophe exposure.
Most German property and casualty insurance companies purchase reinsurance protectionagainst natural perils to cover their portfolios against a 100-year event. This is most oftenachieved with an excess of loss cover, but stop-loss covers or a combination of both are alsocommon.
Companies are increasingly choosing to buy up to a 200-year return level, which marks thenecessary protection of the Solvency II guidelines (although new guidelines will not beintroduced until 2010, at the earliest). The increased buying of capacity at the top end of thereinsurance programs is often financed by a rise in the retention level. The ROL index has been
Germany
Catastrophe Exposure
Insurance Availability
2006 Reinsurance MarketPosition
EUR0.7828 = USD1.00 @ July 31, 2006
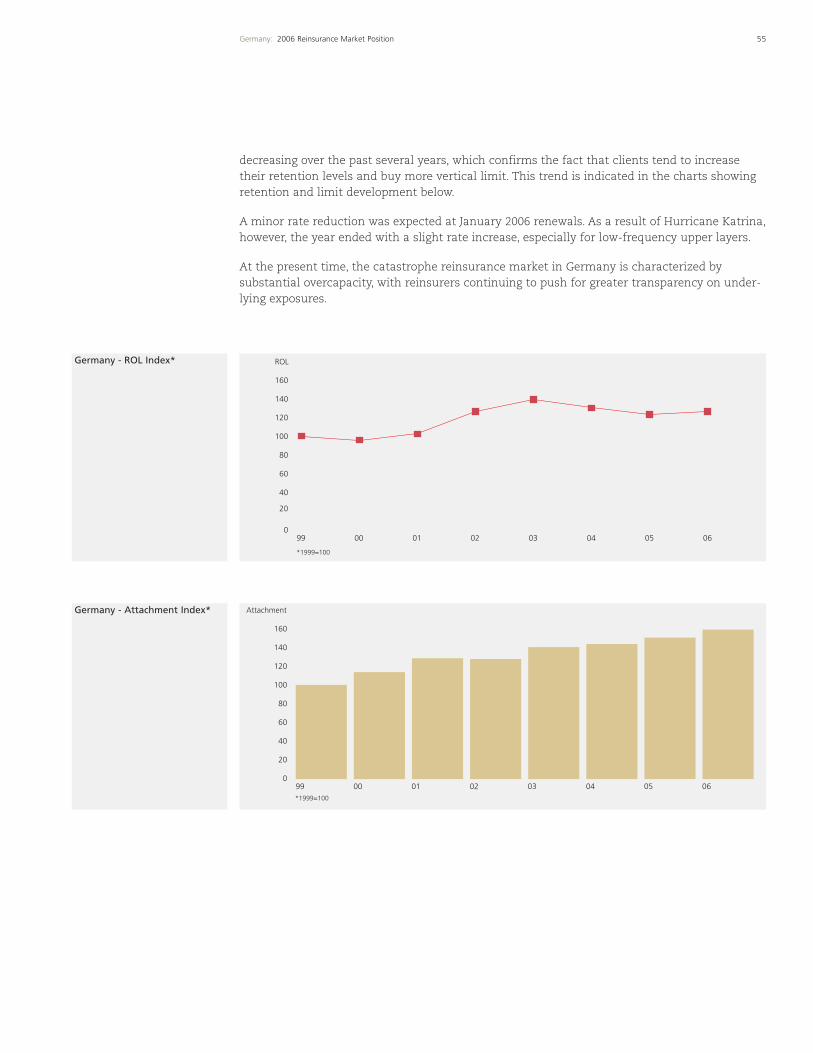
55Germany: 2006 Reinsurance Market Position
decreasing over the past several years, which confirms the fact that clients tend to increasetheir retention levels and buy more vertical limit. This trend is indicated in the charts showingretention and limit development below.
A minor rate reduction was expected at January 2006 renewals. As a result of Hurricane Katrina,however, the year ended with a slight rate increase, especially for low-frequency upper layers.
At the present time, the catastrophe reinsurance market in Germany is characterized bysubstantial overcapacity, with reinsurers continuing to push for greater transparency on under-lying exposures.
160
140
100
120
60
80
20
40
0
ROL
99 00 01 02 03 04 05 06
*1999=100
160
140
100
120
60
80
20
40
0
Attachment
99 00 01 02 03 04 05 06*1999=100
Germany - ROL Index*
Germany - Attachment Index*
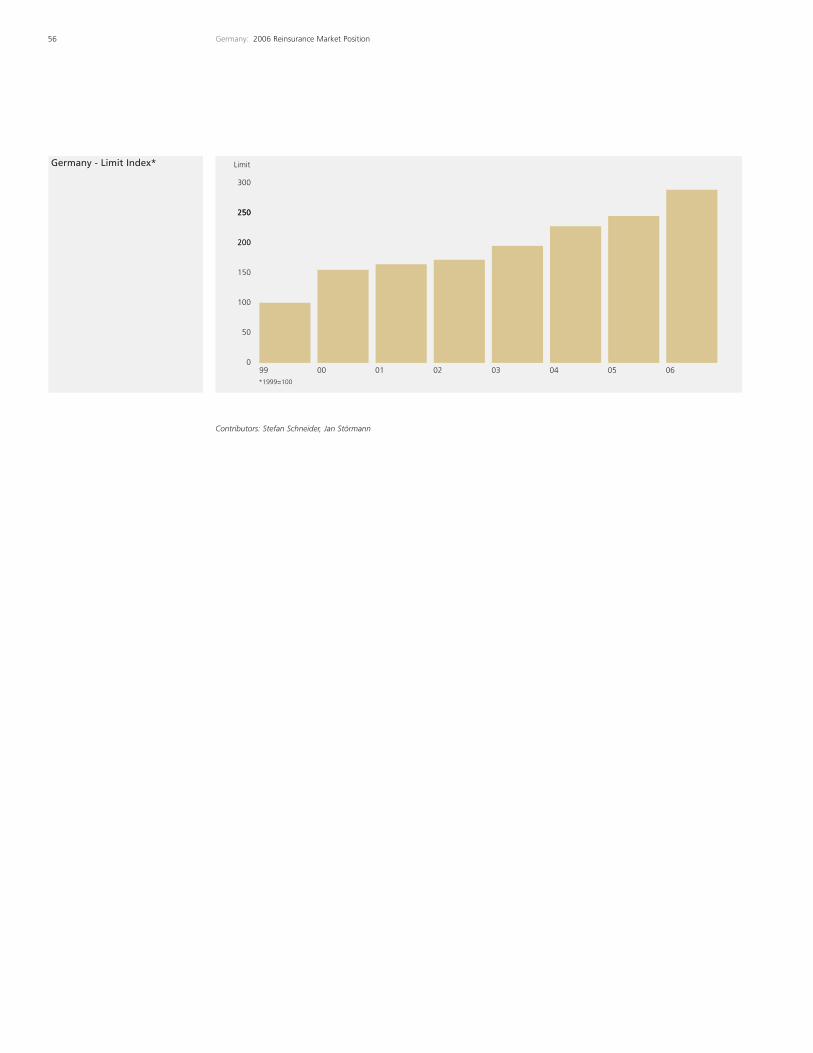
Germany - Limit Index*
56 Germany: 2006 Reinsurance Market Position
Limit
250
150
200
250
200
50
100
099 00 01 02 03 04 05 06*1999=100
250
300
Contributors: Stefan Schneider, Jan Störmann
57Austria: Catastrophe Exposure
Austria is mainly exposed to hail, flood and windstorm. The areas of Vienna and the Danubebasin in upper Austria are the most exposed regions. Although there have been severalsignificant windstorms in the past, Austria typically is not seriously affected by heavy wind.
The meteorological fronts that cause hailstorms tend to move in an easterly direction acrossEurope, causing individual scattered hail showers over a widespread area. The formation of hailis associated with currents of rising air in thunderstorms, so that severe hailstorms tend tooccur in and adjacent to the country’s mountainous regions, where air masses are forcedupward. There have been two major hailstorms in recent years: one in July 2000 and another inMay 2003. The hailstorm of 2000 affected a 20-kilometer strip from north of Salzburg to thesouth of Linz and caused an insured loss of more than EUR250 million in Austria. The hailstormof 2003 occurred in the Vienna area and caused an insured loss of EUR50 million.
Floods have occurred in various parts of Austria but with no regular pattern. The worst floodevent to date occurred in August 2002 and affected large parts of Austria to an extent hithertounknown. The economic loss was approximately EUR3 billion, and the insured loss is estimatedat EUR400 million to EUR500 million.
The earthquake hazard in Austria is considered low. The last notable earthquake was a magni-tude 5.4 event that occurred in 2000 to the south of Vienna.
The largest event in 2005 was the flooding that hit central and eastern Europe in August. InAustria, the event caused an estimated economic loss of EUR560 million and an insured lossthat exceeded EUR110 million. Although this event was not as severe as the one experienced in2002, it still had some impact on the 2006 renewals. Furthermore, the severe winter of2005/2006 resulted in heavy losses, with an estimated insured loss of EUR200 million as aconsequence of snow pressure.
While windstorm is usually included under homeowners policies, there is only limited coverage,if any, available for flood and earthquake. For commercial and industrial policies, cover forwindstorm, flood and earthquake (extended perils) can be obtained for additional premium.Weight of snow, which is included within most covers, is a significant peril in provinces south ofthe Alps.
Insurers are coming under increasing pressure from the government to offer broader cover forcatastrophe perils, and the insurance association is working with the state and federal catas-trophe funds to come to a solution. No concrete proposals have yet been made.
Increasingly, catastrophe modeling provides the basis for reinsurance decisions regardingretention and limit levels. There are three commercial storm models available for Austria. A fewearthquake and flood modeling products are available, and further models are expected to bereleased in the near future.
Most Austrian property insurance companies purchase reinsurance protection against naturalperils to cover their portfolios at a minimum for a 100-year event, though buying attitudes canvary widely among companies.
Austria
Insurance Availability
2006 Reinsurance MarketPosition
Catastrophe Exposure
EUR0.7828 = USD1.00 @ July 31, 2006
58 Austria: 2006 Reinsurance Market Position
At 2006 renewals, we saw rate increases up to 10 percent for catastrophe reinsurance in theAustrian market. At the present time, the catastrophe reinsurance market in Austria is charac-terized by substantial overcapacity. This is due to the relatively small size of the Austrianinsurance market. However, the portfolios of some of the bigger Austrian companies alsoinclude significant eastern European exposures, which are becoming increasingly relevant toreinsurance protections. Reinsurers continue to push hard for greater transparency onunderlying exposures.
Contributors: Marco Meili, Stefan Schneider, Jane Toothill
59Italy: Catastrophe Exposure
Italy is heavily exposed to natural catastrophes such as earthquake, landslide and flood. Abouthalf of all Italian municipalities are exposed to natural perils, with peak exposure in Perugia inthe Umbria region, where about 90 percent of the municipalities are at risk.
Over the course of 2005, Italy experienced fewer natural events than usual, and none causeddamage to dwellings or injured people.
Italy is crossed by a seismic fault, which makes earthquake one of the major causes of loss for70 percent of the municipalities. In addition, landslide and flood have caused similar numbersof victims and property damage. Since the beginning of the 20th century, landslide has killedabout 6,000 victims and caused between EUR1 billion to EUR2 billion in damages.
On average, flood in Italy causes losses equal to 0.2 percent of GDP, and the number of victimsrepresents 38 percent of the European total for this type of risk. A more concerning statistic isthe frequency of flood events, which have increased by 50 percent over the last few years.
Because of this evident danger, in May 2004, the Associazione Nazionale fra le ImpreseAssicuratrici (ANIA, Italy’s national association of insurance companies) agreed to a project thatwould evaluate flood risk in Italy. This project, called SIGRA (integrated system for the manage-ment of flood risks), should be completed by July 2007.
SIGRA will allow insurance companies to evaluate the grade of risks for potential policies at thetime of underwriting, hence providing companies a way to rate risk more efficiently andcalculate a more accurate PML for any given area of risk. Obviously, the new PML calculation islikely to have a major impact on reinsurance purchasing decisions.
At present, there is no insurance obligation to cover risks caused by natural events.
A draft law included in the Finance Act for 2005 (Article 202 of Law 311, December 30, 2004)confirmed the creation of a voluntary insurance scheme to cover buildings alone. The govern-ment undertook to set up a fund of EUR50 million, to be managed by Consap S.p.A. in order toset up a new reinsurance company.
This initiative was made in order to create additional capacity in the marketplace and toencourage the sale of more policies covering catastrophic natural events. However, the relevantregulation has not been issued, thus leaving the insurance market in an unregulated state, withcompanies exposed to obvious moral hazards.
The reinsurance structures for catastrophe treaties were largely unaltered during 2006renewals, apart from a slight increase of retentions on excess of loss treaties. For expectedlosses with return periods of 250 years (the return period at which clients normally cover theirexposures), the level of cover bought decreased slightly.
Italy
Insurance Availability
2006 Reinsurance MarketPosition
Catastrophe Exposure
EUR0.7828 = USD1.00 @ July 31, 2006
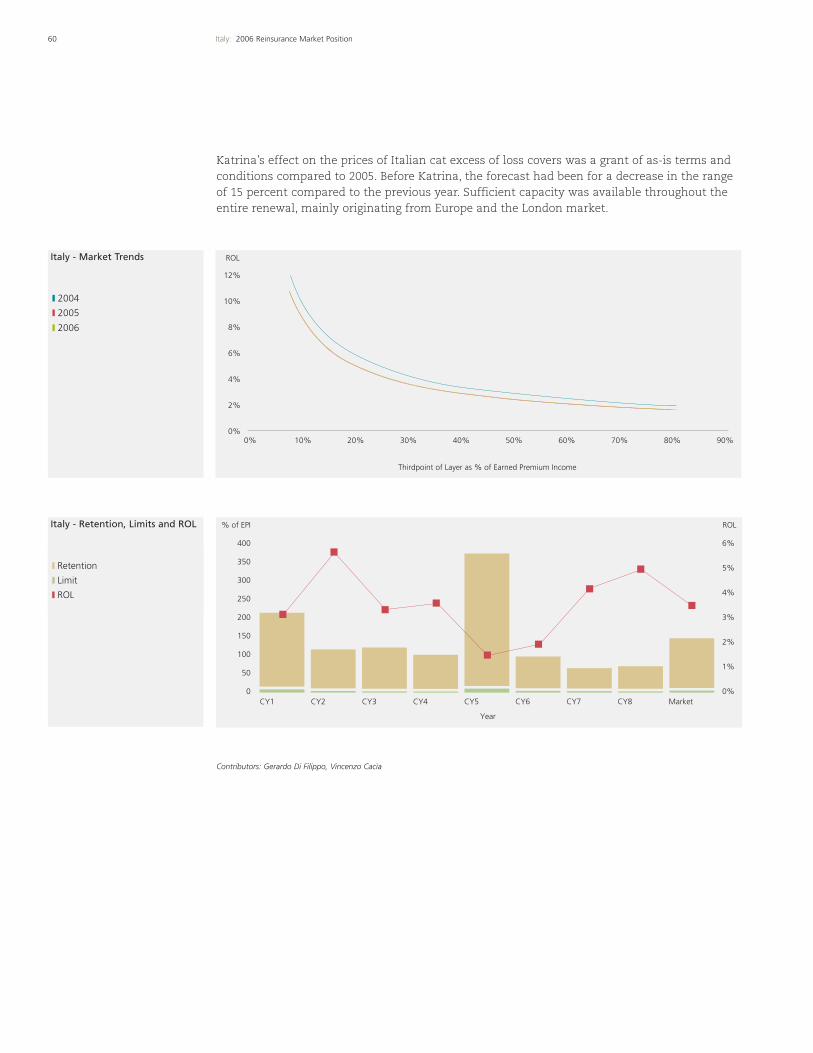
60 Italy: 2006 Reinsurance Market Position
Katrina’s effect on the prices of Italian cat excess of loss covers was a grant of as-is terms andconditions compared to 2005. Before Katrina, the forecast had been for a decrease in the rangeof 15 percent compared to the previous year. Sufficient capacity was available throughout theentire renewal, mainly originating from Europe and the London market.
Contributors: Gerardo Di Filippo, Vincenzo Cacìa
ROL
0%
2%
4%
6%
8%
10%
12%
0% 10% 20% 30% 40% 50% 60% 70% 80% 90%
Thirdpoint of Layer as % of Earned Premium Income
0
50
100
150
250
200
350
300
400
0%
2%
1%
3%
4%
5%
6%
% of EPI ROL
Year
CY1 CY4CY3CY2 CY5 CY6 CY7 CY8 Market
Italy - Market Trends
Italy - Retention, Limits and ROL
Retention
ROL
Limit
2004
2005
2006
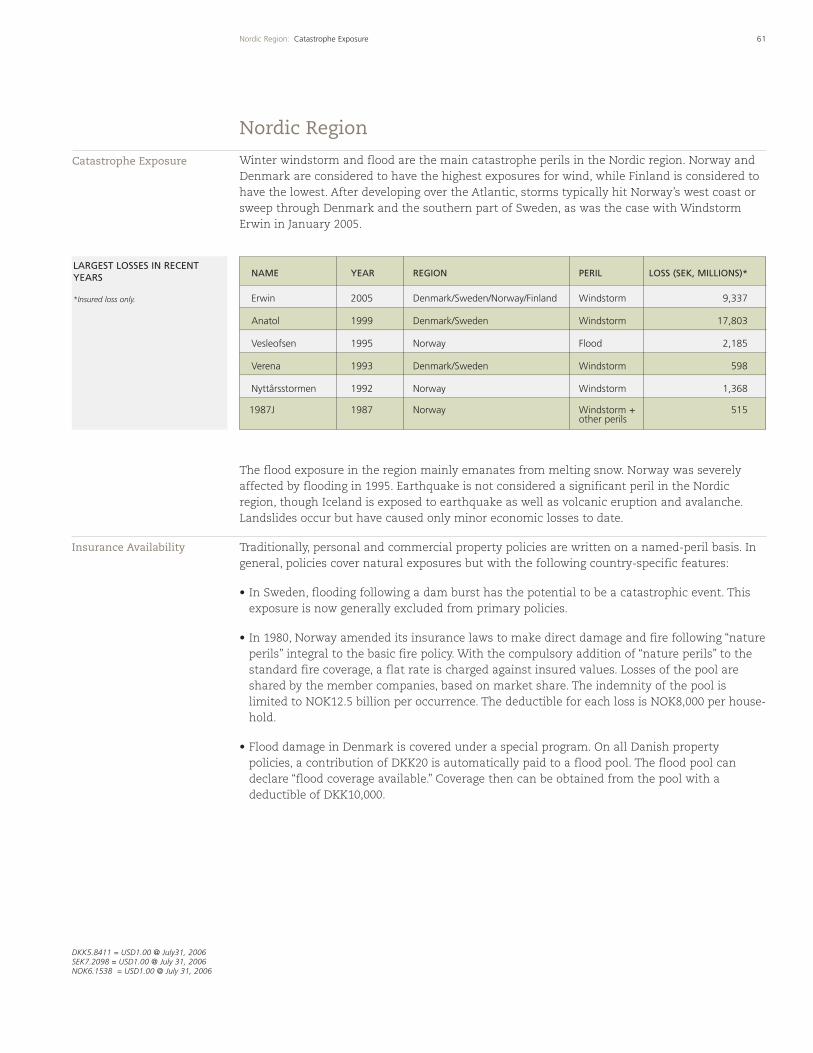
Catastrophe Exposure
61Nordic Region: Catastrophe Exposure
Winter windstorm and flood are the main catastrophe perils in the Nordic region. Norway andDenmark are considered to have the highest exposures for wind, while Finland is considered tohave the lowest. After developing over the Atlantic, storms typically hit Norway’s west coast orsweep through Denmark and the southern part of Sweden, as was the case with WindstormErwin in January 2005.
The flood exposure in the region mainly emanates from melting snow. Norway was severelyaffected by flooding in 1995. Earthquake is not considered a significant peril in the Nordicregion, though Iceland is exposed to earthquake as well as volcanic eruption and avalanche.Landslides occur but have caused only minor economic losses to date.
Traditionally, personal and commercial property policies are written on a named-peril basis. Ingeneral, policies cover natural exposures but with the following country-specific features:
• In Sweden, flooding following a dam burst has the potential to be a catastrophic event. Thisexposure is now generally excluded from primary policies.
• In 1980, Norway amended its insurance laws to make direct damage and fire following “natureperils” integral to the basic fire policy. With the compulsory addition of “nature perils” to thestandard fire coverage, a flat rate is charged against insured values. Losses of the pool areshared by the member companies, based on market share. The indemnity of the pool islimited to NOK12.5 billion per occurrence. The deductible for each loss is NOK8,000 per house-hold.
• Flood damage in Denmark is covered under a special program. On all Danish propertypolicies, a contribution of DKK20 is automatically paid to a flood pool. The flood pool candeclare “flood coverage available.” Coverage then can be obtained from the pool with adeductible of DKK10,000.
Nordic Region
NAME YEAR REGION PERIL LOSS (SEK, MILLIONS)*
Erwin 2005 Denmark/Sweden/Norway/Finland Windstorm 9,337
Anatol 1999 Denmark/Sweden Windstorm 17,803
Vesleofsen 1995 Norway Flood 2,185
Verena 1993 Denmark/Sweden Windstorm 598
Nyttårsstormen 1992 Norway Windstorm 1,368
1987J 1987 Norway Windstorm + 515other perils
LARGEST LOSSES IN RECENTYEARS
*Insured loss only.
Insurance Availability
DKK5.8411 = USD1.00 @ July31, 2006SEK7.2098 = USD1.00 @ July 31, 2006NOK6.1538 = USD1.00 @ July 31, 2006
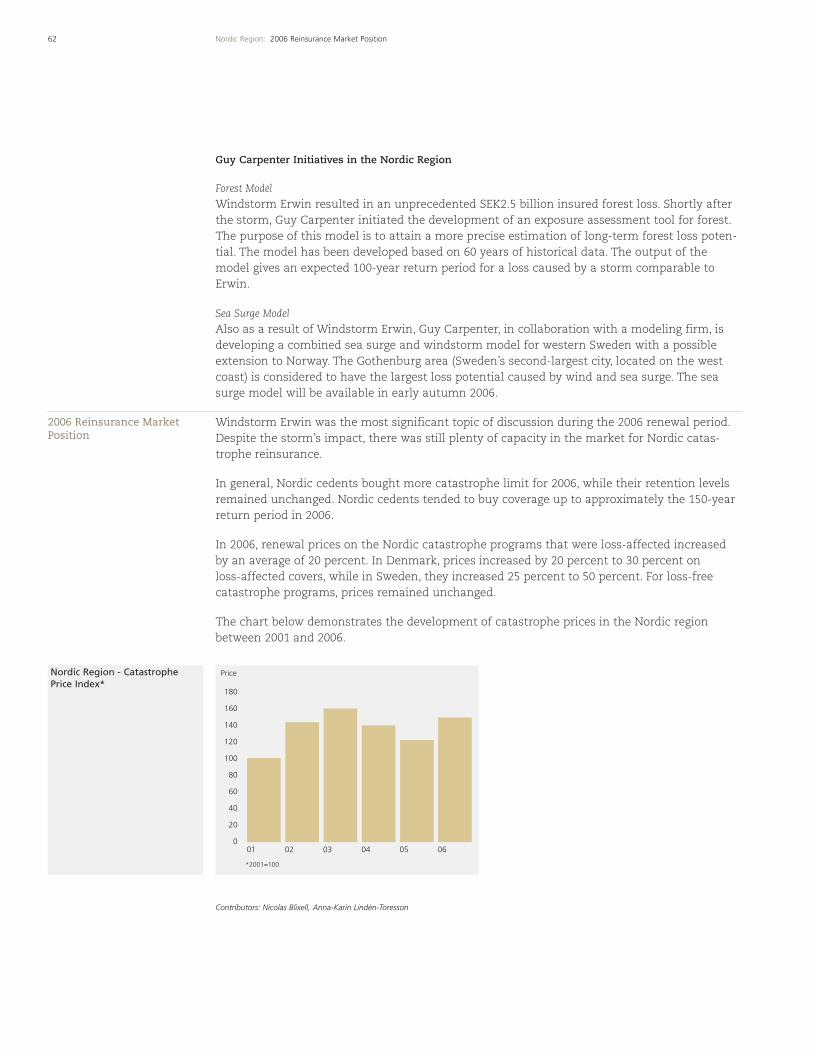
62 Nordic Region: 2006 Reinsurance Market Position
Guy Carpenter Initiatives in the Nordic Region
Forest Model
Windstorm Erwin resulted in an unprecedented SEK2.5 billion insured forest loss. Shortly afterthe storm, Guy Carpenter initiated the development of an exposure assessment tool for forest.The purpose of this model is to attain a more precise estimation of long-term forest loss poten-tial. The model has been developed based on 60 years of historical data. The output of themodel gives an expected 100-year return period for a loss caused by a storm comparable toErwin.
Sea Surge Model
Also as a result of Windstorm Erwin, Guy Carpenter, in collaboration with a modeling firm, isdeveloping a combined sea surge and windstorm model for western Sweden with a possibleextension to Norway. The Gothenburg area (Sweden’s second-largest city, located on the westcoast) is considered to have the largest loss potential caused by wind and sea surge. The seasurge model will be available in early autumn 2006.
Windstorm Erwin was the most significant topic of discussion during the 2006 renewal period.Despite the storm’s impact, there was still plenty of capacity in the market for Nordic catas-trophe reinsurance.
In general, Nordic cedents bought more catastrophe limit for 2006, while their retention levelsremained unchanged. Nordic cedents tended to buy coverage up to approximately the 150-yearreturn period in 2006.
In 2006, renewal prices on the Nordic catastrophe programs that were loss-affected increasedby an average of 20 percent. In Denmark, prices increased by 20 percent to 30 percent onloss-affected covers, while in Sweden, they increased 25 percent to 50 percent. For loss-freecatastrophe programs, prices remained unchanged.
The chart below demonstrates the development of catastrophe prices in the Nordic regionbetween 2001 and 2006.
Contributors: Nicolas Blixell, Anna-Karin Lindén-Toresson
2006 Reinsurance MarketPosition
180
100
140
120
160
60
80
20
40
0
Price
01 02 03 04 05
*2001=100
06
Nordic Region - CatastrophePrice Index*
Catastrophe Exposure
63The Netherlands: Catastrophe Exposure
The most important natural perils affecting the Netherlands are windstorm, hail, flood and,to a lesser extent, earthquake, which only occurs in the southeast part of the country.Unfortunately, manmade catastrophes such as terrorism must also be added to the list ofpotential threats.
Windstorm is still the most significant natural peril, accumulating with other countriesbordering the North Atlantic windstorm area. Despite the country’s exposure, the last majorwindstorm that affected the Netherlands was Windstorm Daria in January 1990. WindstormJeannette, in October 2002, turned out to be a minor event and affected only the first layers ofa few Dutch programs.
None of the windstorms that produced major losses in France, Germany, Scandinavia and otherparts of western Europe over the past five to 10 years have caused any significant damage inthe Netherlands.
Insurance penetration traditionally has been very high in the Netherlands and ranks among thehighest in Europe and the world. The Dutch insurance market, having always been a very liberalmarket, has inspired many foreign companies to start up local initiatives and/or entities. A widevariety of life and non-life products are available and adapted continuously to reflect economicand fiscal developments.
Flood and earthquake have been standard exclusions since 1956. Incidental losses are normallycompensated for by the national government or charity groups. Flood losses affecting motorhull and construction all-risk policies, however, do fall under the existing scope of coverage.
Hail is normally covered under property and motor hull policies, while crop hail exposure iscovered by separate and more specialized insurance products.
With a total population of 16.3 million, the Netherlands has always experienced high insurancepenetration. Premiums related to non-life products totaled EUR23.4 billion (EUR11.8 billionexcluding accident and health) and EUR25.1 billion for life premiums, as of year-end 2004.3
Due to the wide variety of insurers and insurance products in the Netherlands, individualinsurer portfolios can differ widely. The ongoing consolidation of the market, a phenomenon ofthe past five to 10 years, has continued with the merger between Achmea (the Dutch insurancebranch of the Eureko Group) and Interpolis (the insurance arm of Rabobank). Further intentionsto merge have been announced by Univé/VGZ and Delta Lloyd/Agis/Menzis, following theintroduction of basic healthcare coverage for all Dutch citizens as of January 1, 2006.
Nationale-Nederlanden (part of ING Group) will remain the biggest life insurer, while the newAchmea/Interpolis combination most likely will become the largest player in several non-lifeareas.
The Netherlands
Insurance Availability
EUR0.7828 = USD1.00 @ July 31, 2006
3Source: AM Jaarboek 2005.
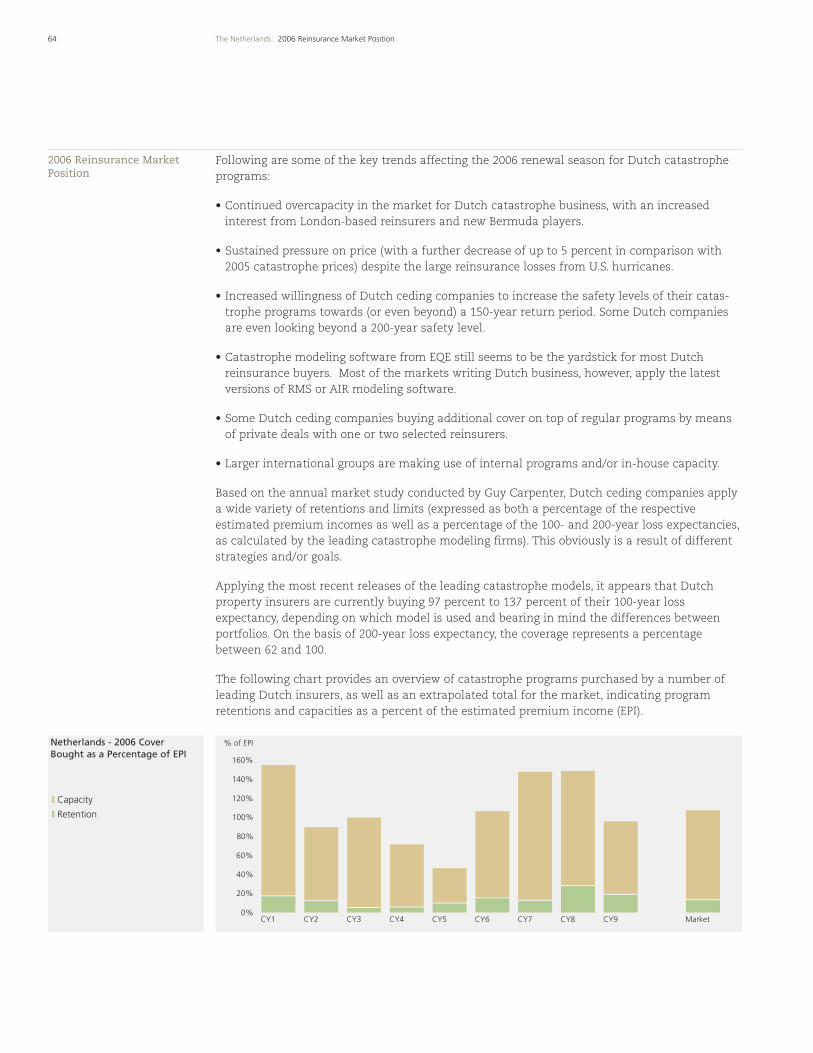
64 The Netherlands: 2006 Reinsurance Market Position
Following are some of the key trends affecting the 2006 renewal season for Dutch catastropheprograms:
• Continued overcapacity in the market for Dutch catastrophe business, with an increasedinterest from London-based reinsurers and new Bermuda players.
• Sustained pressure on price (with a further decrease of up to 5 percent in comparison with2005 catastrophe prices) despite the large reinsurance losses from U.S. hurricanes.
• Increased willingness of Dutch ceding companies to increase the safety levels of their catas-trophe programs towards (or even beyond) a 150-year return period. Some Dutch companiesare even looking beyond a 200-year safety level.
• Catastrophe modeling software from EQE still seems to be the yardstick for most Dutchreinsurance buyers. Most of the markets writing Dutch business, however, apply the latestversions of RMS or AIR modeling software.
• Some Dutch ceding companies buying additional cover on top of regular programs by meansof private deals with one or two selected reinsurers.
• Larger international groups are making use of internal programs and/or in-house capacity.
Based on the annual market study conducted by Guy Carpenter, Dutch ceding companies applya wide variety of retentions and limits (expressed as both a percentage of the respectiveestimated premium incomes as well as a percentage of the 100- and 200-year loss expectancies,as calculated by the leading catastrophe modeling firms). This obviously is a result of differentstrategies and/or goals.
Applying the most recent releases of the leading catastrophe models, it appears that Dutchproperty insurers are currently buying 97 percent to 137 percent of their 100-year lossexpectancy, depending on which model is used and bearing in mind the differences betweenportfolios. On the basis of 200-year loss expectancy, the coverage represents a percentagebetween 62 and 100.
The following chart provides an overview of catastrophe programs purchased by a number ofleading Dutch insurers, as well as an extrapolated total for the market, indicating programretentions and capacities as a percent of the estimated premium income (EPI).
2006 Reinsurance MarketPosition
160%
120%
80%
40%
0%
140%
100%
60%
20%
% of EPI
CY1 CY5CY3CY2 CY6CY4 CY7 CY8 CY9 Market
Netherlands - 2006 CoverBought as a Percentage of EPI
Capacity
Retention
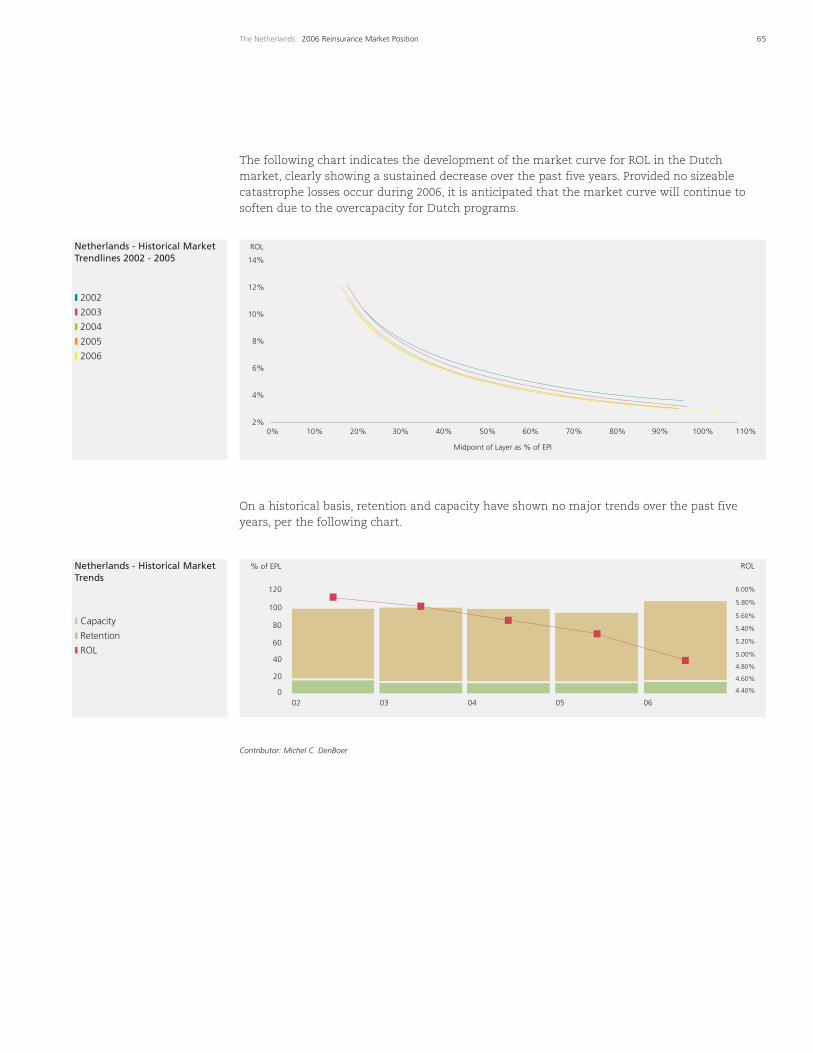
Netherlands - Historical MarketTrends
Netherlands - Historical MarketTrendlines 2002 - 2005
65The Netherlands: 2006 Reinsurance Market Position
The following chart indicates the development of the market curve for ROL in the Dutchmarket, clearly showing a sustained decrease over the past five years. Provided no sizeablecatastrophe losses occur during 2006, it is anticipated that the market curve will continue tosoften due to the overcapacity for Dutch programs.
On a historical basis, retention and capacity have shown no major trends over the past fiveyears, per the following chart.
Contributor: Michel C. DenBoer
2002
2003
2004
2005
2006
ROL
2%
4%
6%
8%
10%
12%
14%
0% 10% 20% 30% 40% 50% 60% 70% 80% 90% 100% 110%
Midpoint of Layer as % of EPI
Capacity
Retention
ROL
ROL
0
20
40
60
80
100
120
02 03 04 05 06
% of EPL
4.40%
4.60%
4.80%
5.00%
5.20%
5.40%
5.60%
5.80%
6.00%
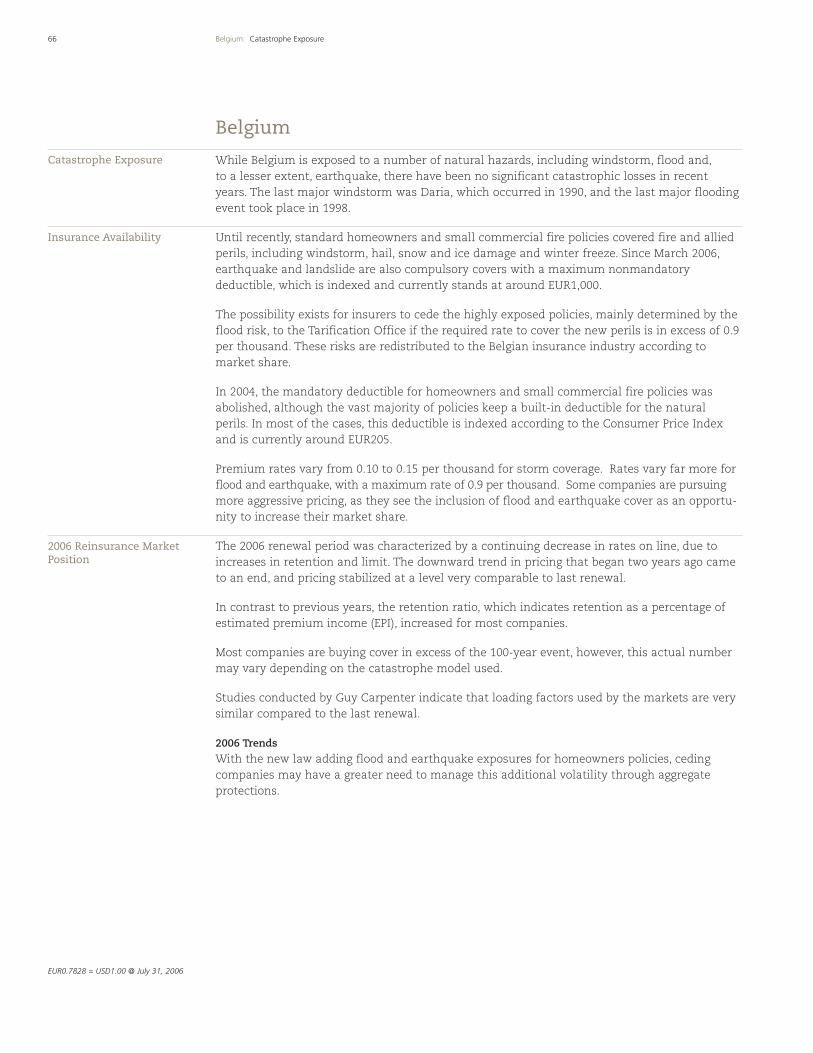
66 Belgium: Catastrophe Exposure
While Belgium is exposed to a number of natural hazards, including windstorm, flood and,to a lesser extent, earthquake, there have been no significant catastrophic losses in recentyears. The last major windstorm was Daria, which occurred in 1990, and the last major floodingevent took place in 1998.
Until recently, standard homeowners and small commercial fire policies covered fire and alliedperils, including windstorm, hail, snow and ice damage and winter freeze. Since March 2006,earthquake and landslide are also compulsory covers with a maximum nonmandatorydeductible, which is indexed and currently stands at around EUR1,000.
The possibility exists for insurers to cede the highly exposed policies, mainly determined by theflood risk, to the Tarification Office if the required rate to cover the new perils is in excess of 0.9per thousand. These risks are redistributed to the Belgian insurance industry according tomarket share.
In 2004, the mandatory deductible for homeowners and small commercial fire policies wasabolished, although the vast majority of policies keep a built-in deductible for the naturalperils. In most of the cases, this deductible is indexed according to the Consumer Price Indexand is currently around EUR205.
Premium rates vary from 0.10 to 0.15 per thousand for storm coverage. Rates vary far more forflood and earthquake, with a maximum rate of 0.9 per thousand. Some companies are pursuingmore aggressive pricing, as they see the inclusion of flood and earthquake cover as an opportu-nity to increase their market share.
The 2006 renewal period was characterized by a continuing decrease in rates on line, due toincreases in retention and limit. The downward trend in pricing that began two years ago cameto an end, and pricing stabilized at a level very comparable to last renewal.
In contrast to previous years, the retention ratio, which indicates retention as a percentage ofestimated premium income (EPI), increased for most companies.
Most companies are buying cover in excess of the 100-year event, however, this actual numbermay vary depending on the catastrophe model used.
Studies conducted by Guy Carpenter indicate that loading factors used by the markets are verysimilar compared to the last renewal.
2006 Trends
With the new law adding flood and earthquake exposures for homeowners policies, cedingcompanies may have a greater need to manage this additional volatility through aggregateprotections.
Belgium
Catastrophe Exposure
Insurance Availability
2006 Reinsurance MarketPosition
EUR0.7828 = USD1.00 @ July 31, 2006
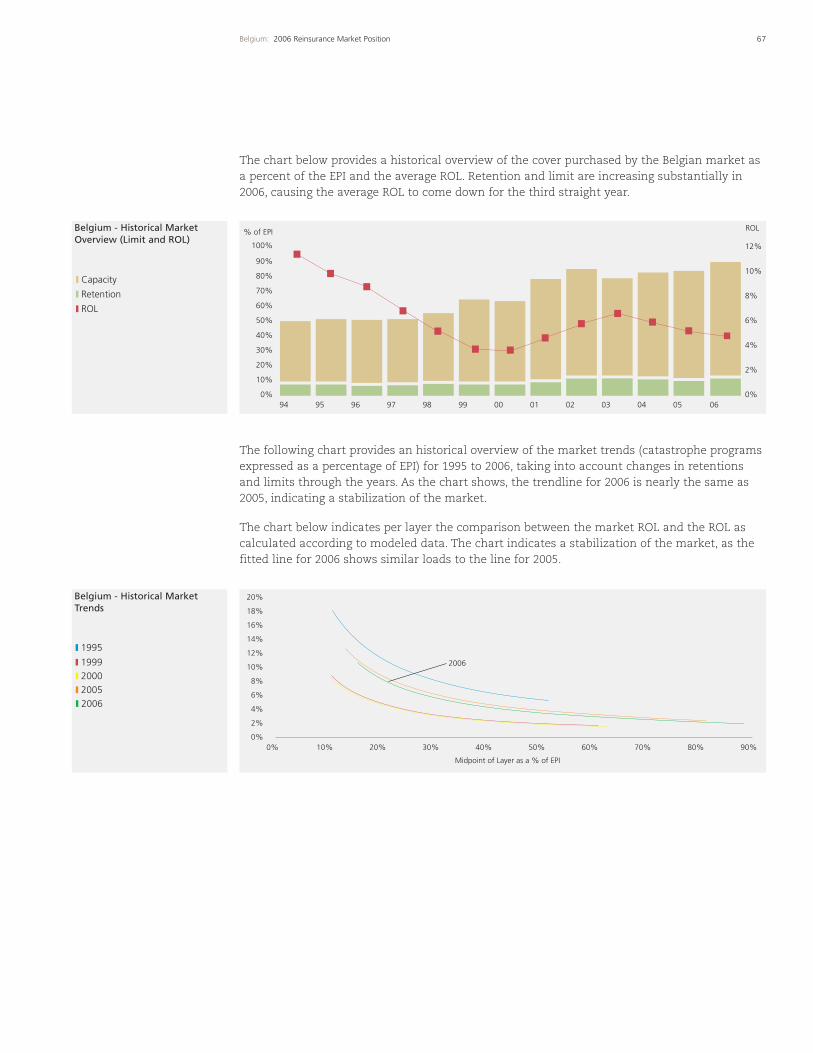
Belgium - Historical MarketTrends
Belgium - Historical MarketOverview (Limit and ROL)
67Belgium: 2006 Reinsurance Market Position
The chart below provides a historical overview of the cover purchased by the Belgian market asa percent of the EPI and the average ROL. Retention and limit are increasing substantially in2006, causing the average ROL to come down for the third straight year.
The following chart provides an historical overview of the market trends (catastrophe programsexpressed as a percentage of EPI) for 1995 to 2006, taking into account changes in retentionsand limits through the years. As the chart shows, the trendline for 2006 is nearly the same as2005, indicating a stabilization of the market.
The chart below indicates per layer the comparison between the market ROL and the ROL ascalculated according to modeled data. The chart indicates a stabilization of the market, as thefitted line for 2006 shows similar loads to the line for 2005.
Capacity
Retention
ROL
0%
30%
20%
50%
10%
40%
60%
70%
80%
100%
90%
0%
4%
2%
8%
6%
10%
12%
% of EPI ROL
94 04030201009998979695 05 06
1995
1999
2005 2000
2006
2006
0%
2%
4%
6%
8%
10%
12%
14%
16%
18%
20%
0% 10% 20% 30% 40% 50% 60% 70% 80% 90%
Midpoint of Layer as a % of EPI
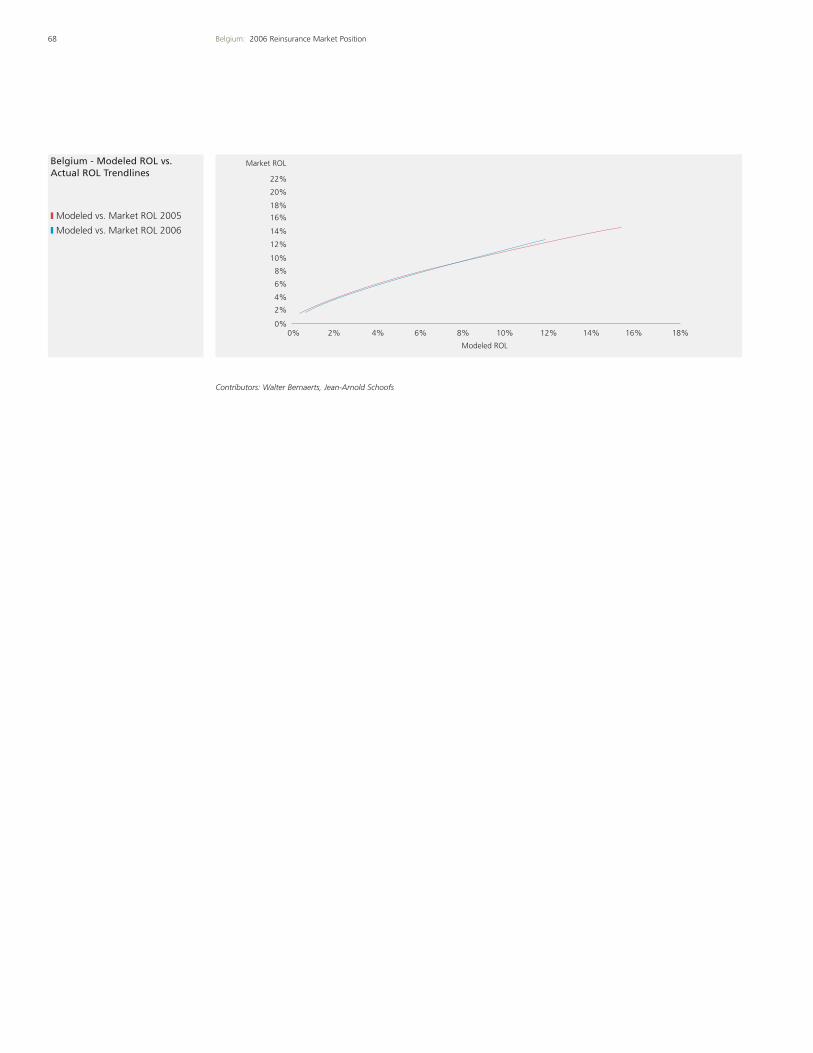
Belgium - Modeled ROL vs.Actual ROL Trendlines
68 Belgium: 2006 Reinsurance Market Position
Contributors: Walter Bernaerts, Jean-Arnold Schoofs
Modeled vs. Market ROL 2005
Modeled vs. Market ROL 2006
10% 12% 14% 16% 18%8%6%4%2%0%
Market ROL
Modeled ROL
0%
2%
4%
6%
8%
10%
12%
14%
16%
18%
20%
22%
69Switzerland: Catastrophe Exposure
Switzerland has a varied natural terrain that produces specific local exposures, such asthunderstorm, hail, avalanche and flooding of smaller local rivers. In addition, the country as awhole is exposed to flood, windstorm and earthquake. Flood and winter storm are generally theexposures with the highest frequency, while a major earthquake has the greatest potential toimpose severe economic loss.
Flood scenarios for the country show a potential 100-year event of about CHF4 billion and aworst-case loss of up to CHF8.5 billion.
Potential economic losses from earthquakes are estimated at approximately CHF80 billion inthe region of Basle, with about CHF45 billion for buildings, CHF15 billion for contents and up toCHF20 billion for business interruption and infrastructure. Other estimates show potentiallosses from buildings and content of more than CHF20 billion for a 500-year event inSwitzerland.
Hailstorms occur often in summer, mainly in areas close to the Alps. While these are normallylocal events, they can cause severe losses, most particularly in agriculture and damage to motorvehicles. In July 2004, a hailstorm over Zurich caused an overall insured loss of CHF140 million.Scenarios show potential losses in motor damage of more than CHF300 million in the region ofZurich.
Over the past 10 years, Switzerland has experienced major floods in 1999, 2000 and 2005, aswell as one major winter storm, Lothar, in 1999. Switzerland experienced its biggest flood loss inhistory when floods in August 2005 caused insured damages of more than CHF2 billion frombuildings, content, business interruption and motor vehicle damage.
Switzerland is divided into 26 cantons. The overall sum insured for buildings in Switzerlandamounts to more than CHF2,000 billion; content cover is about CHF700 billion. In 19 cantons,insurance for buildings is mandatory and provided by monopoly insurers. The cantonalmonopoly insurers cover fire, lightning, explosion, aircraft (FLEXA) and elemental perils only.Elemental perils are defined by law and include flood, storm, hail, avalanche, snow pressure,snowslide, landslide, falling rock and rockslide.
The private insurance industry covers content all over Switzerland and buildings in the non-monopoly cantons. Personal lines insurance covers atmospheric perils and earthquake throughadditional premiums based on a standard policy.
While industrial risks are mainly insured on a named-perils basis, the elemental perils exten-sion (extended coverage) combines storm and the other elemental perils and is generally soldtogether with the standard fire policy. Elemental perils coverage for industrial risks, therefore,has a very high market penetration.
In Switzerland, earthquake is not insured on a mandatory basis. Coverage is available, mainlywith a retention of 10 percent of the sum insured. Nevertheless, only a minority of Swiss house-holds buy earthquake protection. In 2005, the Swiss Insurance Association (SIA) and theInterkantonaler Rückversicherungs-Verband (IRV), an intercantonal pool of the monopolyinsurers, launched a joint initiative to include earthquake under the regular Swiss elementalperils. The intention is to implement a mandatory earthquake insurance solution withappropriate reinsurance protection by January 1, 2008.
Switzerland
Catastrophe Exposure
Insurance Availability
CHF1.2308 = USD1.00 @ July 31, 2006
70 Switzerland: 2006 Reinsurance Market Position
In 18 of the 19 monopoly cantons, earthquake is covered through a fund provided by the IRV.The fund has a total capacity of CHF2 billion. The earthquake coverage provided by themonopoly insurers is voluntary and does not cost any additional premium. One monopolyinsurer, Zurich Cantonal Institute, covers earthquake for buildings in the remaining canton(the capacity is around CHF1 billion). Besides earthquake, the IRV covers its elemental perilsexposure with a stop-loss up to a capacity of CHF550 million.
The private insurance industry pools its elemental perils exposure through the SIA, protectedby a stop-loss cover with a capacity of CHF1.2 billion. In addition, the SIA buys a small earth-quake cover with a capacity of CHF200 million for ex gratia payments in case of a loss.
In 2006, renewals in elemental perils were dominated by the flood losses in August 2005.Reinsurance premiums for SIA’s and IRV’s respective covers increased by around 25 percent;several cat programs of Swiss primary insurers were heavily affected by the floods and sufferedsubstantial price increases. Nevertheless, the structure of the key programs remainedunchanged. In addition to the existing programs, some primary insurers implementedfrequency covers or sublayers for elemental perils. The rates for the Swiss earthquake coversremained relatively stable in 2006.
The floods in 2005 have intensified the discussions on models to analyze Swiss cat exposures.
Only a few catastrophe models are currently available for Switzerland. The existence ofmonopoly insurers and of the elemental perils pool made Switzerland’s requirements for suchservices different from those of other European countries. Increasingly, Swiss insurers areconsidering the development of models, mainly for flood and earthquake.
Between 2002 and 2006, the capacity of the elemental perils stop-loss of IRV increased by25 percent at a premium increase of 40 percent. On the earthquake side, an increase of theretention by 10 percent with stable capacity caused a premium decrease by 20 percent between2002 and 2006.
The private insurance sector shows a similar picture. SIA’s elemental perils pool increasedretention and capacity of its stop-loss by 20 percent at a premium increase of above 30 percentbetween 2002 and 2006. Capacity and premium levels for earthquake have been stable.
Contributors: Hanspeter Hilfiker, Jan Störmann
2006 Reinsurance MarketPosition
71Central and Eastern Europe: Catastrophe Exposure
Central and Eastern Europe represents a very large landmass that normally is defined as thecountries of Albania, Bosnia and Herzegovina, Bulgaria, Croatia, Czech Republic, Estonia,Hungary, Latvia, Lithuania, Montenegro and Macedonia, Poland, Romania, Serbia, Slovakia andSlovenia. Technically, the area includes parts of Russia and other countries in theCommonwealth of Independent States (CIS) up to the Urals.
The territory is exposed to a broad range of natural perils, predominantly flood, earthquake,hail and windstorm. Insurance penetration is still relatively low in the region, and natural perilsare not yet insured in many of the countries. The amount of exposed sums insured, however, isincreasing substantially each year, particularly in those countries that already are members ofthe European Union (Estonia, Latvia, Lithuania, Poland, Czech Republic, Slovakia, Hungary andSlovenia) or are in line for accession on January 1, 2007 (Romania and Bulgaria).
Flood is a significant exposure in the region. It has become a vital issue for the insurance andreinsurance markets following some major flood losses in recent years, such as those experi-enced in Poland, Czech Republic and Slovakia in 1997 and 2002. The 2002 Czech Republicinsured flood loss amounted to nearly USD1.3 billion, more than 95 percent of which was borneby the reinsurance market. This insured loss represented 50 percent of the total economic lossin the country.
There was significant flooding in Romania and Bulgaria in the summer of 2005 and spring of2006, which caused widespread damage and major economic losses to the farming community.However, insurance penetration is negligible in this sector, and no significant insured losseshave been reported. Flood is also an important peril for Hungary, where devastating floodlosses were recorded in 2001 and 2002. However, these did not produce a significant loss for theinsurance industry.
The earthquake peril is increasing in significance in the region as the sums insured continue togrow, particularly in Romania.
Romania is one of Europe’s most seismically active regions, with most of the activity occurringin the Vrancea region, on the eastern side of the Carpathian mountains. The last significantearthquake in the country (in Vrancea in 1977) caused losses in excess of USD2 billion. Acorresponding loss today would be expected to cost about USD10 billion, as Romania isrecording about 20 percent growth in property lines year on year. With this country due to jointhe European Union in 2007, growth in insurance cover may accelerate, resulting in far higherexposure for the earthquake hazard.
Earthquake is also an important peril in Hungary and Slovenia. In the Balkan countries, there isa significant earthquake hazard, but insurance penetration there is still so low that this is notcurrently a problem for the reinsurance market.
The hail peril is important in Slovenia. Insured exposures are not large, but medium-sizedlosses periodically impact the insurance and reinsurance industries.
Windstorm is a recognized natural peril in the Baltic states and Poland, but there have been nosignificant losses to date.
Central and Eastern Europe
Catastrophe Exposure
EUR0.7828 = USD1.00 @ July 31, 2006
72 Central and Eastern Europe: Insurance Availability
Insurance penetration across the region is generally very low compared to western Europe.Average annual spending per capita for the first 15 EU members is EUR2270, and the average forCentral and Eastern European (CEE) countries is approximately EUR125. There is wide variationwithin the region, from EUR766 per capita in Slovenia to EUR38 per capita in Serbia.
In line with the coverage previously afforded to homeowners and commercial/industrial policiesunder the communist state-owned insurance schemes, flood is automatically included amongthe extended coverage perils in a property insurance policy, alongside the basic fire, lightning,explosion and aircraft (FLEXA) perils. For certain classes, such as agricultural buildings inPoland, building insurance (including flood cover) is obligatory, although not enforced. Manyrisks remain uninsured across the region. Public sector, nonprofit entities and infrastructurerisks in Poland are not insured.
In the Czech Republic, which has higher than average spending of around EUR360 per capita,about 40 percent of households buy flood insurance. Since the cover is voluntary, however,increasing adverse selection is expected, despite the highest-risk areas becoming uninsurable.In European terms, the Czech market is exceptionally advanced in its control of floodexposures. Flood aggregates have decreased significantly due to restrictions introduced byinsurers following floods in 2002. There are generally no sublimits for flood for personal linesbusiness, however, sublimits have been introduced for industrial and commercial lines.
In Hungary, where premium per capita is EUR287, earthquake and flood are normally includedunder property policies. There, however, the risk from both perils is perceived to be lower thanin neighboring countries.
In Romania, there continues to be significant growth in insurance business, with 20 percentyear-on-year increases still being normal. While this is from a low base (with premium percapita at EUR55), Romania, with its imminent EU membership, impressive economic progressand soaring property values, represents the leading exposure in the region for insurers – manyof which are now foreign-owned. Earthquake is the main natural peril in Romania, and mostpolicies generally include earthquake cover. In recognition of its severe exposure to naturalhazards, the Romanian government has decided to introduce a compulsory catastropheinsurance scheme for dwellings. The plan is expected to take effect at the beginning of 2007.
In Bulgaria, Serbia and the Balkan countries (with the exception of Slovenia), insurance penetra-tion is among the lowest in the region. Earthquake cover is not included in a typical propertypolicy.
In the Czech Republic, the 2006 renewal season saw no real change in pricing from the previousyear, with an average program rate on line of 4.8 percent. Following large flood losses in 2002 inthis country, catastrophe excess of loss pricing increased significantly at January 2003 renewals,with rates on line moving up from 2.5 percent to 6.5 percent The amount of cover purchasedalso increased substantially because natural perils were excluded from proportional treatiesand companies were obliged to protect these risks under their catastrophe programs. From thisvery high level, prices decreased at both the January 2004 and the January 2005 renewals.
Insurance Availability
2006 Reinsurance MarketPosition
73Central and Eastern Europe: 2006 Reinsurance Market Position
Similarly, at the January 2006 renewals in Poland, there were no significant changes in pricingfor catastrophe programs. Rates decreased by less than 5 percent from the previous year. Theaverage program ROL in Poland is about 3 percent.
Currently, insurers in Romania buy programs representing 4 percent to 5.6 percent of theircountrywide aggregates. The exposure is increasing by about 20 percent each year. Prices at themost recent renewal remained flat, and the average program ROL is about 2 percent.
Catastrophe prices in Hungary also remained flat this renewal, with an average program rate online of just below 4 percent.
Russia and CIS
There is no catastrophe exposure acknowledged in Russia due to very low insurance penetra-tion. Very heavy rainfall has caused flooding in recent years, but this has not generated anysignificant losses. There have been minor losses from wind and hail, mainly for the motorinsurance line. Earthquake is a recognized natural peril in the Ukraine, but again, insurancepenetration is too low to be of any significance to the insurance market.
Contributors: Harry Hatfield, Mary Lyng, Elzbieta Mazaraki-Gawronska, Jane Toothill
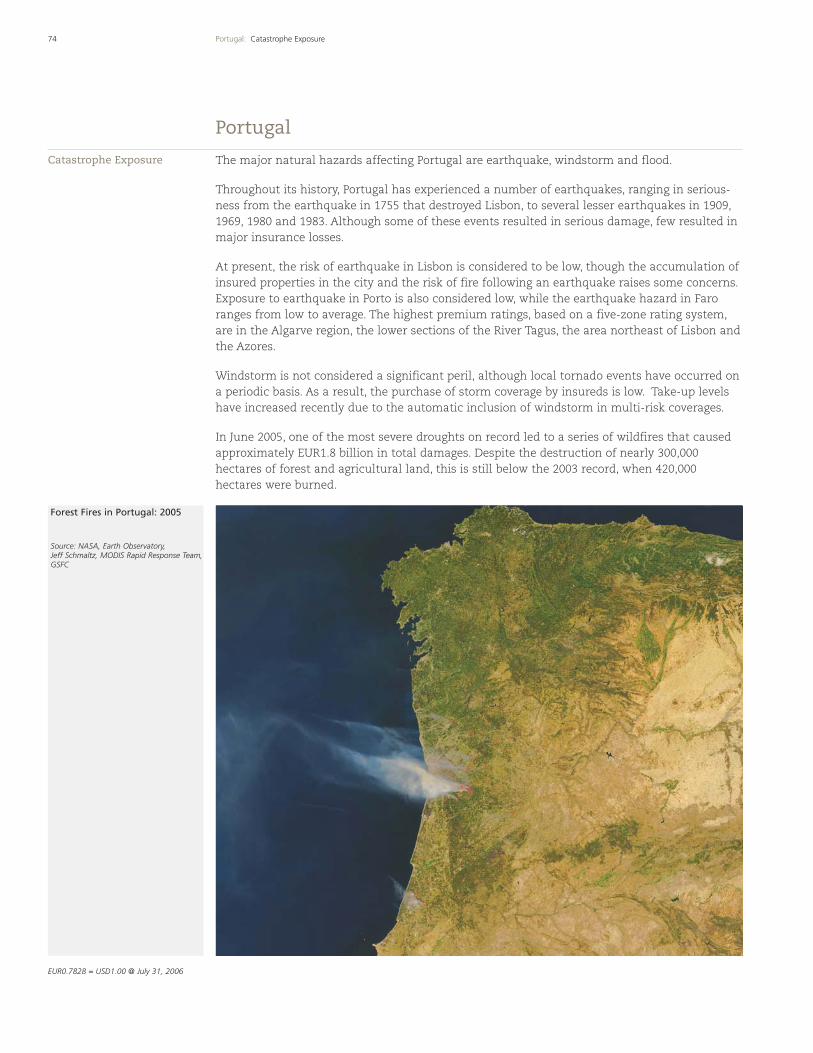
74 Portugal: Catastrophe Exposure
The major natural hazards affecting Portugal are earthquake, windstorm and flood.
Throughout its history, Portugal has experienced a number of earthquakes, ranging in serious-ness from the earthquake in 1755 that destroyed Lisbon, to several lesser earthquakes in 1909,1969, 1980 and 1983. Although some of these events resulted in serious damage, few resulted inmajor insurance losses.
At present, the risk of earthquake in Lisbon is considered to be low, though the accumulation ofinsured properties in the city and the risk of fire following an earthquake raises some concerns.Exposure to earthquake in Porto is also considered low, while the earthquake hazard in Faroranges from low to average. The highest premium ratings, based on a five-zone rating system,are in the Algarve region, the lower sections of the River Tagus, the area northeast of Lisbon andthe Azores.
Windstorm is not considered a significant peril, although local tornado events have occurred ona periodic basis. As a result, the purchase of storm coverage by insureds is low. Take-up levelshave increased recently due to the automatic inclusion of windstorm in multi-risk coverages.
In June 2005, one of the most severe droughts on record led to a series of wildfires that causedapproximately EUR1.8 billion in total damages. Despite the destruction of nearly 300,000hectares of forest and agricultural land, this is still below the 2003 record, when 420,000hectares were burned.
Portugal
Catastrophe Exposure
Forest Fires in Portugal: 2005
Source: NASA, Earth Observatory, Jeff Schmaltz, MODIS Rapid Response Team,GSFC
EUR0.7828 = USD1.00 @ July 31, 2006
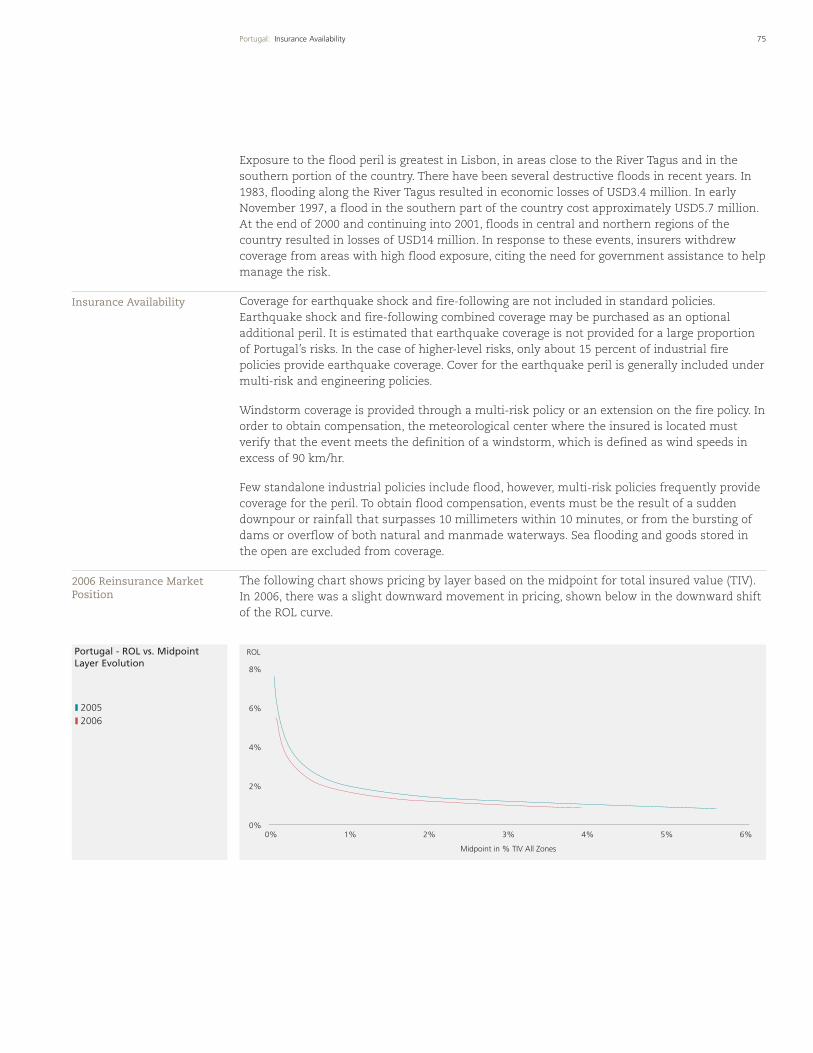
Portugal - ROL vs. Midpoint Layer Evolution
75Portugal: Insurance Availability
Exposure to the flood peril is greatest in Lisbon, in areas close to the River Tagus and in thesouthern portion of the country. There have been several destructive floods in recent years. In1983, flooding along the River Tagus resulted in economic losses of USD3.4 million. In earlyNovember 1997, a flood in the southern part of the country cost approximately USD5.7 million.At the end of 2000 and continuing into 2001, floods in central and northern regions of thecountry resulted in losses of USD14 million. In response to these events, insurers withdrewcoverage from areas with high flood exposure, citing the need for government assistance to helpmanage the risk.
Coverage for earthquake shock and fire-following are not included in standard policies.Earthquake shock and fire-following combined coverage may be purchased as an optionaladditional peril. It is estimated that earthquake coverage is not provided for a large proportionof Portugal’s risks. In the case of higher-level risks, only about 15 percent of industrial firepolicies provide earthquake coverage. Cover for the earthquake peril is generally included undermulti-risk and engineering policies.
Windstorm coverage is provided through a multi-risk policy or an extension on the fire policy. Inorder to obtain compensation, the meteorological center where the insured is located mustverify that the event meets the definition of a windstorm, which is defined as wind speeds inexcess of 90 km/hr.
Few standalone industrial policies include flood, however, multi-risk policies frequently providecoverage for the peril. To obtain flood compensation, events must be the result of a suddendownpour or rainfall that surpasses 10 millimeters within 10 minutes, or from the bursting ofdams or overflow of both natural and manmade waterways. Sea flooding and goods stored inthe open are excluded from coverage.
The following chart shows pricing by layer based on the midpoint for total insured value (TIV).In 2006, there was a slight downward movement in pricing, shown below in the downward shiftof the ROL curve.
Insurance Availability
2006 Reinsurance MarketPosition
2005 2006
ROL
0%
2%
4%
6%
8%
0% 1% 2% 3% 4% 5% 6%
Midpoint in % TIV All Zones
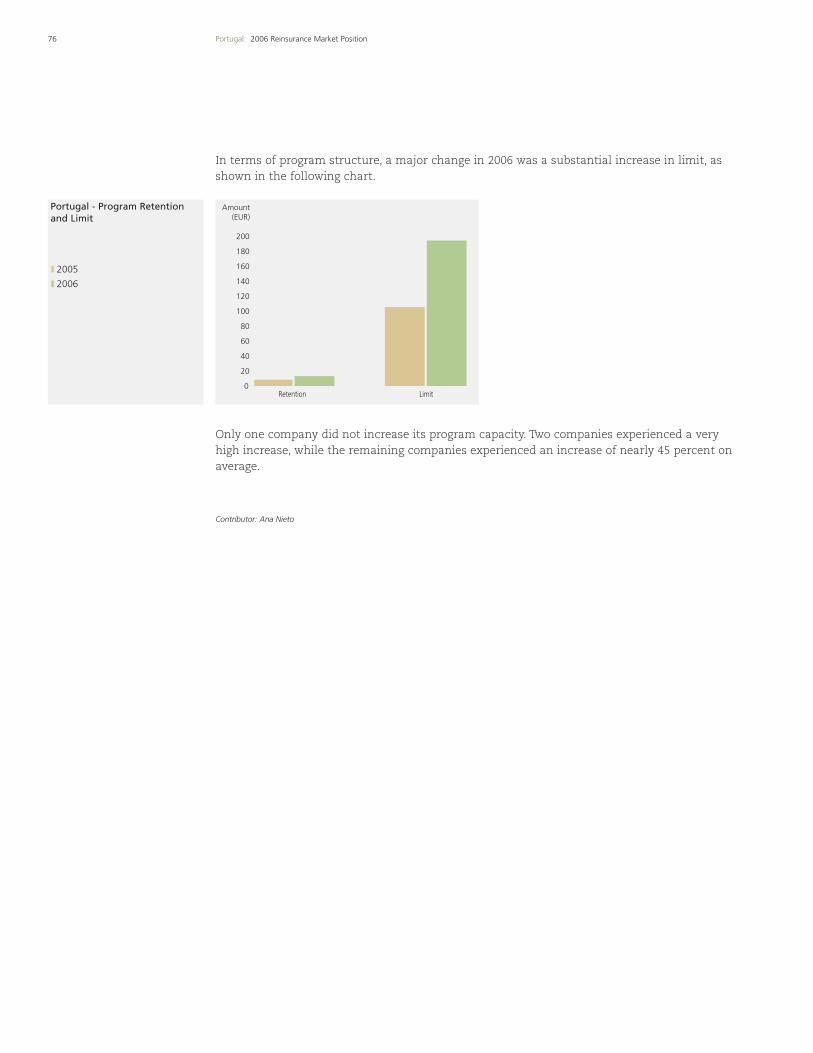
Portugal - Program Retentionand Limit
76 Portugal: 2006 Reinsurance Market Position
In terms of program structure, a major change in 2006 was a substantial increase in limit, asshown in the following chart.
Only one company did not increase its program capacity. Two companies experienced a veryhigh increase, while the remaining companies experienced an increase of nearly 45 percent onaverage.
Contributor: Ana Nieto
2005
2006
Amount(EUR)
200
180
160
100
80
60
40
20
120
140
0LimitRetention
77Turkey: Catastrophe Exposure
The principal catastrophic peril facing Turkey is earthquake, centered on a fault line runningeast to west across the northern part of the country. Technically, the North Anatolian Fault isvery similar to the San Andreas Fault in the United States. The land surfaces are similar, as isthe frequency of earthquakes. The only other catastrophe exposure in the country is localizedstorm and flooding.
Catastrophe Risk Evaluating and Standardizing Target Accumulation (CRESTA) divides Turkeyinto 15 zones. Zones 1 and 3 are of the greatest interest to insurers and reinsurers, as they haveboth exposure to the fault line and substantial insured values. Of these two zones, zone 1 is themore significant and is often used as the adjustable base in reinsurance contracts.
The last major earthquake in Turkey struck Marmara and the surrounding region in 1999,resulting in more than 39,000 deaths and property damage of USD7 billion, of which approxi-mately USD1 billion was insured.
Earthquake coverage is readily available in Turkey. Since 1993, it has been subject to a govern-ment-imposed tariff, which includes a provision for maximum coverage at 80 percent (i.e.,20 percent co-insurance) and a policy deductible calculated as a percentage of the sum insured.Generally, this deductible has been set at 5 percent, although in recent years we have seenvarious options available from the insurance market ranging from 2 percent to 10 percent, withthe appropriate differentiation in rating.
Following the 1999 earthquake, the Turkish government, with the cooperation of the WorldBank, issued a law establishing a compulsory earthquake insurance scheme administered bythe Turkish Catastrophe Insurance Pool (TCIP). The law requires coverage for private residencesfalling within the scope of the legislation. The pool provides coverage up to a fixed limit ofearthquake cover on buildings for all registered habitations, excluding rural areas and unautho-rized construction after December 27, 1999.
Although the draft law has yet to be passed into final legislation, a large number of peoplealready have taken up the TCIP insurance policy, with approximately 2.6 million policies issuedto date. TCIP has just undergone its first year under the new management of Garanti Sigorta,who has an initial mandate for five years. Garanti has adopted an aggressive strategy to expandthe number of policies sold, especially outside the three main CRESTA zones. They have createda new department to deal exclusively with the program and have invested in nationaladvertising to raise the public awareness.
A substantial excess of loss reinsurance program is placed in the international market tosupport TCIP. Original policies are retailed through the local insurance companies and agents,as authorized by the TCIP.
In 2005, we saw the acceleration of a trend that began a couple of years ago, whereby more andmore foreign companies have been acquiring state and privately owned companies withinTurkey. This year, Basak Sigorta was bought out by Groupama, and Isvicre Sigorta and IhlasSigorta are likely to follow suit. This in turn has increased the level of competition between rivalcompanies.
Turkey
Insurance Availability
Catastrophe Exposure
TRY1.4976 = USD1.00 @ July 31, 2006
78 Turkey: 2006 Reinsurance Market Position
Turkish reinsurance pricing saw a substantial increase in the aftermath of the 1999 earthquake,although most reinsurers saw payback of their losses within a two-year period. Competition forpremium income and a consensus that the increase in rating by reinsurers had created anattractive margin led to rate reductions in 2004, 2005 and 2006. The TCIP reinsurance program,which renews November 1, is usually seen as a key indicator for rating movements at January 1renewals, and this was certainly the case in late 2004 ahead of the 2005 season.
For 2006 renewals, the TCIP program saw 8 percent to 10 percent increases, indicating thatprices may begin to rise in Turkey. However, competition has remained fierce this year, andmany reinsurers, buoyed by the TCIP indicators, were later dismayed to see that prices in all ofthe catastrophe excess of loss programs continued to decrease at rates that reached 20 percentto 25 percent. Although many reinsurers consequently walked away, the programs were easilyplaced.
Milli Re, Turkey’s state reinsurer, has been awarded a security rating of B+ by A.M. Best, withwhich the company is hoping to expand its international portfolio of business.
Contributor: Emre Aktas
2006 Reinsurance MarketPosition
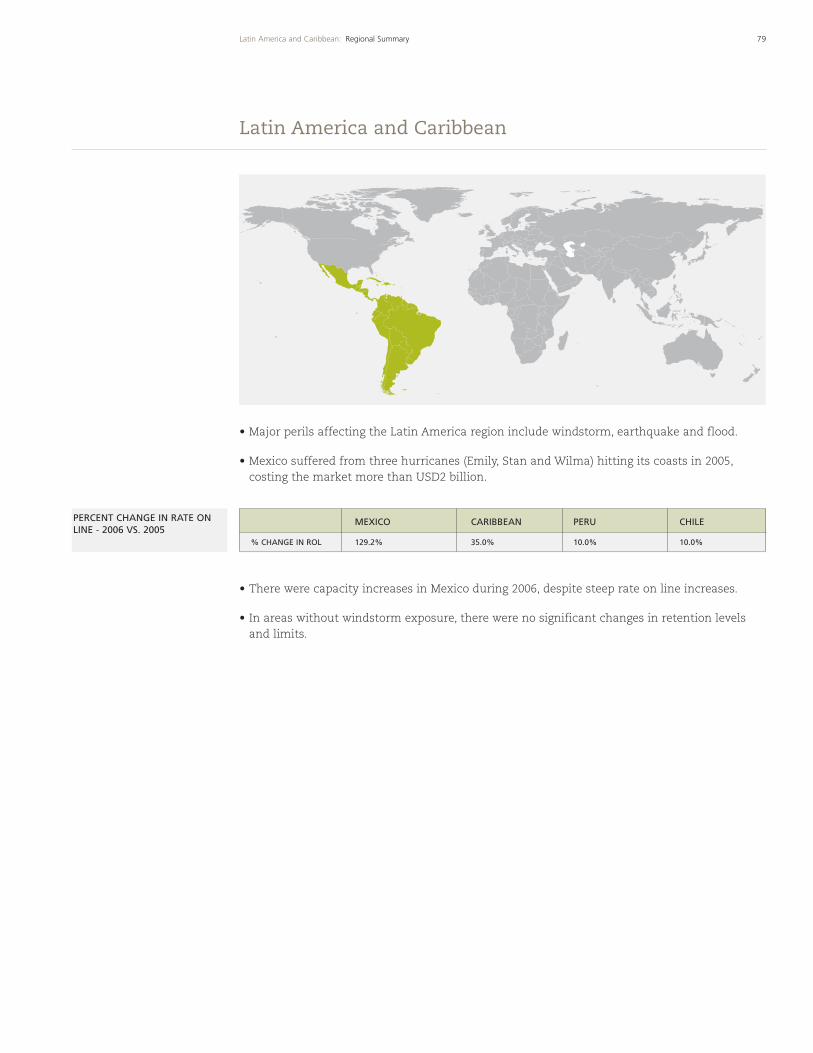
• Major perils affecting the Latin America region include windstorm, earthquake and flood.
• Mexico suffered from three hurricanes (Emily, Stan and Wilma) hitting its coasts in 2005,costing the market more than USD2 billion.
• There were capacity increases in Mexico during 2006, despite steep rate on line increases.
• In areas without windstorm exposure, there were no significant changes in retention levelsand limits.
79Latin America and Caribbean: Regional Summary
Latin America and Caribbean
MEXICO CARIBBEAN PERU CHILE
% CHANGE IN ROL 129.2% 35.0% 10.0% 10.0%
PERCENT CHANGE IN RATE ONLINE - 2006 VS. 2005
80 Mexico: Catastrophe Exposure
Mexico is exposed to a number of natural hazards, including windstorm, earthquake, volcaniceruption, drought and flooding.
The country has an exceptionally high level of seismic activity and is estimated to experiencetremors on a daily basis. The source of this widespread instability is the Cocos Plate, whichmoves slowly beneath the Caribbean Plate in the southern half of the country and interactswith the North American Plate in the north. One of the largest earthquakes in Mexican historydevastated central Mexico on September 19, 1985, killing over 9,500 people in Mexico City. Themagnitude 8.1 event was followed by aftershocks that lasted for hours. Economic losses totaledUSD4 billion, and insured losses were USD400 million.
Mexico’s vulnerability to windstorm is concentrated along its coastlines, due to hurricanesarising from the Caribbean Sea and the Pacific Ocean. The areas most affected by windstormsinclude the Gulf of Mexico and the Caribbean – in particular, the Yucatan Peninsula and thestate of Tamaulipas, as well as areas north of Acapulco along the Pacific coast. Significantrecent windstorms include Hurricane Pauline in October 1997, which caused USD40 million ininsured damage, and Hurricane Gilbert in September 1988, which resulted in losses of USD150million, many of which were uninsured.
Flood is usually associated with wind-driven rains and occurs primarily in the northern part ofthe country, as well as in the coastal areas that are affected by hurricanes. Floods along theGulf Coast in October 1999 impacted nine states and resulted in economic damage thatexceeded USD234 million.
Coverage for the earthquake risk is available under simple-risks policies, under which earth-quakes may be included or excluded. Rates for earthquake are set between 0.48 per thousandfor the northern part of the country, where risk exposure is relatively low, and 0.90 perthousand for Mexico City, where the risk exposure is much greater. Deductibles are estimatedto range from 2 percent to 5 percent, with co-insurance ranging between 10 percent and30 percent. Earthquake may be added as part of extended coverage under industrial andcommercial policies.
Most commercial policies offer coverage on an all-risk basis and provide coverage for bothwindstorm and flood. Insurers generally provide coverage through an increase of premiums anddeductibles and rarely refuse coverage altogether. The premium for the hurricane risk is usuallyquoted as part of the overall rate, and deductibles usually represent between 1 percent and2 percent of the insured value affected. In December 2004, all insurance companies in Mexicoagreed to apply a specific tariff for all meteorological risks, including flood. In the past fiveyears, flood has been the biggest cause of catastrophic claims in Mexico.
Although flood is included on an all-risk basis, coverage is contingent on the exclusion ofgrowing crops, drains, foundations, underground installations and goods in basements. Ratesfor coverage are based on zoning as well as the area within the zone. Rates may be as high as0.80 per thousand in the Yucatan Peninsula and as low as 0.20 per thousand in inland areas.The co-insurance clause is 20 percent. This policy is subject to reductions for underinsurance.The deductible is usually 1 percent of the insured amount affected by the loss.
Mexico
Catastrophe Exposure
Insurance Availability
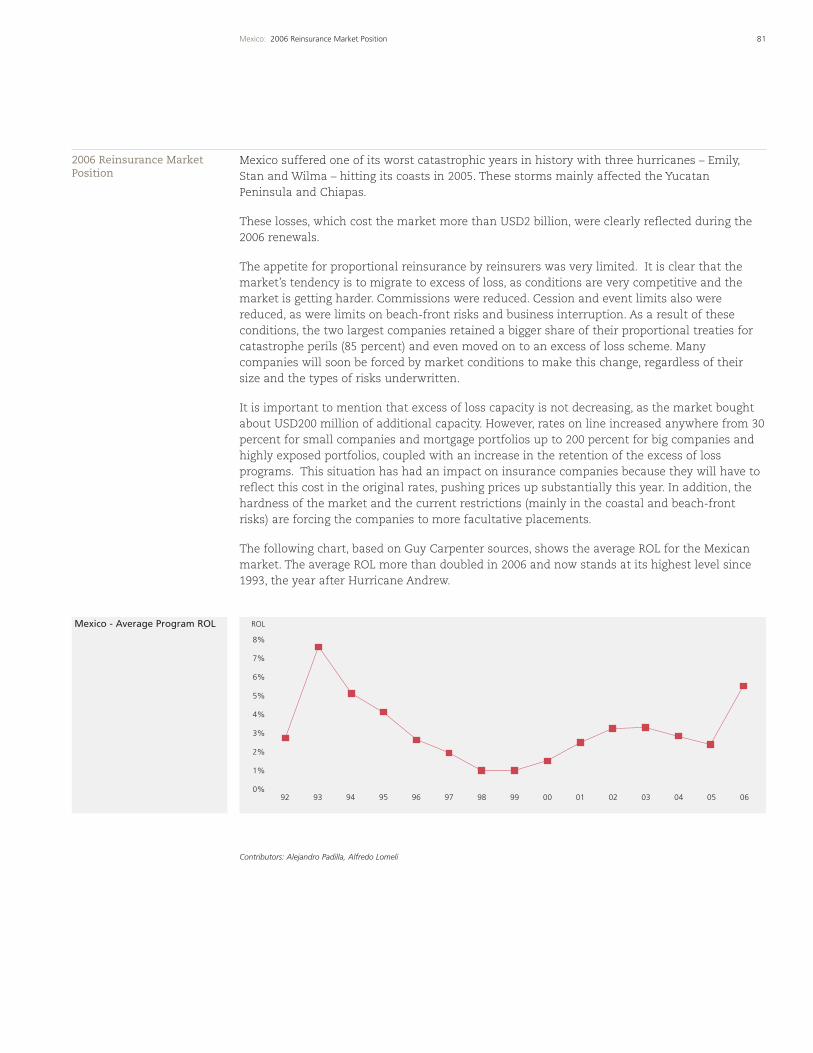
Mexico - Average Program ROL
81Mexico: 2006 Reinsurance Market Position
Mexico suffered one of its worst catastrophic years in history with three hurricanes – Emily,Stan and Wilma – hitting its coasts in 2005. These storms mainly affected the YucatanPeninsula and Chiapas.
These losses, which cost the market more than USD2 billion, were clearly reflected during the2006 renewals.
The appetite for proportional reinsurance by reinsurers was very limited. It is clear that themarket’s tendency is to migrate to excess of loss, as conditions are very competitive and themarket is getting harder. Commissions were reduced. Cession and event limits also werereduced, as were limits on beach-front risks and business interruption. As a result of theseconditions, the two largest companies retained a bigger share of their proportional treaties forcatastrophe perils (85 percent) and even moved on to an excess of loss scheme. Manycompanies will soon be forced by market conditions to make this change, regardless of theirsize and the types of risks underwritten.
It is important to mention that excess of loss capacity is not decreasing, as the market boughtabout USD200 million of additional capacity. However, rates on line increased anywhere from 30percent for small companies and mortgage portfolios up to 200 percent for big companies andhighly exposed portfolios, coupled with an increase in the retention of the excess of lossprograms. This situation has had an impact on insurance companies because they will have toreflect this cost in the original rates, pushing prices up substantially this year. In addition, thehardness of the market and the current restrictions (mainly in the coastal and beach-frontrisks) are forcing the companies to more facultative placements.
The following chart, based on Guy Carpenter sources, shows the average ROL for the Mexicanmarket. The average ROL more than doubled in 2006 and now stands at its highest level since1993, the year after Hurricane Andrew.
Contributors: Alejandro Padilla, Alfredo Lomeli
2006 Reinsurance MarketPosition
8%
ROL
7%
6%
5%
4%
2%
3%
1%
0%92 93 94 95 96 97 98 99 00 01 02 03 04 05 06
82 Chile: Catastrophe Exposure
Chile is exposed to the major hazards of earthquake and flood. Earthquake is Chile’s primaryexposure. The last major earthquake, a magnitude 7.9 event, hit northern Chile on June 13,2005, killing at least 11 people and injuring 200 more. According to the latest report from theChilean Insurance Association, insurers have paid USD40 million in claims. This figure is verylow compared with the USD141 million insured losses for the earthquake of 1985.
Chile has experienced several destructive floods over the years. The last major flood eventoccurred in June 2002, when storms caused severe damage and insured losses settled forUSD34.4 million.
In the first week of July 2006, central and southern Chile were impacted by a severe storm withdestructive floods. Although there is no official information yet, it is expected that insuredlosses will not have a serious impact on excess of loss programs.
Earthquake cover is provided as part of the extended coverage issued in conjunction with thestandard fire policy. Fire-following earthquake is also covered under the extended coverage.Buildings that do not meet the earthquake code receive no more than 75 percent coverage.The standard fire policy does not cover flood damage, however, coverage for flood damage isprovided in the extended coverage section of the form. In addition, an increasing number ofpolicies are being underwritten on an all-risk basis, which allows flood cover to be granted for alarge percentage of industrial and commercial risks. The rate for flood coverage is usuallycalculated in the overall global rate of a program but may be quoted separately at 5 percent ofthe fire rate. Deductibles are usually not applied to flood risk unless the risk is in a high-expo-sure area.
Consolidation continues to be a factor in the marketplace, with the recent acquisition of Cruzdel Sur, the largest local insurer, by Royal & Sun Alliance (RSA). As a result, the local insurancemarket is mainly dominated by international groups such as RSA, Zurich, AIG, Liberty, Mapfre,Ace and Chubb.
The majority of the programs in Chile renew on June 30. In 2006, excess of loss costs increasedby about 10 percent. The facultative market is not supporting a reduction in property rates. Thisfact, as well as the new higher cost of the excess of loss programs, should push up the originalrates by at least 10 percent for those risks with a good loss record.
Terrorism continues to be covered under pro rata and catastrophe excess of loss treaties forhomeowners, dwelling and small commercial clients. Others are covered facultatively.
Contributor: Hernan Irarrazaval
Chile
Catastrophe Exposure
Insurance Availability
2006 Reinsurance MarketPosition
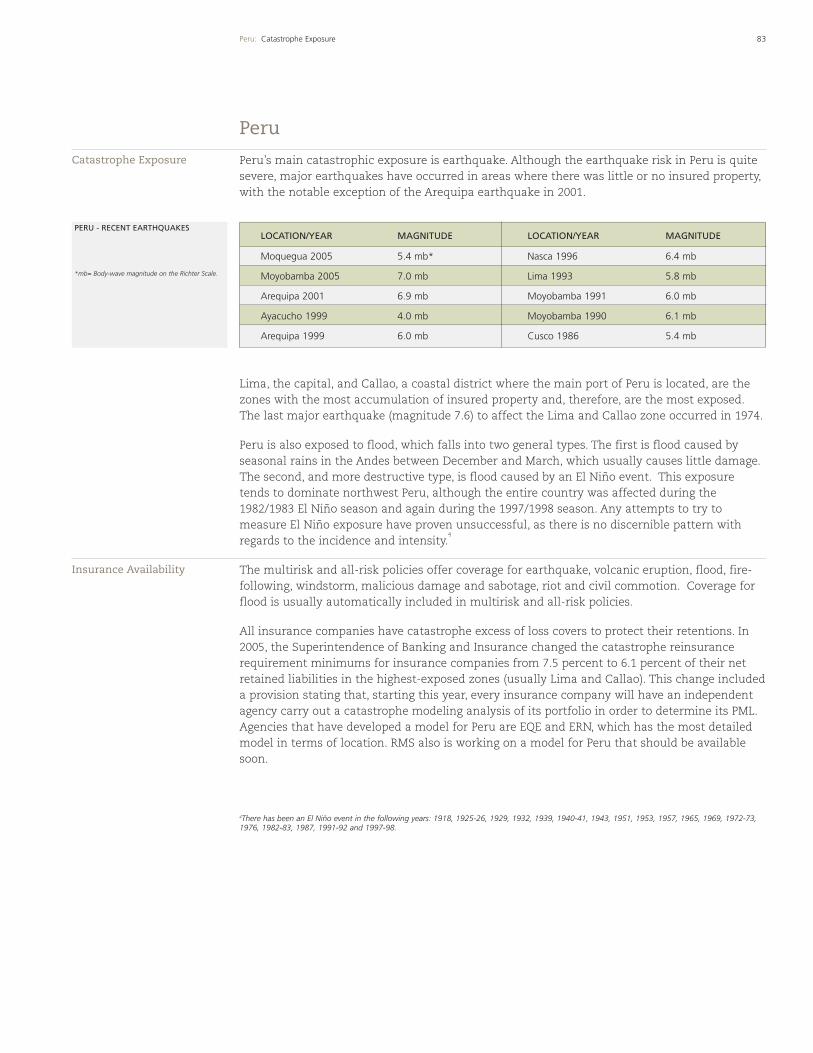
Peru’s main catastrophic exposure is earthquake. Although the earthquake risk in Peru is quitesevere, major earthquakes have occurred in areas where there was little or no insured property,with the notable exception of the Arequipa earthquake in 2001.
Lima, the capital, and Callao, a coastal district where the main port of Peru is located, are thezones with the most accumulation of insured property and, therefore, are the most exposed.The last major earthquake (magnitude 7.6) to affect the Lima and Callao zone occurred in 1974.
Peru is also exposed to flood, which falls into two general types. The first is flood caused byseasonal rains in the Andes between December and March, which usually causes little damage.The second, and more destructive type, is flood caused by an El Niño event. This exposuretends to dominate northwest Peru, although the entire country was affected during the1982/1983 El Niño season and again during the 1997/1998 season. Any attempts to try tomeasure El Niño exposure have proven unsuccessful, as there is no discernible pattern withregards to the incidence and intensity.
4
The multirisk and all-risk policies offer coverage for earthquake, volcanic eruption, flood, fire-following, windstorm, malicious damage and sabotage, riot and civil commotion. Coverage forflood is usually automatically included in multirisk and all-risk policies.
All insurance companies have catastrophe excess of loss covers to protect their retentions. In2005, the Superintendence of Banking and Insurance changed the catastrophe reinsurancerequirement minimums for insurance companies from 7.5 percent to 6.1 percent of their netretained liabilities in the highest-exposed zones (usually Lima and Callao). This change includeda provision stating that, starting this year, every insurance company will have an independentagency carry out a catastrophe modeling analysis of its portfolio in order to determine its PML.Agencies that have developed a model for Peru are EQE and ERN, which has the most detailedmodel in terms of location. RMS also is working on a model for Peru that should be availablesoon.
83Peru: Catastrophe Exposure
Peru
LOCATION/YEAR MAGNITUDE LOCATION/YEAR MAGNITUDE
Moquegua 2005 5.4 mb* Nasca 1996 6.4 mb
Moyobamba 2005 7.0 mb Lima 1993 5.8 mb
Arequipa 2001 6.9 mb Moyobamba 1991 6.0 mb
Ayacucho 1999 4.0 mb Moyobamba 1990 6.1 mb
Arequipa 1999 6.0 mb Cusco 1986 5.4 mb
PERU - RECENT EARTHQUAKES
*mb= Body-wave magnitude on the Richter Scale.
Catastrophe Exposure
Insurance Availability
4There has been an El Niño event in the following years: 1918, 1925-26, 1929, 1932, 1939, 1940-41, 1943, 1951, 1953, 1957, 1965, 1969, 1972-73,1976, 1982-83, 1987, 1991-92 and 1997-98.
84 Peru: 2006 Reinsurance Market Position
As a result of wind-related losses in the United States and Mexico, increased capacity wasshifted by reinsurers to South American markets, which are not greatly affected by the windperil.
Additionally, insurance companies were successful in resisting reinsurers’ attempts to increaserates in response to their heavy hurricane losses in the northern regions. In view of this, rateson line at July 1 renewals increased less than 10 percent on average.
There have been no significant changes in retention levels and limits, and no major losses tothe market have been reported.
The two largest companies are protected on an excess of loss treaty basis. These two companiesaccount for 80 percent of all property premiums. These are among the largest catastropheexcess of loss treaties in Latin America.
Three other companies account for the other 20 percent. These companies have proportionaltreaties and very low retentions covered by small catastrophe programs.
Contributor: Argyros Philippides
2006 Reinsurance MarketPosition
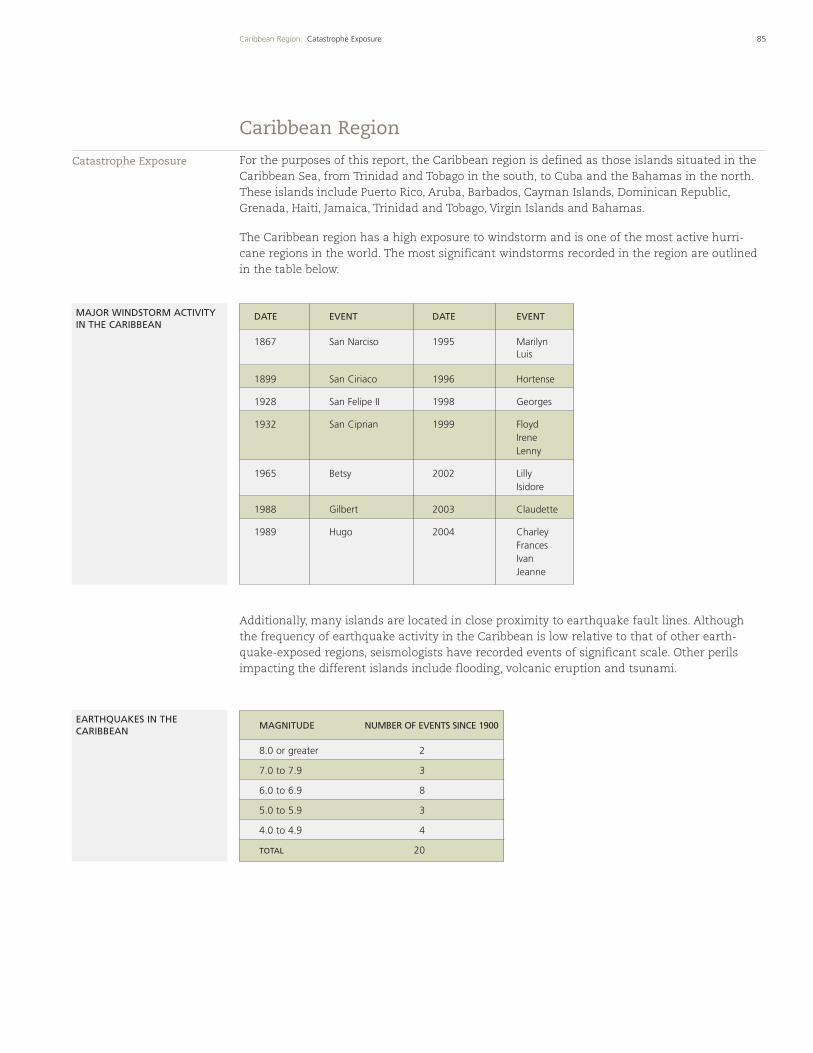
For the purposes of this report, the Caribbean region is defined as those islands situated in theCaribbean Sea, from Trinidad and Tobago in the south, to Cuba and the Bahamas in the north.These islands include Puerto Rico, Aruba, Barbados, Cayman Islands, Dominican Republic,Grenada, Haiti, Jamaica, Trinidad and Tobago, Virgin Islands and Bahamas.
The Caribbean region has a high exposure to windstorm and is one of the most active hurri-cane regions in the world. The most significant windstorms recorded in the region are outlinedin the table below.
Additionally, many islands are located in close proximity to earthquake fault lines. Althoughthe frequency of earthquake activity in the Caribbean is low relative to that of other earth-quake-exposed regions, seismologists have recorded events of significant scale. Other perilsimpacting the different islands include flooding, volcanic eruption and tsunami.
Catastrophe Exposure
85Caribbean Region: Catastrophe Exposure
Caribbean Region
DATE EVENT DATE EVENT
1867 San Narciso 1995 MarilynLuis
1899 San Ciriaco 1996 Hortense
1928 San Felipe II 1998 Georges
1932 San Ciprian 1999 FloydIreneLenny
1965 Betsy 2002 LillyIsidore
1988 Gilbert 2003 Claudette
1989 Hugo 2004 CharleyFrancesIvanJeanne
MAJOR WINDSTORM ACTIVITY IN THE CARIBBEAN
MAGNITUDE NUMBER OF EVENTS SINCE 1900
8.0 or greater 2
7.0 to 7.9 3
6.0 to 6.9 8
5.0 to 5.9 3
4.0 to 4.9 4
TOTAL 20
EARTHQUAKES IN THECARIBBEAN
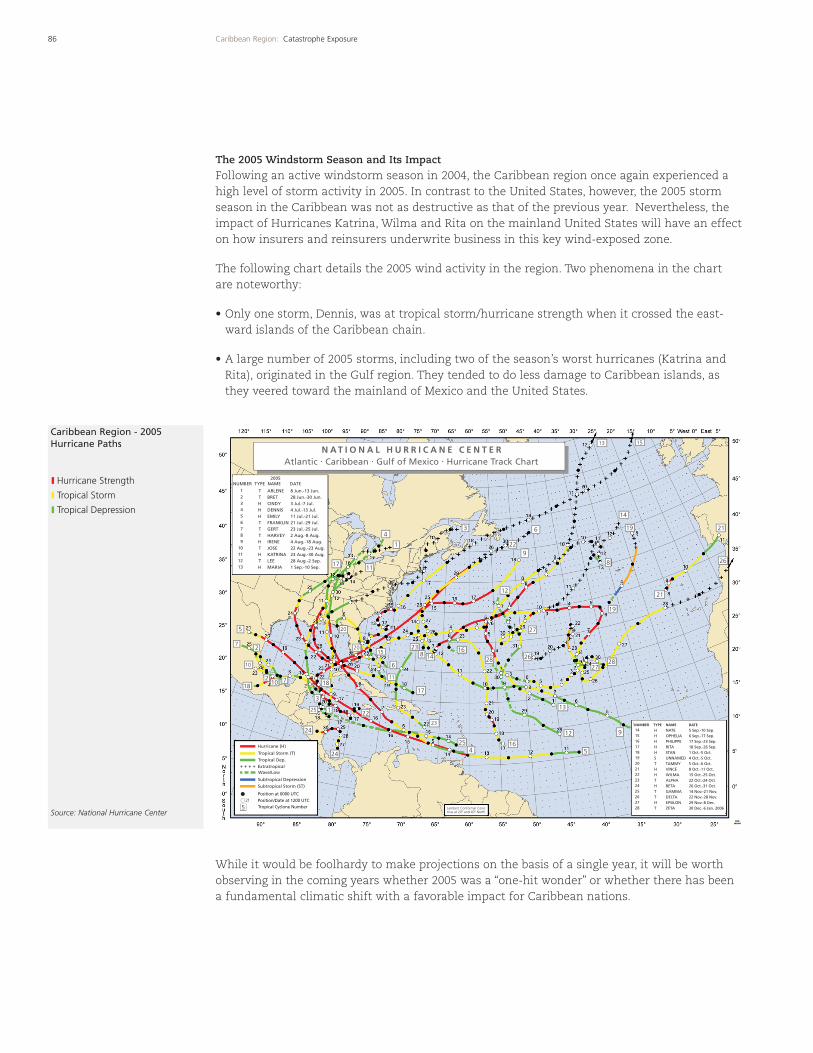
Caribbean Region - 2005Hurricane Paths
Source: National Hurricane Center
86 Caribbean Region: Catastrophe Exposure
The 2005 Windstorm Season and Its Impact
Following an active windstorm season in 2004, the Caribbean region once again experienced ahigh level of storm activity in 2005. In contrast to the United States, however, the 2005 stormseason in the Caribbean was not as destructive as that of the previous year. Nevertheless, theimpact of Hurricanes Katrina, Wilma and Rita on the mainland United States will have an effecton how insurers and reinsurers underwrite business in this key wind-exposed zone.
The following chart details the 2005 wind activity in the region. Two phenomena in the chartare noteworthy:
• Only one storm, Dennis, was at tropical storm/hurricane strength when it crossed the east-ward islands of the Caribbean chain.
• A large number of 2005 storms, including two of the season’s worst hurricanes (Katrina andRita), originated in the Gulf region. They tended to do less damage to Caribbean islands, asthey veered toward the mainland of Mexico and the United States.
While it would be foolhardy to make projections on the basis of a single year, it will be worthobserving in the coming years whether 2005 was a “one-hit wonder” or whether there has beena fundamental climatic shift with a favorable impact for Caribbean nations.
28 26
27
2015
238
6
11
14
17
23
2225 1
24
24
18
10
10 7
3
182
27
5 20
1711
1
4
14
19 21
26
21
8
19
2728
13
12 9
516
9
3
22
6
12
16
425
1513
N A T I O N A L H U R R I C A N E C E N T E RAtlantic . Caribbean . Gulf of Mexico . Hurricane Track Chart
2005NUMBER TYPE NAME DATE
123456789
10111213
TTHHHTTTHTHTH
ARLENEBRETCINDYDENNISEMILYFRANKLINGERTHARVEYIRENEJOSEKATRINALEEMARIA
8 Jun.-13 Jun.28 Jun.-30 Jun.3 Jul.-7 Jul.4 Jul.-13 Jul.11 Jul.-21 Jul.21 Jul.-29 Jul.23 Jul.-25 Jul.2 Aug.-8 Aug.4 Aug.-18 Aug.22 Aug.-23 Aug.23 Aug.-30 Aug.28 Aug.-2 Sep.1 Sep.-10 Sep.
Hurricane (H)
Tropical Storm (T)
Tropical Dep.ExtratropicalWave/Low
Subtropical Depression
Subtropical Storm (ST)
Position at 0000 UTCPosition/Date at 1200 UTC
+ + + +
Tropical Cyclone Number521
NUMBER TYPE NAME DATE
141516171819202122232425262728
HHHHHSTHHTHTTHT
NATEOPHELIAPHILIPPERITASTANUNNAMEDTAMMYVINCEWILMAALPHABETAGAMMADELTAEPSILONZETA
5 Sep.-10 Sep.6 Sep.-17 Sep.17 Sep.-23 Sep.18 Sep.-26 Sep.1 Oct.-5 Oct.4 Oct.-5 Oct.5 Oct.-6 Oct.8 Oct.-11 Oct.15 Oct.-25 Oct.22 Oct.-24 Oct.26 Oct.-31 Oct.14 Nov.-21 Nov.22 Nov.-28 Nov.29 Nov.-8 Dec.30 Dec.-6 Jan. 2006Lambert Conformal Conic
true at 20º and 40º North
Hurricane Strength
Tropical Storm
Tropical Depression
87Caribbean Region: Insurance Availability
In general, property policies offer coverage for fire and allied perils, including windstorm and earth-quake. Because each island is subject to local regulations and customs, different coverages areavailable on different islands. For example, in Puerto Rico, flooding generally is excluded fromcoverage on residential and commercial property policies, while it generally is included on otherislands. Insurers and reinsurers will continue to focus on what coverages are provided, excluded orsublimited.
On many of the Caribbean islands, it can be very difficult to find coverage for certain risks. Coveragefor beachfront exposures has been particularly difficult to secure. Business interruption losscoverage is also under pressure, depending on the location and occupancy of the risk. In both cases,local conditions and pricing may force some policyholders to reduce or forego coverage altogether.
Following the 2004 wind season, there was a scattered tightening of market conditions. In theaftermath of the 2005 wind season, however, there was a broad tightening of conditions. Basically,any wind-exposed territory is subject to significantly increased pricing. Momentum is building forprice increases throughout the region. During the January 2006 renewals, we saw relatively modestprice increases of 10 percent to 15 percent. By April 2006, we had seen pricing increases of 30percent to 40 percent. Additionally, market sources report that some programs actually did not getcomplete placement.
Excess of loss capacity remains abundant throughout the region, albeit at increasing prices. Prorata cover is available, but there are only a limited number of markets actively selling such capacity.Facultative capacity appears to be on the increase, although it can be scarce or exorbitantlyexpensive for highly exposed risks. The new Bermuda markets were relatively active in theCaribbean region and can be expected to grow in influence as they establish more of an overallpresence.
Several key issues will be major focus points for cedents in the region:• Maintaining Proportional Reinsurance Support: Many companies in the region rely on pro rata capacity
to supplement their capital base and reduce the requirement of excess of loss. Maintaining thatpro rata support is critical to their survival. For the most part, companies have been able to main-tain pro rata. However, in some cases, pro rata support has been withdrawn due to change inreinsurer philosophy or capacity. In those cases, companies are having difficulty replacing thatsupport and will need to research alternative solutions.
• Alternative Capital Solutions: There has been some growth in alternative solutions such as catas-trophe bonds. Although pricing remains high relative to traditional reinsurance, a continuedtightening of conditions could lead more companies to explore this alternative.
• Adequate Protection: With an increase in pricing levels, we are seeing an increase in the number ofcompanies that are forced to take the risk of not purchasing adequate protection. In some Julyrenewals, we saw protection levels that were in excess of 100-year loss levels reduced into the75-year to 50-year loss range. Obviously, the impact of this could be significant in the event of loss,especially if there were an increase in insolvencies.
• Modeling and Aggregate Controls: The markets’ reliance on catastrophe modeling continues toincrease, and many reinsurance markets now use multiple models. Some are incorporating modeloutput directly into their underwriting analysis on each individual submission. In many cases, thishas led to changes in the underwriting profit and loss estimates that reinsurers have calculated onsubmissions. In addition, reinsurers have become more attentive to where they choose to applytheir available capacity.
Contributor: David Encinas
Insurance Availability
2006 Reinsurance MarketPosition
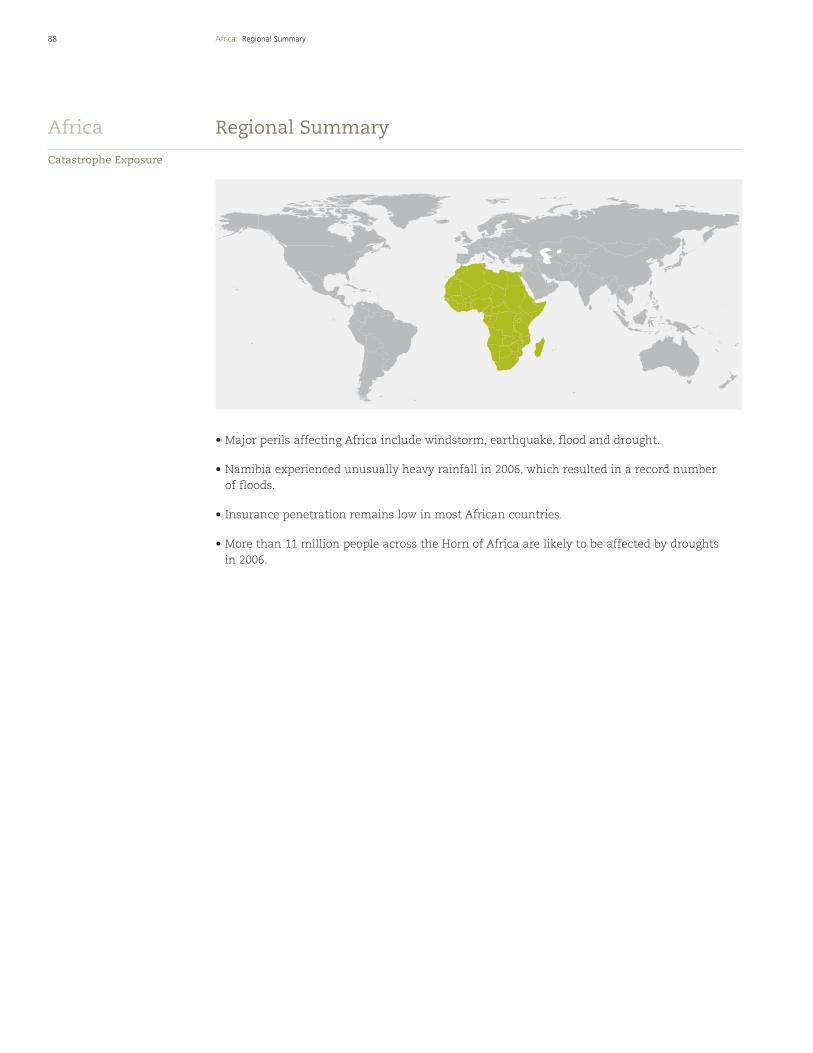
88 Africa: Regional Summary
• Major perils affecting Africa include windstorm, earthquake, flood and drought.
• Namibia experienced unusually heavy rainfall in 2006, which resulted in a record numberof floods.
• Insurance penetration remains low in most African countries.
• More than 11 million people across the Horn of Africa are likely to be affected by droughtsin 2006.
Regional SummaryAfrica
Catastrophe Exposure
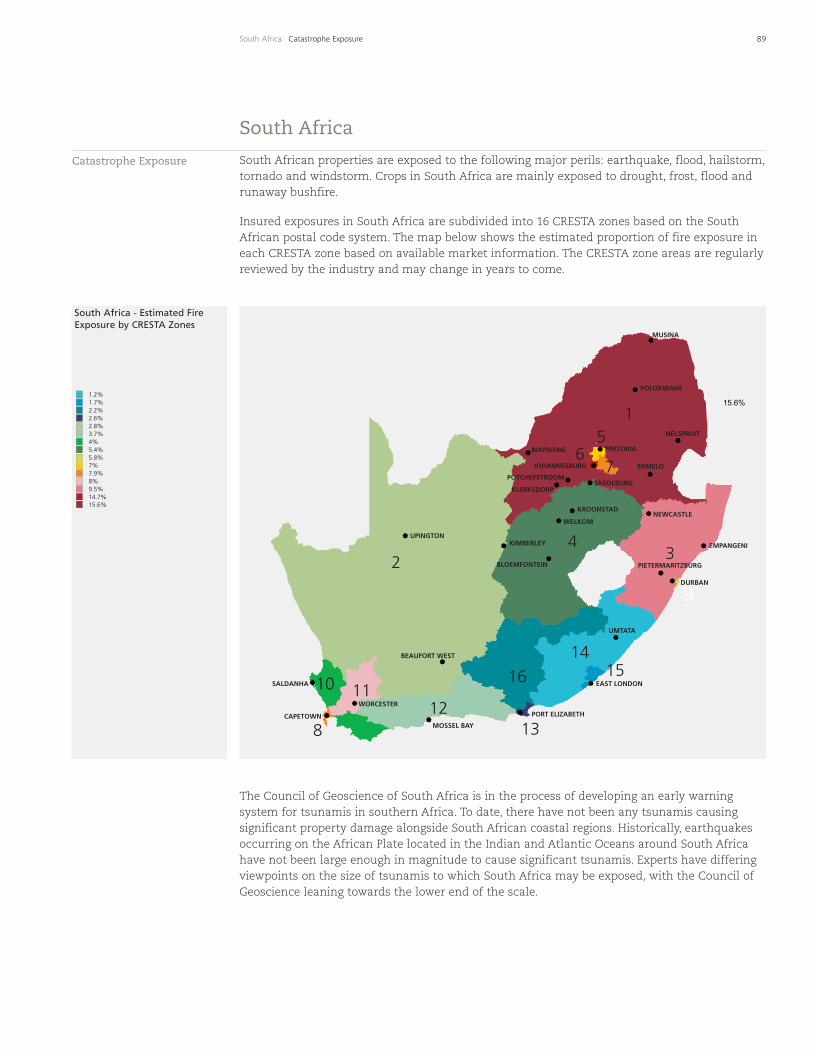
South Africa - Estimated FireExposure by CRESTA Zones
89South Africa: Catastrophe Exposure
South African properties are exposed to the following major perils: earthquake, flood, hailstorm,tornado and windstorm. Crops in South Africa are mainly exposed to drought, frost, flood andrunaway bushfire.
Insured exposures in South Africa are subdivided into 16 CRESTA zones based on the SouthAfrican postal code system. The map below shows the estimated proportion of fire exposure ineach CRESTA zone based on available market information. The CRESTA zone areas are regularlyreviewed by the industry and may change in years to come.
The Council of Geoscience of South Africa is in the process of developing an early warningsystem for tsunamis in southern Africa. To date, there have not been any tsunamis causingsignificant property damage alongside South African coastal regions. Historically, earthquakesoccurring on the African Plate located in the Indian and Atlantic Oceans around South Africahave not been large enough in magnitude to cause significant tsunamis. Experts have differingviewpoints on the size of tsunamis to which South Africa may be exposed, with the Council ofGeoscience leaning towards the lower end of the scale.
South Africa
Catastrophe Exposure
15.6%
2
UPINGTONKIMBERLEY
BLOEMFONTEIN
WELKOM
KLERKSDORP
JOHANNESBURG
MAFIKENG PRETORIA
POTCHEFSTROOM
DURBAN
PIETERMARITZBURG
EMPANGENI
NEWCASTLEKROONSTAD
67
5
SASOLBURG
NELSPRUIT
ERMELO
POLOKWANE
MUSINA
9
34
1
1514
16
1312
1110
8
UMTATA
EAST LONDON
PORT ELIZABETH
BEAUFORT WEST
MOSSEL BAY
SALDANHA
CAPETOWN
WORCESTER
1.2%1.7%2.2%2.6%2.8%3.7%4%5.4%5.8%7%7.9%8%9.5%14.7%15.6%
90 South Africa: Insurance Availability
The most significant earthquake in recent South African history was the Ceres/Tulbagh earth-quake of magnitude 6.3 in 1969. The earthquake was caused by the reactivation of a subsidiaryfault between Ceres and Tulbagh created by heavy erosion. The insured loss was betweenUSD7 million and USD8 million, with uninsured damage estimated at USD24.5 million. If asimilar event were to occur today, the estimated insured loss would be about USD200 million.
The largest event to date in areas with gold mining activity was a magnitude 5.3 earthquake inKlerksdorp in 2005. The current estimated loss to the homeowners market is USD5 million, andlosses to commercial property are unknown at this stage. The Council of Geoscience’s view isthat “ultra deep mining” could result in seismic events of magnitude 5.5.
The biggest economic loss to date in South Africa due to a natural catastrophe was the Natalflood in 1987. The flood was caused by a cut-off low pressure system that produced heavyrainfalls over the whole of KwaZulu-Natal. As a result, 388 people died, 68,000 people were lefthomeless and the total economic loss was estimated at USD250 million. If a similar event wereto occur today, the estimated total economic loss would be approximately USD3 billion.5
Tropical cyclones moving into the Mozambique Channel from the Indian Ocean could result inflooding in the northeastern parts of South Africa. Tropical cyclones normally occur fromNovember to February. The two most severe cyclones to hit South Africa in recent times wereDomoina in January 1984 and Eline in February 2000.
Domoina caused property damage of USD57 million and insured property damage of USD24million. Damage to crops was USD25 million. If a similar event were to occur today, theestimated loss to insured property would be about USD87 million.
Hailstorms tend to produce bigger losses under motor portfolios than building portfolios. Basedon available data, the country’s highest insured hailstorm loss was in Pretoria in 1985. Insuredlosses at the time were USD30 million, and are estimated to be approximately USD240 millionwere a similar event to occur today. The largest proportion of crop insurance premium in SouthAfrica relates to hailstorm damage.
The southern inland parts of KwaZulu-Natal have the highest frequency of tornado events inSouth Africa. The worst tornado in South African history occurred in Roodepoort, located inCRESTA zone 6 in 1948. The tornado destroyed 700 homes, and damage was estimated at USD3million, which would translate into approximately USD450 million for the same event today.
The personal lines insurance market is extremely competitive, and profit margins are low. Anumber of insurers are focusing on increasing their market shares in the small commercialmarket as a result of fierce competition in the personal lines market. Competition on majorcorporate accounts also has increased, resulting in a significant reduction on fire premiumrates.
A general trend among insurers is increased retentions on proportional business, resulting infewer reinsurance cessions. This comes as a result of healthy profits across most classes ofbusiness in recent years and larger capital bases, which need to be allocated efficiently.
Lloyd’s is registered in South Africa and provides significant competition to local insurers,especially in business lines such as casualty, professional indemnity, marine and aviation. Themarine and aviation market remains very competitive on price, and reinsurance tends to beplaced predominantly in London and Europe.
Insurance Availability
5 Estimates of current losses allow for the increased number of properties, the inflation of building costs and the devaluation of the South Africanrand against the U.S. dollar.
91South Africa: 2006 Reinsurance Market Position
Insurers and reinsurers continue to benefit from the lack of major catastrophe events in recentyears. The last significant catastrophe event was the flooding from Cyclone Eline in February2000, which affected the Mpumalanga and the Limpopo provinces but breached only the firstlayers of most companies.
The reinsurance market is represented by Munich Re, Swiss Re, Hannover Re, Africa Re andGenRe. The split between proportional and nonproportional premium income is roughly90 percent and 10 percent, respectively. Standard wordings are mostly used as compiled bySAROA (South African Reinsurance Offices Association).
Personal property insurance is covered under multiperil policies on a monthly basis. It coverslosses arising from fire, lightning, explosion, storm, flood, earthquake, theft and impact.Subsidence, heave and landslip are excluded as standard practice but may be added for anadditional premium charge.
For commercial risks, fire policies are extended to include cover for natural perils. Policies areissued according Multimark III policy wording, which is the market-accepted standard wordingfor all general commercial classes of business in South Africa. Fire-following earthquake iscovered but often is separately specified. There are usually no deductibles other than compositedeductibles under all-risk policies. Mining covers are subject to more stringent terms, and theMultimark III wording excludes damage to property in the underground operations of any mine.
Motor policies cover own damage, third-party property damage and bodily injury to passengers.The Road Accident Fund operated by the government was established to compensate thirdparties for bodily injury claims as a result of motor vehicle and road accidents. Bodily injurycover for passengers is capped. The fund has been depleted by legal costs and some corruption,and as a result, the fund is considering capping its liability at significantly lower levels.Previously, unlimited cover was provided. Should the proposed changes materialize, motoristscan then voluntarily purchase top-up cover from the private sector over and above the coverprovided by the fund. The idea is that insurers will provide this cover through an enhancedpersonal accident product to protect themselves against the exhaustive legal fees entailed inproving/disproving negligence.
The South African Special Risk Insurance Association (SASRIA), the government-backed nicheinsurer, provides cover for material property damage as a result of a strike, riot or terrorist act.Business interruption is not covered and liability is capped per company, including anysubsidiaries. The maximum sum insured per company was recently increased from USD50million to USD73 million, and cover is provided using a coupon-system.
Workers compensation insurance is regulated by the Compensation of Occupational Injury andDiseases Act, 1993. This insurance is obligatory and is run by the state and two authorizedinsurers.
Most insurance companies continue to have proportional treaties and excess of loss covers,and these are largely placed through domestic reinsurance brokers. The number of captivecompanies continues to increase, as the market has not softened sufficiently to slow downgrowth in this area.
2006 Reinsurance MarketPosition
92 South Africa: 2006 Reinsurance Market Position
Insurers still are faced with the problem of insufficient treaty capacity. This has led to anincrease in the demand for facultative covers, resulting in very profitable portfolios of faculta-tive business.
There is still a substantial amount of co-insurance being placed in the market, and often threeor four major companies appear on the schedule. This still poses accumulation problems forreinsurers in the event of a major loss, but there are no restrictions on co-insurance beingceded to treaties on the normal basis. Certain reinsurers, however, restrict the amount ofinward facultative reinsurance business going into proportional treaties. There are no reinsur-ance pools.
Flat commissions on proportional business have been replaced by sliding scale commissions.At the bottom end of the scale, the commission rate often falls below acquisition costs. Onproperty, business insurers pay a regulated 20 percent to the retail/direct broker, and frequentlythe bottom end of the scale falls as low as 15 percent. Reinsurers have also enforced eventlimits on proportional covers, thereby restricting the unlimited lateral cover afforded in thepast.
South African catastrophe covers are still attractive to international reinsurers, as they help todiversify portfolios. Local reinsurers continue to write fairly proportionally across the catas-trophe layers, while London and European markets tend to offer more competitive pricing andmore capacity on the upper layers. One possible reason for this is that the majority of insurancecompanies still opt for relatively low attachment points for catastrophe purposes and often donot buy sufficient cover at the top end. As a result, the average rate on line for South Africanprograms is higher than the global average. The minimum ROL for top catastrophe layersremains around 1 percent.
Reinsurance programs continue to be placed on a combined-risk, estimated maximum losserror and catastrophe excess of loss basis.
The absence of any major catastrophes in recent years means that South African catastrophebusiness continues to be highly profitable for reinsurers.
Contributors: Riaan Botes, Sean Fitzsimmons
93Namibia: Catastrophe Exposure
Namibia has experienced very few losses from major natural hazards. There have been nosignificant earthquakes in the country, even though Windhoek, Namibia’s capital, lies on asmall fault. Windstorms, other than the occasional whirlwind, are rare. While flash floods occurin the rainy season, these are not a major concern, as the resulting losses have been small.
In the first four months of 2006, Namibia experienced unusually heavy rainfall. This resulted ina record number of floods, including floods in Windhoek in January, in Mariental in Februaryand along the coast in April. However, damage was minimal in relation to flooding in othercountries.
Hail is a rare occurrence in Namibia. Along the west coast (Walvis Bay and Swakopmund), nohail has been recorded for the past 100 years. In Windhoek, hail does fall between October andMay, but no major damage to property has been recorded.
An earthquake in the Atlantic could result in damage by tsunami, but historically no largeearthquakes have occurred anywhere near the Namibian coast.
The short-term (non-life) written premium for 2005 was approximately NMD900 million. Thereare a total of 10 short-term insurers in the market and one reinsurer, NamibRe. Though insur-ance in Namibia is being forced to localize as a result of the Insurance Bill of 1998, a fewinsurers still function as subsidiaries of South African companies.
There are no compulsory classes of insurance. Motor third-party bodily injury liability insur-ance is run by a government fund and paid for by means of a levy on gasoline sales.
There are no obligatory tariffs for any class of business, resulting in fierce competition. Mostinsurers battle to write a profitable motor account.
The market is firmly driven by brokers. Apart from agents, there are few other forms of distribu-tion of insurance products.
Cover for political riot is provided by a Special Risks Insurance Association (NASRIA), whichoperates as a nonprofit organization along similar lines to SASRIA in South Africa.
Under current legislation, insurance placed outside the borders of Namibia is not permittedunless cover is not available in the local market. In practice, there are many such risks,principally in the areas of marine, aviation and professional indemnity insurance, which mustbe sent to the Director of Financial Institutions for approval or declinature. Approved cases ofnonadmitted insurance are widespread in view of the lack of capacity or technical expertise incertain areas.
The capacity of the market is small, both gross and net – particularly the latter in view of thelarge amounts of reinsurance placed abroad with either parent companies or professionalreinsurers.
Reinsurers not domiciled in Namibia do not have to be registered to participate in reinsuranceof Namibian risks. However, companies cannot place reinsurance beyond Namibia’s borderswithout the express permission of the Registrar of Insurance.
Namibia
Catastrophe Exposure
Insurance Availability
2006 Reinsurance MarketPosition
94 Namibia: 2006 Reinsurance Market Position
With the National Reinsurance Bill passed in 1998, the state revealed its intention to nationalizepart of the insurance industry. An agreement was reached whereby 20 percent of all reinsur-ance treaties would be offered to NamibRe as of the next renewal date, and they would havethe right of first refusal on all facultative reinsurance.
There is still widespread use of proportional treaties. However, Namibian treaties have eventlimits restricting the unlimited lateral cover afforded in the past.
Rates for catastrophe programs have remained constant due to the lack of major events.However, there have been increases in recent years due to global pressure on catastrophe rates.
Contributor: Renate Scriba
95
The basic outlook for renewals at January 1, 2007, is rate stability. In general, rate on line isexpected to be flat to slightly down for most countries.
We can expect to see the continuation of a difficult market for the coastline that is exposed toNorth Atlantic storms, from Mexico to Maine. However, some rates are likely to decline fromtheir current stratospheric levels.
What if there is a catastrophe in the second half of 2006? History has shown that the latterhalf of the year can be very active for catastrophes, both manmade and natural. For instance, inthe fall of 2005, we experienced three major hurricanes in the United States that left nearlyUSD55 billion in insured losses. In December 2004, the Indian Ocean tsunami hit the coasts ofIndonesia and Thailand, as well as nine other countries. The tsunami left in its wake thousandof deaths and insured losses of USD5 billion. Furthermore, in July, August and September of2002, Europe experienced insured losses totaling USD4.1 billion from major floods in severalcountries. Finally, the list would not be complete without including the devastating terroristevents of September 11, 2001. In fact, of the top 40 most costly insured losses, nearly 80 percenthave occurred in the last six months of the given year.
In this context, it is helpful to distinguish between event types. On the one hand, there areunexpected mega-catastrophes such as Hurricane Katrina and the terrorist events of September11, 2001. On the other hand, there are the regular, more normal and less severe events thatoccur practically every year. If such regular events persist this season, there will be no changein the projections. A localized impact can be expected, but it is unlikely to have significantramifications beyond the affected area.
If there is another exceptional catastrophe, the marketplace is apt to see, at a minimum, abreakdown in cover for that particular subject exposure. This was seen following the destruc-tion of the World Trade Center on September 11, 2001, when reinsurers shied away fromterrorism risks in the years following the event.
Hopefully, we will experience a return to a more normal occurrence of catastrophes in the latterhalf of 2006. After two tumultuous years, a stable, boring season might be just what theindustry needs.
The Last Word
The Last Word
96 Appendix A: Government Catastrophe Programs for Natural Hazards
Government plays a prominent role in many areas of disaster management. In addition to disaster relief and mitigation issues (e.g., updated building codes), some governments have specific insurance programs in place for funding losses from natural catastrophes. Governmentcatastrophe programs are reviewed in the country-specific sections of this report. It is helpful,however, to review the programs based on a common list of criteria, ranging from perils coveredto coverage triggers. The tables on the following pages review major catastrophe programs inthis fashion. A review of the information indicates that the various programs differ widelyunder most of the categories. Government programs reflect the underlying exposures and thesocial milieu of each country, which in turn show a wide variety across the globe.
Appendix A
Government CatastrophePrograms for Natural Hazards
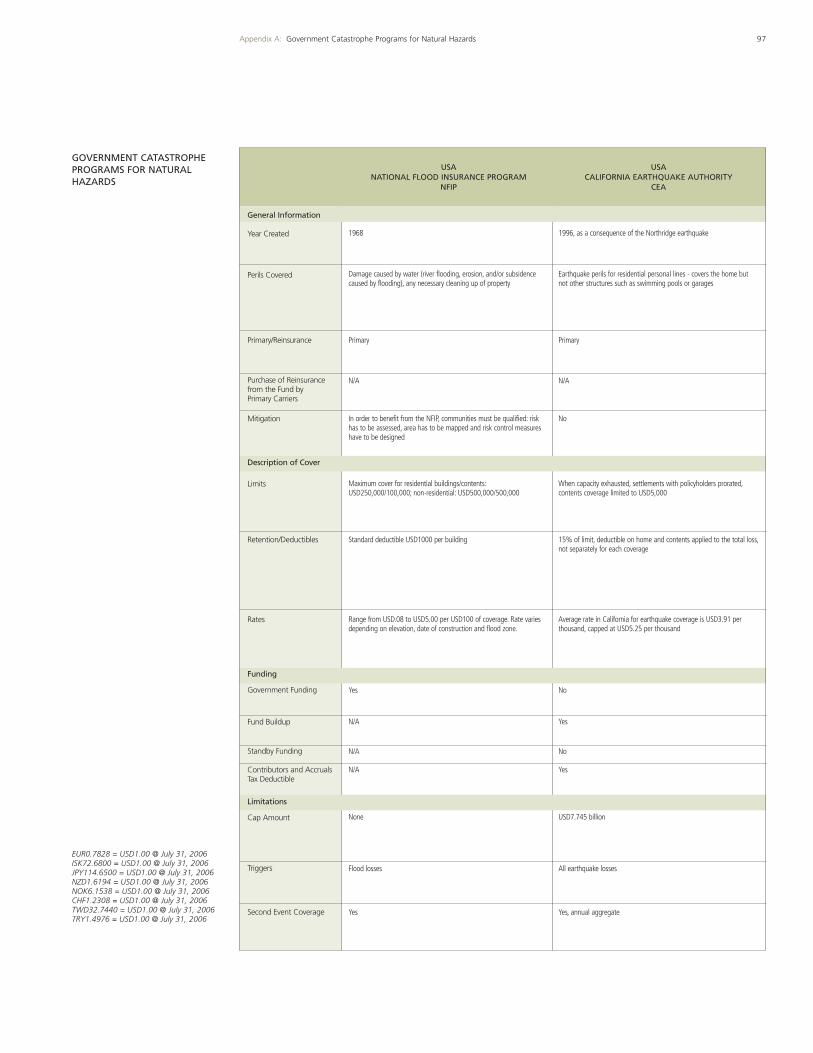
97Appendix A: Government Catastrophe Programs for Natural Hazards
GOVERNMENT CATASTROPHEPROGRAMS FOR NATURAL HAZARDS
General Information
Year Created
Perils Covered
Primary/Reinsurance
Purchase of Reinsurancefrom the Fund by Primary Carriers
Mitigation
Description of Cover
Limits
Retention/Deductibles
Rates
Funding
Government Funding
Fund Buildup
Standby Funding
Contributors and AccrualsTax Deductible
Limitations
Cap Amount
Triggers
Second Event Coverage
1968 1996, as a consequence of the Northridge earthquake
N/A N/A
USANATIONAL FLOOD INSURANCE PROGRAM
NFIP
USACALIFORNIA EARTHQUAKE AUTHORITY
CEA
Damage caused by water (river flooding, erosion, and/or subsidencecaused by flooding), any necessary cleaning up of property
Earthquake perils for residential personal lines - covers the home butnot other structures such as swimming pools or garages
Primary Primary
In order to benefit from the NFIP, communities must be qualified: riskhas to be assessed, area has to be mapped and risk control measureshave to be designed
No
Maximum cover for residential buildings/contents:USD250,000/100,000; non-residential: USD500,000/500,000
When capacity exhausted, settlements with policyholders prorated,contents coverage limited to USD5,000
Range from USD.08 to USD5.00 per USD100 of coverage. Rate variesdepending on elevation, date of construction and flood zone.
Average rate in California for earthquake coverage is USD3.91 per thousand, capped at USD5.25 per thousand
Yes No
N/A Yes
N/A No
N/A Yes
None USD7.745 billion
Flood losses All earthquake losses
Yes Yes, annual aggregate
Standard deductible USD1000 per building 15% of limit, deductible on home and contents applied to the total loss,not separately for each coverage
EUR0.7828 = USD1.00 @ July 31, 2006 ISK72.6800 = USD1.00 @ July 31, 2006 JPY114.6500 = USD1.00 @ July 31, 2006 NZD1.6194 = USD1.00 @ July 31, 2006 NOK6.1538 = USD1.00 @ July 31, 2006 CHF1.2308 = USD1.00 @ July 31, 2006 TWD32.7440 = USD1.00 @ July 31, 2006 TRY1.4976 = USD1.00 @ July 31, 2006
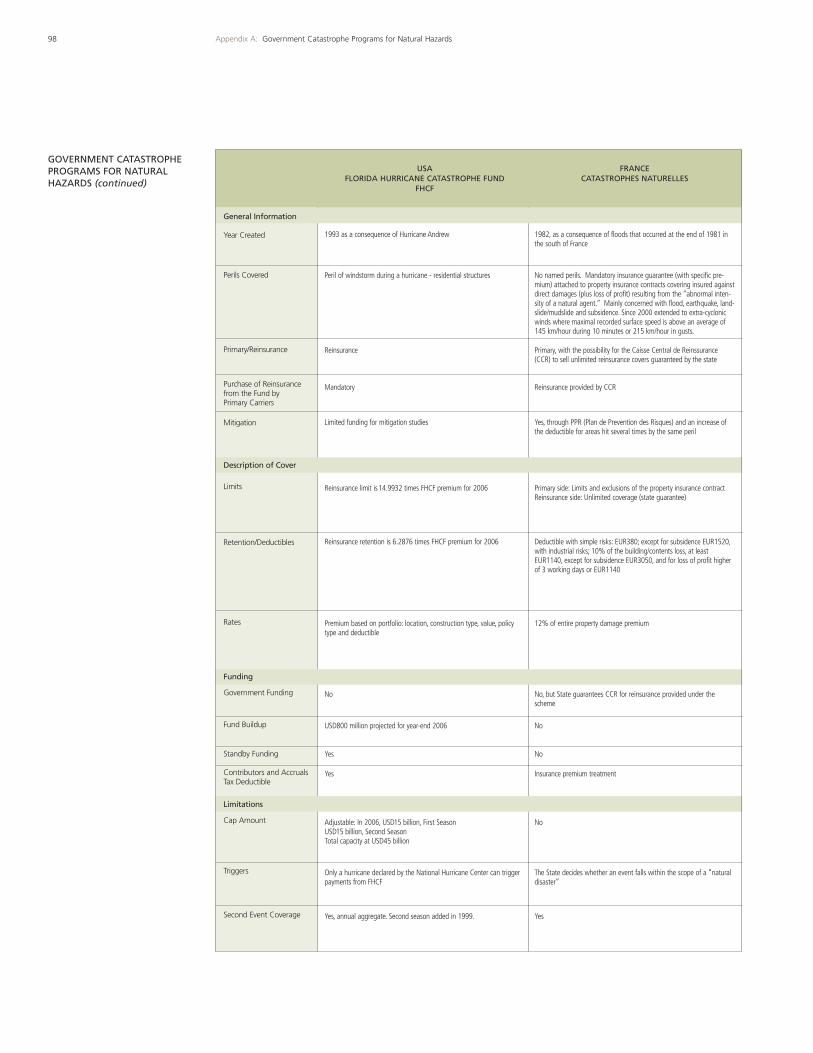
98 Appendix A: Government Catastrophe Programs for Natural Hazards
GOVERNMENT CATASTROPHEPROGRAMS FOR NATURAL HAZARDS (continued)
General Information
Year Created
Perils Covered
Primary/Reinsurance
Purchase of Reinsurancefrom the Fund by Primary Carriers
Mitigation
Description of Cover
Limits
Retention/Deductibles
Rates
Funding
Government Funding
Fund Buildup
Standby Funding
Contributors and AccrualsTax Deductible
Limitations
Cap Amount
Triggers
Second Event Coverage
1993 as a consequence of Hurricane Andrew 1982, as a consequence of floods that occurred at the end of 1981 inthe south of France
Mandatory Reinsurance provided by CCR
USAFLORIDA HURRICANE CATASTROPHE FUND
FHCF
FRANCECATASTROPHES NATURELLES
Peril of windstorm during a hurricane - residential structures No named perils. Mandatory insurance guarantee (with specific pre-mium) attached to property insurance contracts covering insured againstdirect damages (plus loss of profit) resulting from the “abnormal inten-sity of a natural agent.” Mainly concerned with flood, earthquake, land-slide/mudslide and subsidence. Since 2000 extended to extra-cyclonicwinds where maximal recorded surface speed is above an average of145 km/hour during 10 minutes or 215 km/hour in gusts.
Reinsurance Primary, with the possibility for the Caisse Central de Reinssurance(CCR) to sell unlimited reinsurance covers guaranteed by the state
Limited funding for mitigation studies Yes, through PPR (Plan de Prevention des Risques) and an increase ofthe deductible for areas hit several times by the same peril
Reinsurance limit is14.9932 times FHCF premium for 2006 Primary side: Limits and exclusions of the property insurance contractReinsurance side: Unlimited coverage (state guarantee)
Premium based on portfolio: location, construction type, value, policytype and deductible
12% of entire property damage premium
No No, but State guarantees CCR for reinsurance provided under thescheme
USD800 million projected for year-end 2006 No
Yes No
Yes Insurance premium treatment
Adjustable: In 2006, USD15 billion, First SeasonUSD15 billion, Second SeasonTotal capacity at USD45 billion
No
Only a hurricane declared by the National Hurricane Center can triggerpayments from FHCF
The State decides whether an event falls within the scope of a “naturaldisaster”
Yes, annual aggregate. Second season added in 1999. Yes
Reinsurance retention is 6.2876 times FHCF premium for 2006 Deductible with simple risks: EUR380; except for subsidence EUR1520,with industrial risks; 10% of the building/contents loss, at leastEUR1140, except for subsidence EUR3050, and for loss of profit higherof 3 working days or EUR1140
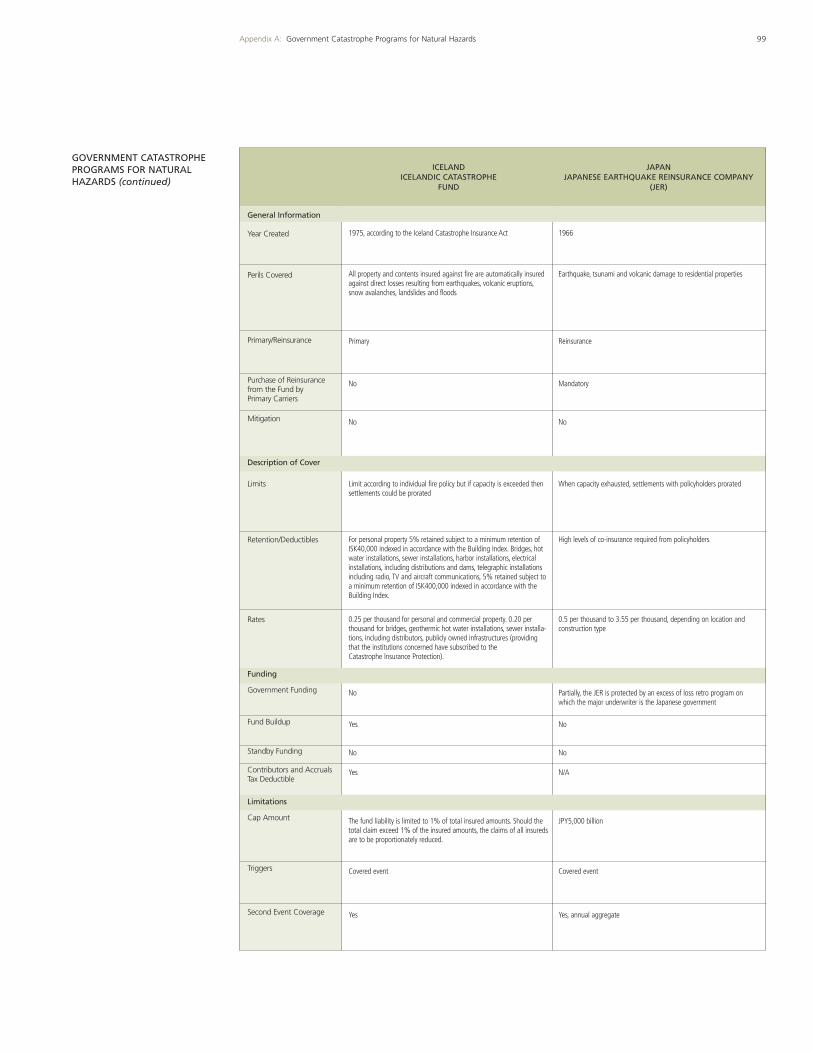
99Appendix A: Government Catastrophe Programs for Natural Hazards
GOVERNMENT CATASTROPHEPROGRAMS FOR NATURAL HAZARDS (continued)
1975, according to the Iceland Catastrophe Insurance Act 1966
No Mandatory
ICELAND ICELANDIC CATASTROPHE
FUND
JAPANJAPANESE EARTHQUAKE REINSURANCE COMPANY
(JER)
General Information
Year Created
Perils Covered
Primary/Reinsurance
Purchase of Reinsurancefrom the Fund by Primary Carriers
Mitigation
Description of Cover
Limits
Retention/Deductibles
Rates
Funding
Government Funding
Fund Buildup
Standby Funding
Contributors and AccrualsTax Deductible
Limitations
Cap Amount
Triggers
Second Event Coverage
All property and contents insured against fire are automatically insuredagainst direct losses resulting from earthquakes, volcanic eruptions,snow avalanches, landslides and floods
Earthquake, tsunami and volcanic damage to residential properties
Primary Reinsurance
No No
Limit according to individual fire policy but if capacity is exceeded thensettlements could be prorated
When capacity exhausted, settlements with policyholders prorated
0.25 per thousand for personal and commercial property. 0.20 perthousand for bridges, geothermic hot water installations, sewer installa-tions, including distributors, publicly owned infrastructures (providingthat the institutions concerned have subscribed to theCatastrophe Insurance Protection).
0.5 per thousand to 3.55 per thousand, depending on location andconstruction type
No Partially, the JER is protected by an excess of loss retro program onwhich the major underwriter is the Japanese government
Yes No
No No
Yes N/A
The fund liability is limited to 1% of total insured amounts. Should thetotal claim exceed 1% of the insured amounts, the claims of all insuredsare to be proportionately reduced.
JPY5,000 billion
Covered event Covered event
Yes Yes, annual aggregate
For personal property 5% retained subject to a minimum retention ofISK40,000 indexed in accordance with the Building Index. Bridges, hotwater installations, sewer installations, harbor installations, electricalinstallations, including distributions and dams, telegraphic installationsincluding radio, TV and aircraft communications, 5% retained subject toa minimum retention of ISK400,000 indexed in accordance with theBuilding Index.
High levels of co-insurance required from policyholders
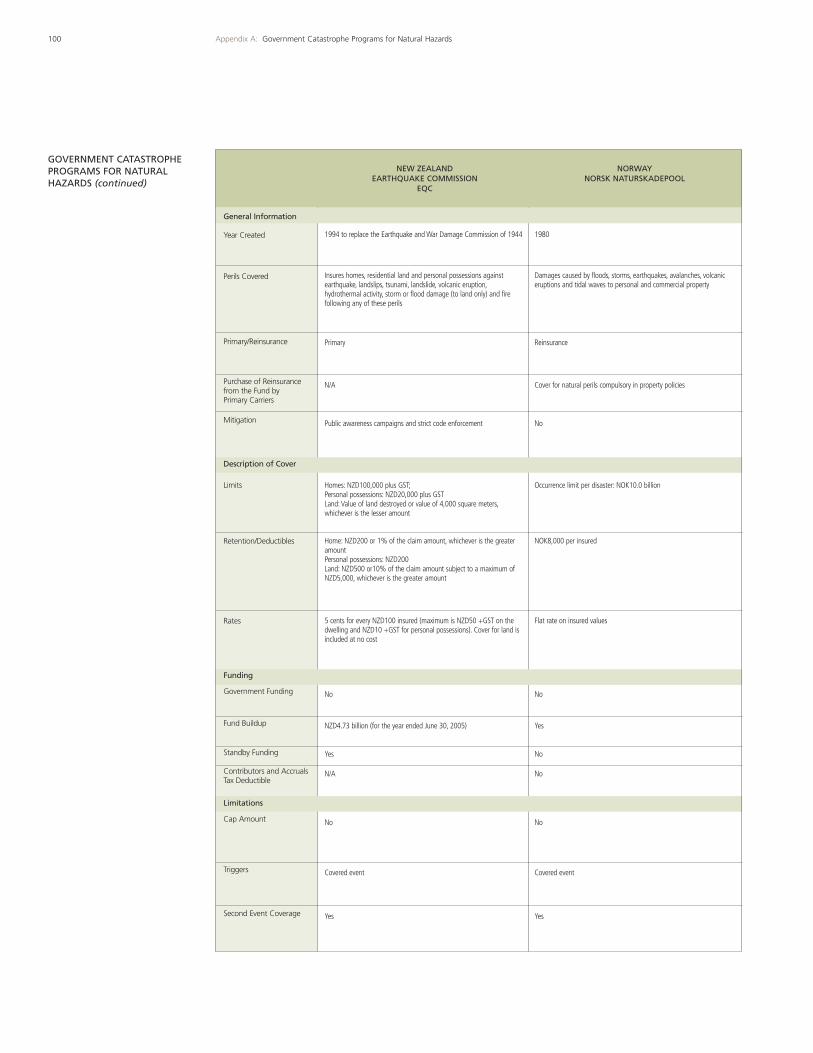
100 Appendix A: Government Catastrophe Programs for Natural Hazards
GOVERNMENT CATASTROPHEPROGRAMS FOR NATURAL HAZARDS (continued)
1994 to replace the Earthquake and War Damage Commission of 1944 1980
N/A Cover for natural perils compulsory in property policies
NEW ZEALANDEARTHQUAKE COMMISSION
EQC
NORWAYNORSK NATURSKADEPOOL
General Information
Year Created
Perils Covered
Primary/Reinsurance
Purchase of Reinsurancefrom the Fund by Primary Carriers
Mitigation
Description of Cover
Limits
Retention/Deductibles
Rates
Funding
Government Funding
Fund Buildup
Standby Funding
Contributors and AccrualsTax Deductible
Limitations
Cap Amount
Triggers
Second Event Coverage
Insures homes, residential land and personal possessions againstearthquake, landslips, tsunami, landslide, volcanic eruption,hydrothermal activity, storm or flood damage (to land only) and firefollowing any of these perils
Damages caused by floods, storms, earthquakes, avalanches, volcaniceruptions and tidal waves to personal and commercial property
Primary Reinsurance
Public awareness campaigns and strict code enforcement No
Homes: NZD100,000 plus GST;Personal possessions: NZD20,000 plus GSTLand: Value of land destroyed or value of 4,000 square meters,whichever is the lesser amount
Occurrence limit per disaster: NOK10.0 billion
5 cents for every NZD100 insured (maximum is NZD50 +GST on thedwelling and NZD10 +GST for personal possessions). Cover for land isincluded at no cost
Flat rate on insured values
No No
NZD4.73 billion (for the year ended June 30, 2005) Yes
Yes No
N/A No
No No
Covered event Covered event
Yes Yes
Home: NZD200 or 1% of the claim amount, whichever is the greateramountPersonal possessions: NZD200Land: NZD500 or10% of the claim amount subject to a maximum ofNZD5,000, whichever is the greater amount
NOK8,000 per insured
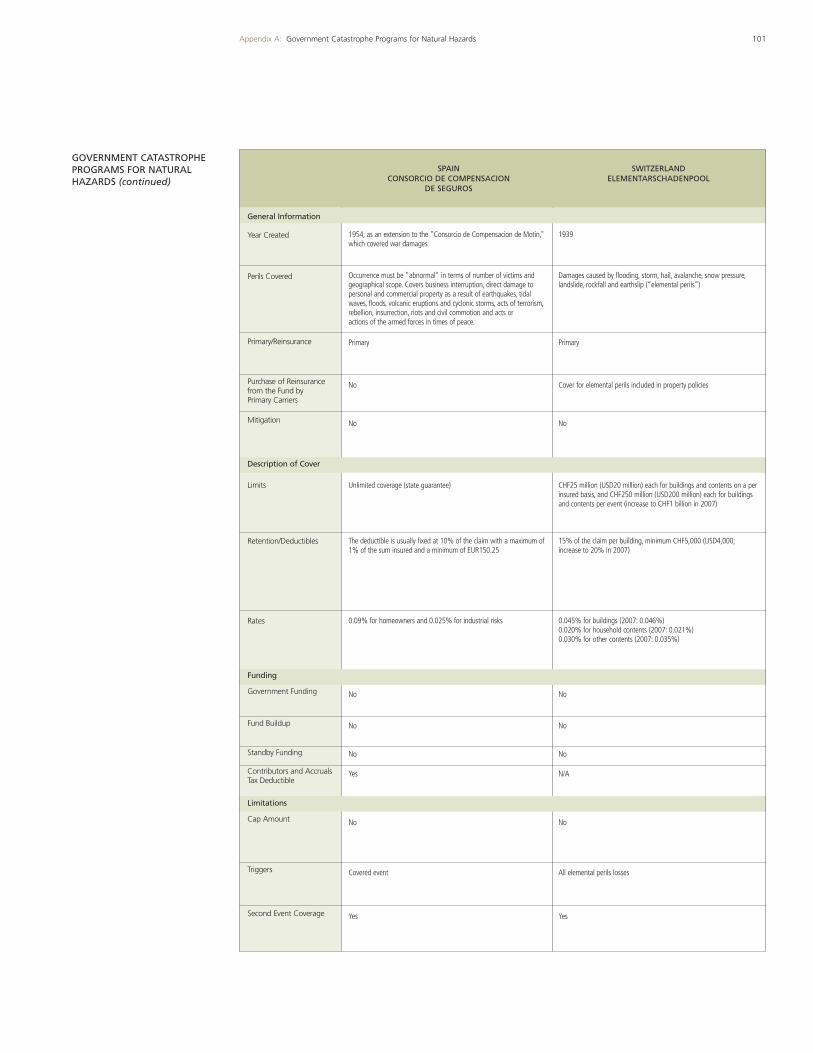
101Appendix A: Government Catastrophe Programs for Natural Hazards
GOVERNMENT CATASTROPHEPROGRAMS FOR NATURAL HAZARDS (continued)
1954, as an extension to the "Consorcio de Compensacion de Motin,"which covered war damages
1939
No Cover for elemental perils included in property policies
SPAIN CONSORCIO DE COMPENSACION
DE SEGUROS
SWITZERLAND ELEMENTARSCHADENPOOL
General Information
Year Created
Perils Covered
Primary/Reinsurance
Purchase of Reinsurancefrom the Fund by Primary Carriers
Mitigation
Description of Cover
Limits
Retention/Deductibles
Rates
Funding
Government Funding
Fund Buildup
Standby Funding
Contributors and AccrualsTax Deductible
Limitations
Cap Amount
Triggers
Second Event Coverage
Occurrence must be "abnormal" in terms of number of victims andgeographical scope. Covers business interruption, direct damage topersonal and commercial property as a result of earthquakes, tidalwaves, floods, volcanic eruptions and cyclonic storms, acts of terrorism,rebellion, insurrection, riots and civil commotion and acts oractions of the armed forces in times of peace.
Damages caused by flooding, storm, hail, avalanche, snow pressure,landslide, rockfall and earthslip (“elemental perils”)
Primary Primary
No No
Unlimited coverage (state guarantee) CHF25 million (USD20 million) each for buildings and contents on a perinsured basis, and CHF250 million (USD200 million) each for buildingsand contents per event (increase to CHF1 billion in 2007)
0.09% for homeowners and 0.025% for industrial risks 0.045% for buildings (2007: 0.046%)0.020% for household contents (2007: 0.021%)0.030% for other contents (2007: 0.035%)
No No
No No
No No
Yes N/A
No No
Covered event All elemental perils losses
Yes Yes
The deductible is usually fixed at 10% of the claim with a maximum of1% of the sum insured and a minimum of EUR150.25
15% of the claim per building, minimum CHF5,000 (USD4,000;increase to 20% in 2007)
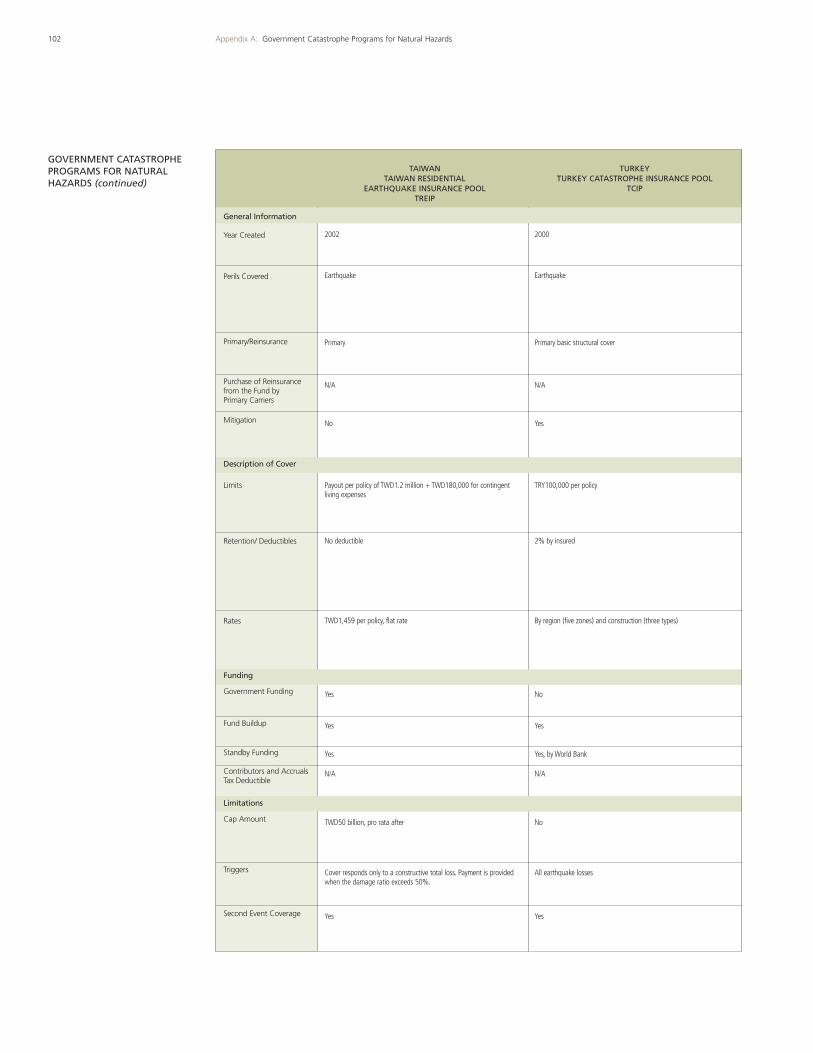
102 Appendix A: Government Catastrophe Programs for Natural Hazards
GOVERNMENT CATASTROPHEPROGRAMS FOR NATURAL HAZARDS (continued)
2002 2000
N/A N/A
TAIWANTAIWAN RESIDENTIAL
EARTHQUAKE INSURANCE POOLTREIP
TURKEYTURKEY CATASTROPHE INSURANCE POOL
TCIP
General Information
Year Created
Perils Covered
Primary/Reinsurance
Purchase of Reinsurancefrom the Fund by Primary Carriers
Mitigation
Description of Cover
Limits
Retention/ Deductibles
Rates
Funding
Government Funding
Fund Buildup
Standby Funding
Contributors and AccrualsTax Deductible
Limitations
Cap Amount
Triggers
Second Event Coverage
Earthquake Earthquake
Primary Primary basic structural cover
No Yes
Payout per policy of TWD1.2 million + TWD180,000 for contingentliving expenses
TRY100,000 per policy
TWD1,459 per policy, flat rate By region (five zones) and construction (three types)
Yes No
Yes Yes
Yes Yes, by World Bank
N/A N/A
TWD50 billion, pro rata after No
Cover responds only to a constructive total loss. Payment is providedwhen the damage ratio exceeds 50%.
All earthquake losses
Yes Yes
No deductible 2% by insured
103Appendix B: Global Terror Insurance Market Survey
The terrorist attacks on September 11, 2001, prompted major changes in how the world viewsterror cover. Since then, events in Bali, Turkey, Madrid and, most recently, London have served as a reminder that terrorism is a real and persistent threat. Can insurance and reinsurance companies cover losses of a similar future event? Questions have also arisen as to whether governments would be or should be involved in mitigating the risk exposure of insurance andreinsurance companies. Immediately after September 11, 2001, insurance and reinsurance companies around the world moved to exclude terror from their contracts. Since then, bothinsurers and reinsurers have modified their positions. In addition, numerous countries havedeveloped specific pools for the terror risk. Given the wide variation in response to terror coverby insurance providers, Guy Carpenter developed a survey on the global terror insurance market. Information was obtained from Guy Carpenter and Marsh local offices from around theworld. The information in this survey reflects the most recent market information.
Appendix B
Global Terror InsuranceMarket Survey
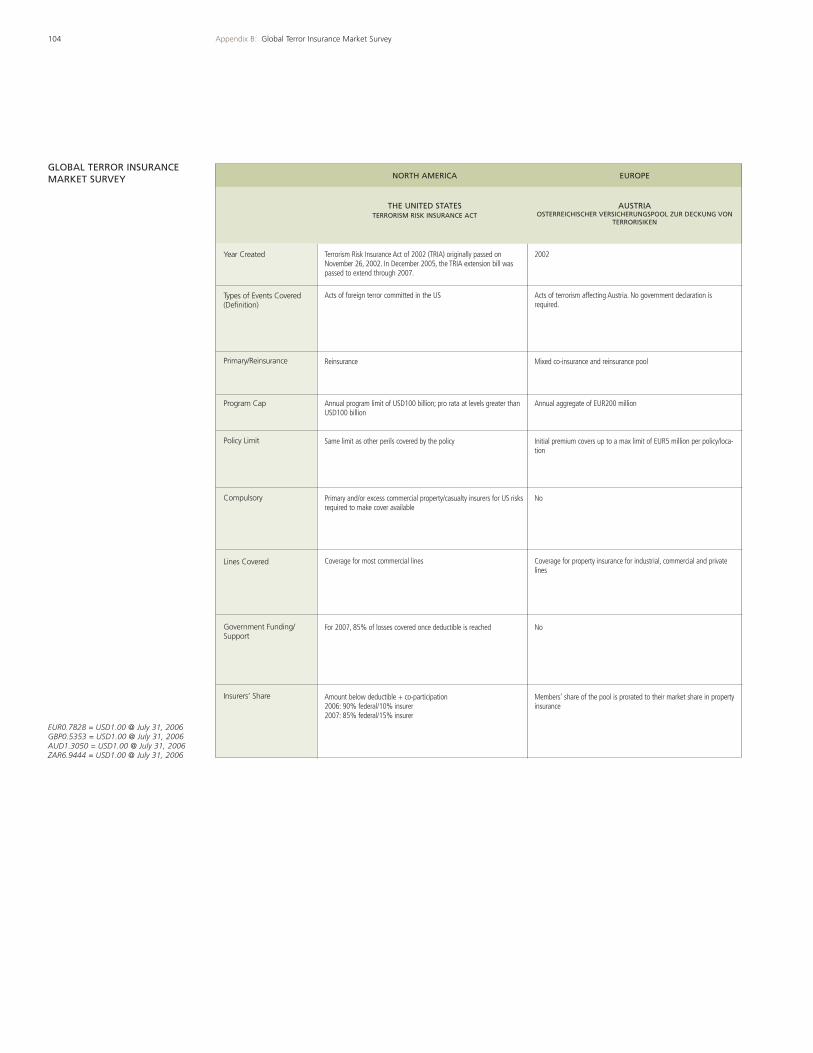
104 Appendix B: Global Terror Insurance Market Survey
GLOBAL TERROR INSURANCEMARKET SURVEY
Terrorism Risk Insurance Act of 2002 (TRIA) originally passed onNovember 26, 2002. In December 2005, the TRIA extension bill waspassed to extend through 2007.
2002
Annual program limit of USD100 billion; pro rata at levels greater thanUSD100 billion
Annual aggregate of EUR200 million
THE UNITED STATESTERRORISM RISK INSURANCE ACT
AUSTRIAOSTERREICHISCHER VERSICHERUNGSPOOL ZUR DECKUNG VON
TERRORISIKEN
NORTH AMERICA EUROPE
Acts of foreign terror committed in the US Acts of terrorism affecting Austria. No government declaration isrequired.
Reinsurance Mixed co-insurance and reinsurance pool
Same limit as other perils covered by the policy Initial premium covers up to a max limit of EUR5 million per policy/loca-tion
Primary and/or excess commercial property/casualty insurers for US risksrequired to make cover available
No
For 2007, 85% of losses covered once deductible is reached No
Amount below deductible + co-participation2006: 90% federal/10% insurer2007: 85% federal/15% insurer
Members’ share of the pool is prorated to their market share in propertyinsurance
Coverage for most commercial lines Coverage for property insurance for industrial, commercial and privatelines
Year Created
Types of Events Covered(Definition)
Primary/Reinsurance
Program Cap
Policy Limit
Compulsory
Lines Covered
Government Funding/ Support
Insurers’ Share
EUR0.7828 = USD1.00 @ July 31, 2006 GBP0.5353 = USD1.00 @ July 31, 2006 AUD1.3050 = USD1.00 @ July 31, 2006 ZAR6.9444 = USD1.00 @ July 31, 2006
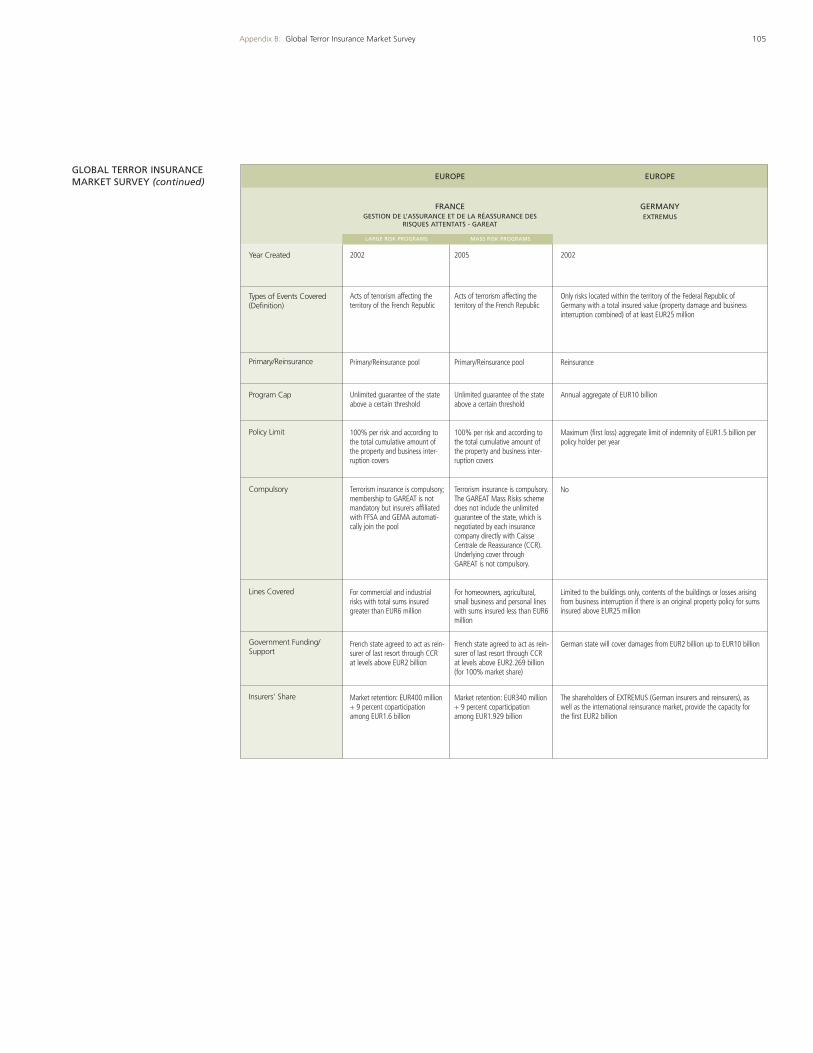
105Appendix B: Global Terror Insurance Market Survey
FRANCEGESTION DE L’ASSURANCE ET DE LA RÉASSURANCE DES
RISQUES ATTENTATS - GAREAT
GERMANYEXTREMUS
GLOBAL TERROR INSURANCEMARKET SURVEY (continued)
2002 2005
Unlimited guarantee of the stateabove a certain threshold
Unlimited guarantee of the stateabove a certain threshold
EUROPE EUROPE
Acts of terrorism affecting theterritory of the French Republic
Acts of terrorism affecting theterritory of the French Republic
Primary/Reinsurance pool Primary/Reinsurance pool
100% per risk and according tothe total cumulative amount ofthe property and business inter-ruption covers
100% per risk and according tothe total cumulative amount ofthe property and business inter-ruption covers
Terrorism insurance is compulsory;membership to GAREAT is notmandatory but insurers affiliatedwith FFSA and GEMA automati-cally join the pool
Terrorism insurance is compulsory.The GAREAT Mass Risks schemedoes not include the unlimitedguarantee of the state, which isnegotiated by each insurancecompany directly with CaisseCentrale de Reassurance (CCR).Underlying cover throughGAREAT is not compulsory.
French state agreed to act as rein-surer of last resort through CCRat levels above EUR2 billion
French state agreed to act as rein-surer of last resort through CCRat levels above EUR2.269 billion(for 100% market share)
Market retention: EUR400 million+ 9 percent coparticipationamong EUR1.6 billion
Market retention: EUR340 million+ 9 percent coparticipationamong EUR1.929 billion
For commercial and industrialrisks with total sums insuredgreater than EUR6 million
For homeowners, agricultural,small business and personal lineswith sums insured less than EUR6million
Year Created
Types of Events Covered(Definition)
Primary/Reinsurance
Program Cap
Policy Limit
Compulsory
Lines Covered
Government Funding/ Support
Insurers’ Share
2002
Annual aggregate of EUR10 billion
Only risks located within the territory of the Federal Republic ofGermany with a total insured value (property damage and businessinterruption combined) of at least EUR25 million
Reinsurance
Maximum (first loss) aggregate limit of indemnity of EUR1.5 billion perpolicy holder per year
No
German state will cover damages from EUR2 billion up to EUR10 billion
The shareholders of EXTREMUS (German insurers and reinsurers), aswell as the international reinsurance market, provide the capacity forthe first EUR2 billion
Limited to the buildings only, contents of the buildings or losses arisingfrom business interruption if there is an original property policy for sumsinsured above EUR25 million
LARGE RISK PROGRAMS MASS RISK PROGRAMS
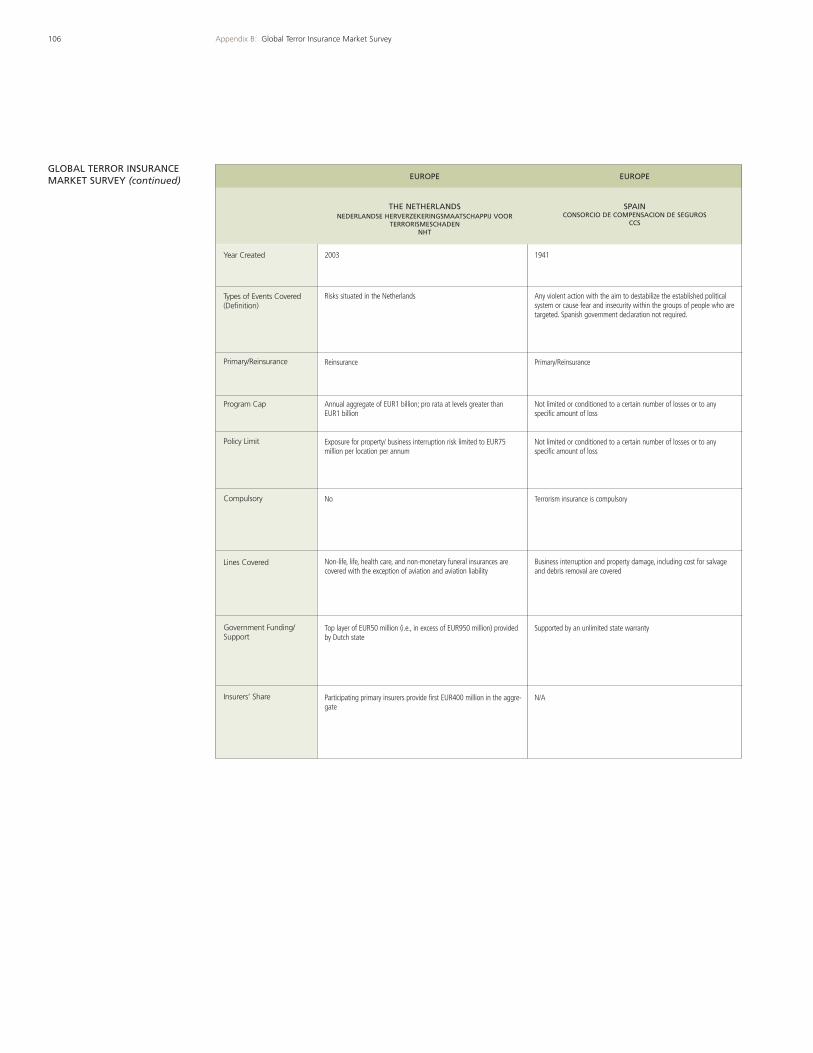
106 Appendix B: Global Terror Insurance Market Survey
GLOBAL TERROR INSURANCEMARKET SURVEY (continued)
2003 1941
Annual aggregate of EUR1 billion; pro rata at levels greater thanEUR1 billion
Not limited or conditioned to a certain number of losses or to anyspecific amount of loss
THE NETHERLANDSNEDERLANDSE HERVERZEKERINGSMAATSCHAPPIJ VOOR
TERRORISMESCHADENNHT
SPAINCONSORCIO DE COMPENSACION DE SEGUROS
CCS
EUROPE EUROPE
Risks situated in the Netherlands Any violent action with the aim to destabilize the established politicalsystem or cause fear and insecurity within the groups of people who aretargeted. Spanish government declaration not required.
Reinsurance Primary/Reinsurance
Exposure for property/ business interruption risk limited to EUR75million per location per annum
Not limited or conditioned to a certain number of losses or to anyspecific amount of loss
No Terrorism insurance is compulsory
Top layer of EUR50 million (i.e., in excess of EUR950 million) providedby Dutch state
Supported by an unlimited state warranty
Participating primary insurers provide first EUR400 million in the aggre-gate
N/A
Non-life, life, health care, and non-monetary funeral insurances arecovered with the exception of aviation and aviation liability
Business interruption and property damage, including cost for salvageand debris removal are covered
Year Created
Types of Events Covered(Definition)
Primary/Reinsurance
Program Cap
Policy Limit
Compulsory
Lines Covered
Government Funding/ Support
Insurers’ Share
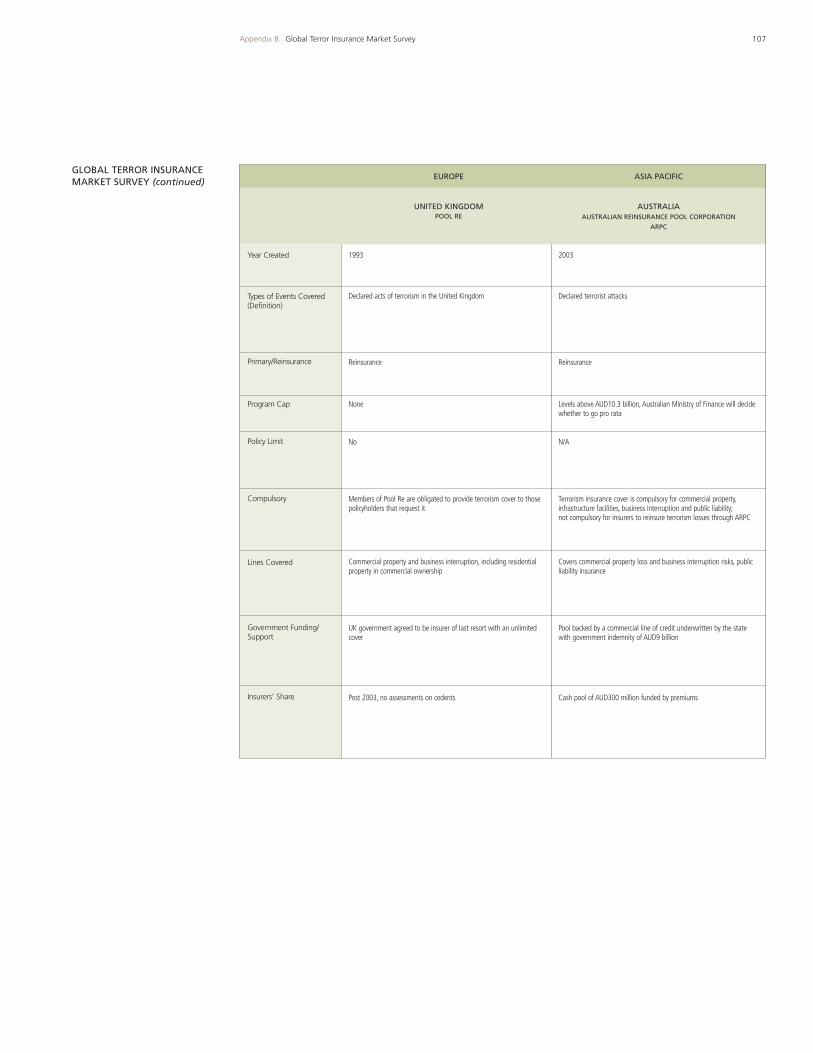
107Appendix B: Global Terror Insurance Market Survey
GLOBAL TERROR INSURANCEMARKET SURVEY (continued)
1993 2003
None Levels above AUD10.3 billion, Australian Ministry of Finance will decidewhether to go pro rata
UNITED KINGDOMPOOL RE
AUSTRALIAAUSTRALIAN REINSURANCE POOL CORPORATION
ARPC
EUROPE ASIA PACIFIC
Declared acts of terrorism in the United Kingdom Declared terrorist attacks
Reinsurance Reinsurance
No N/A
Members of Pool Re are obligated to provide terrorism cover to thosepolicyholders that request it
Terrorism insurance cover is compulsory for commercial property,infrastructure facilities, business interruption and public liability;not compulsory for insurers to reinsure terrorism losses through ARPC
UK government agreed to be insurer of last resort with an unlimitedcover
Pool backed by a commercial line of credit underwritten by the statewith government indemnity of AUD9 billion
Post 2003, no assessments on cedents Cash pool of AUD300 million funded by premiums
Commercial property and business interruption, including residentialproperty in commercial ownership
Covers commercial property loss and business interruption risks, publicliability insurance
Year Created
Types of Events Covered(Definition)
Primary/Reinsurance
Program Cap
Policy Limit
Compulsory
Lines Covered
Government Funding/ Support
Insurers’ Share
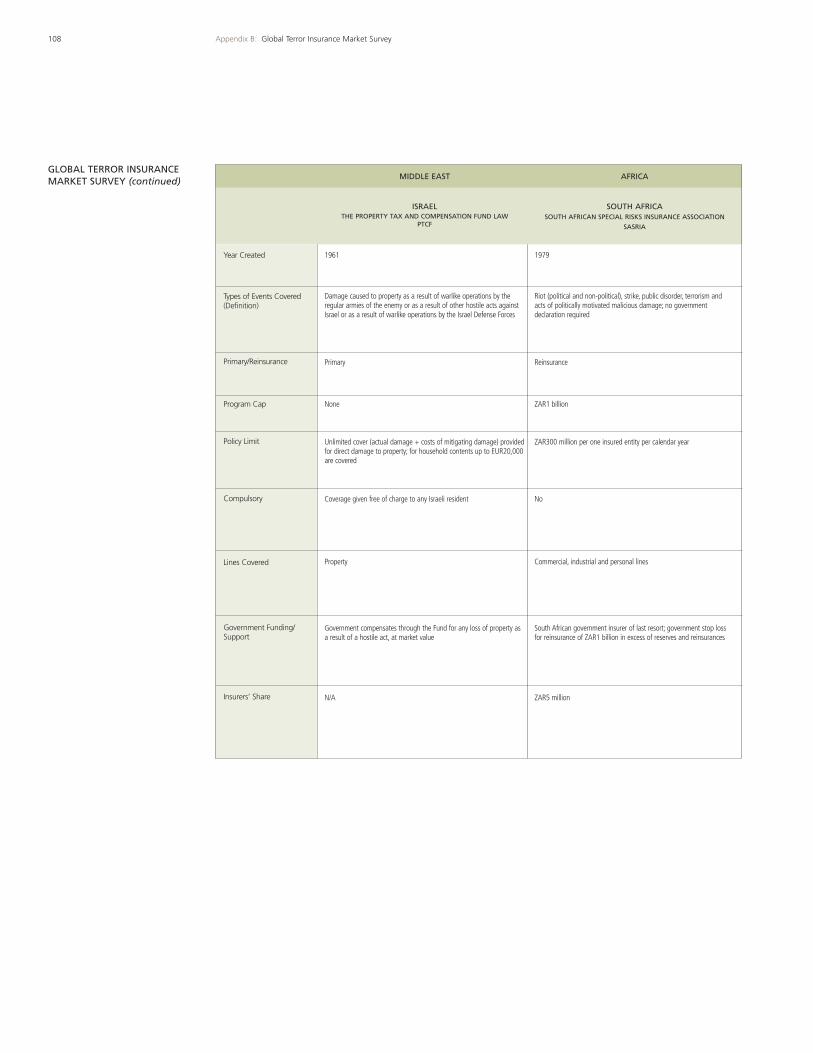
108 Appendix B: Global Terror Insurance Market Survey
GLOBAL TERROR INSURANCEMARKET SURVEY (continued)
1961 1979
None ZAR1 billion
ISRAELTHE PROPERTY TAX AND COMPENSATION FUND LAW
PTCF
SOUTH AFRICASOUTH AFRICAN SPECIAL RISKS INSURANCE ASSOCIATION
SASRIA
MIDDLE EAST AFRICA
Damage caused to property as a result of warlike operations by theregular armies of the enemy or as a result of other hostile acts againstIsrael or as a result of warlike operations by the Israel Defense Forces
Riot (political and non-political), strike, public disorder, terrorism andacts of politically motivated malicious damage; no governmentdeclaration required
Primary Reinsurance
Unlimited cover (actual damage + costs of mitigating damage) providedfor direct damage to property; for household contents up to EUR20,000are covered
ZAR300 million per one insured entity per calendar year
Coverage given free of charge to any Israeli resident No
Government compensates through the Fund for any loss of property asa result of a hostile act, at market value
South African government insurer of last resort; government stop lossfor reinsurance of ZAR1 billion in excess of reserves and reinsurances
N/A ZAR5 million
Property Commercial, industrial and personal lines
Year Created
Types of Events Covered(Definition)
Primary/Reinsurance
Program Cap
Policy Limit
Compulsory
Lines Covered
Government Funding/ Support
Insurers’ Share
109Appendix C: Summary of Catastrophe Bond Transactions
Appendix C
The data pertaining to the catastrophe bond transactions have been compiled by MMCSecurities Corp.* and obtained from publicly available sources.
*Securities are offered in the United States through MMC Securities Corp., Member NASD/SIPC. MMC Securities Corp. is an affiliate of Guy Carpenter &Company, Inc.
Summary of CatastropheBond Transactions
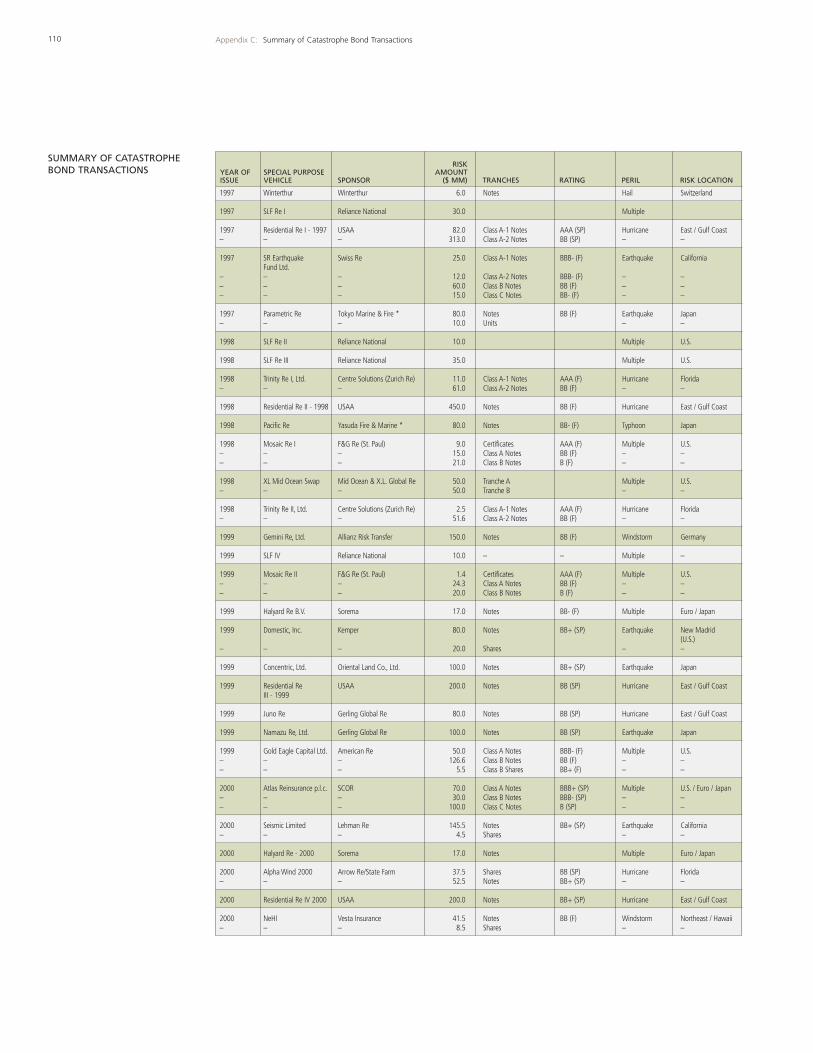
YEAR OFISSUE
SPECIAL PURPOSEVEHICLE SPONSOR
RISKAMOUNT
($ MM) TRANCHES RATING PERIL RISK LOCATION
SUMMARY OF CATASTROPHEBOND TRANSACTIONS
1997 Winterthur Winterthur 6.0 Notes Hail Switzerland
1997 SLF Re I Reliance National 30.0 Multiple
1997 Residential Re I - 1997 USAA 82.0 Class A-1 Notes AAA (SP) Hurricane East / Gulf Coast– – – 313.0 Class A-2 Notes BB (SP) – –
1997 SR Earthquake Swiss Re 25.0 Class A-1 Notes BBB- (F) Earthquake CaliforniaFund Ltd.
– – – 12.0 Class A-2 Notes BBB- (F) – –– – – 60.0 Class B Notes BB (F) – –– – – 15.0 Class C Notes BB- (F) – –
1997 Parametric Re Tokyo Marine & Fire * 80.0 Notes BB (F) Earthquake Japan– – – 10.0 Units – –
1998 SLF Re II Reliance National 10.0 Multiple U.S.
1998 SLF Re III Reliance National 35.0 Multiple U.S.
1998 Trinity Re I, Ltd. Centre Solutions (Zurich Re) 11.0 Class A-1 Notes AAA (F) Hurricane Florida– – – 61.0 Class A-2 Notes BB (F) – –
1998 Residential Re II - 1998 USAA 450.0 Notes BB (F) Hurricane East / Gulf Coast
1998 Pacific Re Yasuda Fire & Marine * 80.0 Notes BB- (F) Typhoon Japan
1998 Mosaic Re I F&G Re (St. Paul) 9.0 Certificates AAA (F) Multiple U.S.– – – 15.0 Class A Notes BB (F) – –– – – 21.0 Class B Notes B (F) – –
1998 XL Mid Ocean Swap Mid Ocean & X.L. Global Re 50.0 Tranche A Multiple U.S.– – – 50.0 Tranche B – –
1998 Trinity Re II, Ltd. Centre Solutions (Zurich Re) 2.5 Class A-1 Notes AAA (F) Hurricane Florida– – – 51.6 Class A-2 Notes BB (F) – –
1999 Gemini Re, Ltd. Allianz Risk Transfer 150.0 Notes BB (F) Windstorm Germany
1999 SLF IV Reliance National 10.0 – – Multiple –
1999 Mosaic Re II F&G Re (St. Paul) 1.4 Certificates AAA (F) Multiple U.S.– – – 24.3 Class A Notes BB (F) – –– – – 20.0 Class B Notes B (F) – –
1999 Halyard Re B.V. Sorema 17.0 Notes BB- (F) Multiple Euro / Japan
1999 Domestic, Inc. Kemper 80.0 Notes BB+ (SP) Earthquake New Madrid (U.S.)
– – – 20.0 Shares – –
1999 Concentric, Ltd. Oriental Land Co., Ltd. 100.0 Notes BB+ (SP) Earthquake Japan
1999 Residential Re USAA 200.0 Notes BB (SP) Hurricane East / Gulf CoastIII - 1999
1999 Juno Re Gerling Global Re 80.0 Notes BB (SP) Hurricane East / Gulf Coast
1999 Namazu Re, Ltd. Gerling Global Re 100.0 Notes BB (SP) Earthquake Japan
1999 Gold Eagle Capital Ltd. American Re 50.0 Class A Notes BBB- (F) Multiple U.S.– – – 126.6 Class B Notes BB (F) – –– – – 5.5 Class B Shares BB+ (F) – –
2000 Atlas Reinsurance p.l.c. SCOR 70.0 Class A Notes BBB+ (SP) Multiple U.S. / Euro / Japan– – – 30.0 Class B Notes BBB- (SP) – –– – – 100.0 Class C Notes B (SP) – –
2000 Seismic Limited Lehman Re 145.5 Notes BB+ (SP) Earthquake California– – – 4.5 Shares – –
2000 Halyard Re - 2000 Sorema 17.0 Notes Multiple Euro / Japan
2000 Alpha Wind 2000 Arrow Re/State Farm 37.5 Shares BB (SP) Hurricane Florida– – – 52.5 Notes BB+ (SP) – –
2000 Residential Re IV 2000 USAA 200.0 Notes BB+ (SP) Hurricane East / Gulf Coast
2000 NeHI Vesta Insurance 41.5 Notes BB (F) Windstorm Northeast / Hawaii– – – 8.5 Shares – –
110 Appendix C: Summary of Catastrophe Bond Transactions
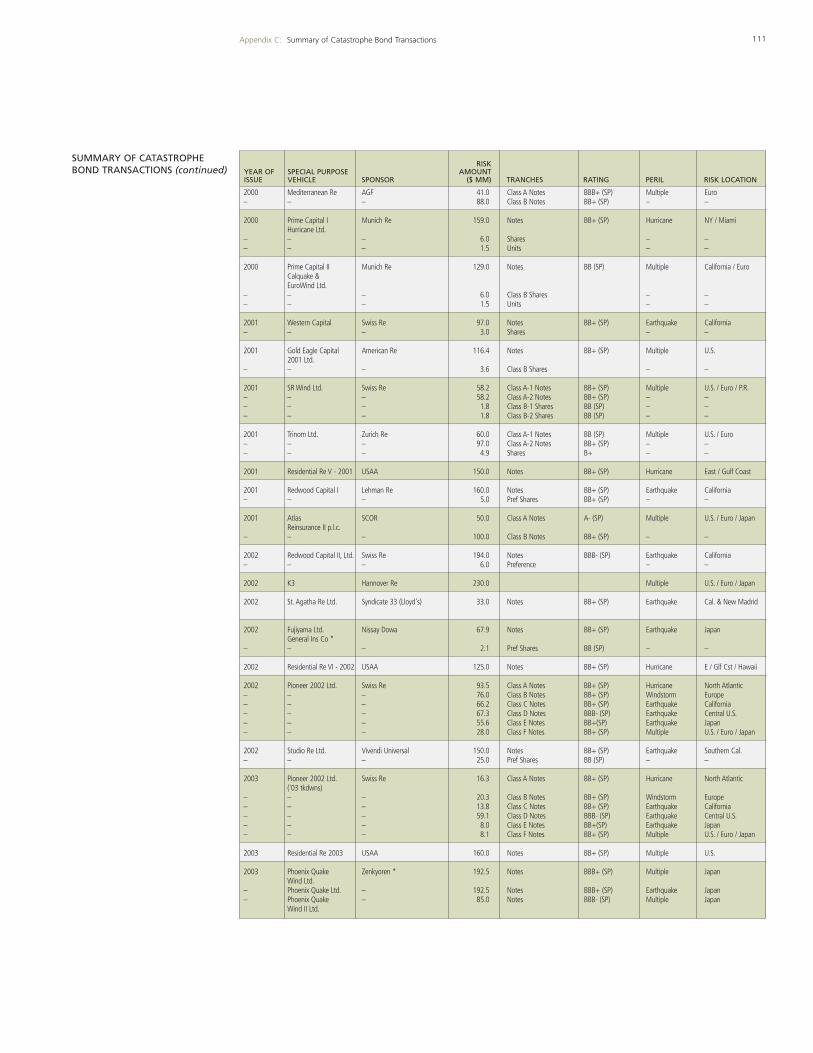
111Appendix C: Summary of Catastrophe Bond Transactions
SUMMARY OF CATASTROPHEBOND TRANSACTIONS (continued) YEAR OF
ISSUESPECIAL PURPOSEVEHICLE SPONSOR
RISKAMOUNT
($ MM) TRANCHES RATING PERIL RISK LOCATION
2000 Mediterranean Re AGF 41.0 Class A Notes BBB+ (SP) Multiple Euro– – – 88.0 Class B Notes BB+ (SP) – –
2000 Prime Capital I Munich Re 159.0 Notes BB+ (SP) Hurricane NY / MiamiHurricane Ltd.
– – – 6.0 Shares – –– – – 1.5 Units – –
2000 Prime Capital II Munich Re 129.0 Notes BB (SP) Multiple California / EuroCalquake &EuroWind Ltd.
– – – 6.0 Class B Shares – –– – – 1.5 Units – –
2001 Western Capital Swiss Re 97.0 Notes BB+ (SP) Earthquake California– – – 3.0 Shares – –
2001 Gold Eagle Capital American Re 116.4 Notes BB+ (SP) Multiple U.S.2001 Ltd.
– – – 3.6 Class B Shares – –
2001 SR Wind Ltd. Swiss Re 58.2 Class A-1 Notes BB+ (SP) Multiple U.S. / Euro / P.R.– – – 58.2 Class A-2 Notes BB+ (SP) – –– – – 1.8 Class B-1 Shares BB (SP) – –– – – 1.8 Class B-2 Shares BB (SP) – –
2001 Trinom Ltd. Zurich Re 60.0 Class A-1 Notes BB (SP) Multiple U.S. / Euro– – – 97.0 Class A-2 Notes BB+ (SP) – –– – – 4.9 Shares B+ – –
2001 Residential Re V - 2001 USAA 150.0 Notes BB+ (SP) Hurricane East / Gulf Coast
2001 Redwood Capital I Lehman Re 160.0 Notes BB+ (SP) Earthquake California– – – 5.0 Pref Shares BB+ (SP) – –
2001 Atlas SCOR 50.0 Class A Notes A- (SP) Multiple U.S. / Euro / JapanReinsurance II p.l.c.
– – – 100.0 Class B Notes BB+ (SP) – –
2002 Redwood Capital II, Ltd. Swiss Re 194.0 Notes BBB- (SP) Earthquake California– – – 6.0 Preference – –
2002 K3 Hannover Re 230.0 Multiple U.S. / Euro / Japan
2002 St. Agatha Re Ltd. Syndicate 33 (Lloyd's) 33.0 Notes BB+ (SP) Earthquake Cal. & New Madrid
2002 Fujiyama Ltd. Nissay Dowa 67.9 Notes BB+ (SP) Earthquake JapanGeneral Ins Co *
– – – 2.1 Pref Shares BB (SP) – –
2002 Residential Re VI - 2002 USAA 125.0 Notes BB+ (SP) Hurricane E / Glf Cst / Hawaii
2002 Pioneer 2002 Ltd. Swiss Re 93.5 Class A Notes BB+ (SP) Hurricane North Atlantic– – – 76.0 Class B Notes BB+ (SP) Windstorm Europe– – – 66.2 Class C Notes BB+ (SP) Earthquake California– – – 67.3 Class D Notes BBB- (SP) Earthquake Central U.S.– – – 55.6 Class E Notes BB+(SP) Earthquake Japan– – – 28.0 Class F Notes BB+ (SP) Multiple U.S. / Euro / Japan
2002 Studio Re Ltd. Vivendi Universal 150.0 Notes BB+ (SP) Earthquake Southern Cal.– – – 25.0 Pref Shares BB (SP) – –
2003 Pioneer 2002 Ltd. Swiss Re 16.3 Class A Notes BB+ (SP) Hurricane North Atlantic('03 tkdwns)
– – – 20.3 Class B Notes BB+ (SP) Windstorm Europe– – – 13.8 Class C Notes BB+ (SP) Earthquake California– – – 59.1 Class D Notes BBB- (SP) Earthquake Central U.S.– – – 8.0 Class E Notes BB+(SP) Earthquake Japan– – – 8.1 Class F Notes BB+ (SP) Multiple U.S. / Euro / Japan
2003 Residential Re 2003 USAA 160.0 Notes BB+ (SP) Multiple U.S.
2003 Phoenix Quake Zenkyoren * 192.5 Notes BBB+ (SP) Multiple JapanWind Ltd.
– Phoenix Quake Ltd. – 192.5 Notes BBB+ (SP) Earthquake Japan– Phoenix Quake – 85.0 Notes BBB- (SP) Multiple Japan
Wind II Ltd.
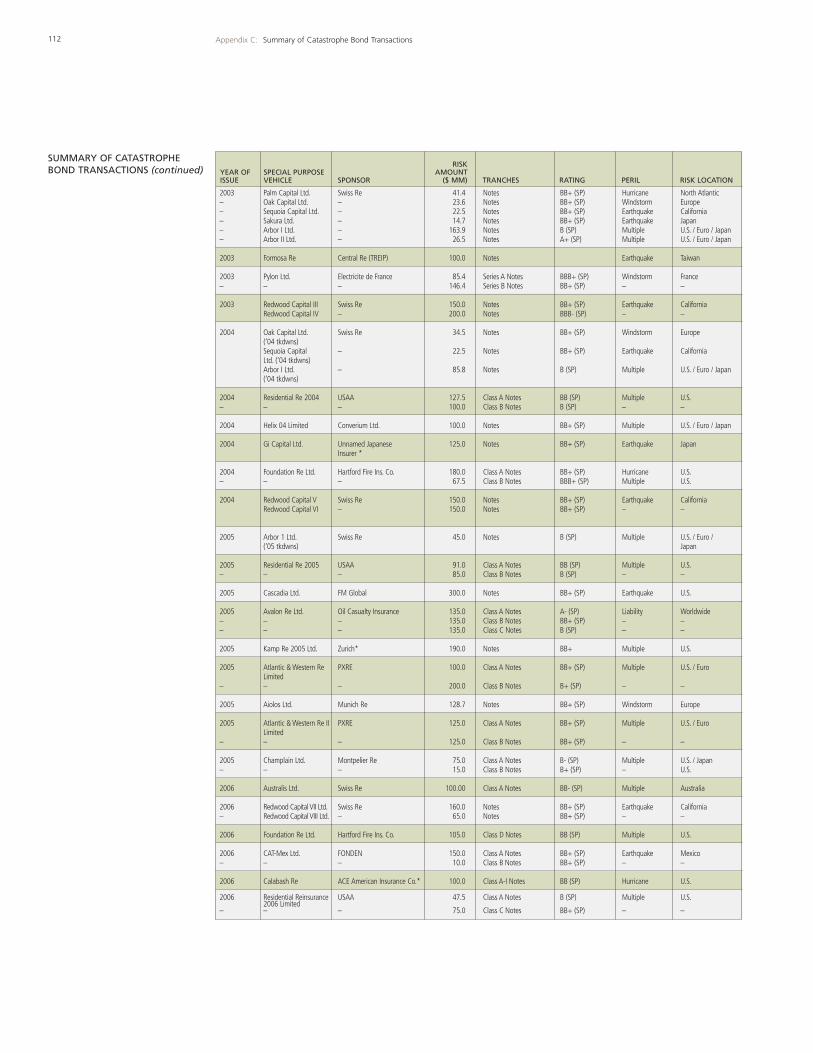
112 Appendix C: Summary of Catastrophe Bond Transactions
2003 Palm Capital Ltd. Swiss Re 41.4 Notes BB+ (SP) Hurricane North Atlantic– Oak Capital Ltd. – 23.6 Notes BB+ (SP) Windstorm Europe– Sequoia Capital Ltd. – 22.5 Notes BB+ (SP) Earthquake California– Sakura Ltd. – 14.7 Notes BB+ (SP) Earthquake Japan– Arbor I Ltd. – 163.9 Notes B (SP) Multiple U.S. / Euro / Japan– Arbor II Ltd. – 26.5 Notes A+ (SP) Multiple U.S. / Euro / Japan
2003 Formosa Re Central Re (TREIP) 100.0 Notes Earthquake Taiwan
2003 Pylon Ltd. Electricite de France 85.4 Series A Notes BBB+ (SP) Windstorm France– – – 146.4 Series B Notes BB+ (SP) – –
2003 Redwood Capital III Swiss Re 150.0 Notes BB+ (SP) Earthquake CaliforniaRedwood Capital IV – 200.0 Notes BBB- (SP) – –
2004 Oak Capital Ltd. Swiss Re 34.5 Notes BB+ (SP) Windstorm Europe(‘04 tkdwns)Sequoia Capital – 22.5 Notes BB+ (SP) Earthquake CaliforniaLtd. (‘04 tkdwns)Arbor I Ltd. – 85.8 Notes B (SP) Multiple U.S. / Euro / Japan(‘04 tkdwns)
2004 Residential Re 2004 USAA 127.5 Class A Notes BB (SP) Multiple U.S.– – – 100.0 Class B Notes B (SP) – –
2004 Helix 04 Limited Converium Ltd. 100.0 Notes BB+ (SP) Multiple U.S. / Euro / Japan
2004 Gi Capital Ltd. Unnamed Japanese 125.0 Notes BB+ (SP) Earthquake JapanInsurer *
2004 Foundation Re Ltd. Hartford Fire Ins. Co. 180.0 Class A Notes BB+ (SP) Hurricane U.S.– – – 67.5 Class B Notes BBB+ (SP) Multiple U.S.
2004 Redwood Capital V Swiss Re 150.0 Notes BB+ (SP) Earthquake CaliforniaRedwood Capital VI – 150.0 Notes BB+ (SP) – –
2005 Arbor 1 Ltd. Swiss Re 45.0 Notes B (SP) Multiple U.S. / Euro / (‘05 tkdwns) Japan
2005 Residential Re 2005 USAA 91.0 Class A Notes BB (SP) Multiple U.S.– – – 85.0 Class B Notes B (SP) – –
2005 Cascadia Ltd. FM Global 300.0 Notes BB+ (SP) Earthquake U.S.
2005 Avalon Re Ltd. Oil Casualty Insurance 135.0 Class A Notes A- (SP) Liability Worldwide– – – 135.0 Class B Notes BB+ (SP) – –– – – 135.0 Class C Notes B (SP) – –
2005 Kamp Re 2005 Ltd. Zurich* 190.0 Notes BB+ Multiple U.S.
2005 Atlantic & Western Re PXRE 100.0 Class A Notes BB+ (SP) Multiple U.S. / EuroLimited
– – – 200.0 Class B Notes B+ (SP) – –
2005 Aiolos Ltd. Munich Re 128.7 Notes BB+ (SP) Windstorm Europe
2005 Atlantic & Western Re II PXRE 125.0 Class A Notes BB+ (SP) Multiple U.S. / EuroLimited
– – – 125.0 Class B Notes BB+ (SP) – –
2005 Champlain Ltd. Montpelier Re 75.0 Class A Notes B- (SP) Multiple U.S. / Japan– – – 15.0 Class B Notes B+ (SP) – U.S.
2006 Australis Ltd. Swiss Re 100.00 Class A Notes BB- (SP) Multiple Australia
2006 Redwood Capital VII Ltd. Swiss Re 160.0 Notes BB+ (SP) Earthquake California– Redwood Capital VIII Ltd. – 65.0 Notes BB+ (SP) – –
2006 Foundation Re Ltd. Hartford Fire Ins. Co. 105.0 Class D Notes BB (SP) Multiple U.S.
2006 CAT-Mex Ltd. FONDEN 150.0 Class A Notes BB+ (SP) Earthquake Mexico– – – 10.0 Class B Notes BB+ (SP) – –
2006 Calabash Re ACE American Insurance Co.* 100.0 Class A-I Notes BB (SP) Hurricane U.S.
2006 Residential Reinsurance USAA 47.5 Class A Notes B (SP) Multiple U.S.2006 Limited
– – – 75.0 Class C Notes BB+ (SP) – –
YEAR OFISSUE
SPECIAL PURPOSEVEHICLE SPONSOR
RISKAMOUNT
($ MM) TRANCHES RATING PERIL RISK LOCATION
SUMMARY OF CATASTROPHEBOND TRANSACTIONS (continued)
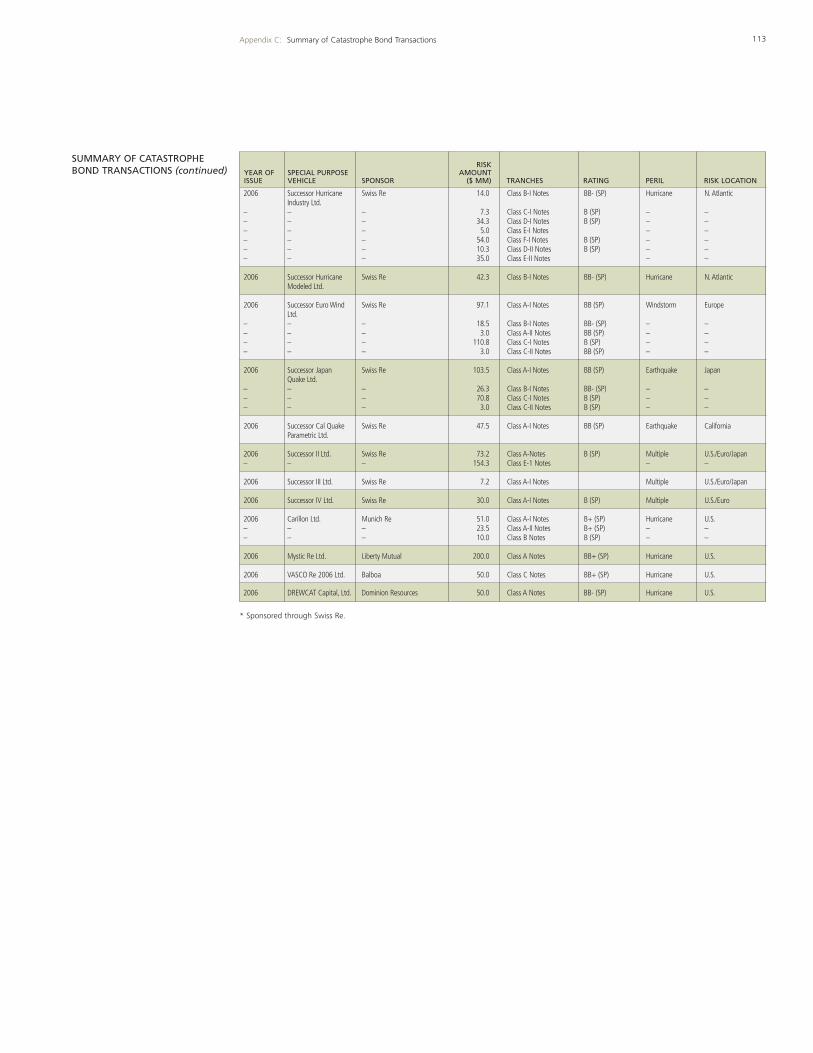
2006 Successor Hurricane Swiss Re 14.0 Class B-I Notes BB- (SP) Hurricane N. AtlanticIndustry Ltd.
– – – 7.3 Class C-I Notes B (SP) – –– – – 34.3 Class D-I Notes B (SP) – –– – – 5.0 Class E-I Notes – –– – – 54.0 Class F-I Notes B (SP) – –– – – 10.3 Class D-II Notes B (SP) – –– – – 35.0 Class E-II Notes – –
2006 Successor Hurricane Swiss Re 42.3 Class B-I Notes BB- (SP) Hurricane N. AtlanticModeled Ltd.
2006 Successor Euro Wind Swiss Re 97.1 Class A-I Notes BB (SP) Windstorm EuropeLtd.
– – – 18.5 Class B-I Notes BB- (SP) – –– – – 3.0 Class A-II Notes BB (SP) – –– – – 110.8 Class C-I Notes B (SP) – –– – – 3.0 Class C-II Notes BB (SP) – –
2006 Successor Japan Swiss Re 103.5 Class A-I Notes BB (SP) Earthquake JapanQuake Ltd.
– – – 26.3 Class B-I Notes BB- (SP) – –– – – 70.8 Class C-I Notes B (SP) – –– – – 3.0 Class C-II Notes B (SP) – –
2006 Successor Cal Quake Swiss Re 47.5 Class A-I Notes BB (SP) Earthquake CaliforniaParametric Ltd.
2006 Successor II Ltd. Swiss Re 73.2 Class A-Notes B (SP) Multiple U.S./Euro/Japan– – – 154.3 Class E-1 Notes – –
2006 Successor III Ltd. Swiss Re 7.2 Class A-I Notes Multiple U.S./Euro/Japan
2006 Successor IV Ltd. Swiss Re 30.0 Class A-I Notes B (SP) Multiple U.S./Euro
2006 Carillon Ltd. Munich Re 51.0 Class A-I Notes B+ (SP) Hurricane U.S.– – – 23.5 Class A-II Notes B+ (SP) – –– – – 10.0 Class B Notes B (SP) – –
2006 Mystic Re Ltd. Liberty Mutual 200.0 Class A Notes BB+ (SP) Hurricane U.S.
2006 VASCO Re 2006 Ltd. Balboa 50.0 Class C Notes BB+ (SP) Hurricane U.S.
2006 DREWCAT Capital, Ltd. Dominion Resources 50.0 Class A Notes BB- (SP) Hurricane U.S.
113Appendix C: Summary of Catastrophe Bond Transactions
YEAR OFISSUE
SPECIAL PURPOSEVEHICLE SPONSOR
RISKAMOUNT
($ MM) TRANCHES RATING PERIL RISK LOCATION
SUMMARY OF CATASTROPHEBOND TRANSACTIONS (continued)
* Sponsored through Swiss Re.
114
2006
Nanotechnology: The Plastics of the 21st Century? (July)
The Lloyd’s Market in 2006 (July)
Global Terror Insurance Market: A World at Risk Keeps Watch (June)
Tropical Cyclone Larry Review (May)
Bermuda Reinsurance Market: After Record Storms, Capital Fills Sails (May)
The Catastrophe Bond Market at Year-End 2005: Ripple Effects from Record Storms (February)
Property Specialty Update: 1 January 2006 Renewal Season Overview (January)
U.S. Reinsurance Renewals at January 1, 2006: Divergent Paths after Record Storms (January)
2005
European Flood Report 2005: Central and Eastern Europe (December)
The Growing Appetite for Catastrophe Risk: The Catastrophe Bond Market at Year-End 2004 (March)
Tsunami: Indian Ocean Event and Investigation into Potential Global Risks (March)
Marine & Energy Reinsurance Review Report 2005 (January)
6All publications are available on Guy Carpenter’s website, www.guycarp.com, in the “Our Insights” section.
Recent Guy Carpenter Publications of Note6
Recent Guy Carpenter Publications of Note

115
Notes

116
Notes
Guy Carpenter & Company, Inc. is the world's leading risk and reinsurance specialist and a part of the Marsh &
McLennan Companies, Inc. Guy Carpenter creates and executes reinsurance and risk management solutions for
clients worldwide through 2,600 professionals across the globe. The firm's full breadth of services includes 16 cen-
ters of excellence in Accident & Health, Agriculture, Alternative Risk Transfer, Environmental, General Casualty,
Investment Banking*, Life & Annuity, Marine and Energy, Professional Liability, Program Manager Solutions, Property,
Retrocessional, Structured Risk, Surety, Terror Risk and Workers Compensation. In addition, Guy Carpenter's Instrat®
unit utilizes industry-leading quantitative skills and modeling tools that optimize the reinsurance decision-making
process and help make the firm's clients more successful. Guy Carpenter’s website address is www.guycarp.com.
* Securities or investments, as applicable, are offered in the (i) United States through MMC Securities Corp., a US reg-
istered broker-dealer and member NASD/SIPC, and (ii) European Union through Marsh Advanced Risk Solutions Ltd.
(“MARS Ltd.”), regulated by the Financial Services Authority for the conduct of investment business in the United
Kingdom. Reinsurance products are placed through qualified affiliates of Guy Carpenter. MMC Securities Corp. and
MARS Ltd. are affiliates of Guy Carpenter.
Guy Carpenter & Company, Inc. provides this report for general information only. The information contained herein
is based on sources we believe reliable, but we do not guarantee its accuracy, and it should be understood to be gen-
eral insurance/reinsurance information only. Guy Carpenter & Company, Inc. makes no representations or war-
ranties, express or implied. The information is not intended to be taken as advice with respect to any individual situ-
ation and cannot be relied upon as such. Please consult your insurance/reinsurance advisors with respect to indi-
vidual coverage issues.
Readers are cautioned not to place undue reliance on any historical, current or forward-looking statements. Guy
Carpenter & Company, Inc. undertakes no obligation to update or revise publicly any historical, current or forward-
looking statements, whether as a result of new information, research, future events or otherwise.
Statements concerning tax, accounting, legal or regulatory matters should be understood to be general observations
based solely on our experience as reinsurance brokers and risk consultants, and may not be relied upon as tax,
accounting, legal or regulatory advice, which we are not authorized to provide. All such matters should be reviewed
with your own qualified advisors in these areas.
Unless otherwise noted herein, all statistics, tables, charts, graphs and exhibits contained herein were compiled by
either Guy Carpenter or MMC Securities Corp. While the information contained herein is based on sources that are
believed to be reliable, no warranties are made as to the accuracy, reliability or completeness of this information and
no information is to be relied upon for the purpose of making or communicating investment or other decisions.
Furthermore, no warranties are made concerning the financial condition or solvency of any capital market partici-
pants. Past performance does not guarantee future outcome. Guy Carpenter, MMCSC, or any of their affiliates may
have an independent business relationship with any of the companies described herein.
This document or any portion of the information it contains may not be copied or reproduced in any form without
the permission of Guy Carpenter & Company, Inc., except that clients of Guy Carpenter & Company, Inc. need not
obtain such permission when using this report for their internal purposes.
The trademarks and service marks contained herein are the property of their respective owners. Securities are
offered in the United States through MMC Securities Corp., member NASD, SIPC.
For additional copies of this
report, please contact us at
This report is also available for
download at www.guycarp.com.
Questions or comments regarding
this report should be addressed
to:
Seán Mooney, Ph.D.
Chief Economist
Guy Carpenter & Company, Inc.
917.937.3189

The World Catastrophe Reinsurance Market: Steep Peaks Overshadow Plateaus © 2006 Guy Carpenter & Company, Inc.M1678B.09.2006:5M