Embed Size (px)
Citation preview

2016 Insurance Market Briefing - Germany
Hyatt Regency Köln
26 April 2016

2016 Insurance Market Briefing - Germany
2016 Insurance Market Briefing - Germany 26 April 2016 2
Welcome
Nick Charteris-Black Managing Director, Market Development – EMEA
William Mills
Director, Market Development

Agenda
2016 Insurance Market Briefing - Germany 26 April 2016 3
10:10 Guest Presentation: The Reinsurance Market Today – Risks and Opportunities Ulrich Wallin, Chairman of the Executive Board, Hannover Re
10:50 Natural Catastrophe Schemes in Europe Carlos Wong-Fupuy, Senior Director
11:20
11:40 Global Reinsurance Market Trends Ghislain Le Cam, Associate Director, Analytics
12:10 Mock Rating Committee & Vote Greg Carter, Managing Director, Analytics
Konstantin Langowski, Financial Analyst
plus other Committee Members
13:00

Disclaimer
2016 Insurance Market Briefing - Germany 26 April 2016 4
© AM Best Company (AMB) and/or its licensors and affiliates. All rights reserved. ALL INFORMATION CONTAINED HEREIN IS PROTECTED BY COPYRIGHT LAW AND NONE OF SUCH INFORMATION MAY BE COPIED OR OTHERWISE REPRODUCED, REPACKAGED, FURTHER TRANSMITTED, TRANSFERRED, DISSEMINATED, REDISTRIBUTED OR RESOLD, OR STORED FOR SUBSEQUENT USE FOR ANY SUCH PURPOSE, IN WHOLE OR IN PART, IN ANY FORM OR MANNER OR BY ANY MEANS WHATSOEVER, BY ANY PERSON WITHOUT AMB’s PRIOR WRITTEN CONSENT. All information contained herein is obtained by AMB from sources believed by it to be accurate and reliable. Because of the possibility of human or mechanical error as well as other factors, however, all information contained herein is provided “AS IS” without warranty of any kind. Under no circumstances shall AMB have any liability to any person or entity for (a) any loss or damage in whole or in part caused by, resulting from, or relating to, any error (negligent or otherwise) or other circumstance or contingency within or outside the control of AMB or any of its directors, officers, employees or agents in connection with the procurement, collection, compilation, analysis, interpretation, communication, publication or delivery of any such information, or (b) any direct, indirect, special, consequential, compensatory or incidental damages whatsoever (including without limitation, lost profits), even if AMB is advised in advance of the possibility of such damages, resulting from the use of or inability to use, any such information. The credit ratings, financial reporting analysis, projections, and other observations, if any, constituting part of the information contained herein are, and must be construed solely as, statements of opinion and not statements of fact or recommendations to purchase, sell or hold any securities, insurance policies, contracts or any other financial obligations, nor does it address the suitability of any particular financial obligation for a specific purpose or purchaser. Credit risk is the risk that an entity may not meet its contractual, financial obligations as they come due. Credit ratings do not address any other risk, including but not limited to, liquidity risk, market value risk or price volatility of rated securities. NO WARRANTY, EXPRESS OR IMPLIED, AS TO THE ACCURACY, TIMELINESS, COMPLETENESS, MERCHANTABILITY OR FITNESS FOR ANY PARTICULAR PURPOSE OF ANY SUCH RATING OR OTHER OPINION OR INFORMATION IS GIVEN OR MADE BY AMB IN ANY FORM OR MANNER WHATSOEVER. Each credit rating or other opinion must be weighed solely as one factor in any investment or purchasing decision made by or on behalf of any user of the information contained herein, and each such user must accordingly make its own study and evaluation of each security or other financial obligation and of each issuer and guarantor of, and each provider of credit support for, each security or other financial obligation that it may consider purchasing, holding or selling.
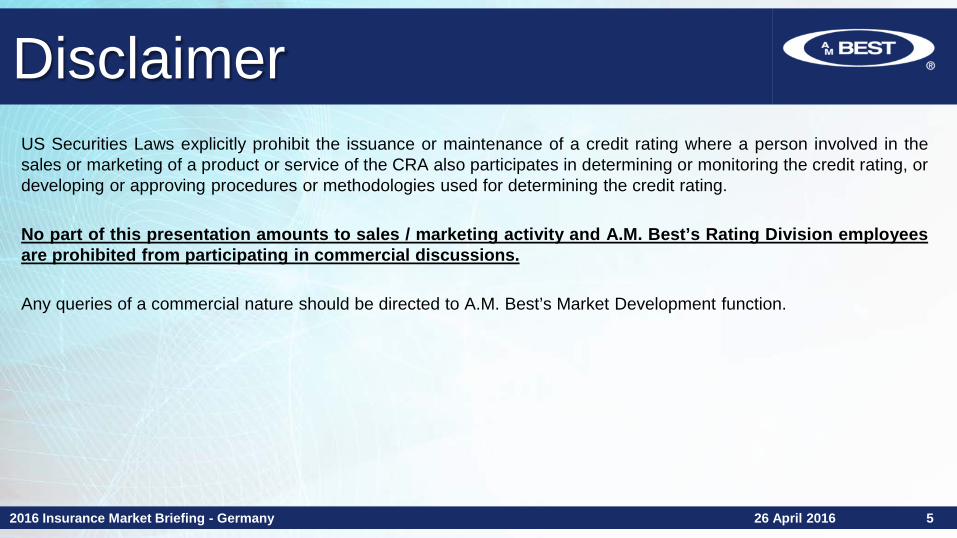
Disclaimer
2016 Insurance Market Briefing - Germany 26 April 2016 5
US Securities Laws explicitly prohibit the issuance or maintenance of a credit rating where a person involved in the sales or marketing of a product or service of the CRA also participates in determining or monitoring the credit rating, or developing or approving procedures or methodologies used for determining the credit rating.
No part of this presentation amounts to sales / marketing activity and A.M. Best’s Rating Division employees are prohibited from participating in commercial discussions.
Any queries of a commercial nature should be directed to A.M. Best’s Market Development function.

Der Rückversicherungsmarkt heute ... ... Chancen und Risiken
Ulrich Wallin, Vorstandsvorsitzender
A.M. Best Präsentation über den Versicherungsmarkt 2016 - Deutschland Köln, 26. April 2016

Die Rolle eines Rückversicherers
1
Erstversicherer Risiko Rückversicherer
Zugriff auf besondere Expertise
Innovationspartner
Realisierung von Geschäftsmöglichkeiten
Reduzierung der Ergebnisvolatilität
Bilanz- und Kapitalschutz

Die Top 15 Rückversicherer im Zeitvergleich
2
Prämien-Ranking 2004 in Mio. USD
Rang Unternehmensgruppe GebuchteBruttoprämie
1 Münchener Rück 30.5582 Swiss Re 28.0473 Berkshire Hathaway1) 13.0854 Hannover Rück 13.0535 Lloyd's 11.8836 GE Global Ins. Holdings2) 9.6317 XL Re 4.7648 Everest Re 4.7049 Transatlantic Re 4.14110 Partner Re 3.88811 Converium 3.84112 RGA Re 3.64913 SCOR 3.44914 London Re 3.06815 Odyssey Re 2.657
Quelle: A.M. Best; weitere Informationen für 2014: „Best‘s Review“ (September 2015) 1) GenRe Group, Berkshire Hathaway Re Group (National Indemnity) 2) ERC, GE Re, GE Frankona Group
Prämien-Ranking 2014 in Mio. USD
Unternehmensgruppe GebuchteBruttoprämie
Munich Re 39.035Swiss Re 33.276Hannover Rück 17.457Berkshire Hathaway Inc. 14.919SCOR 13.756Lloyd's 13.199RGA 9.118China Re 8.373PartnerRe 5.932Everest Re 5.749Korean Re 5.461Great West Lifeco 3.916Transatlantic Holdings 3.600General Insurance Corporation of India 2.428MAPFRE RE 2.255

Schaden-Rückversicherung weltweit betrachtet
3
Marktgröße und -konzentration 2015
Quelle: Eigene Recherche (weltweite Marktgröße basiert auf Schätzung von gesamt abgegebenen Prämien von Erstversicherern) Top 10: Munich Re, Swiss Re, Lloyd’s, Hannover Re, Berkshire, SCOR, China Re, PartnerRe, Everest Re, KoreanRe
Weiterer Anstieg des Anteils der Top 10
Sonstige 34 %
Top 11 - 50 22 %
Top 10 44 %
in Mrd. EUR 2011 2015 Δ CAGR
Top 10 67 84 +17 +5,7 %
Top 11 - 50 39 41 +2 +1,5 %
Sonstige 64 65 +1 +0,4 %
RV-Markt 170 190 +20 +2,8 %

Personen-Rückversicherung weltweit betrachtet
4
Marktgröße und -konzentration 2015
in Mrd. EUR 2011 2015 Δ CAGR
Top 5 37 50 +14 +8,3 %
Top 6 - 10 9 15 +6 +12,7 %
Top 11 - 50 3 3 0 0,0 %
RV-Markt 49 68 +19 +8,8 %
Quelle: Eigene Recherche (weltweite Marktgröße basiert auf Schätzung von gesamt abgegebenen Prämien von Erstversicherern) Top 10: Munich Re, Swiss Re, RGA, Hannover Re, SCOR, Berkshire (inkl. GenRe), Great West Lifeco, China Re, Korean Re, PartnerRe
Weitere Konzentration in den Top 5/Top 10
Top 5 75 %
Top 10 96 %
Top 11 - 50 4 %
Top 6 - 50 26 %
Top 5 74 %

Erhebliche Steigerung des Kapitals der Rückversicherer
5
340
400
470 455
505 540
575 565
2008 2009 2010 2011 2012 2013 2014 2015
Rückversicherungskapital* in Mrd. USD
Hat das Kapital seine Rekordhöhe erreicht?
* Für weitere Informationen: „The Aon Benfield Aggregate, Results for the Year Ended December 31, 2015“, Aon Benfield
CAGR +7,5 %
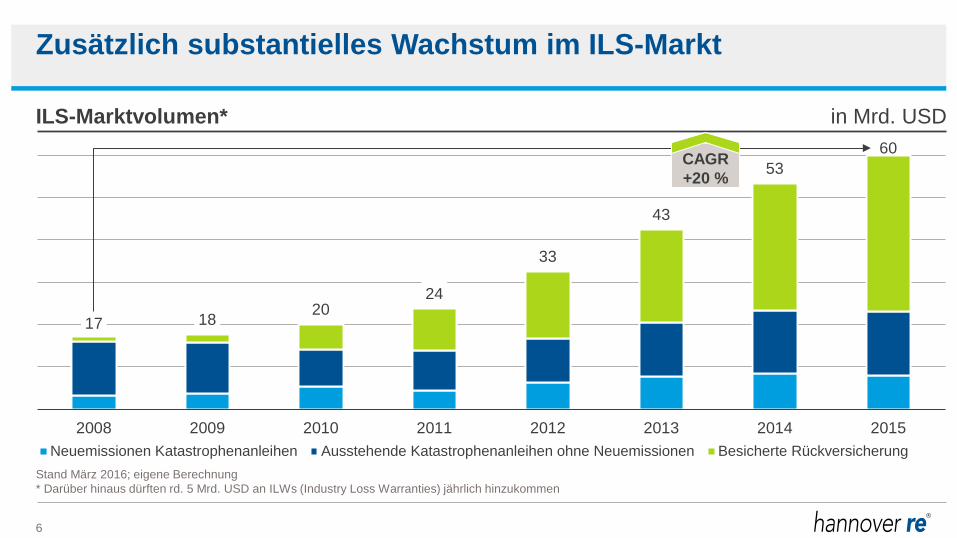
Zusätzlich substantielles Wachstum im ILS-Markt
6
17 18 20 24
33
43
53 60
2008 2009 2010 2011 2012 2013 2014 2015Neuemissionen Katastrophenanleihen Ausstehende Katastrophenanleihen ohne Neuemissionen Besicherte Rückversicherung
ILS-Marktvolumen* in Mrd. USD
Stand März 2016; eigene Berechnung * Darüber hinaus dürften rd. 5 Mrd. USD an ILWs (Industry Loss Warranties) jährlich hinzukommen
CAGR +20 %

Bedingungen im Rückversicherungsmarkt verbessern sich ...
7
Entwicklung EK-Rendite und Guy Carpenter Global Property Cat RoL Index
... wenn die Eigenkapitalrendite ausreichend niedrig ist
2.2%
17.3%
14.4%
0.4%
12.2% 10.4%
4.0%
13.2% 11.9% 10.9% 9.8%
175
195
215
235
255
275
295
315
335
355
0%
4%
8%
12%
16%
20%
24%
2005 2006 2007 2008 2009 2010 2011 2012 2013 2014 2015
EK-Rendite GC Global Property Cat RoL Index
Quelle: Guy Carpenter EK-Rendite basiert auf Unternehmensdaten (Top 10 des Global Reinsurance Index (GloRe) mit mehr als 50 % Rückversicherungsgeschäft), eigene Berechnung

Regulatorische Anforderungen (z. B. Solvency II, Sanktionen, Steuern…)
Starke Kapitalisierung/Überkapazität
Intensiver Wettbewerb (auch durch alternatives Kapital - ILS)
Neue Gefährdungslagen (Cyber, …)
Neue Risiken (z. B. Digitalisierung)
Anhaltend niedriges Zinsniveau, weiter Druck auf Kapitalanlageerträge
Regulatorische Anforderungen (zur EK-Ausstattung) steigern Nachfrage nach Rückversicherung
Absicherung von Wetterextremen
Demographischer Wandel
Neue Produkte (z. B. Landwirtschaft, Cyber)
Neue Risiken (z. B. Reputationsrisiken)
Neue Märkte (asiatische und lateinamerikanische Märkte)
Finanzierung und Rückversicherung von Neugründungen (Digitalisierung)
Mittelfristige Entwicklungen beeinflussen den RV-Sektor
8
Dauerhafte Wettbewerbsvorteile: Finanzkraft & langfristige Kundenbeziehungen

E+S Rück: Der Rückversicherer für Deutschland in der ...
9
... Hannover Rück Gruppe
* Mehrheitseigentümer HDI V.a.G.
>100 Tochtergesellschaften, Niederlassungen und Repräsentanzen
in ~20 Ländern
Inlandsgeschäft
64,8 %
Internationales Geschäft
8 deutsche Erstversicherer
49,8 %
Streubesitz Talanx AG*
50,2 %

NatKat-Modelle für unsere Kunden in Deutschland
10
E+S Rück - der Rückversicherer für Deutschland

Hannover Rück: Einer der profitabelsten Rückversicherer
11
EK-Rendite
4.0%
13.2% 11.9%
10.9% 9.8%
9.8%
12.8% 15.4% 15.0% 14.7% 14.7% 14.5%
0%
4%
8%
12%
16%
20%
2011 2012 2013 2014 2015 Ø 2011 - 2015Peer Gruppe* Hannover Rück Gruppe
Eigene Berechnung * EK-Rendite basiert auf Unternehmensdaten (Top 10 des Global Reinsurance Index (GloRe) mit mehr als 50 % Rückversicherungsgeschäft einschließlich HR)
Der Rückversicherungsmarkt heute ... ... Chancen und Risiken
Ulrich Wallin, Vorstandsvorsitzender
A.M. Best Präsentation über den Versicherungsmarkt 2016 - Deutschland Köln, 26. April 2016

Haftungsausschluss
Diese Präsentation ist nicht auf die Investitionsziele oder finanzielle Lage einer bestimmten Einzelperson oder juristischen Person ausgerichtet. Investoren sollten zu der Frage einer Investition in Aktien und sonstige Wertpapiere von Hannover Rück unabhängigen fachlichen Rat einholen und selbst eine gründliche Analyse der betreffenden Situation vornehmen.
Obwohl Hannover Rück sich bemüht hat, mit dieser Präsentation zuverlässige, vollständige und aktuelle Informationen zu liefern, kann das Unternehmen für die Richtigkeit, Vollständigkeit und Aktualität der Angaben keine Haftung übernehmen.
Bestimmte Aussagen in dieser Präsentation, die auf gegenwärtig zur Verfügung stehenden Informationen beruhen, sind in die Zukunft gerichtet oder enthalten bestimmte Erwartungen für die Zukunft. Solche Aussagen sind naturgemäß mit Risiken und Unsicherheiten behaftet. Umstände wie die allgemeine wirtschaftliche Entwicklung, zukünftige Marktbedingungen, außergewöhnliche Schadensbelastungen durch Katastrophen, Veränderungen der Kapitalmärkte und sonstige Umstände können dazu führen, dass die tatsächlichen Ereignisse oder Ergebnisse erheblich von den Vorhersagen der in die Zukunft gerichteten Aussagen abweichen.
Die Angaben in dieser Präsentation dienen allgemeinen Informationszwecken und sind weder ein Angebot noch Teil eines Angebotes oder einer sonstigen Aufforderung, von Hannover Rück begebene Wertpapiere zu erwerben, zu zeichnen oder zu veräußern.
© Hannover Rück SE. Alle Rechte vorbehalten. Hannover Re ist das eingetragene Markenzeichen von Hannover Rück SE.

2016 Insurance Market Briefing - Germany
2016 Insurance Market Briefing - Germany 26 April 2016 20
Carlos Wong-Fupuy Senior Director
Natural Catastrophe Schemes in Europe

Nat Cat up on the agenda
2016 Insurance Market Briefing - Germany 26 April 2016 21
Climate change (flood and
windstorm risks)
Pressures - fiscal budgets The State - shrinking role
Increased urbanisation Exposure concentration

The Insurance Gap
2016 Insurance Market Briefing - Germany 26 April 2016 22
Date Event Location Deaths
Economic Loss (USD bn)
Insured Loss (USD bn)
Dec. 22-31 Flooding United Kingdom N/A 2 .5 1 .3
Mar. 29-Apr. 1 Windstorms Mike and Niklas Western and Central Europe
9 1.4 1.0
Oct.3-4 Flooding France 19 1.3 0.7
Jul.-Dec. Drought South Africa N/A 2.0 0.3
Jan. 9-11 Windstorms Elon and Felix Western and Northern Europe N/A 0.7 0.4
Source: Aon Benfield, 2015 Annual Global Climate and Catastrophe Report

Need for public / private partnership
2016 Insurance Market Briefing - Germany 26 April 2016 23
Prevention Mitigation
Risk transfer Recovery
State Infrastructure
Education Assistance
Re-construction Compulsion
Subsidies Guarantees
Private Sector
Risk pricing Deductibles
Exclusion
Claims payment Technical assistance
Technical expertise Risk modelling
Operational support

Challenges that Nat Cat schemes face
2016 Insurance Market Briefing - Germany 26 April 2016 24
Anti-selection Competition
High penetration? Bundling
State Guarantee?
Private or Public
Flat Pricing? Coverage
Compulsion?

Preparedness in Europe
2016 Insurance Market Briefing - Germany 26 April 2016 25
Flood Earthquake • Nat Cat Schemes: NDCS/CCR (France), CCS (Spain), Flood Re (UK)
• Spain: high penetration, tempered by inclusion of motor lines (flood)
• Germany: low penetration household insurance (flood)
• Italy: low penetration in general, high exposure to earthquake 50
90
90 90
30
30 5 50
90
90 90
18
5 5
5 90
Source: European Union Commission

France – Natural Disasters Compensation Scheme / CCR
2016 Insurance Market Briefing - Germany 26 April 2016 26

Spain – Consorcio de Compensacion de Seguros
2016 Insurance Market Briefing - Germany 26 April 2016 27

UK – Flood Re
2016 Insurance Market Briefing - Germany 26 April 2016 28

Germany
2016 Insurance Market Briefing - Germany 26 April 2016 29
• Main perils flood and windstorms • Increased awareness due to flood and hailstorm losses
in 2013 • Availability vs affordability • High penetration on basic policies (excl nat cat) • 99% of nat cat risks insurable, but only 35%
penetration on flood for households • Key difference with other markets: optionality • Recent experience reliant on post-event assistance
from local governments
Overview

Italy
2016 Insurance Market Briefing - Germany 26 April 2016 30
• Main risks: earthquake and flood • Low penetration rates in household insurance (< 40%) • Earthquake losses:
• L’Aquila (2009): € 10bn economic losses vs € 250m insurance claims
• Emilia Romagna (2012): € 12bn economic losses vs € 1bn insurance claims
• Discussions between ANIA and the government: • Increasing penetration rates. Compulsion (?) • Reduction or elimination of rates on premiums. • State guarantee
Overview

Conclusions
2016 Insurance Market Briefing - Germany 26 April 2016 31
• Prevalence of flood risks in most countries (earthquake in Italy)
• Increased awareness due to climate change
• No “one size fits all” solution • Need for public/private partnership
initiatives • High penetration as a requirement, not
a consequence
• Nat cat schemes are a complement, not a substitute to the private sector
• Incentives and restrictions to limit adverse selection are key
• Need for a solid technical framework that ensures the long term financial viability of the model

2016 Insurance Market Briefing - Germany
2016 Insurance Market Briefing - Germany 26 April 2016 32
Carlos Wong-Fupuy Senior Director
Q&A

2016 Insurance Market Briefing - Germany
2016 Insurance Market Briefing - Germany 26 April 2016 33
Ghislain Le Cam Associate Director, Analytics
Global Reinsurance Market Trends
Discussion Outline
2016 Insurance Market Briefing - Germany 26 April 2016 34
Global Economic Conditions
Global Reinsurance Results and Trends
The Merger and Acquisition Phase
Challenges and Impact of Alternative Capital
2016 Outlook

Global Reinsurance
2016 Insurance Market Briefing - Germany 26 April 2016 35
Global Economic Conditions
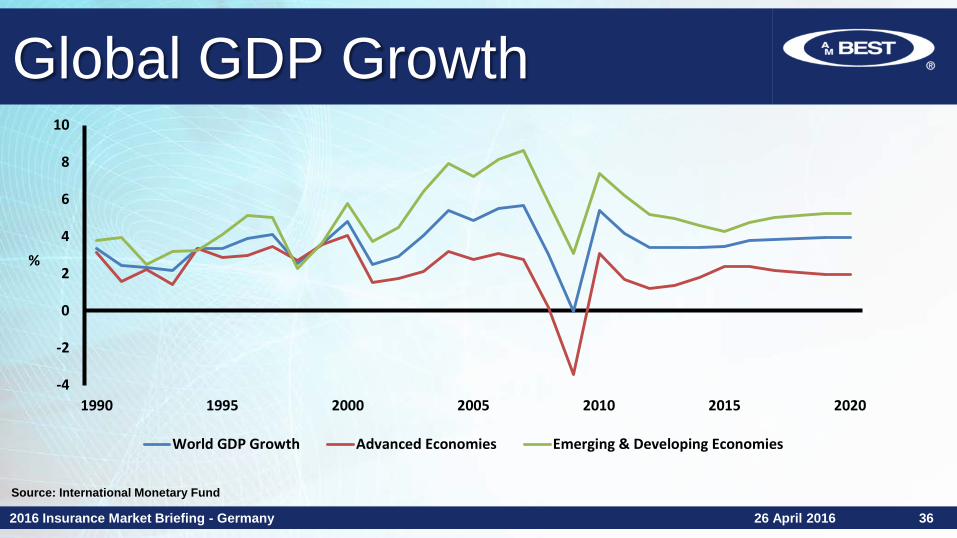
Global GDP Growth
2016 Insurance Market Briefing - Germany 26 April 2016 36
-4
-2
0
2
4
6
8
10
1990 1995 2000 2005 2010 2015 2020
World GDP Growth Advanced Economies Emerging & Developing Economies
%
Source: International Monetary Fund

Interest Rate Environment
2016 Insurance Market Briefing - Germany 26 April 2016 37
0
1
2
3
4
5
6
7
2000 2005 2010 2015
%
US Japan
UK Germany
Source: OECD, Bank of Japan and Federal Reserve
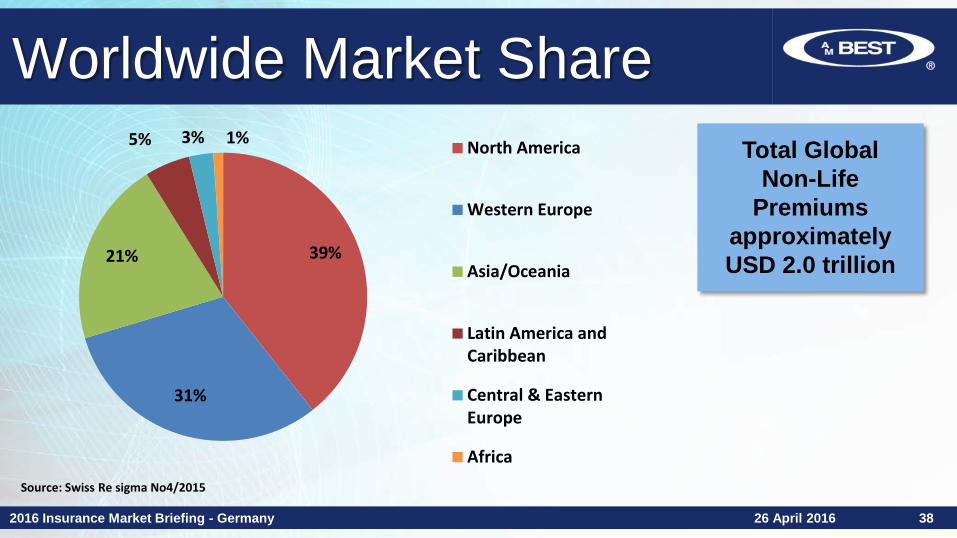
Worldwide Market Share
2016 Insurance Market Briefing - Germany 26 April 2016 38
39%
31%
21%
5% 3% 1% North America
Western Europe
Asia/Oceania
Latin America andCaribbean
Central & EasternEurope
AfricaSource: Swiss Re sigma No4/2015
Total Global Non-Life
Premiums approximately USD 2.0 trillion

Global Reinsurance
2016 Insurance Market Briefing - Germany 26 April 2016 39
Global Reinsurance Results and
Trends

2015 Stock Price Change
2016 Insurance Market Briefing - Germany 26 April 2016 40
-55
-45
-35
-25
-15
-5
5
15
25
35
%
Through December 31, 2015 YTD Price Change Avg Chg Reinsurer YTD S&P 500 Chg
Source: Bloomberg, Yahoo, company websites

Underwriting Profitability
2016 Insurance Market Briefing - Germany 26 April 2016 41
63.8% 76.1%
60.7% 56.4% 56.4% 56.2% 62.7%
31.6%
31.3%
31.3% 32.2% 33.1% 34.2% 31.9%
95.4%
107.4%
92.0% 88.6% 89.5% 90.4% 94.6%
0%
5%
10%
15%
20%
25%
30%
35%
40%
45%
50%
0%
20%
40%
60%
80%
100%
120%
2010 2011 2012 2013 2014 2015 5yr Avg
Loss Ratio Expense Ratio Fav. Loss Dev.

Operating Returns
2016 Insurance Market Briefing - Germany 26 April 2016 42
10.6%
2.5%
12.1%
13.1%
11.4%
9.5%
0%
2%
4%
6%
8%
10%
12%
14%
2010 2011 2012 2013 2014 2015
ROE 5yr Avg

Current Market Conditions
2016 Insurance Market Briefing - Germany 26 April 2016 43
It’s a “buyer’s market”
Primary companies retaining
more
Increased use of alternative
capacity
Terms and conditions broadened
Rate on line under
pressure – especially loss-free business
Industry consolidation is creating a ripple effect

Catastrophe Rates
2016 Insurance Market Briefing - Germany 26 April 2016 44
Global Reinsurance – Catastrophe Rate on Line Index
0%
50%
100%
150%
200%
250%
300%
350%
400%US Asia - Pacific UK Europe
9/11 Attacks KRW*
IKE Japan EQ
Andrew Sandy
Source: AM Best Research, Guy Carpenter & Co LLC * Hurricanes Katrina, Rita & Wilma

Reinsurance Capacity Utilization
2016 Insurance Market Briefing - Germany 26 April 2016 45
Source: A.M. Best research and data
81% 76%
73%
50
60
70
80
90
100
2012 2013 2014
%
Capacity Utilization Based on Aggregate Risk-Adjusted Capitalization of Rated Balance Sheets

2015 Capital Management
2016 Insurance Market Briefing - Germany 26 April 2016 46
0
500
1,000
1,500
2,000
2,500
3,000
3,500
(USD
mill
ions
)
2015 Share Repurchases & Dividends Paid
Dividends Share Repurchases
Source: Company reports

Global Reinsurance
2016 Insurance Market Briefing - Germany 26 April 2016 47
The M&A Phase
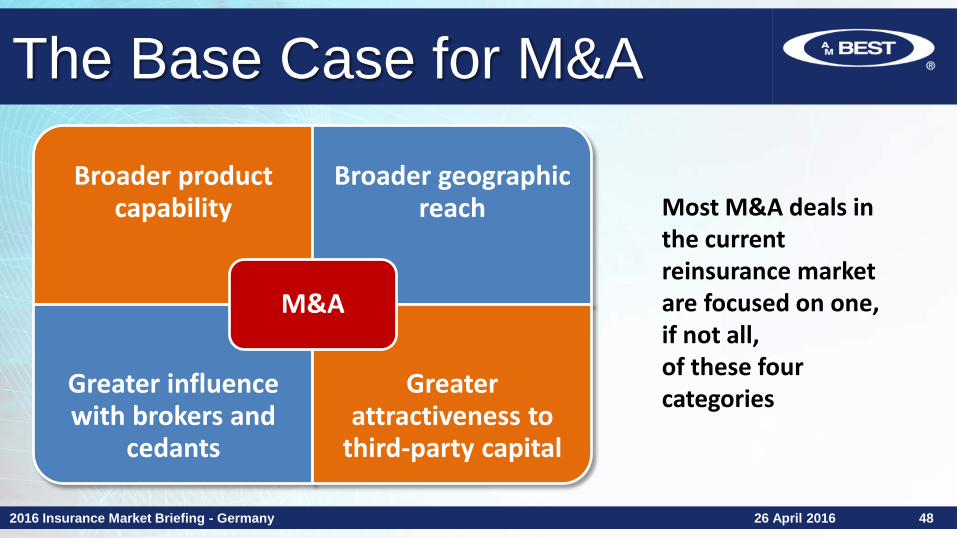
The Base Case for M&A
2016 Insurance Market Briefing - Germany 26 April 2016 48
Broader product capability
Broader geographic reach
Greater influence with brokers and
cedants
Greater attractiveness to
third-party capital
M&A
Most M&A deals in the current reinsurance market are focused on one, if not all, of these four categories

The Drive for Efficiency
2016 Insurance Market Briefing - Germany 26 April 2016 49
The market will continue to
become more efficient as
all players strive to become
closer to the client
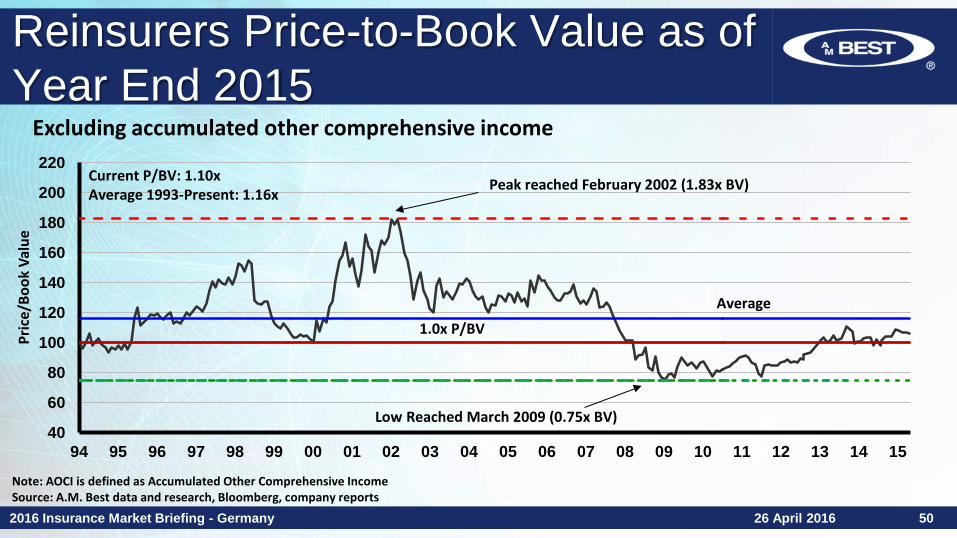
Note: AOCI is defined as Accumulated Other Comprehensive Income Source: A.M. Best data and research, Bloomberg, company reports
Reinsurers Price-to-Book Value as of Year End 2015
2016 Insurance Market Briefing - Germany 26 April 2016 50
40
60
80
100
120
140
160
180
200
220
94 95 96 97 98 99 00 01 02 03 04 05 06 07 08 09 10 11 12 13 14 15
Pric
e/Bo
ok V
alue
Average
Current P/BV: 1.10x Average 1993-Present: 1.16x
Low Reached March 2009 (0.75x BV)
Peak reached February 2002 (1.83x BV)
1.0x P/BV
Excluding accumulated other comprehensive income
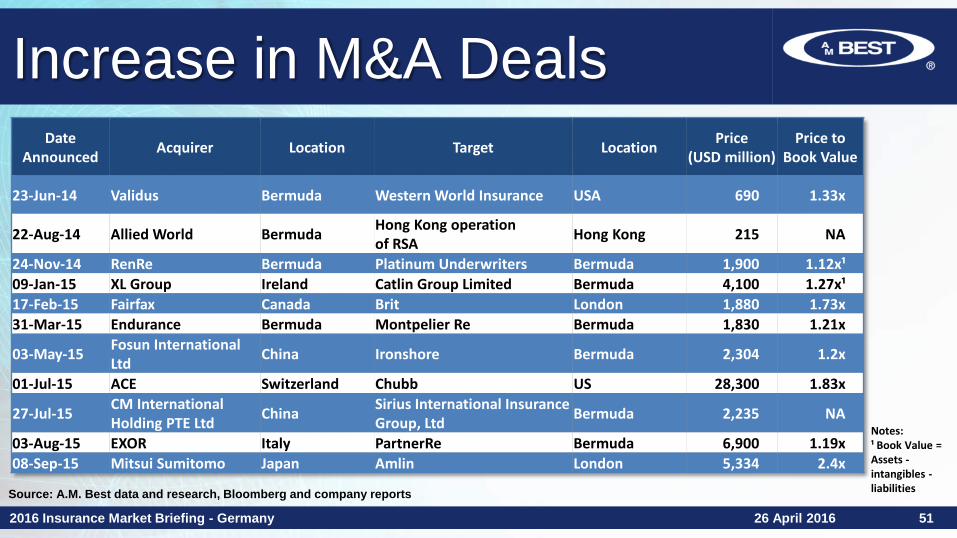
Increase in M&A Deals
2016 Insurance Market Briefing - Germany 26 April 2016 51
Date Announced Acquirer Location Target Location Price
(USD million) Price to
Book Value
23-Jun-14 Validus Bermuda Western World Insurance USA 690 1.33x
22-Aug-14 Allied World Bermuda Hong Kong operation of RSA Hong Kong 215 NA
24-Nov-14 RenRe Bermuda Platinum Underwriters Bermuda 1,900 1.12x¹ 09-Jan-15 XL Group Ireland Catlin Group Limited Bermuda 4,100 1.27x¹ 17-Feb-15 Fairfax Canada Brit London 1,880 1.73x 31-Mar-15 Endurance Bermuda Montpelier Re Bermuda 1,830 1.21x
03-May-15 Fosun International Ltd China Ironshore Bermuda 2,304 1.2x
01-Jul-15 ACE Switzerland Chubb US 28,300 1.83x
27-Jul-15 CM International Holding PTE Ltd China Sirius International Insurance
Group, Ltd Bermuda 2,235 NA
03-Aug-15 EXOR Italy PartnerRe Bermuda 6,900 1.19x 08-Sep-15 Mitsui Sumitomo Japan Amlin London 5,334 2.4x
Notes: ¹ Book Value = Assets - intangibles - liabilities Source: A.M. Best data and research, Bloomberg and company reports

Global Reinsurance
2016 Insurance Market Briefing - Germany 26 April 2016 52
Challenges and Impact of
Alternative Capital

Alternative Capital
2016 Insurance Market Briefing - Germany 26 April 2016 53
Market still heavily influenced
by global leaders –
that won’t change anytime soon
Cultural issues no longer
limiting M&A – it is happening
Alternative capacity is driving change
Alternative capital is driving a great deal of structural change in the market
However, do not lose sight of the fact that the market continues to be heavily influenced by the global reinsurance leaders

Dedicated Reinsurance Capacity
2016 Insurance Market Briefing - Germany 26 April 2016 54
Total Dedicated Reinsurance Capacity (USD billions)
292 320 340 332
19 48
60 68
0
50
100
150
200
250
300
350
400
450
2012 2013 2014 2015E*Traditional Capacity Convergence Capacity
Note: * Estimate by Guy Carpenter and A.M. Best Source: A.M. Best, Guy Carpenter

CAT Bond Issuances
2016 Insurance Market Briefing - Germany 26 April 2016 55
CAT Bonds Issued and Outstanding
0
4
8
12
16
20
24
28
1997
1998
1999
2000
2001
2002
2003
2004
2005
2006
2007
2008
2009
2010
2011
2012
2013
2014
2015
(USD
bill
ions
)
CAT Bonds OutstandingSource: A.M. Best, Artemis

Convergence Products
2016 Insurance Market Briefing - Germany 26 April 2016 56
Basis Risk – The risk that a convergence instrument may not fully trigger when the sponsor suffers a loss
Tail Risk – The risk borne by a sponsor if an entity to which it cedes business is insufficiently capitalised
Credit, Default and Recovery Risk – Transactions that involve payment obligations from third parties
Investment Performance Risk – For transactions that rely on investment earnings and return on investments
Structuring Risk – Transactions involving securitizations where cash flows are an essential source of investor repayment
Modelling Risk – Transaction where modelling performed by third-party consulting firms
Risks associated with convergence products

Global Reinsurance
2016 Insurance Market Briefing - Germany 26 April 2016 57
Reinsurance Rating Outlook

Today’s Reinsurance Market…
2016 Insurance Market Briefing - Germany 26 April 2016 58
Negative Outlook
Increased client
retentions
Excess capacity
Convergence capital
Benign cat losses
Questionable underwriting
discipline
Declining reserve
redundancies
Low investment
yields

2016 Insurance Market Briefing - Germany
2016 Insurance Market Briefing - Germany 26 April 2016 59
Ghislain Le Cam Associate Director, Analytics
Q&A

A.M. Best Präsentation über den Versicherungsmarkt
A.M. Best Präsentation über den Versicherungsmarkt 26 April 2016 60
Mock Rating Committee & Vote Konstantin Langowski
Financial Analyst
Carlos Wong-Fupuy Senior Director
Ghislain Le Cam Associate Director, Analytics
Charlotte Vigier Senior Financial Analyst
Greg Carter Managing Director, Analytics

• A.M. Best rating actions determined by a Rating Committee
• Rating actions include: – affirmations – upgrades and downgrades – initial ratings – placement of ratings under
review
• Responsible analyst produces rating package and proposes rating action
• Rating Committee deliberates on the proposed action and determines the rating action
Mock Rating Committee and Vote Introduction
A.M. Best Präsentation über den Versicherungsmarkt 61 26 April 2016

• Voting quorum – minimum of six members, including at least two senior members
• Voting order: – Responsible analyst and team
leader – All other members in reverse
order of seniority
• Simple majority vote is acceptable for the approval of any rating action
• Chair of the Rating Committee can break a tie or refer the decision to a higher committee
• Voting members must have no conflicts of interest, but must have relevant experience and have passed compliance requirements
Mock Rating Committee and Vote Voting
A.M. Best Präsentation über den Versicherungsmarkt 62 26 April 2016
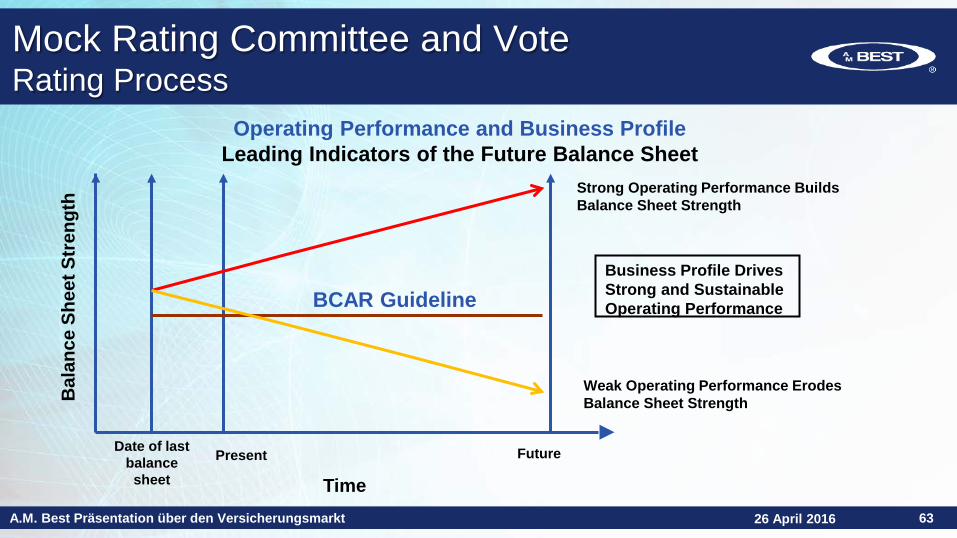
Mock Rating Committee and Vote Rating Process
Strong Operating Performance Builds Balance Sheet Strength
Weak Operating Performance Erodes Balance Sheet Strength
Date of last balance
sheet Present Future
Operating Performance and Business Profile Leading Indicators of the Future Balance Sheet
Bal
ance
She
et S
tren
gth
Time
BCAR Guideline Business Profile Drives Strong and Sustainable Operating Performance
A.M. Best Präsentation über den Versicherungsmarkt 63 26 April 2016

Introduction BMF Insurance Company
• New rating for a subsidiary of an already rated group
• Recommendation: stand-alone assessment of ‘a’, stable outlook
ERM
Adequate
Good Business Profile
Stable Operating Performance
Solid Risk-Adjusted Capitalisation and
Balance Sheet Strength
Note: ERM = Enterprise Risk Management
A.M. Best Präsentation über den Versicherungsmarkt 64 26 April 2016

Business Profile - BMF Insurance Company Overview
• Domiciled in a small European country
• Country Risk Tier 1 – stable operating environment
• BMF Insurance Company (BMF) established 70 years ago and is owned 100% by Windermere Insurance Group (UK) plc
• Good competitive position: – third-largest insurer in its country of domicile – in-depth knowledge and experience of the local market
A.M. Best Präsentation über den Versicherungsmarkt 65 26 April 2016

• Well diversified insurance portfolio by line of business
Business Profile - BMF Insurance Company Business split
6% 5% 6%
34% 36% 37%
40% 38% 40%
11% 15% 11% 9% 6% 6%
0%10%20%30%40%50%60%70%80%90%
100%
2013 2014 2015
PA and Health Motor and Third-Party LiabilityFire and Property MarineMisc
A.M. Best Präsentation über den Versicherungsmarkt 66 26 April 2016

• GWP increased by 11% during 2015, driven by increase in motor and property business
• High competition in local market
• Planned growth driven by higher volume and moderate rate increases
Business Profile - BMF Insurance Company Gross Written Premium (GWP) development
050
100150200250300350400450500
2011 2012 2013 2014 2015 2016e 2017eEU
R m
illio
ns
Gross Written Premium Net Written Premium
A.M. Best Präsentation über den Versicherungsmarkt 67 26 April 2016

• Geographically concentrated, only writing local business
• Plans to open a branch in a neighbouring country in 2017 to diversify geographically
• Growth of 10 - 15% expected over each of the next three years, includes growth via new branch
• New branch represents execution risk
Business Profile - BMF Insurance Company Business plans
A.M. Best Präsentation über den Versicherungsmarkt 68 26 April 2016
• Business profile supports the recommendation:
– Good market position, competitive advantage – Strong brand recognition – Diverse product offering – Offset by geographical concentration – Diversification via branch comes with execution risk
Business Profile - BMF Insurance Company Summary
A.M. Best Präsentation über den Versicherungsmarkt 69 26 April 2016
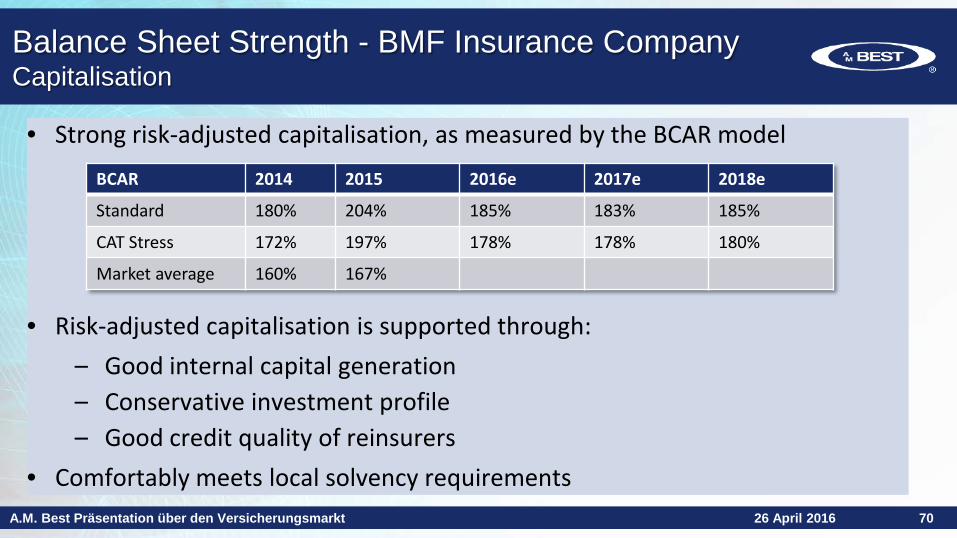
• Strong risk-adjusted capitalisation, as measured by the BCAR model
• Risk-adjusted capitalisation is supported through: – Good internal capital generation – Conservative investment profile – Good credit quality of reinsurers
• Comfortably meets local solvency requirements
BCAR 2014 2015 2016e 2017e 2018e
Standard 180% 204% 185% 183% 185%
CAT Stress 172% 197% 178% 178% 180%
Market average 160% 167%
Balance Sheet Strength - BMF Insurance Company Capitalisation
A.M. Best Präsentation über den Versicherungsmarkt 70 26 April 2016

• Historically: significant exposure to Peripheral European Sovereign Debt
• De-risked portfolio in 2015, leading to improvement in risk-adjusted capitalisation
Balance Sheet Strength - BMF Insurance Company Investments
42% 41%
62%
30% 28%
7%
20% 23% 21%
6% 4% 5%
0%10%20%30%40%50%60%70%80%90%
100%
2013 2014 2015
Fixed income Peripheral European Sovereign DebtPublic Equity Mutual fundsProperty
A.M. Best Präsentation über den Versicherungsmarkt 71 26 April 2016
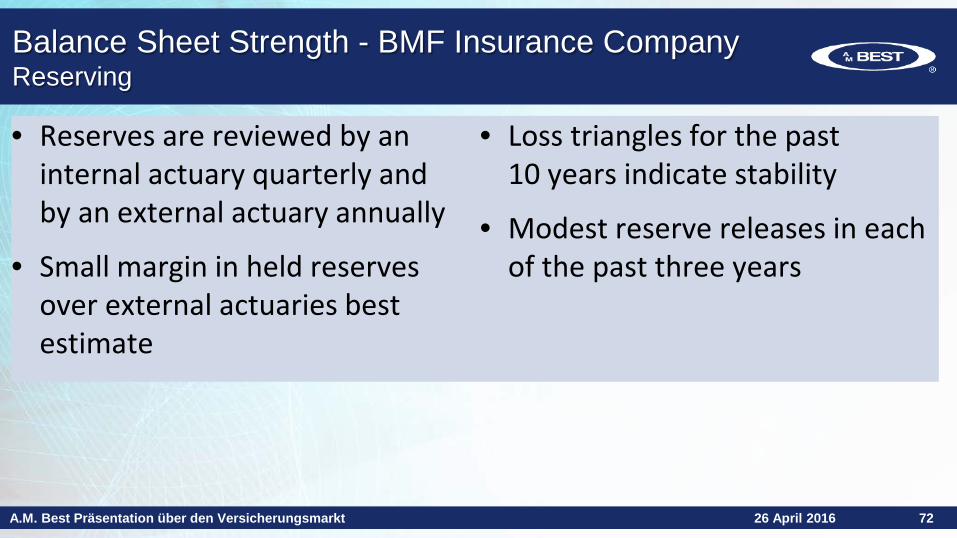
• Reserves are reviewed by an internal actuary quarterly and by an external actuary annually
• Small margin in held reserves over external actuaries best estimate
• Loss triangles for the past 10 years indicate stability
• Modest reserve releases in each of the past three years
Balance Sheet Strength - BMF Insurance Company Reserving
A.M. Best Präsentation über den Versicherungsmarkt 72 26 April 2016

• Reinsurance includes both proportional and non-proportional arrangements
• 92% of reinsurers are rated “A-” or above
• Limited cat risk in local market, earthquake risk is borne by state reinsurer
Balance Sheet Strength - BMF Insurance Company Reinsurance
A.M. Best Präsentation über den Versicherungsmarkt 73 26 April 2016

• Balance sheet strength is supportive of the recommended rating
• Solid risk-adjusted capitalisation
• Good internal capital generation to support planned growth
• Investment risk has reduced
• Stable reserve development
• Limited CAT risk
• Comprehensive reinsurance with high quality panel
Balance Sheet Strength - BMF Insurance Company Summary
A.M. Best Präsentation über den Versicherungsmarkt 74 26 April 2016

• Good return on equity, averaging 12% over the last five years
Operating Performance - BMF Insurance Company Overall performance
16
-11
19 20 21 22 23
7
7
7 6 3 5 6
-2
2
4 2
-3
1 1
-15
-10
-5
0
5
10
15
20
25
30
35
2011 2012 2013 2014 2015 2016e 2017e
EUR
mill
ions
Technical profit Investment Income Fair Value gains
A.M. Best Präsentation über den Versicherungsmarkt 75 26 April 2016

• Diverse product range has supported stable underwriting performance
• Combined ratios average 93% over the past five years
Operating Performance - BMF Insurance Company Underwriting
40%
50%
60%
70%
80%
90%
100%
2011 2012 2013 2014 2015
Loss
ratio
PA and Health Motor and Third-Party LiabilityFire and Property MarineMisc
A.M. Best Präsentation über den Versicherungsmarkt 76 26 April 2016

2011 2012 2013 2014 2015 2016e 2017e
BMF Combined ratio 91% 105% 93% 94% 92% 93% 96%
Market average 92% 103% 95% 95% 94%
Operating Performance - BMF Insurance Company Underwriting
• Combined ratio better than market in last three years
• Expected to increase in 2017 due to higher expenses of new branch
A.M. Best Präsentation über den Versicherungsmarkt 77 26 April 2016

• Investment yield reduced due to sale of high-risk assets
• Reinvestment rate reducing year on year – currently 2.5%
Operating Performance - BMF Insurance Company Investment income
2011
2012 2013
2014
2015 2016e
2.0%
2.2%
2.4%
2.6%
2.8%
3.0%
3.2%
3.4%
3.6%
3.8%Investment Yield
A.M. Best Präsentation über den Versicherungsmarkt 78 26 April 2016

• Operating performance is supportive of the recommended rating
– Stable underwriting performance – Modest investment income reflective of low-risk strategy – Generally outperforms peers
Operating Performance - BMF Insurance Company Summary
A.M. Best Präsentation über den Versicherungsmarkt 79 26 April 2016

Enterprise Risk Management BMF Insurance Company
A.M. Best Präsentation über den Versicherungsmarkt 80 26 April 2016
Principal areas of focus – Risk Categories
• Product & Underwriting Risk
• Reserving Risk
• Concentration Risk
• Reinsurance Risk
• Financial Flexibility Risk
• Investment Risk
• Legislative/Regulatory/ Judicial/Economic Risk
• Management Risk
• Operational Risk
• Risk Appetite/Stress Testing

Enterprise Risk Management BMF Insurance Company
A.M. Best Präsentation über den Versicherungsmarkt 81 26 April 2016
• Product & Underwriting Risk
• Reserving Risk
• Concentration Risk
• Reinsurance Risk
• Financial Flexibility Risk
• Investment Risk
• Legislative/Regulatory/ Judicial/Economic Risk
• Management Risk
• Operational Risk
• Risk Appetite/Stress Testing

Recommendation: a standalone assessment of ‘a’, stable outlook
Summary BMF Insurance Company
Supporting factors Offsetting factors Good business profile in local market Geographically concentrated
Well diversified by line of business Execution risk associated with planned expansion
Solid risk-adjusted capitalisation
Stable underwriting performance
A.M. Best Präsentation über den Versicherungsmarkt 82 26 April 2016
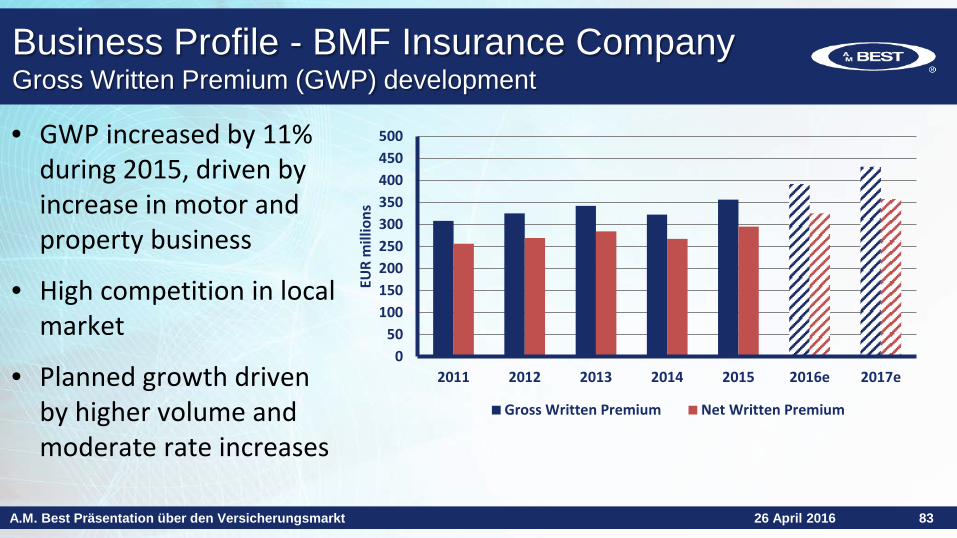
• GWP increased by 11% during 2015, driven by increase in motor and property business
• High competition in local market
• Planned growth driven by higher volume and moderate rate increases
Business Profile - BMF Insurance Company Gross Written Premium (GWP) development
050
100150200250300350400450500
2011 2012 2013 2014 2015 2016e 2017eEU
R m
illio
ns
Gross Written Premium Net Written Premium
A.M. Best Präsentation über den Versicherungsmarkt 83 26 April 2016

2011 2012 2013 2014 2015 2016e 2017e
BMF Combined ratio 91% 105% 93% 94% 92% 93% 96%
Market average 92% 103% 95% 95% 94%
Operating Performance - BMF Insurance Company Underwriting
• Combined ratio better than market in last three years
• Expected to increase in 2017 due to higher expenses of new branch
A.M. Best Präsentation über den Versicherungsmarkt 84 26 April 2016

• Strong risk-adjusted capitalisation, as measured by the BCAR model
• Risk-adjusted capitalisation is supported through: – Good internal capital generation – Conservative investment profile – Good credit quality of reinsurers
• Comfortably meets local solvency requirements
BCAR 2014 2015 2016e 2017e 2018e
Standard 180% 204% 185% 183% 185%
CAT Stress 172% 197% 178% 178% 180%
Market average 160% 167%
Balance Sheet Strength - BMF Insurance Company Capitalisation
A.M. Best Präsentation über den Versicherungsmarkt 85 26 April 2016

Considerations for rating enhancement BMF Insurance Company
Implicit support • Level of integration • Brand name • Contribution to earnings • Contribution to growth
Explicit support • Financial guarantee • Reinsurance support
A.M. Best Präsentation über den Versicherungsmarkt 86 26 April 2016

Rating Enhancement Ownership - BMF Insurance Company
• BMF is owned 100% by Windermere Insurance Limited (UK) Plc (Windermere)
• Windermere acquired BMF in 2004
• Windermere has operations in the UK and Continental Europe
• Windermere is rated as ‘aa-’ with a stable outlook by A.M. Best
A.M. Best Präsentation über den Versicherungsmarkt 87 26 April 2016

Windermere Insurance Group (UK) Plc
Windermere Insurance Limited (UK)
BMF Insurance Company (Europe)
Windermere Insurance (Poland)
Rating Enhancement Structure - BMF Insurance Company
Rated ‘aa-’ stable
Recommended ‘a+’ stable
Rated ‘aa-’ stable
A.M. Best Präsentation über den Versicherungsmarkt 88 26 April 2016

Recommendation of one-notch of rating enhancement Published rating of ‘a+’ with a stable outlook
Rating Enhancement Summary - BMF Insurance Company
Support factors Offsetting factors Shared IT and HR systems Does not carry the Windermere brand name
Shared pricing tools No financial guarantee or net worth maintenance agreement from Group
Good level of oversight and monitoring controls from Windermere
No reinsurance support from Group
Group earnings: contributes 15% and will be the driver of Group’s growth in Europe
A.M. Best Präsentation über den Versicherungsmarkt 89 26 April 2016

Windermere Insurance Group (UK) Plc
Windermere Insurance Limited (UK)
BMF Insurance Company (Europe)
Windermere Insurance (Poland)
Rating Enhancement Structure - BMF Insurance Company
Rated ‘aa-’ stable
Recommended ‘a+’ stable
Rated ‘aa-’ stable
A.M. Best Präsentation über den Versicherungsmarkt 90 26 April 2016

A.M. Best Präsentation über den Versicherungsmarkt
A.M. Best Präsentation über den Versicherungsmarkt 26 April 2016 91
Konstantin Langowski Financial Analyst
Q&A

2016 Insurance Market Briefing - Germany
Hyatt Regency Köln
26 April 2016