Embed Size (px)
Citation preview
MILLIMAN REPORT
2018 Embedded Value Results: Asia Shifting strategies in search of growth
August 2019
Paul Sinnott
Michael Daly
Richard Holloway
Wing Wong
Chihong An
Wen Yee Lee
Stephen Conwill
MILLIMAN REPORT
Table of Contents
OPENING REMARKS ............................................................................................................................................ 1
EXECUTIVE SUMMARY ........................................................................................................................................ 2
Background ........................................................................................................................................................ 2
EV results ........................................................................................................................................................... 3
New business results ......................................................................................................................................... 5
New business margins ....................................................................................................................................... 7
Recent and upcoming regulatory changes ......................................................................................................... 9
INTRODUCTION AND BACKGROUND ............................................................................................................... 12
OVERVIEW OF EMBEDDED VALUE .................................................................................................................. 16
History of EV reporting ..................................................................................................................................... 16
EV in Asia ......................................................................................................................................................... 17
Components of EV ........................................................................................................................................... 18
TEV vs. EEV vs. MCEV .................................................................................................................................... 20
Indian EV .......................................................................................................................................................... 20
EMBEDDED VALUE RESULTS ........................................................................................................................... 21
Recent updates on reported disclosures .......................................................................................................... 21
EV in Asia ......................................................................................................................................................... 22
EV by Company ............................................................................................................................................... 24
VNB in Asia ...................................................................................................................................................... 27
VNB by Company ............................................................................................................................................. 29
New business margins in Asia ......................................................................................................................... 31
Detailed market analysis .................................................................................................................................. 32
CHINA ..................................................................................................................................................... 33
HONG KONG ......................................................................................................................................... 35
INDIA ...................................................................................................................................................... 37
INDONESIA ............................................................................................................................................ 39
JAPAN .................................................................................................................................................... 40
MALAYSIA .............................................................................................................................................. 42
SINGAPORE .......................................................................................................................................... 44
SOUTH KOREA ...................................................................................................................................... 46
TAIWAN .................................................................................................................................................. 48
THAILAND .............................................................................................................................................. 50
VIETNAM ................................................................................................................................................ 53
METHODOLOGY HOT TOPICS ........................................................................................................................... 55
Construction of risk discount rate ..................................................................................................................... 55
Investment return assumptions ........................................................................................................................ 63
Expense overruns ............................................................................................................................................ 63
Cost of capital .................................................................................................................................................. 63

MILLIMAN REPORT
Time value of options and guarantees ............................................................................................................. 66
DISCLOSURES .................................................................................................................................................... 68
OTHER MEASURES OF VALUE ......................................................................................................................... 71
Market capitalisation......................................................................................................................................... 71
IFRS17 ............................................................................................................................................................. 71
APPENDIX A: TOTAL ASIAN EV BY COMPANY BY TERRITORY ................................................................... 74
APPENDIX B: EXCHANGE RATES ..................................................................................................................... 76
MILLIMAN REPORT
2018 Embedded Value Results: Asia 1 August 2019
Opening remarks Thank you for taking the time to read the latest edition of Milliman’s Asian embedded value (EV) report.
The main change from our previous reports is that, starting this year, we are including EV results from Japan
within our year-end and mid-year Asian EV reports. We had previously included Japan results within our
European reports, given the similarities in market-consistent EV methodologies used in these markets.
Asia’s economic growth remained strong in 2018, helping several of the region’s emerging markets post
positive percentage rises in life insurance gross written premiums for the year. The past year also saw the
emergence of various global and domestic economic headwinds, primarily from a shift towards protectionism
in many major economies. Growth in EV was positive across almost all Asian markets. New business margins
generally continued to increase, especially for those insurers that have successfully reoriented their product
strategies from savings to protection business.
Our report compares and contrasts the various different approaches taken to EV reporting across Asian markets
and insurers. A further report containing commentary on the reported mid-year 2019 EV results, as well as any
2018 year-end reporting not disclosed in time for this report, will be produced later in the year. A report on
shareholder value reporting in Europe will be available in September 2019.
Once again, we would appreciate any feedback you have on our report content and format.
Best regards,
Paul Sinnott
Michael Daly
Richard Holloway
Wing Wong
Chihong An
Wen Yee Lee
Stephen Conwill
MILLIMAN REPORT
2018 Embedded Value Results: Asia 2 August 2019
Executive summary
BACKGROUND
Asia’s economic performance continues to be strong, with 5.5% gross domestic product (GDP1) growth recorded
for 2018, compared with the overall global GDP growth of 3.6%. India, Vietnam and China posted the highest
2018 GDP growth rates of 7.1%, 7.1% and 6.6%, respectively.
Total estimated gross written premium2 (GWP) for the markets covered in our report increased by 4% in 2018.
China reported the largest increase in GWP of approximately USD 31 billion, while other markets saw similar
GWP levels in comparison to the previous year.
Capital regulations continue to evolve throughout Asia. Insurers in China are performing quantitative impact
studies for Phase II of China Risk Oriented Solvency System (C-ROSS2), a regulatory initiative to further refine
industry capital requirements
The Insurance Regulatory and Development Authority of India (IRDAI) has announced plans to move to a risk-
based capital (RBC) regime, although the planned timing of such a move remains uncertain. We expect greater
clarity in the coming months as the IRDAI starts the design process, including the selection of consultants.
In Hong Kong, the Insurance Authority (IA) is also in the process of developing a new RBC framework for the
industry. Two Quantitative Impact Studies (QIS) have been completed and an additional pilot test (QIS 2.5) was
carried out during May and June 2019, on a voluntary basis. The third QIS (QIS 3) is likely to commence in
August 2019 and require submission by the end of November 2019. The new RBC framework is expected to be
implemented in 2020-21.
The Monetary Authority of Singapore (MAS) has announced that RBC2 will be implemented from 1 January
2020, with parallel runs required for year-end 2018 (this is currently ongoing and insurers were expected to
submit their results by 2 July 2019) and year-end 2019.
In Japan, the Financial Services Agency (FSA) has been conducting extensive field tests on a new solvency capital
regime. However, given the predominance of Market-Consistent Embedded Value (MCEV) reporting in the market
there will be limited impact on EV results (through frictional costs), although the split between required capital and
free surplus is likely to change.
The EV methodologies used in the region remain varied, including Traditional Embedded Value (TEV), European
Embedded Value (EEV), Market-Consistent Embedded Value (MCEV3) and Indian Embedded Value (IEV). As
mentioned in last year's report, the number of European multinational corporations (MNCs) reporting EV has
reduced, as their parent companies have switched to using Solvency II (SII) as their primary shareholder value
reporting metric. Aviva and AXA have stopped publishing EV results but continued to disclose value of new
business (VNB) figures. Insurers in China, South Korea and Taiwan continue to report on a TEV basis. In
contrast, all insurers in Japan adopt MCEV or a Market-Consistent EEV (MC-EEV) approach. In India, almost all
companies4 that report EV now do so on an IEV or MCEV basis. Reliance Nippon Life is the only company that
still reports on a TEV basis.
1 Real GDP. Sourced from the International Monetary Fund (IMF).
2 Milliman has estimated market growth rates because not all Asian economies have reported their 2018 total GWPs as at the date of publication
of this report. A more precise update will be presented in our report '2018 Mid-Year Embedded Value Results – Asia.’ The GWP figures are
estimated in USD terms.
3 The MCEV principles are a copyright of the Stichting CFO Forum Foundation 2008.
4 Companies covered under this report only.
MILLIMAN REPORT
2018 Embedded Value Results: Asia 3 August 2019
EV RESULTS
This report examines the EV results published by MNCs and domestic insurers within Asia.5 Our publication on
shareholder value reporting in Europe will be released in September 2019.
The scope of this report is limited to EV results directly related solely, or predominantly, to Asian operations.
Insurers with a presence in Asia that do not provide separate results for the region are not included in this report.
All figures in this section of the report are based on a comparable basis, i.e., comparing only companies that
have reported 2016, 2017 and 2018 EV results for Asia.
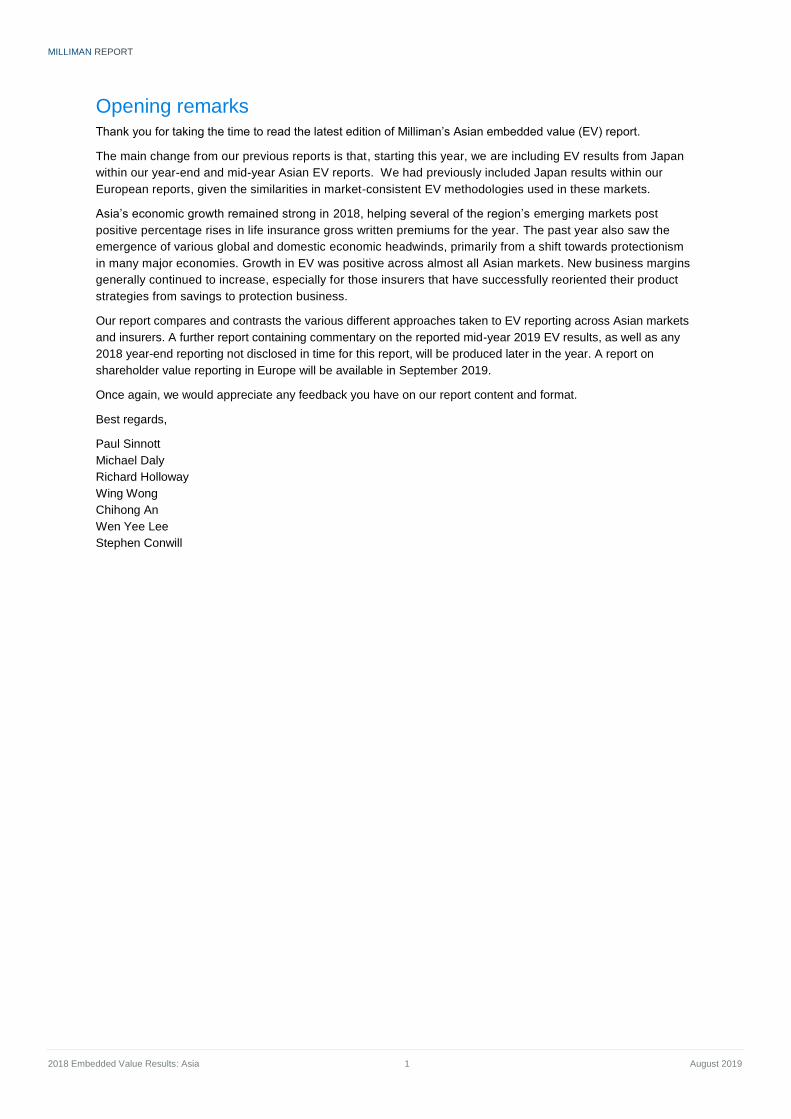
In 2018, total reported Asian EV grew by 5.3% on a comparable basis6 to USD 756 billion, up from USD 718
billion in 2017. The companies reporting the largest Asian EV at the 2018 year-end continue to be China Life,
Ping An Life and AIA, at USD 116 billion, USD 89 billion and USD 55 billion, respectively.
FIGURE 1: COMPARABLE ASIAN LIFE INSURANCE COVERED EV BY MARKET,7,8 2016 TO 2018
Vietnam reported the highest comparable EV growth in 2018 of 39%. However, this is primarily due to its smaller
base EV value and because there is only one data point in the market, Dai-ichi Life Vietnam. China and India
continue to lead growth in the Asia region. Despite the regulatory clampdown on the sale of high guarantee short-
medium term universal life business in China last year, the increased focus on protection business has helped
drive positive EV growth. Similarly, in India, increasing sales of protection business is one of the main reasons for
the market posting one of the highest EV growth rates in Asia.
5 For the avoidance of doubt, Asia does not include Australia or New Zealand.
6 Comparable basis = comparing only companies that have reported 2016, 2017 and 2018 EV results for Asia. For example, Ageas, which
discontinued its standalone Asian EV reporting in 2016, is not included in this comparison.
7 Results for all years have been converted to USD using the prevailing foreign exchange (FX) rate as at the 2018 reporting date to provide
comparability and eliminate FX effects.
8 Unallocated indicates EV figures that are reported by insurers to relate to their Asian operations, but have not been allocated to specific countries.
15%
-2%
70
120
170
220
270
320
8%
16%
8%
0%
-15%
-5%
3%
39%
16%
-
10
20
30
40
50
60
70
China Hong Kong India Japan Malaysia Singapore SouthKorea
Taiwan Thailand Vietnam Unallocated
2016 2017 2018 % Growth 2017-18
//
As
ia L
ife
In
su
ran
ce
EV
(2
01
8 U
SD
billio
ns
)
MILLIMAN REPORT
2018 Embedded Value Results: Asia 4 August 2019
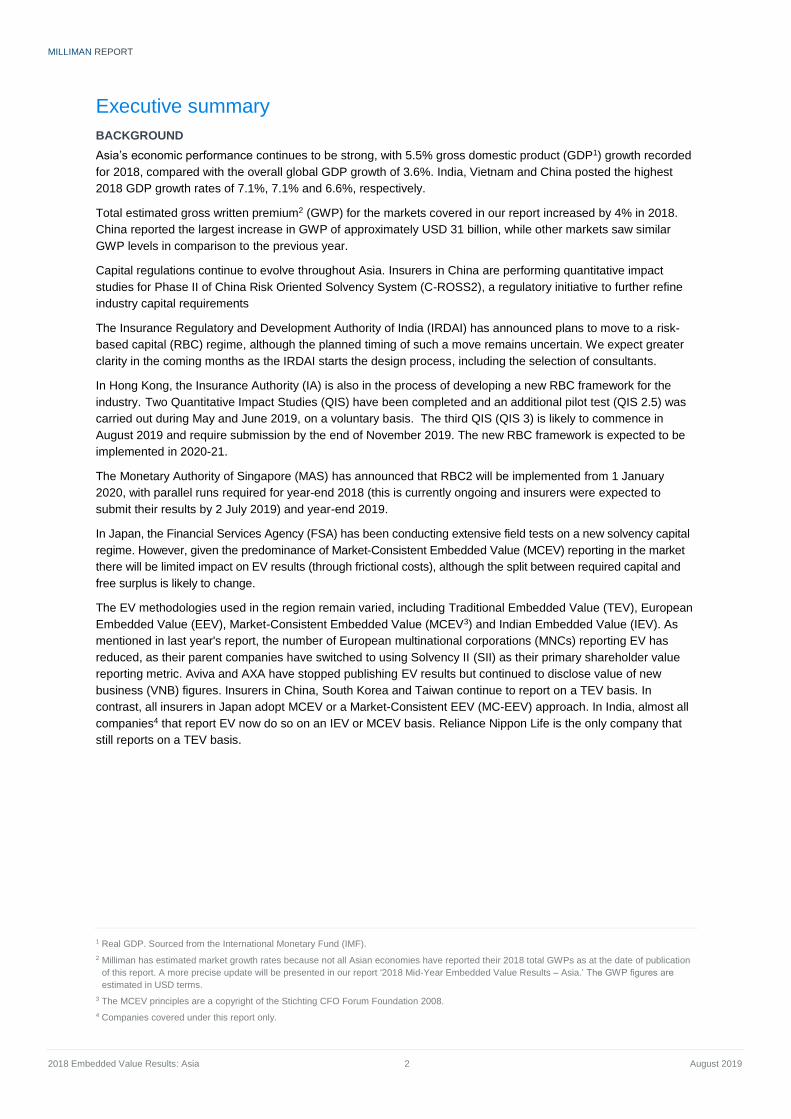
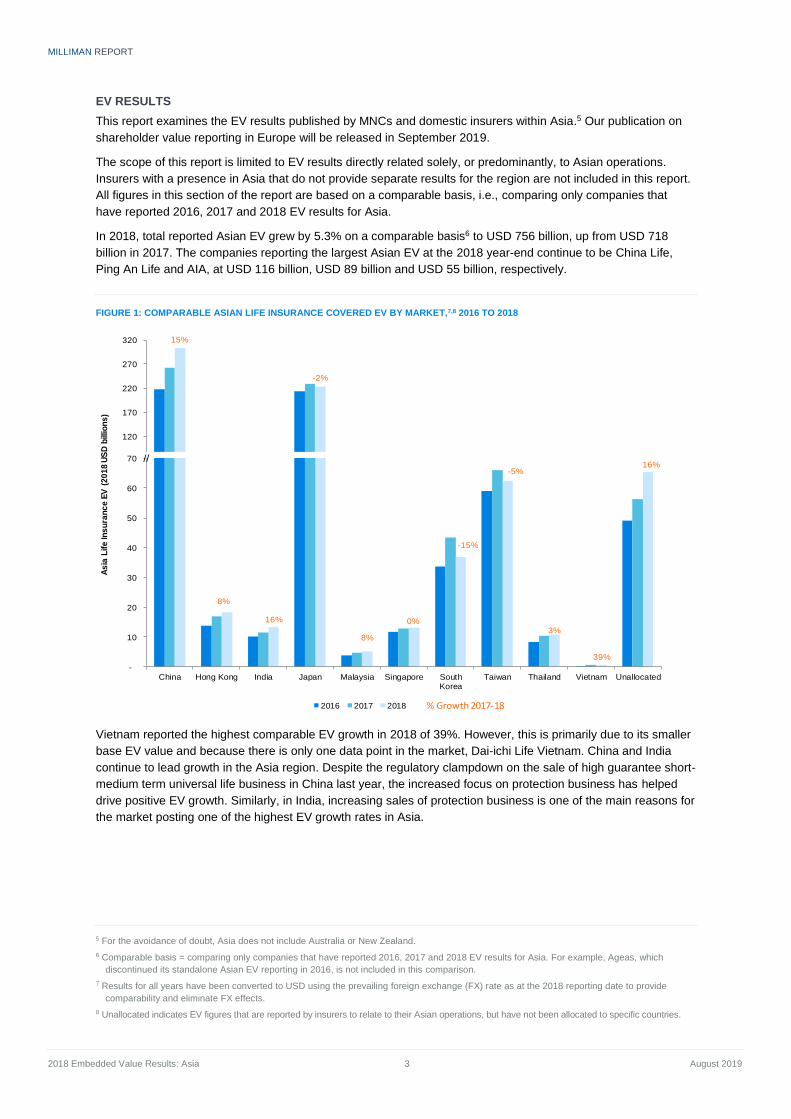
FIGURE 2: COMPARABLE9 ASIAN LIFE INSURANCE COVERED ADJUSTED NET WORTH (ANW), 2016 TO 2018
FIGURE 3: COMPARABLE10 ASIAN LIFE INSURANCE COVERED VALUE OF IN-FORCE (VIF), 2016 TO 2018
Growth in ANW was varied in fiscal year (FY) 2018. Vietnam posted the largest percentage growth in ANW,
followed by India and China, while Taiwan reported the biggest fall of 16%.
VIF growth was positive for almost all markets except for Japan and South Korea. Common reasons cited by
insurers for increasing VIF results were increased focus on protection products and improved productivity of
distribution channels. Insurers in South Korea cited a fall in investment return assumptions as the main reason for
their declining VIF results.
9 Comparable basis = comparing only companies that have reported 2016, 2017 and 2018 EV results for Asia. Insurers that have not yet published
their 2018 results as at the data cutoff date include Tahoe Life, Exide Life, DB Insurance and Samsung Fire & Marine.
10 Ibid.
10%
8%
-2% -16%
10,000
50,000
90,000
130,000
170,000
210,000
250,000
290,000
-1%
11%
4%
-5%
5%
35%
-
1,000
2,000
3,000
4,000
5,000
6,000
7,000
8,000
9,000
10,000
China Hong Kong India Japan Malaysia Singapore South Korea Taiwan Thailand Vietnam
AN
W (
US
D m
illio
ns
)
2016 2017 2018 % Growth 2017-18
//
20%
41,500
91,500
141,500
191,500
15%
21%
-394%
11%
5%-55%
5%
3%
43%
(18,500)
(8,500)
1,500
11,500
21,500
31,500
41,500
China Hong Kong India Japan Malaysia Singapore South Korea Taiwan Thailand Vietnam
VIF
(U
SD
millio
ns
)
2016 2017 2018 % Growth 2017-18
//
MILLIMAN REPORT
2018 Embedded Value Results: Asia 5 August 2019
A certain amount of caution must be exercised when evaluating Japanese company embedded values, especially
when comparisons are made across Asia. Japanese companies typically report on a market-consistent basis,
either MCEV or MC-EEV. In addition, many companies manage large blocks of legacy policies with relatively
high guarantees (in some cases, in excess of 5%). As a result of these two factors, many companies have a very
small (or even negative) VIF compared to the size of the in-force block. On a percentage basis, this VIF is
extremely sensitive to changes in interest rate environment. However, due to the use of market-consistent
approach, and asset liability management, changes in VIF are often substantially offset by changes in adjusted
net worth. As a result, overall EV, though sensitive to changing market yields, is far less sensitive than the
individual VIF and ANW components.
NEW BUSINESS RESULTS
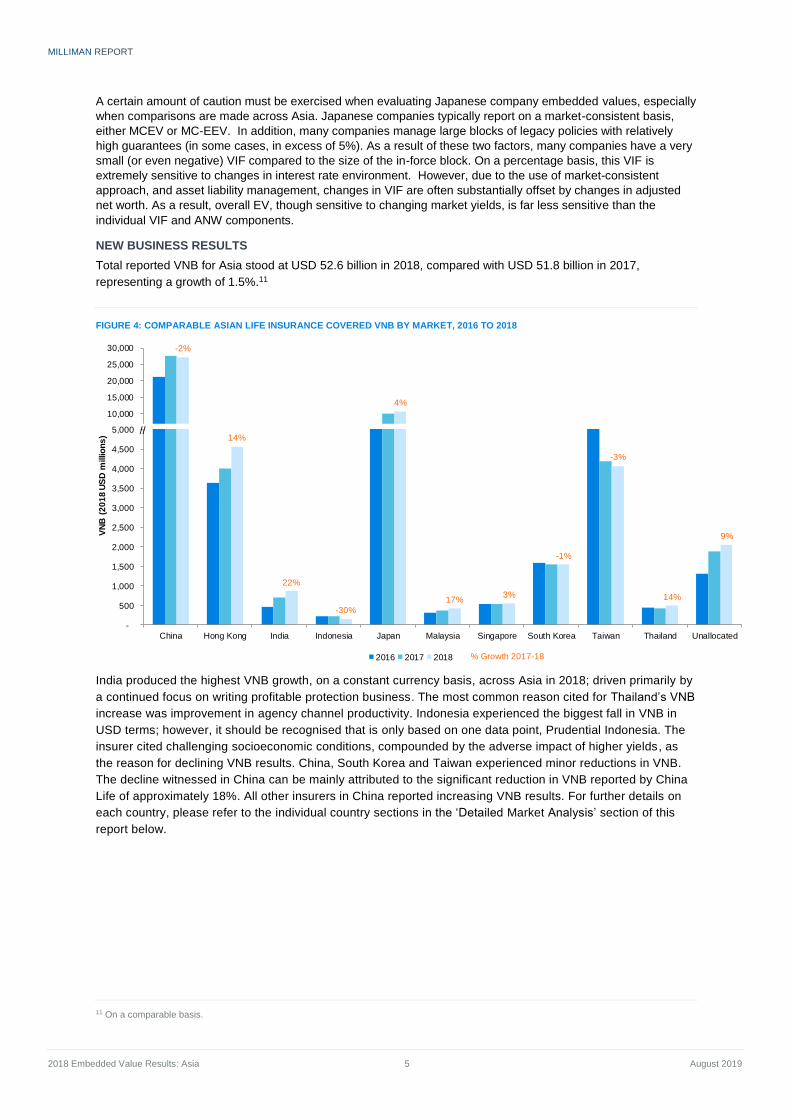
Total reported VNB for Asia stood at USD 52.6 billion in 2018, compared with USD 51.8 billion in 2017,
representing a growth of 1.5%.11
FIGURE 4: COMPARABLE ASIAN LIFE INSURANCE COVERED VNB BY MARKET, 2016 TO 2018
India produced the highest VNB growth, on a constant currency basis, across Asia in 2018; driven primarily by
a continued focus on writing profitable protection business. The most common reason cited for Thailand’s VNB
increase was improvement in agency channel productivity. Indonesia experienced the biggest fall in VNB in
USD terms; however, it should be recognised that is only based on one data point, Prudential Indonesia. The
insurer cited challenging socioeconomic conditions, compounded by the adverse impact of higher yields, as
the reason for declining VNB results. China, South Korea and Taiwan experienced minor reductions in VNB.
The decline witnessed in China can be mainly attributed to the significant reduction in VNB reported by China
Life of approximately 18%. All other insurers in China reported increasing VNB results. For further details on
each country, please refer to the individual country sections in the ‘Detailed Market Analysis’ section of this
report below.
11 On a comparable basis.
-2%
4%
5,000
10,000
15,000
20,000
25,000
30,000
14%
22%
-30%
17%3%
-1%
-3%
14%
9%
-
500
1,000
1,500
2,000
2,500
3,000
3,500
4,000
4,500
5,000
China Hong Kong India Indonesia Japan Malaysia Singapore South Korea Taiwan Thailand Unallocated
VN
B (
20
18
US
D m
illio
ns
)
2016 2017 2018 % Growth 2017-18
//
MILLIMAN REPORT
2018 Embedded Value Results: Asia 6 August 2019
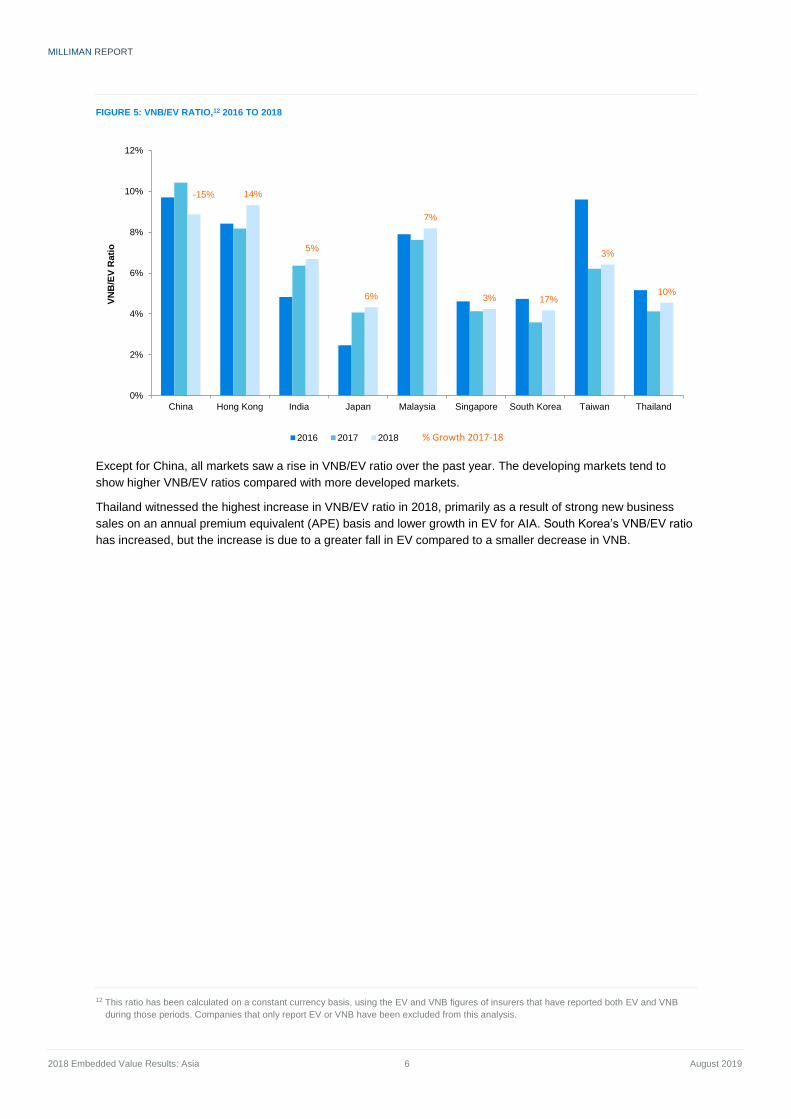
FIGURE 5: VNB/EV RATIO,12 2016 TO 2018
Except for China, all markets saw a rise in VNB/EV ratio over the past year. The developing markets tend to
show higher VNB/EV ratios compared with more developed markets.
Thailand witnessed the highest increase in VNB/EV ratio in 2018, primarily as a result of strong new business
sales on an annual premium equivalent (APE) basis and lower growth in EV for AIA. South Korea’s VNB/EV ratio
has increased, but the increase is due to a greater fall in EV compared to a smaller decrease in VNB.
12 This ratio has been calculated on a constant currency basis, using the EV and VNB figures of insurers that have reported both EV and VNB
during those periods. Companies that only report EV or VNB have been excluded from this analysis.
-15% 14%
5%
6%
7%
3% 17%
3%
10%
0%
2%
4%
6%
8%
10%
12%
China Hong Kong India Japan Malaysia Singapore South Korea Taiwan Thailand
VN
B/E
V R
ati
o
2016 2017 2018 % Growth 2017-18
MILLIMAN REPORT
2018 Embedded Value Results: Asia 7 August 2019
NEW BUSINESS MARGINS
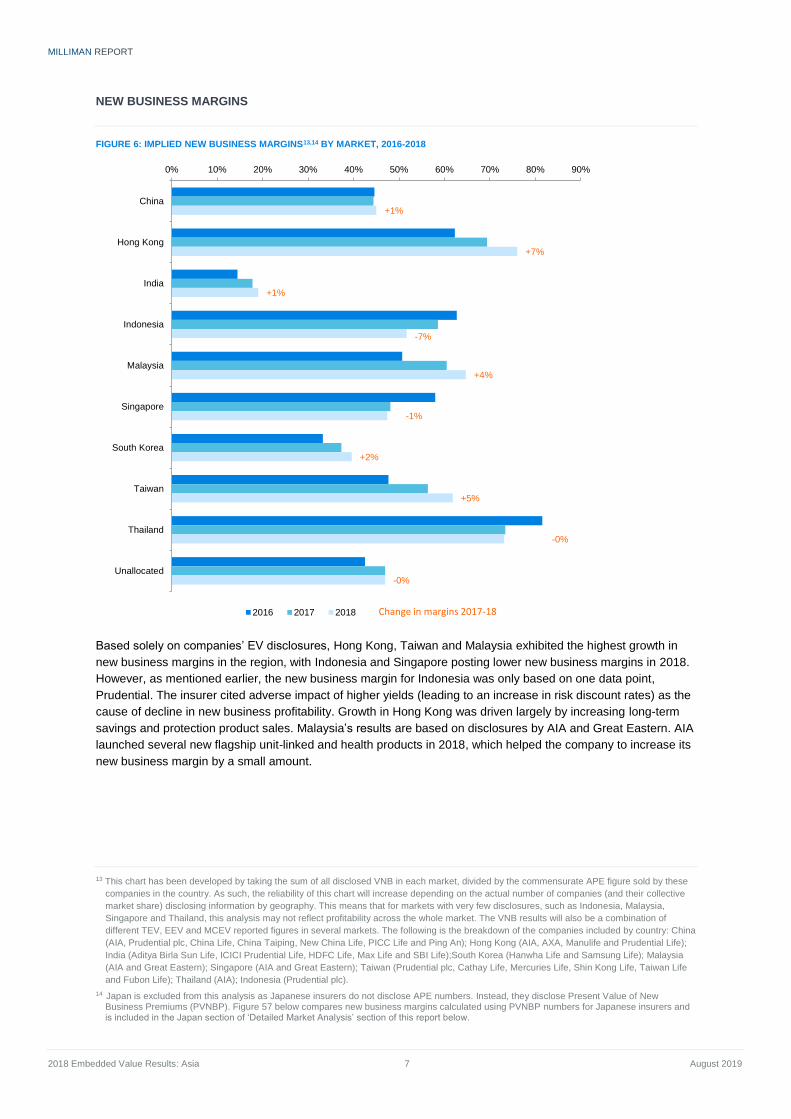
FIGURE 6: IMPLIED NEW BUSINESS MARGINS13,14 BY MARKET, 2016-2018
Based solely on companies’ EV disclosures, Hong Kong, Taiwan and Malaysia exhibited the highest growth in
new business margins in the region, with Indonesia and Singapore posting lower new business margins in 2018.
However, as mentioned earlier, the new business margin for Indonesia was only based on one data point,
Prudential. The insurer cited adverse impact of higher yields (leading to an increase in risk discount rates) as the
cause of decline in new business profitability. Growth in Hong Kong was driven largely by increasing long-term
savings and protection product sales. Malaysia’s results are based on disclosures by AIA and Great Eastern. AIA
launched several new flagship unit-linked and health products in 2018, which helped the company to increase its
new business margin by a small amount.
13 This chart has been developed by taking the sum of all disclosed VNB in each market, divided by the commensurate APE figure sold by these
companies in the country. As such, the reliability of this chart will increase depending on the actual number of companies (and their collective
market share) disclosing information by geography. This means that for markets with very few disclosures, such as Indonesia, Malaysia,
Singapore and Thailand, this analysis may not reflect profitability across the whole market. The VNB results will also be a combination of
different TEV, EEV and MCEV reported figures in several markets. The following is the breakdown of the companies included by country: China
(AIA, Prudential plc, China Life, China Taiping, New China Life, PICC Life and Ping An); Hong Kong (AIA, AXA, Manulife and Prudential Life);
India (Aditya Birla Sun Life, ICICI Prudential Life, HDFC Life, Max Life and SBI Life);South Korea (Hanwha Life and Samsung Life); Malaysia
(AIA and Great Eastern); Singapore (AIA and Great Eastern); Taiwan (Prudential plc, Cathay Life, Mercuries Life, Shin Kong Life, Taiwan Life
and Fubon Life); Thailand (AIA); Indonesia (Prudential plc).
14 Japan is excluded from this analysis as Japanese insurers do not disclose APE numbers. Instead, they disclose Present Value of New Business Premiums (PVNBP). Figure 57 below compares new business margins calculated using PVNBP numbers for Japanese insurers and is included in the Japan section of ‘Detailed Market Analysis’ section of this report below.
+1%
+7%
+1%
-7%
+4%
-1%
+2%
+5%
-0%
-0%
0% 10% 20% 30% 40% 50% 60% 70% 80% 90%
China
Hong Kong
India
Indonesia
Malaysia
Singapore
South Korea
Taiwan
Thailand
Unallocated
2016 2017 2018 Change in margins 2017-18
MILLIMAN REPORT
2018 Embedded Value Results: Asia 8 August 2019
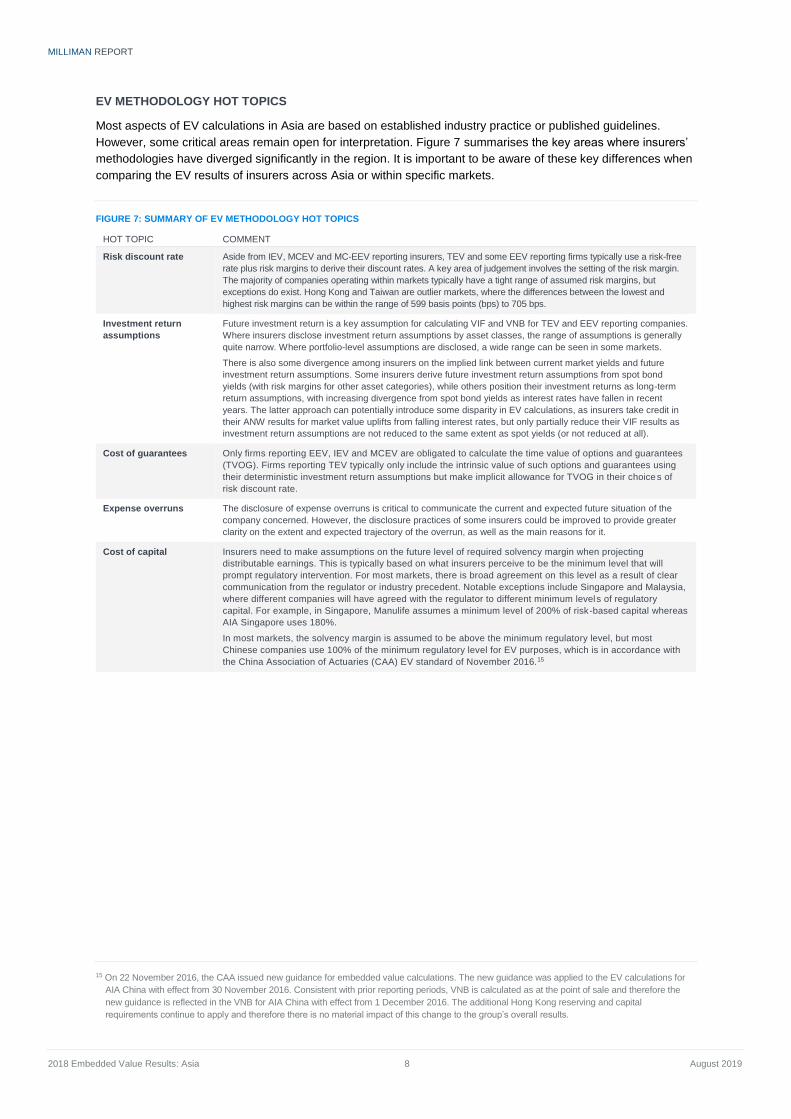
EV METHODOLOGY HOT TOPICS
Most aspects of EV calculations in Asia are based on established industry practice or published guidelines.
However, some critical areas remain open for interpretation. Figure 7 summarises the key areas where insurers’
methodologies have diverged significantly in the region. It is important to be aware of these key differences when
comparing the EV results of insurers across Asia or within specific markets.
FIGURE 7: SUMMARY OF EV METHODOLOGY HOT TOPICS
HOT TOPIC COMMENT
Risk discount rate Aside from IEV, MCEV and MC-EEV reporting insurers, TEV and some EEV reporting firms typically use a risk-free
rate plus risk margins to derive their discount rates. A key area of judgement involves the setting of the risk margin.
The majority of companies operating within markets typically have a tight range of assumed risk margins, but
exceptions do exist. Hong Kong and Taiwan are outlier markets, where the differences between the lowest and
highest risk margins can be within the range of 599 basis points (bps) to 705 bps.
Investment return
assumptions
Future investment return is a key assumption for calculating VIF and VNB for TEV and EEV reporting companies.
Where insurers disclose investment return assumptions by asset classes, the range of assumptions is generally
quite narrow. Where portfolio-level assumptions are disclosed, a wide range can be seen in some markets.
There is also some divergence among insurers on the implied link between current market yields and future
investment return assumptions. Some insurers derive future investment return assumptions from spot bond
yields (with risk margins for other asset categories), while others position their investment returns as long-term
return assumptions, with increasing divergence from spot bond yields as interest rates have fallen in recent
years. The latter approach can potentially introduce some disparity in EV calculations, as insurers take credit in
their ANW results for market value uplifts from falling interest rates, but only partially reduce their VIF results as
investment return assumptions are not reduced to the same extent as spot yields (or not reduced at all).
Cost of guarantees Only firms reporting EEV, IEV and MCEV are obligated to calculate the time value of options and guarantees
(TVOG). Firms reporting TEV typically only include the intrinsic value of such options and guarantees using
their deterministic investment return assumptions but make implicit allowance for TVOG in their choices of
risk discount rate.
Expense overruns The disclosure of expense overruns is critical to communicate the current and expected future situation of the
company concerned. However, the disclosure practices of some insurers could be improved to provide greater
clarity on the extent and expected trajectory of the overrun, as well as the main reasons for it.
Cost of capital Insurers need to make assumptions on the future level of required solvency margin when projecting
distributable earnings. This is typically based on what insurers perceive to be the minimum level that will
prompt regulatory intervention. For most markets, there is broad agreement on this level as a result of clear
communication from the regulator or industry precedent. Notable exceptions include Singapore and Malaysia,
where different companies will have agreed with the regulator to different minimum levels of regulatory
capital. For example, in Singapore, Manulife assumes a minimum level of 200% of risk-based capital whereas
AIA Singapore uses 180%.
In most markets, the solvency margin is assumed to be above the minimum regulatory level, but most
Chinese companies use 100% of the minimum regulatory level for EV purposes, which is in accordance with
the China Association of Actuaries (CAA) EV standard of November 2016.15
15 On 22 November 2016, the CAA issued new guidance for embedded value calculations. The new guidance was applied to the EV calculations for
AIA China with effect from 30 November 2016. Consistent with prior reporting periods, VNB is calculated as at the point of sale and therefore the
new guidance is reflected in the VNB for AIA China with effect from 1 December 2016. The additional Hong Kong reserving and capital
requirements continue to apply and therefore there is no material impact of this change to the group’s overall results.
MILLIMAN REPORT
2018 Embedded Value Results: Asia 9 August 2019
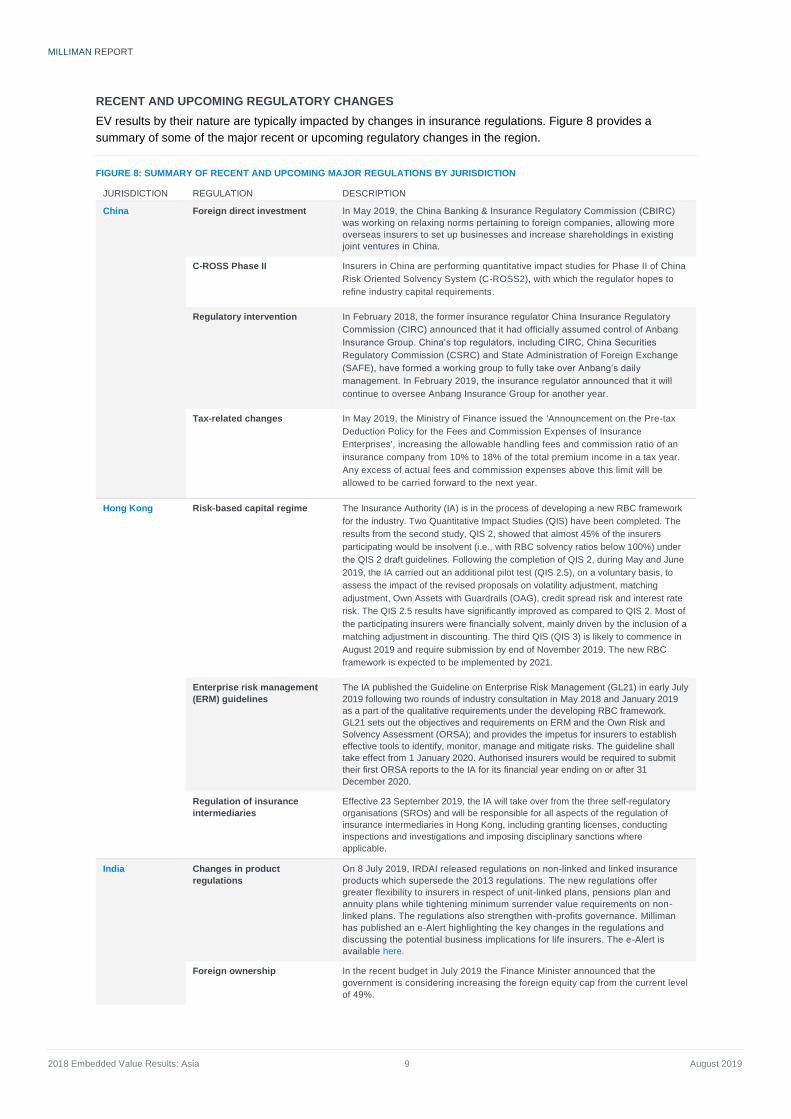
RECENT AND UPCOMING REGULATORY CHANGES
EV results by their nature are typically impacted by changes in insurance regulations. Figure 8 provides a
summary of some of the major recent or upcoming regulatory changes in the region.
FIGURE 8: SUMMARY OF RECENT AND UPCOMING MAJOR REGULATIONS BY JURISDICTION
JURISDICTION REGULATION DESCRIPTION
China Foreign direct investment In May 2019, the China Banking & Insurance Regulatory Commission (CBIRC)
was working on relaxing norms pertaining to foreign companies, allowing more
overseas insurers to set up businesses and increase shareholdings in existing
joint ventures in China.
C-ROSS Phase II Insurers in China are performing quantitative impact studies for Phase II of China
Risk Oriented Solvency System (C-ROSS2), with which the regulator hopes to
refine industry capital requirements.
Regulatory intervention In February 2018, the former insurance regulator China Insurance Regulatory
Commission (CIRC) announced that it had officially assumed control of Anbang
Insurance Group. China’s top regulators, including CIRC, China Securities
Regulatory Commission (CSRC) and State Administration of Foreign Exchange
(SAFE), have formed a working group to fully take over Anbang’s daily
management. In February 2019, the insurance regulator announced that it will
continue to oversee Anbang Insurance Group for another year.
Tax-related changes In May 2019, the Ministry of Finance issued the 'Announcement on the Pre-tax
Deduction Policy for the Fees and Commission Expenses of Insurance
Enterprises', increasing the allowable handling fees and commission ratio of an
insurance company from 10% to 18% of the total premium income in a tax year.
Any excess of actual fees and commission expenses above this limit will be
allowed to be carried forward to the next year.
Hong Kong Risk-based capital regime The Insurance Authority (IA) is in the process of developing a new RBC framework
for the industry. Two Quantitative Impact Studies (QIS) have been completed. The
results from the second study, QIS 2, showed that almost 45% of the insurers
participating would be insolvent (i.e., with RBC solvency ratios below 100%) under
the QIS 2 draft guidelines. Following the completion of QIS 2, during May and June
2019, the IA carried out an additional pilot test (QIS 2.5), on a voluntary basis, to
assess the impact of the revised proposals on volatility adjustment, matching
adjustment, Own Assets with Guardrails (OAG), credit spread risk and interest rate
risk. The QIS 2.5 results have significantly improved as compared to QIS 2. Most of
the participating insurers were financially solvent, mainly driven by the inclusion of a
matching adjustment in discounting. The third QIS (QIS 3) is likely to commence in
August 2019 and require submission by end of November 2019. The new RBC
framework is expected to be implemented by 2021.
Enterprise risk management
(ERM) guidelines
The IA published the Guideline on Enterprise Risk Management (GL21) in early July
2019 following two rounds of industry consultation in May 2018 and January 2019
as a part of the qualitative requirements under the developing RBC framework.
GL21 sets out the objectives and requirements on ERM and the Own Risk and
Solvency Assessment (ORSA); and provides the impetus for insurers to establish
effective tools to identify, monitor, manage and mitigate risks. The guideline shall
take effect from 1 January 2020. Authorised insurers would be required to submit
their first ORSA reports to the IA for its financial year ending on or after 31
December 2020.
Regulation of insurance
intermediaries
Effective 23 September 2019, the IA will take over from the three self-regulatory
organisations (SROs) and will be responsible for all aspects of the regulation of
insurance intermediaries in Hong Kong, including granting licenses, conducting
inspections and investigations and imposing disciplinary sanctions where
applicable.
India Changes in product
regulations
On 8 July 2019, IRDAI released regulations on non-linked and linked insurance
products which supersede the 2013 regulations. The new regulations offer
greater flexibility to insurers in respect of unit-linked plans, pensions plan and
annuity plans while tightening minimum surrender value requirements on non-
linked plans. The regulations also strengthen with-profits governance. Milliman
has published an e-Alert highlighting the key changes in the regulations and
discussing the potential business implications for life insurers. The e-Alert is
available here.
Foreign ownership In the recent budget in July 2019 the Finance Minister announced that the
government is considering increasing the foreign equity cap from the current level
of 49%.
MILLIMAN REPORT
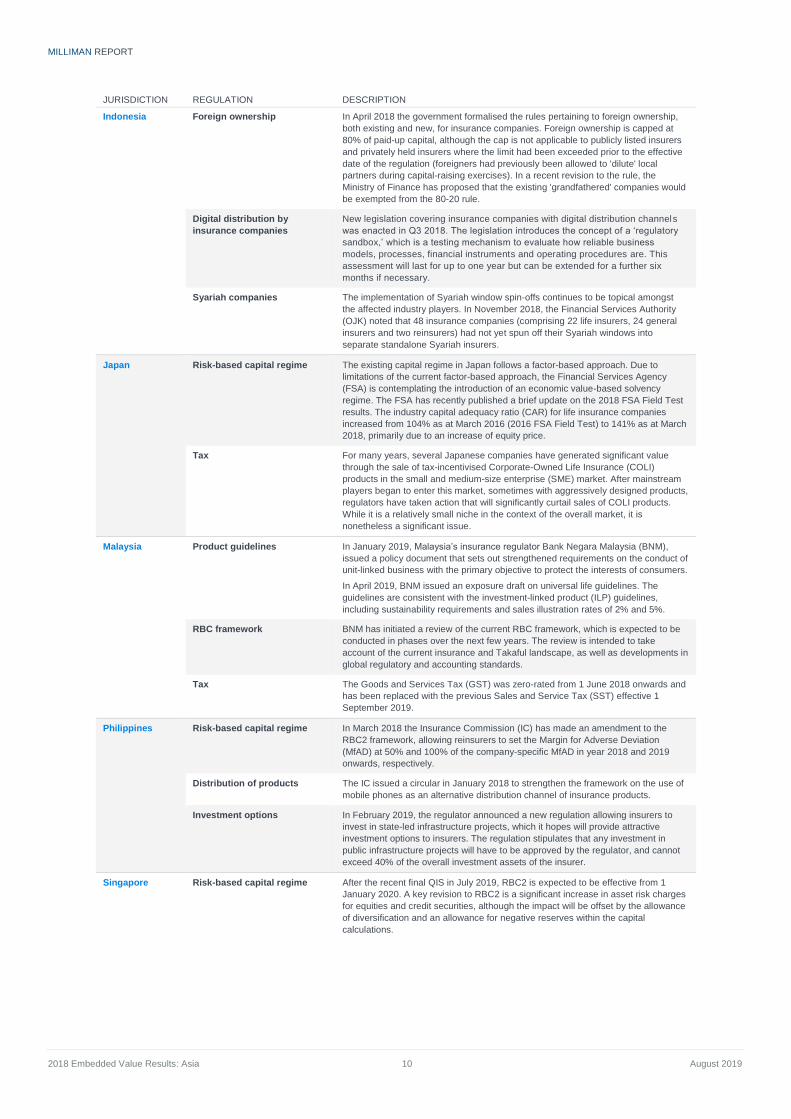
2018 Embedded Value Results: Asia 10 August 2019
JURISDICTION REGULATION DESCRIPTION
Indonesia Foreign ownership In April 2018 the government formalised the rules pertaining to foreign ownership,
both existing and new, for insurance companies. Foreign ownership is capped at
80% of paid-up capital, although the cap is not applicable to publicly listed insurers
and privately held insurers where the limit had been exceeded prior to the effective
date of the regulation (foreigners had previously been allowed to 'dilute' local
partners during capital-raising exercises). In a recent revision to the rule, the
Ministry of Finance has proposed that the existing 'grandfathered' companies would
be exempted from the 80-20 rule.
Digital distribution by
insurance companies
New legislation covering insurance companies with digital distribution channels
was enacted in Q3 2018. The legislation introduces the concept of a ‘regulatory
sandbox,’ which is a testing mechanism to evaluate how reliable business
models, processes, financial instruments and operating procedures are. This
assessment will last for up to one year but can be extended for a further six
months if necessary.
Syariah companies The implementation of Syariah window spin-offs continues to be topical amongst
the affected industry players. In November 2018, the Financial Services Authority
(OJK) noted that 48 insurance companies (comprising 22 life insurers, 24 general
insurers and two reinsurers) had not yet spun off their Syariah windows into
separate standalone Syariah insurers.
Japan
Risk-based capital regime The existing capital regime in Japan follows a factor-based approach. Due to
limitations of the current factor-based approach, the Financial Services Agency
(FSA) is contemplating the introduction of an economic value-based solvency
regime. The FSA has recently published a brief update on the 2018 FSA Field Test
results. The industry capital adequacy ratio (CAR) for life insurance companies
increased from 104% as at March 2016 (2016 FSA Field Test) to 141% as at March
2018, primarily due to an increase of equity price.
Tax For many years, several Japanese companies have generated significant value
through the sale of tax-incentivised Corporate-Owned Life Insurance (COLI)
products in the small and medium-size enterprise (SME) market. After mainstream
players began to enter this market, sometimes with aggressively designed products,
regulators have taken action that will significantly curtail sales of COLI products.
While it is a relatively small niche in the context of the overall market, it is
nonetheless a significant issue.
Malaysia Product guidelines In January 2019, Malaysia’s insurance regulator Bank Negara Malaysia (BNM),
issued a policy document that sets out strengthened requirements on the conduct of
unit-linked business with the primary objective to protect the interests of consumers.
In April 2019, BNM issued an exposure draft on universal life guidelines. The
guidelines are consistent with the investment-linked product (ILP) guidelines,
including sustainability requirements and sales illustration rates of 2% and 5%.
RBC framework BNM has initiated a review of the current RBC framework, which is expected to be
conducted in phases over the next few years. The review is intended to take
account of the current insurance and Takaful landscape, as well as developments in
global regulatory and accounting standards.
Tax The Goods and Services Tax (GST) was zero-rated from 1 June 2018 onwards and
has been replaced with the previous Sales and Service Tax (SST) effective 1
September 2019.
Philippines Risk-based capital regime In March 2018 the Insurance Commission (IC) has made an amendment to the
RBC2 framework, allowing reinsurers to set the Margin for Adverse Deviation
(MfAD) at 50% and 100% of the company-specific MfAD in year 2018 and 2019
onwards, respectively.
Distribution of products The IC issued a circular in January 2018 to strengthen the framework on the use of
mobile phones as an alternative distribution channel of insurance products.
Investment options In February 2019, the regulator announced a new regulation allowing insurers to
invest in state-led infrastructure projects, which it hopes will provide attractive
investment options to insurers. The regulation stipulates that any investment in
public infrastructure projects will have to be approved by the regulator, and cannot
exceed 40% of the overall investment assets of the insurer.
Singapore
Risk-based capital regime After the recent final QIS in July 2019, RBC2 is expected to be effective from 1
January 2020. A key revision to RBC2 is a significant increase in asset risk charges
for equities and credit securities, although the impact will be offset by the allowance
of diversification and an allowance for negative reserves within the capital
calculations.
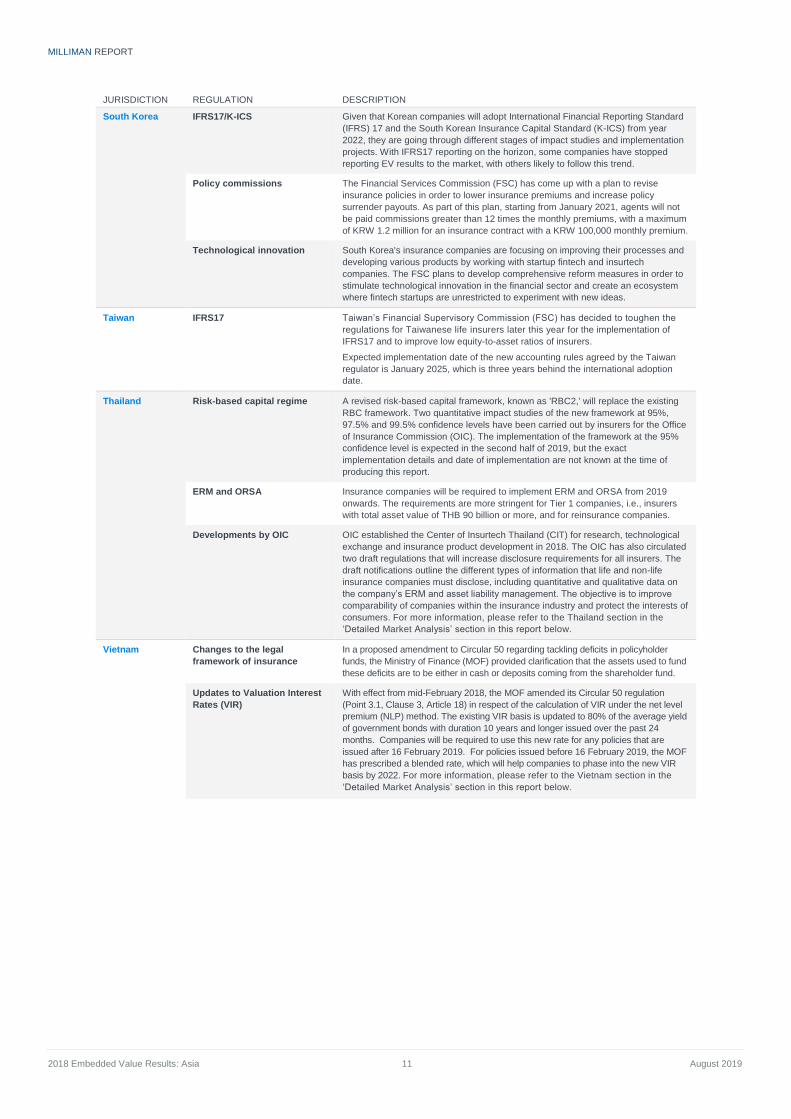
MILLIMAN REPORT
2018 Embedded Value Results: Asia 11 August 2019
JURISDICTION REGULATION DESCRIPTION
South Korea IFRS17/K-ICS Given that Korean companies will adopt International Financial Reporting Standard
(IFRS) 17 and the South Korean Insurance Capital Standard (K-ICS) from year
2022, they are going through different stages of impact studies and implementation
projects. With IFRS17 reporting on the horizon, some companies have stopped
reporting EV results to the market, with others likely to follow this trend.
Policy commissions The Financial Services Commission (FSC) has come up with a plan to revise
insurance policies in order to lower insurance premiums and increase policy
surrender payouts. As part of this plan, starting from January 2021, agents will not
be paid commissions greater than 12 times the monthly premiums, with a maximum
of KRW 1.2 million for an insurance contract with a KRW 100,000 monthly premium.
Technological innovation South Korea's insurance companies are focusing on improving their processes and
developing various products by working with startup fintech and insurtech
companies. The FSC plans to develop comprehensive reform measures in order to
stimulate technological innovation in the financial sector and create an ecosystem
where fintech startups are unrestricted to experiment with new ideas.
Taiwan IFRS17 Taiwan’s Financial Supervisory Commission (FSC) has decided to toughen the
regulations for Taiwanese life insurers later this year for the implementation of
IFRS17 and to improve low equity-to-asset ratios of insurers.
Expected implementation date of the new accounting rules agreed by the Taiwan
regulator is January 2025, which is three years behind the international adoption
date.
Thailand Risk-based capital regime A revised risk-based capital framework, known as 'RBC2,' will replace the existing
RBC framework. Two quantitative impact studies of the new framework at 95%,
97.5% and 99.5% confidence levels have been carried out by insurers for the Office
of Insurance Commission (OIC). The implementation of the framework at the 95%
confidence level is expected in the second half of 2019, but the exact
implementation details and date of implementation are not known at the time of
producing this report.
ERM and ORSA Insurance companies will be required to implement ERM and ORSA from 2019
onwards. The requirements are more stringent for Tier 1 companies, i.e., insurers
with total asset value of THB 90 billion or more, and for reinsurance companies.
Developments by OIC OIC established the Center of Insurtech Thailand (CIT) for research, technological
exchange and insurance product development in 2018. The OIC has also circulated
two draft regulations that will increase disclosure requirements for all insurers. The
draft notifications outline the different types of information that life and non-life
insurance companies must disclose, including quantitative and qualitative data on
the company’s ERM and asset liability management. The objective is to improve
comparability of companies within the insurance industry and protect the interests of
consumers. For more information, please refer to the Thailand section in the
‘Detailed Market Analysis’ section in this report below.
Vietnam Changes to the legal
framework of insurance
In a proposed amendment to Circular 50 regarding tackling deficits in policyholder
funds, the Ministry of Finance (MOF) provided clarification that the assets used to fund
these deficits are to be either in cash or deposits coming from the shareholder fund.
Updates to Valuation Interest
Rates (VIR)
With effect from mid-February 2018, the MOF amended its Circular 50 regulation
(Point 3.1, Clause 3, Article 18) in respect of the calculation of VIR under the net level
premium (NLP) method. The existing VIR basis is updated to 80% of the average yield
of government bonds with duration 10 years and longer issued over the past 24
months. Companies will be required to use this new rate for any policies that are
issued after 16 February 2019. For policies issued before 16 February 2019, the MOF
has prescribed a blended rate, which will help companies to phase into the new VIR
basis by 2022. For more information, please refer to the Vietnam section in the
‘Detailed Market Analysis’ section in this report below.
MILLIMAN REPORT
2018 Embedded Value Results: Asia 12 August 2019
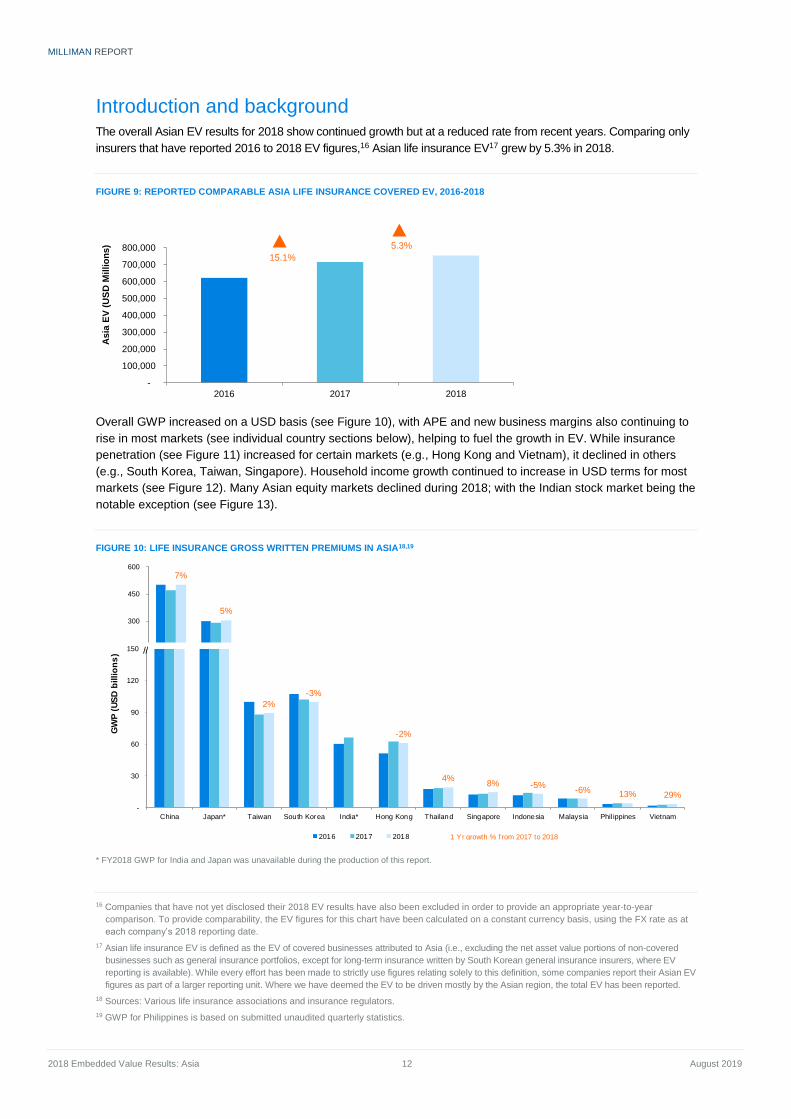
Introduction and background The overall Asian EV results for 2018 show continued growth but at a reduced rate from recent years. Comparing only
insurers that have reported 2016 to 2018 EV figures,16 Asian life insurance EV17 grew by 5.3% in 2018.
FIGURE 9: REPORTED COMPARABLE ASIA LIFE INSURANCE COVERED EV, 2016-2018
Overall GWP increased on a USD basis (see Figure 10), with APE and new business margins also continuing to
rise in most markets (see individual country sections below), helping to fuel the growth in EV. While insurance
penetration (see Figure 11) increased for certain markets (e.g., Hong Kong and Vietnam), it declined in others
(e.g., South Korea, Taiwan, Singapore). Household income growth continued to increase in USD terms for most
markets (see Figure 12). Many Asian equity markets declined during 2018; with the Indian stock market being the
notable exception (see Figure 13).
FIGURE 10: LIFE INSURANCE GROSS WRITTEN PREMIUMS IN ASIA18,19
* FY2018 GWP for India and Japan was unavailable during the production of this report.
16 Companies that have not yet disclosed their 2018 EV results have also been excluded in order to provide an appropriate year-to-year
comparison. To provide comparability, the EV figures for this chart have been calculated on a constant currency basis, using the FX rate as at
each company’s 2018 reporting date.
17 Asian life insurance EV is defined as the EV of covered businesses attributed to Asia (i.e., excluding the net asset value portions of non-covered
businesses such as general insurance portfolios, except for long-term insurance written by South Korean general insurance insurers, where EV
reporting is available). While every effort has been made to strictly use figures relating solely to this definition, some companies report their Asian EV
figures as part of a larger reporting unit. Where we have deemed the EV to be driven mostly by the Asian region, the total EV has been reported.
18 Sources: Various life insurance associations and insurance regulators.
19 GWP for Philippines is based on submitted unaudited quarterly statistics.
-
100,000
200,000
300,000
400,000
500,000
600,000
700,000
800,000
2016 2017 2018
Asia
EV
(U
SD
Millio
ns) 5.3%
7%
5%
150
300
450
600
2%
-3%
-2%
4%8% -5%
-6%13% 29%
-
30
60
90
120
150
China Japan* Taiwan South Korea India* Hong Kong Thailand Singapore Indonesia Malaysia Phil ippines Vietnam
GW
P (
US
D b
illio
ns
)
2016 2017 2018 1 Yr growth % f rom 2017 to 2018
//
15.1%
MILLIMAN REPORT
2018 Embedded Value Results: Asia 13 August 2019
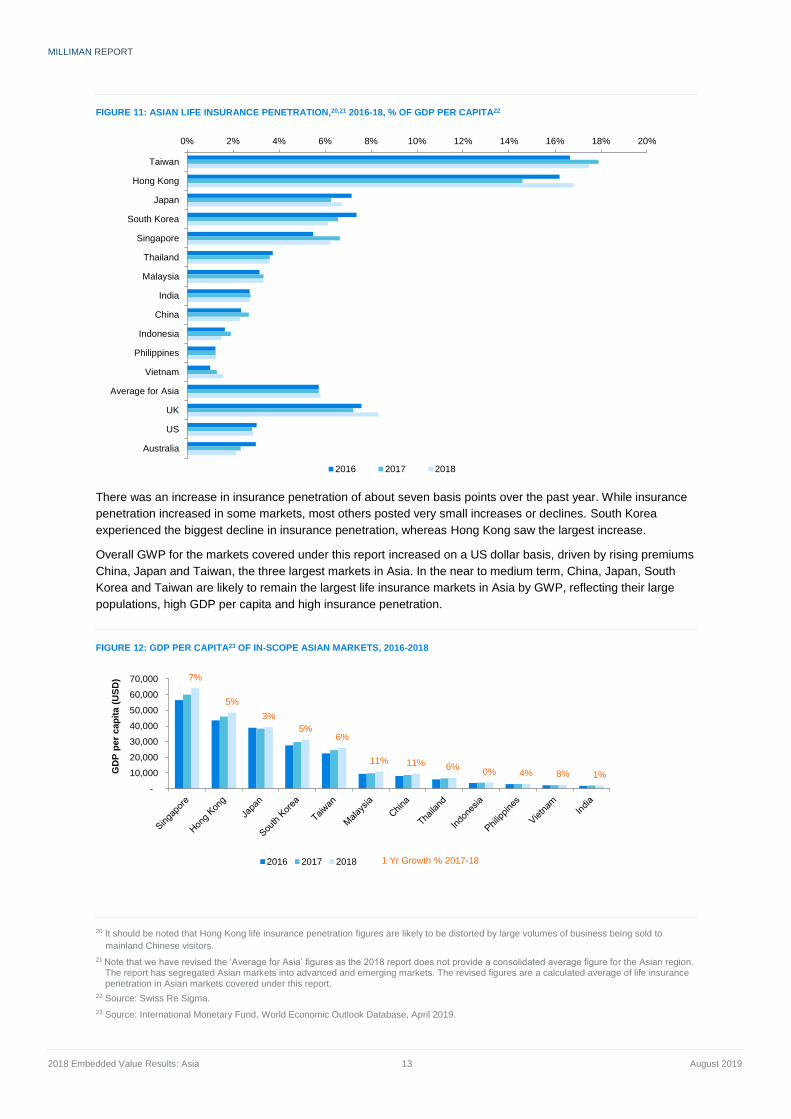
FIGURE 11: ASIAN LIFE INSURANCE PENETRATION,20,21 2016-18, % OF GDP PER CAPITA22
There was an increase in insurance penetration of about seven basis points over the past year. While insurance
penetration increased in some markets, most others posted very small increases or declines. South Korea
experienced the biggest decline in insurance penetration, whereas Hong Kong saw the largest increase.
Overall GWP for the markets covered under this report increased on a US dollar basis, driven by rising premiums
China, Japan and Taiwan, the three largest markets in Asia. In the near to medium term, China, Japan, South
Korea and Taiwan are likely to remain the largest life insurance markets in Asia by GWP, reflecting their large
populations, high GDP per capita and high insurance penetration.
FIGURE 12: GDP PER CAPITA23 OF IN-SCOPE ASIAN MARKETS, 2016-2018
20 It should be noted that Hong Kong life insurance penetration figures are likely to be distorted by large volumes of business being sold to
mainland Chinese visitors.
21 Note that we have revised the ‘Average for Asia’ figures as the 2018 report does not provide a consolidated average figure for the Asian region. The report has segregated Asian markets into advanced and emerging markets. The revised figures are a calculated average of life insurance penetration in Asian markets covered under this report.
22 Source: Swiss Re Sigma.
23 Source: International Monetary Fund, World Economic Outlook Database, April 2019.
0% 2% 4% 6% 8% 10% 12% 14% 16% 18% 20%
Taiwan
Hong Kong
Japan
South Korea
Singapore
Thailand
Malaysia
India
China
Indonesia
Philippines
Vietnam
Average for Asia
UK
US
Australia
2016 2017 2018
7%
5%
3%
5%6%
11% 11% 6%0% 4% 8% 1%
-
10,000
20,000
30,000
40,000
50,000
60,000
70,000
GD
P p
er
cap
ita (
US
D)
2016 2017 2018 1 Yr Growth % 2017-18
MILLIMAN REPORT
2018 Embedded Value Results: Asia 14 August 2019
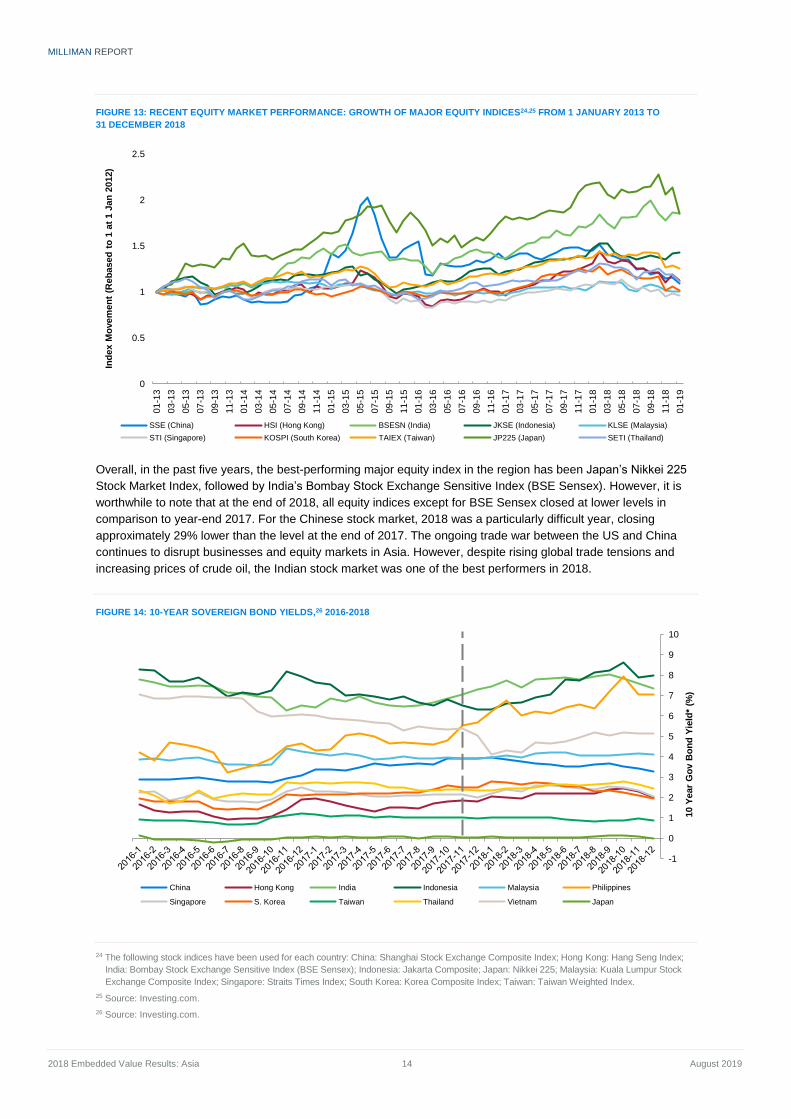
FIGURE 13: RECENT EQUITY MARKET PERFORMANCE: GROWTH OF MAJOR EQUITY INDICES24,25 FROM 1 JANUARY 2013 TO
31 DECEMBER 2018
Overall, in the past five years, the best-performing major equity index in the region has been Japan’s Nikkei 225
Stock Market Index, followed by India’s Bombay Stock Exchange Sensitive Index (BSE Sensex). However, it is
worthwhile to note that at the end of 2018, all equity indices except for BSE Sensex closed at lower levels in
comparison to year-end 2017. For the Chinese stock market, 2018 was a particularly difficult year, closing
approximately 29% lower than the level at the end of 2017. The ongoing trade war between the US and China
continues to disrupt businesses and equity markets in Asia. However, despite rising global trade tensions and
increasing prices of crude oil, the Indian stock market was one of the best performers in 2018.
FIGURE 14: 10-YEAR SOVEREIGN BOND YIELDS,26 2016-2018
24 The following stock indices have been used for each country: China: Shanghai Stock Exchange Composite Index; Hong Kong: Hang Seng Index;
India: Bombay Stock Exchange Sensitive Index (BSE Sensex); Indonesia: Jakarta Composite; Japan: Nikkei 225; Malaysia: Kuala Lumpur Stock
Exchange Composite Index; Singapore: Straits Times Index; South Korea: Korea Composite Index; Taiwan: Taiwan Weighted Index.
25 Source: Investing.com.
26 Source: Investing.com.
0
0.5
1
1.5
2
2.501
-13
03
-13
05
-13
07
-13
09
-13
11
-13
01
-14
03
-14
05
-14
07
-14
09
-14
11
-14
01
-15
03
-15
05
-15
07
-15
09
-15
11
-15
01
-16
03
-16
05
-16
07
-16
09
-16
11
-16
01
-17
03
-17
05
-17
07
-17
09
-17
11
-17
01
-18
03
-18
05
-18
07
-18
09
-18
11
-18
01
-19
Ind
ex M
ovem
en
t (R
eb
ased
to
1 a
t 1 J
an
2012)
SSE (China) HSI (Hong Kong) BSESN (India) JKSE (Indonesia) KLSE (Malaysia)
STI (Singapore) KOSPI (South Korea) TAIEX (Taiwan) JP225 (Japan) SETI (Thailand)
-1
0
1
2
3
4
5
6
7
8
9
10
10 Y
ear
Go
v B
on
d Y
ield
* (%
)
China Hong Kong India Indonesia Malaysia Philippines
Singapore S. Korea Taiwan Thailand Vietnam Japan
MILLIMAN REPORT
2018 Embedded Value Results: Asia 15 August 2019
Asian yield curves moved in different directions during 2018, with Indonesia experiencing the highest increase,
and the highest in its 10-year government bond yield, and China experiencing the biggest decline. The
weakening of China’s 10-year bond yield has been attributed to its slowing economy, impacted by the ongoing
trade war with the US. China’s industrial production has slowed down and retail sales growth rate fell to its lowest
level in more than a decade. Indonesia on the other hand became the highest yielding bond market in Asia, after
the 10-year government bond yield closed at 8.05% at the end of 2018. Economists have attributed this to
growing investor confidence in the Indonesian government and inflation being within the targeted range.
Overall, emerging markets in Asia are projected to experience favourable growth over the near to medium
term. However, maintaining robust economic growth momentum will require several key challenges to be
addressed, including:
Major global economies are aiming to boost exports as protectionist government policies become more
common. Many economists believe that continued structural reforms in Asia will be important to mitigate the
risks posed by increasing trade protectionism.
The Organisation for Economic Co-operation and Development (OECD) highlighted the need for Asia to avoid
the economic pitfalls of regulations curtailing developments in the financial technology sector. Despite several
advancements, including improvements in lending and capital-raising platforms, mobile payments and
machine learning tools for managing financial assets, regulatory progress has been uneven and policy gaps
related to potential risks remain.27
On the regulatory front, RBC-type solvency frameworks are already embedded, or are in the process of being
introduced or enhanced, in many Asian markets. China’s C-ROSS Phase II, Hong Kong’s upcoming RBC
framework and Singapore and Thailand’s RBC2 enhancements, are in various stages of development, while
Malaysia is reviewing its RBC framework and India is planning to move to a RBC regime. These changes will
likely impact cost of capital calculations, although it is too early to be definitive about the exact impact, given,
in most cases, that the new rules have still not yet been finalised.
EV continues to be widely used as a performance measurement tool and an external financial disclosure metric
for insurers operating in Asia. EV is also commonly used as an internal financial performance metric, and can be
included as a component of management long-term incentive plans. Broadly speaking, subsidiaries of MNCs,
especially European insurers, utilise more advanced EEV and MCEV methodologies for their EV reporting,
compared with the local and regional insurers, which almost entirely use TEV. In Japan and India, however, there
has been a convergence towards market-consistent methodologies, with more companies adopting the IEV
approach in the latter.
In June 2019, the International Accounting Standards Board (IASB) proposed amendments to IFRS17 to alleviate
concerns and challenges raised about implementing the standard. The IASB has also proposed to delay the
implementation of IFRS17 by one year. Previously, the target effective date for implementation was set as
January 2021.
In this publication, we focus on EV results as at financial year-end 2018.28 In addition to providing an overview of
the methodology insurers used and commenting on any new developments, we have included the following
current ‘hot topics’ that insurers may wish to consider when enhancing their EV approaches in the future:
Determining the risk discount rate
Setting appropriate investment return assumptions
Setting appropriate future solvency capital assumptions
Evaluating the time value of options and guarantees (TVOG)
Disclosures in EV reporting
Other measures of value (e.g., market capitalisation, financial reports based on IFRS or GAAP)
Before covering these topics in detail, we provide a high-level overview of the history of EV, the key components
of EV calculations and the differences between the various types of EV methodologies.
27 Economic Outlook for Southeast Asia, China and India 2018 (OECD Development Centre).
28 For India and Japan, the financial year-end 2018 is 31 March 2019.
MILLIMAN REPORT
2018 Embedded Value Results: Asia 16 August 2019
Overview of embedded value The EV of an insurer is intended to be a measure of the value of the shareholders’ interests in the business. Over
time, various principles and guidance have been issued by industry bodies to achieve consistency among
companies and reporting periods within their own governing territories. For example, guidance notes have been
issued in the UK, Canada, and the US. The two main sets of guidance currently widely used by European
companies and their subsidiaries around the world are the EEV principles and MCEV principles.29
Common to all the various EV principles are the following two major components:
1. Value of in-force business (VIF): The discounted future distributable earnings arising from policies in-force as
at the valuation date.
2. The adjusted net worth (ANW): The shareholders’ net assets, including free surpluses and required capital,
i.e., the amount returned to shareholders should all assets be sold and liabilities settled immediately.
The above two items relate purely to existing policies and do not take into account new business potentially
written in the future. When the value of future new business (akin to goodwill, representing the ability of the
insurer to sell profitable future new business) is added to the two existing components, it results in an appraisal
value, a common metric used to assess the overall economic value of insurance companies.
EV reporting is typically only applicable to long-term life, accident/health and group risk insurance business, often
referred to as ‘covered business.’ This is a critical factor to keep in mind, as there are currently no standards or
guidance in applying EV to general insurance businesses. Hence, for composite insurers (i.e., those that write
general insurance in addition to life insurance), the relationship between market capitalisation and life insurance
EV may be weaker than for pure life insurers. In Asia, however, we do have the anomaly that South Korean
general insurers are allowed to write long-term insurance business, which would, in most jurisdictions, be
categorised as life insurance business. As listed South Korean general insurers produce EV results for their long-
term insurance business, we have included them in this report.
In the following section, we present a brief history of EV reporting, its introduction into Asia and current practices.
HISTORY OF EV REPORTING
EV reporting started in the UK in the 1980s as a way for life insurance companies to give better guidance to
analysts and shareholders on their underlying economic values. At that time, accounting standards were not fully
equipped to handle the unique nature of life insurance businesses, and it was very difficult to use the standard
financial statements to assess a life insurer’s economic value.
The methodology has since spread globally. Early EV methodologies, using deterministic approaches to value
cash flows and implicitly allowing for the cost of policyholder options and guarantees, asset/liability mismatch risk,
credit and other risks and the economic cost of capital through the use of a risk discount rate, are often
characterised as TEV.
Following some TEV-related criticism in the investment community, a group of leading European insurers, known
as the European Insurance CFO Forum (CFO Forum), published more detailed agreements on principles for EV
calculations and disclosures in 2004, which formed the basis for what is now referred to as European EV (EEV)
methodology. EEV provides more standardisation of definitions, required calculations and disclosures, providing
greater comparability among insurers.
The latest evolution in EV reporting came in 2008, with the introduction of the MCEV principles by the same CFO
Forum. These principles introduced mandatory market-consistent valuation of assets, liabilities and financial
risks, while also introducing more specific disclosure requirements. The CFO Forum had originally intended
introducing MCEV as the mandatory standard for its members from 2012 onwards, but this requirement was
withdrawn in 2011 pending the development of Solvency II and IFRS.
29 Formally known as the European Insurance CFO Forum Market Consistent Embedded Value Principles. The MCEV principles are a copyright
of the Stichting CFO Forum Foundation 2008.
MILLIMAN REPORT
2018 Embedded Value Results: Asia 17 August 2019
The prevalence of EV reporting continues to grow among insurers outside of Europe, including those in Canada
and Asia. However, the future of EV reporting in Europe is in some doubt since the introduction of Solvency II
and developments in IFRS financial reporting. Over the last few years, a number of companies have discontinued
EV reporting, citing the new Solvency Il regime's market-consistent framework which incorporates best estimate
cash flows for assets and liabilities. Some companies have started using new shareholder value metrics, based
on Solvency Il Own Funds, adjusted for certain features (e.g., contract boundaries, cost of capital, ring-fenced
funds restrictions and matching adjustment application restrictions), which are considered by the companies
producing these metrics as not being consistent with their economic views.
EV IN ASIA
EV was initially introduced into Asia through the subsidiaries and joint ventures of European companies. Since
then, many domestic insurers have introduced EV reporting, with major life insurers in the significant Asian
insurance markets now calculating and disclosing EV in some form. There are currently different EV
methodologies being used in Asia: domestic insurers outside of India and Asian MNCs tend to report on a TEV
basis, while European MNCs and Japanese insurers favour MCEV, EEV30 or Market Consistent EEV31 (MC-
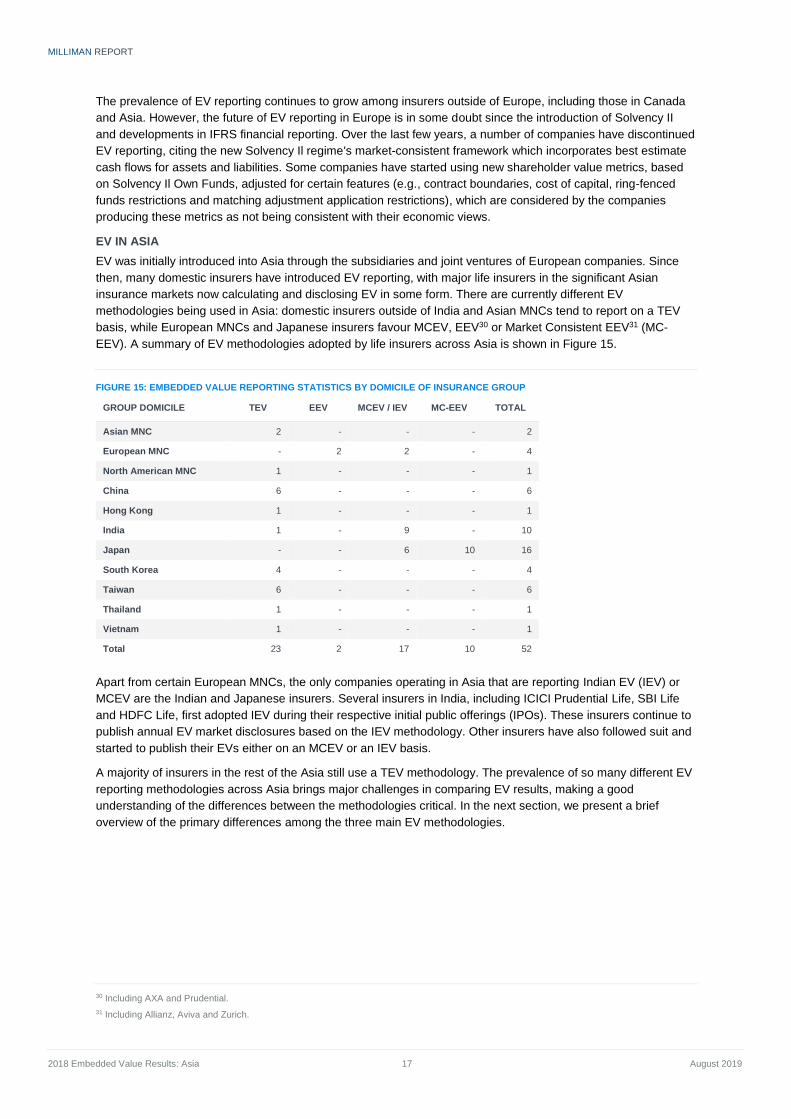
EEV). A summary of EV methodologies adopted by life insurers across Asia is shown in Figure 15.
FIGURE 15: EMBEDDED VALUE REPORTING STATISTICS BY DOMICILE OF INSURANCE GROUP
GROUP DOMICILE TEV EEV MCEV / IEV MC-EEV TOTAL
Asian MNC 2 - - - 2
European MNC - 2 2 - 4
North American MNC 1 - - - 1
China 6 - - - 6
Hong Kong 1 - - - 1
India 1 - 9 - 10
Japan - - 6 10 16
South Korea 4 - - - 4
Taiwan 6 - - - 6
Thailand 1 - - - 1
Vietnam 1 - - - 1
Total 23 2 17 10 52
Apart from certain European MNCs, the only companies operating in Asia that are reporting Indian EV (IEV) or
MCEV are the Indian and Japanese insurers. Several insurers in India, including ICICI Prudential Life, SBI Life
and HDFC Life, first adopted IEV during their respective initial public offerings (IPOs). These insurers continue to
publish annual EV market disclosures based on the IEV methodology. Other insurers have also followed suit and
started to publish their EVs either on an MCEV or an IEV basis.
A majority of insurers in the rest of the Asia still use a TEV methodology. The prevalence of so many different EV
reporting methodologies across Asia brings major challenges in comparing EV results, making a good
understanding of the differences between the methodologies critical. In the next section, we present a brief
overview of the primary differences among the three main EV methodologies.
30 Including AXA and Prudential.
31 Including Allianz, Aviva and Zurich.
MILLIMAN REPORT
2018 Embedded Value Results: Asia 18 August 2019
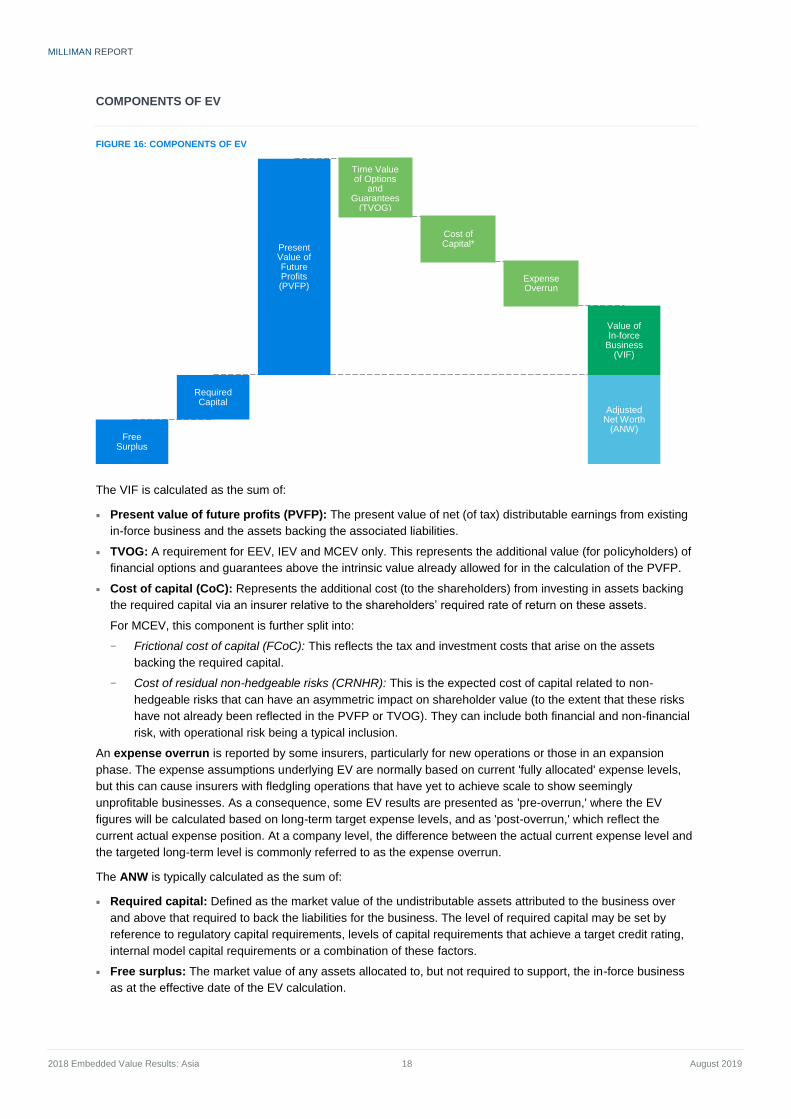
COMPONENTS OF EV
FIGURE 16: COMPONENTS OF EV
The VIF is calculated as the sum of:
Present value of future profits (PVFP): The present value of net (of tax) distributable earnings from existing
in-force business and the assets backing the associated liabilities.
TVOG: A requirement for EEV, IEV and MCEV only. This represents the additional value (for policyholders) of
financial options and guarantees above the intrinsic value already allowed for in the calculation of the PVFP.
Cost of capital (CoC): Represents the additional cost (to the shareholders) from investing in assets backing
the required capital via an insurer relative to the shareholders’ required rate of return on these assets.
For MCEV, this component is further split into:
− Frictional cost of capital (FCoC): This reflects the tax and investment costs that arise on the assets
backing the required capital.
− Cost of residual non-hedgeable risks (CRNHR): This is the expected cost of capital related to non-
hedgeable risks that can have an asymmetric impact on shareholder value (to the extent that these risks
have not already been reflected in the PVFP or TVOG). They can include both financial and non-financial
risk, with operational risk being a typical inclusion.
An expense overrun is reported by some insurers, particularly for new operations or those in an expansion
phase. The expense assumptions underlying EV are normally based on current 'fully allocated' expense levels,
but this can cause insurers with fledgling operations that have yet to achieve scale to show seemingly
unprofitable businesses. As a consequence, some EV results are presented as 'pre-overrun,' where the EV
figures will be calculated based on long-term target expense levels, and as 'post-overrun,' which reflect the
current actual expense position. At a company level, the difference between the actual current expense level and
the targeted long-term level is commonly referred to as the expense overrun.
The ANW is typically calculated as the sum of:
Required capital: Defined as the market value of the undistributable assets attributed to the business over
and above that required to back the liabilities for the business. The level of required capital may be set by
reference to regulatory capital requirements, levels of capital requirements that achieve a target credit rating,
internal model capital requirements or a combination of these factors.
Free surplus: The market value of any assets allocated to, but not required to support, the in-force business
as at the effective date of the EV calculation.
Free Surplus
Required Capital
Present Value of Future Profits (PVFP)
Time Value of Options
and Guarantees
(TVOG)
Cost of Capital*
Expense Overrun
Value of In-force
Business (VIF)
Adjusted Net Worth
(ANW)
MILLIMAN REPORT
2018 Embedded Value Results: Asia 19 August 2019
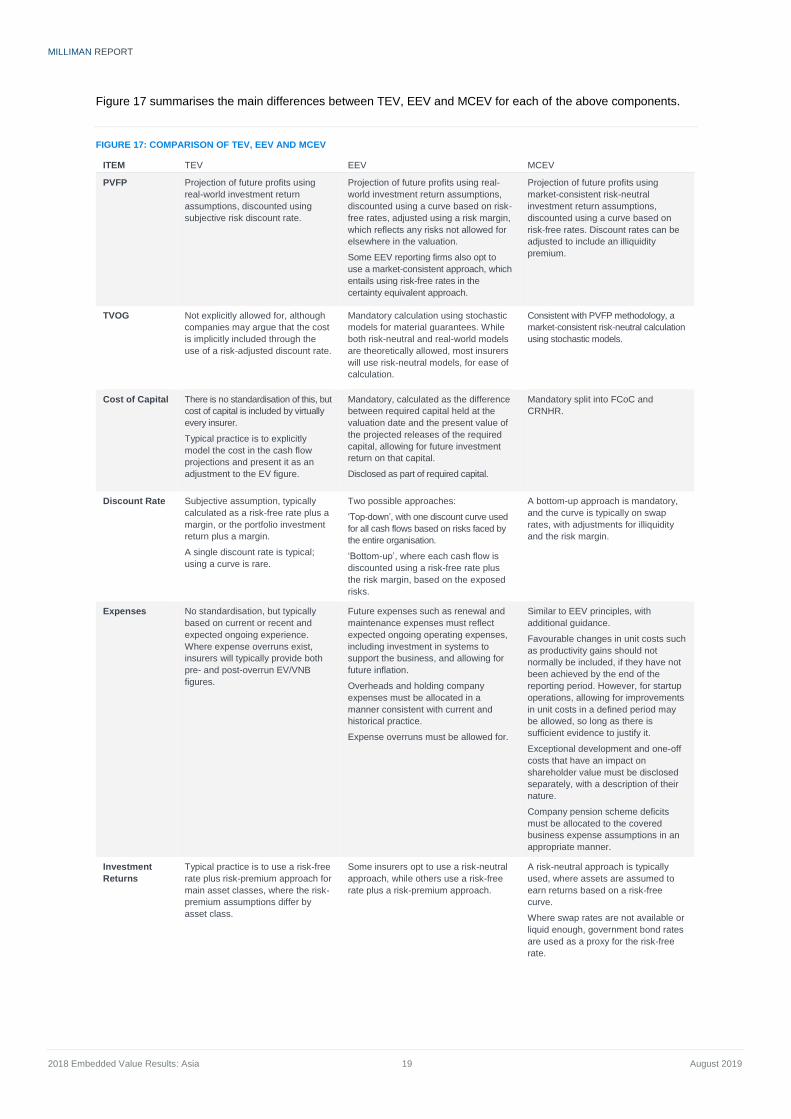
Figure 17 summarises the main differences between TEV, EEV and MCEV for each of the above components.
FIGURE 17: COMPARISON OF TEV, EEV AND MCEV
ITEM TEV EEV MCEV
PVFP Projection of future profits using
real-world investment return
assumptions, discounted using
subjective risk discount rate.
Projection of future profits using real-
world investment return assumptions,
discounted using a curve based on risk-
free rates, adjusted using a risk margin,
which reflects any risks not allowed for
elsewhere in the valuation.
Some EEV reporting firms also opt to
use a market-consistent approach, which
entails using risk-free rates in the
certainty equivalent approach.
Projection of future profits using
market-consistent risk-neutral
investment return assumptions,
discounted using a curve based on
risk-free rates. Discount rates can be
adjusted to include an illiquidity
premium.
TVOG Not explicitly allowed for, although
companies may argue that the cost
is implicitly included through the
use of a risk-adjusted discount rate.
Mandatory calculation using stochastic
models for material guarantees. While
both risk-neutral and real-world models
are theoretically allowed, most insurers
will use risk-neutral models, for ease of
calculation.
Consistent with PVFP methodology, a
market-consistent risk-neutral calculation
using stochastic models.
Cost of Capital There is no standardisation of this, but
cost of capital is included by virtually
every insurer.
Typical practice is to explicitly
model the cost in the cash flow
projections and present it as an
adjustment to the EV figure.
Mandatory, calculated as the difference
between required capital held at the
valuation date and the present value of
the projected releases of the required
capital, allowing for future investment
return on that capital.
Disclosed as part of required capital.
Mandatory split into FCoC and
CRNHR.
Discount Rate Subjective assumption, typically
calculated as a risk-free rate plus a
margin, or the portfolio investment
return plus a margin.
A single discount rate is typical;
using a curve is rare.
Two possible approaches:
‘Top-down’, with one discount curve used
for all cash flows based on risks faced by
the entire organisation.
‘Bottom-up’, where each cash flow is
discounted using a risk-free rate plus
the risk margin, based on the exposed
risks.
A bottom-up approach is mandatory,
and the curve is typically on swap
rates, with adjustments for illiquidity
and the risk margin.
Expenses No standardisation, but typically
based on current or recent and
expected ongoing experience.
Where expense overruns exist,
insurers will typically provide both
pre- and post-overrun EV/VNB
figures.
Future expenses such as renewal and
maintenance expenses must reflect
expected ongoing operating expenses,
including investment in systems to
support the business, and allowing for
future inflation.
Overheads and holding company
expenses must be allocated in a
manner consistent with current and
historical practice.
Expense overruns must be allowed for.
Similar to EEV principles, with
additional guidance.
Favourable changes in unit costs such
as productivity gains should not
normally be included, if they have not
been achieved by the end of the
reporting period. However, for startup
operations, allowing for improvements
in unit costs in a defined period may
be allowed, so long as there is
sufficient evidence to justify it.
Exceptional development and one-off
costs that have an impact on
shareholder value must be disclosed
separately, with a description of their
nature.
Company pension scheme deficits
must be allocated to the covered
business expense assumptions in an
appropriate manner.
Investment
Returns
Typical practice is to use a risk-free
rate plus risk-premium approach for
main asset classes, where the risk-
premium assumptions differ by
asset class.
Some insurers opt to use a risk-neutral
approach, while others use a risk-free
rate plus a risk-premium approach.
A risk-neutral approach is typically
used, where assets are assumed to
earn returns based on a risk-free
curve.
Where swap rates are not available or
liquid enough, government bond rates
are used as a proxy for the risk-free
rate.
MILLIMAN REPORT
2018 Embedded Value Results: Asia 20 August 2019
TEV VS. EEV VS. MCEV
The primary advantage that EEV and MCEV approaches have over TEV is the greater standardisation (and less
subjectivity) of assumptions, methodologies and disclosures, leading to better comparability from an investor’s
viewpoint. For example, MCEV assumes that assets earn the risk-free rate of return. This approach avoids the
use of actual risk-weighted yields or management’s view of future market directions in EV calculations, as is the
case with TEV (and some EEV) reporting.
Insurers reporting on EEV or MCEV bases will typically experience greater volatility in EV results, especially if a
market-consistent basis is used. This can complicate reporting and investor disclosures and is one of the reasons
often cited by industry insiders as to why most Asian companies have not yet moved from TEV to EEV or MCEV.
Another key reason put forward is the increased capabilities required to fully implement EEV or MCEV reporting.
For example, the implementation of proper TVOG calculations requires the use of stochastic models to value
embedded policy options and guarantees. This inevitably means using specialised economic scenario generator
(ESG) software. This will add to financial reporting lead times. In addition, it is difficult to calibrate the ESG for
Asian capital markets, which are in general not as deep or liquid as those in the US or Europe. Given this, it is
understandable that Asian insurers are not prioritising moving from TEV, which is itself already a useful metric for
managing their businesses, so long as it is calculated robustly and consistently. However, in a region where long-
term guarantees are so prevalent and yield curves are at, or close to, historic lows, not explicitly allowing for
TVOG is an obvious and significant flaw in companies’ TEV financial reporting.
INDIAN EV
In 2013, the Institute of Actuaries of India published Actuarial Practice Standard 10 (APS10), 'Determination of
the Embedded Value,’ establishing a standard for what is now known as Indian EV (IEV). It explicitly takes
inspiration from, and is generally commensurate with, the MCEV principles. APS10 provided minimum disclosure
requirements for Indian life insurers that are seeking an IPO share flotation.
For voluntary ongoing reporting and disclosures that are not related to an IPO, Indian insurers are free to choose
their preferred EV methodologies, with no requirement to adopt IEV. In fact, Indian insurers have chosen almost
every variety of EV reporting principles, with IEV, TEV and MCEV all present in the market, although we have
started to see a gradual convergence towards market-consistent methodologies (IEV, MCEV) in recent years.
MILLIMAN REPORT
2018 Embedded Value Results: Asia 21 August 2019
Embedded value results This section presents EV results under three different lenses:
1. Asia-wide
2. Company by company
3. Detailed market-level
We have also provided a summary of changes in EV/VNB disclosures in the region.
The majority of our commentary is included in the ‘Detailed Market Analysis’ section below.
The values presented in this section relate to EV results for life insurance and other long-term insurance
operations in Asia. Because of the way some companies group their business, Asian operations are sometimes
included under ‘international’ or ‘emerging markets’ business units, which may include non-Asian operations.
For these 'grouped' business units (i.e., those that include Asian and non-Asian operations), the total value has
been included in this report when we believe that most of the value has been generated in Asia.
RECENT UPDATES ON REPORTED DISCLOSURES
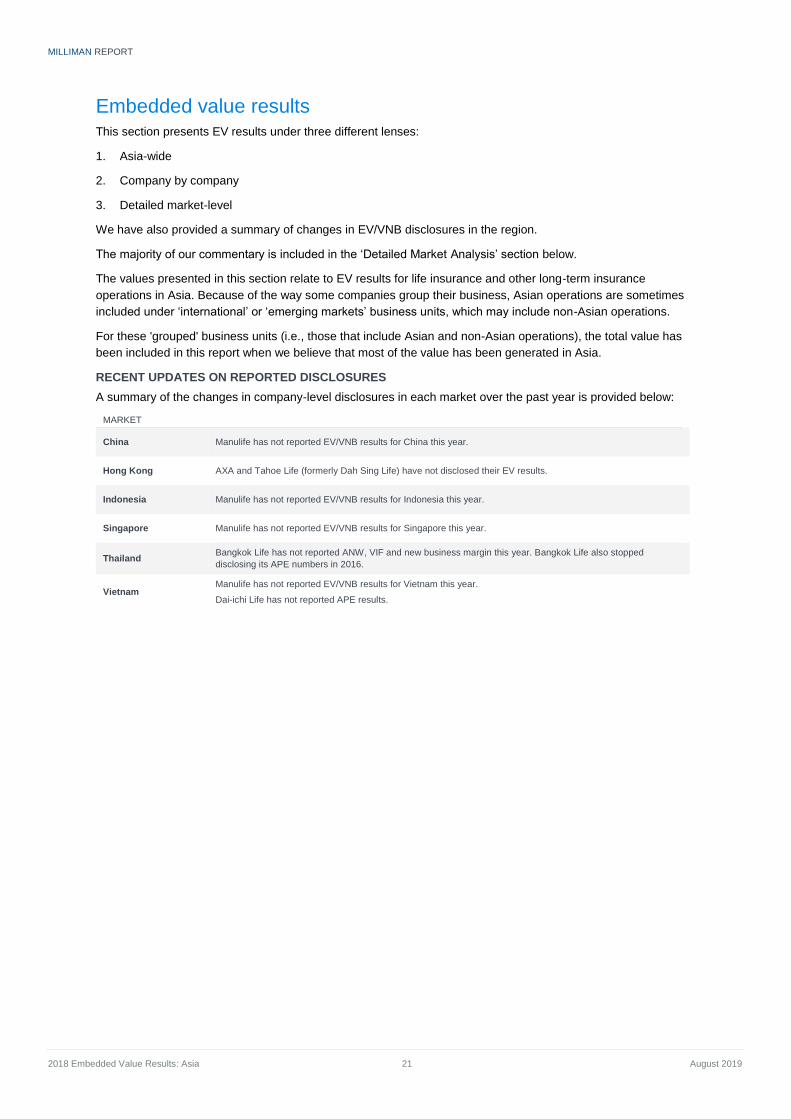
A summary of the changes in company-level disclosures in each market over the past year is provided below:
MARKET
China Manulife has not reported EV/VNB results for China this year.
Hong Kong AXA and Tahoe Life (formerly Dah Sing Life) have not disclosed their EV results.
Indonesia Manulife has not reported EV/VNB results for Indonesia this year.
Singapore Manulife has not reported EV/VNB results for Singapore this year.
Thailand Bangkok Life has not reported ANW, VIF and new business margin this year. Bangkok Life also stopped
disclosing its APE numbers in 2016.
Vietnam Manulife has not reported EV/VNB results for Vietnam this year.
Dai-ichi Life has not reported APE results.
MILLIMAN REPORT
2018 Embedded Value Results: Asia 22 August 2019
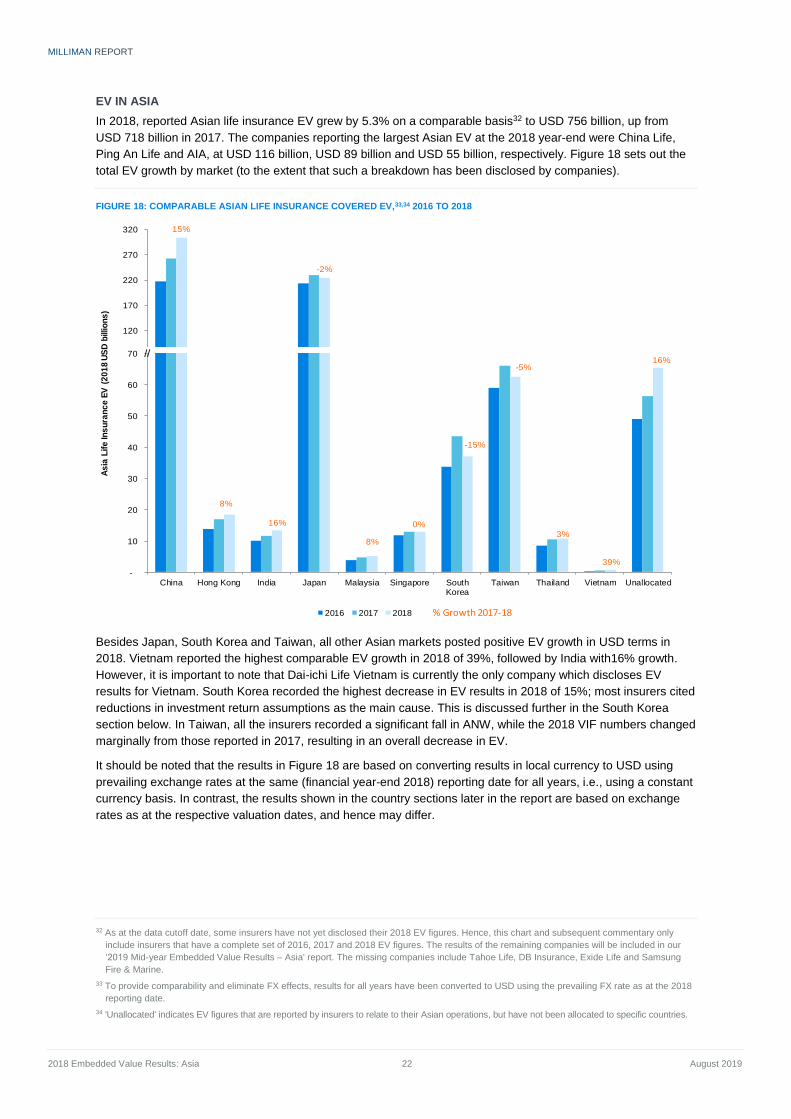
EV IN ASIA
In 2018, reported Asian life insurance EV grew by 5.3% on a comparable basis32 to USD 756 billion, up from
USD 718 billion in 2017. The companies reporting the largest Asian EV at the 2018 year-end were China Life,
Ping An Life and AIA, at USD 116 billion, USD 89 billion and USD 55 billion, respectively. Figure 18 sets out the
total EV growth by market (to the extent that such a breakdown has been disclosed by companies).
FIGURE 18: COMPARABLE ASIAN LIFE INSURANCE COVERED EV,33,34 2016 TO 2018
Besides Japan, South Korea and Taiwan, all other Asian markets posted positive EV growth in USD terms in
2018. Vietnam reported the highest comparable EV growth in 2018 of 39%, followed by India with16% growth.
However, it is important to note that Dai-ichi Life Vietnam is currently the only company which discloses EV
results for Vietnam. South Korea recorded the highest decrease in EV results in 2018 of 15%; most insurers cited
reductions in investment return assumptions as the main cause. This is discussed further in the South Korea
section below. In Taiwan, all the insurers recorded a significant fall in ANW, while the 2018 VIF numbers changed
marginally from those reported in 2017, resulting in an overall decrease in EV.
It should be noted that the results in Figure 18 are based on converting results in local currency to USD using
prevailing exchange rates at the same (financial year-end 2018) reporting date for all years, i.e., using a constant
currency basis. In contrast, the results shown in the country sections later in the report are based on exchange
rates as at the respective valuation dates, and hence may differ.
32 As at the data cutoff date, some insurers have not yet disclosed their 2018 EV figures. Hence, this chart and subsequent commentary only
include insurers that have a complete set of 2016, 2017 and 2018 EV figures. The results of the remaining companies will be included in our
‘2019 Mid-year Embedded Value Results – Asia' report. The missing companies include Tahoe Life, DB Insurance, Exide Life and Samsung
Fire & Marine.
33 To provide comparability and eliminate FX effects, results for all years have been converted to USD using the prevailing FX rate as at the 2018
reporting date.
34 'Unallocated' indicates EV figures that are reported by insurers to relate to their Asian operations, but have not been allocated to specific countries.
15%
-2%
70
120
170
220
270
320
8%
16%
8%
0%
-15%
-5%
3%
39%
16%
-
10
20
30
40
50
60
70
China Hong Kong India Japan Malaysia Singapore SouthKorea
Taiwan Thailand Vietnam Unallocated
2016 2017 2018 % Growth 2017-18
//
As
ia L
ife
In
su
ran
ce
EV
(2
01
8 U
SD
billio
ns
)

MILLIMAN REPORT
2018 Embedded Value Results: Asia 23 August 2019
FIGURE 19: COMPARABLE ASIAN LIFE INSURANCE COVERED ANW, 2016 TO 2018
FIGURE 20: COMPARABLE ASIAN LIFE INSURANCE COVERED VIF, 2016 TO 2018
The aggregate ANW for the Asian life insurance sector increased in 2018, despite four markets individually reporting
a fall last year (namely Hong Kong, Singapore, South Korea and Taiwan). Vietnam reported the highest increase of
35%, followed by India with a 21% growth. In contrast, Taiwan recorded the greatest fall of 16% in 2018.
With the exceptions of Japan and South Korea, VIF growth was positive for all markets. Vietnam recorded the
highest increase of 43% in 2018, followed by India with a 21% growth. Japan recorded the greatest fall in VIF of
394% in 2018, where the total life insurance sector VIF turned negative in 2018, but this fall was offset by gains in
ANW, leading to a small reduction in EV. South Korea also saw a decline in VIF of 55%, driven mainly from
reduced investment return assumptions for all insurers.
10%
8%
-2% -16%
10,000
50,000
90,000
130,000
170,000
210,000
250,000
290,000
-1%
11%
4%
-5%
5%
35%
-
1,000
2,000
3,000
4,000
5,000
6,000
7,000
8,000
9,000
10,000
China Hong Kong India Japan Malaysia Singapore South Korea Taiwan Thailand Vietnam
AN
W (
US
D m
illio
ns
)
2016 2017 2018 % Growth 2017-18
//
20%
41,500
91,500
141,500
191,500
15%
21%
-394%
11%
5%-55%
5%
3%
43%
(18,500)
(8,500)
1,500
11,500
21,500
31,500
41,500
China Hong Kong India Japan Malaysia Singapore South Korea Taiwan Thailand Vietnam
VIF
(U
SD
millio
ns
)
2016 2017 2018 % Growth 2017-18
//
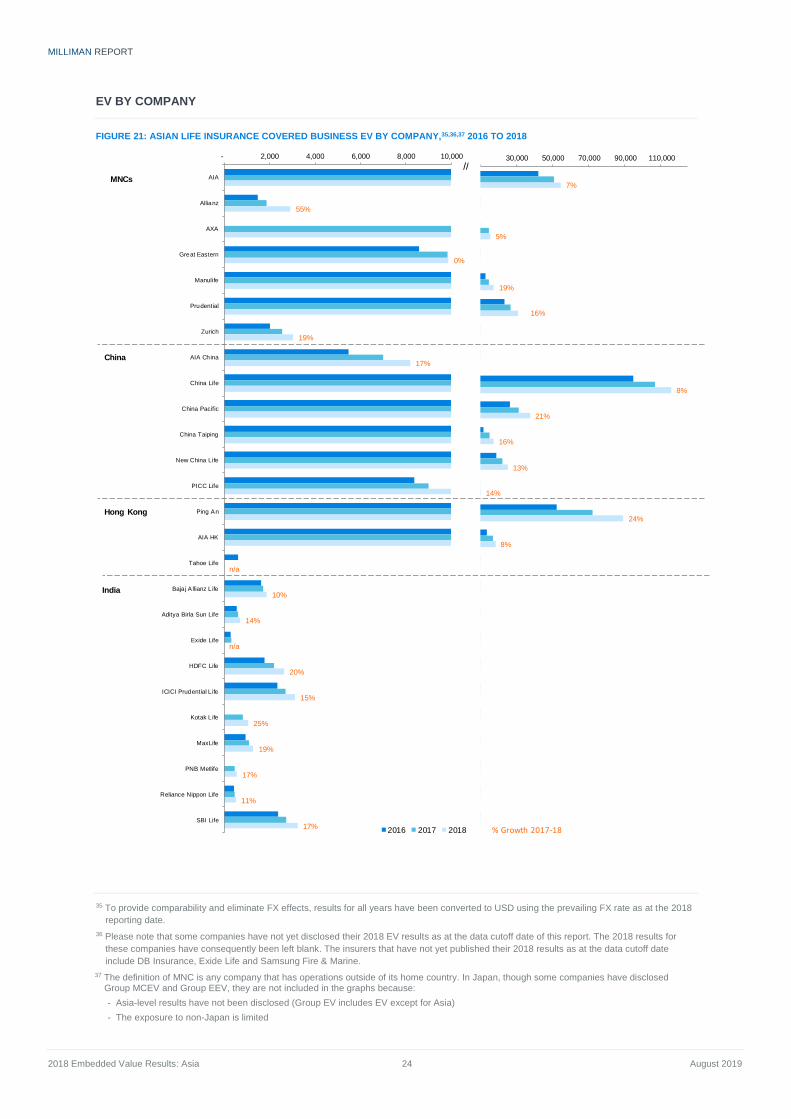
MILLIMAN REPORT
2018 Embedded Value Results: Asia 24 August 2019
EV BY COMPANY
FIGURE 21: ASIAN LIFE INSURANCE COVERED BUSINESS EV BY COMPANY,35,36,37 2016 TO 2018
35 To provide comparability and eliminate FX effects, results for all years have been converted to USD using the prevailing FX rate as at the 2018
reporting date.
36 Please note that some companies have not yet disclosed their 2018 EV results as at the data cutoff date of this report. The 2018 results for
these companies have consequently been left blank. The insurers that have not yet published their 2018 results as at the data cutoff date
include DB Insurance, Exide Life and Samsung Fire & Marine.
37 The definition of MNC is any company that has operations outside of its home country. In Japan, though some companies have disclosed Group MCEV and Group EEV, they are not included in the graphs because:
- Asia-level results have not been disclosed (Group EV includes EV except for Asia)
- The exposure to non-Japan is limited
7%
5%
19%
16%
8%
21%
16%
13%
14%
24%
8%
10,000 30,000 50,000 70,000 90,000 110,000
55%
0%
19%
17%
n/a
10%
14%
n/a
20%
15%
25%
19%
17%
11%
17%
- 2,000 4,000 6,000 8,000 10,000
AIA
Allianz
AXA
Great Eastern
Manuli fe
Prudential
Zurich
AIA China
China Life
China Pacific
China Taiping
New China Li fe
PICC Life
Ping An
AIA HK
Tahoe Life
Baja j A llianz L ife
Aditya Birla Sun Life
Exide Life
HDFC Life
ICICI Prudential L ife
Kotak L ife
MaxLife
PNB Metlife
Reliance Nippon Life
SBI Life
Reported Asia EV (2018 USD millions)
2016 2017 2018
China
Hong Kong
MNCs
//
India
% Growth 2017-18
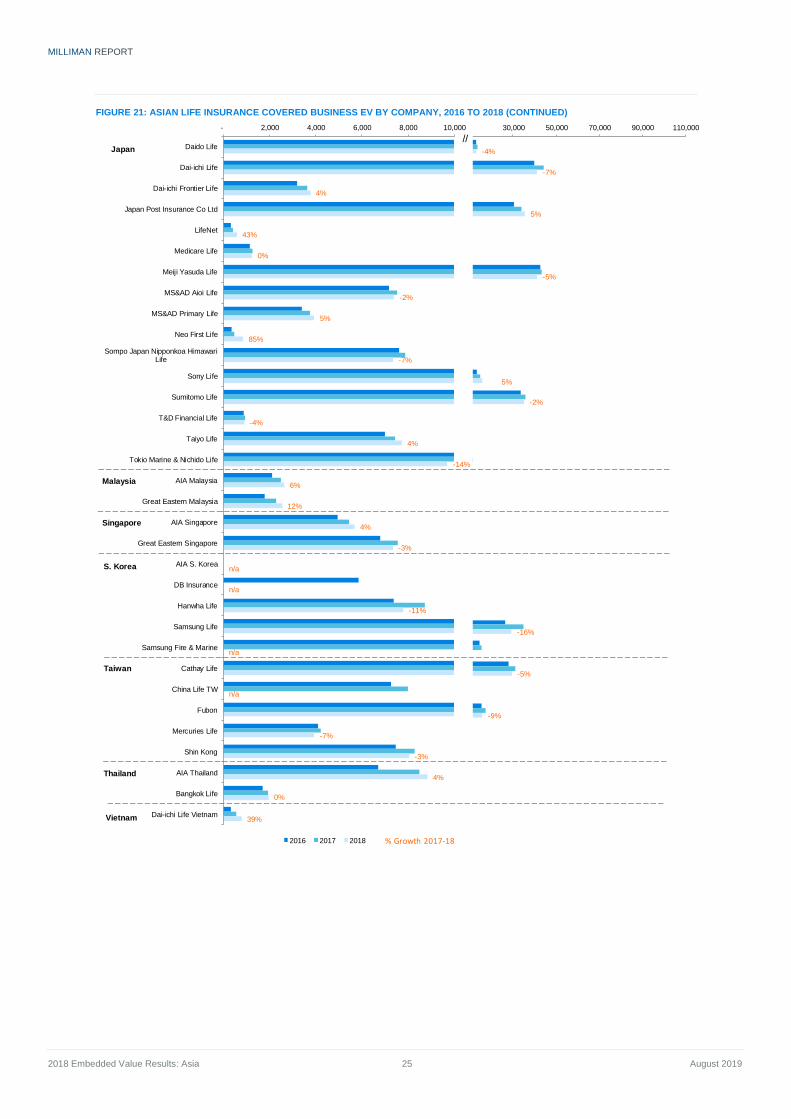
MILLIMAN REPORT
2018 Embedded Value Results: Asia 25 August 2019
FIGURE 21: ASIAN LIFE INSURANCE COVERED BUSINESS EV BY COMPANY, 2016 TO 2018 (CONTINUED)
-4%
-7%
5%
-5%
5%
-2%
-16%
-5%
-9%
10,000 30,000 50,000 70,000 90,000 110,000
4%
43%
0%
-2%
5%
85%
-7%
-4%
4%
-14%
6%
12%
4%
-3%
n/a
n/a
-11%
n/a
n/a
-7%
-3%
4%
0%
39%
- 2,000 4,000 6,000 8,000 10,000
Daido Life
Dai-ichi Life
Dai-ichi Frontier Life
Japan Post Insurance Co Ltd
LifeNet
Medicare Life
Meiji Yasuda Life
MS&AD Aioi Life
MS&AD Primary Life
Neo First Life
Sompo Japan Nipponkoa HimawariLife
Sony Life
Sumitomo Life
T&D Financial Life
Taiyo Life
Tokio Marine & Nichido Life
AIA Malaysia
Great Eastern Malaysia
AIA Singapore
Great Eastern Singapore
AIA S. Korea
DB Insurance
Hanwha Life
Samsung Life
Samsung Fire & Marine
Cathay Life
China Life TW
Fubon
Mercuries Life
Shin Kong
AIA Thailand
Bangkok Life
Dai-ichi Life Vietnam
Reported Asia EV (2018 USD millions)
2016 2017 2018 % Growth 2017-18
Japan
Singapore
S. Korea
Taiwan
Malaysia
Thailand
Vietnam
//
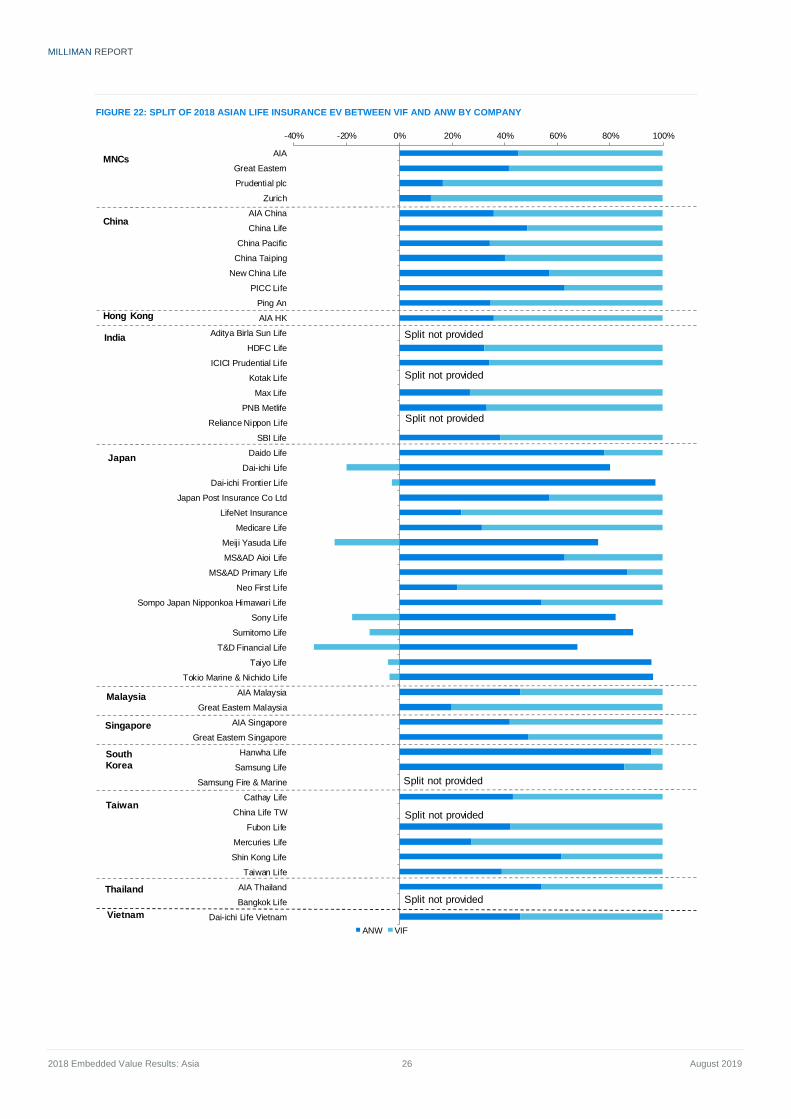
MILLIMAN REPORT
2018 Embedded Value Results: Asia 26 August 2019
FIGURE 22: SPLIT OF 2018 ASIAN LIFE INSURANCE EV BETWEEN VIF AND ANW BY COMPANY
-40% -20% 0% 20% 40% 60% 80% 100%
AIA
Great Eastern
Prudential plc
Zurich
AIA China
China Life
China Pacific
China Taiping
New China Life
PICC Life
Ping An
AIA HK
Aditya Birla Sun Life
HDFC Life
ICICI Prudential Life
Kotak Life
Max Life
PNB Metlife
Reliance Nippon Life
SBI Life
Daido Life
Dai-ichi Life
Dai-ichi Frontier Life
Japan Post Insurance Co Ltd
LifeNet Insurance
Medicare Life
Meiji Yasuda Life
MS&AD Aioi Life
MS&AD Primary Life
Neo First Life
Sompo Japan Nipponkoa Himawari Life
Sony Life
Sumitomo Life
T&D Financial Life
Taiyo Life
Tokio Marine & Nichido Life
AIA Malaysia
Great Eastern Malaysia
AIA Singapore
Great Eastern Singapore
Hanwha Life
Samsung Life
Samsung Fire & Marine
Cathay Life
China Life TW
Fubon Life
Mercuries Life
Shin Kong Life
Taiwan Life
AIA Thailand
Bangkok Life
Dai-ichi Life Vietnam
Split of 2018 Asian Life Insurance EV betw een VIF and ANW
ANW VIF
Hong Kong
China
MNCs
India
SouthKorea
Taiwan
Thailand
Split not provided
Vietnam
Singapore
Malaysia
Split not provided
Japan
Split not provided
Split not provided
Split not provided
Split not provided
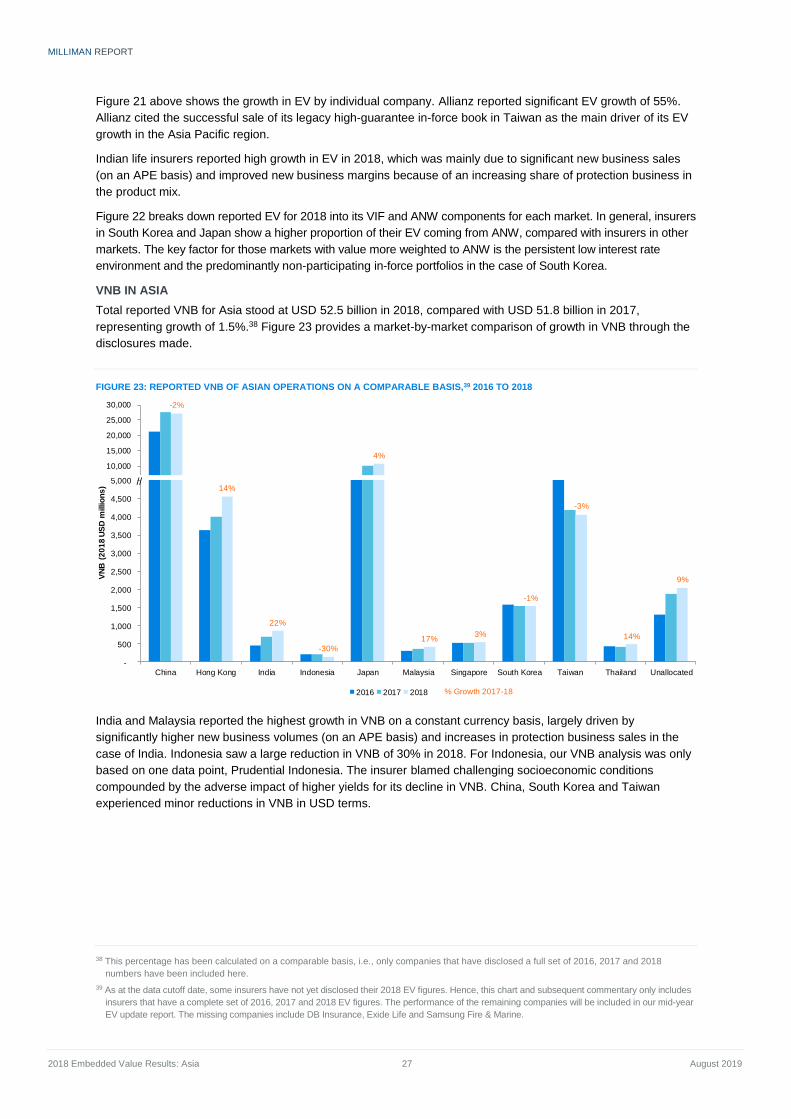
MILLIMAN REPORT
2018 Embedded Value Results: Asia 27 August 2019
Figure 21 above shows the growth in EV by individual company. Allianz reported significant EV growth of 55%.
Allianz cited the successful sale of its legacy high-guarantee in-force book in Taiwan as the main driver of its EV
growth in the Asia Pacific region.
Indian life insurers reported high growth in EV in 2018, which was mainly due to significant new business sales
(on an APE basis) and improved new business margins because of an increasing share of protection business in
the product mix.
Figure 22 breaks down reported EV for 2018 into its VIF and ANW components for each market. In general, insurers
in South Korea and Japan show a higher proportion of their EV coming from ANW, compared with insurers in other
markets. The key factor for those markets with value more weighted to ANW is the persistent low interest rate
environment and the predominantly non-participating in-force portfolios in the case of South Korea.
VNB IN ASIA
Total reported VNB for Asia stood at USD 52.5 billion in 2018, compared with USD 51.8 billion in 2017,
representing growth of 1.5%.38 Figure 23 provides a market-by-market comparison of growth in VNB through the
disclosures made.
FIGURE 23: REPORTED VNB OF ASIAN OPERATIONS ON A COMPARABLE BASIS,39 2016 TO 2018
India and Malaysia reported the highest growth in VNB on a constant currency basis, largely driven by
significantly higher new business volumes (on an APE basis) and increases in protection business sales in the
case of India. Indonesia saw a large reduction in VNB of 30% in 2018. For Indonesia, our VNB analysis was only
based on one data point, Prudential Indonesia. The insurer blamed challenging socioeconomic conditions
compounded by the adverse impact of higher yields for its decline in VNB. China, South Korea and Taiwan
experienced minor reductions in VNB in USD terms.
38 This percentage has been calculated on a comparable basis, i.e., only companies that have disclosed a full set of 2016, 2017 and 2018
numbers have been included here.
39 As at the data cutoff date, some insurers have not yet disclosed their 2018 EV figures. Hence, this chart and subsequent commentary only includes
insurers that have a complete set of 2016, 2017 and 2018 EV figures. The performance of the remaining companies will be included in our mid-year
EV update report. The missing companies include DB Insurance, Exide Life and Samsung Fire & Marine.
-2%
4%
5,000
10,000
15,000
20,000
25,000
30,000
14%
22%
-30%
17%3%
-1%
-3%
14%
9%
-
500
1,000
1,500
2,000
2,500
3,000
3,500
4,000
4,500
5,000
China Hong Kong India Indonesia Japan Malaysia Singapore South Korea Taiwan Thailand Unallocated
VN
B (
20
18
US
D m
illio
ns
)
2016 2017 2018 % Growth 2017-18
//
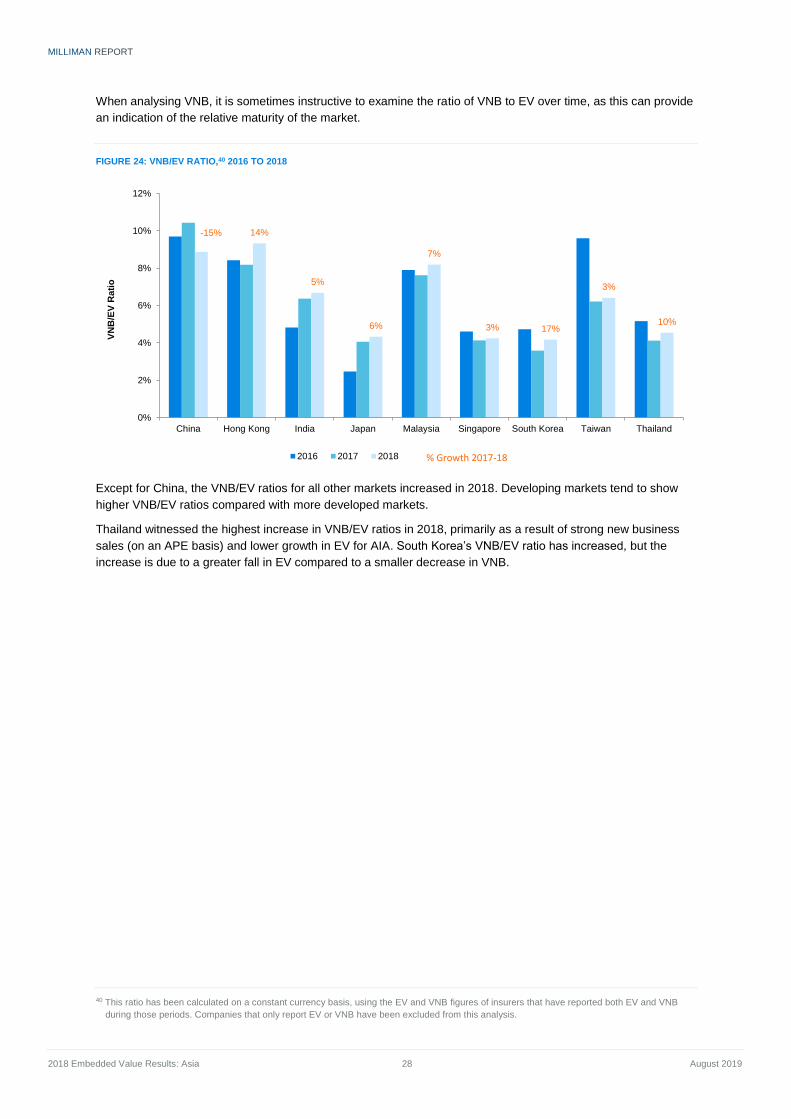
MILLIMAN REPORT
2018 Embedded Value Results: Asia 28 August 2019
When analysing VNB, it is sometimes instructive to examine the ratio of VNB to EV over time, as this can provide
an indication of the relative maturity of the market.
FIGURE 24: VNB/EV RATIO,40 2016 TO 2018
Except for China, the VNB/EV ratios for all other markets increased in 2018. Developing markets tend to show
higher VNB/EV ratios compared with more developed markets.
Thailand witnessed the highest increase in VNB/EV ratios in 2018, primarily as a result of strong new business
sales (on an APE basis) and lower growth in EV for AIA. South Korea’s VNB/EV ratio has increased, but the
increase is due to a greater fall in EV compared to a smaller decrease in VNB.
40 This ratio has been calculated on a constant currency basis, using the EV and VNB figures of insurers that have reported both EV and VNB
during those periods. Companies that only report EV or VNB have been excluded from this analysis.
-15% 14%
5%
6%
7%
3% 17%
3%
10%
0%
2%
4%
6%
8%
10%
12%
China Hong Kong India Japan Malaysia Singapore South Korea Taiwan Thailand
VN
B/E
V R
ati
o
2016 2017 2018 % Growth 2017-18
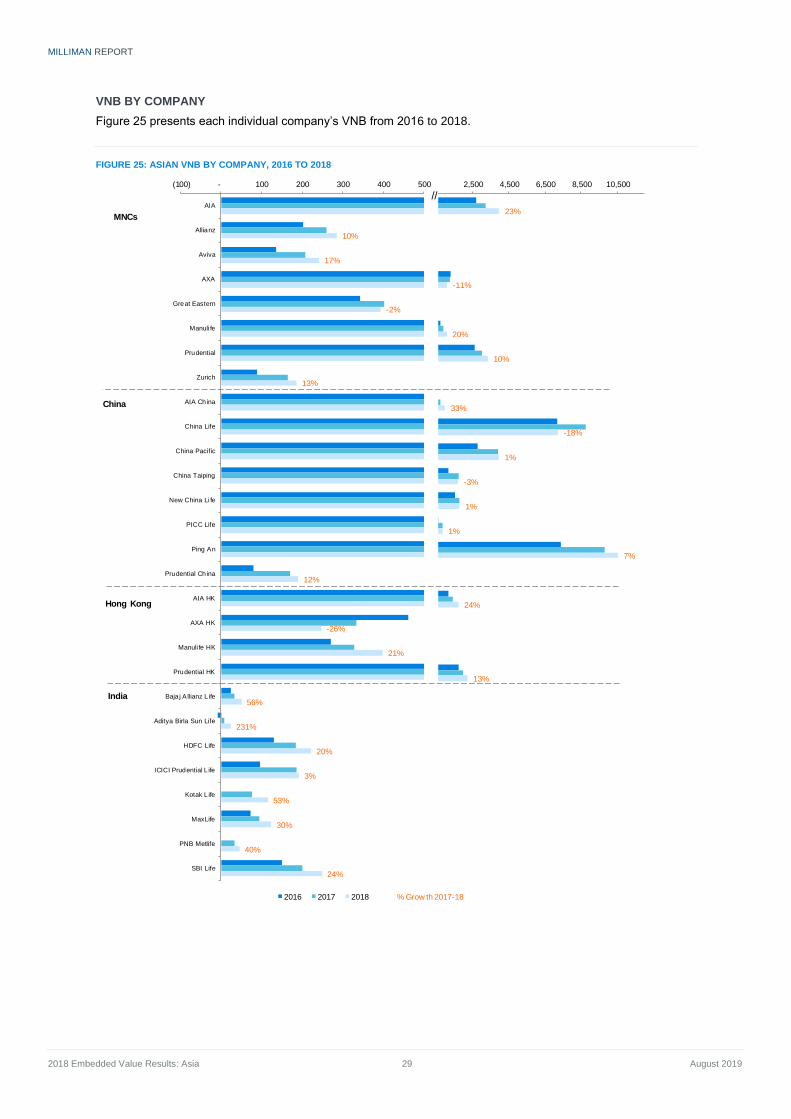
MILLIMAN REPORT
2018 Embedded Value Results: Asia 29 August 2019
VNB BY COMPANY
Figure 25 presents each individual company’s VNB from 2016 to 2018.
FIGURE 25: ASIAN VNB BY COMPANY, 2016 TO 2018
23%
-11%
20%
10%
33%
-18%
1%
-3%
1%
1%
7%
24%
13%
500 2,500 4,500 6,500 8,500 10,500
//
10%
17%
-2%
13%
12%
-26%
21%
56%
231%
20%
3%
53%
30%
40%
24%
(100) - 100 200 300 400 500
AIA
Allianz
Aviva
AXA
Great Eastern
Manuli fe
Prudential
Zurich
AIA China
China Life
China Pacific
China Taiping
New China Li fe
PICC Life
Ping An
Prudential China
AIA HK
AXA HK
Manuli fe HK
Prudential HK
Baja j A llianz L ife
Aditya Birla Sun Life
HDFC Life
ICICI Prudential L ife
Kotak L ife
MaxLife
PNB Metlife
SBI Life
Reported Asia VNB (2018 USD millions)
2016 2017 2018
//
% Grow th 2017-18
China
Hong Kong
MNCs
India
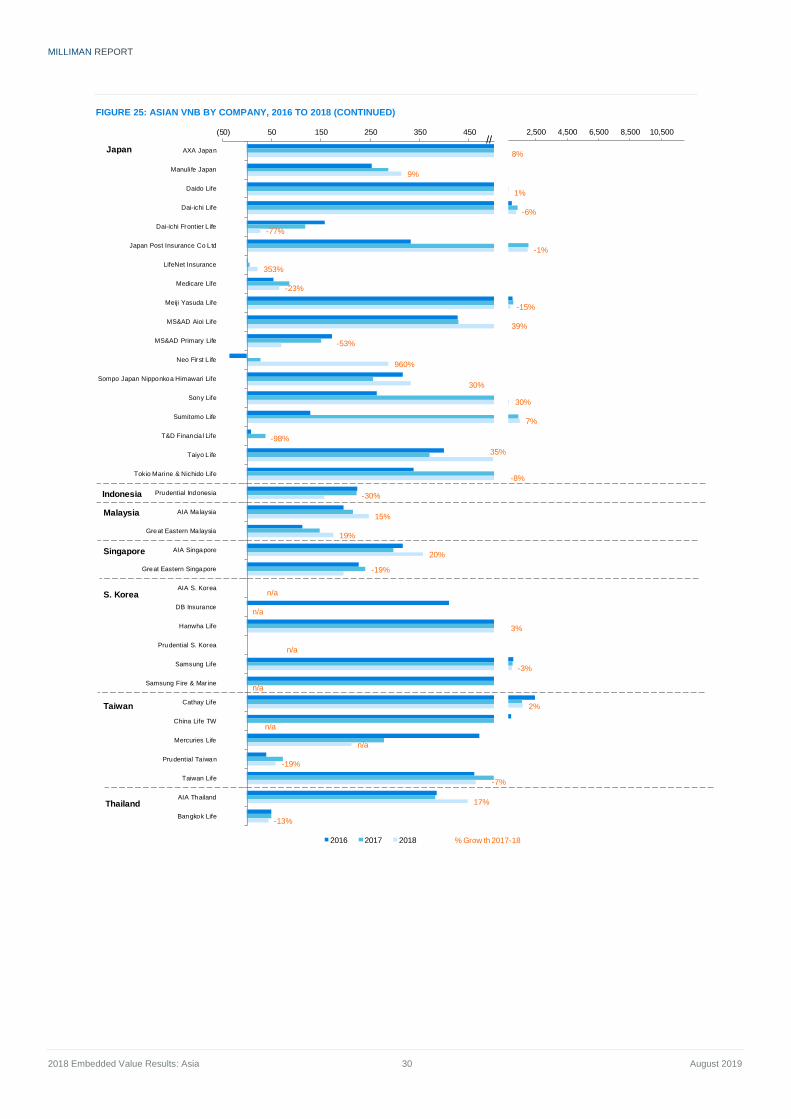
MILLIMAN REPORT
2018 Embedded Value Results: Asia 30 August 2019
FIGURE 25: ASIAN VNB BY COMPANY, 2016 TO 2018 (CONTINUED)
8%
1%
-6%
-1%
-15%
39%
30%
7%
-8%
3%
-3%
2%
500 2,500 4,500 6,500 8,500 10,500//
9%
-77%
353%
-23%
-53%
960%
30%
-98%
35%
-30%
15%
19%
20%
-19%
n/a
n/a
n/a
n/a
n/a
n/a
-19%
-7%
17%
-13%
(50) 50 150 250 350 450
AXA Japan
Manuli fe Japan
Daido Life
Dai-ichi Life
Dai-ichi Frontier L ife
Japan Post Insurance Co Ltd
LifeNet Insurance
Medicare Life
Meiji Yasuda Life
MS&AD Aioi Life
MS&AD Primary Life
Neo First L ife
Sompo Japan Nipponkoa Himawari Life
Sony Life
Sumitomo Life
T&D Financia l Life
Taiyo L ife
Tokio Marine & Nichido Life
Prudential Indonesia
AIA Malaysia
Great Eastern Malaysia
AIA Singapore
Great Eastern Singapore
AIA S. Korea
DB Insurance
Hanwha Life
Prudential S. Korea
Samsung Life
Samsung Fire & Mar ine
Cathay Life
China Life TW
Mercuries Life
Prudential Ta iwan
Taiwan Life
AIA Thailand
Bangkok Life
Reported Asia VNB (2018 USD millions)
2016 2017 2018
Singapore
Thailand
S. Korea
Taiwan
Malaysia
Indonesia
//
% Grow th 2017-18
Japan
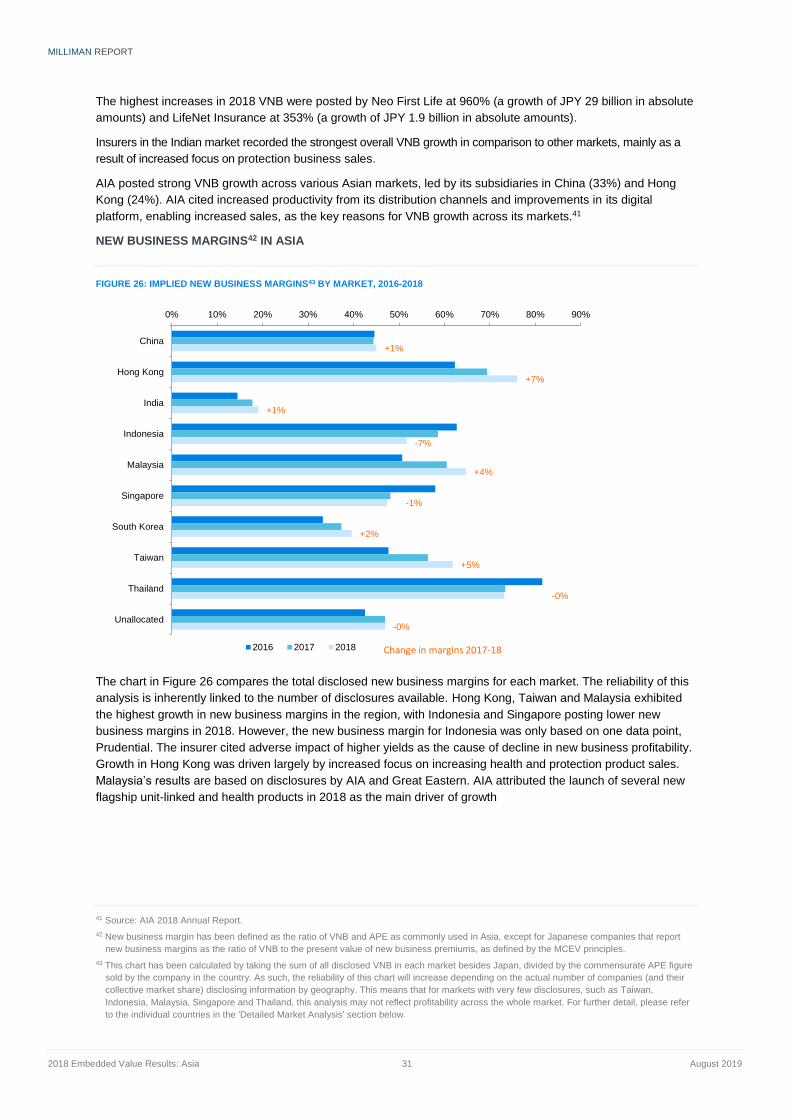
MILLIMAN REPORT
2018 Embedded Value Results: Asia 31 August 2019
The highest increases in 2018 VNB were posted by Neo First Life at 960% (a growth of JPY 29 billion in absolute
amounts) and LifeNet Insurance at 353% (a growth of JPY 1.9 billion in absolute amounts).
Insurers in the Indian market recorded the strongest overall VNB growth in comparison to other markets, mainly as a
result of increased focus on protection business sales.
AIA posted strong VNB growth across various Asian markets, led by its subsidiaries in China (33%) and Hong
Kong (24%). AIA cited increased productivity from its distribution channels and improvements in its digital
platform, enabling increased sales, as the key reasons for VNB growth across its markets.41
NEW BUSINESS MARGINS42 IN ASIA
FIGURE 26: IMPLIED NEW BUSINESS MARGINS43 BY MARKET, 2016-2018
The chart in Figure 26 compares the total disclosed new business margins for each market. The reliability of this
analysis is inherently linked to the number of disclosures available. Hong Kong, Taiwan and Malaysia exhibited
the highest growth in new business margins in the region, with Indonesia and Singapore posting lower new
business margins in 2018. However, the new business margin for Indonesia was only based on one data point,
Prudential. The insurer cited adverse impact of higher yields as the cause of decline in new business profitability.
Growth in Hong Kong was driven largely by increased focus on increasing health and protection product sales.
Malaysia’s results are based on disclosures by AIA and Great Eastern. AIA attributed the launch of several new
flagship unit-linked and health products in 2018 as the main driver of growth
41 Source: AIA 2018 Annual Report.
42 New business margin has been defined as the ratio of VNB and APE as commonly used in Asia, except for Japanese companies that report
new business margins as the ratio of VNB to the present value of new business premiums, as defined by the MCEV principles.
43 This chart has been calculated by taking the sum of all disclosed VNB in each market besides Japan, divided by the commensurate APE figure
sold by the company in the country. As such, the reliability of this chart will increase depending on the actual number of companies (and their
collective market share) disclosing information by geography. This means that for markets with very few disclosures, such as Taiwan,
Indonesia, Malaysia, Singapore and Thailand, this analysis may not reflect profitability across the whole market. For further detail, please refer
to the individual countries in the 'Detailed Market Analysis' section below.
+1%
+7%
+1%
-7%
+4%
-1%
+2%
+5%
-0%
-0%
0% 10% 20% 30% 40% 50% 60% 70% 80% 90%
China
Hong Kong
India
Indonesia
Malaysia
Singapore
South Korea
Taiwan
Thailand
Unallocated
2016 2017 2018 Change in margins 2017-18

MILLIMAN REPORT
2018 Embedded Value Results: Asia 32 August 2019
DETAILED MARKET ANALYSIS
This section presents EV and VNB results by market, together with some commentary on relevant issues in
each jurisdiction.
In order to provide a clearer picture of each market’s performance, all EV and VNB results in this section have
been converted to local currency using the prevailing exchange rate as at each insurer’s reporting dates for each
year (2016, 2017 and 201844). This is in contrast to the previous sections’ figures, where the EV and VNB results
were converted to USD using the prevailing exchange rate at each insurer’s reporting date for 2018. As a result
of exchange rate differences, the 2018 growth rates for each MNC’s subsidiary may not be the same as those
presented in the previous sections.
44 Please note that not all the financial years of insurers coincide with calendar years. In this report, we have defined 2018 results to be the
financial year results that contain the majority of 2018 calendar year results. Results for Indian and Japanese insurers that have a March
financial year-end date correspond to the financial results for the year ending 31 March 2019. Hence, when referring to Indian and Japanese
insurers, FY2018 refers to the year ending 31 March 2019.
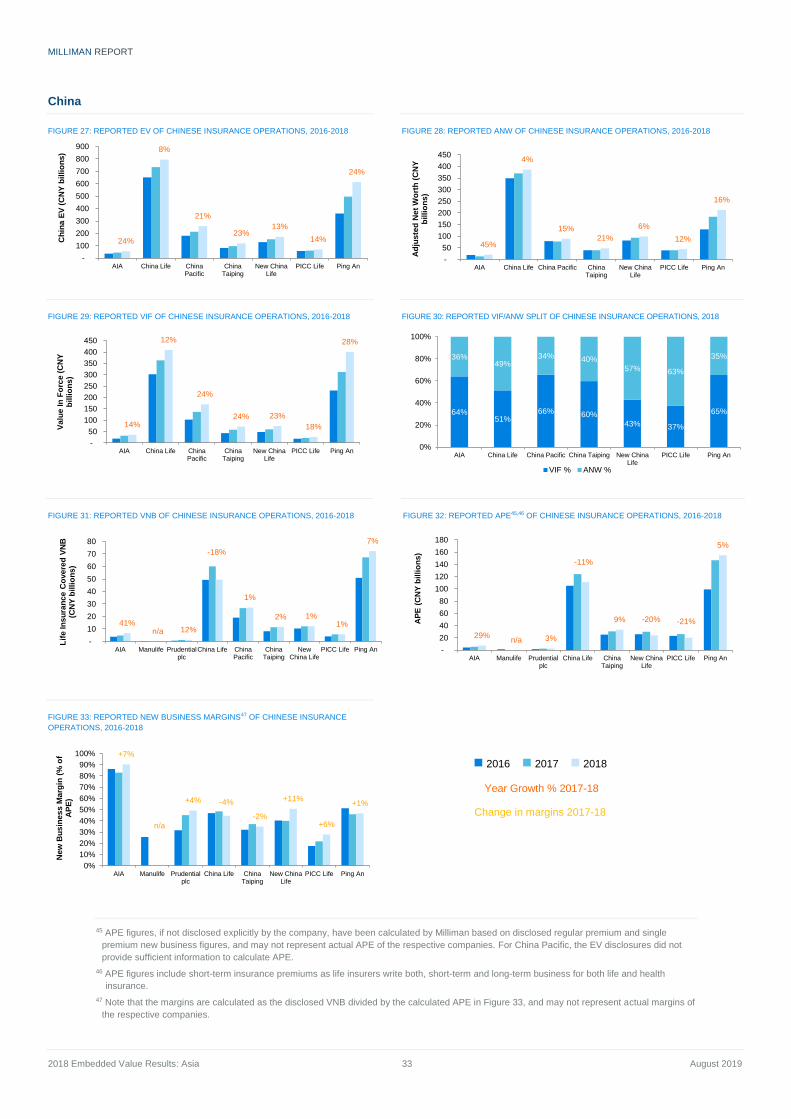
MILLIMAN REPORT
2018 Embedded Value Results: Asia 33 August 2019
China
FIGURE 27: REPORTED EV OF CHINESE INSURANCE OPERATIONS, 2016-2018
FIGURE 28: REPORTED ANW OF CHINESE INSURANCE OPERATIONS, 2016-2018
FIGURE 29: REPORTED VIF OF CHINESE INSURANCE OPERATIONS, 2016-2018
FIGURE 30: REPORTED VIF/ANW SPLIT OF CHINESE INSURANCE OPERATIONS, 2018
FIGURE 31: REPORTED VNB OF CHINESE INSURANCE OPERATIONS, 2016-2018
FIGURE 32: REPORTED APE45,46 OF CHINESE INSURANCE OPERATIONS, 2016-2018
FIGURE 33: REPORTED NEW BUSINESS MARGINS47 OF CHINESE INSURANCE
OPERATIONS, 2016-2018
45 APE figures, if not disclosed explicitly by the company, have been calculated by Milliman based on disclosed regular premium and single
premium new business figures, and may not represent actual APE of the respective companies. For China Pacific, the EV disclosures did not
provide sufficient information to calculate APE.
46 APE figures include short-term insurance premiums as life insurers write both, short-term and long-term business for both life and health
insurance.
47 Note that the margins are calculated as the disclosed VNB divided by the calculated APE in Figure 33, and may not represent actual margins of
the respective companies.
24%
8%
21%
23%13%
14%
24%
-
100
200
300
400
500
600
700
800
900
AIA China Life ChinaPacific
ChinaTaiping
New ChinaLife
PICC Life Ping An
Ch
ina
EV
(C
NY
bil
lio
ns
)
45%
4%
15%
21%
6%
12%
16%
-
50
100
150
200
250
300
350
400
450
AIA China Life China Pacific ChinaTaiping
New ChinaLife
PICC Life Ping An
Ad
jus
ted
Ne
t W
ort
h (
CN
Y
bil
lio
ns
)14%
12%
24%
24% 23%
18%
28%
-
50
100
150
200
250
300
350
400
450
AIA China Life ChinaPacific
ChinaTaiping
New ChinaLife
PICC Life Ping An
Va
lue
In
Fo
rce
(C
NY
b
illi
on
s)
64%51%
66% 60%
43% 37%
65%
36%49%
34% 40%57% 63%
35%
0%
20%
40%
60%
80%
100%
AIA China Life China Pacific China Taiping New ChinaLife
PICC Life Ping An
VIF % ANW %
41%n/a 12%
-18%
1%
2% 1%1%
7%
-
10
20
30
40
50
60
70
80
AIA Manulife Prudentialplc
China Life ChinaPacific
ChinaTaiping
NewChina Life
PICC Life Ping An
Lif
e In
su
ran
ce
Co
ve
red
VN
B
(CN
Y b
illi
on
s)
29%n/a 3%
-11%
9% -20% -21%
5%
-
20
40
60
80
100
120
140
160
180
AIA Manulife Prudentialplc
China Life ChinaTaiping
New ChinaLife
PICC Life Ping An
AP
E (
CN
Y b
illi
on
s)
+7%
n/a
+4% -4%
-2%
+11%
+6%
+1%
0%
10%
20%
30%
40%
50%
60%
70%
80%
90%
100%
AIA Manulife Prudentialplc
China Life ChinaTaiping
New ChinaLife
PICC Life Ping An
New
Bu
sin
es
s M
arg
in (
% o
f A
PE
)
◼ 2016 ◼ 2017 ◼ 2018
Year Growth % 2017-18
Change in margins 2017-18
MILLIMAN REPORT
2018 Embedded Value Results: Asia 34 April 2019
Seven companies reported 2018 EV results in China, almost all of which managed double-digit growth for the
year, with the only exception being China Life. AIA and Ping An reported the highest growth at 24%, followed by
China Taiping and China Pacific, which recorded growth rates of 23% and 21%, respectively. Prudential only
disclosed VNB and APE results for its China joint venture, CITIC-Prudential, which have also been included in
the analysis (on an EEV basis with the rest of the market reporting TEV).
VNB growth rates were mixed in 2018, with AIA posting the highest figure of 23%, followed by CITIC-Prudential
recording a 12% increase. China Life was the only insurer that reported a fall in VNB, which was mainly due to a
lower new business volume. New China Life sustained its VNB growth despite witnessing a fall in APE, primarily
due to an increasing proportion of protection business sales. The company also recorded the highest growth in
new business margin in China last year.48 Similarly, Ping An cited optimisation of its product mix as the main
reason behind its VNB growth.
The majority of insurers have kept their discount rate assumptions unchanged since 2017. However, Prudential
decreased its discount rate from 9.7% in 2017 to 8.1% in 2018, in response to the fall in the 10-year government
bond yield from 3.92% in 2017 to 3.27% in 2018. All life insurers have maintained their investment return
assumptions in 2018 with the only exception being Prudential. The full set of economic assumptions disclosed in
the market is set out in Figure 100 below. The domestic life insurers typically assume investment returns rising
from around 4.5% to 5%, with risk discount rates of around 11%.
In recent developments, the PICC Group completed ‘A share’ listing (shares quoted in RMB only) in Shanghai in
November 2018. It became the fifth Chinese insurance company to list in both Hong Kong and Mainland China.
The other four are Ping An, China Life, New China Insurance and CPIC.
In May 2019, the China Banking & Insurance Regulatory Commission (CBIRC) announced plans to relax
restrictions on foreign companies, aiming to:
• Increase foreign direct investment in the insurance sector.
• Improve the mixture and sources of capital of foreign-invested insurance companies established in
China, by allowing qualified non-insurance foreign financial institutions to invest in the former. This is
inadmissible under the current regime.
Insurers in China are performing quantitative impact studies for Phase II of the China Risk Oriented Solvency
System (C-ROSS2), with which the regulator hopes to refine industry capital requirements.
48 Among the Chinese insurers covered under this report.
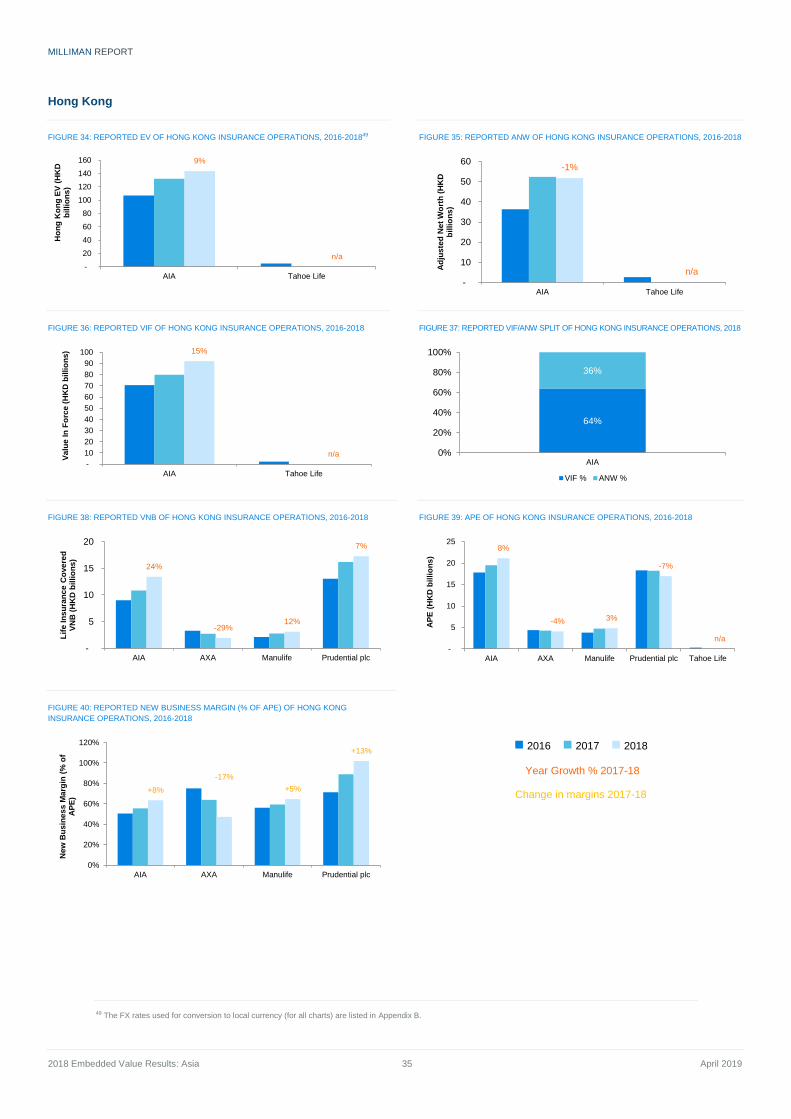
MILLIMAN REPORT
2018 Embedded Value Results: Asia 35 April 2019
Hong Kong
FIGURE 34: REPORTED EV OF HONG KONG INSURANCE OPERATIONS, 2016-201849
FIGURE 35: REPORTED ANW OF HONG KONG INSURANCE OPERATIONS, 2016-2018
FIGURE 36: REPORTED VIF OF HONG KONG INSURANCE OPERATIONS, 2016-2018
FIGURE 37: REPORTED VIF/ANW SPLIT OF HONG KONG INSURANCE OPERATIONS, 2018
FIGURE 38: REPORTED VNB OF HONG KONG INSURANCE OPERATIONS, 2016-2018
FIGURE 39: APE OF HONG KONG INSURANCE OPERATIONS, 2016-2018
FIGURE 40: REPORTED NEW BUSINESS MARGIN (% OF APE) OF HONG KONG
INSURANCE OPERATIONS, 2016-2018
49 The FX rates used for conversion to local currency (for all charts) are listed in Appendix B.
9%
n/a
-
20
40
60
80
100
120
140
160
AIA Tahoe Life
Ho
ng
Ko
ng
EV
(H
KD
b
illi
on
s)
-1%
n/a
-
10
20
30
40
50
60
AIA Tahoe Life
Ad
jus
ted
Ne
t W
ort
h (
HK
D
bil
lio
ns
)
15%
n/a
-
10
20
30
40
50
60
70
80
90
100
AIA Tahoe Life
Va
lue
In
Fo
rce
(H
KD
bil
lio
ns
)
64%
36%
0%
20%
40%
60%
80%
100%
AIA
VIF % ANW %
24%
-29%12%
7%
-
5
10
15
20
AIA AXA Manulife Prudential plc
Lif
e In
su
ran
ce
Co
ve
red
V
NB
(H
KD
bil
lio
ns
)
8%
-4% 3%
-7%
n/a
-
5
10
15
20
25
AIA AXA Manulife Prudential plc Tahoe Life
AP
E (
HK
D b
illi
on
s)
+8%
-17%
+5%
+13%
0%
20%
40%
60%
80%
100%
120%
AIA AXA Manulife Prudential plc
New
Bu
sin
es
s M
arg
in (
% o
f A
PE
)
◼ 2016 ◼ 2017 ◼ 2018
Year Growth % 2017-18
Change in margins 2017-18
MILLIMAN REPORT
2018 Embedded Value Results: Asia 36 April 2019
AIA is the only company that continues to disclose EV results for its Hong Kong operation, with AXA and Tahoe
Life (formerly Dah Sing Life) having discontinued this practice. Prudential and Manulife only disclose VNB and
new business margins for their Hong Kong businesses.
The growth in VNB was positive for all insurers, except AXA, which recorded a fall of 29%. AIA posted the
highest figure of 24%, crediting the results to the continued success of its internal Premier Agency strategy,
significant retail Independent Financial Adviser (IFA) business, its long-term strategic partnership with Citibank,
and the broad-based growth from both domestic and Mainland China visitor customer segments. Manulife cited
higher sales of its profitable critical illness products as the main driver of its VNB growth.
Our analysis covers AIA, AXA, Manulife and Prudential plc. The growth in APE was mixed in local currency
terms.50 AIA and Manulife reported positive growth of 8% and 3%, respectively. In contrast, Prudential recorded
the highest fall of 7%, followed by AXA with a reduction of 4%.
There has been an overall rise in new business margins, with Prudential reporting the highest growth of 13%. AIA
and Manulife reported increases of 8% and 5%, respectively, in new business margins. The drop in new business
margin of AXA was mainly attributed to the increase in sales of savings products, with relatively lower margins
coupled with its protection product redesign.
Despite APE declining for the insurers covered in this analysis, according to the IA, Hong Kong’s overall
individual non-linked business premiums increased by 4.0% to HKD 396.5 billion, whereas linked business
premiums increased by 9.9% to HKD 34.8 billion over the course of 2018. In respect of Mainland China visitor
sales, new office premiums in 2018 decreased by 6.4% to HKD 47.6 billion when compared with 2017,
representing 29.4% of the total new individual business.
As part of the development of the new RBC regime, the QIS 2 was conducted by the IA in late 2018. Milliman has
published an e-Alert highlighting the QIS 2 long-term business results, including commentary on key components
affecting solvency ratios and the next steps insurance companies could take before the next quantitative impact
study. The e-Alert is available here.
The solvency ratio results for the insurers participating in QIS 2 were generally poor. The IA subsequently carried
out a pilot test (QIS 2.5) on a voluntary basis for companies to assess the impact of the revised technical
specification during May and June 2019, with several moderations introduced to the standard. The QIS 2.5
results have significantly improved as compared to QIS 2, with most of the participating insurers now financially
solvent, which was mainly driven by the inclusion of the matching adjustment in discounting. QIS 3 is likely to
commence in August 2019 and require submission by the end of November 2019. The new RBC framework is
expected to be implemented by 2021.
The IA published the Guideline on Enterprise Risk Management (GL21) in early July 2019, following two rounds
of industry consultation in May 2018 and January 2019 as a part of the qualitative requirements under the
developing RBC framework. GL21 sets out the objectives and requirements on ERM and ORSA; and provides
the impetus for insurers to establish effective tools to identify, monitor, manage and mitigate risks. The guideline
shall take effect from 1 January 2020. An authorised insurer should submit its first ORSA report to the IA for its
financial year ending on or after 31 December 2020.
Effective 23 September 2019, the IA will take over from the three self-regulatory organisations (SROs) and will be
responsible for all aspects of the regulation of insurance intermediaries in Hong Kong, including granting
licenses, conducting inspections and investigations and imposing disciplinary sanctions where applicable. The IA
has formulated two sets of rules—Insurance (Maximum Number of Authorised Insurers) Rules and the Insurance
(Financial and Other Requirements for Licensed Insurance Broker Companies) Rules—which will take effect on
23 September 2019, subject to approval by the Legislative Council.
50 APEs throughout this section have been converted to local currency using the prevailing exchange rates applicable at each reporting date
(2016, 2017 and 2018). These figures are different from the disclosed APEs in reported currency terms.
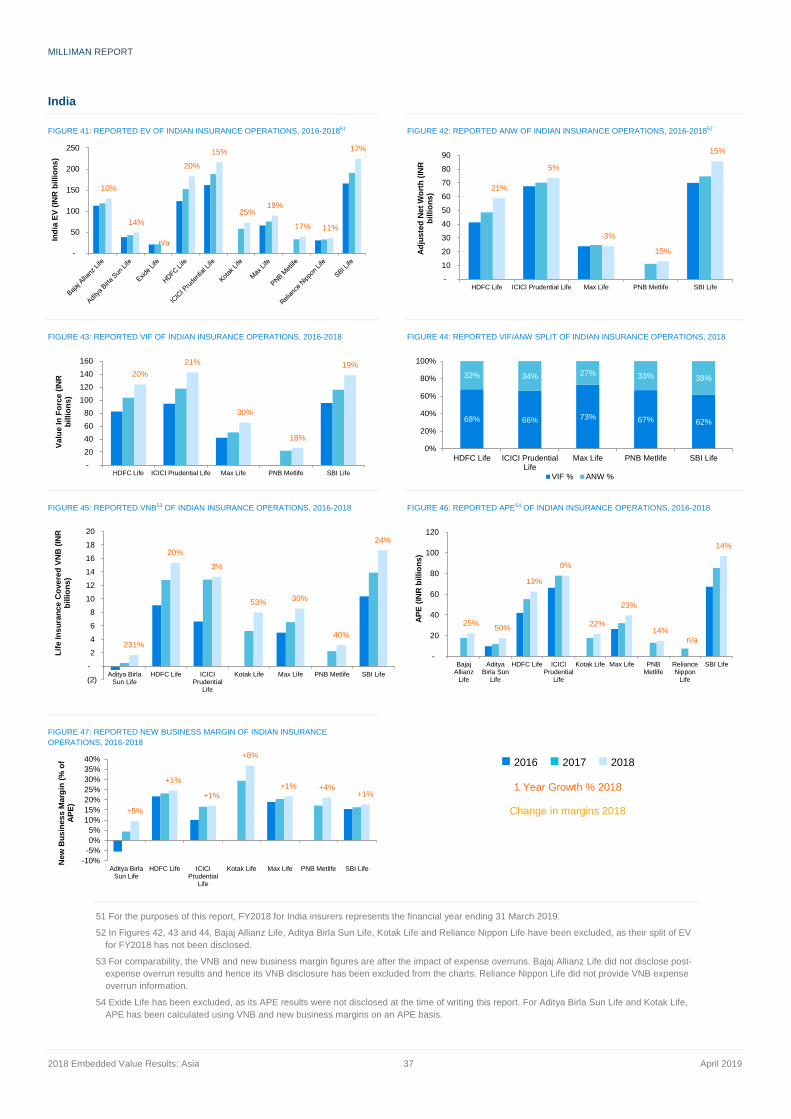
MILLIMAN REPORT
2018 Embedded Value Results: Asia 37 April 2019
India
FIGURE 41: REPORTED EV OF INDIAN INSURANCE OPERATIONS, 2016-201851
FIGURE 42: REPORTED ANW OF INDIAN INSURANCE OPERATIONS, 2016-201852
FIGURE 43: REPORTED VIF OF INDIAN INSURANCE OPERATIONS, 2016-2018
FIGURE 44: REPORTED VIF/ANW SPLIT OF INDIAN INSURANCE OPERATIONS, 2018
FIGURE 45: REPORTED VNB53 OF INDIAN INSURANCE OPERATIONS, 2016-2018
FIGURE 46: REPORTED APE54 OF INDIAN INSURANCE OPERATIONS, 2016-2018
FIGURE 47: REPORTED NEW BUSINESS MARGIN OF INDIAN INSURANCE
OPERATIONS, 2016-2018
51 For the purposes of this report, FY2018 for India insurers represents the financial year ending 31 March 2019.
52 In Figures 42, 43 and 44, Bajaj Allianz Life, Aditya Birla Sun Life, Kotak Life and Reliance Nippon Life have been excluded, as their split of EV
for FY2018 has not been disclosed.
53 For comparability, the VNB and new business margin figures are after the impact of expense overruns. Bajaj Allianz Life did not disclose post-
expense overrun results and hence its VNB disclosure has been excluded from the charts. Reliance Nippon Life did not provide VNB expense
overrun information.
54 Exide Life has been excluded, as its APE results were not disclosed at the time of writing this report. For Aditya Birla Sun Life and Kotak Life,
APE has been calculated using VNB and new business margins on an APE basis.
10%
14%
n/a
20%
15%
25%19%
17% 11%
17%
-
50
100
150
200
250
Ind
ia E
V (
INR
bil
lio
ns
)
21%
5%
-3%
15%
15%
-
10
20
30
40
50
60
70
80
90
HDFC Life ICICI Prudential Life Max Life PNB Metlife SBI Life
Ad
jus
ted
Ne
t W
ort
h (
INR
b
illi
on
s)
20%
21%
30%
18%
19%
-
20
40
60
80
100
120
140
160
HDFC Life ICICI Prudential Life Max Life PNB Metlife SBI Life
Va
lue
In
Fo
rce
(IN
R
bil
lio
ns
)
68% 66% 73% 67% 62%
32% 34% 27% 33% 38%
0%
20%
40%
60%
80%
100%
HDFC Life ICICI PrudentialLife
Max Life PNB Metlife SBI Life
VIF % ANW %
231%
20%
3%
53%30%
40%
24%
(2)
-
2
4
6
8
10
12
14
16
18
20
Aditya BirlaSun Life
HDFC Life ICICIPrudential
Life
Kotak Life Max Life PNB Metlife SBI Life
Lif
e In
su
ran
ce
Co
ve
red
VN
B (
INR
b
illi
on
s)
25%50%
13%
0%
22%
23%
14%n/a
14%
-
20
40
60
80
100
120
BajajAllianz
Life
AdityaBirla Sun
Life
HDFC Life ICICIPrudential
Life
Kotak Life Max Life PNBMetlife
RelianceNippon
Life
SBI Life
AP
E (
INR
bil
lio
ns
)
+5%
+1%
+1%
+8%
+1% +4%+1%
-10%
-5%
0%
5%
10%
15%
20%
25%
30%
35%
40%
Aditya BirlaSun Life
HDFC Life ICICIPrudential
Life
Kotak Life Max Life PNB Metlife SBI Life
New
Bu
sin
es
s M
arg
in (
% o
f A
PE
)
◼ 2016 ◼ 2017 ◼ 2018
1 Year Growth % 2018
Change in margins 2018
MILLIMAN REPORT
2018 Embedded Value Results: Asia 38 April 2019
Embedded values continue to increase in India, with all disclosed companies posting double-digit growth.
EV/VNB methodology in India has also largely converged to a market-consistent approach. All insurers use either
MCEV or IEV, except for Reliance Nippon Life, which continues to be the only insurer publicly disclosing results
using TEV methodology.
Reported new business margins are in the range of 10% to 37%, after allowing for the impact of acquisition
expense overruns. Bajaj Allianz Life and Reliance Nippon Life do not give any expense overrun information in
their VNB disclosures. Given this inconsistency, we have excluded the VNB disclosures for these companies
from our analysis. Reliance Nippon Life has not disclosed its new business margins for FY2018; however, the
company reported a VNB figure of INR 3.3 billion, which we estimate may result in a new business margin of
around 30% to 40%.
While new business margins have increased slightly across the board, there has been a significant increase in
new business APE, leading to a growth in VNB for all companies. An increasing share of protection business in
product mixes has contributed to improving the new business margins for most insurers. Aditya Birla Sun Life
recorded the highest VNB growth of 231% in FY2018, attributing its growth to a balanced channel mix, increased
sales productivity from its HDFC Bank partnership and increased focus on the sale of protection business.
On 8 July 2019, IRDAI released regulations on non-linked and linked insurance products, which supersede the
2013 regulations. The new regulations offer greater flexibility to insurers in respect of unit-linked plans, pension
plans and annuity plans, while tightening minimum surrender value requirements on non-linked plans. The
regulations also strengthen with-profits governance. Milliman has published an e-Alert highlighting the key
changes in the regulations and discussing the potential business implications for life insurers. The e-Alert is
available here.
With a strong macroeconomic outlook for the Indian economy, the young population, the large emerging middle
class with high savings potential and the low penetration of life insurance business, the longer-term outlook for
the Indian life insurance industry continues to be positive. Milliman has published an e-Alert on consolidation in
the Indian life insurance industry, available here.
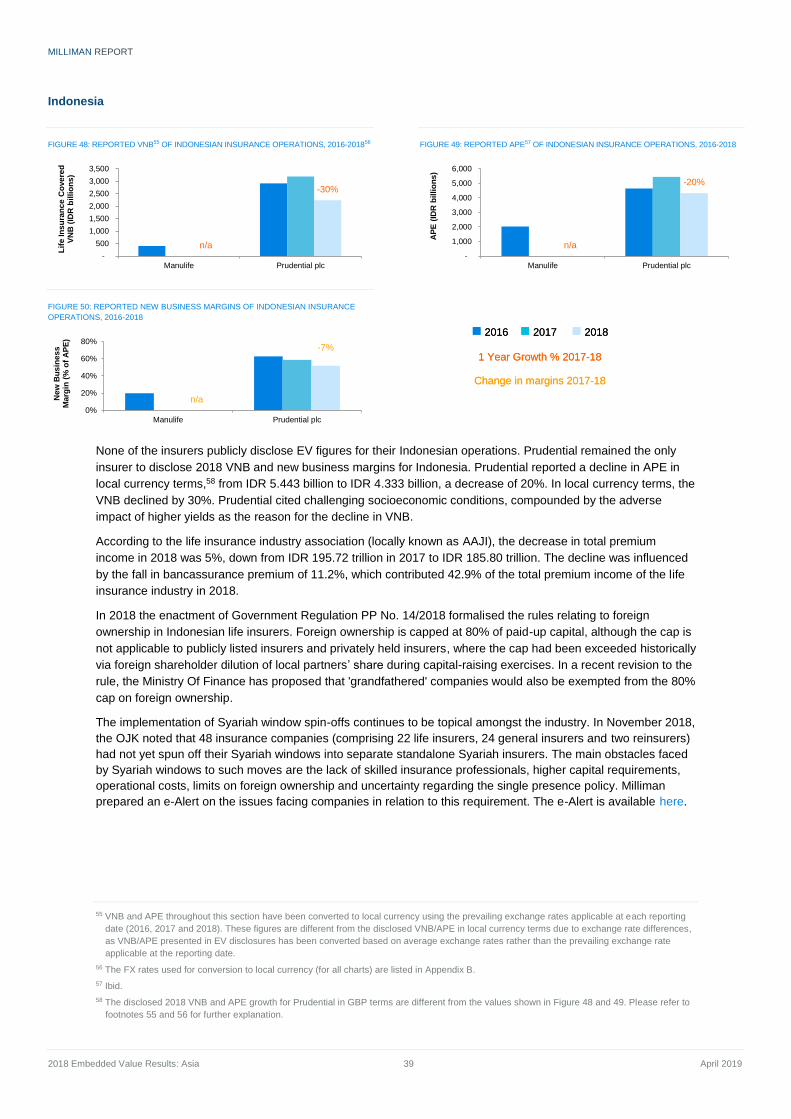
MILLIMAN REPORT
2018 Embedded Value Results: Asia 39 April 2019
Indonesia
FIGURE 48: REPORTED VNB55 OF INDONESIAN INSURANCE OPERATIONS, 2016-201856
FIGURE 49: REPORTED APE57 OF INDONESIAN INSURANCE OPERATIONS, 2016-2018
FIGURE 50: REPORTED NEW BUSINESS MARGINS OF INDONESIAN INSURANCE
OPERATIONS, 2016-2018
None of the insurers publicly disclose EV figures for their Indonesian operations. Prudential remained the only
insurer to disclose 2018 VNB and new business margins for Indonesia. Prudential reported a decline in APE in
local currency terms,58 from IDR 5.443 billion to IDR 4.333 billion, a decrease of 20%. In local currency terms, the
VNB declined by 30%. Prudential cited challenging socioeconomic conditions, compounded by the adverse
impact of higher yields as the reason for the decline in VNB.
According to the life insurance industry association (locally known as AAJI), the decrease in total premium
income in 2018 was 5%, down from IDR 195.72 trillion in 2017 to IDR 185.80 trillion. The decline was influenced
by the fall in bancassurance premium of 11.2%, which contributed 42.9% of the total premium income of the life
insurance industry in 2018.
In 2018 the enactment of Government Regulation PP No. 14/2018 formalised the rules relating to foreign
ownership in Indonesian life insurers. Foreign ownership is capped at 80% of paid-up capital, although the cap is
not applicable to publicly listed insurers and privately held insurers, where the cap had been exceeded historically
via foreign shareholder dilution of local partners’ share during capital-raising exercises. In a recent revision to the
rule, the Ministry Of Finance has proposed that 'grandfathered' companies would also be exempted from the 80%
cap on foreign ownership.
The implementation of Syariah window spin-offs continues to be topical amongst the industry. In November 2018,
the OJK noted that 48 insurance companies (comprising 22 life insurers, 24 general insurers and two reinsurers)
had not yet spun off their Syariah windows into separate standalone Syariah insurers. The main obstacles faced
by Syariah windows to such moves are the lack of skilled insurance professionals, higher capital requirements,
operational costs, limits on foreign ownership and uncertainty regarding the single presence policy. Milliman
prepared an e-Alert on the issues facing companies in relation to this requirement. The e-Alert is available here.
55 VNB and APE throughout this section have been converted to local currency using the prevailing exchange rates applicable at each reporting
date (2016, 2017 and 2018). These figures are different from the disclosed VNB/APE in local currency terms due to exchange rate differences,
as VNB/APE presented in EV disclosures has been converted based on average exchange rates rather than the prevailing exchange rate
applicable at the reporting date.
56 The FX rates used for conversion to local currency (for all charts) are listed in Appendix B.
57 Ibid.
58 The disclosed 2018 VNB and APE growth for Prudential in GBP terms are different from the values shown in Figure 48 and 49. Please refer to
footnotes 55 and 56 for further explanation.
n/a
-30%
-
500
1,000
1,500
2,000
2,500
3,000
3,500
Manulife Prudential plc
Lif
e In
su
ran
ce
Co
ve
red
V
NB
(ID
R b
illi
on
s)
n/a
-20%
-
1,000
2,000
3,000
4,000
5,000
6,000
Manulife Prudential plc
AP
E (
IDR
bil
lio
ns
)
n/a
-7%
0%
20%
40%
60%
80%
Manulife Prudential plc
New
Bu
sin
es
s
Ma
rgin
(%
of
AP
E)
◼ 2016 ◼ 2017 ◼ 2018
1 Year Growth % 2017-18
Change in margins 2017-18
◼ 2016 ◼ 2017 ◼ 2018
1 Year Growth % 2017-18
Change in margins 2017-18
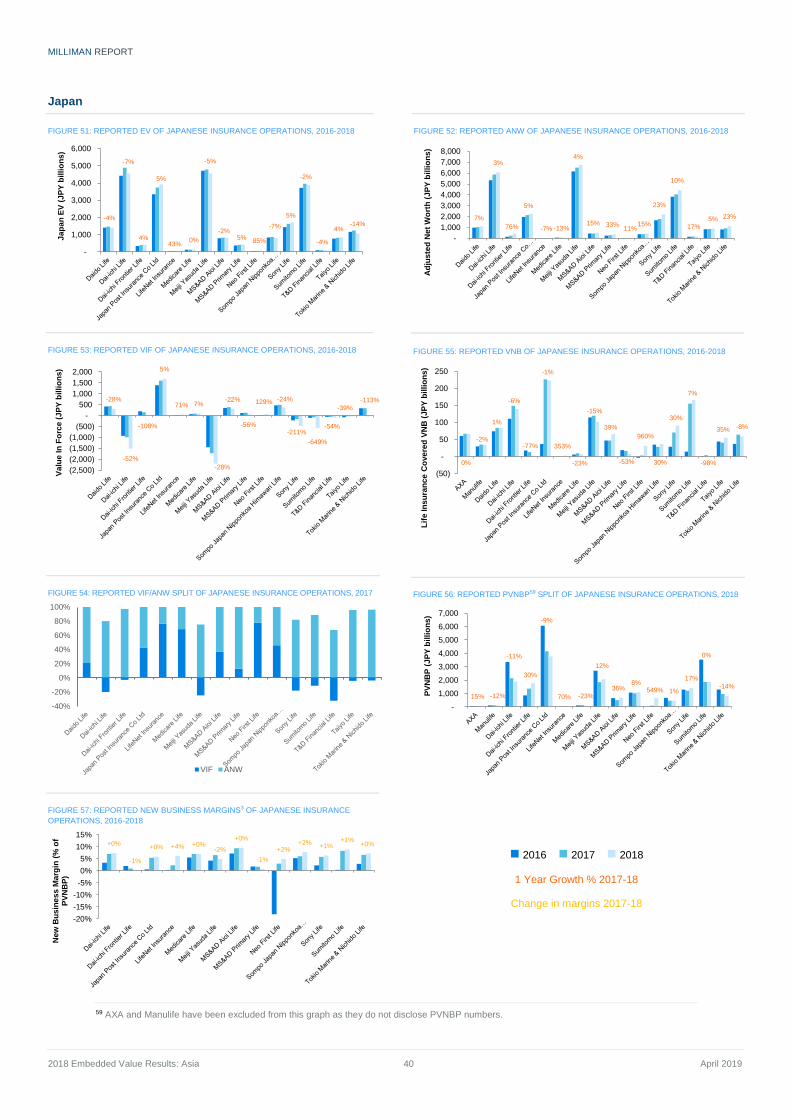
MILLIMAN REPORT
2018 Embedded Value Results: Asia 40 April 2019
Japan
FIGURE 51: REPORTED EV OF JAPANESE INSURANCE OPERATIONS, 2016-2018
FIGURE 52: REPORTED ANW OF JAPANESE INSURANCE OPERATIONS, 2016-2018
FIGURE 53: REPORTED VIF OF JAPANESE INSURANCE OPERATIONS, 2016-2018
FIGURE 54: REPORTED VIF/ANW SPLIT OF JAPANESE INSURANCE OPERATIONS, 2017
FIGURE 55: REPORTED VNB OF JAPANESE INSURANCE OPERATIONS, 2016-2018
FIGURE 56: REPORTED PVNBP59 SPLIT OF JAPANESE INSURANCE OPERATIONS, 2018
FIGURE 57: REPORTED NEW BUSINESS MARGINS3 OF JAPANESE INSURANCE
OPERATIONS, 2016-2018
59 AXA and Manulife have been excluded from this graph as they do not disclose PVNBP numbers.
-4%
-7%
4%
5%
43%0%
-5%
-2%5%
85%
-7%
5%
-2%
-4%
4%-14%
-
1,000
2,000
3,000
4,000
5,000
6,000
Ja
pa
n E
V (
JP
Y b
illi
on
s)
7%
3%
76%
5%
-7% -13%
4%
15% 33%11%
15%
23%
10%
17%5% 23%
-
1,000
2,000
3,000
4,000
5,000
6,000
7,000
8,000
Ad
jus
ted
Ne
t W
ort
h (
JP
Y b
illi
on
s)
-28%
-52%
-108%
5%
71% 7%
-28%
-22%
-56%
129% -24%
-211%
-649%
-54%
-39%
-113%
(2,500)
(2,000)
(1,500)
(1,000)
(500)
-
500
1,000
1,500
2,000
Va
lue
In
Fo
rce
(J
PY
bil
lio
ns
)
-40%
-20%
0%
20%
40%
60%
80%
100%
VIF ANW
0%
-2%
1%
-6%
-77%
-1%
353%
-23%
-15%
39%
-53%
960%
30%
30%
7%
-98%
35% -8%
(50)
-
50
100
150
200
250
Lif
e In
su
ran
ce
Co
ve
red
VN
B (
JP
Y b
illi
on
s)
15% -12%
-11%
30%
-9%
70% -23%
12%
36%8%
549% 1%
17%
0%
-14%
-
1,000
2,000
3,000
4,000
5,000
6,000
7,000
PV
NB
P (
JP
Y b
illi
on
s)
+0%
-1%
+0% +4% +0%-2%
+0%
-1%
+2%+2%
+1%+1%
+0%
-20%
-15%
-10%
-5%
0%
5%
10%
15%
New
Bu
sin
es
s M
arg
in (
% o
f P
VN
BP
)
◼ 2016 ◼ 2017 ◼ 2018
1 Year Growth % 2017-18
Change in margins 2017-18
MILLIMAN REPORT
2018 Embedded Value Results: Asia 41 August 2019
The low or negative interest rate environment continues to pose challenges for Japan’s economy and its life
insurance industry. Interest rates continued to decline over the past year, which has further eroded profit margins,
especially for long-term business.
Sixteen companies in Japan reported their 2018 EV results. They were mixed, with most companies reporting EV
increases or decreases between zero and 5% of the opening figures. In some cases, the more favourable results
can be attributed to asset-liability management (ALM) practices, less severe legacy liabilities or solid value of
new sales. However, results are materially affected by methodology differences, such as the approach to interest
rate extrapolation and calculation of the cost-of-non-hedgeable risks.
AXA and Manulife only disclose VNB and APE results for their Japan operations. In 2018, AXA and Manulife
reported an APE of EUR 546 million and CAD 1,410 million, respectively, for its Japan operations. All other
Japanese companies disclose present value of new business premiums (PVNBP) instead of APE.
Almost all domestic insurers reported a decline in VIF results for 2018, a reflection of the severe and declining
risk-free yields. The situation is particularly severe for companies maintaining large, long-duration legacy
liabilities. Asset gains typically substantially offset the declining VIF, demonstrating successful ALM by Japanese
insurers. In addition, as shown in Figure 55, value accruals from new sales remain quite robust for many
companies, in spite of the difficult financial environment.
A certain amount of caution must be exercised when evaluating Japanese company embedded values, especially
when comparisons are made across Asia. In particular, it is important to keep in mind that Japanese companies
typically report on a market-consistent basis, either MCEV or MC-EEV. In addition, many companies manage
large blocks of legacy policies with relatively high guarantees, in some cases in excess of 5%. As a result of
these two factors, many companies have a very small (or even negative) VIF compared to the size of the in-force
block.60 On a percentage basis, this VIF is extremely sensitive to changes in the interest rate environment.
However, due to the use of a market-consistent approach, and asset-liability management, changes in VIF are
often substantially offset by changes in adjusted net worth. As a result, overall EV, though sensitive to changing
market yields, is far less sensitive than the VIF and ANW components.
The reduction and flattening of the yield curve between March 2018 and March 2019 had a severe impact on
many companies. In order to understand and compare results, it is critical to look at differences in the underlying
methodologies. As one would expect, embedded values at companies employing an ultimate forward rate (UFR)
were less severely impacted than were those at companies which apply a constant forward rate.
Although most companies continue to generate significant value from new sales, in many cases this was not
enough to offset the impact of the flattening yield curve and declining equity values. As a result, approximately
half of Japanese companies reporting embedded values experienced an overall decline in EV during fiscal 2018.
With respect to new sales and new business value, looking forward, some caution may be in order. For many
years, several Japanese companies have generated significant value through the sale of tax-favoured COLI
products in the SME market. After mainstream players began to enter this market, sometimes with aggressively
designed products, regulators took action that will significantly curtail sales of COLI products. While it is a
relatively small niche in the context of the overall market, it is nonetheless a significant issue that analysts should
be aware of.
Looking forward, although we are optimistic about the global economy and Japan’s prospects, Japanese insurers
face significant risks such as interest rates and the economic effects of trade wars. Japanese life insurers are
increasingly exposed to the vagaries of global trade and finance, in part due to explicit expansion efforts in Asia,
North America, and elsewhere, but also due to the significant sales of foreign-denominated products in the
domestic market. Yen versus US or Australian dollar spreads have been quite volatile, making the design, sale,
and hedging of these product challenging. Growing international exposure and diversification makes EV analysis
more critical than ever, yet more complex to interpret. In this environment, reporting with greater detail and
transparency, coupled with effective corporate communications, will be essential if Japanese companies are to
achieve the market recognition they deserve.
60 See, for example, Figure 53.

MILLIMAN REPORT
2018 Embedded Value Results: Asia 42 August 2019
Malaysia
FIGURE 58: REPORTED EV OF MALAYSIAN INSURANCE OPERATIONS, 2016-201861,62
FIGURE 59: REPORTED ANW OF MALAYSIAN INSURANCE OPERATIONS, 2016-2018
FIGURE 60: REPORTED VIF OF MALAYSIAN INSURANCE OPERATIONS, 2016-2018
FIGURE 61: REPORTED VIF/ANW SPLIT OF MALAYSIAN INSURANCE OPERATIONS, 2018
FIGURE 62: REPORTED VNB63 OF MALAYSIAN INSURANCE OPERATIONS, 2016-201864
FIGURE 63: REPORTED APE65 OF MALAYSIAN INSURANCE OPERATIONS, 2016-2018
FIGURE 64: REPORTED NEW BUSINESS MARGIN OF MALAYSIAN INSURANCE
OPERATIONS, 2016-2018
61 Great Eastern Malaysia’s EV (ANW plus VIF) figure includes Great Eastern Takaful Berhad (GETB).
62 The FX rates used for conversion to local currency (for all charts) are listed in Appendix B.
63 AIA’s VNB and APE figures exclude pension business.
64 Great Eastern Malaysia’s VNB figure excludes GETB.
65 The values have been determined based on APE reported in EV disclosures converted to local currency using the prevailing exchange rate applicable at each reporting
date (2016, 2017 and 2018). These figures are different from the disclosed APEs for AIA and Great Eastern Malaysia in local currency terms due to exchange rate
differences, as APE presented in EV disclosures has been converted based on average exchange rates rather than the prevailing exchange rate applicable at the
reporting date.
8%12%
-
2,000
4,000
6,000
8,000
10,000
12,000
AIA Great Eastern
Ma
lays
ia E
V (
MY
R m
illi
on
s)
3%
14%
-
1,000
2,000
3,000
4,000
5,000
6,000
AIA Great Eastern
Ad
jus
ted
Ne
t W
ort
h (
MY
R
mil
lio
ns
)
13%
11%
-
1,000
2,000
3,000
4,000
5,000
6,000
7,000
8,000
9,000
AIA Great Eastern
Va
lue
In
Fo
rce
(M
YR
m
illi
on
s)
54%
80%
46%
20%
0%
20%
40%
60%
80%
100%
AIA Great Eastern
VIF % ANW %
17%
19%
-
200
400
600
800
1,000
1,200
AIA Great Eastern
Lif
e In
su
ran
ce
Co
ve
red
V
NB
(M
YR
mil
lio
ns
)
15%
5%
-13%
-
200
400
600
800
1,000
1,200
1,400
1,600
1,800
AIA Great Eastern Prudential plc
AP
E (
MY
R m
illi
on
s)
+1% +8%
0%
10%
20%
30%
40%
50%
60%
70%
AIA Great Eastern
New
Bu
sin
es
s M
arg
in (
% o
f A
PE
)
◼ 2016 ◼ 2017 ◼ 2018
1 Year Growth % 2017-18
Change in margins 2017-18
MILLIMAN REPORT
2018 Embedded Value Results: Asia 43 August 2019
Only Great Eastern and AIA disclosed 2018 EV and VNB results for Malaysia. Prudential’s results are not
disclosed (as it is part of an aggregated classification); although some of the underlying EV assumptions are
provided.
The risk discount rate for Great Eastern and AIA remained unchanged from 2017 at 8.75%. Prudential increased
its risk discount rate assumption marginally for new business and in-force business from 6.4% and 6.5%,
respectively, to 6.6% (for both new business and in-force business). Its 10-year bond yield assumption also
increased from 3.9% in 2017 to 4.1% in 2018. The 10-year government bond yield in Malaysia as at 31
December 2018 was 4.1%. Great Eastern did not disclose its investment return assumptions for 2018.
Despite a general reduction in insurance-related consumer activity, AIA recorded a 12% increase in its APE in
2018, while its VNB and new business margin grew by 15% and 1%, respectively, over the same period. Its new
business margin remained strong at 63.8%, having launched several new flagship unit-linked and health products
in 2018. This included a bespoke high sum assured regular unit-linked product for its bancassurance partner,
Public Bank, which helped drive greater penetration of the bank’s affluent customer base. AIA also launched a
first-to-market health rider designed to encourage healthy living and provide recovery support following treatment.
AIA’s Takaful business continues to be an important strategic focus, delivering double-digit VNB growth in 2018.
AIA continues to be the leader of Malaysia’s group insurance market
Great Eastern Malaysia posted robust results in 2018, which it has attributed to the continued demand for regular
premium unit-linked products, strong growth in group insurance business and continued success in its
bancassurance partnership with OCBC. Great Eastern Malaysia’s Takaful business recorded double-digit growth,
driven mainly by growth in its agency channel.
In January 2019, the insurance regulator Bank Negara Malaysia (BNM)issued a policy document that sets out
strengthened requirements on the conduct of unit-linked66 business with the primary objective to protect the
interests of consumers. The salient requirements are as follows:
Implementation of standards on minimum allocation rates to protect the account values of unit-linked
policy/certificate owners
Introduction of minimum standards on sustainability tests and communication to policy/certificate owners to
improve long-term persistency of unit-linked products and consumer awareness
Strengthening of disclosure standards for product illustrations to facilitate more informed decision-making by
consumers
In the second half of 2018, AIA Malaysia became the first insurer in Malaysia to offer unit-linked insurance
products that are compliant with the new Minimum Allocation Rate regulation in advance of the formal regulatory
deadline of 1 July 2019 (for a licensed insurer) and 1 July 2020 (for a licensed Takaful operator). The introduction
of the minimum allocation rate is likely to decrease margins for unit-linked business in Malaysia, particularly for
Takaful operators. In addition, effective 1 January 2020, the sales illustrations for unit-linked business will be
based on two reduced specified rates, of 2% per annum (p.a.) and 5% p.a., to reflect the impact of different
investment returns, with the rates being in line with those used for participating business. The lower sales
illustration rates may reduce the attractiveness of unit-linked business to consumers. Thirdly, effective 1 July
2019, all licensed insurers and Takaful operators have had to redesign and reprice their unit-linked products to
demonstrate that the policy is expected to sustain its coverage until the end of the contractual term. There is also
a requirement for a regular sustainability assessment of existing unit-linked policies that has to be communicated
to policyholders at least annually. Companies are likely to change the product design of unit-linked business to
meet the new sustainability requirements. Overall, the new regulations are expected to increase the transparency
of unit-linked products, which is beneficial for consumers, but they may have a negative impact on insurers’ profit
margins unless the products are redesigned and repriced.
BNM has initiated a review of the current RBC framework which is expected to be conducted in phases over the
next few years. The review is intended to take account of the current insurance and Takaful landscape, as well as
developments in global regulatory and accounting standards.
66 In Malaysia, unit-linked business is also known as investment-linked business
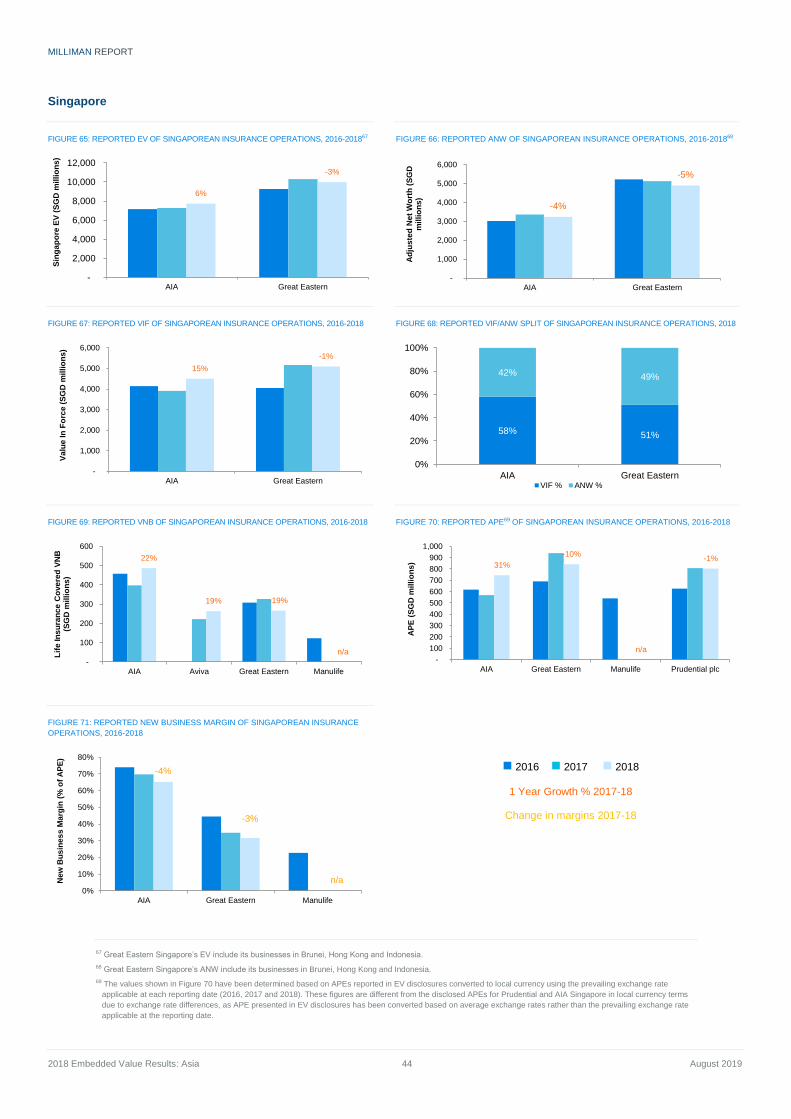
MILLIMAN REPORT
2018 Embedded Value Results: Asia 44 August 2019
Singapore
FIGURE 65: REPORTED EV OF SINGAPOREAN INSURANCE OPERATIONS, 2016-201867
FIGURE 66: REPORTED ANW OF SINGAPOREAN INSURANCE OPERATIONS, 2016-201868
FIGURE 67: REPORTED VIF OF SINGAPOREAN INSURANCE OPERATIONS, 2016-2018
FIGURE 68: REPORTED VIF/ANW SPLIT OF SINGAPOREAN INSURANCE OPERATIONS, 2018
FIGURE 69: REPORTED VNB OF SINGAPOREAN INSURANCE OPERATIONS, 2016-2018
FIGURE 70: REPORTED APE69 OF SINGAPOREAN INSURANCE OPERATIONS, 2016-2018
FIGURE 71: REPORTED NEW BUSINESS MARGIN OF SINGAPOREAN INSURANCE
OPERATIONS, 2016-2018
67 Great Eastern Singapore’s EV include its businesses in Brunei, Hong Kong and Indonesia.
68 Great Eastern Singapore’s ANW include its businesses in Brunei, Hong Kong and Indonesia.
69 The values shown in Figure 70 have been determined based on APEs reported in EV disclosures converted to local currency using the prevailing exchange rate
applicable at each reporting date (2016, 2017 and 2018). These figures are different from the disclosed APEs for Prudential and AIA Singapore in local currency terms
due to exchange rate differences, as APE presented in EV disclosures has been converted based on average exchange rates rather than the prevailing exchange rate
applicable at the reporting date.
6%
-3%
-
2,000
4,000
6,000
8,000
10,000
12,000
AIA Great Eastern
Sin
ga
po
re E
V (
SG
D m
illi
on
s)
-4%
-5%
-
1,000
2,000
3,000
4,000
5,000
6,000
AIA Great Eastern
Ad
jus
ted
Ne
t W
ort
h (
SG
D
mil
lio
ns
)
15%
-1%
-
1,000
2,000
3,000
4,000
5,000
6,000
AIA Great Eastern
Va
lue
In
Fo
rce
(S
GD
mil
lio
ns
)
58% 51%
42% 49%
0%
20%
40%
60%
80%
100%
AIA Great EasternVIF % ANW %
22%
19% -19%
n/a
-
100
200
300
400
500
600
AIA Aviva Great Eastern Manulife
Lif
e In
su
ran
ce
Co
ve
red
VN
B
(SG
D m
illi
on
s)
31%
-10%
n/a
-1%
-
100
200
300
400
500
600
700
800
900
1,000
AIA Great Eastern Manulife Prudential plc
AP
E (
SG
D m
illi
on
s)
-4%
-3%
n/a0%
10%
20%
30%
40%
50%
60%
70%
80%
AIA Great Eastern Manulife
New
Bu
sin
es
s M
arg
in (
% o
f A
PE
)
◼ 2016 ◼ 2017 ◼ 2018
1 Year Growth % 2017-18
Change in margins 2017-18
MILLIMAN REPORT
2018 Embedded Value Results: Asia 45 August 2019
Only Great Eastern and AIA disclosed separate 2018 EV results for Singapore. Prudential’s results are not
disclosed (it is part of an aggregated classification), although some of the underlying EV assumptions are
provided. The risk discount rate for Great Eastern remained unchanged at 7.0% for year-end 2018, while for AIA
Singapore it has increased from 6.9% to 7.1%. There was a decrease in the in-force business risk discount rate
used by Prudential for EEV reporting from 4.4% to 4.2%, further increasing the gap between the rates adopted by
Great Eastern and AIA, which report on a TEV basis. Great Eastern did not disclose its investment return
assumptions for 2018. AIA Singapore’s 2018 investment return assumptions increased by 20 bps to 7.2% for
equity and 2.7% for 10-year government bond yields. Prudential increased its equity and 10-year government
bond yield assumptions by 10 bps to 8.6% and 2.1%, respectively. The 10-year government bond yield in
Singapore as at 31 December 2018 was approximately 2.04%.
AIA disclosed a 29% increase in its Singapore APE in SGD terms,70 driven by the agency channel and its
strategic partnership with Citibank, although new business margin fell by 7% in 2018. This lower new business
margin was attributed to lower profitability from Health Shield business and higher volumes of low-margin, single
premium unit-linked business prior to a regulatory change in October 2018. Great Eastern reported a fall in APE
due to lower sales from both agency and bancassurance channels. Consequently, overall VNB and new business
margins fell too. Prudential reported a slight decline of 1% in Singapore APE in SGD terms.
The new risk-based capital regime RBC2 is expected to become effective from 1 January 2020, following the
recent requirement for insurers to submit parallel runs (as part of the final QIS) for year-end 2018 by 2 July 2019.
A key revision to RBC2 is a significant increase in asset risk charges for equities and credit securities, although
the impact will be offset by the allowance of diversification and an allowance for negative reserves within the
capital calculations. Preliminary results indicate that insurers would continue to remain healthy with CAR levels in
excess of 100% under RBC2. However, it appears that insurers with large participating funds and universal life
business could see a fall in CAR levels, given that these product lines are heavily invested in equities and credit
securities. On the contrary, unit-linked players will likely see CAR levels increasing given the allowance for
negative reserves.
70 The values shown in Figure 70 for 2018 APE growth for Prudential and AIA Singapore, in SGD terms, are different from the reported
disclosures. Please refer to footnote 69 for further explanation.
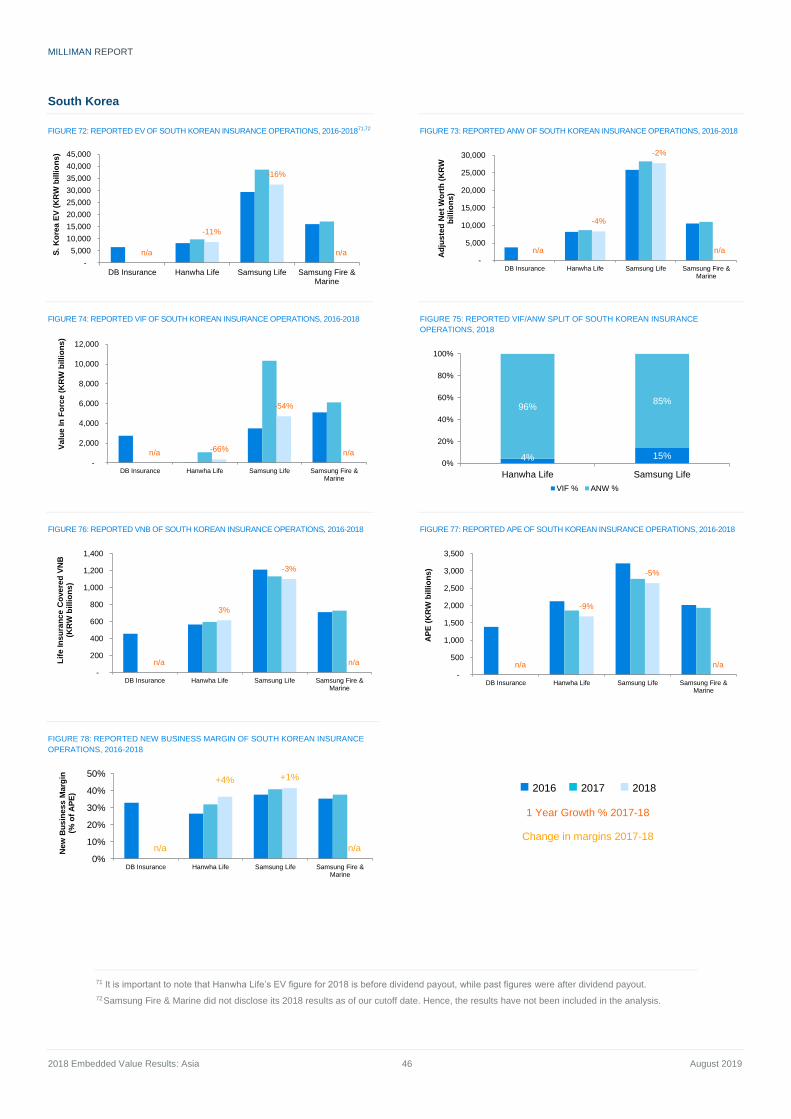
MILLIMAN REPORT
2018 Embedded Value Results: Asia 46 August 2019
South Korea
FIGURE 72: REPORTED EV OF SOUTH KOREAN INSURANCE OPERATIONS, 2016-201871,72
FIGURE 73: REPORTED ANW OF SOUTH KOREAN INSURANCE OPERATIONS, 2016-2018
FIGURE 74: REPORTED VIF OF SOUTH KOREAN INSURANCE OPERATIONS, 2016-2018
FIGURE 75: REPORTED VIF/ANW SPLIT OF SOUTH KOREAN INSURANCE
OPERATIONS, 2018
FIGURE 76: REPORTED VNB OF SOUTH KOREAN INSURANCE OPERATIONS, 2016-2018
FIGURE 77: REPORTED APE OF SOUTH KOREAN INSURANCE OPERATIONS, 2016-2018
FIGURE 78: REPORTED NEW BUSINESS MARGIN OF SOUTH KOREAN INSURANCE
OPERATIONS, 2016-2018
71 It is important to note that Hanwha Life’s EV figure for 2018 is before dividend payout, while past figures were after dividend payout.
72 Samsung Fire & Marine did not disclose its 2018 results as of our cutoff date. Hence, the results have not been included in the analysis.
n/a
-11%
-16%
n/a
-
5,000
10,000
15,000
20,000
25,000
30,000
35,000
40,000
45,000
DB Insurance Hanwha Life Samsung Life Samsung Fire &Marine
S.
Ko
rea
EV
(K
RW
bil
lio
ns
)
n/a
-4%
-2%
n/a
-
5,000
10,000
15,000
20,000
25,000
30,000
DB Insurance Hanwha Life Samsung Life Samsung Fire &Marine
Ad
jus
ted
Ne
t W
ort
h (
KR
W
bil
lio
ns
)n/a -66%
-54%
n/a
-
2,000
4,000
6,000
8,000
10,000
12,000
DB Insurance Hanwha Life Samsung Life Samsung Fire &Marine
Va
lue
In
Fo
rce
(K
RW
bil
lio
ns
)
4% 15%
96%85%
0%
20%
40%
60%
80%
100%
Hanwha Life Samsung Life
VIF % ANW %
n/a
3%
-3%
n/a
-
200
400
600
800
1,000
1,200
1,400
DB Insurance Hanwha Life Samsung Life Samsung Fire &Marine
Lif
e In
su
ran
ce
Co
ve
red
VN
B
(KR
W b
illi
on
s)
n/a
-9%
-5%
n/a
-
500
1,000
1,500
2,000
2,500
3,000
3,500
DB Insurance Hanwha Life Samsung Life Samsung Fire &Marine
AP
E (
KR
W b
illi
on
s)
n/a
+4% +1%
n/a
0%
10%
20%
30%
40%
50%
DB Insurance Hanwha Life Samsung Life Samsung Fire &Marine
New
Bu
sin
es
s M
arg
in
(% o
f A
PE
)
◼ 2016 ◼ 2017 ◼ 2018
1 Year Growth % 2017-18
Change in margins 2017-18
MILLIMAN REPORT
2018 Embedded Value Results: Asia 47 August 2019
Our South Korea analysis includes the EV and VNB results of Hanwha Life and Samsung Life.73 AIA has not
reported its EV and VNB results for South Korea separately since 2015. All of the EV reporting companies have
kept their risk discount rates unchanged for 2018. Hanwha Life and Samsung have decreased their investment
return assumptions from 3.65% to 3.35% and from 4.00% to 3.40%, respectively. The 10-year government bond
yield in South Korea, as at 31 December 2018 was 1.96%, down from 2.47% as at 31 December 2017.
Both the Korean insurers reported a decrease in their ANW and VIF. The decreases in ANW were caused
partially by additional stochastic guarantee reserve requirements due to the declining interest rates. Hanwha Life
attributed its decrease in VIF to a fall in investment return assumptions. Samsung Life recorded a 54% fall in VIF,
citing a fall in investment rate assumptions and worsening actuarial assumptions as the main reasons. Although
VNB dropped by around 3% for Samsung Life, new business margins improved by 1% due to higher sales of
protection products.
Given that Korean companies will adopt IFRS17 and K-ICS from year 2022, they are going through different
stages of impact studies and implementation projects. With IFRS17 reporting on the horizon, some companies
have stopped reporting EV results to the market, with others likely to follow this trend.
The Korean regulator, Financial Services Commission (FSC), has come up with a plan to revise insurance
policies in order to lower insurance premiums and increase policy surrender payouts. As part of this plan, starting
from January 2021, agents will not be paid commissions greater than12 times the monthly premiums, with a
maximum of KRW 1.2 million for an insurance contract with a KRW 100,000 monthly premium.
South Korea's insurance companies are focusing on improving their processes and developing various products
by working with startup fintech and insurtech companies. The FSC plans to develop comprehensive reform
measures in order to stimulate technological innovation in the financial sector and create an ecosystem where
fintech startups are unrestricted to experiment with new ideas.
73 It is important to note that DB Insurance and Samsung Fire & Marine also transact property and casualty insurance, hence care will need to be taken
when comparing their EV against other companies, as the results cover their ‘pseudo-life’ type long-term business and other non-life business.
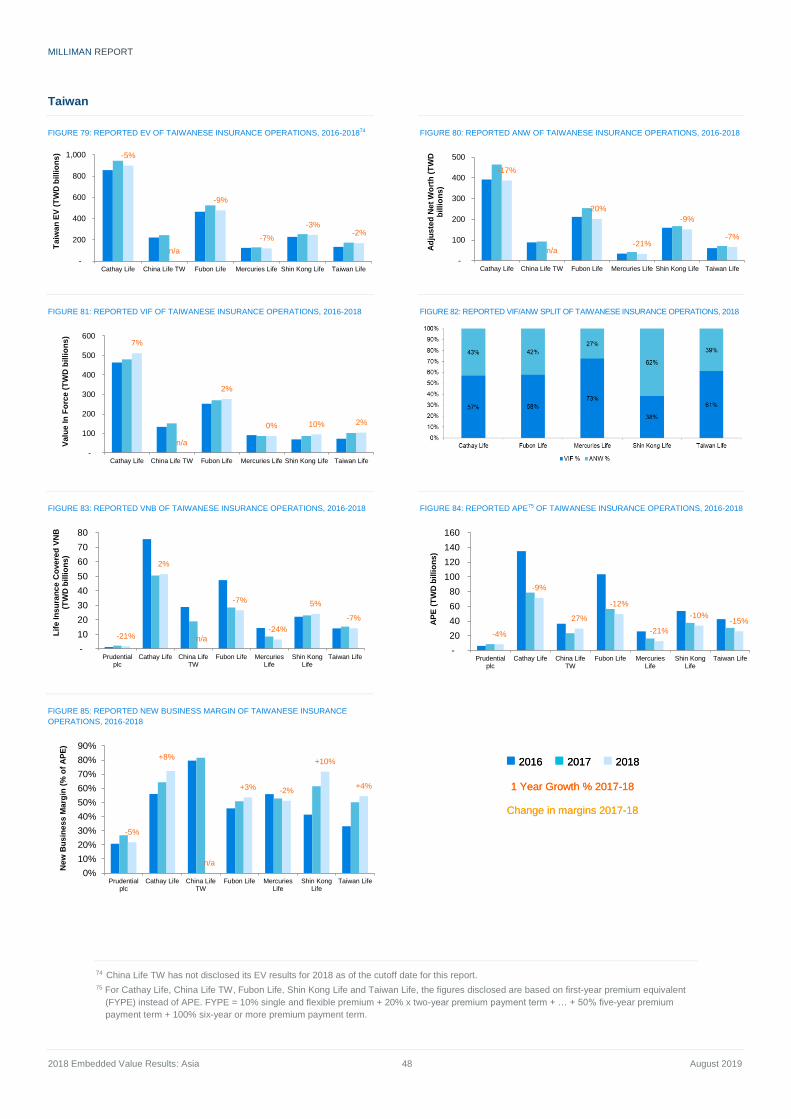
MILLIMAN REPORT
2018 Embedded Value Results: Asia 48 August 2019
Taiwan
FIGURE 79: REPORTED EV OF TAIWANESE INSURANCE OPERATIONS, 2016-201874
FIGURE 80: REPORTED ANW OF TAIWANESE INSURANCE OPERATIONS, 2016-2018
FIGURE 81: REPORTED VIF OF TAIWANESE INSURANCE OPERATIONS, 2016-2018
FIGURE 82: REPORTED VIF/ANW SPLIT OF TAIWANESE INSURANCE OPERATIONS, 2018
FIGURE 83: REPORTED VNB OF TAIWANESE INSURANCE OPERATIONS, 2016-2018
FIGURE 84: REPORTED APE75 OF TAIWANESE INSURANCE OPERATIONS, 2016-2018
FIGURE 85: REPORTED NEW BUSINESS MARGIN OF TAIWANESE INSURANCE
OPERATIONS, 2016-2018
74 China Life TW has not disclosed its EV results for 2018 as of the cutoff date for this report.
75 For Cathay Life, China Life TW, Fubon Life, Shin Kong Life and Taiwan Life, the figures disclosed are based on first-year premium equivalent
(FYPE) instead of APE. FYPE = 10% single and flexible premium + 20% x two-year premium payment term + … + 50% five-year premium
payment term + 100% six-year or more premium payment term.
-5%
n/a
-9%
-7%
-3%-2%
-
200
400
600
800
1,000
Cathay Life China Life TW Fubon Life Mercuries Life Shin Kong Life Taiwan Life
Ta
iwa
n E
V (
TW
D b
illi
on
s)
-17%
n/a
-20%
-21%
-9%
-7%
-
100
200
300
400
500
Cathay Life China Life TW Fubon Life Mercuries Life Shin Kong Life Taiwan Life
Ad
jus
ted
Ne
t W
ort
h (
TW
D
bil
lio
ns
)
7%
n/a
2%
0% 10% 2%
-
100
200
300
400
500
600
Cathay Life China Life TW Fubon Life Mercuries Life Shin Kong Life Taiwan Life
Va
lue
In
Fo
rce
(T
WD
bil
lio
ns
)
-21%
2%
n/a
-7%
-24%
5%
-7%
-
10
20
30
40
50
60
70
80
Prudentialplc
Cathay Life China LifeTW
Fubon Life MercuriesLife
Shin KongLife
Taiwan Life
Lif
e In
su
ran
ce
Co
ve
red
VN
B
(TW
D b
illi
on
s)
-4%
-9%
27%
-12%
-21%
-10%-15%
-
20
40
60
80
100
120
140
160
Prudentialplc
Cathay Life China LifeTW
Fubon Life MercuriesLife
Shin KongLife
Taiwan Life
AP
E (
TW
D b
illi
on
s)
-5%
+8%
n/a
+3% -2%
+10%
+4%
0%
10%
20%
30%
40%
50%
60%
70%
80%
90%
Prudentialplc
Cathay Life China LifeTW
Fubon Life MercuriesLife
Shin KongLife
Taiwan Life
New
Bu
sin
es
s M
arg
in (
% o
f A
PE
)
◼ 2016 ◼ 2017 ◼ 2018
1 Year Growth % 2017-18
Change in margins 2017-18
◼ 2016 ◼ 2017 ◼ 2018
1 Year Growth % 2017-18
Change in margins 2017-18
MILLIMAN REPORT
2018 Embedded Value Results: Asia 49 August 2019
All insurers in Taiwan posted declining EV results in 2018, with Fubon Life reporting the greatest fall of 9%,
followed by Mercuries Life, which reported a reduction of 7%. Fubon Life and Mercuries Life recorded significant
drops in ANW, of approximately 20% and 21%, respectively, while the 2018 VIF results only changed marginally
from those reported in 2017.
Cathay Life and Shin Kong Life reported rises in VNB results, whereas Prudential plc, Fubon Life, Mercuries Life
and Taiwan Life recorded falls in VNB. Fubon Life’s VNB decreased by 7% for the year ending 2018 due to a
shift in market demand towards unit-linked and short-term health and accident plans.
Prudential plc increased its risk discount rate assumption for in-force and new business from 3.9% to 4.4% and
from 4.3% to 4.5%, respectively, while keeping its 10-year government bond yield assumption unchanged from
2017. The domestic life insurers in 2018 typically assumed investment returns that start from around 3.1% to
4.8%, and increase to long-term rates of around 4.8% to 6.0%, with risk discount rates of around 10.5%. The 10-
year government bond yield stood at approximately 0.87% at the end of 2018, down from 0.95% at the end of
2017. The full set of economic assumptions disclosed in the market is set out in Figure 100 below.
In other developments, to prepare for the implementation of IFRS17 and to improve low equity-to-asset ratios of
insurers, Taiwan’s Financial Supervisory Commission (FSC) has decided to toughen the regulations for
Taiwanese life insurers later this year. Insurers in Taiwan lack the adequate reserves to fulfil IFRS17
requirements; hence, the expected implementation date agreed by Taiwan regulator is January 2025, which is
three years behind the international adoption date. Press reports suggest the regulations will also promote
traditional products and discourage use of insurance as a wealth management options for individuals.
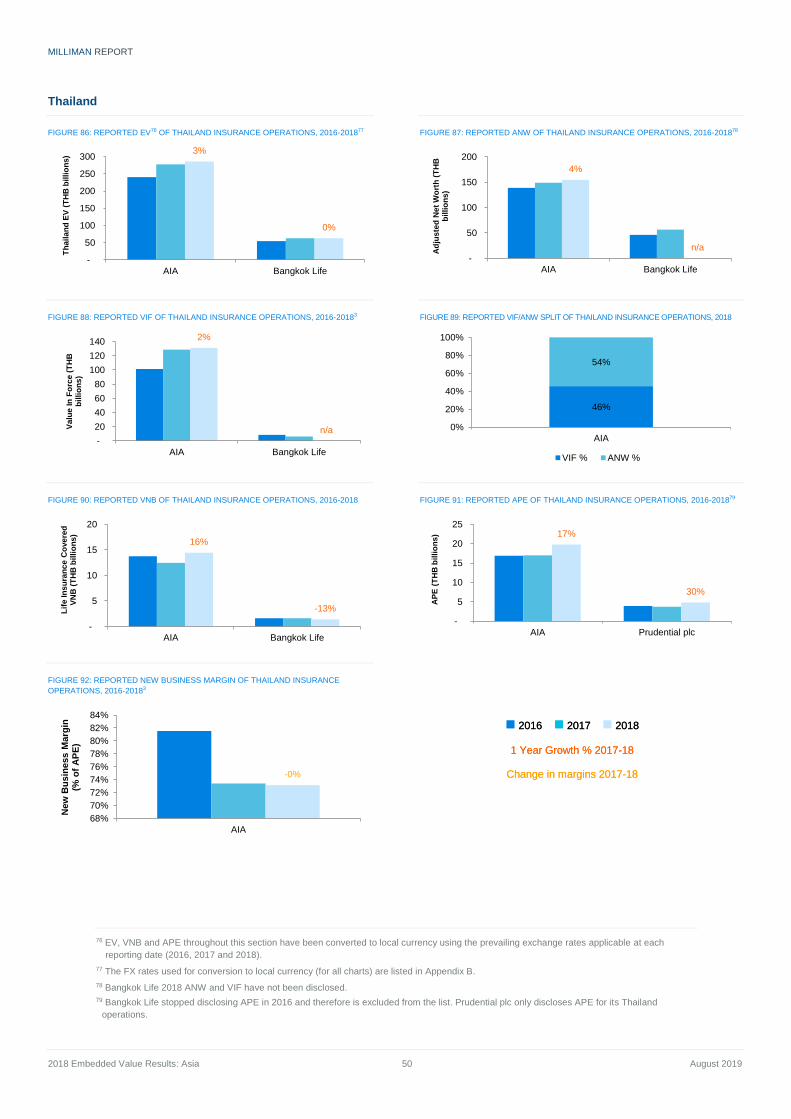
MILLIMAN REPORT
2018 Embedded Value Results: Asia 50 August 2019
Thailand
FIGURE 86: REPORTED EV76 OF THAILAND INSURANCE OPERATIONS, 2016-201877
FIGURE 87: REPORTED ANW OF THAILAND INSURANCE OPERATIONS, 2016-201878
FIGURE 88: REPORTED VIF OF THAILAND INSURANCE OPERATIONS, 2016-20183
FIGURE 89: REPORTED VIF/ANW SPLIT OF THAILAND INSURANCE OPERATIONS, 2018
FIGURE 90: REPORTED VNB OF THAILAND INSURANCE OPERATIONS, 2016-2018
FIGURE 91: REPORTED APE OF THAILAND INSURANCE OPERATIONS, 2016-201879
FIGURE 92: REPORTED NEW BUSINESS MARGIN OF THAILAND INSURANCE
OPERATIONS, 2016-20183
76 EV, VNB and APE throughout this section have been converted to local currency using the prevailing exchange rates applicable at each
reporting date (2016, 2017 and 2018).
77 The FX rates used for conversion to local currency (for all charts) are listed in Appendix B.
78 Bangkok Life 2018 ANW and VIF have not been disclosed. 79 Bangkok Life stopped disclosing APE in 2016 and therefore is excluded from the list. Prudential plc only discloses APE for its Thailand
operations.
3%
0%
-
50
100
150
200
250
300
AIA Bangkok Life
Th
ail
an
d E
V (
TH
B b
illi
on
s)
4%
n/a
-
50
100
150
200
AIA Bangkok Life
Ad
jus
ted
Ne
t W
ort
h (
TH
B
bil
lio
ns
)
2%
n/a
-
20
40
60
80
100
120
140
AIA Bangkok Life
Va
lue
In
Fo
rce
(T
HB
b
illi
on
s)
46%
54%
0%
20%
40%
60%
80%
100%
AIA
VIF % ANW %
16%
-13%
-
5
10
15
20
AIA Bangkok Life
Lif
e In
su
ran
ce
Co
ve
red
V
NB
(T
HB
bil
lio
ns
) 17%
30%
-
5
10
15
20
25
AIA Prudential plc
AP
E (
TH
B b
illi
on
s)
-0%
68%
70%
72%
74%
76%
78%
80%
82%
84%
AIA
New
Bu
sin
ess M
arg
in
(% o
f A
PE
)
◼ 2016 ◼ 2017 ◼ 2018
1 Year Growth % 2017-18
Change in margins 2017-18
◼ 2016 ◼ 2017 ◼ 2018
1 Year Growth % 2017-18
Change in margins 2017-18
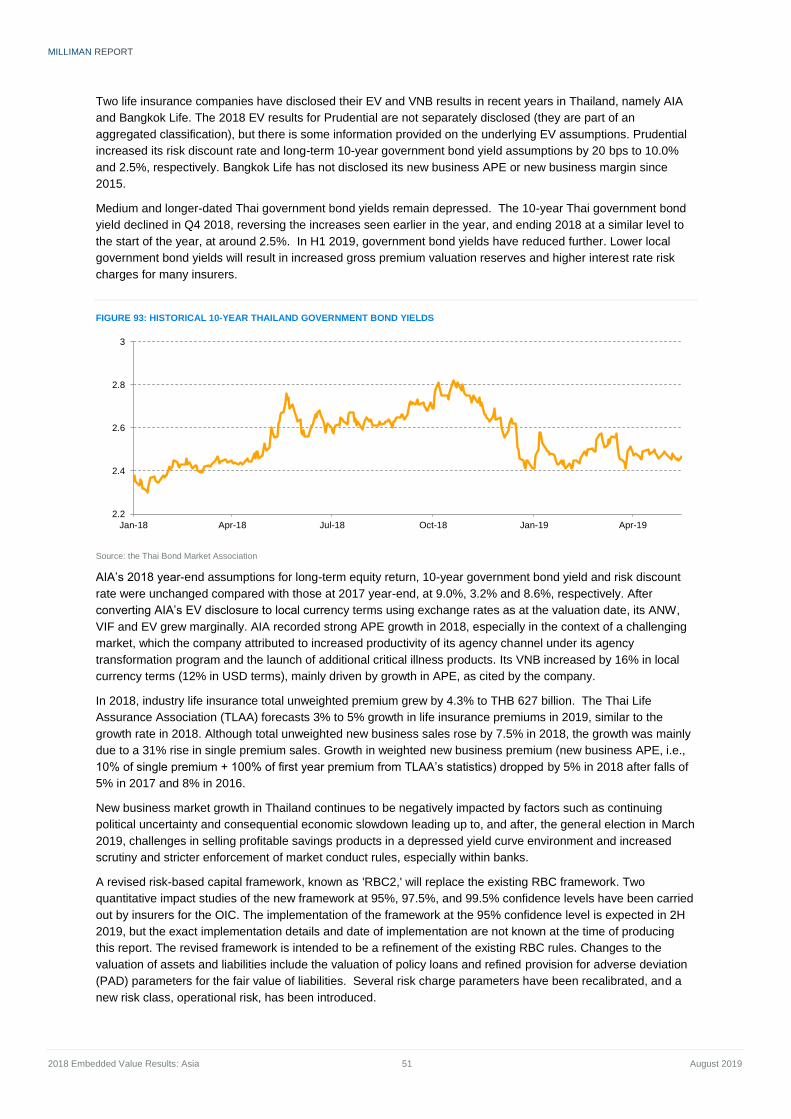
MILLIMAN REPORT
2018 Embedded Value Results: Asia 51 August 2019
Two life insurance companies have disclosed their EV and VNB results in recent years in Thailand, namely AIA
and Bangkok Life. The 2018 EV results for Prudential are not separately disclosed (they are part of an
aggregated classification), but there is some information provided on the underlying EV assumptions. Prudential
increased its risk discount rate and long-term 10-year government bond yield assumptions by 20 bps to 10.0%
and 2.5%, respectively. Bangkok Life has not disclosed its new business APE or new business margin since
2015.
Medium and longer-dated Thai government bond yields remain depressed. The 10-year Thai government bond
yield declined in Q4 2018, reversing the increases seen earlier in the year, and ending 2018 at a similar level to
the start of the year, at around 2.5%. In H1 2019, government bond yields have reduced further. Lower local
government bond yields will result in increased gross premium valuation reserves and higher interest rate risk
charges for many insurers.
FIGURE 93: HISTORICAL 10-YEAR THAILAND GOVERNMENT BOND YIELDS
Source: the Thai Bond Market Association
AIA’s 2018 year-end assumptions for long-term equity return, 10-year government bond yield and risk discount
rate were unchanged compared with those at 2017 year-end, at 9.0%, 3.2% and 8.6%, respectively. After
converting AIA’s EV disclosure to local currency terms using exchange rates as at the valuation date, its ANW,
VIF and EV grew marginally. AIA recorded strong APE growth in 2018, especially in the context of a challenging
market, which the company attributed to increased productivity of its agency channel under its agency
transformation program and the launch of additional critical illness products. Its VNB increased by 16% in local
currency terms (12% in USD terms), mainly driven by growth in APE, as cited by the company.
In 2018, industry life insurance total unweighted premium grew by 4.3% to THB 627 billion. The Thai Life
Assurance Association (TLAA) forecasts 3% to 5% growth in life insurance premiums in 2019, similar to the
growth rate in 2018. Although total unweighted new business sales rose by 7.5% in 2018, the growth was mainly
due to a 31% rise in single premium sales. Growth in weighted new business premium (new business APE, i.e.,
10% of single premium + 100% of first year premium from TLAA’s statistics) dropped by 5% in 2018 after falls of
5% in 2017 and 8% in 2016.
New business market growth in Thailand continues to be negatively impacted by factors such as continuing
political uncertainty and consequential economic slowdown leading up to, and after, the general election in March
2019, challenges in selling profitable savings products in a depressed yield curve environment and increased
scrutiny and stricter enforcement of market conduct rules, especially within banks.
A revised risk-based capital framework, known as 'RBC2,' will replace the existing RBC framework. Two
quantitative impact studies of the new framework at 95%, 97.5%, and 99.5% confidence levels have been carried
out by insurers for the OIC. The implementation of the framework at the 95% confidence level is expected in 2H
2019, but the exact implementation details and date of implementation are not known at the time of producing
this report. The revised framework is intended to be a refinement of the existing RBC rules. Changes to the
valuation of assets and liabilities include the valuation of policy loans and refined provision for adverse deviation
(PAD) parameters for the fair value of liabilities. Several risk charge parameters have been recalibrated, and a
new risk class, operational risk, has been introduced.
2.2
2.4
2.6
2.8
3
Jan-18 Apr-18 Jul-18 Oct-18 Jan-19 Apr-19
MILLIMAN REPORT
2018 Embedded Value Results: Asia 52 August 2019
In addition, from 2019 onwards insurance companies will be required to implement ERM and ORSA practices.
The requirements are more stringent for Tier 1 companies, i.e., insurers with total asset value of THB 90 billion or
more, and for reinsurance companies. On top of the regulatory capital requirements, insurance companies are
required to calculate economic capital in the event that the regulatory capital alone fails to capture the risk profile
of the company adequately.
The OIC has circulated two draft regulations that will increase disclosure requirements for all insurers, namely
‘Rules, Procedures and Conditions for Disclosure of Financial Standing and Operating Results of Life Insurance
Companies’ and ‘Rules, Procedures and Conditions for Disclosure of Financial Standing and Operating Results
of Non-Life Insurance Companies.’ The draft notifications outline the different types of information that life and
non-life insurance companies must disclose, including quantitative and qualitative data on the company’s ERM
and asset liability management. The objective is to improve comparability of companies within the insurance
industry and protect the interests of consumers.
In other developments, the OIC established the CIT for research, technological exchange and insurance product
development in 2018. It aims to bring together insurance firms and tech startups to encourage technological
innovation in the insurance industry. There is also a regulatory sandbox for insurtech, along with a number of
benefits for new entrants that reduce the regulatory hurdles they need to face.
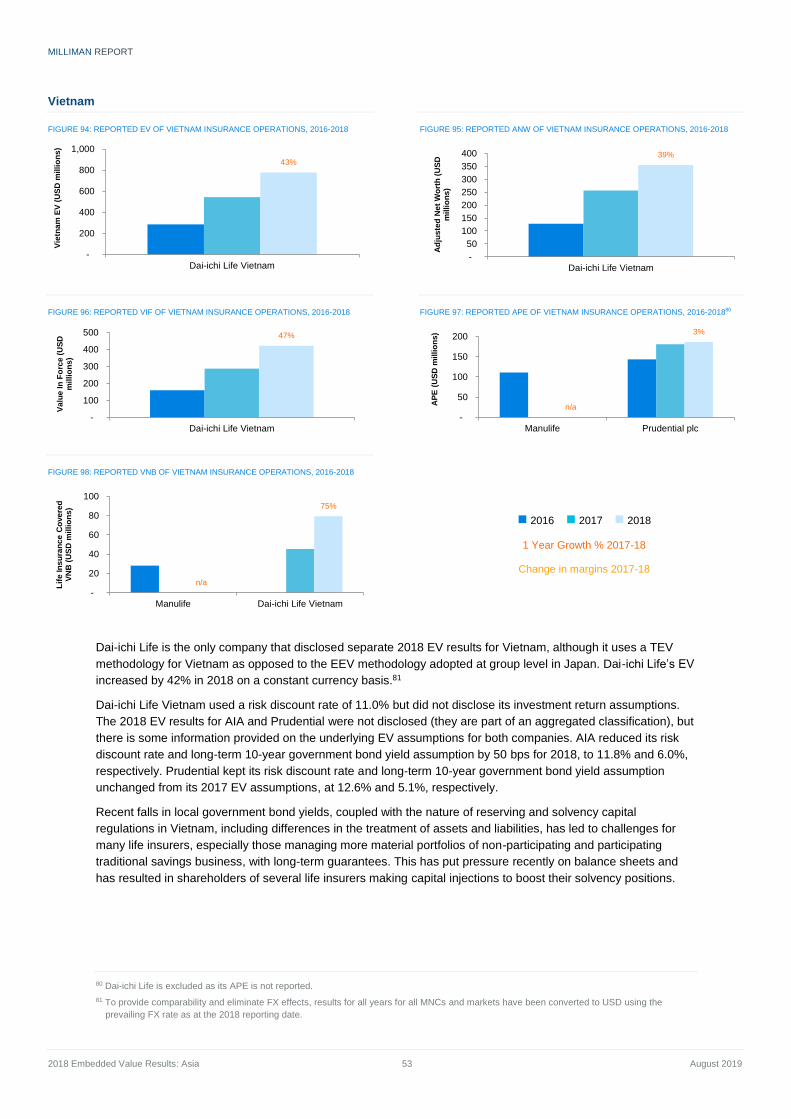
MILLIMAN REPORT
2018 Embedded Value Results: Asia 53 August 2019
Vietnam
FIGURE 94: REPORTED EV OF VIETNAM INSURANCE OPERATIONS, 2016-2018
FIGURE 95: REPORTED ANW OF VIETNAM INSURANCE OPERATIONS, 2016-2018
FIGURE 96: REPORTED VIF OF VIETNAM INSURANCE OPERATIONS, 2016-2018
FIGURE 97: REPORTED APE OF VIETNAM INSURANCE OPERATIONS, 2016-201880
FIGURE 98: REPORTED VNB OF VIETNAM INSURANCE OPERATIONS, 2016-2018
Dai-ichi Life is the only company that disclosed separate 2018 EV results for Vietnam, although it uses a TEV
methodology for Vietnam as opposed to the EEV methodology adopted at group level in Japan. Dai-ichi Life’s EV
increased by 42% in 2018 on a constant currency basis.81
Dai-ichi Life Vietnam used a risk discount rate of 11.0% but did not disclose its investment return assumptions.
The 2018 EV results for AIA and Prudential were not disclosed (they are part of an aggregated classification), but
there is some information provided on the underlying EV assumptions for both companies. AIA reduced its risk
discount rate and long-term 10-year government bond yield assumption by 50 bps for 2018, to 11.8% and 6.0%,
respectively. Prudential kept its risk discount rate and long-term 10-year government bond yield assumption
unchanged from its 2017 EV assumptions, at 12.6% and 5.1%, respectively.
Recent falls in local government bond yields, coupled with the nature of reserving and solvency capital
regulations in Vietnam, including differences in the treatment of assets and liabilities, has led to challenges for
many life insurers, especially those managing more material portfolios of non-participating and participating
traditional savings business, with long-term guarantees. This has put pressure recently on balance sheets and
has resulted in shareholders of several life insurers making capital injections to boost their solvency positions.
80 Dai-ichi Life is excluded as its APE is not reported.
81 To provide comparability and eliminate FX effects, results for all years for all MNCs and markets have been converted to USD using the
prevailing FX rate as at the 2018 reporting date.
43%
-
200
400
600
800
1,000
Dai-ichi Life Vietnam
Vie
tna
m E
V (
US
D m
illi
on
s)
39%
-
50
100
150
200
250
300
350
400
Dai-ichi Life Vietnam
Ad
jus
ted
Ne
t W
ort
h (
US
D
mil
lio
ns
)
47%
-
100
200
300
400
500
Dai-ichi Life Vietnam
Va
lue
In
Fo
rce
(U
SD
m
illi
on
s)
n/a
3%
-
50
100
150
200
Manulife Prudential plcA
PE
(U
SD
mil
lio
ns
)
n/a
75%
-
20
40
60
80
100
Manulife Dai-ichi Life Vietnam
Lif
e In
su
ran
ce
Co
ve
red
V
NB
(U
SD
mil
lio
ns
)
◼ 2016 ◼ 2017 ◼ 2018
1 Year Growth % 2017-18
Change in margins 2017-18
MILLIMAN REPORT
2018 Embedded Value Results: Asia 54 August 2019
Against the backdrop of the low yield environment, there has been extensive industry lobbying for changes to the
statutory reserving rules, and recent changes to the basis. With effect from 16 February 2019, the MOF amended
its Circular 50 regulation (Point 3.1, Clause 3, Article 18) in respect of the calculation of VIR under the NLP
method. The change from the existing VIR basis to the new VIR basis is summarised below:
Existing VIR basis: 70% of the average yield of government bonds with durations of 10 years or longer issued
over the past six months.
New VIR basis: 80% of the average yield of government bonds with durations of 10 years or longer issued
over the past 24 months.
The maximum VIR allowed by the MOF differs by the issue date of policies and is set to be the lowest of (a), (b)
and (c) as described below:
a) For policies issued before 16 February 2019: A blended rate according to calendar year in the table
below, gradually phased in to the new VIR basis.
CALENDAR YEAR VIR ASSUMPTION
2019 60% of existing VIR basis + 40% of new VIR basis
2020 40% of existing VIR basis + 60% of new VIR basis
2021 20% of existing VIR basis + 80% of new VIR basis
2022+ 100% of new VIR basis
For policies issued on or after 16 February 2019: The new VIR basis.
b) The average investment interest returns achieved over the last four quarters.
c) Valuation interest rate adopted in pricing.
The new reserving rules have resulted in higher VIR and lower statutory reserves, and led to some improvement
in solvency ratios for many insurers.
In other developments, the use of cash or deposits to fund deficits in the policyholder fund under Circular 50
(Clause 1, Article 27) will also be amended. The original Circular 50 states that the insurers have the
responsibility to address deficits in the policyholder fund (if any) from the shareholder fund. In the proposed
amendment to Circular 50, the MOF provided clarification that the assets used to fund these deficits are to be
either in cash or deposits at the financial institutions coming from the shareholder fund.
Vietnam has seen more macroeconomic stability in recent years, helping to support growth in the insurance
sector. The MOF Insurance Supervisory Authority is targeting a premium growth rate of 20% in 2019, to reach
around 3% of GDP by 2020 and 3.5% by 2025. Life insurance market growth has been strong in the past few
years. In 2018, total gross written premium increased by 29% to VND 85 trillion (approximately USD 3.69 billion)
and new business premium grew by 29% to VND 29 trillion (approximately USD 1.25 billion).
MILLIMAN REPORT
2018 Embedded Value Results: Asia 55 August 2019
Methodology hot topics Within Asia, there are two groups of companies publicly reporting EV: 1) those reporting TEV, and 2) the
remaining reporting EEV, IEV or MCEV. The latter tend to be subsidiaries or joint ventures of European and
Japanese insurers.
For all types of EV reporting, common hot topics in Asia include:
The selection and construction of the appropriate risk discount rate
The selection of appropriate investment rate assumptions
Allowance for the impact of cost/expense overruns
How to explicitly or implicitly allow for the cost of capital
Calculation of TVOG
CONSTRUCTION OF RISK DISCOUNT RATE
The selection of risk discount rate is one of the most important considerations for EV calculations. Broadly, there
are three main methodologies behind discount rate derivation:
1. A single discount rate applied to all periods, calculated using a benchmark risk-free rate plus risk margin or
adjusting an assumed investment return.
2. A ‘top-down’ approach, whereby a discount rate or curve is constructed by adjusting the expected portfolio
returns by considering the risks that the company is exposed to, and applying this discount rate or curve to
every cash flow.
3. A ‘bottom-up’ approach, whereby a risk-free rate plus risk margin curve is constructed for each cash flow or
group of cash flows, with due consideration to the risk exposure of each cash flow. Where cash flows have
an equivalent liquid and listed asset, the discount rate will be set to the implied yield of the asset. In IEV and
MCEV, the risk margin typically only includes the liquidity premium.
These three methods roughly correspond to the TEV, EEV and IEV/MCEV approaches, although the majority of
companies that report using EEV also now adopt a ‘bottom-up’ approach.
In addition to the derivation methodology, there are three further major considerations:
1. The underlying basis for the risk discount rate.
2. The inclusion of any illiquidity premium.
3. The interpolation and extrapolation method used to construct a discount curve (typically applicable only to
EEV and MCEV companies).
The three considerations described above generally only apply to firms using EEV, IEV and MCEV reporting. For
TEV-reporting firms, the generally accepted approach is to use an underlying risk-free rate (such as a long-dated
government bond), and apply an additional risk margin; a popular subset of this approach includes the capital asset
pricing model (CAPM). The main consideration for TEV firms is the calculation of the risk margin, meant to
encompass factors which are explicitly accounted for in EEV, IEV and MCEV; that is, the cost of capital and TVOG.
Figure 99 summarises the risk discount rate and investment return assumptions by the MNCs (both foreign and
Asian MNCs). Figure 100 summarises the assumptions by market.
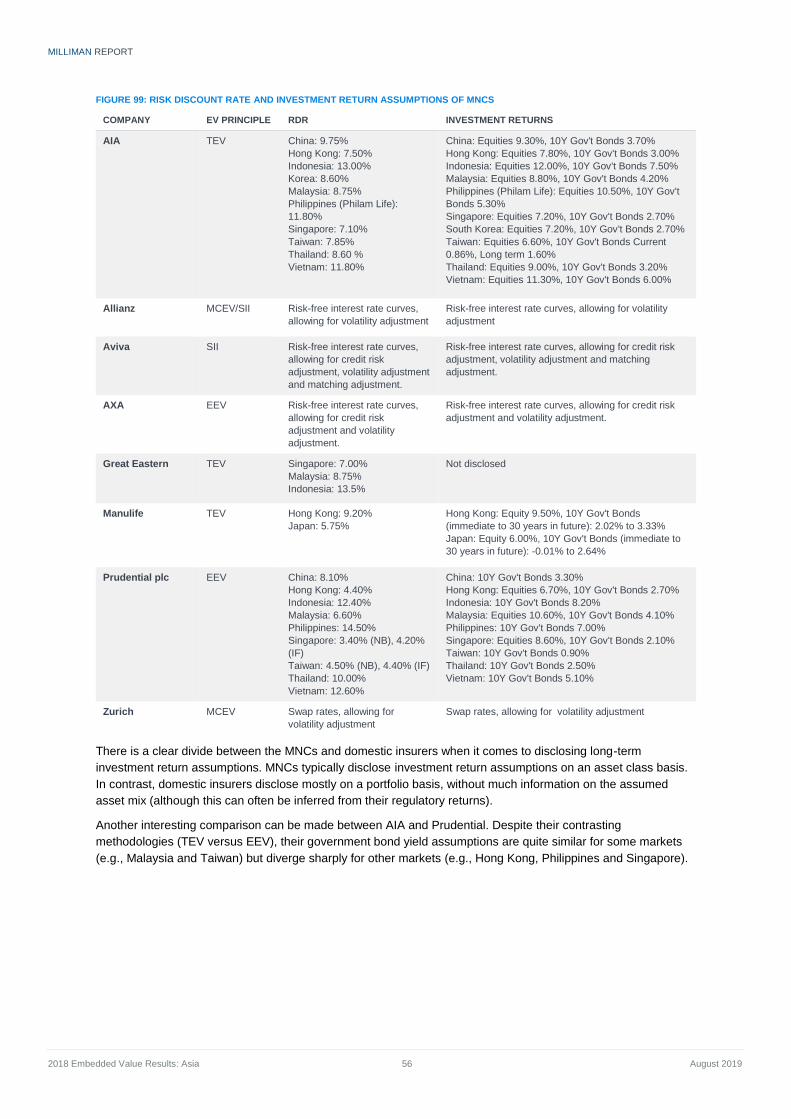
MILLIMAN REPORT
2018 Embedded Value Results: Asia 56 August 2019
FIGURE 99: RISK DISCOUNT RATE AND INVESTMENT RETURN ASSUMPTIONS OF MNCS
COMPANY EV PRINCIPLE RDR INVESTMENT RETURNS
AIA TEV China: 9.75%
Hong Kong: 7.50%
Indonesia: 13.00%
Korea: 8.60%
Malaysia: 8.75%
Philippines (Philam Life):
11.80%
Singapore: 7.10%
Taiwan: 7.85%
Thailand: 8.60 %
Vietnam: 11.80%
China: Equities 9.30%, 10Y Gov't Bonds 3.70%
Hong Kong: Equities 7.80%, 10Y Gov't Bonds 3.00%
Indonesia: Equities 12.00%, 10Y Gov't Bonds 7.50%
Malaysia: Equities 8.80%, 10Y Gov't Bonds 4.20%
Philippines (Philam Life): Equities 10.50%, 10Y Gov't
Bonds 5.30%
Singapore: Equities 7.20%, 10Y Gov't Bonds 2.70%
South Korea: Equities 7.20%, 10Y Gov't Bonds 2.70%
Taiwan: Equities 6.60%, 10Y Gov't Bonds Current
0.86%, Long term 1.60%
Thailand: Equities 9.00%, 10Y Gov't Bonds 3.20%
Vietnam: Equities 11.30%, 10Y Gov't Bonds 6.00%
Allianz MCEV/SII Risk-free interest rate curves,
allowing for volatility adjustment
Risk-free interest rate curves, allowing for volatility
adjustment
Aviva SII Risk-free interest rate curves,
allowing for credit risk
adjustment, volatility adjustment
and matching adjustment.
Risk-free interest rate curves, allowing for credit risk
adjustment, volatility adjustment and matching
adjustment.
AXA EEV Risk-free interest rate curves,
allowing for credit risk
adjustment and volatility
adjustment.
Risk-free interest rate curves, allowing for credit risk
adjustment and volatility adjustment.
Great Eastern TEV Singapore: 7.00%
Malaysia: 8.75%
Indonesia: 13.5%
Not disclosed
Manulife TEV Hong Kong: 9.20%
Japan: 5.75%
Hong Kong: Equity 9.50%, 10Y Gov't Bonds
(immediate to 30 years in future): 2.02% to 3.33%
Japan: Equity 6.00%, 10Y Gov't Bonds (immediate to
30 years in future): -0.01% to 2.64%
Prudential plc EEV China: 8.10%
Hong Kong: 4.40%
Indonesia: 12.40%
Malaysia: 6.60%
Philippines: 14.50%
Singapore: 3.40% (NB), 4.20%
(IF)
Taiwan: 4.50% (NB), 4.40% (IF)
Thailand: 10.00%
Vietnam: 12.60%
China: 10Y Gov't Bonds 3.30%
Hong Kong: Equities 6.70%, 10Y Gov't Bonds 2.70%
Indonesia: 10Y Gov't Bonds 8.20%
Malaysia: Equities 10.60%, 10Y Gov't Bonds 4.10%
Philippines: 10Y Gov't Bonds 7.00%
Singapore: Equities 8.60%, 10Y Gov't Bonds 2.10%
Taiwan: 10Y Gov't Bonds 0.90%
Thailand: 10Y Gov't Bonds 2.50%
Vietnam: 10Y Gov't Bonds 5.10%
Zurich MCEV Swap rates, allowing for
volatility adjustment
Swap rates, allowing for volatility adjustment
There is a clear divide between the MNCs and domestic insurers when it comes to disclosing long-term
investment return assumptions. MNCs typically disclose investment return assumptions on an asset class basis.
In contrast, domestic insurers disclose mostly on a portfolio basis, without much information on the assumed
asset mix (although this can often be inferred from their regulatory returns).
Another interesting comparison can be made between AIA and Prudential. Despite their contrasting
methodologies (TEV versus EEV), their government bond yield assumptions are quite similar for some markets
(e.g., Malaysia and Taiwan) but diverge sharply for other markets (e.g., Hong Kong, Philippines and Singapore).
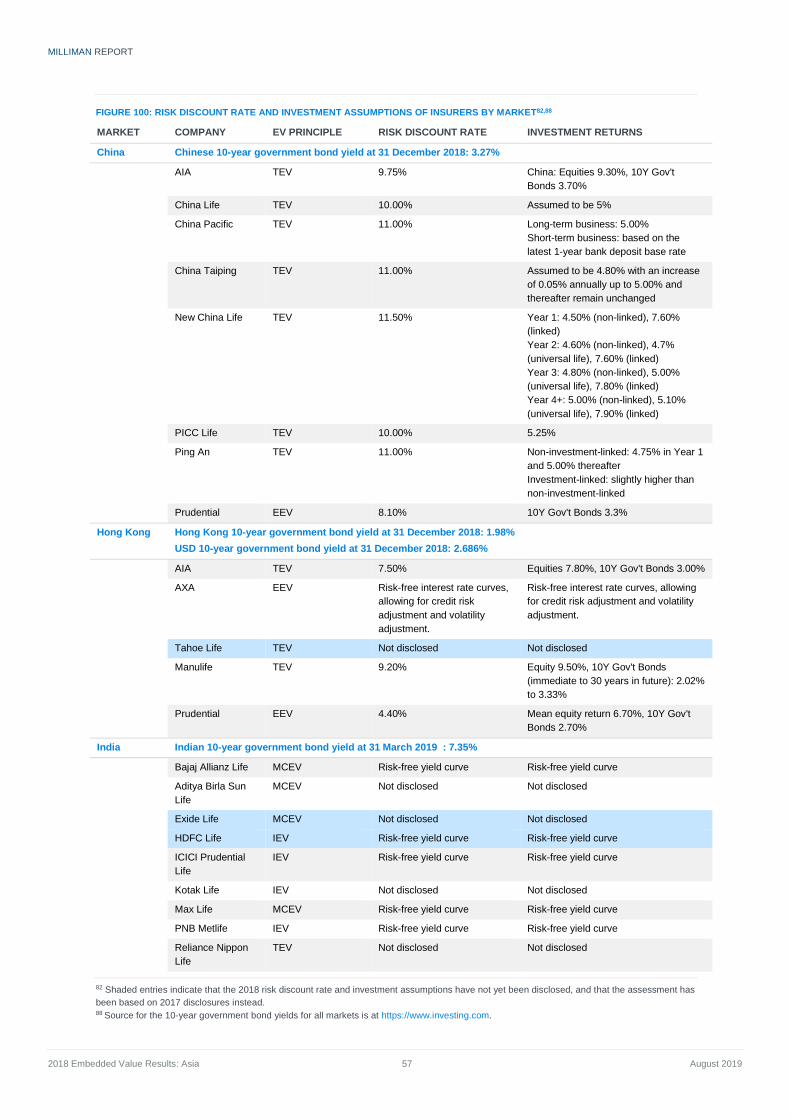
MILLIMAN REPORT
2018 Embedded Value Results: Asia 57 August 2019
FIGURE 100: RISK DISCOUNT RATE AND INVESTMENT ASSUMPTIONS OF INSURERS BY MARKET82,88
MARKET COMPANY EV PRINCIPLE RISK DISCOUNT RATE INVESTMENT RETURNS
China Chinese 10-year government bond yield at 31 December 2018: 3.27%
AIA TEV 9.75% China: Equities 9.30%, 10Y Gov't
Bonds 3.70%
China Life TEV 10.00% Assumed to be 5%
China Pacific TEV 11.00% Long-term business: 5.00%
Short-term business: based on the
latest 1-year bank deposit base rate
China Taiping TEV 11.00% Assumed to be 4.80% with an increase
of 0.05% annually up to 5.00% and
thereafter remain unchanged
New China Life TEV 11.50% Year 1: 4.50% (non-linked), 7.60%
(linked)
Year 2: 4.60% (non-linked), 4.7%
(universal life), 7.60% (linked)
Year 3: 4.80% (non-linked), 5.00%
(universal life), 7.80% (linked)
Year 4+: 5.00% (non-linked), 5.10%
(universal life), 7.90% (linked)
PICC Life TEV 10.00% 5.25%
Ping An TEV 11.00% Non-investment-linked: 4.75% in Year 1
and 5.00% thereafter
Investment-linked: slightly higher than
non-investment-linked
Prudential EEV 8.10% 10Y Gov't Bonds 3.3%
Hong Kong Hong Kong 10-year government bond yield at 31 December 2018: 1.98%
USD 10-year government bond yield at 31 December 2018: 2.686%
AIA TEV 7.50% Equities 7.80%, 10Y Gov't Bonds 3.00%
AXA EEV Risk-free interest rate curves,
allowing for credit risk
adjustment and volatility
adjustment.
Risk-free interest rate curves, allowing
for credit risk adjustment and volatility
adjustment.
Tahoe Life TEV Not disclosed Not disclosed
Manulife TEV 9.20% Equity 9.50%, 10Y Gov't Bonds
(immediate to 30 years in future): 2.02%
to 3.33%
Prudential EEV 4.40% Mean equity return 6.70%, 10Y Gov't
Bonds 2.70%
India Indian 10-year government bond yield at 31 March 2019 : 7.35%
Bajaj Allianz Life MCEV Risk-free yield curve Risk-free yield curve
Aditya Birla Sun
Life
MCEV Not disclosed Not disclosed
Exide Life MCEV Not disclosed Not disclosed
HDFC Life IEV Risk-free yield curve Risk-free yield curve
ICICI Prudential
Life
IEV Risk-free yield curve Risk-free yield curve
Kotak Life IEV Not disclosed Not disclosed
Max Life MCEV Risk-free yield curve Risk-free yield curve
PNB Metlife IEV Risk-free yield curve Risk-free yield curve
Reliance Nippon
Life
TEV Not disclosed Not disclosed
82 Shaded entries indicate that the 2018 risk discount rate and investment assumptions have not yet been disclosed, and that the assessment has
been based on 2017 disclosures instead. 88 Source for the 10-year government bond yields for all markets is at https://www.investing.com.
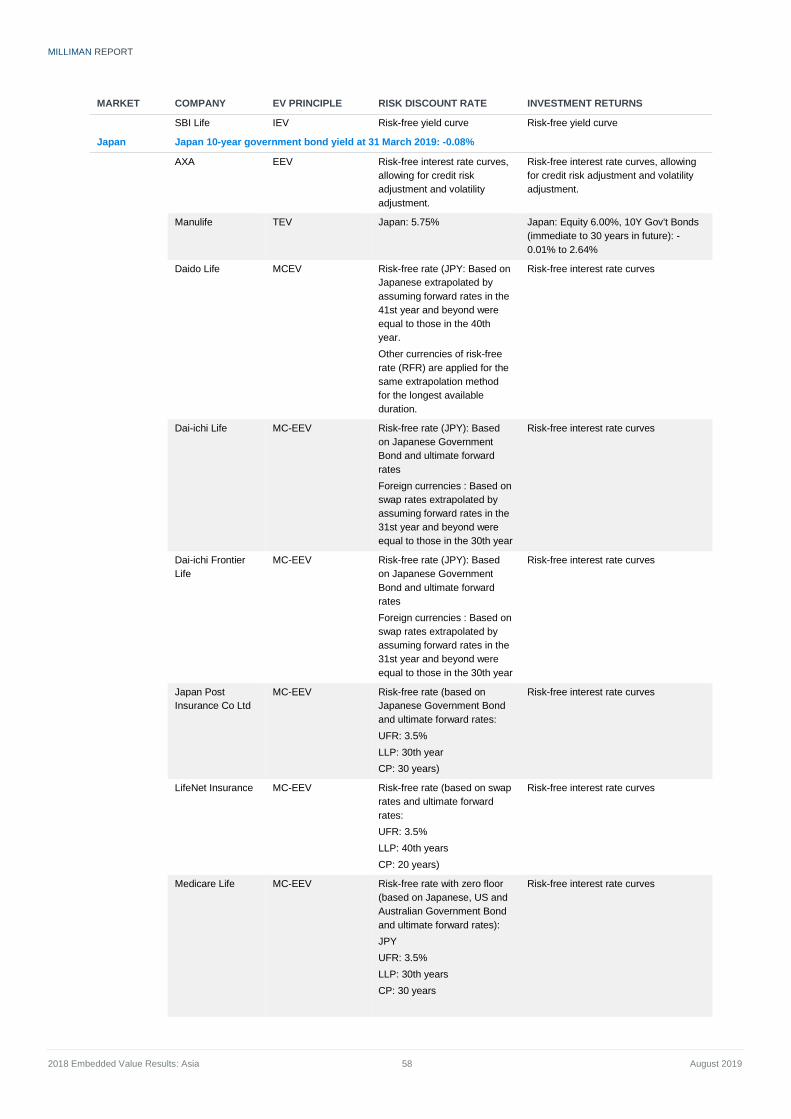
MILLIMAN REPORT
2018 Embedded Value Results: Asia 58 August 2019
MARKET COMPANY EV PRINCIPLE RISK DISCOUNT RATE INVESTMENT RETURNS
SBI Life IEV Risk-free yield curve Risk-free yield curve
Japan Japan 10-year government bond yield at 31 March 2019: -0.08%
AXA EEV Risk-free interest rate curves,
allowing for credit risk
adjustment and volatility
adjustment.
Risk-free interest rate curves, allowing
for credit risk adjustment and volatility
adjustment.
Manulife TEV Japan: 5.75% Japan: Equity 6.00%, 10Y Gov't Bonds
(immediate to 30 years in future): -
0.01% to 2.64%
Daido Life MCEV Risk-free rate (JPY: Based on
Japanese extrapolated by
assuming forward rates in the
41st year and beyond were
equal to those in the 40th
year.
Other currencies of risk-free
rate (RFR) are applied for the
same extrapolation method
for the longest available
duration.
Risk-free interest rate curves
Dai-ichi Life MC-EEV Risk-free rate (JPY): Based
on Japanese Government
Bond and ultimate forward
rates
Foreign currencies : Based on
swap rates extrapolated by
assuming forward rates in the
31st year and beyond were
equal to those in the 30th year
Risk-free interest rate curves
Dai-ichi Frontier
Life
MC-EEV Risk-free rate (JPY): Based
on Japanese Government
Bond and ultimate forward
rates
Foreign currencies : Based on
swap rates extrapolated by
assuming forward rates in the
31st year and beyond were
equal to those in the 30th year
Risk-free interest rate curves
Japan Post
Insurance Co Ltd
MC-EEV Risk-free rate (based on
Japanese Government Bond and ultimate forward rates:
UFR: 3.5%
LLP: 30th year
CP: 30 years)
Risk-free interest rate curves
LifeNet Insurance MC-EEV Risk-free rate (based on swap
rates and ultimate forward
rates:
UFR: 3.5%
LLP: 40th years
CP: 20 years)
Risk-free interest rate curves
Medicare Life MC-EEV Risk-free rate with zero floor
(based on Japanese, US and
Australian Government Bond
and ultimate forward rates):
JPY
UFR: 3.5%
LLP: 30th years
CP: 30 years
Risk-free interest rate curves
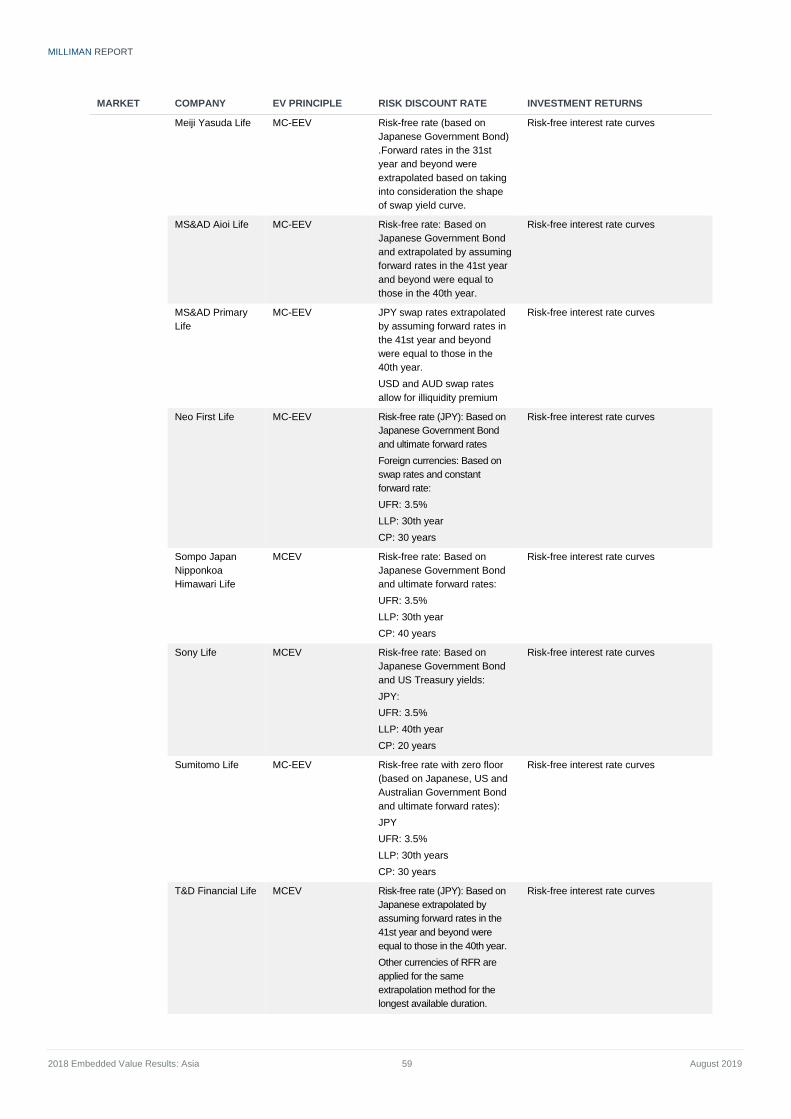
MILLIMAN REPORT
2018 Embedded Value Results: Asia 59 August 2019
MARKET COMPANY EV PRINCIPLE RISK DISCOUNT RATE INVESTMENT RETURNS
Meiji Yasuda Life MC-EEV Risk-free rate (based on
Japanese Government Bond)
.Forward rates in the 31st
year and beyond were
extrapolated based on taking
into consideration the shape
of swap yield curve.
Risk-free interest rate curves
MS&AD Aioi Life MC-EEV Risk-free rate: Based on
Japanese Government Bond
and extrapolated by assuming
forward rates in the 41st year
and beyond were equal to
those in the 40th year.
Risk-free interest rate curves
MS&AD Primary
Life
MC-EEV JPY swap rates extrapolated
by assuming forward rates in
the 41st year and beyond
were equal to those in the
40th year.
USD and AUD swap rates
allow for illiquidity premium
Risk-free interest rate curves
Neo First Life MC-EEV Risk-free rate (JPY): Based on
Japanese Government Bond
and ultimate forward rates
Foreign currencies: Based on
swap rates and constant
forward rate:
UFR: 3.5%
LLP: 30th year
CP: 30 years
Risk-free interest rate curves
Sompo Japan
Nipponkoa
Himawari Life
MCEV Risk-free rate: Based on
Japanese Government Bond
and ultimate forward rates:
UFR: 3.5%
LLP: 30th year
CP: 40 years
Risk-free interest rate curves
Sony Life MCEV Risk-free rate: Based on
Japanese Government Bond
and US Treasury yields:
JPY:
UFR: 3.5%
LLP: 40th year
CP: 20 years
Risk-free interest rate curves
Sumitomo Life MC-EEV Risk-free rate with zero floor
(based on Japanese, US and
Australian Government Bond
and ultimate forward rates):
JPY
UFR: 3.5%
LLP: 30th years
CP: 30 years
Risk-free interest rate curves
T&D Financial Life MCEV Risk-free rate (JPY): Based on
Japanese extrapolated by
assuming forward rates in the
41st year and beyond were
equal to those in the 40th year.
Other currencies of RFR are
applied for the same
extrapolation method for the
longest available duration.
Risk-free interest rate curves
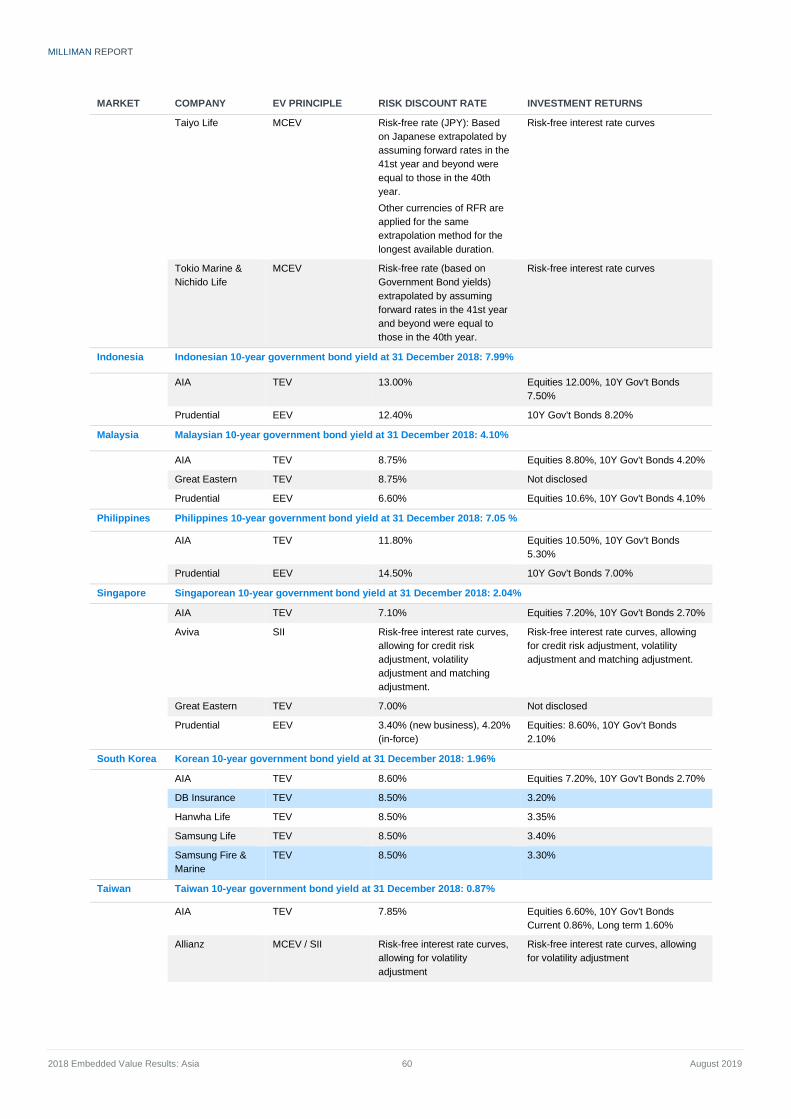
MILLIMAN REPORT
2018 Embedded Value Results: Asia 60 August 2019
MARKET COMPANY EV PRINCIPLE RISK DISCOUNT RATE INVESTMENT RETURNS
Taiyo Life MCEV Risk-free rate (JPY): Based
on Japanese extrapolated by
assuming forward rates in the
41st year and beyond were
equal to those in the 40th
year.
Other currencies of RFR are
applied for the same
extrapolation method for the
longest available duration.
Risk-free interest rate curves
Tokio Marine &
Nichido Life
MCEV Risk-free rate (based on
Government Bond yields)
extrapolated by assuming
forward rates in the 41st year
and beyond were equal to
those in the 40th year.
Risk-free interest rate curves
Indonesia Indonesian 10-year government bond yield at 31 December 2018: 7.99%
AIA TEV 13.00% Equities 12.00%, 10Y Gov't Bonds
7.50%
Prudential EEV 12.40% 10Y Gov't Bonds 8.20%
Malaysia Malaysian 10-year government bond yield at 31 December 2018: 4.10%
AIA TEV 8.75% Equities 8.80%, 10Y Gov't Bonds 4.20%
Great Eastern TEV 8.75% Not disclosed
Prudential EEV 6.60% Equities 10.6%, 10Y Gov't Bonds 4.10%
Philippines Philippines 10-year government bond yield at 31 December 2018: 7.05 %
AIA TEV 11.80% Equities 10.50%, 10Y Gov't Bonds
5.30%
Prudential EEV 14.50% 10Y Gov't Bonds 7.00%
Singapore Singaporean 10-year government bond yield at 31 December 2018: 2.04%
AIA TEV 7.10% Equities 7.20%, 10Y Gov't Bonds 2.70%
Aviva SII Risk-free interest rate curves,
allowing for credit risk
adjustment, volatility
adjustment and matching
adjustment.
Risk-free interest rate curves, allowing
for credit risk adjustment, volatility
adjustment and matching adjustment.
Great Eastern TEV 7.00% Not disclosed
Prudential EEV 3.40% (new business), 4.20%
(in-force)
Equities: 8.60%, 10Y Gov't Bonds
2.10%
South Korea Korean 10-year government bond yield at 31 December 2018: 1.96%
AIA TEV 8.60% Equities 7.20%, 10Y Gov't Bonds 2.70%
DB Insurance TEV 8.50% 3.20%
Hanwha Life TEV 8.50% 3.35%
Samsung Life TEV 8.50% 3.40%
Samsung Fire &
Marine
TEV 8.50% 3.30%
Taiwan Taiwan 10-year government bond yield at 31 December 2018: 0.87%
AIA TEV 7.85% Equities 6.60%, 10Y Gov't Bonds
Current 0.86%, Long term 1.60%
Allianz MCEV / SII Risk-free interest rate curves,
allowing for volatility
adjustment
Risk-free interest rate curves, allowing
for volatility adjustment
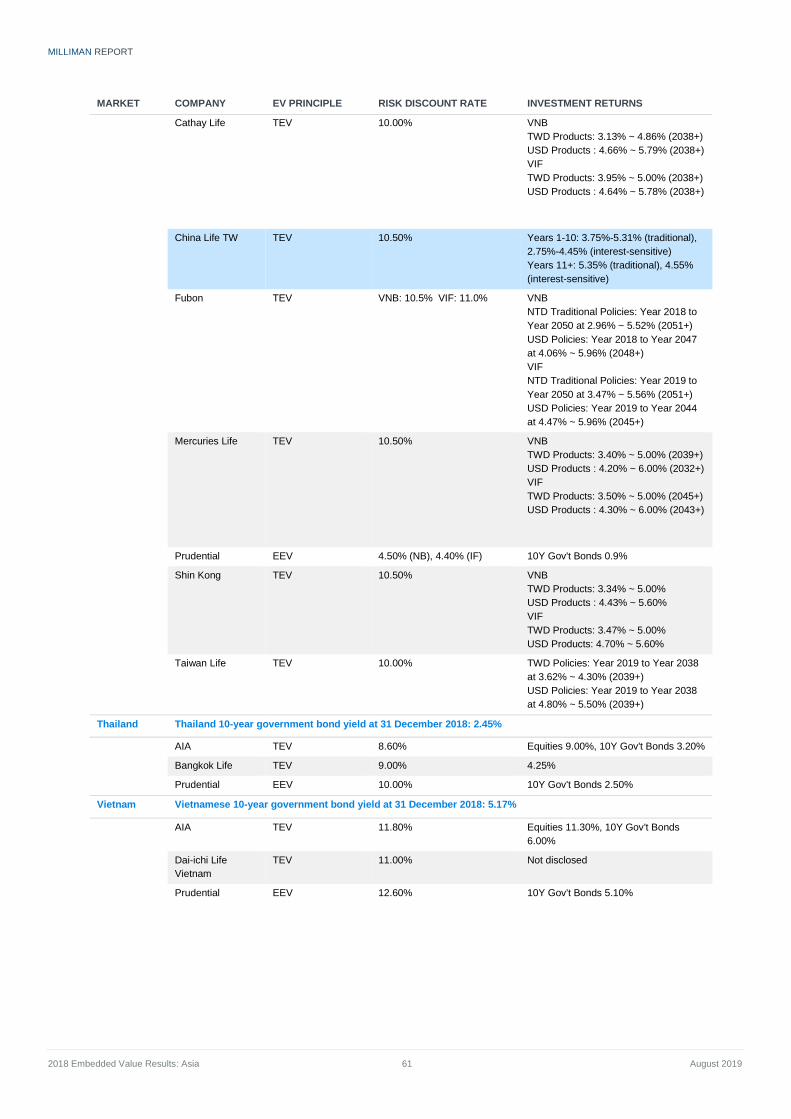
MILLIMAN REPORT
2018 Embedded Value Results: Asia 61 August 2019
MARKET COMPANY EV PRINCIPLE RISK DISCOUNT RATE INVESTMENT RETURNS
Cathay Life TEV 10.00% VNB
TWD Products: 3.13% ~ 4.86% (2038+)
USD Products : 4.66% ~ 5.79% (2038+)
VIF
TWD Products: 3.95% ~ 5.00% (2038+)
USD Products : 4.64% ~ 5.78% (2038+)
China Life TW TEV 10.50% Years 1-10: 3.75%-5.31% (traditional),
2.75%-4.45% (interest-sensitive)
Years 11+: 5.35% (traditional), 4.55%
(interest-sensitive)
Fubon TEV VNB: 10.5% VIF: 11.0% VNB
NTD Traditional Policies: Year 2018 to
Year 2050 at 2.96% ~ 5.52% (2051+)
USD Policies: Year 2018 to Year 2047
at 4.06% ~ 5.96% (2048+)
VIF
NTD Traditional Policies: Year 2019 to
Year 2050 at 3.47% ~ 5.56% (2051+)
USD Policies: Year 2019 to Year 2044
at 4.47% ~ 5.96% (2045+)
Mercuries Life TEV 10.50% VNB
TWD Products: 3.40% ~ 5.00% (2039+)
USD Products : 4.20% ~ 6.00% (2032+)
VIF
TWD Products: 3.50% ~ 5.00% (2045+)
USD Products : 4.30% ~ 6.00% (2043+)
Prudential EEV 4.50% (NB), 4.40% (IF) 10Y Gov't Bonds 0.9%
Shin Kong TEV 10.50% VNB
TWD Products: 3.34% ~ 5.00%
USD Products : 4.43% ~ 5.60%
VIF
TWD Products: 3.47% ~ 5.00%
USD Products: 4.70% ~ 5.60%
Taiwan Life TEV 10.00% TWD Policies: Year 2019 to Year 2038
at 3.62% ~ 4.30% (2039+)
USD Policies: Year 2019 to Year 2038
at 4.80% ~ 5.50% (2039+)
Thailand Thailand 10-year government bond yield at 31 December 2018: 2.45%
AIA TEV 8.60% Equities 9.00%, 10Y Gov't Bonds 3.20%
Bangkok Life TEV 9.00% 4.25%
Prudential EEV 10.00% 10Y Gov't Bonds 2.50%
Vietnam Vietnamese 10-year government bond yield at 31 December 2018: 5.17%
AIA TEV 11.80% Equities 11.30%, 10Y Gov't Bonds
6.00%
Dai-ichi Life
Vietnam
TEV 11.00% Not disclosed
Prudential EEV 12.60% 10Y Gov't Bonds 5.10%
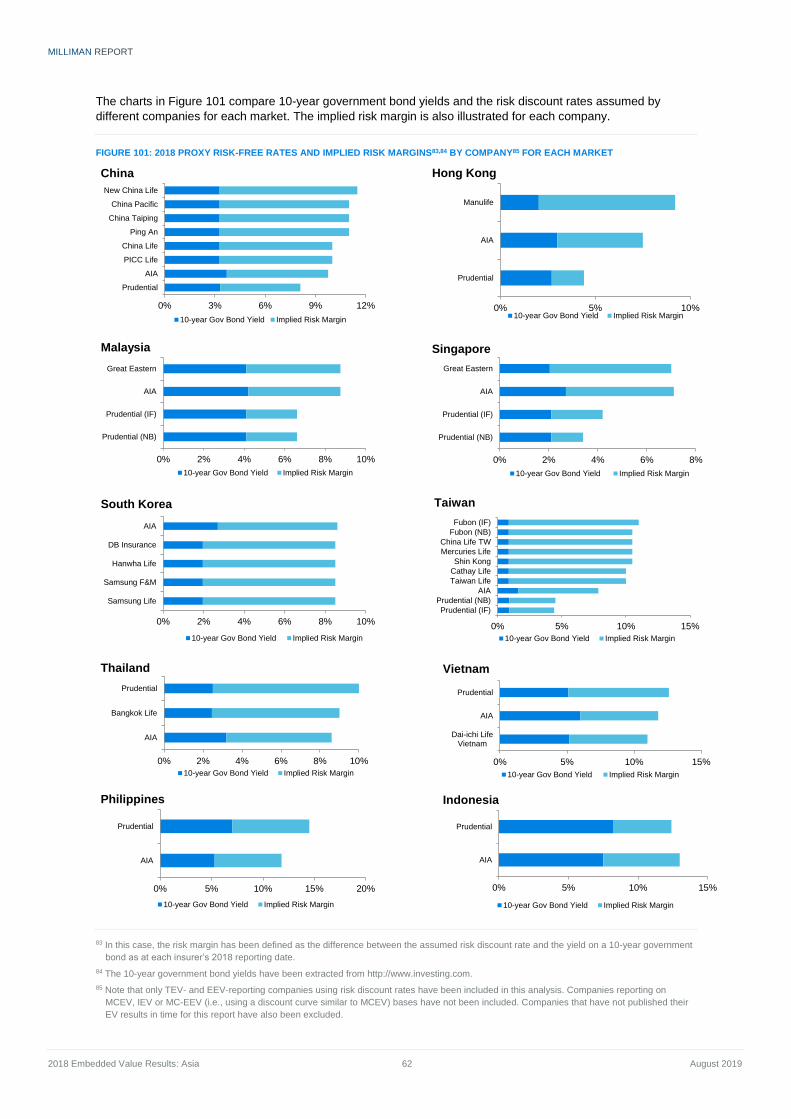
MILLIMAN REPORT
2018 Embedded Value Results: Asia 62 August 2019
The charts in Figure 101 compare 10-year government bond yields and the risk discount rates assumed by
different companies for each market. The implied risk margin is also illustrated for each company.
FIGURE 101: 2018 PROXY RISK-FREE RATES AND IMPLIED RISK MARGINS83,84 BY COMPANY85 FOR EACH MARKET
83 In this case, the risk margin has been defined as the difference between the assumed risk discount rate and the yield on a 10-year government
bond as at each insurer’s 2018 reporting date.
84 The 10-year government bond yields have been extracted from http://www.investing.com.
85 Note that only TEV- and EEV-reporting companies using risk discount rates have been included in this analysis. Companies reporting on
MCEV, IEV or MC-EEV (i.e., using a discount curve similar to MCEV) bases have not been included. Companies that have not published their
EV results in time for this report have also been excluded.
0% 3% 6% 9% 12%
Prudential
AIA
PICC Life
China Life
Ping An
China Taiping
China Pacific
New China Life
China
10-year Gov Bond Yield Implied Risk Margin
0% 2% 4% 6% 8% 10%
Prudential (NB)
Prudential (IF)
AIA
Great Eastern
Malaysia
10-year Gov Bond Yield Implied Risk Margin
0% 2% 4% 6% 8% 10%
Samsung Life
Samsung F&M
Hanwha Life
DB Insurance
AIA
South Korea
10-year Gov Bond Yield Implied Risk Margin
0% 2% 4% 6% 8% 10%
AIA
Bangkok Life
Prudential
Thailand
10-year Gov Bond Yield Implied Risk Margin
0% 5% 10% 15% 20%
AIA
Prudential
Philippines
10-year Gov Bond Yield Implied Risk Margin
0% 5% 10%
Prudential
AIA
Manulife
Hong Kong
10-year Gov Bond Yield Implied Risk Margin
0% 2% 4% 6% 8%
Prudential (NB)
Prudential (IF)
AIA
Great Eastern
Singapore
10-year Gov Bond Yield Implied Risk Margin
0% 5% 10% 15%
Prudential (IF)
Prudential (NB)
AIA
Taiwan Life
Cathay Life
Shin Kong
Mercuries Life
China Life TW
Fubon (NB)
Fubon (IF)
Taiwan
10-year Gov Bond Yield Implied Risk Margin
0% 5% 10% 15%
Dai-ichi LifeVietnam
AIA
Prudential
Vietnam
10-year Gov Bond Yield Implied Risk Margin
0% 5% 10% 15%
AIA
Prudential
Indonesia
10-year Gov Bond Yield Implied Risk Margin
MILLIMAN REPORT
2018 Embedded Value Results: Asia 63 August 2019
INVESTMENT RETURN ASSUMPTIONS
Unlike insurers reporting under MCEV, companies reporting TEV and EEV results need to make assumptions
about future investment returns earned on reserves and required capital. In the MCEV framework, assets are
assumed to earn returns that are, on average, equal to the risk-free reference rate (typically swaps plus
adjustments). The major investment assumptions for MCEV are embedded in the stochastic asset model and the
calibration of those models, including correlation assumptions.
Insurers reporting under TEV and EEV tend to specify investment returns at the asset class level. However, some
insurers choose to disclose (and potentially use) investment assumptions at a fund or company86 level instead.
In general, the investment return assumptions used by insurers tend to be in a tight band in most markets. This is
illustrated in Figures 99 and Figure 100 above. There can often be greater variation in equity return assumptions
than government bond yield assumptions.
Chinese and Taiwanese insurers, in particular, have assumed increasing investment returns for future years. There
is limited disclosure as to how these increasing yield scenarios are reflected in the VIF calculations, in particular
whether corresponding capital losses are incorporated as interest rates are projected to rise. This is in contrast to
AIA, where disclosures indicate that, when fixed interest yields are assumed to rise from the current level to the
long-term assumptions, appropriate allowances are made for the resulting bond portfolio capital losses.
The key for any investor is to compare the investment return assumptions against available government bond
yields to assess whether the implied risk premiums are reasonable. Comparing increasing yield assumptions
against prevailing forward rates is also normally a useful exercise, as is understanding the asset modelling
supporting any upward trending interest rate approach.
EXPENSE OVERRUNS
Expense overruns are reported by some insurers, particularly for new operations or those in an expansion phase.
The EV expense assumptions are usually based on 'fully allocated' historical experience, but this can cause insurers
with fledgling operations that have yet to scale to show seemingly unprofitable business. As a result, some EV
results are presented as 'pre-overrun,’ where the EV figures will be calculated based on long-term target expense
levels, and as 'post-overrun,’ which reflects current actual expense experience. The difference between actual
current expense level and the targeted long-term level is commonly referred to as an expense overrun. Overruns
can come from acquisition expenses (including distribution-related costs), maintenance expenses, or one-off costs.
COST OF CAPITAL
Cost of capital (CoC) is typically calculated as a deduction from the PVFP to reflect the fact that assets backing
the required capital are held within an insurance company and, therefore, cannot be distributed to shareholders
immediately. Additional frictional costs may arise from investing in assets via an insurance company, such as
additional taxation, investment expenses or the fact that investors do not have direct control over their capital
(known as agency costs). Cost of capital may also arise in respect of asymmetric non-hedgeable risks that may
not have been reflected in the PVFP, and reflects the potential additional cost and risk on shareholders. The split
into FCoC and CRNHR is a requirement of the MCEV and IEV reporting principles.
Under TEV, CoC reflects the cost to shareholders of having to hold the required capital, which will earn the after-
tax investment rate of return instead of the risk discount rate. CRNHR is generally implicit in the choice of the risk
discount rate assumption; hence it is not disclosed separately. Asian insurers reporting TEV usually include the
impact of the CoC as part of the EV report, although a few companies do not.
Companies reporting under MCEV principles typically allow for FCoC within the investment income on assets
backing the required capital by:
Projecting investment returns using the reference rate net of tax and investment management expenses
Discounting using the reference rate gross of tax and investment management expenses
Companies may also adopt such an approach under the EEV principles, especially if they use a market-
consistent basis. Alternatively, the CoC may be calculated based on the difference between the real-world
investment return assumptions and the risk discount rate, similar to the approach for TEV.
86 For example, Hanwha Life (South Korea) cites an investment assumption of 3.35% for its entire business instead of specifying the exact asset
class assumptions.
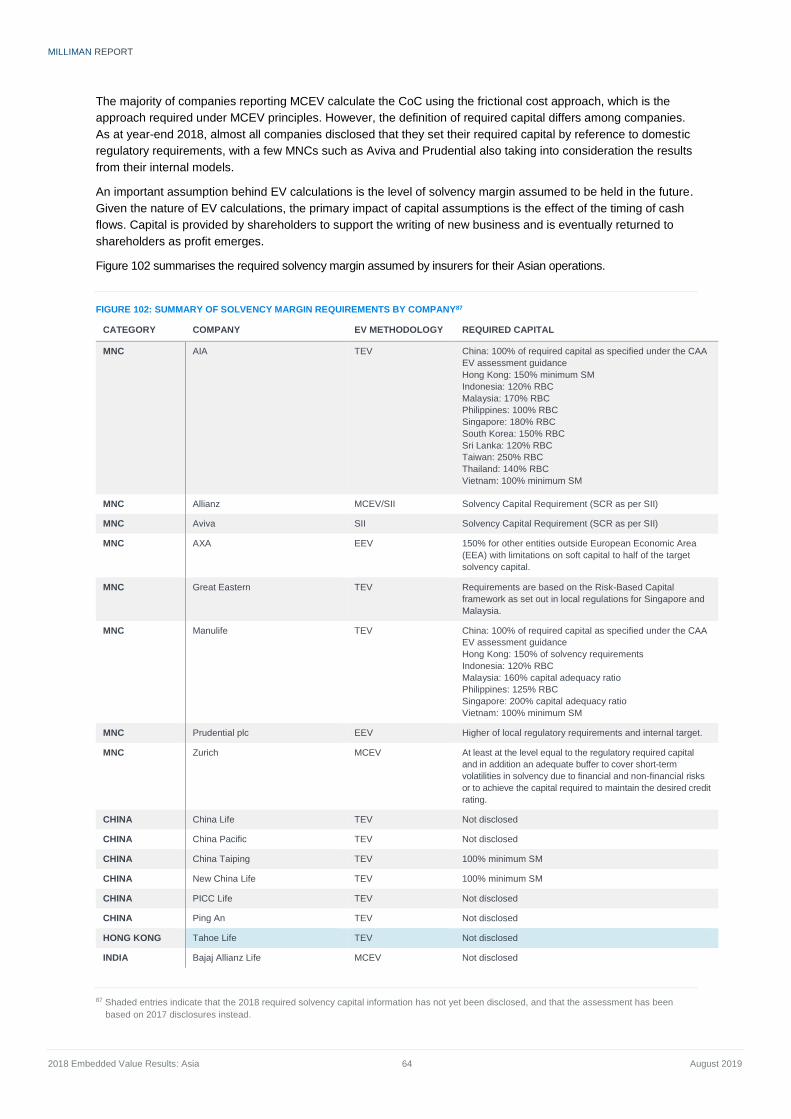
MILLIMAN REPORT
2018 Embedded Value Results: Asia 64 August 2019
The majority of companies reporting MCEV calculate the CoC using the frictional cost approach, which is the
approach required under MCEV principles. However, the definition of required capital differs among companies.
As at year-end 2018, almost all companies disclosed that they set their required capital by reference to domestic
regulatory requirements, with a few MNCs such as Aviva and Prudential also taking into consideration the results
from their internal models.
An important assumption behind EV calculations is the level of solvency margin assumed to be held in the future.
Given the nature of EV calculations, the primary impact of capital assumptions is the effect of the timing of cash
flows. Capital is provided by shareholders to support the writing of new business and is eventually returned to
shareholders as profit emerges.
Figure 102 summarises the required solvency margin assumed by insurers for their Asian operations.
FIGURE 102: SUMMARY OF SOLVENCY MARGIN REQUIREMENTS BY COMPANY87
CATEGORY COMPANY EV METHODOLOGY REQUIRED CAPITAL
MNC AIA TEV China: 100% of required capital as specified under the CAA
EV assessment guidance
Hong Kong: 150% minimum SM
Indonesia: 120% RBC
Malaysia: 170% RBC
Philippines: 100% RBC
Singapore: 180% RBC
South Korea: 150% RBC
Sri Lanka: 120% RBC
Taiwan: 250% RBC
Thailand: 140% RBC
Vietnam: 100% minimum SM
MNC Allianz MCEV/SII Solvency Capital Requirement (SCR as per SII)
MNC Aviva SII Solvency Capital Requirement (SCR as per SII)
MNC AXA EEV 150% for other entities outside European Economic Area
(EEA) with limitations on soft capital to half of the target
solvency capital.
MNC Great Eastern TEV Requirements are based on the Risk-Based Capital
framework as set out in local regulations for Singapore and
Malaysia.
MNC Manulife TEV China: 100% of required capital as specified under the CAA
EV assessment guidance
Hong Kong: 150% of solvency requirements
Indonesia: 120% RBC
Malaysia: 160% capital adequacy ratio
Philippines: 125% RBC
Singapore: 200% capital adequacy ratio
Vietnam: 100% minimum SM
MNC Prudential plc EEV Higher of local regulatory requirements and internal target.
MNC Zurich MCEV At least at the level equal to the regulatory required capital
and in addition an adequate buffer to cover short-term
volatilities in solvency due to financial and non-financial risks
or to achieve the capital required to maintain the desired credit
rating.
CHINA China Life TEV Not disclosed
CHINA China Pacific TEV Not disclosed
CHINA China Taiping TEV 100% minimum SM
CHINA New China Life TEV 100% minimum SM
CHINA PICC Life TEV Not disclosed
CHINA Ping An TEV Not disclosed
HONG KONG Tahoe Life TEV Not disclosed
INDIA Bajaj Allianz Life MCEV Not disclosed
87 Shaded entries indicate that the 2018 required solvency capital information has not yet been disclosed, and that the assessment has been
based on 2017 disclosures instead.
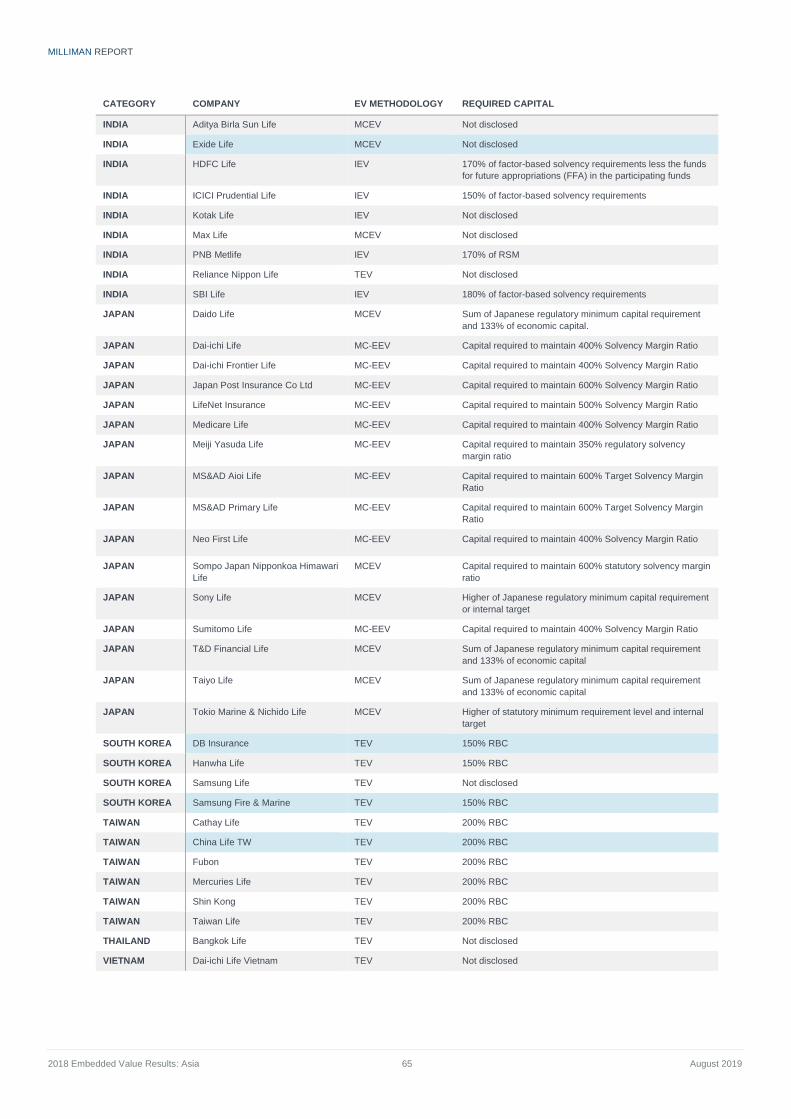
MILLIMAN REPORT
2018 Embedded Value Results: Asia 65 August 2019
CATEGORY COMPANY EV METHODOLOGY REQUIRED CAPITAL
INDIA Aditya Birla Sun Life MCEV Not disclosed
INDIA Exide Life MCEV Not disclosed
INDIA HDFC Life IEV 170% of factor-based solvency requirements less the funds
for future appropriations (FFA) in the participating funds
INDIA ICICI Prudential Life IEV 150% of factor-based solvency requirements
INDIA Kotak Life IEV Not disclosed
INDIA Max Life MCEV Not disclosed
INDIA PNB Metlife IEV 170% of RSM
INDIA Reliance Nippon Life TEV Not disclosed
INDIA SBI Life IEV 180% of factor-based solvency requirements
JAPAN Daido Life MCEV Sum of Japanese regulatory minimum capital requirement
and 133% of economic capital.
JAPAN Dai-ichi Life MC-EEV Capital required to maintain 400% Solvency Margin Ratio
JAPAN Dai-ichi Frontier Life MC-EEV Capital required to maintain 400% Solvency Margin Ratio
JAPAN Japan Post Insurance Co Ltd MC-EEV Capital required to maintain 600% Solvency Margin Ratio
JAPAN LifeNet Insurance MC-EEV Capital required to maintain 500% Solvency Margin Ratio
JAPAN Medicare Life MC-EEV Capital required to maintain 400% Solvency Margin Ratio
JAPAN Meiji Yasuda Life MC-EEV Capital required to maintain 350% regulatory solvency
margin ratio
JAPAN MS&AD Aioi Life MC-EEV Capital required to maintain 600% Target Solvency Margin
Ratio
JAPAN MS&AD Primary Life MC-EEV Capital required to maintain 600% Target Solvency Margin
Ratio
JAPAN Neo First Life MC-EEV Capital required to maintain 400% Solvency Margin Ratio
JAPAN Sompo Japan Nipponkoa Himawari
Life
MCEV Capital required to maintain 600% statutory solvency margin
ratio
JAPAN Sony Life MCEV Higher of Japanese regulatory minimum capital requirement
or internal target
JAPAN Sumitomo Life MC-EEV Capital required to maintain 400% Solvency Margin Ratio
JAPAN T&D Financial Life MCEV Sum of Japanese regulatory minimum capital requirement
and 133% of economic capital
JAPAN Taiyo Life MCEV Sum of Japanese regulatory minimum capital requirement
and 133% of economic capital
JAPAN Tokio Marine & Nichido Life MCEV Higher of statutory minimum requirement level and internal
target
SOUTH KOREA DB Insurance TEV 150% RBC
SOUTH KOREA Hanwha Life TEV 150% RBC
SOUTH KOREA Samsung Life TEV Not disclosed
SOUTH KOREA Samsung Fire & Marine TEV 150% RBC
TAIWAN Cathay Life TEV 200% RBC
TAIWAN China Life TW TEV 200% RBC
TAIWAN Fubon TEV 200% RBC
TAIWAN Mercuries Life TEV 200% RBC
TAIWAN Shin Kong TEV 200% RBC
TAIWAN Taiwan Life TEV 200% RBC
THAILAND Bangkok Life TEV Not disclosed
VIETNAM Dai-ichi Life Vietnam TEV Not disclosed
MILLIMAN REPORT
2018 Embedded Value Results: Asia 66 August 2019
EV-reporting insurers generally use similar assumptions, opting to use the level of solvency margin at which they
believe regulatory intervention will occur. The exceptions to this are as follows:
In Singapore, where AIA uses 180% while Manulife uses 200% (Great Eastern did not disclose the minimum
regulatory level for 2018)
In Malaysia, where AIA uses 170% and Manulife uses 160% (Great Eastern did not disclose the minimum
regulatory level for 2018)
In Taiwan, where AIA uses 250% compared with the 200% used by all domestic insurers
A few companies notably do not disclose their required solvency margin assumptions.
TIME VALUE OF OPTIONS AND GUARANTEES
The impact of financial options and guarantees can be split into two components. The first is the effect on the
PVFP with respect to the intrinsic value88 of such financial options and guarantees. The second is the time value
of options and guarantees (TVOG), representing the difference between the total value of the options or
guarantees and the intrinsic value. It is effectively the value of the 'optionality' bestowed on the policyholder for
the duration of the insurance contract.
The reporting of TVOG is mandatory for insurers reporting on EEV, MCEV and IEV bases. The TVOG primarily
corresponds to the asymmetry of the impact over a range of scenarios on the distributable earnings to shareholders.
For example, for the case of participating contracts, profits are shared between shareholders and policyholders.
Losses, however, are only shared up to a certain point, after which shareholders bear all the subsequent losses.
This can be further exacerbated by the actions of policyholders (dynamic policyholder behaviour).
The features of products that generally give rise to an assessment of TVOG can include interest rate guarantees on
traditional products, profit-sharing features such as bonuses or levels of credited rates and guaranteed benefits on
linked and guaranteed annuity options. Other features such as ‘return of premiums’ are also a form of a guarantee.
As noted, EEV-, MCEV- and IEV-reporting insurers are required to assess the TVOG using stochastic techniques.
Closed-form solutions can also be used where they lead to sufficiently accurate results but may not be suitable in
valuing certain guarantees. The stochastic models must be appropriately calibrated and internally consistent with
the rest of the modelling methodologies and approaches. Management actions can be allowed for, including those
relating to crediting rates, bonus rates, charges to asset shares and investment strategies. These management
actions can be reflected, if such actions are consistent with the insurer's normal governance and approval
processes, are consistent with the operating environment and take into account the market reaction to discretion.
Dynamic policyholder behaviour is included in many companies' assessments of TVOG. In particular, a number
of companies recognise the impact of dynamic policyholder behaviour under certain economic scenarios.
Figure 103 shows that, of those companies that disclosed the number of scenarios used, the majority applied
1,000 economic scenarios on a market-consistent basis.
88 In the example of a financial call option, the intrinsic value is the positive difference between the current underlying asset price and the strike price.
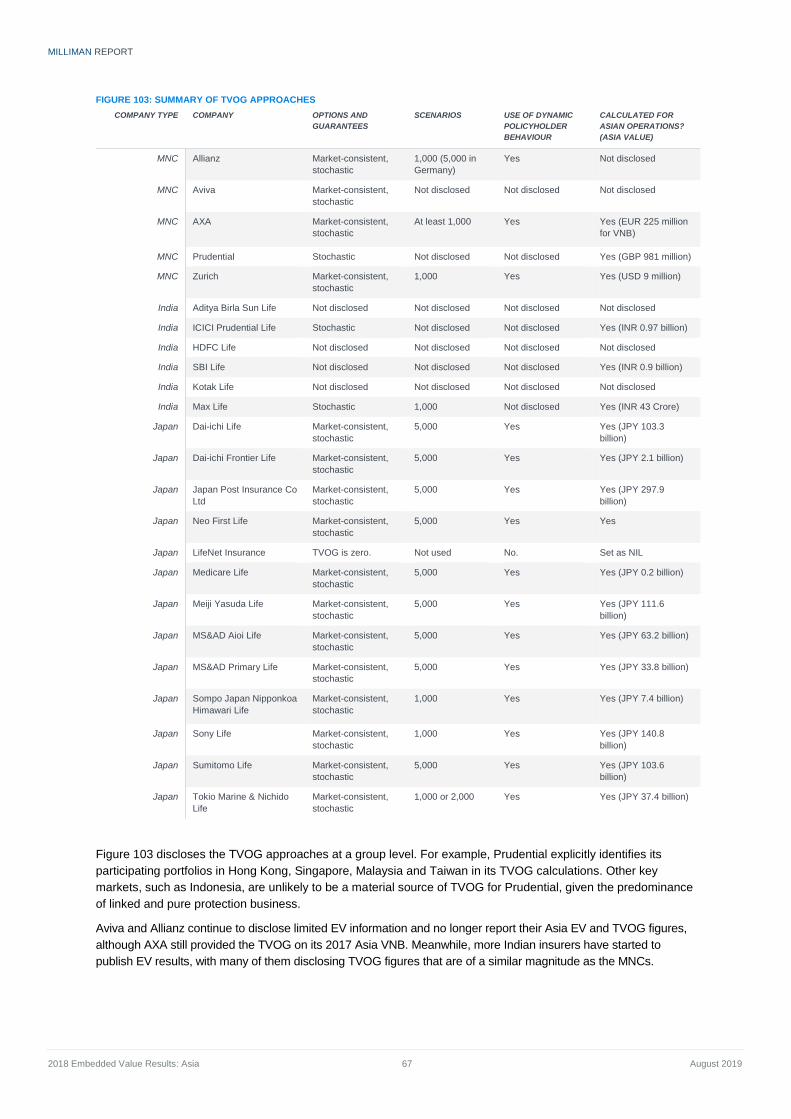
MILLIMAN REPORT
2018 Embedded Value Results: Asia 67 August 2019
FIGURE 103: SUMMARY OF TVOG APPROACHES
COMPANY TYPE COMPANY OPTIONS AND
GUARANTEES
SCENARIOS USE OF DYNAMIC
POLICYHOLDER
BEHAVIOUR
CALCULATED FOR
ASIAN OPERATIONS?
(ASIA VALUE)
MNC Allianz Market-consistent,
stochastic
1,000 (5,000 in
Germany)
Yes Not disclosed
MNC Aviva Market-consistent,
stochastic
Not disclosed Not disclosed Not disclosed
MNC AXA Market-consistent,
stochastic
At least 1,000 Yes Yes (EUR 225 million
for VNB)
MNC Prudential Stochastic Not disclosed Not disclosed Yes (GBP 981 million)
MNC Zurich Market-consistent,
stochastic
1,000 Yes Yes (USD 9 million)
India Aditya Birla Sun Life Not disclosed Not disclosed Not disclosed Not disclosed
India ICICI Prudential Life Stochastic Not disclosed Not disclosed Yes (INR 0.97 billion)
India HDFC Life Not disclosed Not disclosed Not disclosed Not disclosed
India SBI Life Not disclosed Not disclosed Not disclosed Yes (INR 0.9 billion)
India Kotak Life Not disclosed Not disclosed Not disclosed Not disclosed
India Max Life Stochastic 1,000 Not disclosed Yes (INR 43 Crore)
Japan Dai-ichi Life Market-consistent,
stochastic
5,000 Yes Yes (JPY 103.3
billion)
Japan Dai-ichi Frontier Life Market-consistent,
stochastic
5,000 Yes Yes (JPY 2.1 billion)
Japan Japan Post Insurance Co
Ltd
Market-consistent,
stochastic
5,000 Yes Yes (JPY 297.9
billion)
Japan Neo First Life Market-consistent,
stochastic
5,000 Yes Yes
Japan LifeNet Insurance TVOG is zero. Not used No. Set as NIL
Japan Medicare Life Market-consistent,
stochastic
5,000 Yes Yes (JPY 0.2 billion)
Japan Meiji Yasuda Life Market-consistent,
stochastic
5,000 Yes Yes (JPY 111.6
billion)
Japan MS&AD Aioi Life Market-consistent,
stochastic
5,000 Yes Yes (JPY 63.2 billion)
Japan MS&AD Primary Life Market-consistent,
stochastic
5,000 Yes Yes (JPY 33.8 billion)
Japan Sompo Japan Nipponkoa
Himawari Life
Market-consistent,
stochastic
1,000 Yes Yes (JPY 7.4 billion)
Japan Sony Life Market-consistent,
stochastic
1,000 Yes Yes (JPY 140.8
billion)
Japan Sumitomo Life Market-consistent,
stochastic
5,000 Yes Yes (JPY 103.6
billion)
Japan Tokio Marine & Nichido
Life
Market-consistent,
stochastic
1,000 or 2,000 Yes Yes (JPY 37.4 billion)
Figure 103 discloses the TVOG approaches at a group level. For example, Prudential explicitly identifies its
participating portfolios in Hong Kong, Singapore, Malaysia and Taiwan in its TVOG calculations. Other key
markets, such as Indonesia, are unlikely to be a material source of TVOG for Prudential, given the predominance
of linked and pure protection business.
Aviva and Allianz continue to disclose limited EV information and no longer report their Asia EV and TVOG figures,
although AXA still provided the TVOG on its 2017 Asia VNB. Meanwhile, more Indian insurers have started to
publish EV results, with many of them disclosing TVOG figures that are of a similar magnitude as the MNCs.
MILLIMAN REPORT
2018 Embedded Value Results: Asia 68 August 2019
Disclosures Analysts have frequently commented that the drive towards greater consistency, through improved guidance and
developments in EV reporting, has helped to improve their understanding of the inherent values and strengths
within companies. The richness of disclosures has been particularly helpful, as they allow analysts to compare
and contrast performances across insurers.
Similarly, EV reporting continues to provide rating agencies with valuable information in their credit assessments.
For example, Standard & Poor’s (S&P) states that return on embedded value (RoEV) is one of the factors
considered in determining life insurers’ ratings. Additional disclosures, and the component nature with which the
analysis is presented, assist rating agencies in drilling down into the underlying key risk drivers and the areas of a
company that are most important and/or where the ability to generate value is most at risk.
The most developed EV disclosure requirements are set out in the EEV and MCEV principles from the European
Insurance CFO Forum, which cover methodology, assumptions, sensitivities and analyses. APS10 standard
disclosures for IEV in India require similar levels of detail. However, the prevalence of TEV in Asia, with the
associated lack of any disclosure standards or requirements, makes it more difficult to use EV results for
comparison and evaluation purposes.
The quality of EV disclosures tends to be closely correlated with the nature of the insurance operations. MNCs
(whether they are Asian, European or North American) tend to provide more disclosure than insurers focusing on
one or two core markets. For the single-market operations, typical disclosures include only group EV and VNB,
and some companies do not disclose key assumptions, such as risk discount rate and investment return.
The table in Figure 104 summarises the available disclosures of insurers operating in Asia. While the level of
disclosures in Asia lags behind Europe now, the key components are typically provided, i.e., analysis of
movement, sensitivities and key assumptions.
Another key differentiator between Europe and Asia is that it is normal practice for European insurers to include a
detailed EV report in their annual reports, almost to the same level of detail as their statutory IFRS statements. At
this time, only AIA amongst the Asian insurers has a comparable level of disclosure.
We anticipate that more detailed reporting will follow over the next few years as Asian insurers increase in scale,
complexity and sophistication, not only in EV methodology but in investor relations as well.
Note: Figure 104 should not and cannot be taken as endorsement or verification of any kind on the part of
Milliman that the disclosures of specific sections by specific companies meet in part or in full the requirements
laid out by the EEV or MCEV principles.
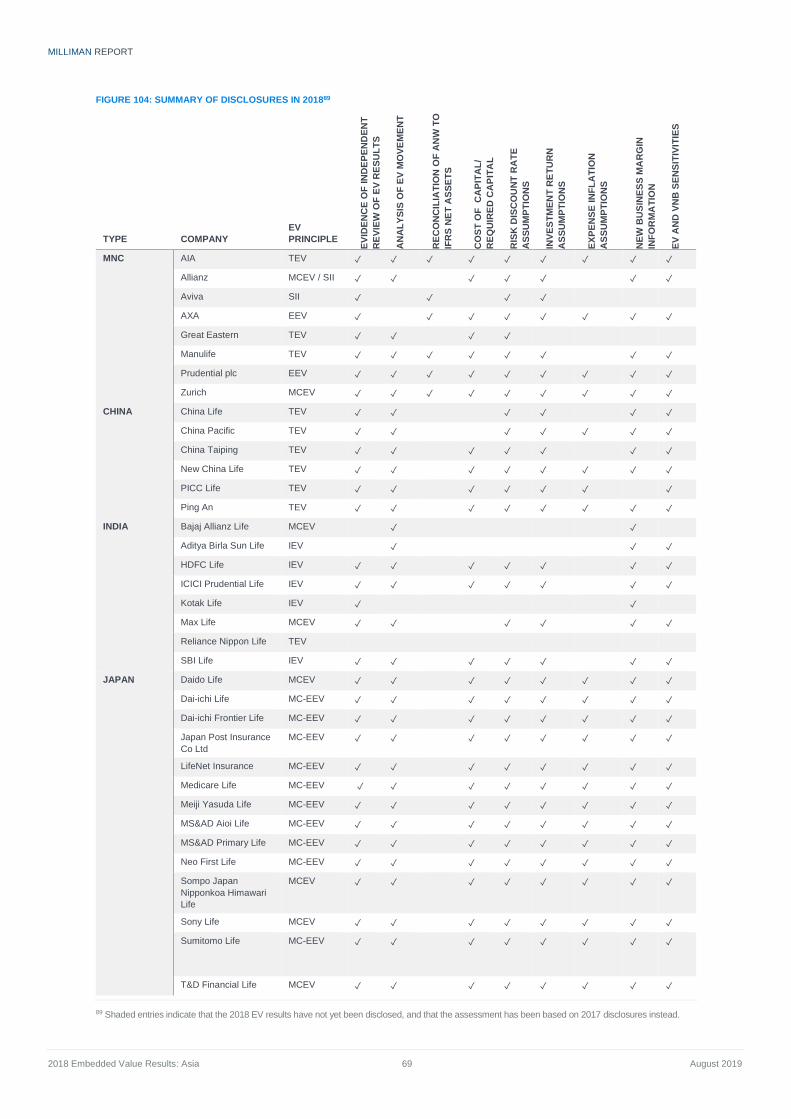
MILLIMAN REPORT
2018 Embedded Value Results: Asia 69 August 2019
FIGURE 104: SUMMARY OF DISCLOSURES IN 201889
TYPE COMPANY
EV
PRINCIPLE
EV
IDE
NC
E O
F IN
DE
PE
ND
EN
T
RE
VIE
W O
F E
V R
ES
UL
TS
AN
AL
YS
IS O
F E
V M
OV
EM
EN
T
RE
CO
NC
ILIA
TIO
N O
F A
NW
TO
IFR
S N
ET
AS
SE
TS
CO
ST
OF
C
AP
ITA
L/
RE
QU
IRE
D C
AP
ITA
L
RIS
K D
ISC
OU
NT
RA
TE
AS
SU
MP
TIO
NS
INV
ES
TM
EN
T R
ET
UR
N
AS
SU
MP
TIO
NS
EX
PE
NS
E IN
FL
AT
ION
AS
SU
MP
TIO
NS
NE
W B
US
INE
SS
MA
RG
IN
INF
OR
MA
TIO
N
EV
AN
D V
NB
SE
NS
ITIV
ITIE
S
MNC AIA TEV ✓ ✓ ✓ ✓ ✓ ✓ ✓ ✓ ✓
Allianz MCEV / SII ✓ ✓ ✓ ✓ ✓ ✓ ✓
Aviva SII ✓ ✓ ✓ ✓
AXA EEV ✓ ✓ ✓ ✓ ✓ ✓ ✓ ✓
Great Eastern TEV ✓ ✓ ✓ ✓
Manulife TEV ✓ ✓ ✓ ✓ ✓ ✓ ✓ ✓
Prudential plc EEV ✓ ✓ ✓ ✓ ✓ ✓ ✓ ✓ ✓
Zurich MCEV ✓ ✓ ✓ ✓ ✓ ✓ ✓ ✓ ✓
CHINA China Life TEV ✓ ✓ ✓ ✓ ✓ ✓
China Pacific TEV ✓ ✓ ✓ ✓ ✓ ✓ ✓
China Taiping TEV ✓ ✓ ✓ ✓ ✓ ✓ ✓
New China Life TEV ✓ ✓ ✓ ✓ ✓ ✓ ✓ ✓
PICC Life TEV ✓ ✓ ✓ ✓ ✓ ✓ ✓
Ping An TEV ✓ ✓ ✓ ✓ ✓ ✓ ✓ ✓
INDIA Bajaj Allianz Life MCEV ✓ ✓
Aditya Birla Sun Life IEV ✓ ✓ ✓
HDFC Life IEV ✓ ✓ ✓ ✓ ✓ ✓ ✓
ICICI Prudential Life IEV ✓ ✓ ✓ ✓ ✓ ✓ ✓
Kotak Life IEV ✓ ✓
Max Life MCEV ✓ ✓ ✓ ✓ ✓ ✓
Reliance Nippon Life TEV
SBI Life IEV ✓ ✓ ✓ ✓ ✓ ✓ ✓
JAPAN Daido Life MCEV ✓ ✓ ✓ ✓ ✓ ✓ ✓ ✓
Dai-ichi Life MC-EEV ✓ ✓ ✓ ✓ ✓ ✓ ✓ ✓
Dai-ichi Frontier Life MC-EEV ✓ ✓ ✓ ✓ ✓ ✓ ✓ ✓
Japan Post Insurance
Co Ltd
MC-EEV ✓ ✓ ✓ ✓ ✓ ✓ ✓ ✓
LifeNet Insurance MC-EEV ✓ ✓ ✓ ✓ ✓ ✓ ✓ ✓
Medicare Life MC-EEV ✓ ✓
✓ ✓ ✓ ✓ ✓ ✓
Meiji Yasuda Life MC-EEV ✓ ✓
✓ ✓ ✓ ✓ ✓ ✓
MS&AD Aioi Life MC-EEV ✓ ✓ ✓ ✓ ✓ ✓ ✓ ✓
MS&AD Primary Life MC-EEV ✓ ✓ ✓ ✓ ✓ ✓ ✓ ✓
Neo First Life MC-EEV ✓ ✓ ✓ ✓ ✓ ✓ ✓ ✓
Sompo Japan
Nipponkoa Himawari
Life
MCEV ✓ ✓ ✓ ✓ ✓ ✓ ✓ ✓
Sony Life MCEV ✓ ✓ ✓ ✓ ✓ ✓ ✓ ✓
Sumitomo Life MC-EEV ✓ ✓
✓ ✓ ✓ ✓ ✓ ✓
T&D Financial Life MCEV ✓ ✓ ✓ ✓ ✓ ✓ ✓ ✓
89 Shaded entries indicate that the 2018 EV results have not yet been disclosed, and that the assessment has been based on 2017 disclosures instead.
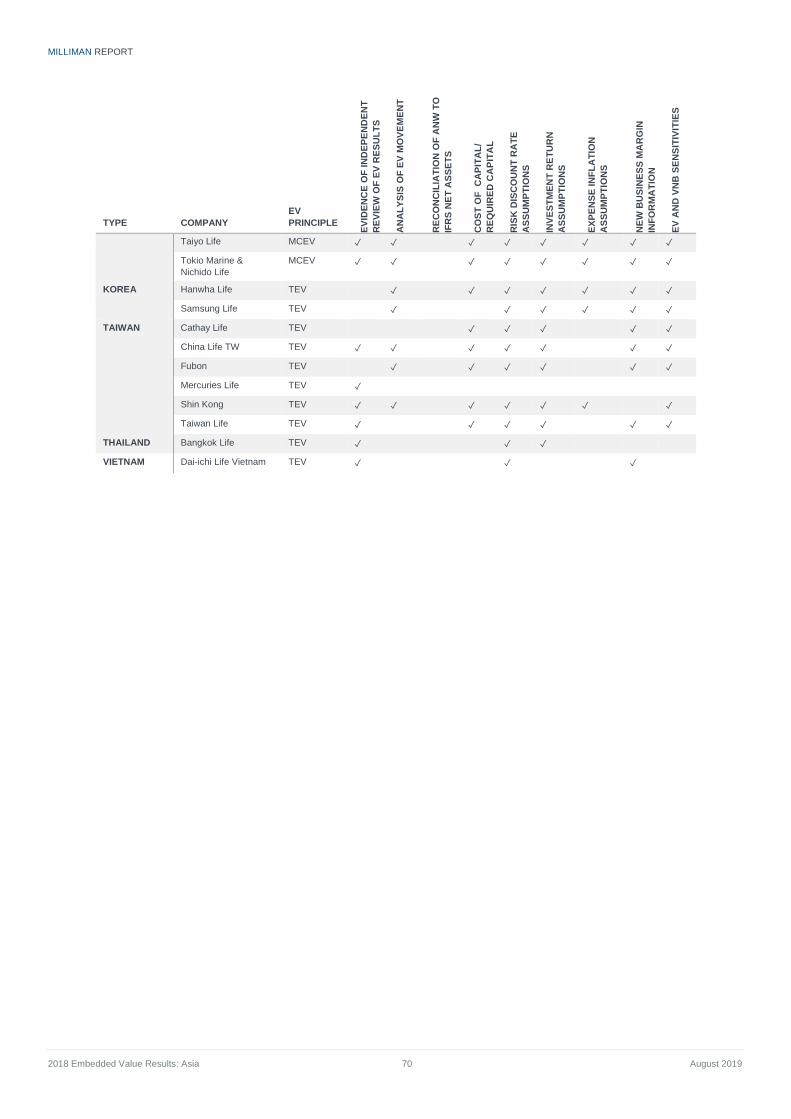
MILLIMAN REPORT
2018 Embedded Value Results: Asia 70 August 2019
TYPE COMPANY
EV
PRINCIPLE
EV
IDE
NC
E O
F IN
DE
PE
ND
EN
T
RE
VIE
W O
F E
V R
ES
UL
TS
AN
AL
YS
IS O
F E
V M
OV
EM
EN
T
RE
CO
NC
ILIA
TIO
N O
F A
NW
TO
IFR
S N
ET
AS
SE
TS
CO
ST
OF
C
AP
ITA
L/
RE
QU
IRE
D C
AP
ITA
L
RIS
K D
ISC
OU
NT
RA
TE
AS
SU
MP
TIO
NS
INV
ES
TM
EN
T R
ET
UR
N
AS
SU
MP
TIO
NS
EX
PE
NS
E IN
FL
AT
ION
AS
SU
MP
TIO
NS
NE
W B
US
INE
SS
MA
RG
IN
INF
OR
MA
TIO
N
EV
AN
D V
NB
SE
NS
ITIV
ITIE
S
Taiyo Life MCEV ✓ ✓ ✓ ✓ ✓ ✓ ✓ ✓
Tokio Marine &
Nichido Life
MCEV ✓ ✓ ✓ ✓ ✓ ✓ ✓ ✓
KOREA Hanwha Life TEV ✓ ✓ ✓ ✓ ✓ ✓ ✓
Samsung Life TEV ✓ ✓ ✓ ✓ ✓ ✓
TAIWAN Cathay Life TEV ✓ ✓ ✓ ✓ ✓
China Life TW TEV ✓ ✓ ✓ ✓ ✓ ✓ ✓
Fubon TEV
✓ ✓ ✓ ✓ ✓ ✓
Mercuries Life TEV ✓
Shin Kong TEV ✓ ✓ ✓ ✓ ✓ ✓ ✓
Taiwan Life TEV ✓ ✓ ✓ ✓ ✓ ✓
THAILAND Bangkok Life TEV ✓ ✓ ✓
VIETNAM Dai-ichi Life Vietnam TEV ✓ ✓ ✓
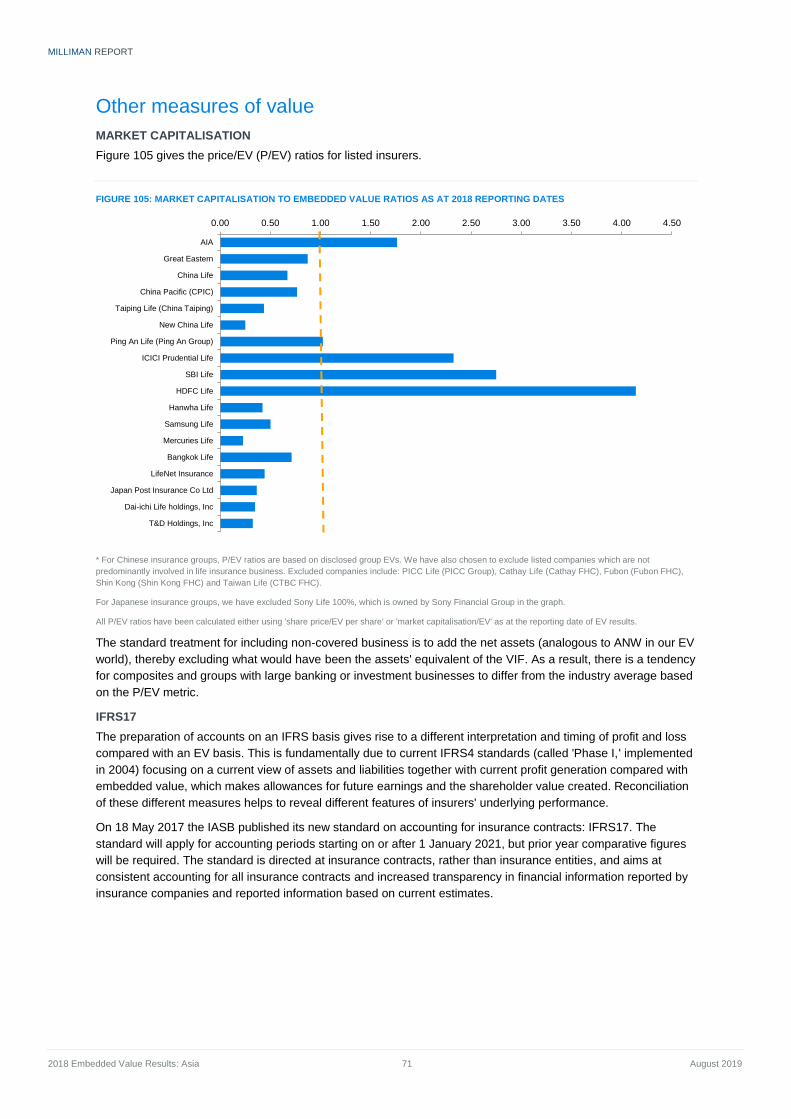
MILLIMAN REPORT
2018 Embedded Value Results: Asia 71 August 2019
Other measures of value
MARKET CAPITALISATION
Figure 105 gives the price/EV (P/EV) ratios for listed insurers.
FIGURE 105: MARKET CAPITALISATION TO EMBEDDED VALUE RATIOS AS AT 2018 REPORTING DATES
* For Chinese insurance groups, P/EV ratios are based on disclosed group EVs. We have also chosen to exclude listed companies which are not
predominantly involved in life insurance business. Excluded companies include: PICC Life (PICC Group), Cathay Life (Cathay FHC), Fubon (Fubon FHC),
Shin Kong (Shin Kong FHC) and Taiwan Life (CTBC FHC).
For Japanese insurance groups, we have excluded Sony Life 100%, which is owned by Sony Financial Group in the graph.
All P/EV ratios have been calculated either using 'share price/EV per share' or 'market capitalisation/EV' as at the reporting date of EV results.
The standard treatment for including non-covered business is to add the net assets (analogous to ANW in our EV
world), thereby excluding what would have been the assets' equivalent of the VIF. As a result, there is a tendency
for composites and groups with large banking or investment businesses to differ from the industry average based
on the P/EV metric.
IFRS17
The preparation of accounts on an IFRS basis gives rise to a different interpretation and timing of profit and loss
compared with an EV basis. This is fundamentally due to current IFRS4 standards (called 'Phase I,' implemented
in 2004) focusing on a current view of assets and liabilities together with current profit generation compared with
embedded value, which makes allowances for future earnings and the shareholder value created. Reconciliation
of these different measures helps to reveal different features of insurers' underlying performance.
On 18 May 2017 the IASB published its new standard on accounting for insurance contracts: IFRS17. The
standard will apply for accounting periods starting on or after 1 January 2021, but prior year comparative figures
will be required. The standard is directed at insurance contracts, rather than insurance entities, and aims at
consistent accounting for all insurance contracts and increased transparency in financial information reported by
insurance companies and reported information based on current estimates.
0.00 0.50 1.00 1.50 2.00 2.50 3.00 3.50 4.00 4.50
AIA
Great Eastern
China Life
China Pacific (CPIC)
Taiping Life (China Taiping)
New China Life
Ping An Life (Ping An Group)
ICICI Prudential Life
SBI Life
HDFC Life
Hanwha Life
Samsung Life
Mercuries Life
Bangkok Life
LifeNet Insurance
Japan Post Insurance Co Ltd
Dai-ichi Life holdings, Inc
T&D Holdings, Inc
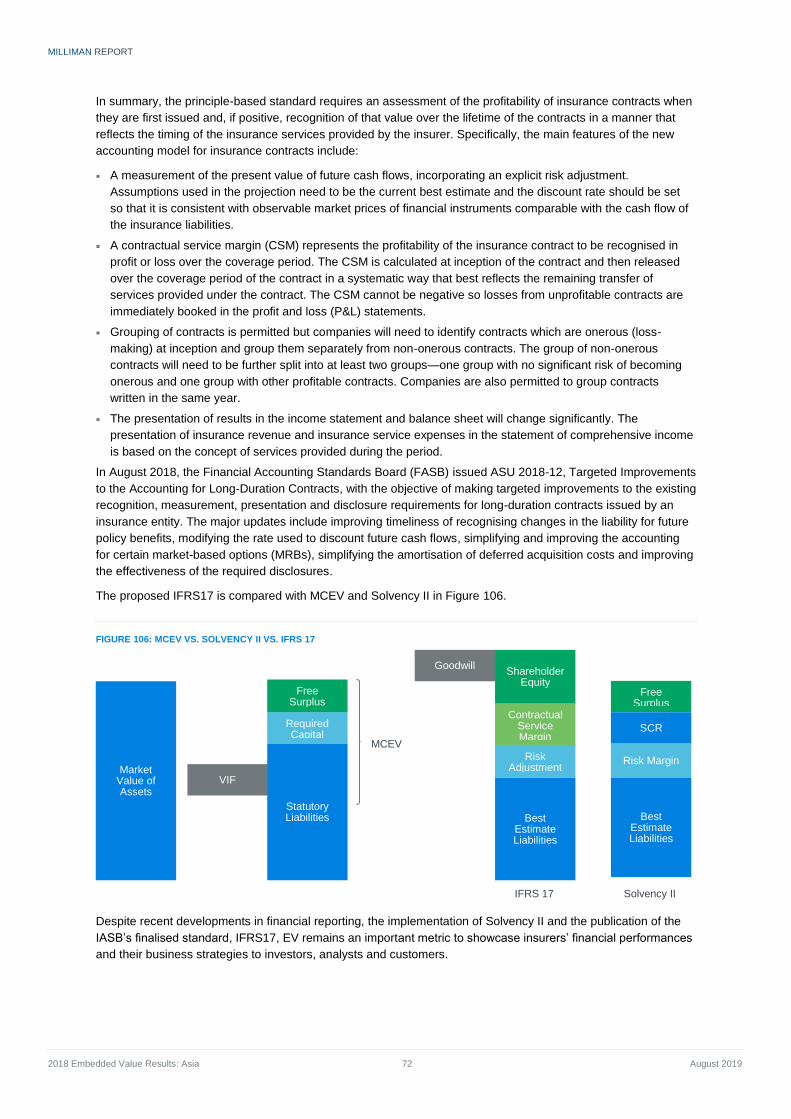
MILLIMAN REPORT
2018 Embedded Value Results: Asia 72 August 2019
In summary, the principle-based standard requires an assessment of the profitability of insurance contracts when
they are first issued and, if positive, recognition of that value over the lifetime of the contracts in a manner that
reflects the timing of the insurance services provided by the insurer. Specifically, the main features of the new
accounting model for insurance contracts include:
A measurement of the present value of future cash flows, incorporating an explicit risk adjustment.
Assumptions used in the projection need to be the current best estimate and the discount rate should be set
so that it is consistent with observable market prices of financial instruments comparable with the cash flow of
the insurance liabilities.
A contractual service margin (CSM) represents the profitability of the insurance contract to be recognised in
profit or loss over the coverage period. The CSM is calculated at inception of the contract and then released
over the coverage period of the contract in a systematic way that best reflects the remaining transfer of
services provided under the contract. The CSM cannot be negative so losses from unprofitable contracts are
immediately booked in the profit and loss (P&L) statements.
Grouping of contracts is permitted but companies will need to identify contracts which are onerous (loss-
making) at inception and group them separately from non-onerous contracts. The group of non-onerous
contracts will need to be further split into at least two groups—one group with no significant risk of becoming
onerous and one group with other profitable contracts. Companies are also permitted to group contracts
written in the same year.
The presentation of results in the income statement and balance sheet will change significantly. The
presentation of insurance revenue and insurance service expenses in the statement of comprehensive income
is based on the concept of services provided during the period.
In August 2018, the Financial Accounting Standards Board (FASB) issued ASU 2018-12, Targeted Improvements
to the Accounting for Long-Duration Contracts, with the objective of making targeted improvements to the existing
recognition, measurement, presentation and disclosure requirements for long-duration contracts issued by an
insurance entity. The major updates include improving timeliness of recognising changes in the liability for future
policy benefits, modifying the rate used to discount future cash flows, simplifying and improving the accounting
for certain market-based options (MRBs), simplifying the amortisation of deferred acquisition costs and improving
the effectiveness of the required disclosures.
The proposed IFRS17 is compared with MCEV and Solvency II in Figure 106.
FIGURE 106: MCEV VS. SOLVENCY II VS. IFRS 17
Despite recent developments in financial reporting, the implementation of Solvency II and the publication of the
IASB’s finalised standard, IFRS17, EV remains an important metric to showcase insurers’ financial performances
and their business strategies to investors, analysts and customers.
Market Value of Assets
VIF
Free Surplus
Required Capital
Statutory Liabilities
Goodwill Shareholder
Equity
Contractual Service Margin
Risk Adjustment
Best Estimate Liabilities
Free Surplus
SCR
Risk Margin
Best Estimate Liabilities
Solvency II IFRS 17
MCEV

MILLIMAN REPORT
2018 Embedded Value Results: Asia 73 August 2019
An improvement in overall embedded value results over 2017, reflecting for many firms strong growth of new
business and largely favourable economic effects, continued to indicate a relatively stable and optimistic market.
However, with a largely unsettled global political landscape, the market environment continues to present
challenges for insurers.
With an implementation date for IFRS17 of 1 January 2021, and with a prior year comparative result also
required, insurers will increasingly be focused on ensuring their readiness under this new standard. As a result, it
remains uncertain whether embedded value will continue evolving in order to remain a useful metric alongside
the new solvency and accounting regimes.
In June 2019, the IASB proposed amendments to IFRS17 to alleviate concerns and challenges raised about
implementing it. The IASB has also proposed to delay the implementation of IFRS17 by one year. Previously, the
target effective date for implementation was set as January 2021.
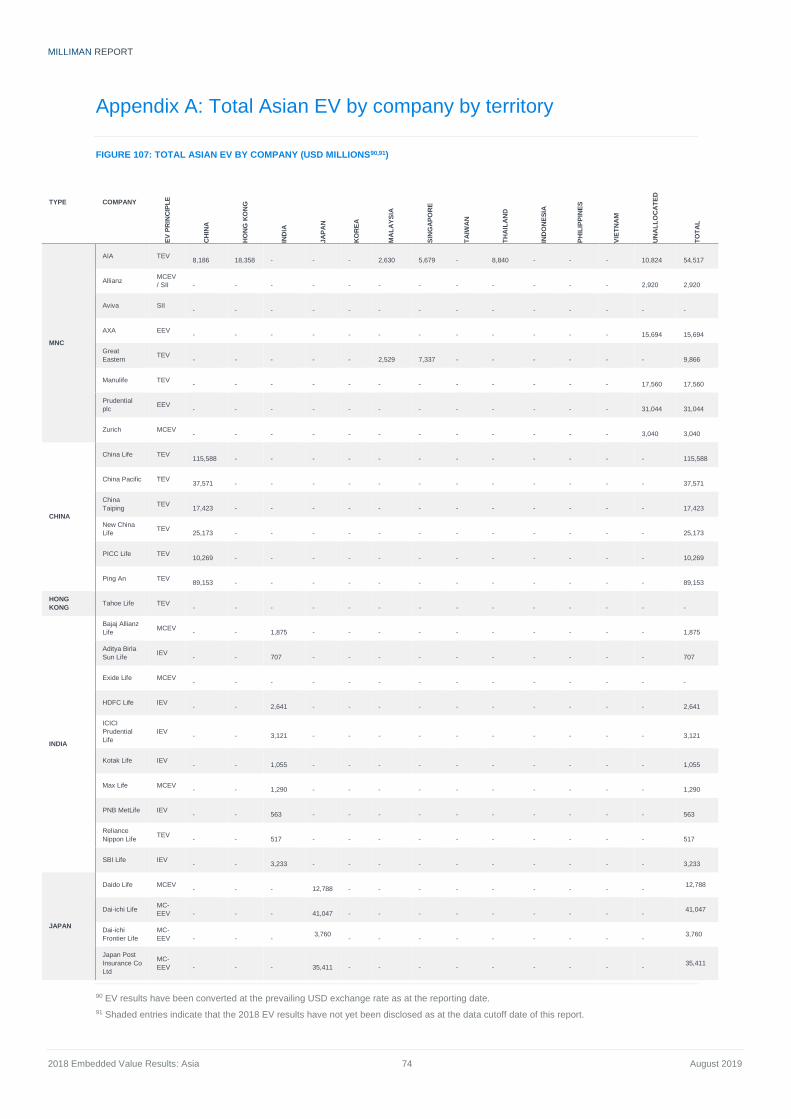
MILLIMAN REPORT
2018 Embedded Value Results: Asia 74 August 2019
Appendix A: Total Asian EV by company by territory
FIGURE 107: TOTAL ASIAN EV BY COMPANY (USD MILLIONS90,91)
TYPE COMPANY
EV
PR
INC
IPL
E
CH
INA
HO
NG
KO
NG
IND
IA
JA
PA
N
KO
RE
A
MA
LA
YS
IA
SIN
GA
PO
RE
TA
IWA
N
TH
AIL
AN
D
IND
ON
ES
IA
PH
ILIP
PIN
ES
VIE
TN
AM
UN
AL
LO
CA
TE
D
TO
TA
L
MNC
AIA TEV
8,186
18,358
-
-
-
2,630
5,679
-
8,840
-
-
-
10,824
54,517
Allianz MCEV
/ SII
-
-
-
-
-
-
-
-
-
-
-
-
2,920
2,920
Aviva SII
-
-
-
-
-
-
-
-
-
-
-
-
-
-
AXA EEV
-
-
-
-
-
-
-
-
-
-
-
-
15,694
15,694
Great
Eastern TEV
-
-
-
-
-
2,529
7,337
-
-
-
-
-
-
9,866
Manulife TEV
-
-
-
-
-
-
-
-
-
-
-
-
17,560
17,560
Prudential
plc EEV
-
-
-
-
-
-
-
-
-
-
-
-
31,044
31,044
Zurich MCEV
-
-
-
-
-
-
-
-
-
-
-
-
3,040
3,040
CHINA
China Life TEV
115,588
-
-
-
-
-
-
-
-
-
-
-
-
115,588
China Pacific TEV
37,571
-
-
-
-
-
-
-
-
-
-
-
-
37,571
China
Taiping TEV
17,423
-
-
-
-
-
-
-
-
-
-
-
-
17,423
New China
Life TEV
25,173
-
-
-
-
-
-
-
-
-
-
-
-
25,173
PICC Life TEV
10,269
-
-
-
-
-
-
-
-
-
-
-
-
10,269
Ping An TEV
89,153
-
-
-
-
-
-
-
-
-
-
-
-
89,153
HONG
KONG Tahoe Life TEV
-
-
-
-
-
-
-
-
-
-
-
-
-
-
INDIA
Bajaj Allianz
Life MCEV
-
-
1,875
-
-
-
-
-
-
-
-
-
-
1,875
Aditya Birla
Sun Life IEV
-
-
707
-
-
-
-
-
-
-
-
-
-
707
Exide Life MCEV
-
-
-
-
-
-
-
-
-
-
-
-
-
-
HDFC Life IEV
-
-
2,641
-
-
-
-
-
-
-
-
-
-
2,641
ICICI
Prudential
Life
IEV
-
-
3,121
-
-
-
-
-
-
-
-
-
-
3,121
Kotak Life IEV
-
-
1,055
-
-
-
-
-
-
-
-
-
-
1,055
Max Life MCEV
-
-
1,290
-
-
-
-
-
-
-
-
-
-
1,290
PNB MetLife IEV
-
-
563
-
-
-
-
-
-
-
-
-
-
563
Reliance
Nippon Life TEV
-
-
517
-
-
-
-
-
-
-
-
-
-
517
SBI Life IEV
-
-
3,233
-
-
-
-
-
-
-
-
-
-
3,233
JAPAN
Daido Life MCEV
-
-
-
12,788
-
-
-
-
-
-
-
-
- 12,788
Dai-ichi Life MC-
EEV
-
-
-
41,047
-
-
-
-
-
-
-
-
- 41,047
Dai-ichi
Frontier Life
MC-
EEV
-
-
- 3,760
-
-
-
-
-
-
-
-
- 3,760
Japan Post
Insurance Co
Ltd
MC-
EEV
-
-
-
35,411
-
-
-
-
-
-
-
-
- 35,411
90 EV results have been converted at the prevailing USD exchange rate as at the reporting date.
91 Shaded entries indicate that the 2018 EV results have not yet been disclosed as at the data cutoff date of this report.
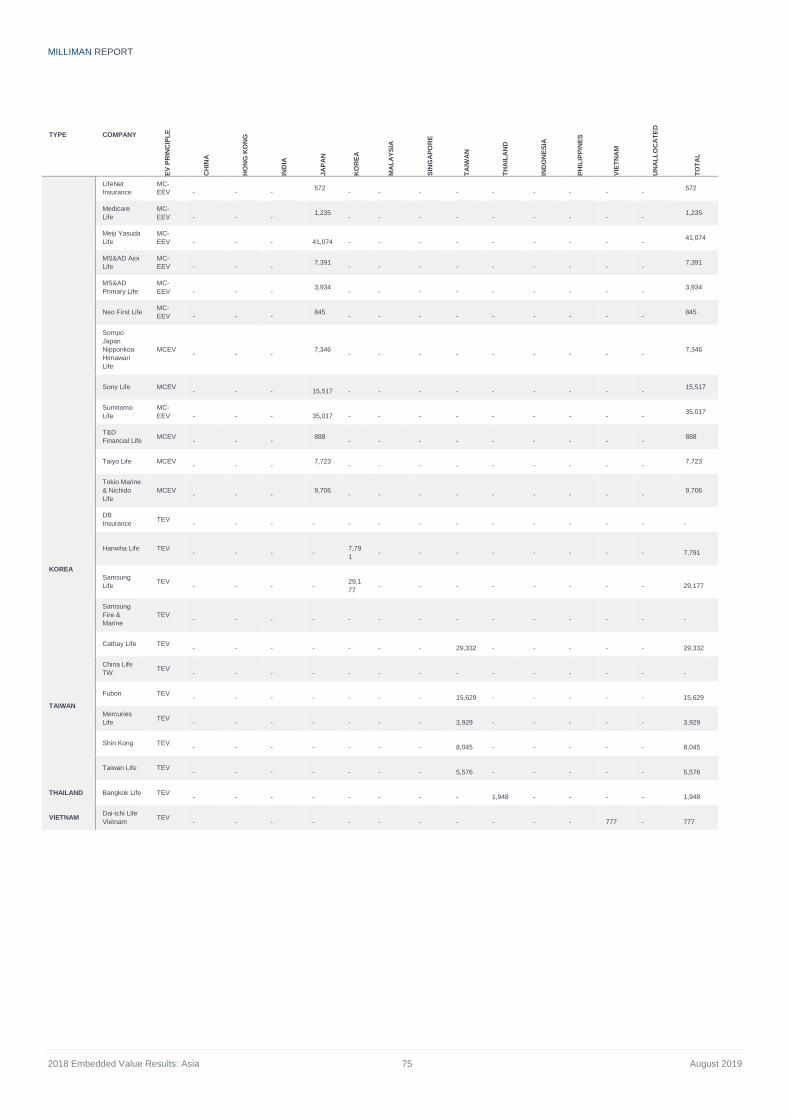
MILLIMAN REPORT
2018 Embedded Value Results: Asia 75 August 2019
TYPE COMPANY
EV
PR
INC
IPL
E
CH
INA
HO
NG
KO
NG
IND
IA
JA
PA
N
KO
RE
A
MA
LA
YS
IA
SIN
GA
PO
RE
TA
IWA
N
TH
AIL
AN
D
IND
ON
ES
IA
PH
ILIP
PIN
ES
VIE
TN
AM
UN
AL
LO
CA
TE
D
TO
TA
L
LifeNet
Insurance
MC-
EEV
-
-
- 572
-
-
-
-
-
-
-
-
- 572
Medicare
Life
MC-
EEV
-
-
- 1,235
-
-
-
-
-
-
-
-
- 1,235
Meiji Yasuda
Life
MC-
EEV
-
-
-
41,074
-
-
-
-
-
-
-
-
- 41,074
MS&AD Aioi
Life
MC-
EEV
-
-
- 7,391
-
-
-
-
-
-
-
-
- 7,391
MS&AD
Primary Life
MC-
EEV
-
-
- 3,934
-
-
-
-
-
-
-
-
- 3,934
Neo First Life MC-
EEV
-
-
- 845
-
-
-
-
-
-
-
-
- 845
Sompo
Japan
Nipponkoa
Himawari
Life
MCEV
-
-
- 7,346
-
-
-
-
-
-
-
-
- 7,346
Sony Life MCEV
-
-
-
15,517
-
-
-
-
-
-
-
-
- 15,517
Sumitomo
Life
MC-
EEV
-
-
-
35,017
-
-
-
-
-
-
-
-
- 35,017
T&D
Financial Life MCEV
-
-
- 888
-
-
-
-
-
-
-
-
- 888
Taiyo Life MCEV
-
-
- 7,723
-
-
-
-
-
-
-
-
- 7,723
Tokio Marine
& Nichido
Life
MCEV
-
-
- 9,706
-
-
-
-
-
-
-
-
- 9,706
KOREA
DB
Insurance TEV
-
-
-
-
-
-
-
-
-
-
-
-
-
-
Hanwha Life TEV
-
-
-
-
7,79
1
-
-
-
-
-
-
-
-
7,791
Samsung
Life TEV
-
-
-
-
29,1
77
-
-
-
-
-
-
-
-
29,177
Samsung
Fire &
Marine
TEV
-
-
-
-
-
-
-
-
-
-
-
-
-
-
TAIWAN
Cathay Life TEV
-
-
-
-
-
-
-
29,332
-
-
-
-
-
29,332
China Life
TW TEV
-
-
-
-
-
-
-
-
-
-
-
-
-
-
Fubon TEV
-
-
-
-
-
-
-
15,629
-
-
-
-
-
15,629
Mercuries
Life TEV
-
-
-
-
-
-
-
3,929
-
-
-
-
-
3,929
Shin Kong TEV
-
-
-
-
-
-
-
8,045
-
-
-
-
-
8,045
Taiwan Life TEV
-
-
-
-
-
-
-
5,576
-
-
-
-
-
5,576
THAILAND Bangkok Life TEV
-
-
-
-
-
-
-
-
1,948
-
-
-
-
1,948
VIETNAM Dai-ichi Life
Vietnam TEV
-
-
-
-
-
-
-
-
-
-
-
777
-
777
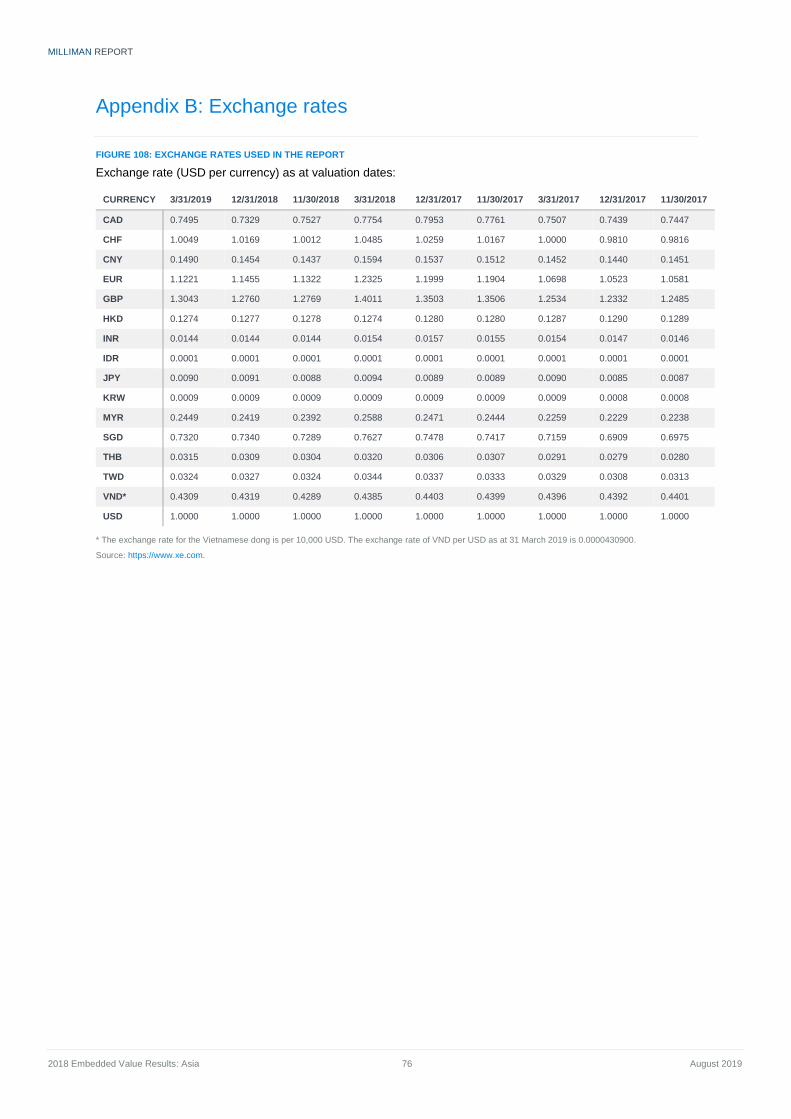
MILLIMAN REPORT
2018 Embedded Value Results: Asia 76 August 2019
Appendix B: Exchange rates
FIGURE 108: EXCHANGE RATES USED IN THE REPORT
Exchange rate (USD per currency) as at valuation dates:
CURRENCY 3/31/2019 12/31/2018 11/30/2018 3/31/2018 12/31/2017 11/30/2017 3/31/2017 12/31/2017 11/30/2017
CAD 0.7495 0.7329 0.7527 0.7754 0.7953 0.7761 0.7507 0.7439 0.7447
CHF 1.0049 1.0169 1.0012 1.0485 1.0259 1.0167 1.0000 0.9810 0.9816
CNY 0.1490 0.1454 0.1437 0.1594 0.1537 0.1512 0.1452 0.1440 0.1451
EUR 1.1221 1.1455 1.1322 1.2325 1.1999 1.1904 1.0698 1.0523 1.0581
GBP 1.3043 1.2760 1.2769 1.4011 1.3503 1.3506 1.2534 1.2332 1.2485
HKD 0.1274 0.1277 0.1278 0.1274 0.1280 0.1280 0.1287 0.1290 0.1289
INR 0.0144 0.0144 0.0144 0.0154 0.0157 0.0155 0.0154 0.0147 0.0146
IDR 0.0001 0.0001 0.0001 0.0001 0.0001 0.0001 0.0001 0.0001 0.0001
JPY 0.0090 0.0091 0.0088 0.0094 0.0089 0.0089 0.0090 0.0085 0.0087
KRW 0.0009 0.0009 0.0009 0.0009 0.0009 0.0009 0.0009 0.0008 0.0008
MYR 0.2449 0.2419 0.2392 0.2588 0.2471 0.2444 0.2259 0.2229 0.2238
SGD 0.7320 0.7340 0.7289 0.7627 0.7478 0.7417 0.7159 0.6909 0.6975
THB 0.0315 0.0309 0.0304 0.0320 0.0306 0.0307 0.0291 0.0279 0.0280
TWD 0.0324 0.0327 0.0324 0.0344 0.0337 0.0333 0.0329 0.0308 0.0313
VND* 0.4309 0.4319 0.4289 0.4385 0.4403 0.4399 0.4396 0.4392 0.4401
USD 1.0000 1.0000 1.0000 1.0000 1.0000 1.0000 1.0000 1.0000 1.0000
* The exchange rate for the Vietnamese dong is per 10,000 USD. The exchange rate of VND per USD as at 31 March 2019 is 0.0000430900.
Source: https://www.xe.com.

Milliman is among the world’s largest providers of actuarial and
related products and services. The firm has consulting practices in
life insurance and financial services, property & casualty insurance,
healthcare, and employee benefits. Founded in 1947, Milliman is an
independent firm with offices in major cities around the globe.
milliman.com
© 2019 Milliman, Inc. All Rights Reserved. The materials in this document represent the opinion of the authors and are not representative of the views of Milliman,
Inc. Milliman does not certify the information, nor does it guarantee the accuracy and completeness of such information. Use of such information is voluntary and
should not be relied upon unless an independent review of its accuracy and completeness has been performed. Materials may not be reproduced without the
express consent of Milliman.
CONTACT
Paul Sinnott
Michael Daly
Richard Holloway
Wing Wong
Chihong An
Wen Yee Lee
Stephen Conwill