Embed Size (px)
Citation preview
2018 Business Plan and Budget
Western Electricity Coordinating Council
Approved by: WECC Board of Directors
Date: June 21, 2017
155 North 400 West, Suite 200
Salt Lake City, Utah 84103‐1114
2018 WECC Business Plan and Budget
Approved by Board of Directors: June 21, 2017 2
Table of Contents
Introduction................................................................................................................................ 4
Organizational Overview ............................................................................................................................ 4
Membership and Governance ................................................................................................................... 5
2018 Key Assumptions ............................................................................................................................... 6
2018 Key Deliverables ................................................................................................................................ 7
2018 Overview of Cost Impacts ................................................................................................................. 7
Personnel Analysis ..................................................................................................................................... 9
2017 Budget and Projection and 2018 Budget Comparisons .................................................................. 10
Section A — 2018 Business Plan and Budget ‐ Statutory Programs ........................................... 12
Reliability Standards Program .................................................................................................................. 12
Compliance Monitoring and Enforcement and Organization Registration and Certification Program ... 16
Reliability Assessment and Performance Analysis Program .................................................................... 22
Training, Education, and Stakeholder Outreach Program ....................................................................... 27
Situation Awareness and Infrastructure Security Program ..................................................................... 30
Corporate Services ................................................................................................................................... 34
Technical Committees and Member Forums ........................................................................................... 34
General and Administrative ..................................................................................................................... 36
Legal and Regulatory ................................................................................................................................ 38
Information Technology ........................................................................................................................... 39
Human Resources .................................................................................................................................... 41
Finance and Accounting ........................................................................................................................... 42
Section B — Supplemental Financial Information ..................................................................... 45
Reserve Analysis ....................................................................................................................................... 45
Civil Penalty Sanctions ............................................................................................................................. 46
Penalty Sanctions ..................................................................................................................................... 47
Supplemental Funding ............................................................................................................................. 48
Personnel Expenses.................................................................................................................................. 49
Meeting Expenses .................................................................................................................................... 50
Office Rent ............................................................................................................................................... 53
Office Costs .............................................................................................................................................. 53
2018 WECC Business Plan and Budget
Approved by Board of Directors: June 21, 2017 3
Professional Services ................................................................................................................................ 54
Other Non‐Operating ............................................................................................................................... 55
Fixed Assets .............................................................................................................................................. 56
Section C — 2018 Budget ‐ Non‐Statutory Activities ................................................................. 58
Western Renewable Energy Generation Information System (WREGIS) ................................................ 58
Personnel Analysis ................................................................................................................................... 62
Reserve Analysis ....................................................................................................................................... 62
Section D – Additional Financial Information ............................................................................ 64
2018 Consolidated Statement of Activities by Program, Statutory, and Non‐Statutory ......................... 64
Statement of Financial Position ............................................................................................................... 65
Appendix A: Organizational Chart ............................................................................................. 66
Appendix B: 2018 Budget & Projected 2019 and 2020 Budgets ................................................. 67
Key Assumptions ...................................................................................................................................... 67
Appendix C: Adjustment to the Alberta Electric System Operator (AESO) Assessment .............. 69
Appendix D: Statutory and Non‐Statutory Budget History Charts ............................................. 70
2018 Business Plan and Budget Introduction
2018 WECC Business Plan and Budget
Approved by Board of Directors: June 21, 2017 4
Introduction
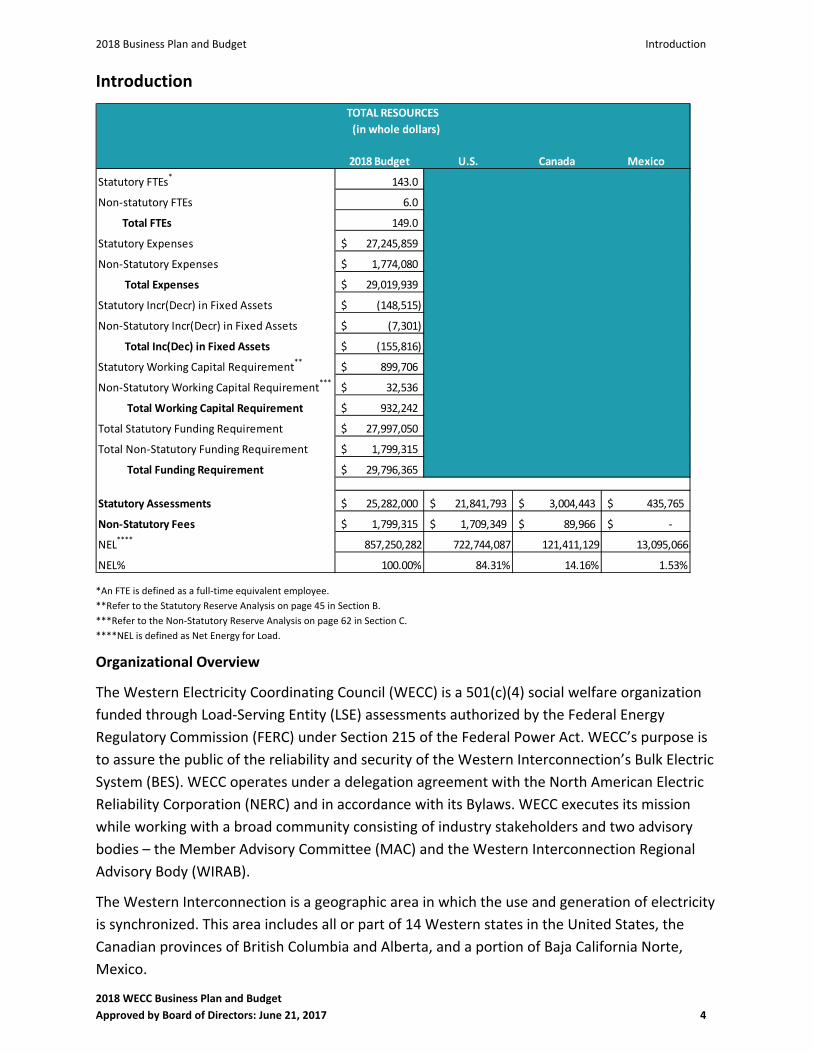
2018 Budget U.S. Canada Mexico
Statutory FTEs*
143.0
Non‐statutory FTEs 6.0
Total FTEs 149.0
Statutory Expenses 27,245,859$
Non‐Statutory Expenses 1,774,080$
Total Expenses 29,019,939$
Statutory Incr(Decr) in Fixed Assets (148,515)$
Non‐Statutory Incr(Decr) in Fixed Assets (7,301)$
Total Inc(Dec) in Fixed Assets (155,816)$
Statutory Working Capital Requirement**
899,706$
Non‐Statutory Working Capital Requirement***
32,536$
Total Working Capital Requirement 932,242$
Total Statutory Funding Requirement 27,997,050$
Total Non‐Statutory Funding Requirement 1,799,315$
Total Funding Requirement 29,796,365$
Statutory Assessments 25,282,000$ 21,841,793$ 3,004,443$ 435,765$
Non‐Statutory Fees 1,799,315$ 1,709,349$ 89,966$ ‐$
NEL****
857,250,282 722,744,087 121,411,129 13,095,066
NEL% 100.00% 84.31% 14.16% 1.53%
TOTAL RESOURCES
(in whole dollars)
*An FTE is defined as a full‐time equivalent employee.
**Refer to the Statutory Reserve Analysis on page 45 in Section B.
***Refer to the Non‐Statutory Reserve Analysis on page 62 in Section C.
****NEL is defined as Net Energy for Load.
Organizational Overview
The Western Electricity Coordinating Council (WECC) is a 501(c)(4) social welfare organization
funded through Load‐Serving Entity (LSE) assessments authorized by the Federal Energy
Regulatory Commission (FERC) under Section 215 of the Federal Power Act. WECC’s purpose is
to assure the public of the reliability and security of the Western Interconnection’s Bulk Electric
System (BES). WECC operates under a delegation agreement with the North American Electric
Reliability Corporation (NERC) and in accordance with its Bylaws. WECC executes its mission
while working with a broad community consisting of industry stakeholders and two advisory
bodies – the Member Advisory Committee (MAC) and the Western Interconnection Regional
Advisory Body (WIRAB).
The Western Interconnection is a geographic area in which the use and generation of electricity
is synchronized. This area includes all or part of 14 Western states in the United States, the
Canadian provinces of British Columbia and Alberta, and a portion of Baja California Norte,
Mexico.
2018 Business Plan and Budget Introduction
2018 WECC Business Plan and Budget
Approved by Board of Directors: June 21, 2017 5
WECC’s value proposition is to enhance reliability and security through two measures:
Providing efficient and effective risk‐based Compliance Monitoring and Enforcement of
Reliability Standards through standards development, entity registration, compliance
risk assessment, and audits and investigations; and
Informing the actions, practices, and decisions of industry participants, regulators, and
policy‐makers through reliability assessments, performance analysis, situation
awareness, event analysis, training, and outreach.
WECC’s business philosophy is guided by three fundamental principles:
Independence – As a 501(c)(4) social welfare organization, our goal is to serve the public
interest. WECC represents what is best for reliability within the Western Interconnection
with an impartial and unbiased voice.
Perspective – WECC is uniquely situated in a way that allows its subject matter experts
to develop comprehensive and influential work products for the Western
Interconnection.
Partnership – WECC is focused on assuring a reliable Bulk Electric System in the West by
collaborating with others who have the same reliability‐driven mission.
Membership and Governance
WECC has 366 members1 divided into the following five Membership Classes:
1. Large Transmission Owners,
2. Small Transmission Owners,
3. Electric Line of Business Entities doing business in the Western Interconnection that do not
own, control or operate transmission or distribution lines in the Western Interconnection,
4. End Users and entities that represent the interests of end users, and
5. Representatives of State and Provincial Governments.
WECC membership is open to any person or entity that has an interest in the reliable operation
of the Western Interconnection BES. WECC membership is not a requirement for participation
in the WECC Standards Development Process.2
WECC is governed by a nine‐member Independent Board of Directors (Board) elected by the
WECC membership, and WECC’s Chief Executive Officer. The nine Independent Directors are
compensated by WECC for their time.
1 As of April 13, 2017.
2 Non‐WECC members may participate in standards drafting teams and participating stakeholders may vote on
Regional Reliability Standards. A Participating Stakeholder is defined in Section 3.23 of the WECC Bylaws and the
Participating Stakeholder Application Process is described in Section 8.7.4. WECC’s Reliability Standards Voting
Procedures are detailed in the Reliability Standards Development Procedures.
2018 Business Plan and Budget Introduction
2018 WECC Business Plan and Budget
Approved by Board of Directors: June 21, 2017 6
WECC has five governance committees that provide functional oversight of WECC operations:
Compliance Hearing Body (CHB),
Finance and Audit Committee (FAC),
Governance Committee (GC),
Human Resources and Compensation Committee (HRCC), and
Nominating Committee (NC).
Under the direction of the WECC Board, additional committees provide the Board with
technical advice and policy recommendations:
Joint Guidance Committee (JGC),
Market Interface Committee (MIC),
Member Advisory Committee (MAC),
Operating Committee (OC),
Reliability Assessment Committee (RAC), and
WECC Standards Committee (WSC).
Pursuant to Section 215(j) of the Federal Power Act, FERC created WIRAB. WIRAB’s purpose is
to advise WECC, NERC and FERC regarding the governance of WECC, and whether proposed
Reliability Standards and the budget are just, reasonable, not unduly discriminatory or
preferential, and in the public interest.
WECC and FERC may request that WIRAB provide advice on other topics. Members are
appointed by the Governors/Premiers from Alberta, Arizona, British Columbia, California,
Colorado, Idaho, Montana, Nebraska, Nevada, New Mexico, Oregon, South Dakota, Utah,
Texas, Washington, Wyoming and Mexico. WECC’s budget does not include any costs related to
WIRAB operations.
2018 Key Assumptions
The Board recognizes that the electric industry is undergoing profound changes nationally and
in the West, and that other institutions are involved in furthering the understanding of these
changes. While WECC will not duplicate the efforts of other qualified entities, the Board
believes WECC should proactively address issues where the impact to the Western
Interconnection’s reliability are less understood or where WECC and its committees are
positioned to make a significant contribution to Western reliability and security.
Therefore, in addition to its baseload work supporting Electric Reliability Organization (ERO)‐
Enterprise‐driven programs, the Board has established the following strategic priorities for
WECC.
Monitor progress as proposals are developed for structural changes in the West and be
prepared to evaluate potential impacts on reliability.
2018 Business Plan and Budget Introduction
2018 WECC Business Plan and Budget
Approved by Board of Directors: June 21, 2017 7
Assess the reliability implications of the ongoing evolution of load composition and
resource mix in the Western Interconnection as well as fuel security, resource and
transmission adequacy, and BES stability.
Identify key vulnerability issues and work with stakeholders to address them.
Maximize sharing of operating and system data (within agreed parameters), and insights
from Event Analysis including, to the extent possible, near‐misses –.
Focus reliability assessment efforts on identifying the impacts and possible mitigation
efforts surrounding a handful of future industry evolution scenarios or high‐impact/low‐
probability events.
NERC and the Regional Entities’ business plans and budgets reflect the collaborative
development of the ERO Enterprise Strategic Plan and a set of shared common assumptions
and key focus areas. The entire set of Shared Assumptions is provided in Exhibit A to the NERC
2018 Business Plan and Budget. WECC supports these assumptions and focus areas as well as
assumptions specific to WECC that are described in each statutory program area in Section A.
2018 Key Deliverables
While WECC has many deliverables that are outlined in each program area, the following are
key deliverables due to their strategic importance.
Complete a comprehensive assessment of the adequacy and risk profile of the natural
gas infrastructure in the West, including natural gas storage capacity and other critical
facilities that support the electric power sector’s evolving reliability needs.
Enhance WECC’s capability to assess Essential Reliability Services in future scenarios.
Refine the comprehensive risk assessment of the Western Interconnection.
Assess Interconnection performance regarding key operational practices and work with
our stakeholder committees to improve those practices.
2018 Overview of Cost Impacts
WECC’s proposed 2018 statutory budget is $27.10 million, a $300,000 (1.12 percent) increase
from the 2017 statutory budget. The increase is mainly attributable to the one‐time
Gas/Electric Interdependence Study offset by completion of some Remedial Action Scheme
(RAS) modeling software enhancements and other one‐time 2017 projects, labor float
assumption changes based on actual turnover and vacancy rates, 3 percent merit pool, and the
addition of three new positions (3 FTEs).
Full‐time equivalents (FTE) represent the fractional allocation of a full‐time position’s cost to
one or more functional areas. Headcount (HC) represents either vacant or filled positions.
Major drivers of the change between the 2018 and 2017 statutory budgets are as follows:
Personnel Expenses increase by a net of $642,000, primarily due to a budgeted
3 percent merit pool, continued refinement of labor float percentages, the increase of
2018 Business Plan and Budget Introduction
2018 WECC Business Plan and Budget
Approved by Board of Directors: June 21, 2017 8
3.0 FTEs for Project Manager, Project Coordinator, and Risk Analyst positions, insurance
premium rate increases, and increased employee training needs.
Travel Expenses increase $118,000 primarily due to additional audits/site visits related
to CIP‐005 and CIP‐014.
Consultants and Contracts decrease by a net of $475,000, primarily due to the
completion of some RAS modeling enhancements, other one‐time Reliability
Assessment and Performance Analysis (RAPA) projects completed in 2017, and a
reduction in Board Director Search fees, offset by a one‐time Gas/Electric
Interdependence Study in 2018.
Professional Services decrease by $83,000 primarily due to a new Board Director
compensation structure.
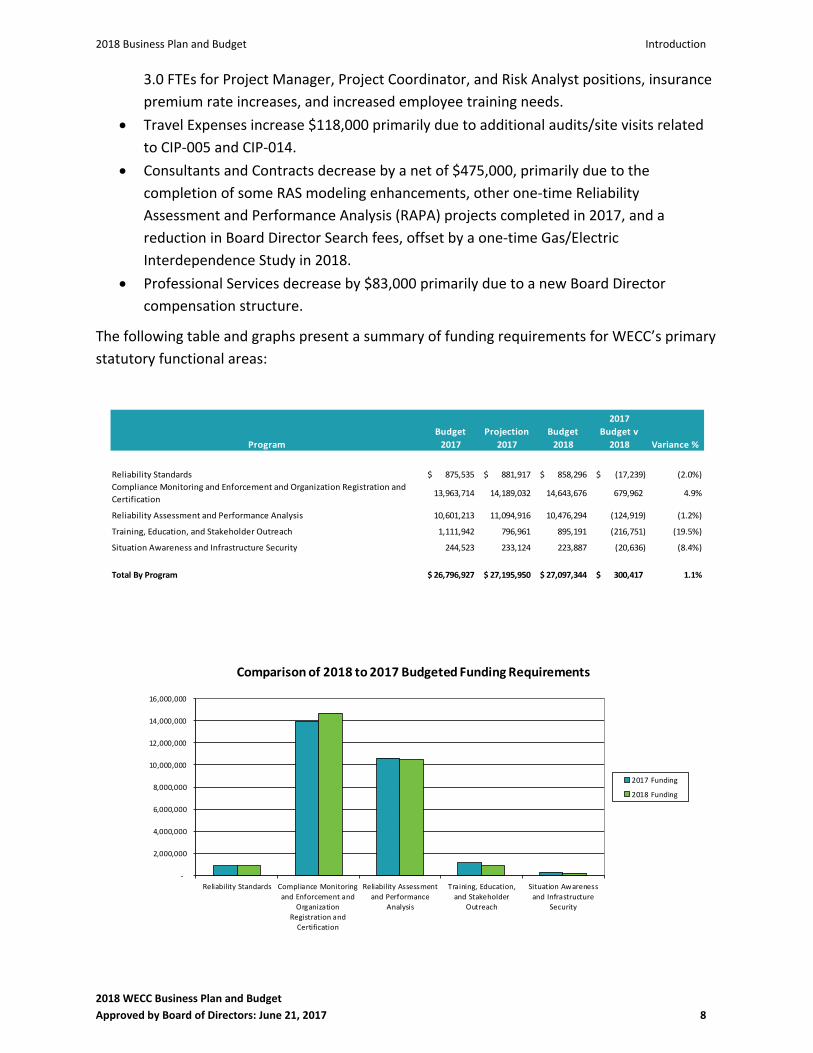
The following table and graphs present a summary of funding requirements for WECC’s primary
statutory functional areas:
Program
Budget
2017
Projection
2017
Budget
2018
2017
Budget v
2018 Variance %
Reliability Standards 875,535$ 881,917$ 858,296$ (17,239)$ (2.0%)
Compliance Monitoring and Enforcement and Organization Registration and
Certification 13,963,714 14,189,032 14,643,676 679,962 4.9%
Reliability Assessment and Performance Analysis 10,601,213 11,094,916 10,476,294 (124,919) (1.2%)
Training, Education, and Stakeholder Outreach 1,111,942 796,961 895,191 (216,751) (19.5%)
Situation Awareness and Infrastructure Security 244,523 233,124 223,887 (20,636) (8.4%)
Total By Program 26,796,927$ 27,195,950$ 27,097,344$ 300,417$ 1.1%
‐
2,000,000
4,000,000
6,000,000
8,000,000
10,000,000
12,000,000
14,000,000
16,000,000
Reliability Standards Compliance Monitoring
and Enforcement and
Organization
Registration and
Certification
Reliability Assessment
and Performance
Analysis
Training, Education,
and Stakeholder
Outreach
Situation Awareness
and Infrastructure
Security
Comparison of 2018 to 2017 Budgeted Funding Requirements
2017 Funding
2018 Funding
2018 Business Plan and Budget Introduction
2018 WECC Business Plan and Budget
Approved by Board of Directors: June 21, 2017 9
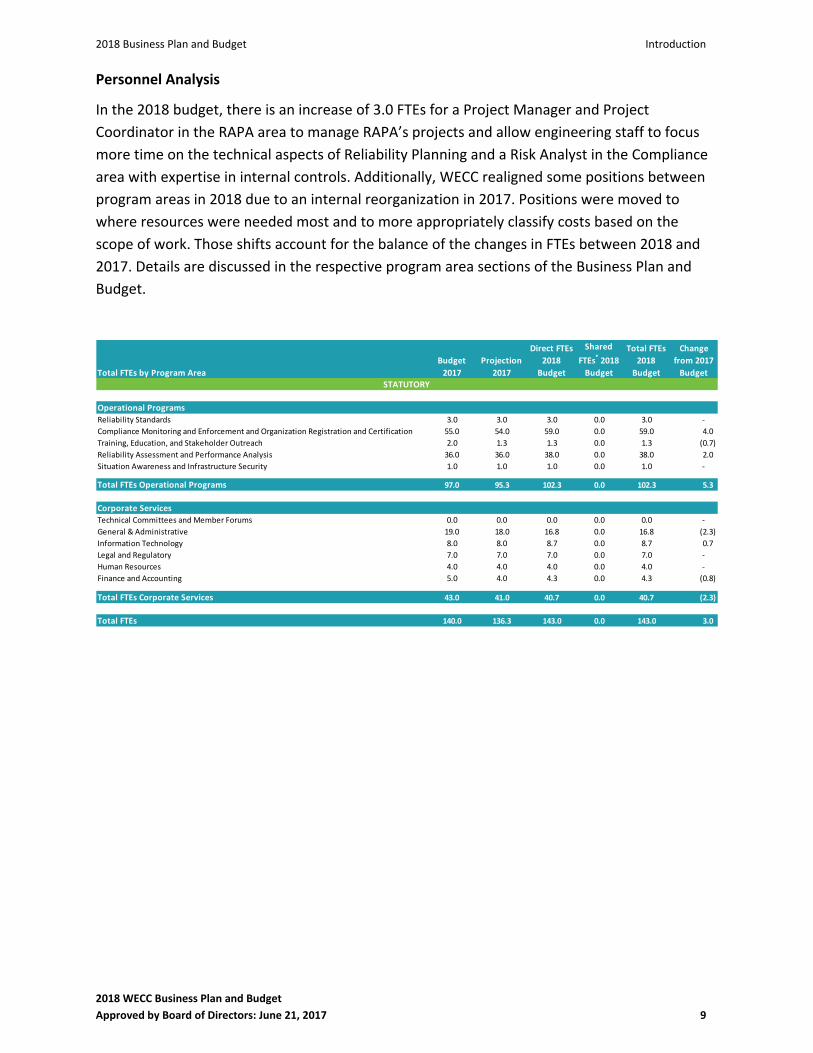
Personnel Analysis
In the 2018 budget, there is an increase of 3.0 FTEs for a Project Manager and Project
Coordinator in the RAPA area to manage RAPA’s projects and allow engineering staff to focus
more time on the technical aspects of Reliability Planning and a Risk Analyst in the Compliance
area with expertise in internal controls. Additionally, WECC realigned some positions between
program areas in 2018 due to an internal reorganization in 2017. Positions were moved to
where resources were needed most and to more appropriately classify costs based on the
scope of work. Those shifts account for the balance of the changes in FTEs between 2018 and
2017. Details are discussed in the respective program area sections of the Business Plan and
Budget.
Total FTEs by Program Area
Budget
2017
Projection
2017
Direct FTEs
2018
Budget
Shared
FTEs* 2018
Budget
Total FTEs
2018
Budget
Change
from 2017
Budget
Operational Programs
Reliability Standards 3.0 3.0 3.0 0.0 3.0 ‐
Compliance Monitoring and Enforcement and Organization Registration and Certification 55.0 54.0 59.0 0.0 59.0 4.0
Training, Education, and Stakeholder Outreach 2.0 1.3 1.3 0.0 1.3 (0.7)
Reliability Assessment and Performance Analysis 36.0 36.0 38.0 0.0 38.0 2.0
Situation Awareness and Infrastructure Security 1.0 1.0 1.0 0.0 1.0 ‐
Total FTEs Operational Programs 97.0 95.3 102.3 0.0 102.3 5.3
Corporate ServicesTechnical Committees and Member Forums 0.0 0.0 0.0 0.0 0.0 ‐
General & Administrative 19.0 18.0 16.8 0.0 16.8 (2.3)
Information Technology 8.0 8.0 8.7 0.0 8.7 0.7
Legal and Regulatory 7.0 7.0 7.0 0.0 7.0 ‐
Human Resources 4.0 4.0 4.0 0.0 4.0 ‐
Finance and Accounting 5.0 4.0 4.3 0.0 4.3 (0.8)
Total FTEs Corporate Services 43.0 41.0 40.7 0.0 40.7 (2.3)
Total FTEs 140.0 136.3 143.0 0.0 143.0 3.0
STATUTORY
2018 Business Plan and Budget Introduction
2018 WECC Business Plan and Budget
Approved by Board of Directors: June 21, 2017 10
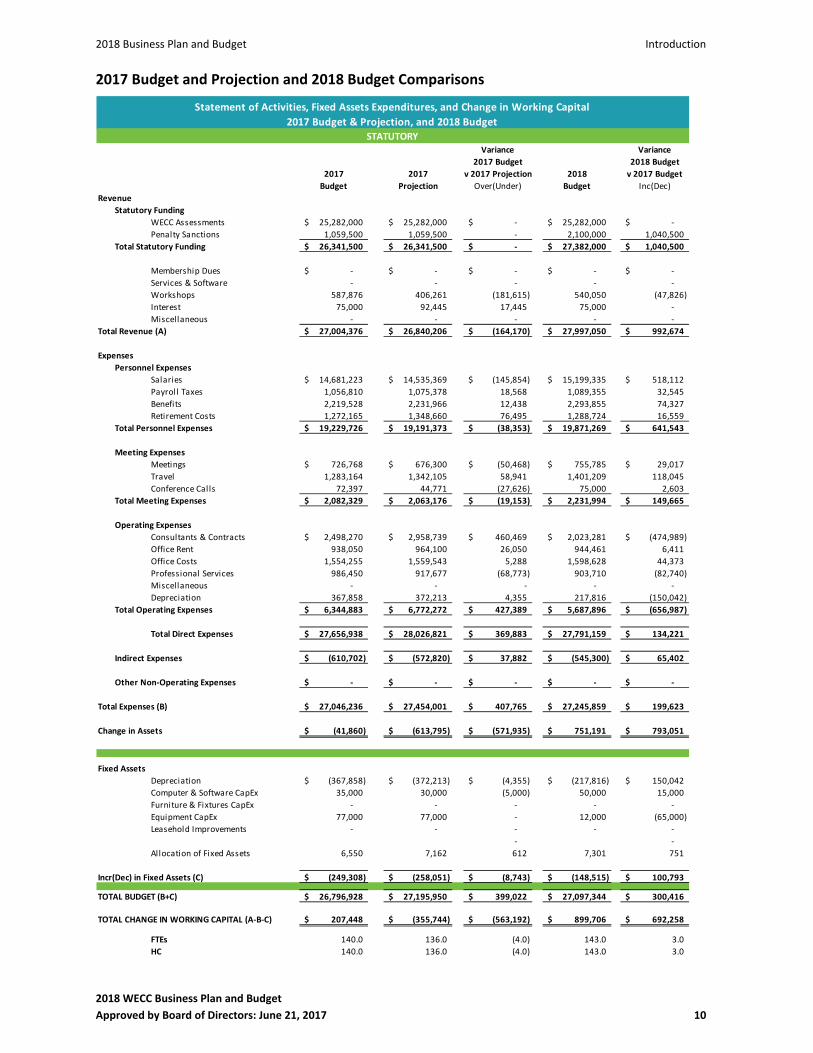
2017 Budget and Projection and 2018 Budget Comparisons
Variance Variance
2017 Budget 2018 Budget
2017 2017 v 2017 Projection 2018 v 2017 Budget
Budget Projection Over(Under) Budget Inc(Dec)
Revenue
Statutory Funding
WECC Assessments 25,282,000$ 25,282,000$ ‐$ 25,282,000$ ‐$
Penalty Sanctions 1,059,500 1,059,500 ‐ 2,100,000 1,040,500
Total Statutory Funding 26,341,500$ 26,341,500$ ‐$ 27,382,000$ 1,040,500$
Membership Dues ‐$ ‐$ ‐$ ‐$ ‐$
Services & Software ‐ ‐ ‐ ‐ ‐
Workshops 587,876 406,261 (181,615) 540,050 (47,826)
Interest 75,000 92,445 17,445 75,000 ‐
Miscellaneous ‐ ‐ ‐ ‐ ‐
Total Revenue (A) 27,004,376$ 26,840,206$ (164,170)$ 27,997,050$ 992,674$
Expenses
Personnel Expenses
Salaries 14,681,223$ 14,535,369$ (145,854)$ 15,199,335$ 518,112$
Payroll Taxes 1,056,810 1,075,378 18,568 1,089,355 32,545
Benefits 2,219,528 2,231,966 12,438 2,293,855 74,327
Retirement Costs 1,272,165 1,348,660 76,495 1,288,724 16,559
Total Personnel Expenses 19,229,726$ 19,191,373$ (38,353)$ 19,871,269$ 641,543$
Meeting Expenses
Meetings 726,768$ 676,300$ (50,468)$ 755,785$ 29,017$
Travel 1,283,164 1,342,105 58,941 1,401,209 118,045
Conference Calls 72,397 44,771 (27,626) 75,000 2,603
Total Meeting Expenses 2,082,329$ 2,063,176$ (19,153)$ 2,231,994$ 149,665$
Operating Expenses
Consultants & Contracts 2,498,270$ 2,958,739$ 460,469$ 2,023,281$ (474,989)$
Office Rent 938,050 964,100 26,050 944,461 6,411
Office Costs 1,554,255 1,559,543 5,288 1,598,628 44,373
Professional Services 986,450 917,677 (68,773) 903,710 (82,740)
Miscellaneous ‐ ‐ ‐ ‐ ‐
Depreciation 367,858 372,213 4,355 217,816 (150,042)
Total Operating Expenses 6,344,883$ 6,772,272$ 427,389$ 5,687,896$ (656,987)$
Total Direct Expenses 27,656,938$ 28,026,821$ 369,883$ 27,791,159$ 134,221$
Indirect Expenses (610,702)$ (572,820)$ 37,882$ (545,300)$ 65,402$
Other Non‐Operating Expenses ‐$ ‐$ ‐$ ‐$ ‐$
Total Expenses (B) 27,046,236$ 27,454,001$ 407,765$ 27,245,859$ 199,623$
Change in Assets (41,860)$ (613,795)$ (571,935)$ 751,191$ 793,051$
Fixed Assets
Depreciation (367,858)$ (372,213)$ (4,355)$ (217,816)$ 150,042$
Computer & Software CapEx 35,000 30,000 (5,000) 50,000 15,000
Furniture & Fixtures CapEx ‐ ‐ ‐ ‐ ‐
Equipment CapEx 77,000 77,000 ‐ 12,000 (65,000)
Leasehold Improvements ‐ ‐ ‐ ‐ ‐
‐ ‐
Allocation of Fixed Assets 6,550 7,162 612 7,301 751
Incr(Dec) in Fixed Assets (C) (249,308)$ (258,051)$ (8,743)$ (148,515)$ 100,793$
TOTAL BUDGET (B+C) 26,796,928$ 27,195,950$ 399,022$ 27,097,344$ 300,416$
TOTAL CHANGE IN WORKING CAPITAL (A‐B‐C) 207,448$ (355,744)$ (563,192)$ 899,706$ 692,258$
FTEs 140.0 136.0 (4.0) 143.0 3.0
HC 140.0 136.0 (4.0) 143.0 3.0
Statement of Activities, Fixed Assets Expenditures, and Change in Working Capital
2017 Budget & Projection, and 2018 BudgetSTATUTORY
2018 WECC Business Plan and Budget
Approved by Board of Directors: June 21, 2017 11
Section A
Statutory Programs
2018 Business Plan and Budget
Section A — 2018 Business Plan and Budget – Statutory Programs Reliability Standards
2018 WECC Business Plan and Budget
Approved by Board of Directors: June 21, 2017 12
Section A — 2018 Business Plan and Budget ‐ Statutory Programs
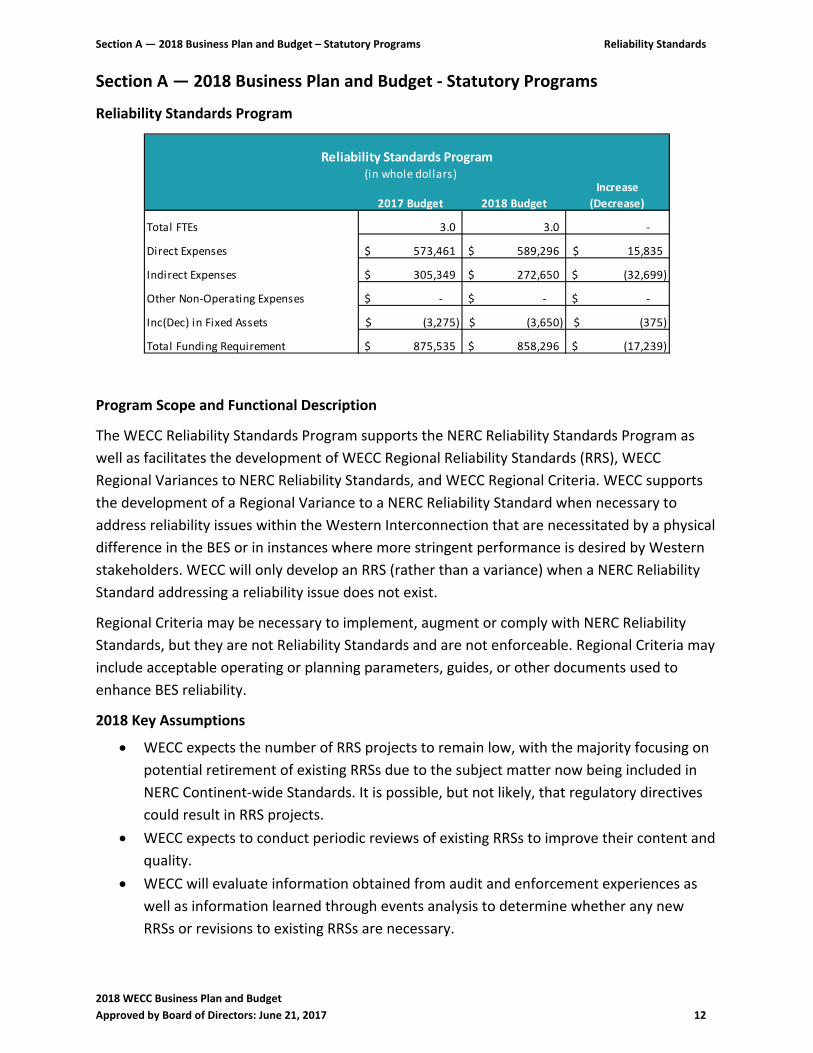
Reliability Standards Program
2017 Budget 2018 Budget
Increase
(Decrease)
Total FTEs 3.0 3.0 ‐
Direct Expenses 573,461$ 589,296$ 15,835$
Indirect Expenses 305,349$ 272,650$ (32,699)$
Other Non‐Operating Expenses ‐$ ‐$ ‐$
Inc(Dec) in Fixed Assets (3,275)$ (3,650)$ (375)$
Total Funding Requirement 875,535$ 858,296$ (17,239)$
Reliability Standards Program (in whole dollars)
Program Scope and Functional Description
The WECC Reliability Standards Program supports the NERC Reliability Standards Program as
well as facilitates the development of WECC Regional Reliability Standards (RRS), WECC
Regional Variances to NERC Reliability Standards, and WECC Regional Criteria. WECC supports
the development of a Regional Variance to a NERC Reliability Standard when necessary to
address reliability issues within the Western Interconnection that are necessitated by a physical
difference in the BES or in instances where more stringent performance is desired by Western
stakeholders. WECC will only develop an RRS (rather than a variance) when a NERC Reliability
Standard addressing a reliability issue does not exist.
Regional Criteria may be necessary to implement, augment or comply with NERC Reliability
Standards, but they are not Reliability Standards and are not enforceable. Regional Criteria may
include acceptable operating or planning parameters, guides, or other documents used to
enhance BES reliability.
2018 Key Assumptions
WECC expects the number of RRS projects to remain low, with the majority focusing on
potential retirement of existing RRSs due to the subject matter now being included in
NERC Continent‐wide Standards. It is possible, but not likely, that regulatory directives
could result in RRS projects.
WECC expects to conduct periodic reviews of existing RRSs to improve their content and
quality.
WECC will evaluate information obtained from audit and enforcement experiences as
well as information learned through events analysis to determine whether any new
RRSs or revisions to existing RRSs are necessary.
Section A — 2018 Business Plan and Budget – Statutory Programs Reliability Standards
2018 WECC Business Plan and Budget
Approved by Board of Directors: June 21, 2017 13
WECC expects that much of the work required to develop Regional Reliability Standards,
Regional Variances to NERC Reliability Standards, and Regional Criteria will continue to
be performed by voluntary stakeholder participation.
WECC will continue to rely on stakeholder volunteers to staff most NERC Standards
drafting teams. WECC staff may, at times, participate as drafting team members or
observers.
WECC Standards staff will take an active role in the coordination and communication of
NERC Standards drafting teams’ activities to the Western stakeholders.
WECC supports NERC’s efforts to replace all fill‐in‐the‐blank standards with standards
applicable to the appropriate registered entity, and doesn’t anticipate it will be
necessary to develop additional RRSs to address fill‐in‐the‐blank standards. WECC will
complete several current WECC RRS and Regional Criteria projects to allow for
development work on unforeseen future projects.
WECC will undertake a review of existing WECC RRSs to determine whether any are
candidates for incorporation as a Regional Variance to a NERC Continent‐wide Reliability
Standard and, if so, coordinate with NERC to address the incorporation during NERC’s
next enhanced periodic review of the NERC Reliability Standard(s).
Integration of renewable resources may require new or modified NERC Reliability
Standards or WECC RRSs. WECC supports the concept and will participate, when
appropriate, in the enhanced periodic reviews of NERC Reliability Standards.
WECC expects that the effort necessary to complete these assumptions can be achieved
by existing resources.
2018 Goals and Key Deliverables
Ensure the Western Interconnection perspective is represented in NERC Continent‐wide
Reliability Standards or, if necessary, through the development of Regional Variances or
Regional Reliability Standards if a NERC Continent‐wide standard addressing a Western
Interconnection reliability issue does not exist.
Ensure that the RRSs and Regional Criteria developed using the WECC Reliability
Standards Development Procedures meet the needs of the Western stakeholders.
Ensure that development of RRSs and Regional Criteria is in accordance with the most
recent WECC Reliability Standards Development Procedures.
Ensure that WECC members and stakeholders are informed and engaged in NERC
Standards development efforts.
Coordinate with NERC's enhanced periodic review process to identify any WECC RRSs
that are candidates for inclusion as an improvement or a Regional Variance to a NERC
Reliability Standard.
Use feedback from WECC's audit and enforcement experience as well as information
learned through events analysis for enhancements to WECC RRSs or WECC Regional
Criteria.
Section A — 2018 Business Plan and Budget – Statutory Programs Reliability Standards
2018 WECC Business Plan and Budget
Approved by Board of Directors: June 21, 2017 14
Provide leadership and guidance to encourage Western Interconnection stakeholder
awareness and participation in the development of NERC risk‐responsive Reliability
Standards and participation in enhanced periodic reviews of existing NERC Standards.
Undertake regular outreach to keep stakeholders informed about the status of NERC
and WECC Standards development activities.
Provide support to NERC’s informal outreach and enhanced periodic review efforts.
Post updates and provide enhancements to the WECC Standards webpages.
Facilitate and support the activities of the WECC Standards Committee.
Continue support of the NERC Standards Committee and its subcommittees.
Ensure that WECC’s procedures are updated as necessary to meet expectations of any
remaining fill‐in‐the‐blank standards.
Resource Requirements/Explanation of Significant Changes
Personnel Expenses
Personnel Expenses increase by a net of $20,000 primarily due to continued refinement
of the labor float rate based on actual turnover and vacancy rates, and a 3 percent
average merit increase.
Meeting Expenses
Conference Calls decrease by $4,000 due to moving the conference call budget to
General and Administrative.
Operating Expenses
No significant changes.
Fixed Assets
No significant changes.
See Section B – Supplemental Financial Information for explanations of other variances
between the 2017 and 2018 budgets.
Section A — 2018 Business Plan and Budget – Statutory Programs Reliability Standards
2018 WECC Business Plan and Budget
Approved by Board of Directors: June 21, 2017 15
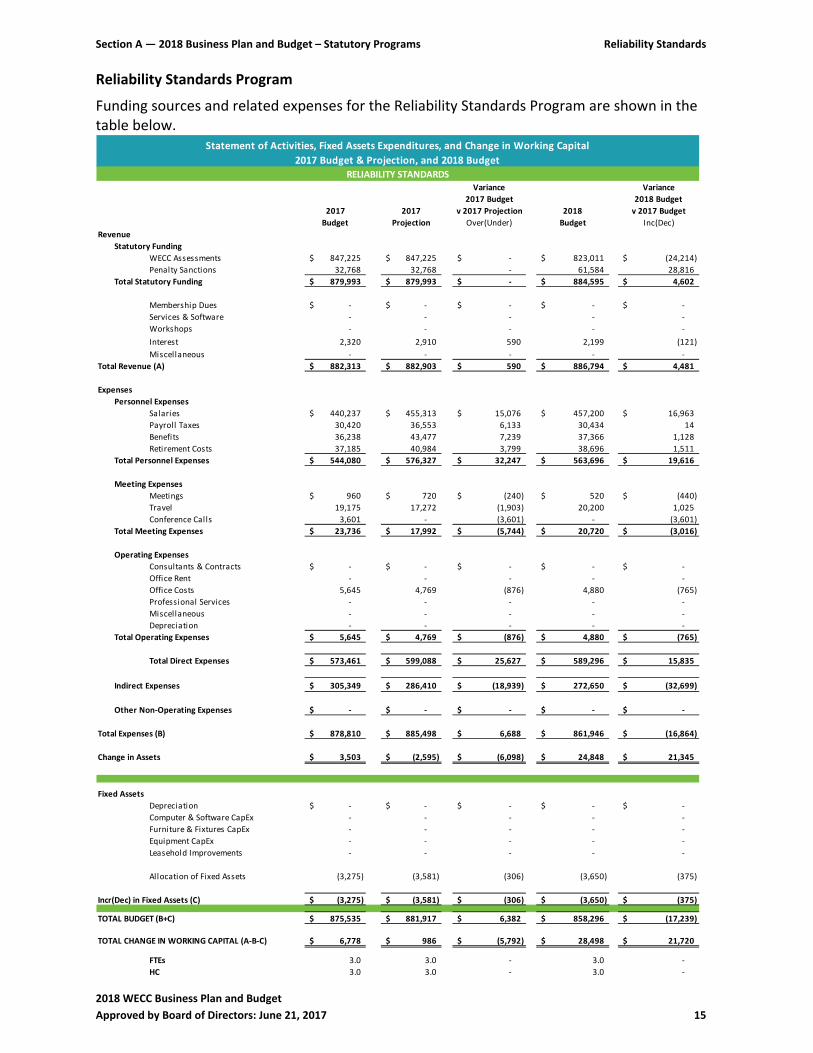
Reliability Standards Program
Funding sources and related expenses for the Reliability Standards Program are shown in the table below.
Variance Variance
2017 Budget 2018 Budget
2017 2017 v 2017 Projection 2018 v 2017 Budget
Budget Projection Over(Under) Budget Inc(Dec)
Revenue
Statutory Funding
WECC Assessments 847,225$ 847,225$ ‐$ 823,011$ (24,214)$
Penalty Sanctions 32,768 32,768 ‐ 61,584 28,816
Total Statutory Funding 879,993$ 879,993$ ‐$ 884,595$ 4,602$
Membership Dues ‐$ ‐$ ‐$ ‐$ ‐$
Services & Software ‐ ‐ ‐ ‐ ‐
Workshops ‐ ‐ ‐ ‐ ‐
Interest 2,320 2,910 590 2,199 (121)
Miscellaneous ‐ ‐ ‐ ‐ ‐
Total Revenue (A) 882,313$ 882,903$ 590$ 886,794$ 4,481$
Expenses
Personnel Expenses
Salaries 440,237$ 455,313$ 15,076$ 457,200$ 16,963$
Payroll Taxes 30,420 36,553 6,133 30,434 14
Benefits 36,238 43,477 7,239 37,366 1,128
Retirement Costs 37,185 40,984 3,799 38,696 1,511
Total Personnel Expenses 544,080$ 576,327$ 32,247$ 563,696$ 19,616$
Meeting Expenses
Meetings 960$ 720$ (240)$ 520$ (440)$
Travel 19,175 17,272 (1,903) 20,200 1,025
Conference Calls 3,601 ‐ (3,601) ‐ (3,601)
Total Meeting Expenses 23,736$ 17,992$ (5,744)$ 20,720$ (3,016)$
Operating Expenses
Consultants & Contracts ‐$ ‐$ ‐$ ‐$ ‐$
Office Rent ‐ ‐ ‐ ‐ ‐
Office Costs 5,645 4,769 (876) 4,880 (765)
Professional Services ‐ ‐ ‐ ‐ ‐
Miscellaneous ‐ ‐ ‐ ‐ ‐
Depreciation ‐ ‐ ‐ ‐ ‐
Total Operating Expenses 5,645$ 4,769$ (876)$ 4,880$ (765)$
Total Direct Expenses 573,461$ 599,088$ 25,627$ 589,296$ 15,835$
Indirect Expenses 305,349$ 286,410$ (18,939)$ 272,650$ (32,699)$
Other Non‐Operating Expenses ‐$ ‐$ ‐$ ‐$ ‐$
Total Expenses (B) 878,810$ 885,498$ 6,688$ 861,946$ (16,864)$
Change in Assets 3,503$ (2,595)$ (6,098)$ 24,848$ 21,345$
Fixed Assets
Depreciation ‐$ ‐$ ‐$ ‐$ ‐$
Computer & Software CapEx ‐ ‐ ‐ ‐ ‐
Furniture & Fixtures CapEx ‐ ‐ ‐ ‐ ‐
Equipment CapEx ‐ ‐ ‐ ‐ ‐
Leasehold Improvements ‐ ‐ ‐ ‐ ‐
Allocation of Fixed Assets (3,275) (3,581) (306) (3,650) (375)
Incr(Dec) in Fixed Assets (C) (3,275)$ (3,581)$ (306)$ (3,650)$ (375)$
TOTAL BUDGET (B+C) 875,535$ 881,917$ 6,382$ 858,296$ (17,239)$
TOTAL CHANGE IN WORKING CAPITAL (A‐B‐C) 6,778$ 986$ (5,792)$ 28,498$ 21,720$
FTEs 3.0 3.0 ‐ 3.0 ‐
HC 3.0 3.0 ‐ 3.0 ‐
Statement of Activities, Fixed Assets Expenditures, and Change in Working Capital
2017 Budget & Projection, and 2018 Budget
RELIABILITY STANDARDS
Section A — 2018 Business Plan and Budget – Statutory Programs Compliance Monitoring and Enforcement
2018 WECC Business Plan and Budget
Approved by Board of Directors: June 21, 2017 16
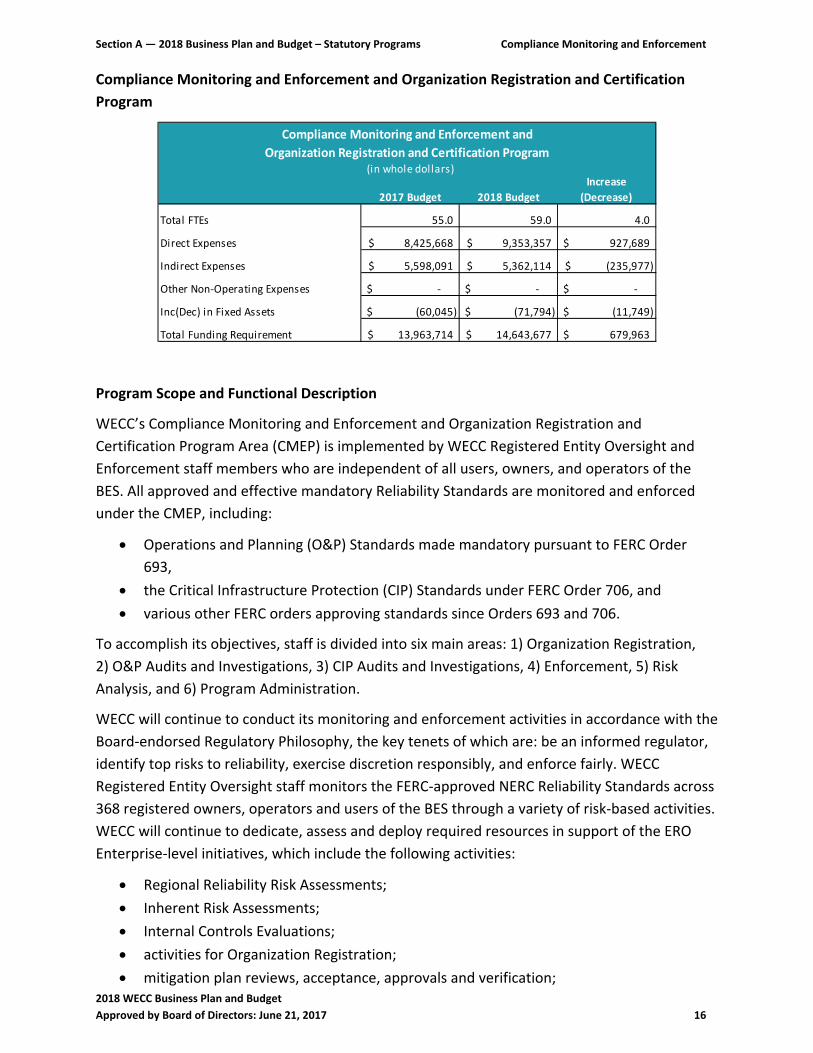
Compliance Monitoring and Enforcement and Organization Registration and Certification
Program
2017 Budget 2018 Budget
Increase
(Decrease)
Total FTEs 55.0 59.0 4.0
Direct Expenses 8,425,668$ 9,353,357$ 927,689$
Indirect Expenses 5,598,091$ 5,362,114$ (235,977)$
Other Non‐Operating Expenses ‐$ ‐$ ‐$
Inc(Dec) in Fixed Assets (60,045)$ (71,794)$ (11,749)$
Total Funding Requirement 13,963,714$ 14,643,677$ 679,963$
Compliance Monitoring and Enforcement and
Organization Registration and Certification Program (in whole dollars)
Program Scope and Functional Description
WECC’s Compliance Monitoring and Enforcement and Organization Registration and
Certification Program Area (CMEP) is implemented by WECC Registered Entity Oversight and
Enforcement staff members who are independent of all users, owners, and operators of the
BES. All approved and effective mandatory Reliability Standards are monitored and enforced
under the CMEP, including:
Operations and Planning (O&P) Standards made mandatory pursuant to FERC Order
693,
the Critical Infrastructure Protection (CIP) Standards under FERC Order 706, and
various other FERC orders approving standards since Orders 693 and 706.
To accomplish its objectives, staff is divided into six main areas: 1) Organization Registration,
2) O&P Audits and Investigations, 3) CIP Audits and Investigations, 4) Enforcement, 5) Risk
Analysis, and 6) Program Administration.
WECC will continue to conduct its monitoring and enforcement activities in accordance with the
Board‐endorsed Regulatory Philosophy, the key tenets of which are: be an informed regulator,
identify top risks to reliability, exercise discretion responsibly, and enforce fairly. WECC
Registered Entity Oversight staff monitors the FERC‐approved NERC Reliability Standards across
368 registered owners, operators and users of the BES through a variety of risk‐based activities.
WECC will continue to dedicate, assess and deploy required resources in support of the ERO
Enterprise‐level initiatives, which include the following activities:
Regional Reliability Risk Assessments;
Inherent Risk Assessments;
Internal Controls Evaluations;
activities for Organization Registration;
mitigation plan reviews, acceptance, approvals and verification;
Section A — 2018 Business Plan and Budget – Statutory Programs Compliance Monitoring and Enforcement
2018 WECC Business Plan and Budget
Approved by Board of Directors: June 21, 2017 17
reviews of self‐logged minimal risk issues;
processing and assessing self‐certification requests and guided self‐certification
responses;
review and validation of periodic data submittals;
internal compliance program assessments;
activities specific to compliance audits, spot‐checks, investigations and assessment of
complaints;
creation of compliance oversight plans along with schedules to align monitoring
activities based on potential risk; and
BES Definition Exception request activities.
These are joint ERO Enterprise initiatives that benefit NERC, the Regional Entities and the
registered entities.
Compliance in Alberta, British Columbia, and Mexico
Alberta and British Columbia, Canada; and a portion of Baja California Norte, Mexico are all part
of the Western Interconnection and have adopted or are adopting mandatory Reliability
Standards based on FERC‐approved Standards. WECC has entered agreements with the Alberta
Market Surveillance Administrator (MSA), the British Columbia Utilities Commission (BCUC),
and Mexico’s Comisión Federal de Electricidad (CFE) under which WECC performs compliance
monitoring activities to help assure reliability across international borders within the Western
Interconnection.
2018 Key Assumptions
The Compliance Monitoring and Enforcement and Organization Registration and Certification
Program Area incorporates the Regional Entity‐specific shared business planning assumptions
as described in the ERO Enterprise 2018–2020 Shared Business Plan and Budget Assumptions
and Key Focus Areas document, and includes the following additional WECC‐specific
assumptions:
WECC promotes a culture of compliance that addresses reliability risks by monitoring
the FERC‐approved NERC Reliability Standards for applicable entities through audits
and/or spot‐checks. WECC applies a risk‐based approach that covers and ensures all
pre‐audit, onsite/offsite, and post‐audit activities are completed in accordance with the
NERC Rules of Procedure and the CMEP within the United States. With respect to
non‐U.S. jurisdictions, WECC monitors compliance in accordance with the approved
agreements and applicable compliance monitoring programs with Canadian and
Mexican authorities.
Additional resources may be required to support increased workload associated with
enforcement activities, specific to violations of new Reliability Standard requirements
for TPL‐001‐4, and CIP v5 low‐impact BES Cyber System (BCS). The number of hearings
to be conducted in 2018 is unknown.
Section A — 2018 Business Plan and Budget – Statutory Programs Compliance Monitoring and Enforcement
2018 WECC Business Plan and Budget
Approved by Board of Directors: June 21, 2017 18
WECC will shift its focus to refreshing BA/RC and TOP IRAs. In addition, WECC will
develop registered entity compliance oversight plans that include compliance
monitoring tools and frequency, and incorporate emerging risks tailored to the inherent
risks posed by specific entities.
WECC will continue work in consultation with the international compliance enforcement
authorities to determine which elements of the risk‐based CMEP should be incorporated
in the respective programs for international entities. Currently, WECC does not conduct
Inherent Risk Assessments (IRA) or Internal Controls Evaluations (ICE) for international
entities.
WECC will allocate resources and provide continued support for the implementation of
cyber‐security Reliability Standards for CIP v5 training, coordination and facilitation of
ERO Enterprise efforts and initiatives. Additional resource allocation may be necessary
for increased monitoring activities and site visits for CIP‐014 related to the Supply Chain
Risk Management Reliability Standard (CIP‐013).
Resource allocation will continue for activities associated with registration. WECC plans
to participate in four NERC‐led centralized review panel sessions as part of the
application process for materiality tests of the risk‐based registration process outlined in
Appendix 5A to the NERC Rules of Procedure. WECC will continue to review, assess,
validate and submit registration recommendations to NERC for new registrations, partial
deactivations, transfer of access and full deregistration changes impacting the NERC
Compliance Registry (NCR).
WECC will fully support ERO Enterprise efforts and activities to evaluate ERO business
practices, consistency, implementation and guidance within the risk‐based compliance
monitoring and enforcement program. WECC will provide feedback to the ERO
Enterprise regarding existing risks, with an emphasis on standard development,
standard modification, audit and monitoring approaches, and potential gaps. WECC will
work within the ERO Enterprise to develop application business requirements and
allocate resources to test business functionality for application projects.
WECC will use the results of the Regional Reliability Risk Assessment (RRA) to review the
potential risks to the reliability of the BES posed by an individual registered entity by
using ERO IRA guidance to perform the registered entity IRA. The information will also
be used to build areas of focus in the WECC CMEP Implementation Plan.
WECC does not anticipate any hearings in 2018. To date, WECC has never had a hearing
and; therefore, does not budget for them. Any costs related to a hearing that may occur
will be funded through working capital reserves.
Three positions (3 FTEs) were transferred from General and Administrative due to the
2017 reorganization to more appropriately align costs with scope of work.
One new position (1 FTE), a risk analyst with expertise in internal controls, is being
added in 2018.
Section A — 2018 Business Plan and Budget – Statutory Programs Compliance Monitoring and Enforcement
2018 WECC Business Plan and Budget
Approved by Board of Directors: June 21, 2017 19
2018 Goals and Key Deliverables
Organization Registration
Process and complete organization registration request reviews, validations and
recommendations to NERC in accordance with risk‐based registration activities and
initiatives.
Process all BES Exception submittals.
Participate in ERO Enterprise working groups to ensure consistency in processing
registration requests in accordance with the NERC Rules of Procedure outlined in
Appendix 5b (Statement of Compliance Registry Criteria).
Compliance Risk Analysis and Monitoring
Monitor and enforce compliance with mandatory standards in accordance with the
WECC/NERC Delegation Agreement, including the Rules of Procedure and the CMEP
within the U.S. With respect to non‐U.S. jurisdictions, monitor compliance in accordance
with the approved agreements and applicable compliance monitoring programs with
Canadian and Mexican authorities.
Complete 22 onsite audits, nine offsite audits and 18 spot checks of registered entities
for 2018. This may change based on broader Interconnection and subregional risk
assessment, Inherent Risk Assessment and the identification of emerging risks that
require proactive compliance monitoring.3 Due to the changes in the new NERC
Reliability Standards for CIP‐005, CIP‐014 and TPL‐001; and implementation of Internal
Controls Evaluation – additional site visits may be required. Additional compliance
audits and/or spot‐checks will be determined from risk‐based analysis.
Complete initial Inherent Risk Assessments for all registered entities by the end of 2018.
Gather and review risk reports and operations information to update its Regional RRA of
the Western Interconnection.
Work with registered entities within the WECC Region to promote a strong culture of
compliance and reliability improvement.
Participate in and represent the Western Interconnection on issues that will impact
WECC regarding NERC and regional initiatives, for example: refining risk‐based concepts
in compliance monitoring and enforcement for the risk‐based CMEP, streamlining
enforcement processing, increasing consistency across the Regions, and reviewing
information technology needs.
Conduct outreach to the industry in various forums; webinars, conferences and entity
specific engagements in support of ERO Enterprise activities and priorities.
3 The 2018 schedule of onsite audits, offsite audits, and spot checks is based on the risk assessment and analysis
process, and is subject to change.
Section A — 2018 Business Plan and Budget – Statutory Programs Compliance Monitoring and Enforcement
2018 WECC Business Plan and Budget
Approved by Board of Directors: June 21, 2017 20
Enforcement
Monitor and manage enforcement measures and metrics in support of the ERO‐
Enterprise Strategic Plan including caseload index, violation aging, and mitigation plan
aging; and collaborate with the ERO enterprise to develop better measures of program
effectiveness.
Continue working with NERC and the other Regional Entities to shape and refine the
ERO Enterprise enforcement philosophy that supports uniform, repeatable, transparent
and reliability‐focused approaches.
Conduct initial violation fact and circumstance reviews, and resolve enforcement actions
in a timely manner using a reliability risk‐based focus. Ensure enforcement discretion is
consistent with NERC directives and FERC orders, rules and regulations.
Resource Requirements/Explanation of Significant Changes
Personnel Expenses
Personnel Expenses increase by a net of $867,000 due to:
o reclassification of three positions (3 FTEs) from General and Administrative from the
2017 reorganization to more appropriately align costs with scope of work,
o one new position (1 FTE) for a Risk Analyst with expertise in internal controls,
o continued refinement of the labor float rate based on actual turnover and vacancy
rates, and
o a 3 percent average merit increase.
Meeting Expenses
Travel Expenses increase by $137,000 due to additional audits/site visits related to
CIP‐005, CIP‐014, and risk‐based compliance monitoring.
Conference Calls decrease by $13,000 due to moving the conference call budget to
General and Administrative.
Operating Expenses
Consultants and Contracts decrease by $53,000 due to an overall reduction in contract
labor for compliance audits.
Fixed Assets
No significant changes.
See Section B – Supplemental Financial Information for explanations of other variances
between the 2017 and 2018 budgets.
Section A — 2018 Business Plan and Budget – Statutory Programs Compliance Monitoring and Enforcement
2018 WECC Business Plan and Budget
Approved by Board of Directors: June 21, 2017 21
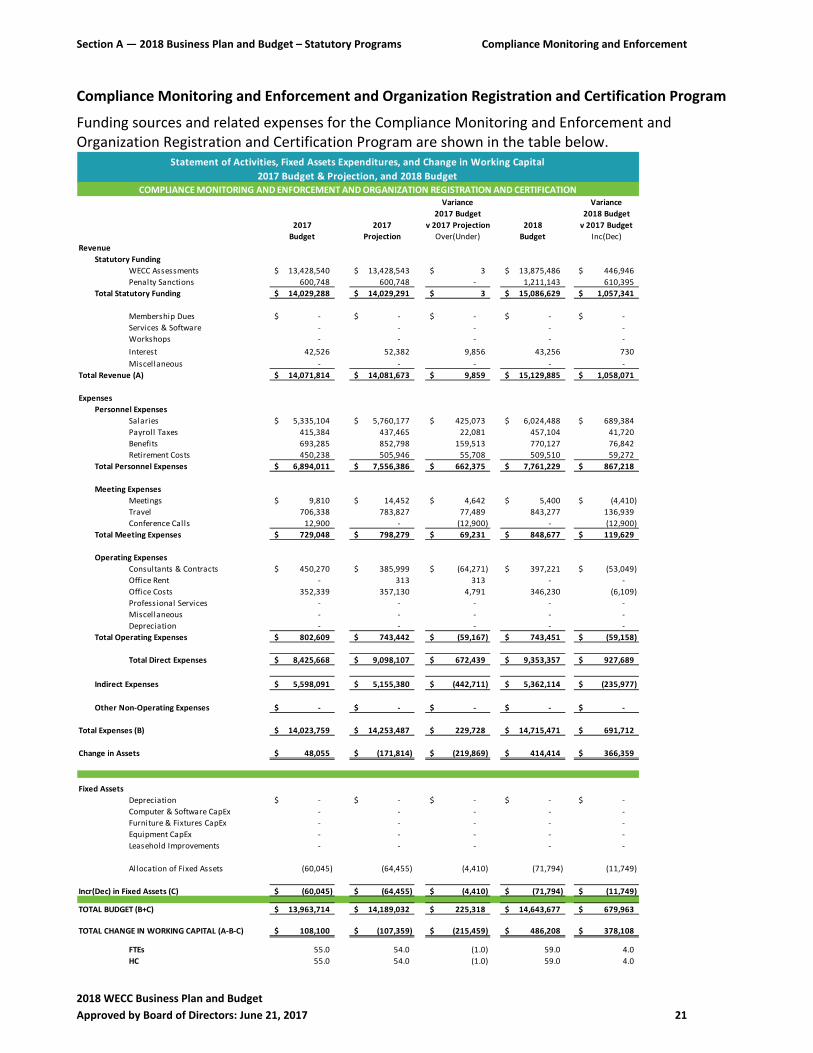
Compliance Monitoring and Enforcement and Organization Registration and Certification Program
Funding sources and related expenses for the Compliance Monitoring and Enforcement and Organization Registration and Certification Program are shown in the table below.
Variance Variance
2017 Budget 2018 Budget
2017 2017 v 2017 Projection 2018 v 2017 Budget
Budget Projection Over(Under) Budget Inc(Dec)
Revenue
Statutory Funding
WECC Assessments 13,428,540$ 13,428,543$ 3$ 13,875,486$ 446,946$
Penalty Sanctions 600,748 600,748 ‐ 1,211,143 610,395
Total Statutory Funding 14,029,288$ 14,029,291$ 3$ 15,086,629$ 1,057,341$
Membership Dues ‐$ ‐$ ‐$ ‐$ ‐$
Services & Software ‐ ‐ ‐ ‐ ‐
Workshops ‐ ‐ ‐ ‐ ‐
Interest 42,526 52,382 9,856 43,256 730
Miscellaneous ‐ ‐ ‐ ‐ ‐
Total Revenue (A) 14,071,814$ 14,081,673$ 9,859$ 15,129,885$ 1,058,071$
Expenses
Personnel Expenses
Salaries 5,335,104$ 5,760,177$ 425,073$ 6,024,488$ 689,384$
Payroll Taxes 415,384 437,465 22,081 457,104 41,720
Benefits 693,285 852,798 159,513 770,127 76,842
Retirement Costs 450,238 505,946 55,708 509,510 59,272
Total Personnel Expenses 6,894,011$ 7,556,386$ 662,375$ 7,761,229$ 867,218$
Meeting Expenses
Meetings 9,810$ 14,452$ 4,642$ 5,400$ (4,410)$
Travel 706,338 783,827 77,489 843,277 136,939
Conference Calls 12,900 ‐ (12,900) ‐ (12,900)
Total Meeting Expenses 729,048$ 798,279$ 69,231$ 848,677$ 119,629$
Operating Expenses
Consultants & Contracts 450,270$ 385,999$ (64,271)$ 397,221$ (53,049)$
Office Rent ‐ 313 313 ‐ ‐
Office Costs 352,339 357,130 4,791 346,230 (6,109)
Professional Services ‐ ‐ ‐ ‐ ‐
Miscellaneous ‐ ‐ ‐ ‐ ‐
Depreciation ‐ ‐ ‐ ‐ ‐
Total Operating Expenses 802,609$ 743,442$ (59,167)$ 743,451$ (59,158)$
Total Direct Expenses 8,425,668$ 9,098,107$ 672,439$ 9,353,357$ 927,689$
Indirect Expenses 5,598,091$ 5,155,380$ (442,711)$ 5,362,114$ (235,977)$
Other Non‐Operating Expenses ‐$ ‐$ ‐$ ‐$ ‐$
Total Expenses (B) 14,023,759$ 14,253,487$ 229,728$ 14,715,471$ 691,712$
Change in Assets 48,055$ (171,814)$ (219,869)$ 414,414$ 366,359$
Fixed Assets
Depreciation ‐$ ‐$ ‐$ ‐$ ‐$
Computer & Software CapEx ‐ ‐ ‐ ‐ ‐
Furniture & Fixtures CapEx ‐ ‐ ‐ ‐ ‐
Equipment CapEx ‐ ‐ ‐ ‐ ‐
Leasehold Improvements ‐ ‐ ‐ ‐ ‐
Allocation of Fixed Assets (60,045) (64,455) (4,410) (71,794) (11,749)
Incr(Dec) in Fixed Assets (C) (60,045)$ (64,455)$ (4,410)$ (71,794)$ (11,749)$
TOTAL BUDGET (B+C) 13,963,714$ 14,189,032$ 225,318$ 14,643,677$ 679,963$
TOTAL CHANGE IN WORKING CAPITAL (A‐B‐C) 108,100$ (107,359)$ (215,459)$ 486,208$ 378,108$
FTEs 55.0 54.0 (1.0) 59.0 4.0
HC 55.0 54.0 (1.0) 59.0 4.0
Statement of Activities, Fixed Assets Expenditures, and Change in Working Capital
2017 Budget & Projection, and 2018 Budget
COMPLIANCE MONITORING AND ENFORCEMENT AND ORGANIZATION REGISTRATION AND CERTIFICATION
Section A — 2018 Business Plan and Budget – Statutory Programs Reliability Assessment and Performance Analysis
2018 WECC Business Plan and Budget
Approved by Board of Directors: June 21, 2017 22
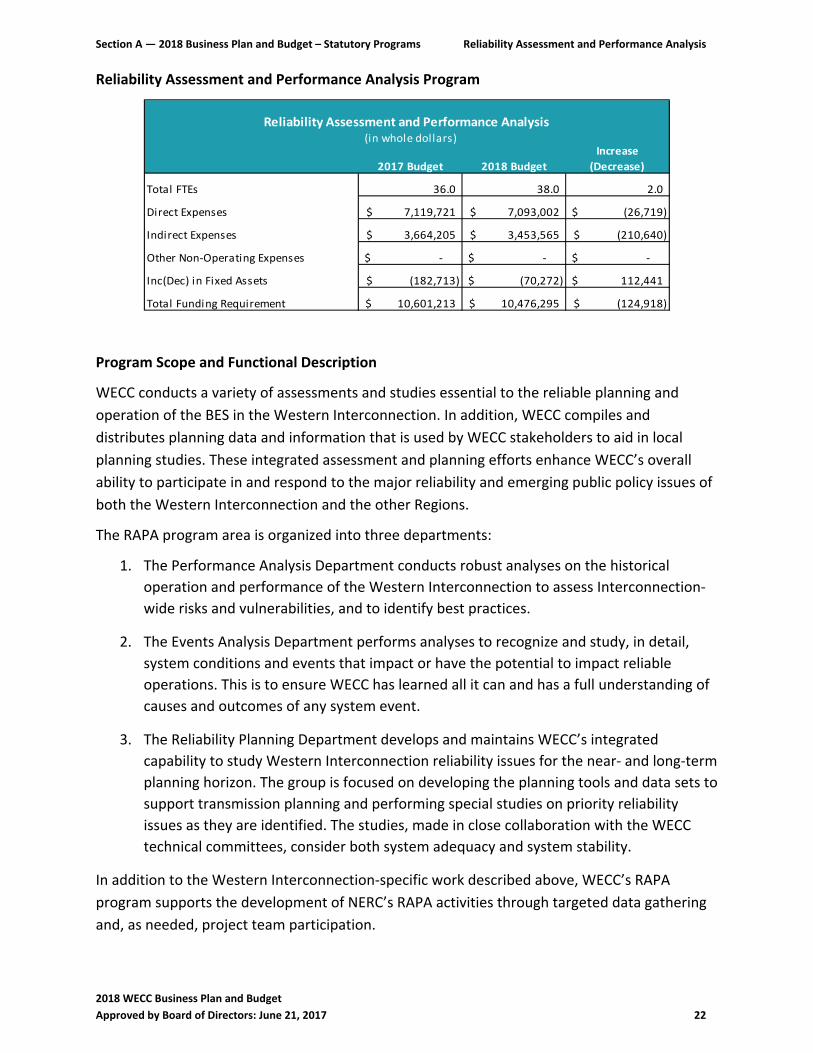
Reliability Assessment and Performance Analysis Program
2017 Budget 2018 Budget
Increase
(Decrease)
Total FTEs 36.0 38.0 2.0
Direct Expenses 7,119,721$ 7,093,002$ (26,719)$
Indirect Expenses 3,664,205$ 3,453,565$ (210,640)$
Other Non‐Operating Expenses ‐$ ‐$ ‐$
Inc(Dec) in Fixed Assets (182,713)$ (70,272)$ 112,441$
Total Funding Requirement 10,601,213$ 10,476,295$ (124,918)$
Reliability Assessment and Performance Analysis (in whole dollars)
Program Scope and Functional Description
WECC conducts a variety of assessments and studies essential to the reliable planning and
operation of the BES in the Western Interconnection. In addition, WECC compiles and
distributes planning data and information that is used by WECC stakeholders to aid in local
planning studies. These integrated assessment and planning efforts enhance WECC’s overall
ability to participate in and respond to the major reliability and emerging public policy issues of
both the Western Interconnection and the other Regions.
The RAPA program area is organized into three departments:
1. The Performance Analysis Department conducts robust analyses on the historical
operation and performance of the Western Interconnection to assess Interconnection‐
wide risks and vulnerabilities, and to identify best practices.
2. The Events Analysis Department performs analyses to recognize and study, in detail,
system conditions and events that impact or have the potential to impact reliable
operations. This is to ensure WECC has learned all it can and has a full understanding of
causes and outcomes of any system event.
3. The Reliability Planning Department develops and maintains WECC’s integrated
capability to study Western Interconnection reliability issues for the near‐ and long‐term
planning horizon. The group is focused on developing the planning tools and data sets to
support transmission planning and performing special studies on priority reliability
issues as they are identified. The studies, made in close collaboration with the WECC
technical committees, consider both system adequacy and system stability.
In addition to the Western Interconnection‐specific work described above, WECC’s RAPA
program supports the development of NERC’s RAPA activities through targeted data gathering
and, as needed, project team participation.
Section A — 2018 Business Plan and Budget – Statutory Programs Reliability Assessment and Performance Analysis
2018 WECC Business Plan and Budget
Approved by Board of Directors: June 21, 2017 23
2018 Key Assumptions
The Reliability Assessment and Performance Analysis Program Area incorporates the Regional
Entity‐specific shared business planning assumptions as described in the ERO Enterprise 2018–
2020 Shared Business Plan and Budget Assumptions and Key Focus Areas document and
includes the following additional WECC‐specific assumptions.
The RAPA staff and WECC technical committees will continue to focus on assessment
activities that address the Strategic Priority areas identified by the WECC Board in
December 2016.
WECC staff and stakeholders will continue to play a leadership role in the identification
of emerging reliability challenges specific to the Western Interconnection.
RAPA will add two positions in 2018—a project manager and a project coordinator—to
help plan, execute and close out WECC’s many projects as well as provide staff liaison
support to the remaining committees, thus freeing up existing engineering staff to focus
on work they are uniquely qualified to do.
As the resource mix in the West continues to evolve, the dependence on natural gas
used for electric generation will continue to increase. The adequacy of the natural gas
infrastructure to meet the evolving reliability needs of the electric power sector is one
of the top structural reliability issues the West faces and WECC will complete an
Interconnection‐wide assessment in 2018.
The Reliability Assessment Committee (RAC) will be fully operational in early 2018 and
we expect efficiencies will be achieved during the year. However, the efficiencies do not
directly translate to a lower WECC budget for 2018. The efficiencies will be observed
within WECC staff hours as well as within the stakeholder community such as less travel
necessary to attend the RAC meeting instead of attending both the Planning
Coordination Committee (PCC) and Transmission Expansion Planning Policy Committee
(TEPPC) meetings.
The 2018 RAPA budget for meetings and travel to support the committees, including the
RAC, is slightly lower than 2017, but at this time it is unclear exactly what subcommittee
structure will be needed to support the RAC.
2018 Goals and Key Deliverables
Implement the three‐year planning cycle, in conjunction with the JGC, to align staff and
technical committee work plans in support of the Board‐approved strategic priorities.
Coordinate internally, with Western Interconnection stakeholders, and with NERC to
ensure that emerging reliability challenges are identified and addressed in work plans.
Prepare Interconnection‐wide power flow and stability base cases and conduct studies
to address key reliability challenges facing the Interconnection. Use base cases and
power flow capabilities to study emerging issues (e.g., frequency response) and system
vulnerabilities.
Section A — 2018 Business Plan and Budget – Statutory Programs Reliability Assessment and Performance Analysis
2018 WECC Business Plan and Budget
Approved by Board of Directors: June 21, 2017 24
Provide technical oversight, insight, and guidance to analyze frequency response trends
and recommend any actions to minimize reliability risks and/or improve modeling
capabilities.
Complete and publish the first Anchor Data Set (a common assumption year‐10 power
flow and production cost model).
Facilitate dynamic model development.
Perform an analysis of short‐circuit modeling practices in the Western Interconnection
and coordinate with the Short‐circuit Modeling Work Group to determine appropriate
next steps for developing Interconnection‐wide short‐circuit models.
Develop and maintain a database for production cost and capital cost models and
conduct system adequacy analyses to meet the needs of NERC, WECC and stakeholders.
Enhance probabilistic‐based planning and analysis tools and capabilities.
Conduct reliability assessments evaluating the adequacy and security of the system in
the planning horizon, including supporting the NERC Long‐Term Reliability Assessment
and incorporated probabilistic assessment, Summer Reliability Assessment and Winter
Reliability Assessment.
Complete an assessment of the adequacy, security, and risks associated with natural gas
infrastructure and its ability to reliably meet the evolving Bulk Electric System needs.
Conduct special reliability assessments as needed or requested by NERC for low
probability/high impact events such as geomagnetic disturbances or prolonged
droughts.
Use data from actual system disturbances to validate power flow and stability base‐case
models and to identify near‐misses.
Publish WECC Transmission Maps of the existing and planned system.
Oversee and facilitate the Project Coordination and Project Rating Review Process.
Process BES Definition exception requests.
Verify and submit NERC Transmission Availability Data System (TADS), Generator
Availability Data System (GADS), Demand‐Response Availability Data System (DADS) and
Misoperations Information Data Analysis System (MIDAS) filings.
Analyze trends and patterns in historical system performance, resource and load
composition, and publish in reports such as the annual State of the Interconnection
report.
Assess Interconnection performance through site visits or short surveys regarding key
operational practices to identify and share best practices and potential risks to
Interconnection‐wide reliability.
Evaluate historical system performance trends to identify reliability risk metrics, key
indicators, and potential improvement strategies. Work with WECC technical
committees to engage in proactive reliability improvement activities.
Section A — 2018 Business Plan and Budget – Statutory Programs Reliability Assessment and Performance Analysis
2018 WECC Business Plan and Budget
Approved by Board of Directors: June 21, 2017 25
Complete Event Analysis reports and develop Lessons Learned to support a high level of
reliability within the BES while minimizing the possibility of major significant events and
preventing reoccurrence of similar type events.
Update and enhance the Reliability Risk Assessment to prospectively identify key risks to
the Western Interconnection.
Develop Reliability Guidelines, technical white papers and reports, and reference
documents to address emerging issues, operational risks and industry concerns related
to system operations.
Ensure the Western Interconnection is represented in reliability matters by participating
in various NERC committees, WECC committees and industry forums.
Add two positions (2 FTEs)—a Project Coordinator and a Project Manager—to help plan,
execute, and close out internal and consulting projects to free up engineering talent and
enable engineers to focus on the more technical requirements of their roles.
Resource Requirements/Explanation of Significant Changes
Personnel Expenses
Personnel Expenses increase by a net of $535,000 primarily due to the addition of a
Project Coordinator and a Project Manager. The increase also relates to continued
refinement of the labor float rate based on actual turnover and vacancy rates and a 3
percent average merit increase.
Meeting Expenses
Meeting Expenses increase by $14,000 due to the addition of the Power Flow Work
Group, Generator Operator Work Group, and Unscheduled Flow Administration
Subcommittee.
Travel Expenses decrease by $12,000 due to a reduction in onsite reliability
assessments.
Conference Calls decrease by $35,000 due to moving the conference call budget to
General and Administrative.
Operating Expenses
Consultants and Contracts decrease by a net of $351,000 due to the completion of one‐
time 2017 projects, including RAS modeling enhancements and the addition of 2018
one‐time projects, including $750,000 for a Gas/Electric Interdependence Study.
Office Costs decrease by $58,000 primarily due to the elimination of license fees for
NatureServe’s wildlife database.
Fixed Assets
No significant changes.
See Section B – Supplemental Financial Information for explanations of other variances
between the 2017 and 2018 budgets.
Section A — 2018 Business Plan and Budget – Statutory Programs Reliability Assessment and Performance Analysis
2018 WECC Business Plan and Budget
Approved by Board of Directors: June 21, 2017 26
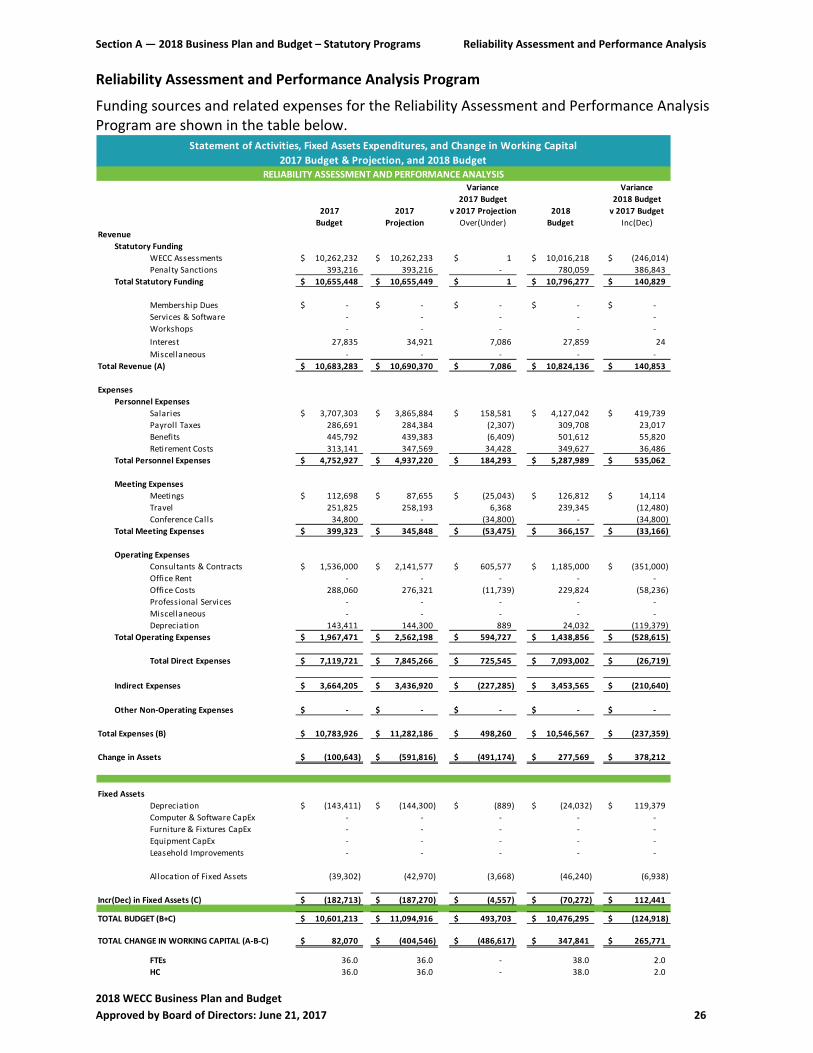
Reliability Assessment and Performance Analysis Program
Funding sources and related expenses for the Reliability Assessment and Performance Analysis Program are shown in the table below.
Variance Variance
2017 Budget 2018 Budget
2017 2017 v 2017 Projection 2018 v 2017 Budget
Budget Projection Over(Under) Budget Inc(Dec)
Revenue
Statutory Funding
WECC Assessments 10,262,232$ 10,262,233$ 1$ 10,016,218$ (246,014)$
Penalty Sanctions 393,216 393,216 ‐ 780,059 386,843
Total Statutory Funding 10,655,448$ 10,655,449$ 1$ 10,796,277$ 140,829$
Membership Dues ‐$ ‐$ ‐$ ‐$ ‐$
Services & Software ‐ ‐ ‐ ‐ ‐
Workshops ‐ ‐ ‐ ‐ ‐
Interest 27,835 34,921 7,086 27,859 24
Miscellaneous ‐ ‐ ‐ ‐ ‐
Total Revenue (A) 10,683,283$ 10,690,370$ 7,086$ 10,824,136$ 140,853$
Expenses
Personnel Expenses
Salaries 3,707,303$ 3,865,884$ 158,581$ 4,127,042$ 419,739$
Payroll Taxes 286,691 284,384 (2,307) 309,708 23,017
Benefits 445,792 439,383 (6,409) 501,612 55,820
Retirement Costs 313,141 347,569 34,428 349,627 36,486
Total Personnel Expenses 4,752,927$ 4,937,220$ 184,293$ 5,287,989$ 535,062$
Meeting Expenses
Meetings 112,698$ 87,655$ (25,043)$ 126,812$ 14,114$
Travel 251,825 258,193 6,368 239,345 (12,480)
Conference Calls 34,800 ‐ (34,800) ‐ (34,800)
Total Meeting Expenses 399,323$ 345,848$ (53,475)$ 366,157$ (33,166)$
Operating Expenses
Consultants & Contracts 1,536,000$ 2,141,577$ 605,577$ 1,185,000$ (351,000)$
Office Rent ‐ ‐ ‐ ‐ ‐
Office Costs 288,060 276,321 (11,739) 229,824 (58,236)
Professional Services ‐ ‐ ‐ ‐ ‐
Miscellaneous ‐ ‐ ‐ ‐ ‐
Depreciation 143,411 144,300 889 24,032 (119,379)
Total Operating Expenses 1,967,471$ 2,562,198$ 594,727$ 1,438,856$ (528,615)$
Total Direct Expenses 7,119,721$ 7,845,266$ 725,545$ 7,093,002$ (26,719)$
Indirect Expenses 3,664,205$ 3,436,920$ (227,285)$ 3,453,565$ (210,640)$
Other Non‐Operating Expenses ‐$ ‐$ ‐$ ‐$ ‐$
Total Expenses (B) 10,783,926$ 11,282,186$ 498,260$ 10,546,567$ (237,359)$
Change in Assets (100,643)$ (591,816)$ (491,174)$ 277,569$ 378,212$
Fixed Assets
Depreciation (143,411)$ (144,300)$ (889)$ (24,032)$ 119,379$
Computer & Software CapEx ‐ ‐ ‐ ‐ ‐
Furniture & Fixtures CapEx ‐ ‐ ‐ ‐ ‐
Equipment CapEx ‐ ‐ ‐ ‐ ‐
Leasehold Improvements ‐ ‐ ‐ ‐ ‐
Allocation of Fixed Assets (39,302) (42,970) (3,668) (46,240) (6,938)
Incr(Dec) in Fixed Assets (C) (182,713)$ (187,270)$ (4,557)$ (70,272)$ 112,441$
TOTAL BUDGET (B+C) 10,601,213$ 11,094,916$ 493,703$ 10,476,295$ (124,918)$
TOTAL CHANGE IN WORKING CAPITAL (A‐B‐C) 82,070$ (404,546)$ (486,617)$ 347,841$ 265,771$
FTEs 36.0 36.0 ‐ 38.0 2.0
HC 36.0 36.0 ‐ 38.0 2.0
Statement of Activities, Fixed Assets Expenditures, and Change in Working Capital
2017 Budget & Projection, and 2018 Budget
RELIABILITY ASSESSMENT AND PERFORMANCE ANALYSIS
Section A — 2018 Business Plan and Budget – Statutory Programs Training, Education, and Stakeholder Outreach
2018 WECC Business Plan and Budget
Approved by Board of Directors: June 21, 2017 27
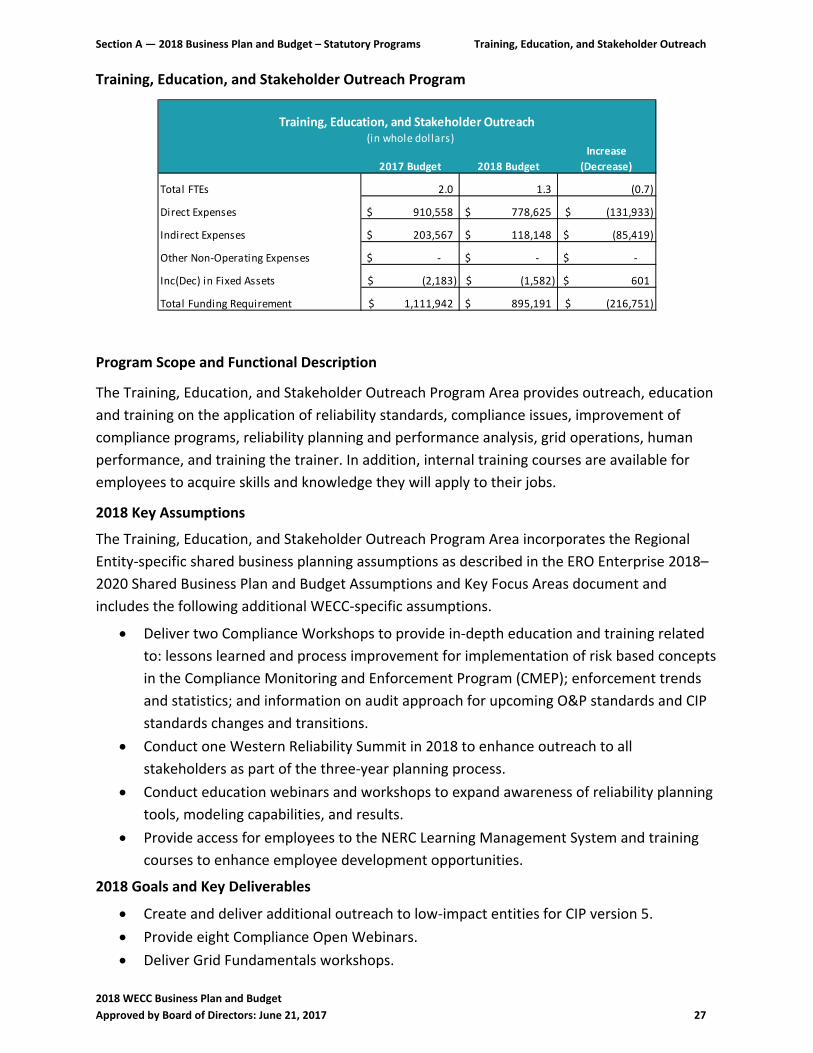
Training, Education, and Stakeholder Outreach Program
2017 Budget 2018 Budget
Increase
(Decrease)
Total FTEs 2.0 1.3 (0.7)
Direct Expenses 910,558$ 778,625$ (131,933)$
Indirect Expenses 203,567$ 118,148$ (85,419)$
Other Non‐Operating Expenses ‐$ ‐$ ‐$
Inc(Dec) in Fixed Assets (2,183)$ (1,582)$ 601$
Total Funding Requirement 1,111,942$ 895,191$ (216,751)$
Training, Education, and Stakeholder Outreach (in whole dollars)
Program Scope and Functional Description
The Training, Education, and Stakeholder Outreach Program Area provides outreach, education
and training on the application of reliability standards, compliance issues, improvement of
compliance programs, reliability planning and performance analysis, grid operations, human
performance, and training the trainer. In addition, internal training courses are available for
employees to acquire skills and knowledge they will apply to their jobs.
2018 Key Assumptions
The Training, Education, and Stakeholder Outreach Program Area incorporates the Regional
Entity‐specific shared business planning assumptions as described in the ERO Enterprise 2018–
2020 Shared Business Plan and Budget Assumptions and Key Focus Areas document and
includes the following additional WECC‐specific assumptions.
Deliver two Compliance Workshops to provide in‐depth education and training related
to: lessons learned and process improvement for implementation of risk based concepts
in the Compliance Monitoring and Enforcement Program (CMEP); enforcement trends
and statistics; and information on audit approach for upcoming O&P standards and CIP
standards changes and transitions.
Conduct one Western Reliability Summit in 2018 to enhance outreach to all
stakeholders as part of the three‐year planning process.
Conduct education webinars and workshops to expand awareness of reliability planning
tools, modeling capabilities, and results.
Provide access for employees to the NERC Learning Management System and training
courses to enhance employee development opportunities.
2018 Goals and Key Deliverables
Create and deliver additional outreach to low‐impact entities for CIP version 5.
Provide eight Compliance Open Webinars.
Deliver Grid Fundamentals workshops.
Section A — 2018 Business Plan and Budget – Statutory Programs Training, Education, and Stakeholder Outreach
2018 WECC Business Plan and Budget
Approved by Board of Directors: June 21, 2017 28
Deliver Train‐the‐Trainer workshop.
Create and deliver Human Performance Work Group conference.
Deliver Compliance Workshops.
Host a third Western Reliability Summit to gather input to identify and analyze risks and
challenges to the reliability of the BES.
Create and deliver educational outreach in the form of webinars and workshops
regarding reliability planning tools, modeling capabilities—including base‐case and
common‐case studies; contingency studies and analysis, RAC studies, scenario planning
and regulatory issues and trends, and events analysis.
Provide access for all employees to the NERC Learning Management System and
develop learning plans for employee training using computer‐based training modules
and classroom training.
Resource Requirements/Explanation of Significant Changes
Personnel Expenses
Personnel Expenses decrease by a net of $164,000 due to the transfer of 0.7 FTE to
Corporate Services to more appropriately align costs with scope of work based on the
2017 reorganization.
Meeting Expenses
Meetings increase by a net of $44,000 primarily due to an anticipated increase in
conference facility and banquet charges for compliance workshops; total revenue from
registration fees offsets the total meeting expenses.
Travel Expenses decrease by $10,000 due to a reduction in offsite classes and
workshops.
Conference Calls decrease by $6,000 due to moving the conference call budget to
General and Administrative.
Operating Expenses
No significant changes.
Fixed Assets
No significant changes.
See Section B – Supplemental Financial Information for explanations of other variances
between the 2017 and 2018 budgets.
Section A — 2018 Business Plan and Budget – Statutory Programs Training, Education, and Stakeholder Outreach
2018 WECC Business Plan and Budget
Approved by Board of Directors: June 21, 2017 29
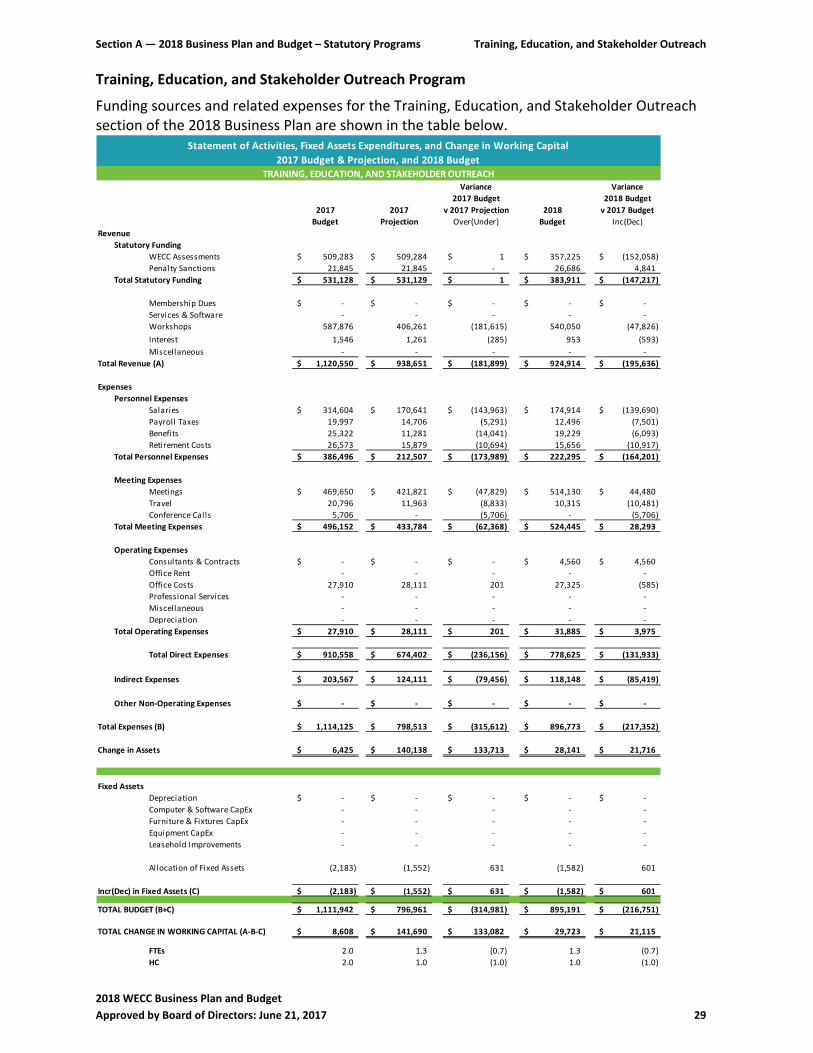
Training, Education, and Stakeholder Outreach Program
Funding sources and related expenses for the Training, Education, and Stakeholder Outreach section of the 2018 Business Plan are shown in the table below.
Variance Variance
2017 Budget 2018 Budget
2017 2017 v 2017 Projection 2018 v 2017 Budget
Budget Projection Over(Under) Budget Inc(Dec)
Revenue
Statutory Funding
WECC Assessments 509,283$ 509,284$ 1$ 357,225$ (152,058)$
Penalty Sanctions 21,845 21,845 ‐ 26,686 4,841
Total Statutory Funding 531,128$ 531,129$ 1$ 383,911$ (147,217)$
Membership Dues ‐$ ‐$ ‐$ ‐$ ‐$
Services & Software ‐ ‐ ‐ ‐ ‐
Workshops 587,876 406,261 (181,615) 540,050 (47,826)
Interest 1,546 1,261 (285) 953 (593)
Miscellaneous ‐ ‐ ‐ ‐ ‐
Total Revenue (A) 1,120,550$ 938,651$ (181,899)$ 924,914$ (195,636)$
Expenses
Personnel Expenses
Salaries 314,604$ 170,641$ (143,963)$ 174,914$ (139,690)$
Payroll Taxes 19,997 14,706 (5,291) 12,496 (7,501)
Benefits 25,322 11,281 (14,041) 19,229 (6,093)
Retirement Costs 26,573 15,879 (10,694) 15,656 (10,917)
Total Personnel Expenses 386,496$ 212,507$ (173,989)$ 222,295$ (164,201)$
Meeting Expenses
Meetings 469,650$ 421,821$ (47,829)$ 514,130$ 44,480$
Travel 20,796 11,963 (8,833) 10,315 (10,481)
Conference Calls 5,706 ‐ (5,706) ‐ (5,706)
Total Meeting Expenses 496,152$ 433,784$ (62,368)$ 524,445$ 28,293$
Operating Expenses
Consultants & Contracts ‐$ ‐$ ‐$ 4,560$ 4,560$
Office Rent ‐ ‐ ‐ ‐ ‐
Office Costs 27,910 28,111 201 27,325 (585)
Professional Services ‐ ‐ ‐ ‐ ‐
Miscellaneous ‐ ‐ ‐ ‐ ‐
Depreciation ‐ ‐ ‐ ‐ ‐
Total Operating Expenses 27,910$ 28,111$ 201$ 31,885$ 3,975$
Total Direct Expenses 910,558$ 674,402$ (236,156)$ 778,625$ (131,933)$
Indirect Expenses 203,567$ 124,111$ (79,456)$ 118,148$ (85,419)$
Other Non‐Operating Expenses ‐$ ‐$ ‐$ ‐$ ‐$
Total Expenses (B) 1,114,125$ 798,513$ (315,612)$ 896,773$ (217,352)$
Change in Assets 6,425$ 140,138$ 133,713$ 28,141$ 21,716$
Fixed Assets
Depreciation ‐$ ‐$ ‐$ ‐$ ‐$
Computer & Software CapEx ‐ ‐ ‐ ‐ ‐
Furniture & Fixtures CapEx ‐ ‐ ‐ ‐ ‐
Equipment CapEx ‐ ‐ ‐ ‐ ‐
Leasehold Improvements ‐ ‐ ‐ ‐ ‐
Allocation of Fixed Assets (2,183) (1,552) 631 (1,582) 601
Incr(Dec) in Fixed Assets (C) (2,183)$ (1,552)$ 631$ (1,582)$ 601$
TOTAL BUDGET (B+C) 1,111,942$ 796,961$ (314,981)$ 895,191$ (216,751)$
TOTAL CHANGE IN WORKING CAPITAL (A‐B‐C) 8,608$ 141,690$ 133,082$ 29,723$ 21,115$
FTEs 2.0 1.3 (0.7) 1.3 (0.7)
HC 2.0 1.0 (1.0) 1.0 (1.0)
Statement of Activities, Fixed Assets Expenditures, and Change in Working Capital
2017 Budget & Projection, and 2018 Budget
TRAINING, EDUCATION, AND STAKEHOLDER OUTREACH
Section A — 2018 Business Plan and Budget – Statutory Programs Situation Awareness and Infrastructure Security
2018 WECC Business Plan and Budget
Approved by Board of Directors: June 21, 2017 30
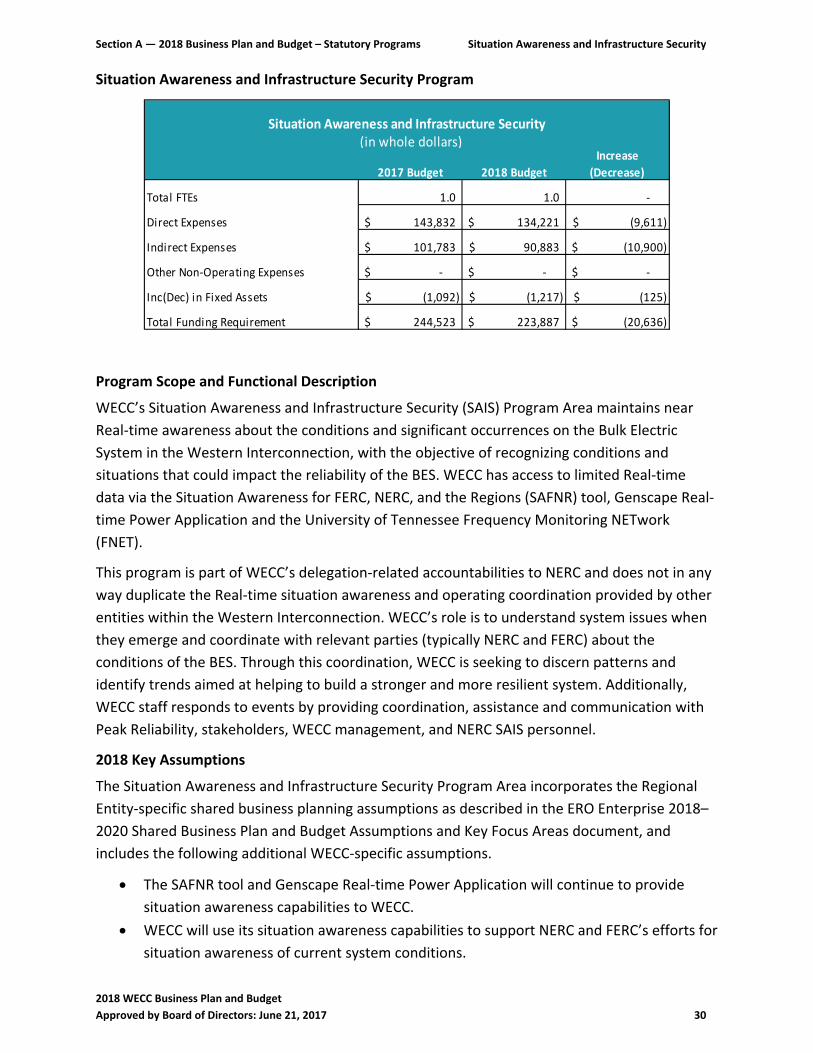
Situation Awareness and Infrastructure Security Program
2017 Budget 2018 Budget
Increase
(Decrease)
Total FTEs 1.0 1.0 ‐
Direct Expenses 143,832$ 134,221$ (9,611)$
Indirect Expenses 101,783$ 90,883$ (10,900)$
Other Non‐Operating Expenses ‐$ ‐$ ‐$
Inc(Dec) in Fixed Assets (1,092)$ (1,217)$ (125)$
Total Funding Requirement 244,523$ 223,887$ (20,636)$
Situation Awareness and Infrastructure Security (in whole dollars)
Program Scope and Functional Description
WECC’s Situation Awareness and Infrastructure Security (SAIS) Program Area maintains near
Real‐time awareness about the conditions and significant occurrences on the Bulk Electric
System in the Western Interconnection, with the objective of recognizing conditions and
situations that could impact the reliability of the BES. WECC has access to limited Real‐time
data via the Situation Awareness for FERC, NERC, and the Regions (SAFNR) tool, Genscape Real‐
time Power Application and the University of Tennessee Frequency Monitoring NETwork
(FNET).
This program is part of WECC’s delegation‐related accountabilities to NERC and does not in any
way duplicate the Real‐time situation awareness and operating coordination provided by other
entities within the Western Interconnection. WECC’s role is to understand system issues when
they emerge and coordinate with relevant parties (typically NERC and FERC) about the
conditions of the BES. Through this coordination, WECC is seeking to discern patterns and
identify trends aimed at helping to build a stronger and more resilient system. Additionally,
WECC staff responds to events by providing coordination, assistance and communication with
Peak Reliability, stakeholders, WECC management, and NERC SAIS personnel.
2018 Key Assumptions
The Situation Awareness and Infrastructure Security Program Area incorporates the Regional
Entity‐specific shared business planning assumptions as described in the ERO Enterprise 2018–
2020 Shared Business Plan and Budget Assumptions and Key Focus Areas document, and
includes the following additional WECC‐specific assumptions.
The SAFNR tool and Genscape Real‐time Power Application will continue to provide
situation awareness capabilities to WECC.
WECC will use its situation awareness capabilities to support NERC and FERC’s efforts for
situation awareness of current system conditions.
Section A — 2018 Business Plan and Budget – Statutory Programs Situation Awareness and Infrastructure Security
2018 WECC Business Plan and Budget
Approved by Board of Directors: June 21, 2017 31
WECC will continue working with stakeholders, government agencies, NERC and the
Electricity Information Sharing and Analysis Center (E‐ISAC) to ensure appropriate event
information is being disseminated to industry in a timely manner.
WECC will maximize sharing of operating and system data (within agreed parameters),
and insights from Events Analysis, including near‐misses, to optimize understanding of
reliability issues, promote operational excellence, share best practices/lessons learned
in a timely manner, and engage third‐party experts to expand capabilities and resources
applied to critical reliability issues.
WECC will collaborate with specific stakeholder groups in the development of lessons
learned and recommendations from events and identified risks.
There is not any duplication of effort between WECC and Peak Reliability.
2018 Goals and Key Deliverables
WECC SAIS staff will monitor system events, collect information, and coordinate the
distribution of timely updates on system events to WECC management, industry
stakeholders, and NERC SAIS personnel.
Staff will continue to work with NERC to monitor system data, weather, and
technological developments to understand trends that affect reliability for the near‐ and
long‐term horizons.
Staff will participate on daily NERC SAIS calls to coordinate, report, and receive any
critical information.
Staff will keep stakeholders informed of emerging reliability threats and risks to the BES,
including any expected actions.
Staff will continue to work and support efforts to develop and enhance ways to improve
the use of SAFNR and Genscape Real‐time Power Application data to further support
SAIS.
Staff will ensure the Western Interconnection is represented in reliability matters by
participating in various NERC committees and industry forums.
WECC staff will participate as appropriate in periodic wide‐area security exercises
(e.g., GridEx, Monitoring and Situation Awareness Workshop, NERC Human
Performance Conference).
Staff will enhance risk analysis capabilities through increased analysis of risk data
sources such as event analysis reports, TADS, GADS, and protection system
misoperations.
Staff will identify key vulnerability issues and work with stakeholders to address them
(e.g., physical and cyber security, situation awareness and coordination across
neighboring systems, human performance, equipment misoperations/failures).
Staff will ensure support for critical infrastructure security by promoting rapid and
appropriate sharing of situation awareness information regarding security occurrences.
Section A — 2018 Business Plan and Budget – Statutory Programs Situation Awareness and Infrastructure Security
2018 WECC Business Plan and Budget
Approved by Board of Directors: June 21, 2017 32
Resource Requirements/Explanation of Significant Changes
Personnel Expenses
No significant changes.
Meeting Expenses
No significant changes.
Operating Expenses
No significant changes.
Fixed Assets
No significant changes.
See Section B – Supplemental Financial Information for explanations of other variances
between the 2017 and 2018 budgets.
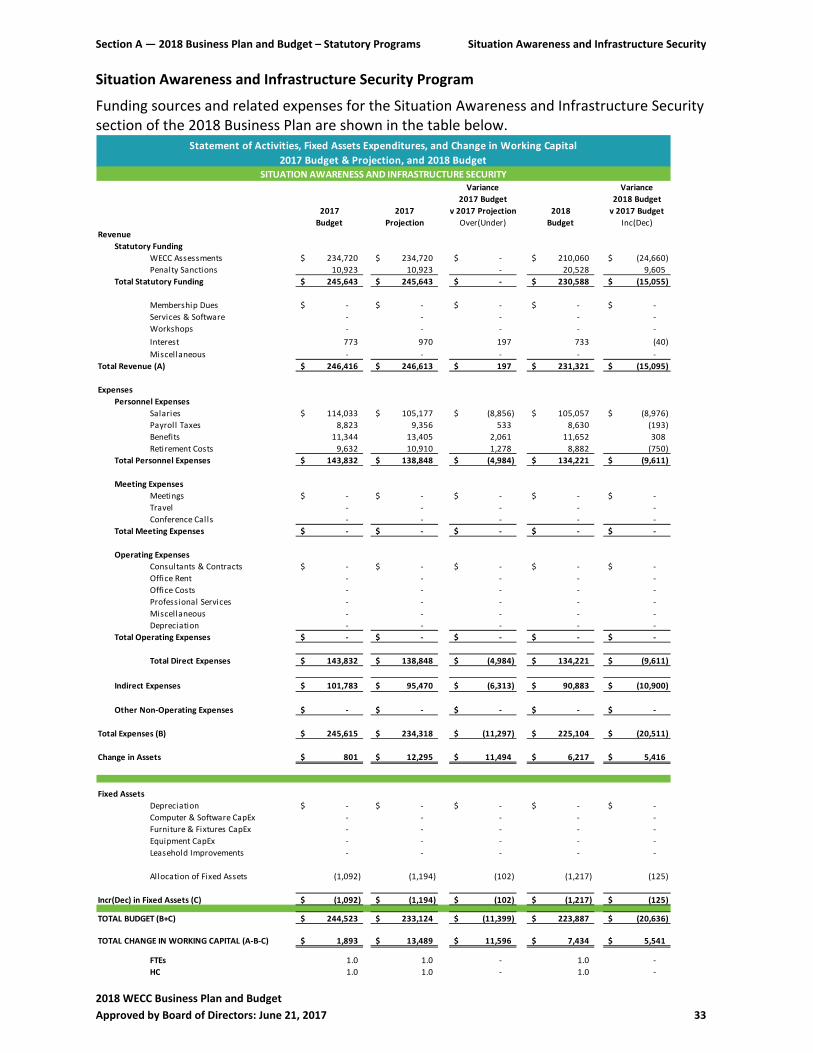
Section A — 2018 Business Plan and Budget – Statutory Programs Situation Awareness and Infrastructure Security
2018 WECC Business Plan and Budget
Approved by Board of Directors: June 21, 2017 33
Situation Awareness and Infrastructure Security Program
Funding sources and related expenses for the Situation Awareness and Infrastructure Security section of the 2018 Business Plan are shown in the table below.
Variance Variance
2017 Budget 2018 Budget
2017 2017 v 2017 Projection 2018 v 2017 Budget
Budget Projection Over(Under) Budget Inc(Dec)
Revenue
Statutory Funding
WECC Assessments 234,720$ 234,720$ ‐$ 210,060$ (24,660)$
Penalty Sanctions 10,923 10,923 ‐ 20,528 9,605
Total Statutory Funding 245,643$ 245,643$ ‐$ 230,588$ (15,055)$
Membership Dues ‐$ ‐$ ‐$ ‐$ ‐$
Services & Software ‐ ‐ ‐ ‐ ‐
Workshops ‐ ‐ ‐ ‐ ‐
Interest 773 970 197 733 (40)
Miscellaneous ‐ ‐ ‐ ‐ ‐
Total Revenue (A) 246,416$ 246,613$ 197$ 231,321$ (15,095)$
Expenses
Personnel Expenses
Salaries 114,033$ 105,177$ (8,856)$ 105,057$ (8,976)$
Payroll Taxes 8,823 9,356 533 8,630 (193)
Benefits 11,344 13,405 2,061 11,652 308
Retirement Costs 9,632 10,910 1,278 8,882 (750)
Total Personnel Expenses 143,832$ 138,848$ (4,984)$ 134,221$ (9,611)$
Meeting Expenses
Meetings ‐$ ‐$ ‐$ ‐$ ‐$
Travel ‐ ‐ ‐ ‐ ‐
Conference Calls ‐ ‐ ‐ ‐ ‐
Total Meeting Expenses ‐$ ‐$ ‐$ ‐$ ‐$
Operating Expenses
Consultants & Contracts ‐$ ‐$ ‐$ ‐$ ‐$
Office Rent ‐ ‐ ‐ ‐ ‐
Office Costs ‐ ‐ ‐ ‐ ‐
Professional Services ‐ ‐ ‐ ‐ ‐
Miscellaneous ‐ ‐ ‐ ‐ ‐
Depreciation ‐ ‐ ‐ ‐ ‐
Total Operating Expenses ‐$ ‐$ ‐$ ‐$ ‐$
Total Direct Expenses 143,832$ 138,848$ (4,984)$ 134,221$ (9,611)$
Indirect Expenses 101,783$ 95,470$ (6,313)$ 90,883$ (10,900)$
Other Non‐Operating Expenses ‐$ ‐$ ‐$ ‐$ ‐$
Total Expenses (B) 245,615$ 234,318$ (11,297)$ 225,104$ (20,511)$
Change in Assets 801$ 12,295$ 11,494$ 6,217$ 5,416$
Fixed Assets
Depreciation ‐$ ‐$ ‐$ ‐$ ‐$
Computer & Software CapEx ‐ ‐ ‐ ‐ ‐
Furniture & Fixtures CapEx ‐ ‐ ‐ ‐ ‐
Equipment CapEx ‐ ‐ ‐ ‐ ‐
Leasehold Improvements ‐ ‐ ‐ ‐ ‐
Allocation of Fixed Assets (1,092) (1,194) (102) (1,217) (125)
Incr(Dec) in Fixed Assets (C) (1,092)$ (1,194)$ (102)$ (1,217)$ (125)$
TOTAL BUDGET (B+C) 244,523$ 233,124$ (11,399)$ 223,887$ (20,636)$
TOTAL CHANGE IN WORKING CAPITAL (A‐B‐C) 1,893$ 13,489$ 11,596$ 7,434$ 5,541$
FTEs 1.0 1.0 ‐ 1.0 ‐
HC 1.0 1.0 ‐ 1.0 ‐
Statement of Activities, Fixed Assets Expenditures, and Change in Working Capital
2017 Budget & Projection, and 2018 Budget
SITUATION AWARENESS AND INFRASTRUCTURE SECURITY
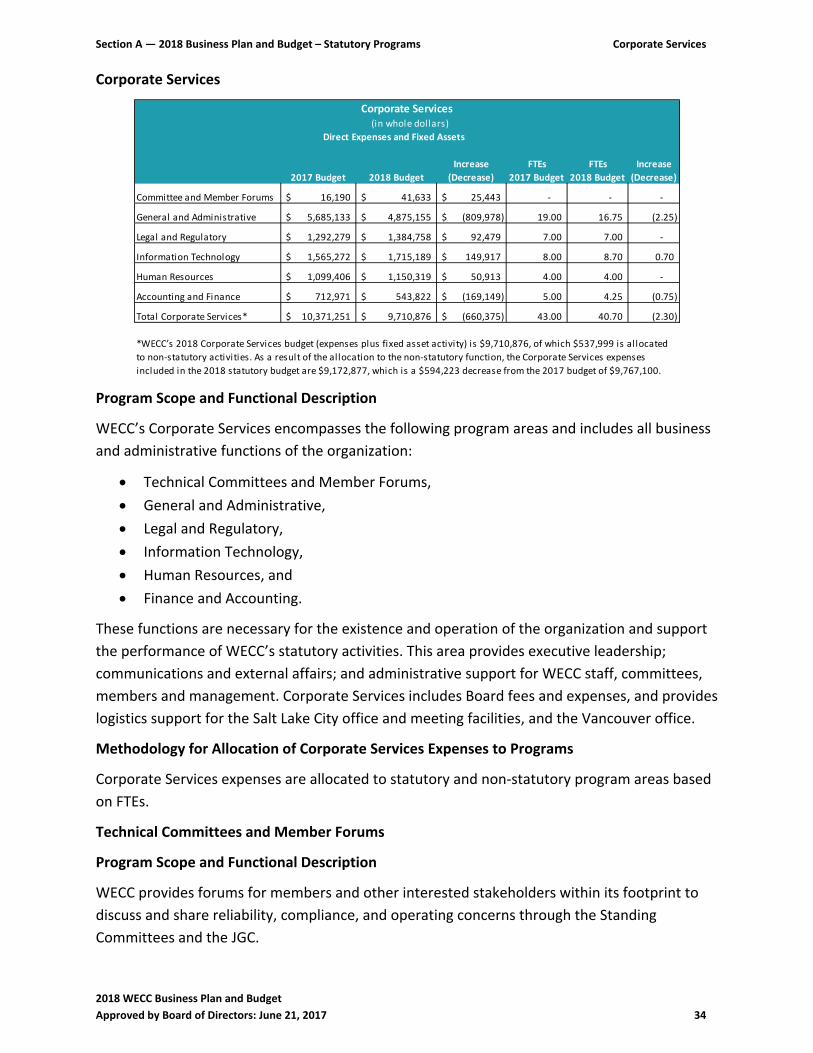
Section A — 2018 Business Plan and Budget – Statutory Programs Corporate Services
2018 WECC Business Plan and Budget
Approved by Board of Directors: June 21, 2017 34
Corporate Services
2017 Budget 2018 Budget
Increase
(Decrease)
FTEs
2017 Budget
FTEs
2018 Budget
Increase
(Decrease)
Committee and Member Forums 16,190$ 41,633$ 25,443$ ‐ ‐ ‐
General and Administrative 5,685,133$ 4,875,155$ (809,978)$ 19.00 16.75 (2.25)
Legal and Regulatory 1,292,279$ 1,384,758$ 92,479$ 7.00 7.00 ‐
Information Technology 1,565,272$ 1,715,189$ 149,917$ 8.00 8.70 0.70
Human Resources 1,099,406$ 1,150,319$ 50,913$ 4.00 4.00 ‐
Accounting and Finance 712,971$ 543,822$ (169,149)$ 5.00 4.25 (0.75)
Total Corporate Services* 10,371,251$ 9,710,876$ (660,375)$ 43.00 40.70 (2.30)
Corporate Services (in whole dollars)
Direct Expenses and Fixed Assets
*WECC’s 2018 Corporate Services budget (expenses plus fixed asset activity) is $9,710,876, of which $537,999 is allocated
to non‐statutory activities. As a result of the allocation to the non‐statutory function, the Corporate Services expenses
included in the 2018 statutory budget are $9,172,877, which is a $594,223 decrease from the 2017 budget of $9,767,100.
Program Scope and Functional Description
WECC’s Corporate Services encompasses the following program areas and includes all business
and administrative functions of the organization:
Technical Committees and Member Forums,
General and Administrative,
Legal and Regulatory,
Information Technology,
Human Resources, and
Finance and Accounting.
These functions are necessary for the existence and operation of the organization and support
the performance of WECC’s statutory activities. This area provides executive leadership;
communications and external affairs; and administrative support for WECC staff, committees,
members and management. Corporate Services includes Board fees and expenses, and provides
logistics support for the Salt Lake City office and meeting facilities, and the Vancouver office.
Methodology for Allocation of Corporate Services Expenses to Programs
Corporate Services expenses are allocated to statutory and non‐statutory program areas based
on FTEs.
Technical Committees and Member Forums
Program Scope and Functional Description
WECC provides forums for members and other interested stakeholders within its footprint to
discuss and share reliability, compliance, and operating concerns through the Standing
Committees and the JGC.
Section A — 2018 Business Plan and Budget – Statutory Programs Corporate Services
2018 WECC Business Plan and Budget
Approved by Board of Directors: June 21, 2017 35
2018 Key Assumptions
The Standing Committees (OC, MIC, and potentially RAC) meet three times each year. In
2018, one Standing Committee meeting will be held offsite and the other two meetings
will be held in Salt Lake City.
Resource Requirements/Explanation of Significant Changes
Personnel Expenses
No significant changes.
Meeting Expenses
Meeting expenses increase by a net of $25,000 due to an offsite Standing Committee
meeting.
Operating Expenses
No significant changes.
Fixed Assets
No significant changes.
Section A — 2018 Business Plan and Budget – Statutory Programs Corporate Services
2018 WECC Business Plan and Budget
Approved by Board of Directors: June 21, 2017 36
General and Administrative
Program Scope and Functional Description
The General and Administrative Department provides executive leadership; communications;
and administrative support for WECC staff, committees, members, and management as well as
logistics support of the Salt Lake City office and meeting facilities. In addition, indirect costs
such as Office Rent that benefit multiple functional areas are accounted for in this budget.
2018 Key Assumptions
Two positions are transferred to Compliance Monitoring and Enforcement and are fully
dedicated to Registration.
One position is transferred to IT as a data analyst.
One Executive is transferred to Compliance Monitoring and Enforcement.
0.7 FTE is transferred from Training, Education and Outreach based on changes in roles
and responsibilities. This position has joined the Executive Team.
0.3 FTE is transferred from Information Technology based on changes in roles and
responsibilities. This position is now partially responsible for WECC’s stakeholder
services group.
0.75 FTE is transferred from Finance and Accounting based on changes in duties and
responsibilities.
Market adjustment pool, used for equity and performance adjustments is redistributed
to Program Areas.
The same level of meetings and meeting support for the Board of Directors and Board
Committees will carry forward into 2018.
The Annual Meeting will be held in Salt Lake City in 2018.
Board members will be compensated for meeting participation in accordance with the
revised Board compensation structure.
2018 Goals and Deliverables
Provide excellent executive leadership and strong strategic guidance for the activities
undertaken by WECC and ensure that WECC contributes positively to the ERO‐
Enterprise’s activities.
Support and coordinate the logistics for the Board of Directors and Board Committees.
Continue to enhance the meetings team and stakeholder services groups to drive
efficiencies and effective services throughout WECC.
Continue to enhance the external relations and outreach programs.
Resource Requirements/Explanation of Significant Changes
Personnel Expenses
Personnel expenses decrease by a net of $607,000 primarily due to the transfer of 3.0
FTE to Compliance, 0.7 FTE to Information Technology, 0.7 FTE from Training, Education,
and Stakeholder Outreach and 0.75 FTE from Finance and Accounting from the 2017
Section A — 2018 Business Plan and Budget – Statutory Programs Corporate Services
2018 WECC Business Plan and Budget
Approved by Board of Directors: June 21, 2017 37
reorganization to more appropriately align costs with scope of work, continued
refinement of the labor float rate based on actual turnover and vacancy rates, and a
3 percent average merit increase.
Meeting Expenses
Meetings decrease by a net of $49,000 primarily due to an onsite WECC Board of
Directors annual meeting.
Conference Calls increase by $64,000 due to moving the conference call budget to
General and Administrative.
Operating Expenses
Consultants and Contracts decrease by a net of $136,000 primarily due to a reduction in
Board Director search fees.
Equipment Rental decreases by $31,000 due to moving the budget for leased printers to
Information Technology.
Dues, Memberships, and Fees increase by $52,000 due to a new membership in the
National Association of Corporate Directors (NACD).
Professional Services decrease by $51,000 due to new Board Director compensation
structure.
Fixed Assets
No significant changes.
Section A — 2018 Business Plan and Budget – Statutory Programs Corporate Services
2018 WECC Business Plan and Budget
Approved by Board of Directors: June 21, 2017 38
Legal and Regulatory
Program Scope and Functional Description
The Legal and Regulatory Department provides coordinated legal services to the WECC Board,
committees and staff, in addition to consistent legal interpretations of relevant statutes,
regulations, court opinions, and regulatory decisions. The department also develops specific
subject matter expertise to further assist WECC with its legal needs. On occasion, major efforts
may be outsourced to select law firms, but the responsibility for all legal matters remains with
the Legal and Regulatory Department.
WECC’s international operations and its broad scope of activities require significant legal
support and review. Arranging for legal support is complicated by the technical nature of this
developing area of law and there are many potential areas of conflict prohibiting the use of law
firms with energy practices.
2018 Key Assumptions
Maintain the scope of its current operations and ensure that WECC contributes
positively to the ERO‐Enterprise’s activities.
2018 Goals and Deliverables
Provide efficient, cost‐effective legal support to the WECC Board, committees, and staff
through a combination of in‐house and outside resources.
Advise WECC departments on specified legal matters and general matters relating to
WECC business.
Resource Requirements/Explanation of Significant Changes
Personnel Expenses
Personnel Expenses increase by $116,000 primarily due to continued refinement of the
labor float rate based on actual turnover and vacancy rates, and a 3 percent average
merit increase.
Meeting Expenses
No significant changes.
Operating Expenses
Legal Fees decrease by $15,000 due to a reduction in the need for outside legal counsel.
Insurance decreases by $15,000 due to reducing the budget to more accurately reflect
the actual insurance cost.
Fixed Assets
No significant changes.
Section A — 2018 Business Plan and Budget – Statutory Programs Corporate Services
2018 WECC Business Plan and Budget
Approved by Board of Directors: June 21, 2017 39
Information Technology
Program Scope and Functional Description
WECC’s Information Technology (IT) Department provides systems support including: servers,
data, email, telephone systems, and Internet and Intranet website maintenance. In addition, IT
includes development of new technology solutions using both internal staff and working with
external service providers. IT provides resources and tools to enable the organization to meet
the evolving requirements to support activities and responsibilities as directed by NERC and
FERC.
2018 Key Assumptions
The Information Technology Program Area incorporates the Regional Entity‐specific shared
business planning assumptions as described in the ERO Enterprise 2018–2020 Shared Business
Plan and Budget Assumptions and Key Focus Areas document and includes the following
additional WECC‐specific assumptions.
Use consultants as needed instead of maintaining headcount.
Transfer 0.3 FTE to General and Administrative.
Replace personal computer equipment on a four‐year refresh cycle, refresh servers
every five years, and replace network equipment every seven‐to‐10 years.
WECC supports the ERO Enterprise IT Strategy and is committed to working
collaboratively to minimize duplication of effort and investments, and improve
operational efficiency.
2018 Goals and Deliverables
Continue to provide increased data support, analysis, and communication.
Create centralized databases, automated processes, and tools to organize a growing
volume of electronic data that will be in high demand.
Add to WECC’s security capabilities with additional authentication controls and
enhanced threat detection.
Deploy improved document management, business process workflow, and records
retention solutions.
Resource Requirements/Explanation of Significant Changes
Personnel Expenses
Personnel Expenses increase by a net of $78,000 primarily due to the transfer of 0.7 FTE
from General and Administrative and continued refinement of the labor float rate based
on actual turnover and vacancy rates, and a 3 percent average merit increase.
Meeting Expenses
No significant changes.
Section A — 2018 Business Plan and Budget – Statutory Programs Corporate Services
2018 WECC Business Plan and Budget
Approved by Board of Directors: June 21, 2017 40
Operating Expenses
Consulting and Contracts decrease by a net of $10,000 due to the reduced use of
consultants for IT projects.
Equipment Rental increases by $30,000 due to moving the budget for leased printers to
Information Technology.
Expensed Equipment increases by $49,000 due to data storage refresh and computer
equipment upgrades.
Computer Supplies, Maintenance, and Licenses increases by $16,000 due to two‐factor
authentication for increased network security.
Other Services increase by $20,000 for security enhancements for increased network
security.
Fixed Assets
Fixed Assets decrease by a net of $50,000 due to a decrease in blade server expansion
from transitioning to cloud‐based storage and an increase for analytic software.
Section A — 2018 Business Plan and Budget – Statutory Programs Corporate Services
2018 WECC Business Plan and Budget
Approved by Board of Directors: June 21, 2017 41
Human Resources
Program Scope and Functional Description
Human Resources (HR) is responsible for the delivery of all HR functions to WECC, including:
recruitment, staffing, compensation, benefits, safety, health and wellness, employee relations,
performance management, succession planning, and employee training and development. HR
maintains Human Resources‐related databases and ensures compliance with all federal and
state requirements.
2018 Key Assumptions
WECC headcount will increase slightly to ensure the talent and skills are in place to meet
the goals of the organization.
Cost to maintain current benefit levels will increase slightly due to market increases.
WECC will conduct an employee compensation study in 2018.
Training and development levels will increase minimally to ensure gaps in skills are
minimalized.
2018 Goals and Deliverables
Commission a salary survey for non‐executive positions to ensure compensation is
managed within approved philosophy.
Enhance the scope of succession planning, employee development and training, which
are vital to ensuring that WECC maintains a highly skilled, qualified and diverse
workforce.
Manage all employee benefits to deliver an attractive benefit package to employees,
and to attract potential employees, while managing overall costs to the organization.
Resource Requirements/Explanation of Significant Changes
Personnel Expenses
Retirement Costs decrease by a net of $23,000 due to reduced Retirement Plan
Administration expenses.
Meeting Expenses
No significant changes.
Operating Expenses
Consultants increase by a net of $70,000 due to a Human Resources and Compensation
Committee employee compensation study.
Fixed Assets
No significant changes.
Section A — 2018 Business Plan and Budget – Statutory Programs Corporate Services
2018 WECC Business Plan and Budget
Approved by Board of Directors: June 21, 2017 42
Finance and Accounting
Program Scope and Functional Description
The Finance and Accounting Department provides accounting and financial analysis support to
WECC. The department is responsible for accounts payable, billing, accounts receivable,
budgeting, fixed asset management, banking, cash management, payroll, and financial
reporting.
2018 Key Assumptions
One position is converted from senior‐level to staff‐level.
One position is transferred to General and Administrative to reflect new scope of
responsibilities and that FTE is split between the two areas. 0.75 FTE is in General and
Administrative and 0.25 FTE is in Finance and Accounting.
Interest rates remain flat.
2018 Goals and Deliverables
Identify and implement efficiencies in financial processes.
Ensure WECC has effective financial controls.
Provide quality and improved reporting and financial analysis to WECC managers, the
FAC, and the WECC Board.
Resource Requirements/Explanation of Significant Changes
Personnel Expenses
Personnel Expenses decrease by $172,000 primarily due to the transfer of 0.75 FTE to
General and Administrative due to 2017 reorganization and to more appropriately align
costs with scope of work.
Meeting Expenses
No significant changes.
Operating Expenses
Office Costs increase by a net of $3,000 due to an overall increase in bank fees and
reporting costs.
Fixed Assets
No significant changes.
See Section B – Supplemental Financial Information for explanations of other variances
between the 2017 and 2018 budgets.
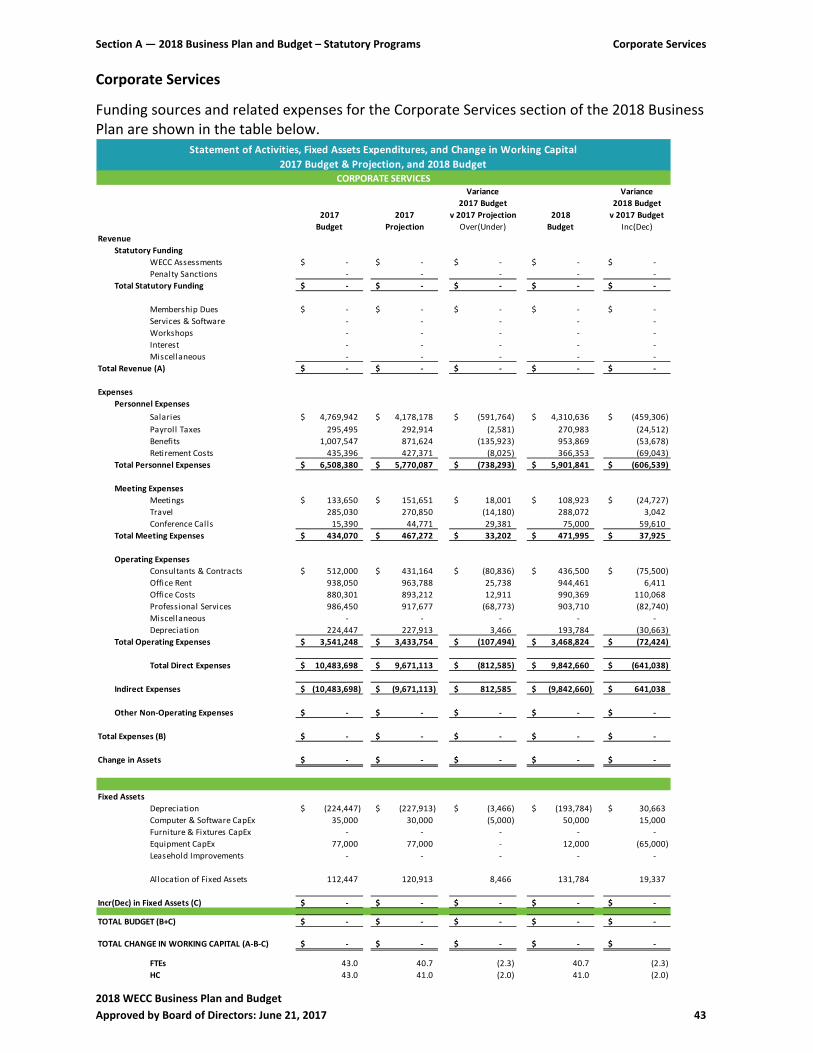
Section A — 2018 Business Plan and Budget – Statutory Programs Corporate Services
2018 WECC Business Plan and Budget
Approved by Board of Directors: June 21, 2017 43
Corporate Services
Funding sources and related expenses for the Corporate Services section of the 2018 Business Plan are shown in the table below.
Variance Variance
2017 Budget 2018 Budget
2017 2017 v 2017 Projection 2018 v 2017 Budget
Budget Projection Over(Under) Budget Inc(Dec)
Revenue
Statutory Funding
WECC Assessments ‐$ ‐$ ‐$ ‐$ ‐$
Penalty Sanctions ‐ ‐ ‐ ‐ ‐
Total Statutory Funding ‐$ ‐$ ‐$ ‐$ ‐$
Membership Dues ‐$ ‐$ ‐$ ‐$ ‐$
Services & Software ‐ ‐ ‐ ‐ ‐
Workshops ‐ ‐ ‐ ‐ ‐
Interest ‐ ‐ ‐ ‐ ‐
Miscellaneous ‐ ‐ ‐ ‐ ‐
Total Revenue (A) ‐$ ‐$ ‐$ ‐$ ‐$
Expenses
Personnel Expenses
Salaries 4,769,942$ 4,178,178$ (591,764)$ 4,310,636$ (459,306)$
Payroll Taxes 295,495 292,914 (2,581) 270,983 (24,512)
Benefits 1,007,547 871,624 (135,923) 953,869 (53,678)
Retirement Costs 435,396 427,371 (8,025) 366,353 (69,043)
Total Personnel Expenses 6,508,380$ 5,770,087$ (738,293)$ 5,901,841$ (606,539)$
Meeting Expenses
Meetings 133,650$ 151,651$ 18,001$ 108,923$ (24,727)$
Travel 285,030 270,850 (14,180) 288,072 3,042
Conference Calls 15,390 44,771 29,381 75,000 59,610
Total Meeting Expenses 434,070$ 467,272$ 33,202$ 471,995$ 37,925$
Operating Expenses
Consultants & Contracts 512,000$ 431,164$ (80,836)$ 436,500$ (75,500)$
Office Rent 938,050 963,788 25,738 944,461 6,411
Office Costs 880,301 893,212 12,911 990,369 110,068
Professional Services 986,450 917,677 (68,773) 903,710 (82,740)
Miscellaneous ‐ ‐ ‐ ‐ ‐
Depreciation 224,447 227,913 3,466 193,784 (30,663)
Total Operating Expenses 3,541,248$ 3,433,754$ (107,494)$ 3,468,824$ (72,424)$
Total Direct Expenses 10,483,698$ 9,671,113$ (812,585)$ 9,842,660$ (641,038)$
Indirect Expenses (10,483,698)$ (9,671,113)$ 812,585$ (9,842,660)$ 641,038$
Other Non‐Operating Expenses ‐$ ‐$ ‐$ ‐$ ‐$
Total Expenses (B) ‐$ ‐$ ‐$ ‐$ ‐$
Change in Assets ‐$ ‐$ ‐$ ‐$ ‐$
Fixed Assets
Depreciation (224,447)$ (227,913)$ (3,466)$ (193,784)$ 30,663$
Computer & Software CapEx 35,000 30,000 (5,000) 50,000 15,000
Furniture & Fixtures CapEx ‐ ‐ ‐ ‐ ‐
Equipment CapEx 77,000 77,000 ‐ 12,000 (65,000)
Leasehold Improvements ‐ ‐ ‐ ‐ ‐
Allocation of Fixed Assets 112,447 120,913 8,466 131,784 19,337
Incr(Dec) in Fixed Assets (C) ‐$ ‐$ ‐$ ‐$ ‐$
TOTAL BUDGET (B+C) ‐$ ‐$ ‐$ ‐$ ‐$
TOTAL CHANGE IN WORKING CAPITAL (A‐B‐C) ‐$ ‐$ ‐$ ‐$ ‐$
FTEs 43.0 40.7 (2.3) 40.7 (2.3)
HC 43.0 41.0 (2.0) 41.0 (2.0)
Statement of Activities, Fixed Assets Expenditures, and Change in Working Capital
2017 Budget & Projection, and 2018 Budget
CORPORATE SERVICES
2018 WECC Business Plan and Budget
Approved by Board of Directors: June 21, 2017 44
Section B
Supplemental Financial Information
2018 Business Plan and Budget
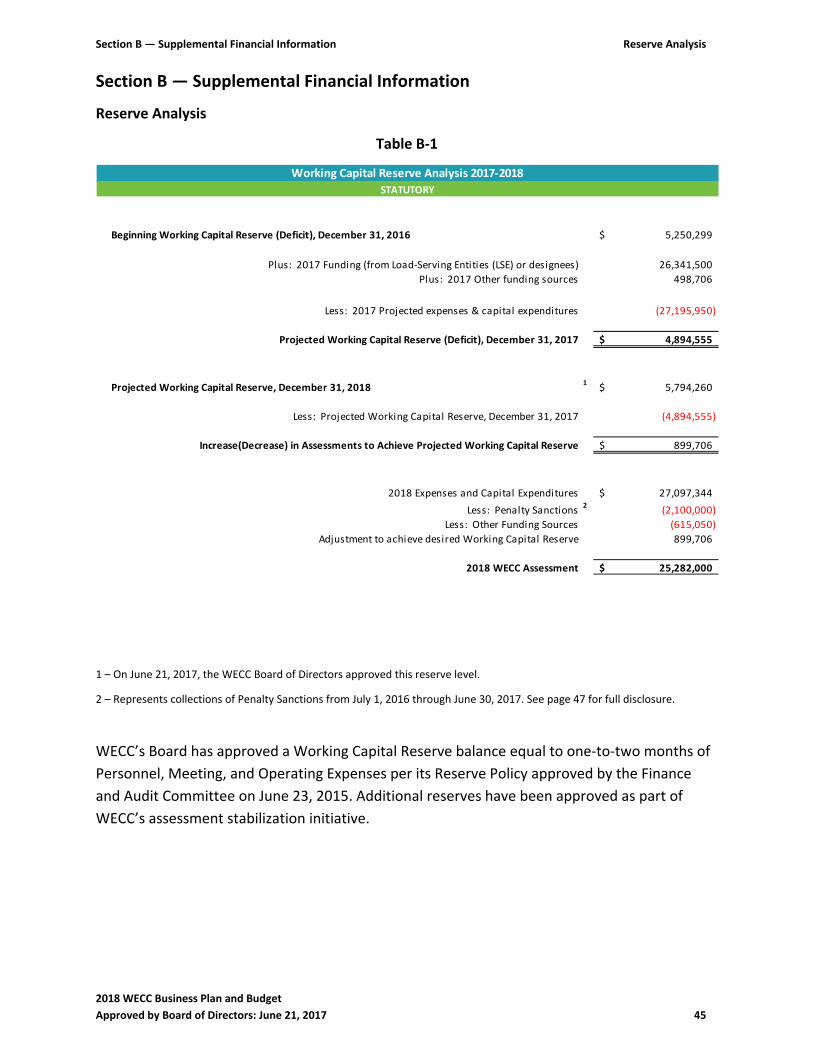
Section B — Supplemental Financial Information Reserve Analysis
2018 WECC Business Plan and Budget
Approved by Board of Directors: June 21, 2017 45
Section B — Supplemental Financial Information
Reserve Analysis
Table B‐1
Beginning Working Capital Reserve (Deficit), December 31, 2016 5,250,299$
Plus: 2017 Funding (from Load‐Serving Entities (LSE) or designees) 26,341,500
Plus: 2017 Other funding sources 498,706
Less: 2017 Projected expenses & capital expenditures (27,195,950)
Projected Working Capital Reserve (Deficit), December 31, 2017 4,894,555$
Projected Working Capital Reserve, December 31, 20181
5,794,260$
Less: Projected Working Capital Reserve, December 31, 2017 (4,894,555)
Increase(Decrease) in Assessments to Achieve Projected Working Capital Reserve 899,706$
2018 Expenses and Capital Expenditures 27,097,344$
Less: Penalty Sanctions2
(2,100,000)
Less: Other Funding Sources (615,050)
Adjustment to achieve desired Working Capital Reserve 899,706
2018 WECC Assessment 25,282,000$
Working Capital Reserve Analysis 2017‐2018
STATUTORY
1 – On June 21, 2017, the WECC Board of Directors approved this reserve level.
2 – Represents collections of Penalty Sanctions from July 1, 2016 through June 30, 2017. See page 47 for full disclosure.
WECC’s Board has approved a Working Capital Reserve balance equal to one‐to‐two months of
Personnel, Meeting, and Operating Expenses per its Reserve Policy approved by the Finance
and Audit Committee on June 23, 2015. Additional reserves have been approved as part of
WECC’s assessment stabilization initiative.
Section B — Supplemental Financial Information Breakdown of Statement of Activities
2018 WECC Business Plan and Budget
Approved by Board of Directors: June 21, 2017 46
Breakdown by Statement of Activity Sections
The following detailed schedules are in support of the Statutory Statement of Activities and
Capital Expenditures on page 10.
Monetary Penalties
As documented in the NERC Policy Accounting, Financial Statement and Budgetary Treatment
of Penalties Imposed and Received for Violations of Reliability Standards, penalty monies
received on or prior to June 30, 2017 will be used to offset assessments in the 2018 WECC
budget.
All penalty monies received on or prior to June 30, 2017 are listed in Table B‐2, including the
amount and the date received.
Allocation Method: Penalty monies received have been allocated to the following Statutory
Programs to reduce assessments:
Reliability Standards;
Compliance Monitoring and Enforcement and Organization Registration and
Certification;
Reliability Assessment and Performance Analysis;
Training, Education, and Stakeholder Outreach; and
Situation Awareness and Infrastructure Security.
Penalty monies are allocated based on the number of FTEs in the functional areas divided by
the aggregate total FTEs in the programs receiving the allocation.
Civil Penalty Sanctions
WECC recognized civil penalty expense in its 2013 and 2014 financial statements that were the
result of the FERC Order pertaining to the Arizona‐Southern California outage that occurred on
September 8, 2011. In 2013, $1 million was recognized and in 2014, $2 million was recognized.
As of May 31, 2017, the entire $3 million has been paid and the liability is now zero. These
penalties do not impact the 2018 budget.
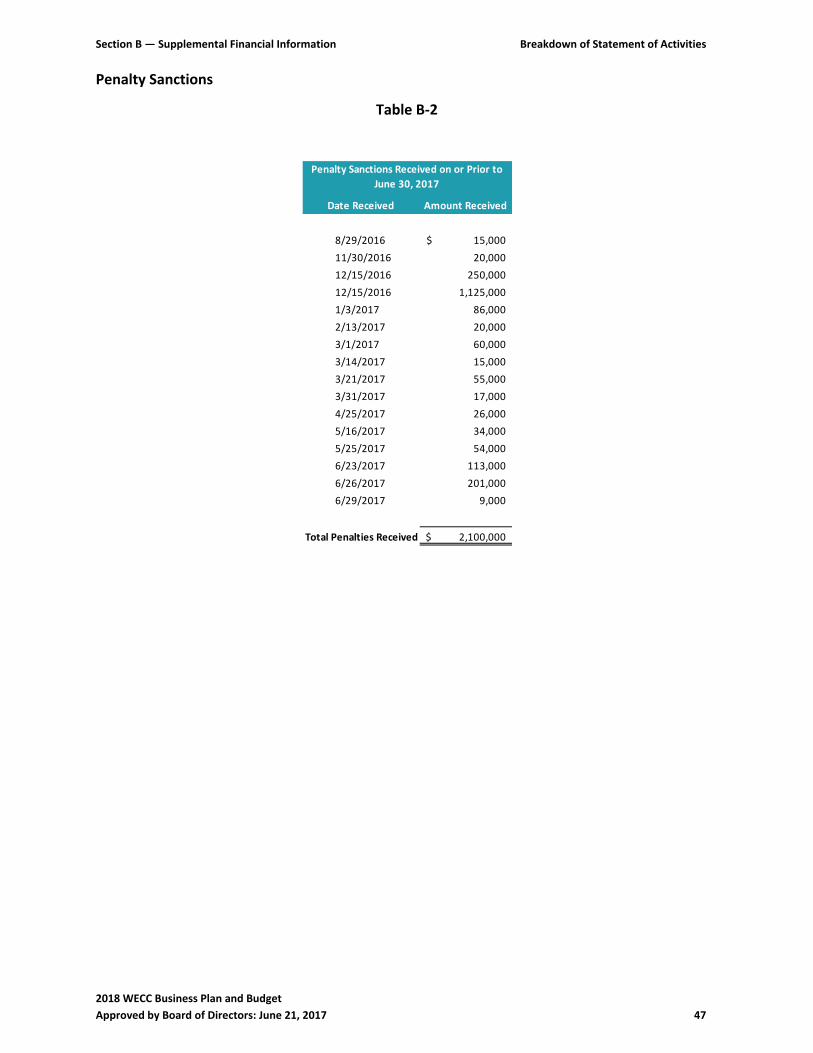
Section B — Supplemental Financial Information Breakdown of Statement of Activities
2018 WECC Business Plan and Budget
Approved by Board of Directors: June 21, 2017 47
Penalty Sanctions
Table B‐2
Date Received Amount Received
8/29/2016 15,000$
11/30/2016 20,000
12/15/2016 250,000
12/15/2016 1,125,000
1/3/2017 86,000
2/13/2017 20,000
3/1/2017 60,000
3/14/2017 15,000
3/21/2017 55,000
3/31/2017 17,000
4/25/2017 26,000
5/16/2017 34,000
5/25/2017 54,000
6/23/2017 113,000
6/26/2017 201,000
6/29/2017 9,000
Total Penalties Received 2,100,000$
Penalty Sanctions Received on or Prior to
June 30, 2017
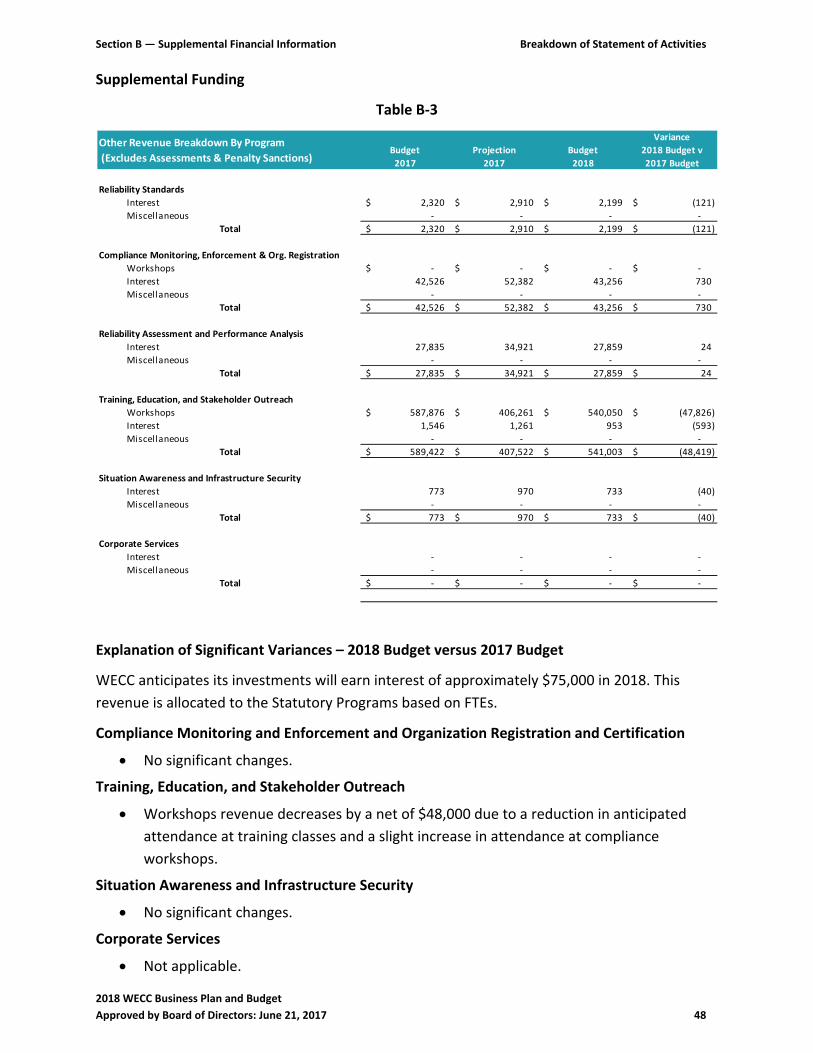
Section B — Supplemental Financial Information Breakdown of Statement of Activities
2018 WECC Business Plan and Budget
Approved by Board of Directors: June 21, 2017 48
Supplemental Funding
Table B‐3
Other Revenue Breakdown By Program
(Excludes Assessments & Penalty Sanctions)Budget
2017
Projection
2017
Budget
2018
Variance
2018 Budget v
2017 Budget
Reliability Standards
Interest 2,320$ 2,910$ 2,199$ (121)$
Miscellaneous ‐ ‐ ‐ ‐
Total 2,320$ 2,910$ 2,199$ (121)$
Compliance Monitoring, Enforcement & Org. Registration
Workshops ‐$ ‐$ ‐$ ‐$
Interest 42,526 52,382 43,256 730
Miscellaneous ‐ ‐ ‐ ‐
Total 42,526$ 52,382$ 43,256$ 730$
Reliability Assessment and Performance Analysis
Interest 27,835 34,921 27,859 24
Miscellaneous ‐ ‐ ‐ ‐
Total 27,835$ 34,921$ 27,859$ 24$
Training, Education, and Stakeholder Outreach
Workshops 587,876$ 406,261$ 540,050$ (47,826)$
Interest 1,546 1,261 953 (593)
Miscellaneous ‐ ‐ ‐ ‐
Total 589,422$ 407,522$ 541,003$ (48,419)$
Situation Awareness and Infrastructure Security
Interest 773 970 733 (40)
Miscellaneous ‐ ‐ ‐ ‐
Total 773$ 970$ 733$ (40)$
Corporate Services
Interest ‐ ‐ ‐ ‐
Miscellaneous ‐ ‐ ‐ ‐
Total ‐$ ‐$ ‐$ ‐$
Explanation of Significant Variances – 2018 Budget versus 2017 Budget
WECC anticipates its investments will earn interest of approximately $75,000 in 2018. This
revenue is allocated to the Statutory Programs based on FTEs.
Compliance Monitoring and Enforcement and Organization Registration and Certification
No significant changes.
Training, Education, and Stakeholder Outreach
Workshops revenue decreases by a net of $48,000 due to a reduction in anticipated
attendance at training classes and a slight increase in attendance at compliance
workshops.
Situation Awareness and Infrastructure Security
No significant changes.
Corporate Services
Not applicable.
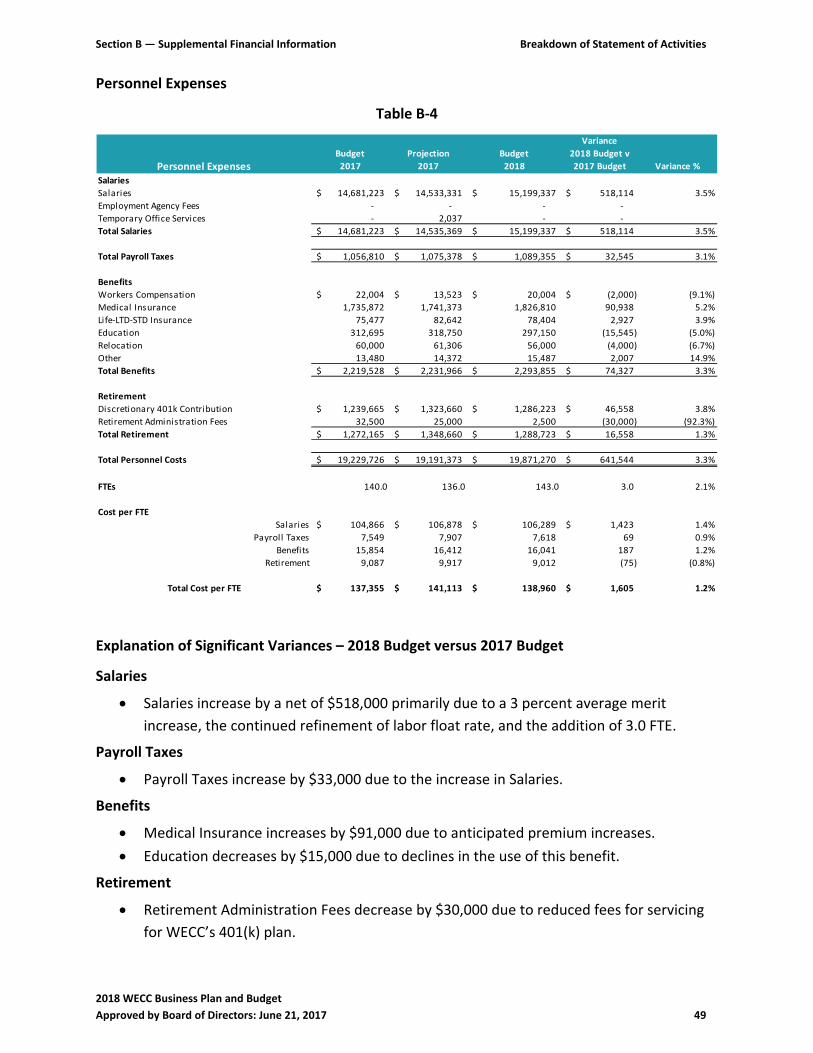
Section B — Supplemental Financial Information Breakdown of Statement of Activities
2018 WECC Business Plan and Budget
Approved by Board of Directors: June 21, 2017 49
Personnel Expenses
Table B‐4
Personnel ExpensesBudget
2017
Projection
2017
Budget
2018
Variance
2018 Budget v
2017 Budget Variance %
Salaries
Salaries 14,681,223$ 14,533,331$ 15,199,337$ 518,114$ 3.5%
Employment Agency Fees ‐ ‐ ‐ ‐
Temporary Office Services ‐ 2,037 ‐ ‐
Total Salaries 14,681,223$ 14,535,369$ 15,199,337$ 518,114$ 3.5%
Total Payroll Taxes 1,056,810$ 1,075,378$ 1,089,355$ 32,545$ 3.1%
Benefits
Workers Compensation 22,004$ 13,523$ 20,004$ (2,000)$ (9.1%)
Medical Insurance 1,735,872 1,741,373 1,826,810 90,938 5.2%
Life‐LTD‐STD Insurance 75,477 82,642 78,404 2,927 3.9%
Education 312,695 318,750 297,150 (15,545) (5.0%)
Relocation 60,000 61,306 56,000 (4,000) (6.7%)
Other 13,480 14,372 15,487 2,007 14.9%
Total Benefits 2,219,528$ 2,231,966$ 2,293,855$ 74,327$ 3.3%
Retirement
Discretionary 401k Contribution 1,239,665$ 1,323,660$ 1,286,223$ 46,558$ 3.8%
Retirement Administration Fees 32,500 25,000 2,500 (30,000) (92.3%)
Total Retirement 1,272,165$ 1,348,660$ 1,288,723$ 16,558$ 1.3%
Total Personnel Costs 19,229,726$ 19,191,373$ 19,871,270$ 641,544$ 3.3%
FTEs 140.0 136.0 143.0 3.0 2.1%
Cost per FTE
Salaries 104,866$ 106,878$ 106,289$ 1,423$ 1.4%
Payroll Taxes 7,549 7,907 7,618 69 0.9%
Benefits 15,854 16,412 16,041 187 1.2%
Retirement 9,087 9,917 9,012 (75) (0.8%)
Total Cost per FTE 137,355$ 141,113$ 138,960$ 1,605$ 1.2%
Explanation of Significant Variances – 2018 Budget versus 2017 Budget
Salaries
Salaries increase by a net of $518,000 primarily due to a 3 percent average merit
increase, the continued refinement of labor float rate, and the addition of 3.0 FTE.
Payroll Taxes
Payroll Taxes increase by $33,000 due to the increase in Salaries.
Benefits
Medical Insurance increases by $91,000 due to anticipated premium increases.
Education decreases by $15,000 due to declines in the use of this benefit.
Retirement
Retirement Administration Fees decrease by $30,000 due to reduced fees for servicing
for WECC’s 401(k) plan.
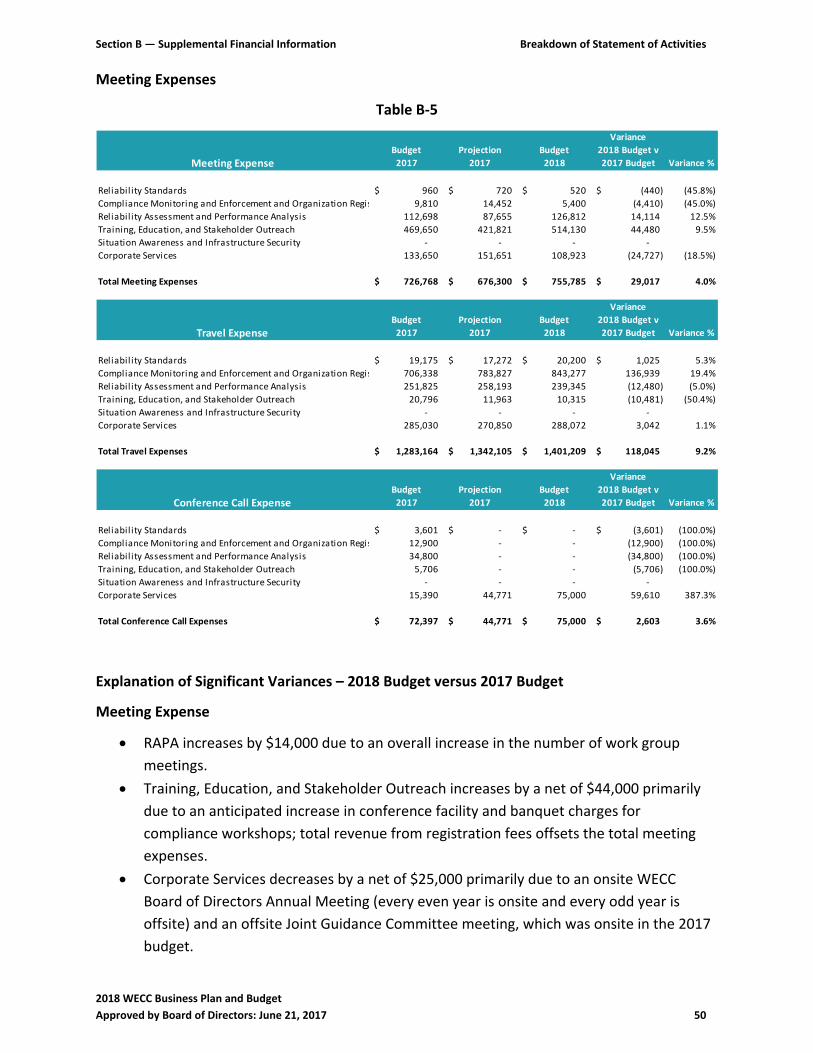
Section B — Supplemental Financial Information Breakdown of Statement of Activities
2018 WECC Business Plan and Budget
Approved by Board of Directors: June 21, 2017 50
Meeting Expenses
Table B‐5
Meeting ExpenseBudget
2017
Projection
2017
Budget
2018
Variance
2018 Budget v
2017 Budget Variance %
Reliabil ity Standards 960$ 720$ 520$ (440)$ (45.8%)
Compliance Monitoring and Enforcement and Organization Regis 9,810 14,452 5,400 (4,410) (45.0%)
Reliabil ity Assessment and Performance Analysis 112,698 87,655 126,812 14,114 12.5%
Training, Education, and Stakeholder Outreach 469,650 421,821 514,130 44,480 9.5%
Situation Awareness and Infrastructure Security ‐ ‐ ‐ ‐
Corporate Services 133,650 151,651 108,923 (24,727) (18.5%)
Total Meeting Expenses 726,768$ 676,300$ 755,785$ 29,017$ 4.0%
Travel ExpenseBudget
2017
Projection
2017
Budget
2018
Variance
2018 Budget v
2017 Budget Variance %
Reliabil ity Standards 19,175$ 17,272$ 20,200$ 1,025$ 5.3%
Compliance Monitoring and Enforcement and Organization Regis 706,338 783,827 843,277 136,939 19.4%
Reliabil ity Assessment and Performance Analysis 251,825 258,193 239,345 (12,480) (5.0%)
Training, Education, and Stakeholder Outreach 20,796 11,963 10,315 (10,481) (50.4%)
Situation Awareness and Infrastructure Security ‐ ‐ ‐ ‐
Corporate Services 285,030 270,850 288,072 3,042 1.1%
Total Travel Expenses 1,283,164$ 1,342,105$ 1,401,209$ 118,045$ 9.2%
Conference Call ExpenseBudget
2017
Projection
2017
Budget
2018
Variance
2018 Budget v
2017 Budget Variance %
Reliabil ity Standards 3,601$ ‐$ ‐$ (3,601)$ (100.0%)
Compliance Monitoring and Enforcement and Organization Regis 12,900 ‐ ‐ (12,900) (100.0%)
Reliabil ity Assessment and Performance Analysis 34,800 ‐ ‐ (34,800) (100.0%)
Training, Education, and Stakeholder Outreach 5,706 ‐ ‐ (5,706) (100.0%)
Situation Awareness and Infrastructure Security ‐ ‐ ‐ ‐
Corporate Services 15,390 44,771 75,000 59,610 387.3%
Total Conference Call Expenses 72,397$ 44,771$ 75,000$ 2,603$ 3.6%
Explanation of Significant Variances – 2018 Budget versus 2017 Budget
Meeting Expense
RAPA increases by $14,000 due to an overall increase in the number of work group
meetings.
Training, Education, and Stakeholder Outreach increases by a net of $44,000 primarily
due to an anticipated increase in conference facility and banquet charges for
compliance workshops; total revenue from registration fees offsets the total meeting
expenses.
Corporate Services decreases by a net of $25,000 primarily due to an onsite WECC
Board of Directors Annual Meeting (every even year is onsite and every odd year is
offsite) and an offsite Joint Guidance Committee meeting, which was onsite in the 2017
budget.
Section B — Supplemental Financial Information Breakdown of Statement of Activities
2018 WECC Business Plan and Budget
Approved by Board of Directors: June 21, 2017 51
Travel Expense
Compliance increases by $137,000 due to additional audits/site visits related to CIP‐005,
CIP‐014, and risk‐based compliance monitoring.
RAPA decreases by $12,000 due to a reduction in onsite reliability assessments.
Training, Education, and Stakeholder Outreach decreases by a net of $10,000 due to a
reduction in offsite classes and workshops.
Conference Call Expense
The Conference Calls budget is centralized in Corporate Services in 2018. No significant
changes in the total budget.
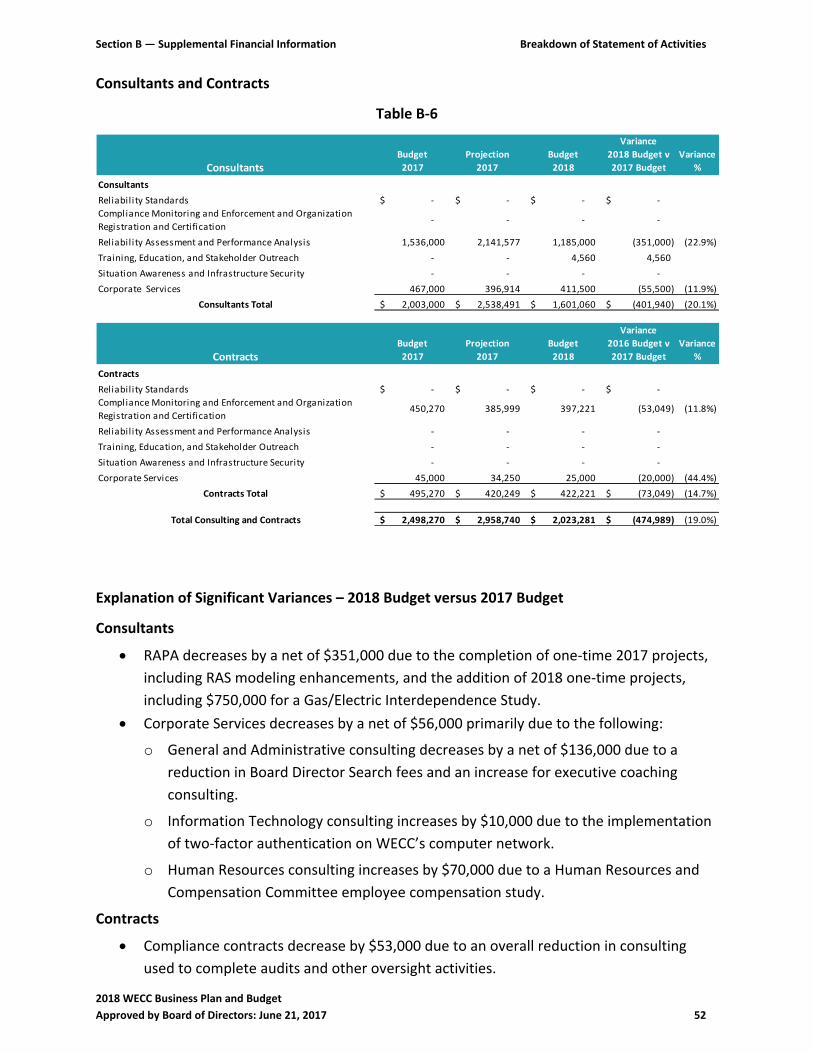
Section B — Supplemental Financial Information Breakdown of Statement of Activities
2018 WECC Business Plan and Budget
Approved by Board of Directors: June 21, 2017 52
Consultants and Contracts
Table B‐6
ConsultantsBudget
2017
Projection
2017
Budget
2018
Variance
2018 Budget v
2017 Budget
Variance
%
Consultants
Reliability Standards ‐$ ‐$ ‐$ ‐$
Compliance Monitoring and Enforcement and Organization
Registration and Certification ‐ ‐ ‐ ‐
Reliability Assessment and Performance Analysis 1,536,000 2,141,577 1,185,000 (351,000) (22.9%)
Training, Education, and Stakeholder Outreach ‐ ‐ 4,560 4,560
Situation Awareness and Infrastructure Security ‐ ‐ ‐ ‐
Corporate Services 467,000 396,914 411,500 (55,500) (11.9%)
Consultants Total 2,003,000$ 2,538,491$ 1,601,060$ (401,940)$ (20.1%)
ContractsBudget
2017
Projection
2017
Budget
2018
Variance
2016 Budget v
2017 Budget
Variance
%
Contracts
Reliability Standards ‐$ ‐$ ‐$ ‐$
Compliance Monitoring and Enforcement and Organization
Registration and Certification 450,270 385,999 397,221 (53,049) (11.8%)
Reliability Assessment and Performance Analysis ‐ ‐ ‐ ‐
Training, Education, and Stakeholder Outreach ‐ ‐ ‐ ‐
Situation Awareness and Infrastructure Security ‐ ‐ ‐ ‐
Corporate Services 45,000 34,250 25,000 (20,000) (44.4%)
Contracts Total 495,270$ 420,249$ 422,221$ (73,049)$ (14.7%)
Total Consulting and Contracts 2,498,270$ 2,958,740$ 2,023,281$ (474,989)$ (19.0%)
Explanation of Significant Variances – 2018 Budget versus 2017 Budget
Consultants
RAPA decreases by a net of $351,000 due to the completion of one‐time 2017 projects,
including RAS modeling enhancements, and the addition of 2018 one‐time projects,
including $750,000 for a Gas/Electric Interdependence Study.
Corporate Services decreases by a net of $56,000 primarily due to the following:
o General and Administrative consulting decreases by a net of $136,000 due to a
reduction in Board Director Search fees and an increase for executive coaching
consulting.
o Information Technology consulting increases by $10,000 due to the implementation
of two‐factor authentication on WECC’s computer network.
o Human Resources consulting increases by $70,000 due to a Human Resources and
Compensation Committee employee compensation study.
Contracts
Compliance contracts decrease by $53,000 due to an overall reduction in consulting
used to complete audits and other oversight activities.
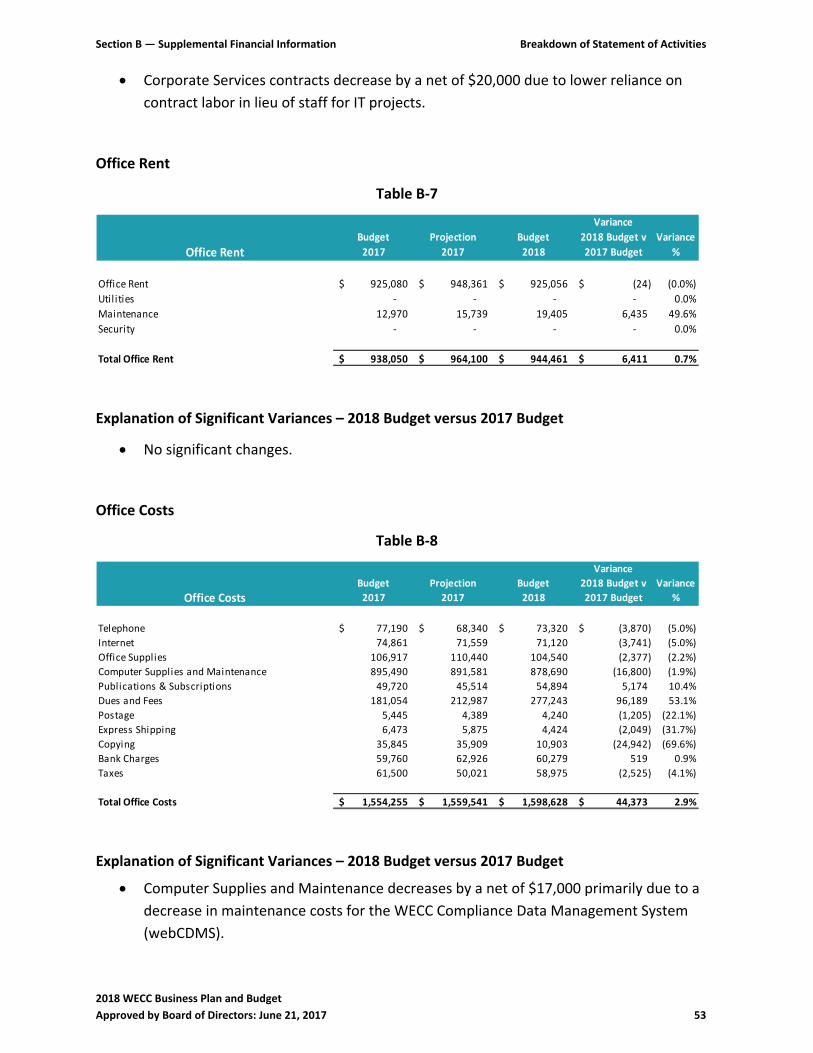
Section B — Supplemental Financial Information Breakdown of Statement of Activities
2018 WECC Business Plan and Budget
Approved by Board of Directors: June 21, 2017 53
Corporate Services contracts decrease by a net of $20,000 due to lower reliance on
contract labor in lieu of staff for IT projects.
Office Rent
Table B‐7
Office RentBudget
2017
Projection
2017
Budget
2018
Variance
2018 Budget v
2017 Budget
Variance
%
Office Rent 925,080$ 948,361$ 925,056$ (24)$ (0.0%)
Util ities ‐ ‐ ‐ ‐ 0.0%
Maintenance 12,970 15,739 19,405 6,435 49.6%
Security ‐ ‐ ‐ ‐ 0.0%
Total Office Rent 938,050$ 964,100$ 944,461$ 6,411$ 0.7%
Explanation of Significant Variances – 2018 Budget versus 2017 Budget
No significant changes.
Office Costs
Table B‐8
Office CostsBudget
2017
Projection
2017
Budget
2018
Variance
2018 Budget v
2017 Budget
Variance
%
Telephone 77,190$ 68,340$ 73,320$ (3,870)$ (5.0%)
Internet 74,861 71,559 71,120 (3,741) (5.0%)
Office Supplies 106,917 110,440 104,540 (2,377) (2.2%)
Computer Supplies and Maintenance 895,490 891,581 878,690 (16,800) (1.9%)
Publications & Subscriptions 49,720 45,514 54,894 5,174 10.4%
Dues and Fees 181,054 212,987 277,243 96,189 53.1%
Postage 5,445 4,389 4,240 (1,205) (22.1%)
Express Shipping 6,473 5,875 4,424 (2,049) (31.7%)
Copying 35,845 35,909 10,903 (24,942) (69.6%)
Bank Charges 59,760 62,926 60,279 519 0.9%
Taxes 61,500 50,021 58,975 (2,525) (4.1%)
Total Office Costs 1,554,255$ 1,559,541$ 1,598,628$ 44,373$ 2.9%
Explanation of Significant Variances – 2018 Budget versus 2017 Budget
Computer Supplies and Maintenance decreases by a net of $17,000 primarily due to a
decrease in maintenance costs for the WECC Compliance Data Management System
(webCDMS).
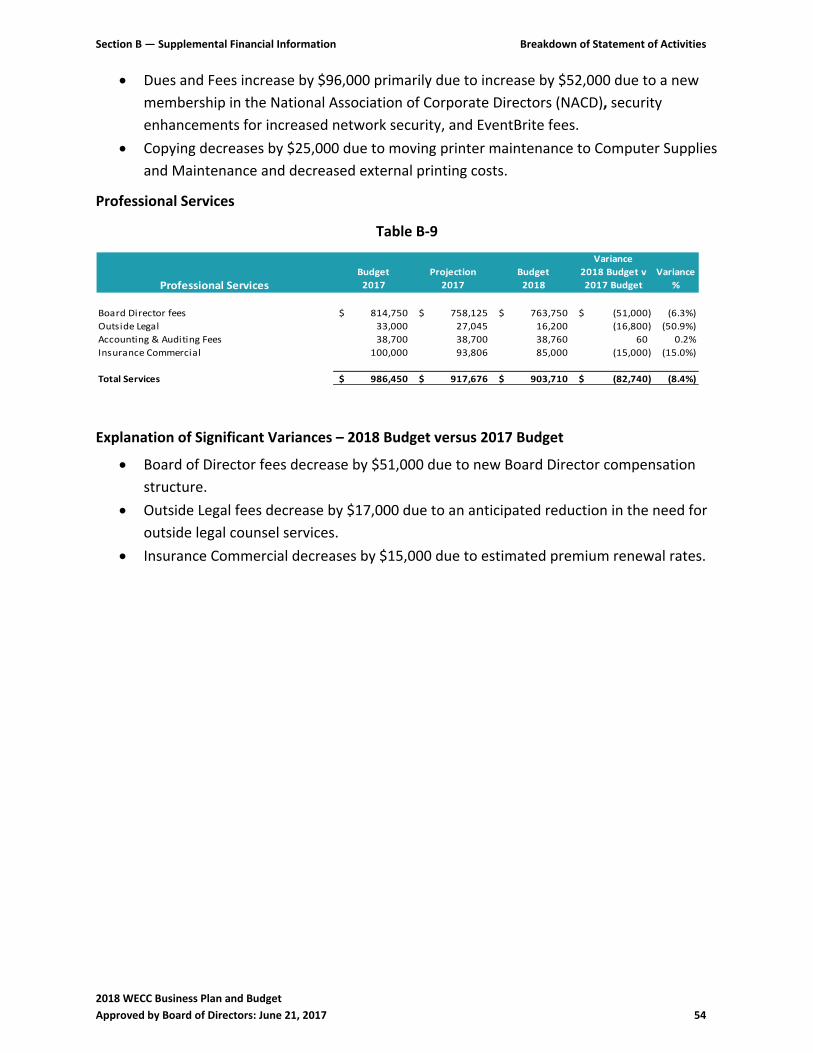
Section B — Supplemental Financial Information Breakdown of Statement of Activities
2018 WECC Business Plan and Budget
Approved by Board of Directors: June 21, 2017 54
Dues and Fees increase by $96,000 primarily due to increase by $52,000 due to a new
membership in the National Association of Corporate Directors (NACD), security
enhancements for increased network security, and EventBrite fees.
Copying decreases by $25,000 due to moving printer maintenance to Computer Supplies
and Maintenance and decreased external printing costs.
Professional Services
Table B‐9
Professional ServicesBudget
2017
Projection
2017
Budget
2018
Variance
2018 Budget v
2017 Budget
Variance
%
Board Director fees 814,750$ 758,125$ 763,750$ (51,000)$ (6.3%)
Outside Legal 33,000 27,045 16,200 (16,800) (50.9%)
Accounting & Auditing Fees 38,700 38,700 38,760 60 0.2%
Insurance Commercial 100,000 93,806 85,000 (15,000) (15.0%)
Total Services 986,450$ 917,676$ 903,710$ (82,740)$ (8.4%)
Explanation of Significant Variances – 2018 Budget versus 2017 Budget
Board of Director fees decrease by $51,000 due to new Board Director compensation
structure.
Outside Legal fees decrease by $17,000 due to an anticipated reduction in the need for
outside legal counsel services.
Insurance Commercial decreases by $15,000 due to estimated premium renewal rates.
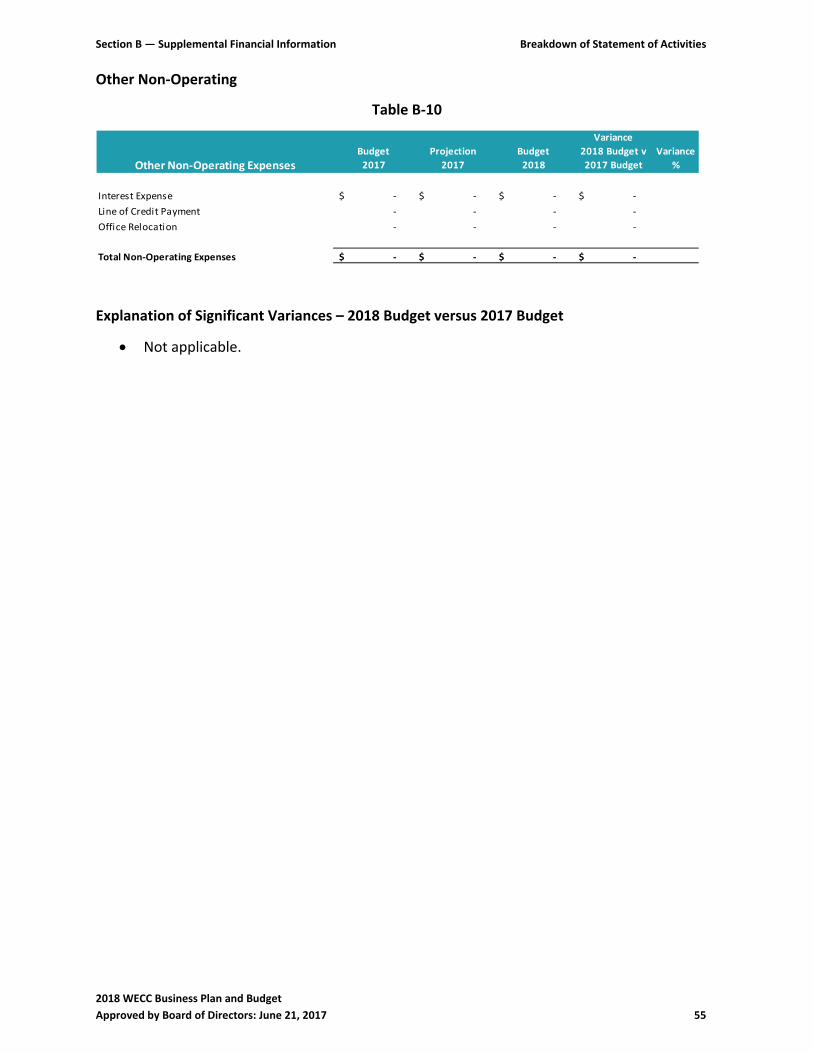
Section B — Supplemental Financial Information Breakdown of Statement of Activities
2018 WECC Business Plan and Budget
Approved by Board of Directors: June 21, 2017 55
Other Non‐Operating
Table B‐10
Other Non‐Operating ExpensesBudget
2017
Projection
2017
Budget
2018
Variance
2018 Budget v
2017 Budget
Variance
%
Interest Expense ‐$ ‐$ ‐$ ‐$
Line of Credit Payment ‐ ‐ ‐ ‐
Office Relocation ‐ ‐ ‐ ‐
Total Non‐Operating Expenses ‐$ ‐$ ‐$ ‐$
Explanation of Significant Variances – 2018 Budget versus 2017 Budget
Not applicable.
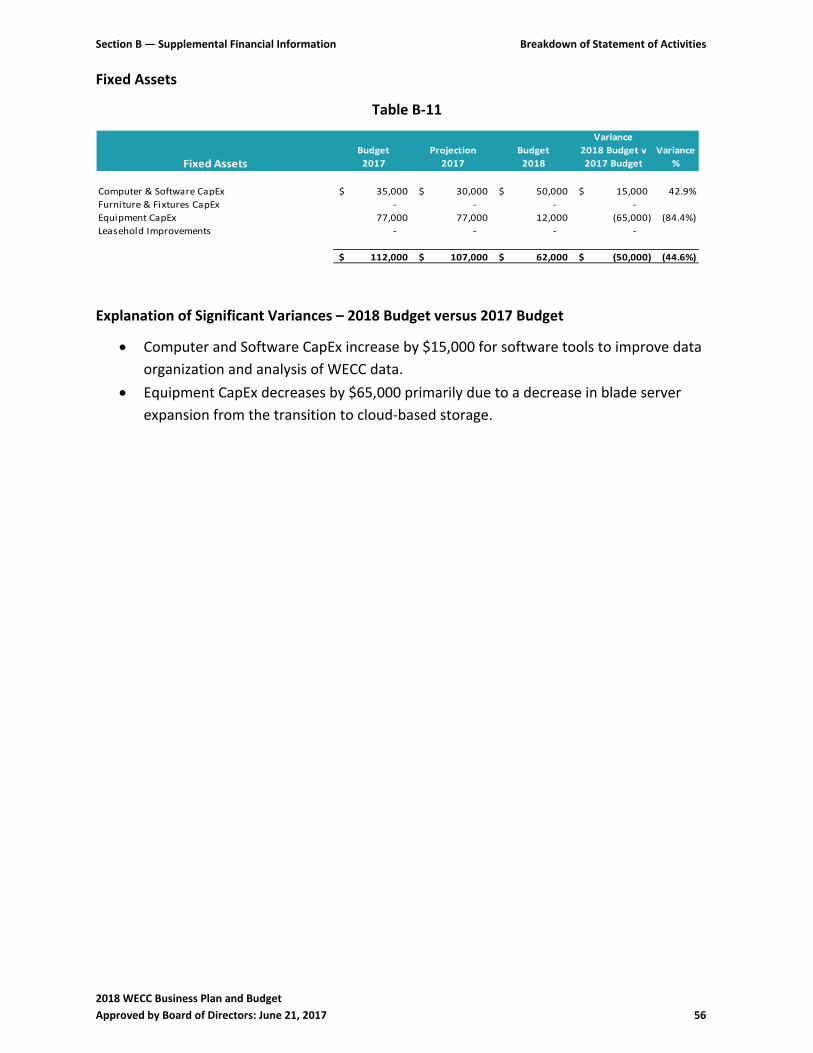
Section B — Supplemental Financial Information Breakdown of Statement of Activities
2018 WECC Business Plan and Budget
Approved by Board of Directors: June 21, 2017 56
Fixed Assets
Table B‐11
Fixed AssetsBudget
2017
Projection
2017
Budget
2018
Variance
2018 Budget v
2017 Budget
Variance
%
Computer & Software CapEx 35,000$ 30,000$ 50,000$ 15,000$ 42.9%
Furniture & Fixtures CapEx ‐ ‐ ‐ ‐
Equipment CapEx 77,000 77,000 12,000 (65,000) (84.4%)
Leasehold Improvements ‐ ‐ ‐ ‐
112,000$ 107,000$ 62,000$ (50,000)$ (44.6%)
Explanation of Significant Variances – 2018 Budget versus 2017 Budget
Computer and Software CapEx increase by $15,000 for software tools to improve data
organization and analysis of WECC data.
Equipment CapEx decreases by $65,000 primarily due to a decrease in blade server
expansion from the transition to cloud‐based storage.
Section B — Supplemental Financial Information Reserve Analysis
2018 WECC Business Plan and Budget
Approved by Board of Directors: June 21, 2017 57
Section C
Non‐Statutory Activities
2018 Business Plan and Budget
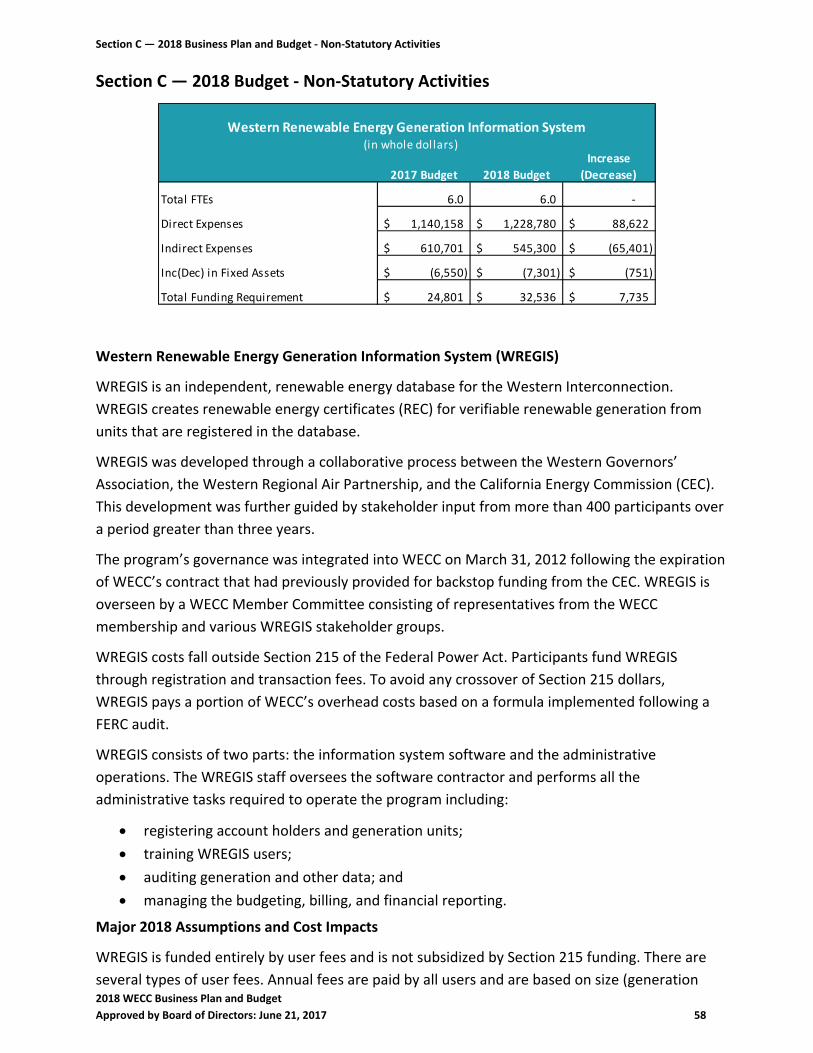
Section C — 2018 Business Plan and Budget ‐ Non‐Statutory Activities
2018 WECC Business Plan and Budget
Approved by Board of Directors: June 21, 2017 58
Section C — 2018 Budget ‐ Non‐Statutory Activities
2017 Budget 2018 Budget
Increase
(Decrease)
Total FTEs 6.0 6.0 ‐
Direct Expenses 1,140,158$ 1,228,780$ 88,622$
Indirect Expenses 610,701$ 545,300$ (65,401)$
Inc(Dec) in Fixed Assets (6,550)$ (7,301)$ (751)$
Total Funding Requirement 24,801$ 32,536$ 7,735$
Western Renewable Energy Generation Information System (in whole dollars)
Western Renewable Energy Generation Information System (WREGIS)
WREGIS is an independent, renewable energy database for the Western Interconnection.
WREGIS creates renewable energy certificates (REC) for verifiable renewable generation from
units that are registered in the database.
WREGIS was developed through a collaborative process between the Western Governors’
Association, the Western Regional Air Partnership, and the California Energy Commission (CEC).
This development was further guided by stakeholder input from more than 400 participants over
a period greater than three years.
The program’s governance was integrated into WECC on March 31, 2012 following the expiration
of WECC’s contract that had previously provided for backstop funding from the CEC. WREGIS is
overseen by a WECC Member Committee consisting of representatives from the WECC
membership and various WREGIS stakeholder groups.
WREGIS costs fall outside Section 215 of the Federal Power Act. Participants fund WREGIS
through registration and transaction fees. To avoid any crossover of Section 215 dollars,
WREGIS pays a portion of WECC’s overhead costs based on a formula implemented following a
FERC audit.
WREGIS consists of two parts: the information system software and the administrative
operations. The WREGIS staff oversees the software contractor and performs all the
administrative tasks required to operate the program including:
registering account holders and generation units;
training WREGIS users;
auditing generation and other data; and
managing the budgeting, billing, and financial reporting.
Major 2018 Assumptions and Cost Impacts
WREGIS is funded entirely by user fees and is not subsidized by Section 215 funding. There are
several types of user fees. Annual fees are paid by all users and are based on size (generation
Section C — 2018 Business Plan and Budget ‐ Non‐Statutory Activities
2018 WECC Business Plan and Budget
Approved by Board of Directors: June 21, 2017 59
capacity) and user type. Usage fees are paid by all but micro, small, and medium generation
owners (as defined by the WREGIS fee matrix). WREGIS also charges various fees for specific
usage to only those requesting the services.
User fees are based on size (generation capacity) and user type.
o Approximately 4 percent of revenues are based on size.
o Approximately 91 percent of revenues are based on usage levels, which can depend
on factors such as weather (wind and solar generation levels) and state regulatory
policies (retirement, transfers, etc.).
o Approximately 5 percent of revenues are attributable to fees for specific, requested
functions such as tracking e‐Tags.
Revenues can vary greatly from year to year; therefore, WECC holds large WREGIS
reserves to allow for normal operations during years in which fee levels are low and to
fund large, non‐recurring expenditures such as major software upgrades.
2018 Primary Goals and Objectives
Implement the WREGIS program as required by the participating states, provinces, and
voluntary programs.
Register program participants, whether mandatory or voluntary.
Refine the WREGIS software to ensure optimum performance in terms of both efficiency
and ease of use for account holders.
Refine and improve data collection to ensure high quality data.
Keep abreast of possible needs to increase WREGIS’s functionality.
Funding Sources and Requirements — Explanation of Increase (Decrease)
Funding Sources (other than ERO Assessments)
WREGIS account holders pay an initial registration fee and annual renewal fees.
Amounts vary by the size and category of the account holder.
Volumetric‐based fees are assessed when RECs are traded, retired, reserved, or
transferred.
Nominal fees are charged for users who attend training.
Personnel Expenses
Personnel Expenses increase by $133,000 primarily due to continued refinement of the
labor float rate based on actual turnover and vacancy rates.
Meeting Expenses
Travel Expenses decrease by $11,000 primarily due to a reduction in needed staff travel
for WREGIS audits.
Operating Expenses
Office Costs decrease by a net of $19,000 due to a reduction in maintenance costs for
the certificate management system and in wireless communication expenditures.
Section C — 2018 Business Plan and Budget ‐ Non‐Statutory Activities
2018 WECC Business Plan and Budget
Approved by Board of Directors: June 21, 2017 60
Professional Services decrease by $12,000 due to a reduction in the need for outside
legal counsel for non‐statutory activities.
Indirect Expenses
Indirect Expenses are allocated based on FTEs. WECC calculates a quarterly allocation
for WREGIS’s indirect costs, based on actual results.
Other Non‐Operating Expenses
Not applicable.
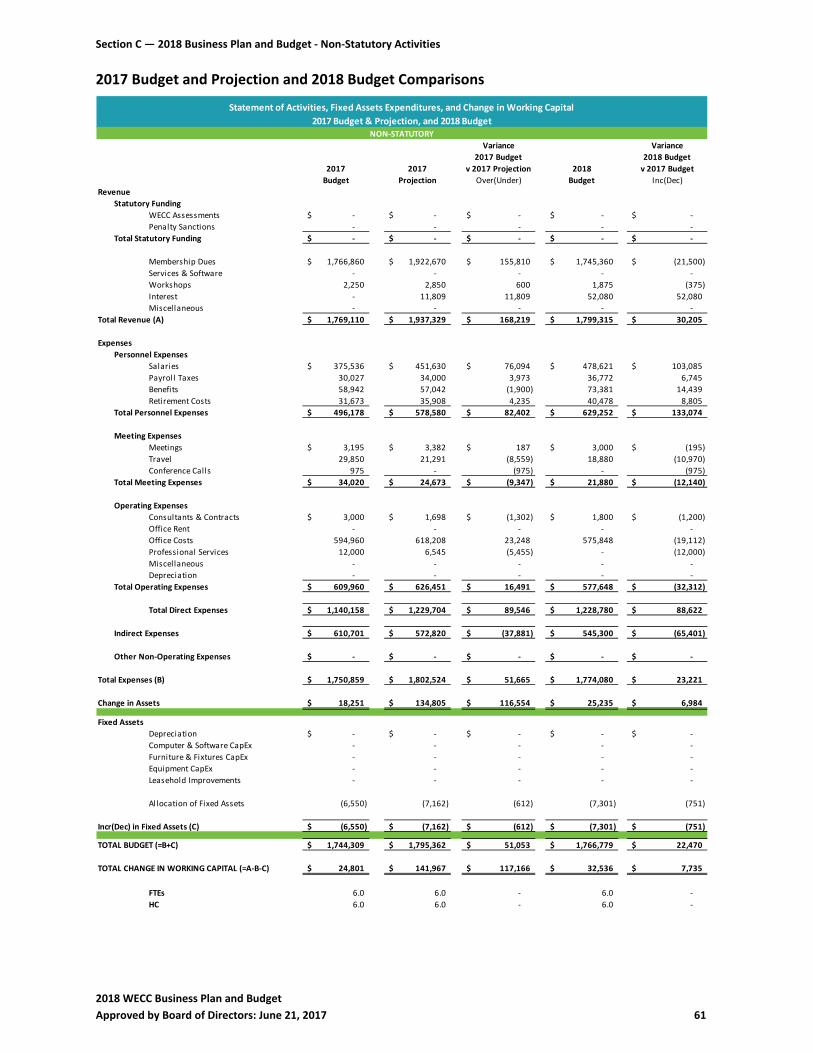
Section C — 2018 Business Plan and Budget ‐ Non‐Statutory Activities
2018 WECC Business Plan and Budget
Approved by Board of Directors: June 21, 2017 61
2017 Budget and Projection and 2018 Budget Comparisons
Variance Variance
2017 Budget 2018 Budget
2017 2017 v 2017 Projection 2018 v 2017 Budget
Budget Projection Over(Under) Budget Inc(Dec)
Revenue
Statutory Funding
WECC Assessments ‐$ ‐$ ‐$ ‐$ ‐$
Penalty Sanctions ‐ ‐ ‐ ‐ ‐
Total Statutory Funding ‐$ ‐$ ‐$ ‐$ ‐$
Membership Dues 1,766,860$ 1,922,670$ 155,810$ 1,745,360$ (21,500)$
Services & Software ‐ ‐ ‐ ‐ ‐
Workshops 2,250 2,850 600 1,875 (375)
Interest ‐ 11,809 11,809 52,080 52,080
Miscellaneous ‐ ‐ ‐ ‐ ‐
Total Revenue (A) 1,769,110$ 1,937,329$ 168,219$ 1,799,315$ 30,205$
Expenses
Personnel Expenses
Salaries 375,536$ 451,630$ 76,094$ 478,621$ 103,085$
Payroll Taxes 30,027 34,000 3,973 36,772 6,745
Benefits 58,942 57,042 (1,900) 73,381 14,439
Retirement Costs 31,673 35,908 4,235 40,478 8,805
Total Personnel Expenses 496,178$ 578,580$ 82,402$ 629,252$ 133,074$
Meeting Expenses
Meetings 3,195$ 3,382$ 187$ 3,000$ (195)$
Travel 29,850 21,291 (8,559) 18,880 (10,970)
Conference Calls 975 ‐ (975) ‐ (975)
Total Meeting Expenses 34,020$ 24,673$ (9,347)$ 21,880$ (12,140)$
Operating Expenses
Consultants & Contracts 3,000$ 1,698$ (1,302)$ 1,800$ (1,200)$
Office Rent ‐ ‐ ‐ ‐ ‐
Office Costs 594,960 618,208 23,248 575,848 (19,112)
Professional Services 12,000 6,545 (5,455) ‐ (12,000)
Miscellaneous ‐ ‐ ‐ ‐ ‐
Depreciation ‐ ‐ ‐ ‐ ‐
Total Operating Expenses 609,960$ 626,451$ 16,491$ 577,648$ (32,312)$
Total Direct Expenses 1,140,158$ 1,229,704$ 89,546$ 1,228,780$ 88,622$
Indirect Expenses 610,701$ 572,820$ (37,881)$ 545,300$ (65,401)$
Other Non‐Operating Expenses ‐$ ‐$ ‐$ ‐$ ‐$
Total Expenses (B) 1,750,859$ 1,802,524$ 51,665$ 1,774,080$ 23,221$
Change in Assets 18,251$ 134,805$ 116,554$ 25,235$ 6,984$
Fixed Assets
Depreciation ‐$ ‐$ ‐$ ‐$ ‐$
Computer & Software CapEx ‐ ‐ ‐ ‐ ‐
Furniture & Fixtures CapEx ‐ ‐ ‐ ‐ ‐
Equipment CapEx ‐ ‐ ‐ ‐ ‐
Leasehold Improvements ‐ ‐ ‐ ‐ ‐
Allocation of Fixed Assets (6,550) (7,162) (612) (7,301) (751)
Incr(Dec) in Fixed Assets (C) (6,550)$ (7,162)$ (612)$ (7,301)$ (751)$
TOTAL BUDGET (=B+C) 1,744,309$ 1,795,362$ 51,053$ 1,766,779$ 22,470$
TOTAL CHANGE IN WORKING CAPITAL (=A‐B‐C) 24,801$ 141,967$ 117,166$ 32,536$ 7,735$
FTEs 6.0 6.0 ‐ 6.0 ‐
HC 6.0 6.0 ‐ 6.0 ‐
Statement of Activities, Fixed Assets Expenditures, and Change in Working Capital
2017 Budget & Projection, and 2018 BudgetNON‐STATUTORY
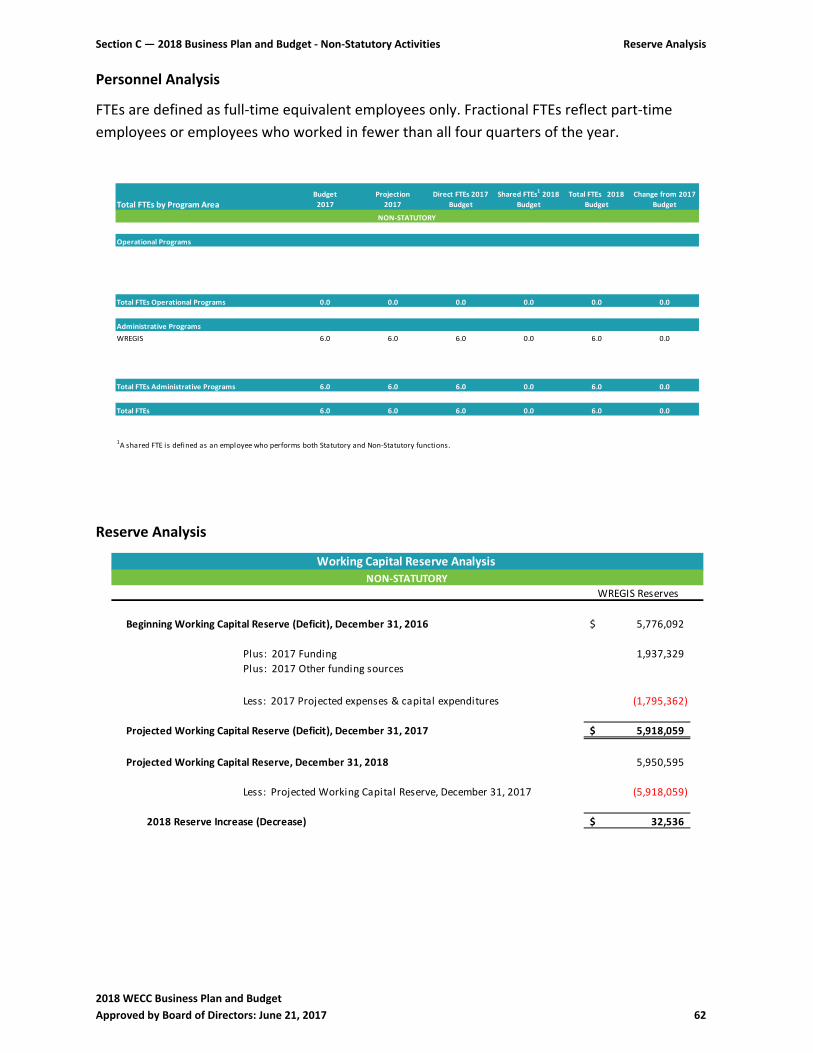
Section C — 2018 Business Plan and Budget ‐ Non‐Statutory Activities Reserve Analysis
2018 WECC Business Plan and Budget
Approved by Board of Directors: June 21, 2017 62
Personnel Analysis
FTEs are defined as full‐time equivalent employees only. Fractional FTEs reflect part‐time
employees or employees who worked in fewer than all four quarters of the year.
Total FTEs by Program AreaBudget
2017
Projection
2017
Direct FTEs 2017
Budget
Shared FTEs1 2018
Budget
Total FTEs 2018
Budget
Change from 2017
Budget
Operational Programs
Total FTEs Operational Programs 0.0 0.0 0.0 0.0 0.0 0.0
Administrative Programs
WREGIS 6.0 6.0 6.0 0.0 6.0 0.0
Total FTEs Administrative Programs 6.0 6.0 6.0 0.0 6.0 0.0
Total FTEs 6.0 6.0 6.0 0.0 6.0 0.0
1A shared FTE is defined as an employee who performs both Statutory and Non‐Statutory functions.
NON‐STATUTORY
Reserve Analysis
WREGIS Reserves
Beginning Working Capital Reserve (Deficit), December 31, 2016 5,776,092$
Plus: 2017 Funding 1,937,329
Plus: 2017 Other funding sources
Less: 2017 Projected expenses & capital expenditures (1,795,362)
Projected Working Capital Reserve (Deficit), December 31, 2017 5,918,059$
Pr Projected Working Capital Reserve, December 31, 2018 5,950,595
Less: Projected Working Capital Reserve, December 31, 2017 (5,918,059)
2018 Reserve Increase (Decrease) 32,536$
Working Capital Reserve Analysis
NON‐STATUTORY
2018 WECC Business Plan and Budget
Approved by Board of Directors: June 21, 2017 63
Section D
Additional Financial Information
2018 Business Plan and Budget
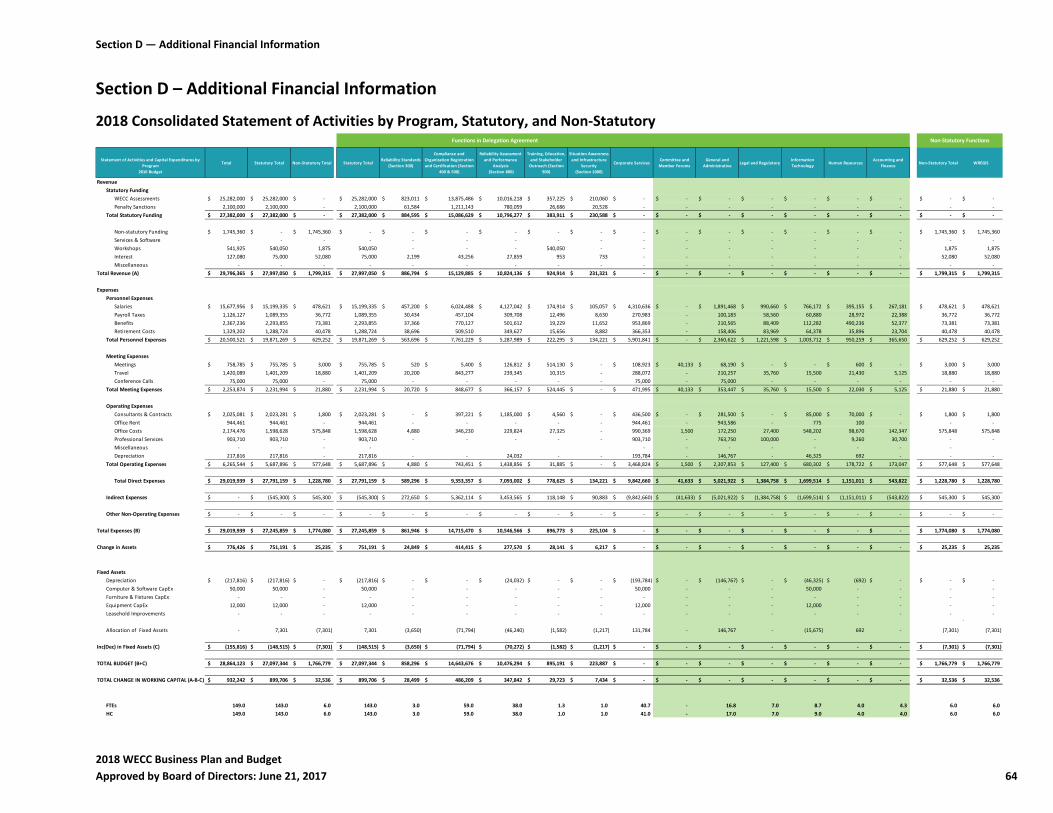
Section D — Additional Financial Information
2018 WECC Business Plan and Budget
Approved by Board of Directors: June 21, 2017 64
Section D – Additional Financial Information
2018 Consolidated Statement of Activities by Program, Statutory, and Non‐Statutory
Total Statutory Total Non‐Statutory Total Statutory TotalReliability Standards
(Section 300)
Compliance and
Organization Registration
and Certification (Section
400 & 500)
Reliability Assessment
and Performance
Analysis
(Section 800)
Training, Education,
and Stakeholder
Outreach (Section
900)
Situation Awareness
and Infrastructure
Security
(Section 1000)
Corporate ServicesCommittee and
Member Forums
General and
AdministrativeLegal and Regulatory
Information
TechnologyHuman Resources
Accounting and
FinanceNon‐Statutory Total WREGIS
Revenue
Statutory Funding
WECC Assessments 25,282,000$ 25,282,000$ ‐$ 25,282,000$ 823,011$ 13,875,486$ 10,016,218$ 357,225$ 210,060$ ‐$ ‐$ ‐$ ‐$ ‐$ ‐$ ‐$ ‐$ ‐$
Penalty Sanctions 2,100,000 2,100,000 ‐ 2,100,000 61,584 1,211,143 780,059 26,686 20,528 ‐ ‐ ‐ ‐ ‐ ‐ ‐ ‐ ‐
Total Statutory Funding 27,382,000$ 27,382,000$ ‐$ 27,382,000$ 884,595$ 15,086,629$ 10,796,277$ 383,911$ 230,588$ ‐$ ‐$ ‐$ ‐$ ‐$ ‐$ ‐$ ‐$ ‐$
Non‐statutory Funding 1,745,360$ ‐$ 1,745,360$ ‐$ ‐$ ‐$ ‐$ ‐$ ‐$ ‐$ ‐$ ‐$ ‐$ ‐$ ‐$ ‐$ 1,745,360$ 1,745,360$
Services & Software ‐ ‐ ‐ ‐ ‐ ‐ ‐ ‐ ‐ ‐ ‐ ‐ ‐ ‐ ‐ ‐ ‐ ‐
Workshops 541,925 540,050 1,875 540,050 ‐ ‐ ‐ 540,050 ‐ ‐ ‐ ‐ ‐ ‐ ‐ ‐ 1,875 1,875
Interest 127,080 75,000 52,080 75,000 2,199 43,256 27,859 953 733 ‐ ‐ ‐ ‐ ‐ ‐ ‐ 52,080 52,080
Miscellaneous ‐ ‐ ‐ ‐ ‐ ‐ ‐ ‐ ‐ ‐ ‐ ‐ ‐ ‐ ‐ ‐ ‐ ‐
Total Revenue (A) 29,796,365$ 27,997,050$ 1,799,315$ 27,997,050$ 886,794$ 15,129,885$ 10,824,136$ 924,914$ 231,321$ ‐$ ‐$ ‐$ ‐$ ‐$ ‐$ ‐$ 1,799,315$ 1,799,315$
Expenses
Personnel Expenses
Salaries 15,677,956$ 15,199,335$ 478,621$ 15,199,335$ 457,200$ 6,024,488$ 4,127,042$ 174,914$ 105,057$ 4,310,636$ ‐$ 1,891,468$ 990,660$ 766,172$ 395,155$ 267,181$ 478,621$ 478,621$
Payroll Taxes 1,126,127 1,089,355 36,772 1,089,355 30,434 457,104 309,708 12,496 8,630 270,983 ‐ 100,183 58,560 60,880 28,972 22,388 36,772 36,772
Benefits 2,367,236 2,293,855 73,381 2,293,855 37,366 770,127 501,612 19,229 11,652 953,869 ‐ 210,565 88,409 112,282 490,236 52,377 73,381 73,381
Retirement Costs 1,329,202 1,288,724 40,478 1,288,724 38,696 509,510 349,627 15,656 8,882 366,353 ‐ 158,406 83,969 64,378 35,896 23,704 40,478 40,478
Total Personnel Expenses 20,500,521$ 19,871,269$ 629,252$ 19,871,269$ 563,696$ 7,761,229$ 5,287,989$ 222,295$ 134,221$ 5,901,841$ ‐$ 2,360,622$ 1,221,598$ 1,003,712$ 950,259$ 365,650$ 629,252$ 629,252$
Meeting Expenses
Meetings 758,785$ 755,785$ 3,000$ 755,785$ 520$ 5,400$ 126,812$ 514,130$ ‐$ 108,923$ 40,133$ 68,190$ ‐$ ‐$ 600$ ‐$ 3,000$ 3,000$
Travel 1,420,089 1,401,209 18,880 1,401,209 20,200 843,277 239,345 10,315 ‐ 288,072 ‐ 210,257 35,760 15,500 21,430 5,125 18,880 18,880
Conference Calls 75,000 75,000 ‐ 75,000 ‐ ‐ ‐ ‐ ‐ 75,000 ‐ 75,000 ‐ ‐ ‐ ‐ ‐ ‐
Total Meeting Expenses 2,253,874$ 2,231,994$ 21,880$ 2,231,994$ 20,720$ 848,677$ 366,157$ 524,445$ ‐$ 471,995$ 40,133$ 353,447$ 35,760$ 15,500$ 22,030$ 5,125$ 21,880$ 21,880$
Operating Expenses
Consultants & Contracts 2,025,081$ 2,023,281$ 1,800$ 2,023,281$ ‐$ 397,221$ 1,185,000$ 4,560$ ‐$ 436,500$ ‐$ 281,500$ ‐$ 85,000$ 70,000$ ‐$ 1,800$ 1,800$
Office Rent 944,461 944,461 ‐ 944,461 ‐ ‐ ‐ ‐ ‐ 944,461 ‐ 943,586 ‐ 775 100 ‐ ‐ ‐
Office Costs 2,174,476 1,598,628 575,848 1,598,628 4,880 346,230 229,824 27,325 ‐ 990,369 1,500 172,250 27,400 548,202 98,670 142,347 575,848 575,848
Professional Services 903,710 903,710 ‐ 903,710 ‐ ‐ ‐ ‐ ‐ 903,710 ‐ 763,750 100,000 ‐ 9,260 30,700 ‐ ‐
Miscellaneous ‐ Expenses ‐ ‐ ‐ ‐ ‐ ‐ ‐ ‐ ‐ ‐ ‐ ‐
Depreciation 217,816 217,816 ‐ 217,816 ‐ ‐ 24,032 ‐ ‐ 193,784 ‐ 146,767 ‐ 46,325 692 ‐ ‐ ‐
Total Operating Expenses 6,265,544$ 5,687,896$ 577,648$ 5,687,896$ 4,880$ 743,451$ 1,438,856$ 31,885$ ‐$ 3,468,824$ 1,500$ 2,307,853$ 127,400$ 680,302$ 178,722$ 173,047$ 577,648$ 577,648$
Total Direct Expenses 29,019,939$ 27,791,159$ 1,228,780$ 27,791,159$ 589,296$ 9,353,357$ 7,093,002$ 778,625$ 134,221$ 9,842,660$ 41,633$ 5,021,922$ 1,384,758$ 1,699,514$ 1,151,011$ 543,822$ 1,228,780$ 1,228,780$
Indirect Expenses ‐$ (545,300)$ 545,300$ (545,300)$ 272,650$ 5,362,114$ 3,453,565$ 118,148$ 90,883$ (9,842,660)$ (41,633)$ (5,021,922)$ (1,384,758)$ (1,699,514)$ (1,151,011)$ (543,822)$ 545,300$ 545,300$
Other Non‐Operating Expenses ‐$ ‐$ ‐$ ‐$ ‐$ ‐$ ‐$ ‐$ ‐$ ‐$ ‐$ ‐$ ‐$ ‐$ ‐$ ‐$ ‐$ ‐$
Total Expenses (B) 29,019,939$ 27,245,859$ 1,774,080$ 27,245,859$ 861,946$ 14,715,470$ 10,546,566$ 896,773$ 225,104$ ‐$ ‐$ ‐$ ‐$ ‐$ ‐$ ‐$ 1,774,080$ 1,774,080$
Change in Assets 776,426$ 751,191$ 25,235$ 751,191$ 24,849$ 414,415$ 277,570$ 28,141$ 6,217$ ‐$ ‐$ ‐$ ‐$ ‐$ ‐$ ‐$ 25,235$ 25,235$
Fixed Assets
Depreciation (217,816)$ (217,816)$ ‐$ (217,816)$ ‐$ ‐$ (24,032)$ ‐$ ‐$ (193,784)$ ‐$ (146,767)$ ‐$ (46,325)$ (692)$ ‐$ ‐$ ‐$
Computer & Software CapEx 50,000 50,000 ‐ 50,000 ‐ ‐ ‐ ‐ ‐ 50,000 ‐ ‐ ‐ 50,000 ‐ ‐ ‐ ‐
Furniture & Fixtures CapEx ‐ ‐ ‐ ‐ ‐ ‐ ‐ ‐ ‐ ‐ ‐ ‐ ‐ ‐ ‐ ‐ ‐ ‐
Equipment CapEx 12,000 12,000 ‐ 12,000 ‐ ‐ ‐ ‐ ‐ 12,000 ‐ ‐ ‐ 12,000 ‐ ‐ ‐ ‐
Leasehold Improvements ‐ ‐ ‐ ‐ ‐ ‐ ‐ ‐ ‐ ‐ ‐ ‐ ‐ ‐ ‐ ‐ ‐ ‐
`
Allocation of Fixed Assets ‐ 7,301 (7,301) 7,301 (3,650) (71,794) (46,240) (1,582) (1,217) 131,784 ‐ 146,767 ‐ (15,675) 692 ‐ (7,301) (7,301)
Inc(Dec) in Fixed Assets (C) (155,816)$ (148,515)$ (7,301)$ (148,515)$ (3,650)$ (71,794)$ (70,272)$ (1,582)$ (1,217)$ ‐$ ‐$ ‐$ ‐$ ‐$ ‐$ ‐$ (7,301)$ (7,301)$
TOTAL BUDGET (B+C) 28,864,123$ 27,097,344$ 1,766,779$ 27,097,344$ 858,296$ 14,643,676$ 10,476,294$ 895,191$ 223,887$ ‐$ ‐$ ‐$ ‐$ ‐$ ‐$ ‐$ 1,766,779$ 1,766,779$
TOTAL CHANGE IN WORKING CAPITAL (A‐B‐C) 932,242$ 899,706$ 32,536$ 899,706$ 28,499$ 486,209$ 347,842$ 29,723$ 7,434$ ‐$ ‐$ ‐$ ‐$ ‐$ ‐$ ‐$ 32,536$ 32,536$
FTEs 149.0 143.0 6.0 143.0 3.0 59.0 38.0 1.3 1.0 40.7 ‐ 16.8 7.0 8.7 4.0 4.3 6.0 6.0
HC 149.0 143.0 6.0 143.0 3.0 59.0 38.0 1.0 1.0 41.0 ‐ 17.0 7.0 9.0 4.0 4.0 6.0 6.0
Statement of Activities and Capital Expenditures by
Program
2016 Budget
Non‐Statutory FunctionsFunctions in Delegation Agreement
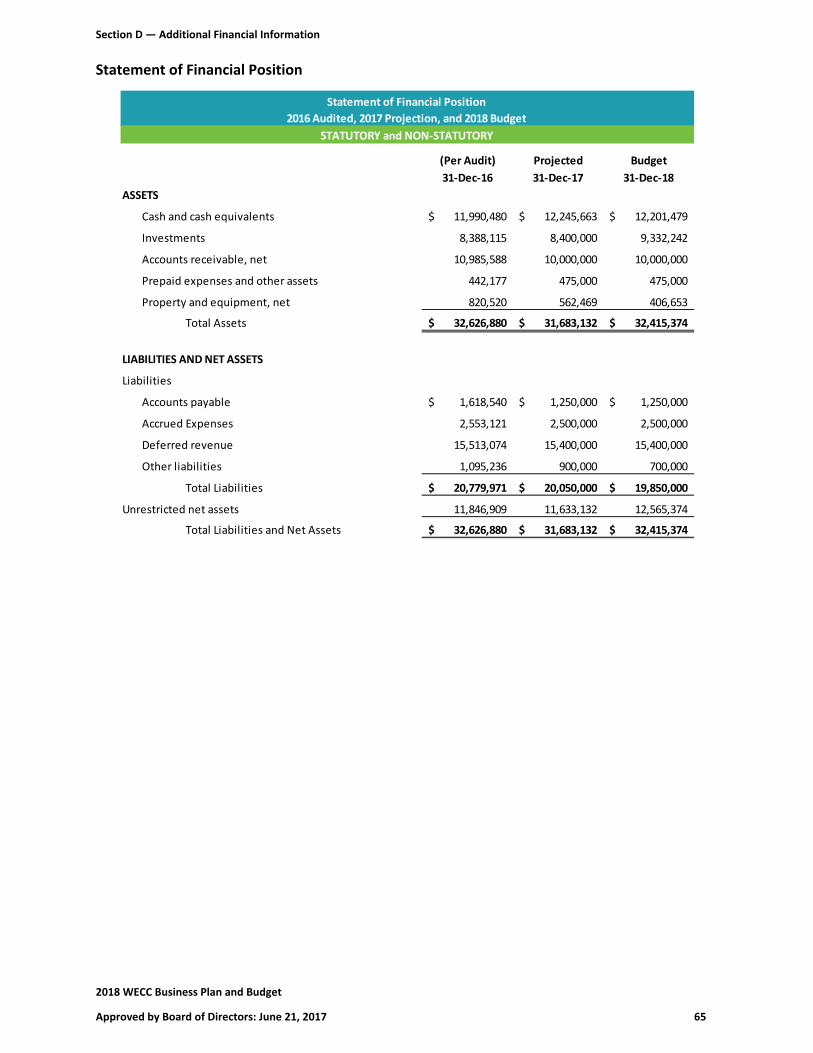
Section D — Additional Financial Information
2018 WECC Business Plan and Budget
Approved by Board of Directors: June 21, 2017 65
Statement of Financial Position
(Per Audit) Projected Budget
31‐Dec‐16 31‐Dec‐17 31‐Dec‐18
ASSETS
Cash and cash equivalents 11,990,480$ 12,245,663$ 12,201,479$
Investments 8,388,115 8,400,000 9,332,242
Accounts receivable, net 10,985,588 10,000,000 10,000,000
Prepaid expenses and other assets 442,177 475,000 475,000
Property and equipment, net 820,520 562,469 406,653
Total Assets 32,626,880$ 31,683,132$ 32,415,374$
LIABILITIES AND NET ASSETS
Liabilities
Accounts payable 1,618,540$ 1,250,000$ 1,250,000$
Accrued Expenses 2,553,121 2,500,000 2,500,000
Deferred revenue 15,513,074 15,400,000 15,400,000
Other liabilities 1,095,236 900,000 700,000
Total Liabilities 20,779,971$ 20,050,000$ 19,850,000$
Unrestricted net assets 11,846,909 11,633,132 12,565,374
Total Liabilities and Net Assets 32,626,880$ 31,683,132$ 32,415,374$
STATUTORY and NON‐STATUTORY
Statement of Financial Position
2016 Audited, 2017 Projection, and 2018 Budget
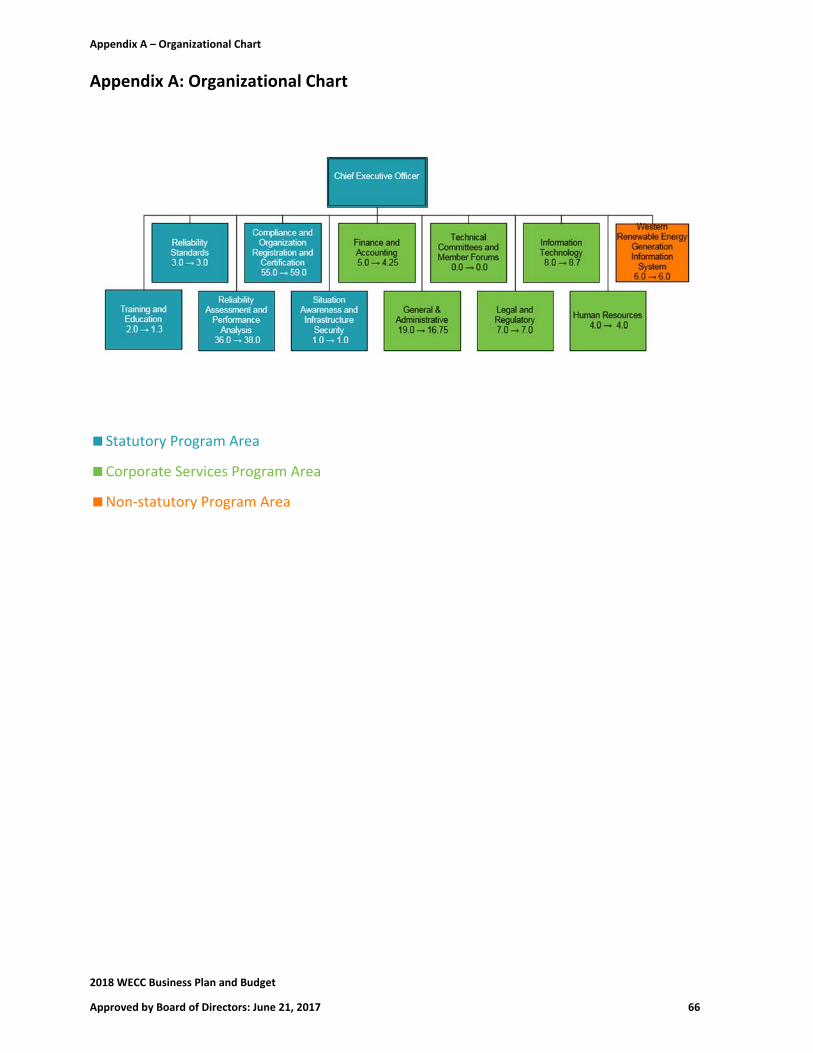
Appendix A – Organizational Chart
2018 WECC Business Plan and Budget
Approved by Board of Directors: June 21, 2017 66
Appendix A: Organizational Chart
Statutory Program Area
Corporate Services Program Area
Non‐statutory Program Area
Appendix B – 2018 Budget & Projected 2019 and 2020 Budgets
2018 WECC Business Plan and Budget
Approved by Board of Directors: June 21, 2017 67
Appendix B: 2018 Budget & Projected 2019 and 2020 Budgets
Key Assumptions
Assessments
A 1 percent increase per WECC’s assessment stabilization initiative.
Personnel Expenses
A 3 percent average merit increase in Salaries.
A 3 percent increase in Payroll Taxes and Retirements Costs.
A 4 percent increase in Benefits.
Meeting Expenses
Travel, Meetings, and Conference Calls are assumed to remain at 2018 budgeted levels.
Operating Expenses
A net reduction in Consultants and Contracts of $400,000 in 2019 due to completion of
one‐time RAPA consulting projects budgeted in 2018, reduced use of contractors in the
CMEP, and the addition of new 2019 one‐time projects. Consultants used for ongoing
studies and assessments remain at current levels.
An increase in office rent in 2020 due to the renegotiation/renewal of WECC’s Salt Lake
City office space.
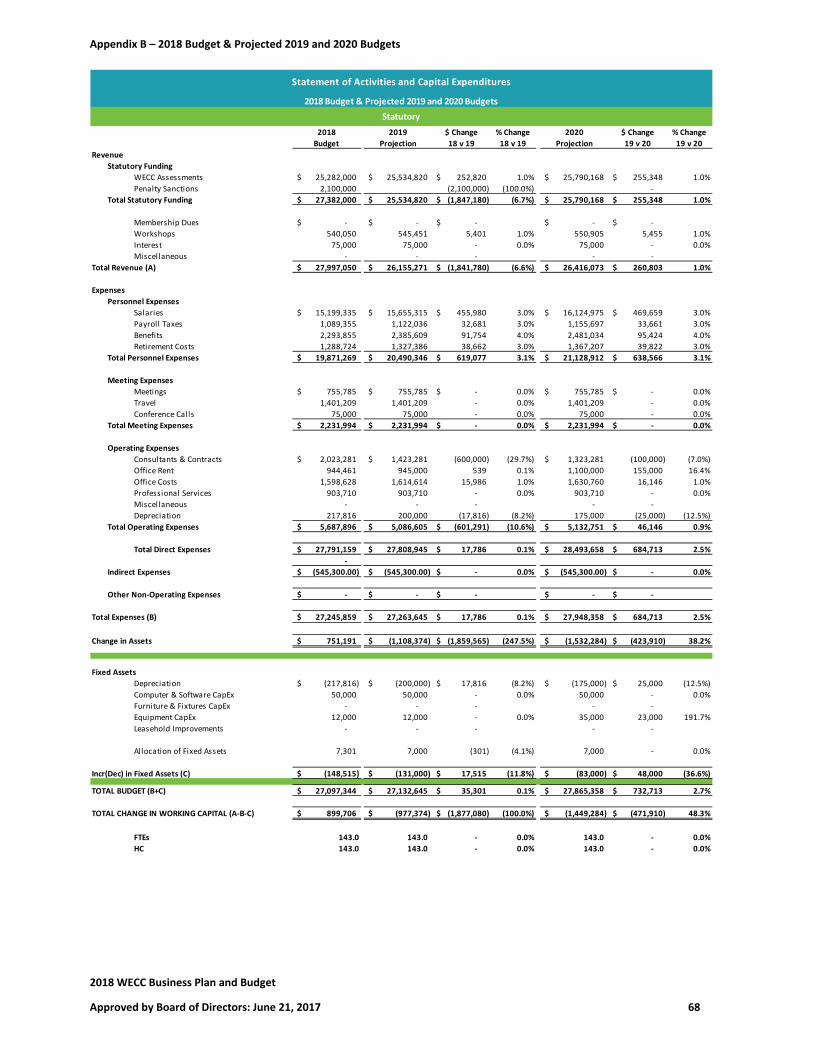
Appendix B – 2018 Budget & Projected 2019 and 2020 Budgets
2018 WECC Business Plan and Budget
Approved by Board of Directors: June 21, 2017 68
2018 2019 $ Change % Change 2020 $ Change % Change
Budget Projection 18 v 19 18 v 19 Projection 19 v 20 19 v 20
Revenue
Statutory Funding
WECC Assessments 25,282,000$ 25,534,820$ 252,820$ 1.0% 25,790,168$ 255,348$ 1.0%
Penalty Sanctions 2,100,000 (2,100,000) (100.0%) ‐
Total Statutory Funding 27,382,000$ 25,534,820$ (1,847,180)$ (6.7%) 25,790,168$ 255,348$ 1.0%
Membership Dues ‐$ ‐$ ‐$ ‐$ ‐$
Workshops 540,050 545,451 5,401 1.0% 550,905 5,455 1.0%
Interest 75,000 75,000 ‐ 0.0% 75,000 ‐ 0.0%
Miscellaneous ‐ ‐ ‐ ‐ ‐
Total Revenue (A) 27,997,050$ 26,155,271$ (1,841,780)$ (6.6%) 26,416,073$ 260,803$ 1.0%
Expenses
Personnel Expenses
Salaries 15,199,335$ 15,655,315$ 455,980$ 3.0% 16,124,975$ 469,659$ 3.0%
Payroll Taxes 1,089,355 1,122,036 32,681 3.0% 1,155,697 33,661 3.0%
Benefits 2,293,855 2,385,609 91,754 4.0% 2,481,034 95,424 4.0%
Retirement Costs 1,288,724 1,327,386 38,662 3.0% 1,367,207 39,822 3.0%
Total Personnel Expenses 19,871,269$ 20,490,346$ 619,077$ 3.1% 21,128,912$ 638,566$ 3.1%
Meeting Expenses
Meetings 755,785$ 755,785$ ‐$ 0.0% 755,785$ ‐$ 0.0%
Travel 1,401,209 1,401,209 ‐ 0.0% 1,401,209 ‐ 0.0%
Conference Calls 75,000 75,000 ‐ 0.0% 75,000 ‐ 0.0%
Total Meeting Expenses 2,231,994$ 2,231,994$ ‐$ 0.0% 2,231,994$ ‐$ 0.0%
Operating Expenses
Consultants & Contracts 2,023,281$ 1,423,281$ (600,000) (29.7%) 1,323,281$ (100,000) (7.0%)
Office Rent 944,461 945,000 539 0.1% 1,100,000 155,000 16.4%
Office Costs 1,598,628 1,614,614 15,986 1.0% 1,630,760 16,146 1.0%
Professional Services 903,710 903,710 ‐ 0.0% 903,710 ‐ 0.0%
Miscellaneous ‐ ‐ ‐ ‐ ‐
Depreciation 217,816 200,000 (17,816) (8.2%) 175,000 (25,000) (12.5%)
Total Operating Expenses 5,687,896$ 5,086,605$ (601,291)$ (10.6%) 5,132,751$ 46,146$ 0.9%
Total Direct Expenses 27,791,159$ 27,808,945$ 17,786$ 0.1% 28,493,658$ 684,713$ 2.5%
‐
Indirect Expenses (545,300.00)$ (545,300.00)$ ‐$ 0.0% (545,300.00)$ ‐$ 0.0%
Other Non‐Operating Expenses ‐$ ‐$ ‐$ ‐$ ‐$
Total Expenses (B) 27,245,859$ 27,263,645$ 17,786$ 0.1% 27,948,358$ 684,713$ 2.5%
Change in Assets 751,191$ (1,108,374)$ (1,859,565)$ (247.5%) (1,532,284)$ (423,910)$ 38.2%
Fixed Assets
Depreciation (217,816)$ (200,000)$ 17,816$ (8.2%) (175,000)$ 25,000$ (12.5%)
Computer & Software CapEx 50,000 50,000 ‐ 0.0% 50,000 ‐ 0.0%
Furniture & Fixtures CapEx ‐ ‐ ‐ ‐ ‐
Equipment CapEx 12,000 12,000 ‐ 0.0% 35,000 23,000 191.7%
Leasehold Improvements ‐ ‐ ‐ ‐ ‐
Allocation of Fixed Assets 7,301 7,000 (301) (4.1%) 7,000 ‐ 0.0%
Incr(Dec) in Fixed Assets (C) (148,515)$ (131,000)$ 17,515$ (11.8%) (83,000)$ 48,000$ (36.6%)
TOTAL BUDGET (B+C) 27,097,344$ 27,132,645$ 35,301$ 0.1% 27,865,358$ 732,713$ 2.7%
TOTAL CHANGE IN WORKING CAPITAL (A‐B‐C) 899,706$ (977,374)$ (1,877,080)$ (100.0%) (1,449,284)$ (471,910)$ 48.3%
FTEs 143.0 143.0 ‐ 0.0% 143.0 ‐ 0.0%
HC 143.0 143.0 ‐ 0.0% 143.0 ‐ 0.0%
2018 Budget & Projected 2019 and 2020 Budgets
Statement of Activities and Capital Expenditures
Statutory
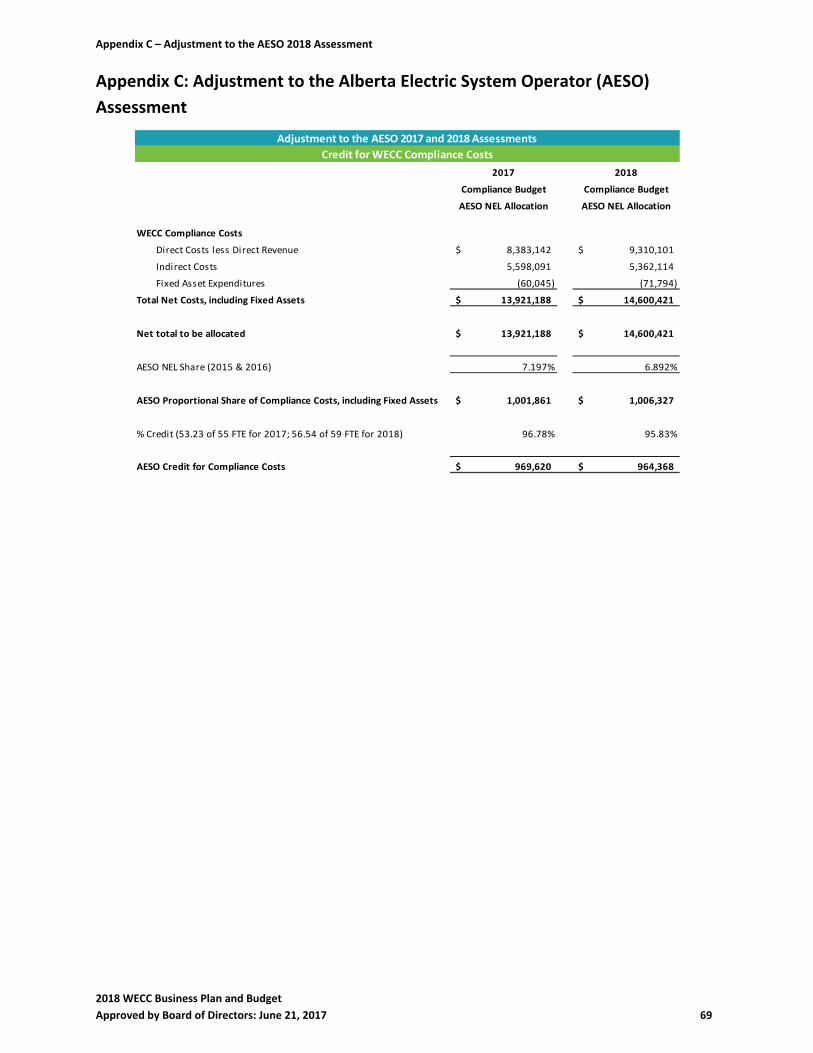
Appendix C – Adjustment to the AESO 2018 Assessment
2018 WECC Business Plan and Budget
Approved by Board of Directors: June 21, 2017 69
Appendix C: Adjustment to the Alberta Electric System Operator (AESO)
Assessment
2017 2018
Compliance Budget Compliance Budget
AESO NEL Allocation AESO NEL Allocation
WECC Compliance Costs
Direct Costs less Direct Revenue 8,383,142$ 9,310,101$
Indirect Costs 5,598,091 5,362,114
Fixed Asset Expenditures (60,045) (71,794)
Total Net Costs, including Fixed Assets 13,921,188$ 14,600,421$
Net total to be allocated 13,921,188$ 14,600,421$
AESO NEL Share (2015 & 2016) 7.197% 6.892%
AESO Proportional Share of Compliance Costs, including Fixed Assets 1,001,861$ 1,006,327$
% Credit (53.23 of 55 FTE for 2017; 56.54 of 59 FTE for 2018) 96.78% 95.83%
AESO Credit for Compliance Costs 969,620$ 964,368$
Adjustment to the AESO 2017 and 2018 Assessments
Credit for WECC Compliance Costs
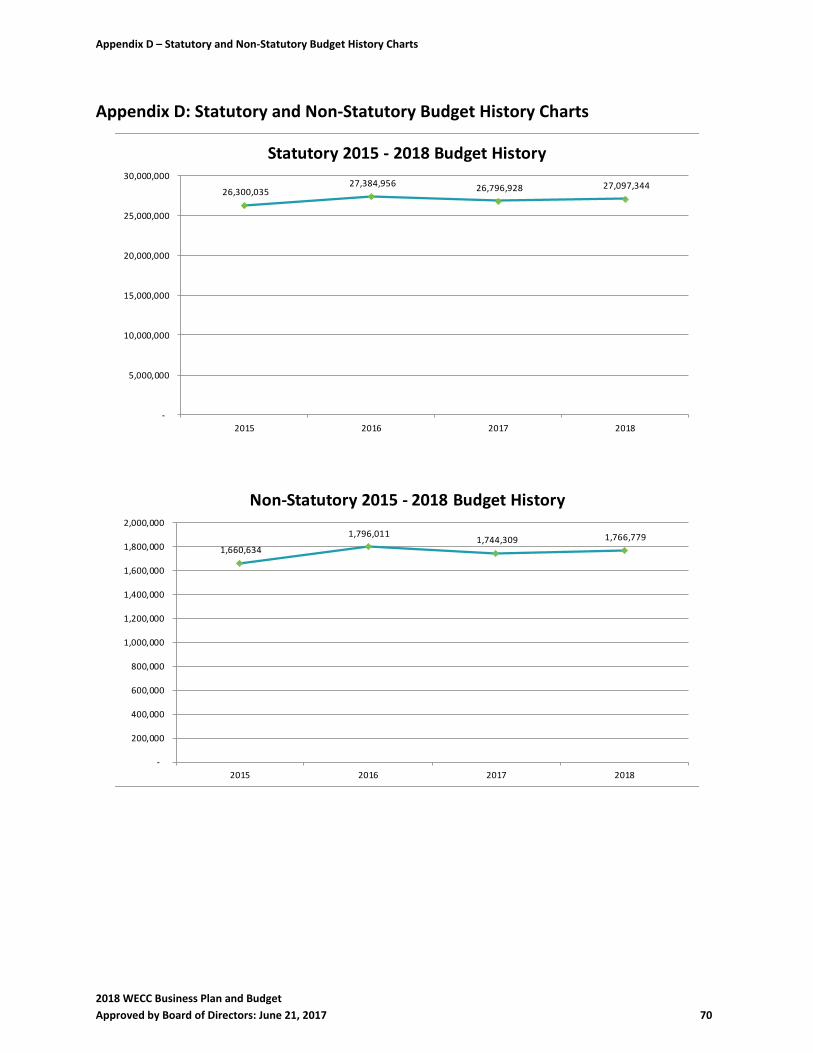
Appendix D – Statutory and Non‐Statutory Budget History Charts
2018 WECC Business Plan and Budget
Approved by Board of Directors: June 21, 2017 70
Appendix D: Statutory and Non‐Statutory Budget History Charts
26,300,035 27,384,956 26,796,928 27,097,344
‐
5,000,000
10,000,000
15,000,000
20,000,000
25,000,000
30,000,000
2015 2016 2017 2018
Statutory 2015 ‐ 2018 Budget History
1,660,634
1,796,011 1,744,309 1,766,779
‐
200,000
400,000
600,000
800,000
1,000,000
1,200,000
1,400,000
1,600,000
1,800,000
2,000,000
2015 2016 2017 2018
Non‐Statutory 2015 ‐ 2018 Budget History