Embed Size (px)
Citation preview

December 2018NEXUS pipeline project
Enbridge2018 ANNUAL INVESTOR DAY

Contents
01
03
05
15
23
28
41
Legal Notice
Opening Remarks
Strategic Overview
Gas Transmission and Midstream
Utilities
Liquids Pipelines
Corporate Finance
Concluding Remarks 51

Legal Notice Forward Looking Information This presentation includes certain forward looking statements and information (FLI) to provide potential investors and shareholders of Enbridge Inc. (Enbridge or the Company) with information about Enbridge and its subsidiaries and affiliates, including management’s assessment of their future plans and operations, which FLI may not be appropriate for other purposes. FLI is typically identified by words such as “anticipate”, “expect”, “project”, “estimate”, “forecast”, “plan”, “intend”, “target”, “believe”, “likely” and similar words suggesting future outcomes or statements regarding an outlook. All statements other than statements of historical fact may be FLI. In particular, this presentation contains FLI pertaining to, but not limited to, information with respect to the following: strategic priorities and guidance; expected EBITDA and expected adjusted EBITDA; expected DCF and DCF/share; expected free cash flow; expected future debt/EBITDA; expected return on equity; annual dividend growth and anticipated dividend increases; financial flexibility; funding requirements and strategy; financing sources, plans and targets; capital allocation; secured growth projects and future growth, development and expansion program and opportunities; future business prospects and performance, including organic growth outlook; closing of announced acquisitions, dispositions, amalgamations and corporate simplification and sponsored vehicle transactions, and the timing, expected benefits and impact thereof; synergies, integration and streamlining plans; project execution, including capital costs, expected construction and in service dates and expected regulatory approvals; system throughput, capacity, expansions and potential future capacity solutions, including optimizations and reversals; tolling approach; and industry and market conditions, including economic growth, population, customer and rate base growth, and energy supply and demand, capacity sources, prices, costs and exports.
Although we believe that the FLI is reasonable based on the information available today and processes used to prepare it, such statements are not guarantees of future performance and you are cautioned against placing undue reliance on FLI. By its nature, FLI involves a variety of assumptions, which are based upon factors that may be difficult to predict and that may involve known and unknown risks and uncertainties and other factors which may cause actual results, levels of activity and achievements to differ materially from those expressed or implied by the FLI, including, but not limited to, the following: expected EBITDA and expected adjusted EBITDA; expected future cash flows; expected future DCF and DCF per share; estimated future dividends; financial strength and flexibility; debt and equity market conditions, including the ability to access capital markets on favourable terms or at all; cost of debt and equity capital; credit ratings; capital project funding; the expected supply of, demand for and prices of crude oil, natural gas, natural gas liquids and renewable energy; economic and competitive conditions; exchange rates; inflation; interest rates; changes in tax laws and tax rates; changes in trade agreements; completion of growth projects; anticipated construction and in-service dates; availability and price of labour and construction materials; operational reliability and performance; changes in tariff rates; customer and regulatory approvals; maintenance of customer and other stakeholder support and regulatory approvals for projects; weather; governmental legislation; announced and potential acquisition, disposition, amalgamation and corporate simplification transactions, and the timing and impact thereof; impact of capital project execution on the Company’s future cash flows; the ability of management to execute key priorities; and the effectiveness of various actions resulting from the Company’s strategic priorities. We caution that the foregoing list of factors is not exhaustive. Additional information about these and other assumptions, risks and uncertainties can be found in applicable filings with Canadian and U.S. securities regulators (including the most recently filed Form 10-K and any subsequently filed Form 10-Q, as applicable). Due to the interdependencies and correlation of these factors, as well as other factors, the impact of any one assumption, risk or uncertainty on FLI cannot be determined with certainty.
Except to the extent required by applicable law, we assume no obligation to publicly update or revise any FLI made in this presentation or otherwise, whether as a result of new information, future events or
Enbridge Investor Day 1

otherwise. All FLI in this presentation and all subsequent FLI, whether written or oral, attributable to Enbridge, or any of its subsidiaries or affiliates, or persons acting on their behalf, are expressly qualified in its entirety by these cautionary statements.
Non-GAAP MeasuresThis presentation makes reference to non-GAAP measures, including adjusted earnings before interest, income taxes, depreciation and amortization (Adjusted EBITDA), distributable cash flow (DCF) and DCF per share. Adjusted EBITDA represents EBITDA adjusted for unusual, non-recurring or non-operating factors on both a consolidated and segmented basis. Management uses adjusted EBITDA to set targets and to assess performance. DCF is defined as cash flow provided by operating activities before changes in operating assets and liabilities (including changes in environmental liabilities) less distributions to non-controlling interests and redeemable non-controlling interests, preference share dividends and maintenance capital expenditures, and further adjusted for unusual, non-recurring or non-operating factors. Management also uses DCF to assess performance and to set its dividend or distribution payout target. Management believes the presentation of these measures gives useful information to investors and shareholders as they provide increased transparency and insight into the performance of Enbridge and its subsidiaries and affiliates. Reconciliations of forward looking non-GAAP financial measures to comparable GAAP measures are not available due to the challenges and impracticability with estimating some of the items, particularly with estimates for certain contingent liabilities, and estimating non-cash unrealized derivative fair value losses and gains and ineffectiveness on hedges which are subject to market variability and therefore a reconciliation is not available without unreasonable effort.
These measures are not measures that have a standardized meaning prescribed by generally accepted accounting principles in the United States of America (U.S. GAAP) and may not be comparable with similar measures presented by other issuers. A reconciliation of historical non-GAAP measures to the most directly comparable GAAP measures is available on the Company’s website. Additional information on non-GAAP measures may be found in the Company’s earnings news releases or in additional information on the Company’s website, www.sedar.com or www.sec.gov.
Enbridge Investor Day 2

New York CityDecember 11, 2018
Enbridge Investor Day
Safety Moment
2
Building Evacuation Procedures
Enbridge Investor Day 3

Strategic Overview Al Monaco 8:30
Gas Transmission & Midstream Bill Yardley 9:30
Utilities Cynthia Hansen 10:15
Break 10:30
Liquids Pipelines Guy Jarvis 10:45
Corporate Finance John Whelen 11:30
Concluding Remarks Al Monaco 12:15
Agenda
3
Legal Notice
4
Forward Looking InformationThis presentation includes certain forward looking statements and information (FLI) to provide potential investors and shareholders of Enbridge Inc. (Enbridge or the Company) with information about Enbridge and its subsidiaries and affiliates, including management’s assessment of their future plans and operations, which FLI may not be appropriate for other purposes. FLI is typically identified by words such as “anticipate”, “expect”, “project”, “estimate”, “forecast”, “plan”, “intend”, “target”, “believe”, “likely” and similar words suggesting future outcomes or statements regarding an outlook. All statements other than statements of historical fact may be FLI. In particular, this presentation contains FLI pertaining to, but not limited to, information with respect to the following: strategic priorities and guidance; expected EBITDA and expected adjusted EBITDA; expected DCF and DCF/share; expected free cash flow; expected future debt/EBITDA; expected return on equity; annual dividend growth and anticipated dividend increases; financial flexibility; funding requirements and strategy; financing sources, plans and targets; capital allocation; secured growth projects and future growth, development and expansion program and opportunities; future business prospects and performance, including organic growth outlook; closing of announced acquisitions, dispositions, amalgamations and corporate simplification and sponsored vehicle transactions, and the timing, expected benefits and impact thereof; synergies, integration and streamlining plans; project execution, including capital costs, expected construction and in service dates and expected regulatory approvals; system throughput, capacity, expansions and potential future capacity solutions, including optimizations and reversals; tolling approach; and industry and market conditions, including economic growth, population, customer and rate base growth, and energy supply and demand, capacity sources, prices, costs and exports.
Although we believe that the FLI is reasonable based on the information available today and processes used to prepare it, such statements are not guarantees of future performance and you are cautioned against placing undue reliance on FLI. By its nature, FLI involves a variety of assumptions, which are based upon factors that may be difficult to predict and that may involve known and unknown risks and uncertainties and other factors which may cause actual results, levels of activity and achievements to differ materially from those expressed or implied by the FLI, including, but not limited to, the following: expected EBITDA and expected adjusted EBITDA; expected future cash flows; expected future DCF and DCF per share; estimated future dividends; financial strength and flexibility; debt and equity market conditions, including the ability to access capital markets on favourable terms or at all; cost of debt and equity capital; credit ratings; capital project funding; the expected supply of, demand for and prices of crude oil, natural gas, natural gas liquids and renewable energy; economic and competitive conditions; exchange rates; inflation; interest rates; changes in tax laws and tax rates; changes in trade agreements; completion of growth projects; anticipated construction and in-service dates; availability and price of labour and construction materials; operational reliability and performance; changes in tariff rates; customer and regulatory approvals; maintenance of customer and other stakeholder support and regulatory approvals for projects; weather; governmental legislation; announced and potential acquisition, disposition, amalgamation and corporate simplification transactions, and the timing and impact thereof; impact of capital project execution on the Company’s future cash flows; the ability of management to execute key priorities; and the effectiveness of various actions resulting from the Company’s strategic priorities. We caution that the foregoing list of factors is not exhaustive. Additional information about these and other assumptions, risks and uncertainties can be found in applicable filings with Canadian and U.S. securities regulators (including the most recently filed Form 10-K and any subsequently filed Form 10-Q, as applicable). Due to the interdependencies and correlation of these factors, as well as other factors, the impact of any one assumption, risk or uncertainty on FLI cannot be determined with certainty.
Except to the extent required by applicable law, we assume no obligation to publicly update or revise any FLI made in this presentation or otherwise, whether as a result of new information, future events or otherwise. All FLI in this presentation and all subsequent FLI, whether written or oral, attributable to Enbridge, or any of its subsidiaries or affiliates, or persons acting on their behalf, are expressly qualified in its entirety by these cautionary statements.
Non-GAAP MeasuresThis presentation makes reference to non-GAAP measures, including adjusted earnings before interest, income taxes, depreciation and amortization (Adjusted EBITDA), distributable cash flow (DCF) and DCF per share. Adjusted EBITDA represents EBITDA adjusted for unusual, non-recurring or non-operating factors on both a consolidated and segmented basis. Management uses adjusted EBITDA to set targets and to assess performance. DCF is defined as cash flow provided by operating activities before changes in operating assets and liabilities (including changes in environmental liabilities) less distributions to non-controlling interests and redeemable non-controlling interests, preference share dividends and maintenance capital expenditures, and further adjusted for unusual, non-recurring or non-operating factors. Management also uses DCF to assess performance and to set its dividend or distribution payout target. Management believes the presentation of these measures gives useful information to investors and shareholders as they provide increased transparency and insight into the performance of Enbridge and its subsidiaries and affiliates. Reconciliations of forward looking non-GAAP financial measures to comparable GAAP measures are not available due to the challenges and impracticability with estimating some of the items, particularly with estimates for certain contingent liabilities, and estimating non-cash unrealized derivative fair value losses and gains and ineffectiveness on hedges which are subject to market variability and therefore a reconciliation is not available without unreasonable effort.
These measures are not measures that have a standardized meaning prescribed by generally accepted accounting principles in the United States of America (U.S. GAAP) and may not be comparable with similar measures presented by other issuers. A reconciliation of historical non-GAAP measures to the most directly comparable GAAP measures is available on the Company’s website. Additional information on non-GAAP measures may be found in the Company’s earnings news releases or in additional information on the Company’s website, www.sedar.com or www.sec.gov.
Enbridge Investor Day 4

President & CEOAl Monaco
Strategic Overview
Highlights
2
2019 DCF guidance $4.30 - $4.60 per share
2019 dividend increase 10%
DCF/share and DPS CAGR through 2020 10%
Newly secured projects $1.8B
Annual DCF/share growth rate post-2020 5-7%
Liquids Pipelines Mainline• Contract proposal
• Throughput optimizations
Enbridge Investor Day 5

2016 2018
EBITDA $6.9B $12.5B
EBITDAby Business
20% Natural Gas
45%Natural Gas
Total Assetsby Geography
50%U.S.
60%U.S.
Enbridge Transformation
3
Delivering North America’s Energy
25%of North America’s
Crude Oil Transported
22%of North America’s
Natural Gas Transported
2 Bcf/dof gas distributed in
Ontario
4
• Regulated / demand-pull assets
• Long term contracts
• Interest rate / inflation protection
• Minimal commodity risk
• Creditworthy counterparties
• Financial risk management
Low Risk Business Model
~98%Regulated/Take or Pay/
Fixed Fee
Low risk business model with highly predictable cash flows differentiates Enbridge from peers
2019e EBITDA Resiliency in All Market Conditions
$0
$25
$50
$75
$100
$0
$2,000
$4,000
$6,000
$8,000
$10,000
$12,000
$14,000
2008 2009 2010 2011 2012 2013 2014 2015 2016 2017* 2018e*
Financial Crisis Commodity Price Collapse
WTI
Adjusted EBITDA
* Includes EBITDA from the Spectra Energy merger
Enbridge Investor Day 6

Major 2018 Accomplishments
5
1. Deliver cash flow & dividend growth • Strong financial and operating performance• $7B projects brought into service
2. Move to pure regulated model • $7.8B of non-core asset sales
3. Accelerate de-leveraging • 4.7x Debt-to-EBITDA; DRIP suspended
4. Streamline the business• On track to achieve $540M synergy target• Reached agreements to buy-in sponsored vehicles• Combining gas utilities
5. Extend growth beyond 2020 • Sanctioned $1.8B of new extension/expansion projects
ActionsPriorities
Financial outlook maintained but with lower risk, stronger balance sheet and simplified structure
3.52 3.57 3.62 3.67 3.69
2014 2015 2016 2017 2018e
1,9952,185
2,405 2,530 ~2,650
2014 2015 2016 2017 2018e
3 Core Businesses Driving Record Results
• Excellent operating performance
• $20B of projects placed into service (2017 & 2018)
• Record pipeline demand - Liquids and Natural Gas
• Strong, highly creditworthy customers
6
2017a 2018e
Adjusted EBITDA
Annual Liquids Mainline Volume (ex-Gretna throughput MMbpd)
U.S. Gas Transmission Re-contracting Rates Total Utility Customers
(million)
99% 97% 98% 98% ~98%
2014 2015 2016 2017 2018e
Enbridge Investor Day 7

95 113
93
128
2016 2040
22 19 20
25
2016 2040
352
522
2016 2040
93106
2016 2040
Longevity of Energy Infrastructure
7Source: International Energy Agency
North America well-positioned to meet global demand for decades
N. America Demand & SupplyN. America Demand & Supply
Global Demand Global Demand
DemandSupply
Crude Oil (MMb/d) Natural Gas (Bcf/d)
Plan Priorities
Continuing Priorities• Deliver strong cash flow and dividends
• Pure pipeline-utility model
• Strong balance sheet
• Streamline, simplify the business
• Extend growth
Areas of Emphasis• Enhance core business returns
• Expand, extend existing footprint
• Capital allocation
8
Safety, reliability and environmental protection are foundational priorities
Enbridge Investor Day 8

Gas Transmission – Strategic Growth Prospects
• Rate cases • System modernization
9
$3BSecured projects
in execution
$2-3Bper year future development opportunities
post-2020
1-2%per year
base businessgrowth
post-2020
• T-South expansion• T-North expansions• Vito offshore pipelines (new)• Cameron Lateral (new)
• USGC & Canadian LNG connections• Further W. Canadian expansions
• Premier demand-pull driven asset base serving key regional markets
• Positioned for significant growth in 4 key regions
TORONTO
OTTAWA
DAWN HUB
ONTARIO
Utilities– Strategic Growth Prospects
• Amalgamation synergies• Cost management• Revenue escalators• Storage & transportation optimization
10
• Rate base additions driven by customer growth
• Post-2020 customer additions• Community expansions• Dawn-Parkway expansions• RNG/CNG growth• Ontario electricity transmission
• Largest and fastest growing gas utility franchise in North America
• Steady annual growth opportunities through new customer additions and system expansions
$1BSecured projects
in execution
~$1Bper year future development opportunities
post-2020
1-2%per year
base businessgrowth
post-2020
Enbridge Investor Day 9

Liquids Pipelines – Strategic Growth Prospects
• Mainline toll framework• Throughput optimization • Toll indexing• Efficiency & productivity
11
• Line 3 replacement• Southern Access Expansion• AOC lateral (new)• Gray Oak pipeline (new)
• System optimizations and enhancements• Market extension expansions• Regional systems expansions• USGC export infrastructure
• Critical link from WCSB to premium Midwest and USGC refining markets
• Leverage existing footprint to expand crude export capacity and develop integrated USGC platform
$11BSecured projects
in execution
~$2Bper year future development opportunities
post-2020
2-3%per year
base businessgrowth
post-2020
Self Funding & Capital Allocation - Context
12
$0.00
$0.50
$1.00
$1.50
$2.00
$2.50
$3.00
$3.50
$4.00
$4.50
$5.00
2014 2020e
$5.00
No further common equity issuance
0
1,000
2,000
2014 2019e 2020+
Organic Growth
Simplification
Diversification
DCF/share (millions)Common Shares outstanding (millions)
Enbridge Investor Day 10

Capital Available to Invest - 2020 & Beyond
13
$0
$6
$12
Cash Flow from Operations
Free Cash Flow Available Capital
Dividends
Maintenance Capital
DebtCapacity
$5-6B~$3.5B
In 2020 and beyond, Enbridge will generate $5-6B annually for reinvestment
Capital Allocation Framework
14
Optimize capital deployment within financial policy constraints to maximize long-term shareholder value
Choices
Financial Policy Filter
Value Drivers Growth Rate | ROCE | Credit Metrics
Project Level Returns Exceed Hurdle RateSelf Funding: $5-6 B
Dividend Pay-out: ~65% DCFConservative Leverage Targets: 4.5x – comfortably below 5x
Organic Growth
Debt Repayment
Share Repurchase
DividendGrowth
Asset Monetization
Large-ScaleM&A
Enbridge Investor Day 11

Capital Allocation Priorities
15
OptionsCurrent Rank Rationale Guideposts for Action
OrganicGrowth High
Attractive opportunities
Protects base, advances strategy
• Availability of core low risk projects
• Accretive to value and DCF/share
Debt Repayment Medium
Preserves optionality
X Dilutive to growth rate• Emerging opportunities justify creating
additional B/S flexibility
Share Repurchase Medium
Stock undervalued
X Does not advance strategy
• Shares below fundamental value
• Return in excess of organic growth
Asset Monetization Low
X Achieved B/S metrics
X Most remaining assets are core
• Accretive to per-share metrics & value
• Neutral to leverage and growth
Primary focus currently on organic growth opportunities but will assess against all other alternatives
Post 2020
5-7%DCF per share growth
Growth Outlook
• Strong organic growth opportunities from 3 core businesses
• Low risk business model
• Self funded equity
• Prudent leverage levels
• Disciplined capital allocation
16
Annual DCF/share growth of 10% through 2020, then 5-7% thereafter
Through 2020
10%DCF and dividend
per share growth rate
Enbridge Investor Day 12

Focus on Energy Sustainability
• Energy demand growth decoupled from GDP
• Reduced emissions to below 1992 levels (U.S.)
• Oilsands lowered intensity by 21%
• Demand management programs reduce consumption, emissions
• Renewable energy
• ESG performance
17
0
5
10
15
20
25
30
35
2005 2006 2007 2008 2009 2010 2011 2012 2013 2014 2015
Demand Side Management(Cumulative C02e Reductions – Lifetime)
Equivalent to taking
6.5 millioncars off the road for 1 year
GDP vs Energy Demand Growth*
0.0
0.4
0.8
1.2
1.6
2.0
2000 2002 2004 2006 2008 2010 2012 2014 2016
Global GDP
Energy Demand
CO2
Union Gas
Enbridge Gas Distribution
Energy industry progress on lowering emissions intensity *Source: IEA
Our #1 Priority: Safety & Operational Reliability
18
We performed
26,300+ pipeline integrity
inspections in 2017
We invested
$8+B 2012-18 to maintain the integrity of our system
We monitor our lines
24-7-365with people and computerized
leak detection systems
We held
265+ emergency exercises
drills in 2017
We’re committed to safety and environmental protection
Enbridge Investor Day 13

Enbridge’s Value Proposition
19
• Leading energy infrastructure position
• Low-risk pure regulated business model
• Strong investment grade credit profile
• 10% DCF and dividend through 2020
• 5-7% DCF growth beyond 2020
Long-life attractive growing yield with lowest risk profile in the sector
Q&A
Enbridge Investor Day 14

President & EVP, Gas Transmission & MidstreamBill Yardley
Gas Transmission & Midstream
Premier Gas Transmission Footprint
2
2018 Accomplishments• Placed 11 projects into service
valued at ~$6B, includingNEXUS and Valley Crossing
• ~98% contract renewal rate
• Filed Texas Eastern rate case
• Focused on core U.S. andCanada pipelines
Canadian Gas Transmission
U.S. Transmission DCP Midstream
Our assetfootprint is
unparalleled & provides a solidbase for growth
Enbridge Investor Day 15

2018 2020 2025 2030
Natural Gas Demand is Growing & Diversified
3
N. Gas Demand Growth by Region (Bcf/d increases by 2035) N. Gas Demand by Sector (N. America, Bcf/d)
E. Canada
+0.6W. Canada
+2.5
Rockies
+1.3West Coast
+0.4 Midwest
+2.8
Northeast
+3.1
South
+3.5Gulf Coast
+6.1
Source: Wood Mac, PIRA Source: Wood Mac, PIRA
LNG Exports
Mexico Exports
Other
Power Gen
Industrial
Residential/ Commercial
Capacity needed Proposed additions
Growing LNG Demand Presents Opportunity
4Sources: WoodMac, IHS, EIA, Enbridge research
2015 2020 2025 2030
Global LNG Demand (Bcf/d) Global Liquefaction Capacity (Bcf/d)
Global LNG demand expected to grow to
~65Bcf/dthrough 2030
Global demand for LNG creates opportunities for large-scale, export-oriented infrastructure
U.S. brownfield
International
NA greenfield
~22 Bcf/dNew capacity
required by 2030 to support demand
Enbridge Investor Day 16

Gas Transmission – Strategic Priorities
Optimize theBase Business
• Leverage premier gas transmission assets
• Implement rate case strategy on certain U.S. pipelines to ensure cost recovery
• Invest in modernization of existing infrastructure
• Continue to achieve toll settlements on Canadian pipelines
ExecuteSecured Projects
• Follow on successful project execution record from 2018
• Execute remaining secured expansions, including BC Pipeline system and U.S. Gulf Coast network
Grow the Business
• Traditional markets: Northeast, TETLP, Alliance, Gulf Coast/Southeast
• Step outs: LNG and Mexico exports, Gulf Coast/Southeast
5
Optimize the Base – Stable Revenue Base
6
95% 98% 98% 99% 98% 96% 99.6%95%
71%
94% 95%
Texas Eastern Gulfstream Algonquin East Tennessee Southeast Supply Header
Maritimes & Northeast
(US & Canada)
Sabal Trail Vector Offshore Alliance BC Pipeline
2017 Reservation Revenue 2017 Usage & Other Revenue
GTM Reservation Revenue (Based on revenues for 12 months ended 12/31/17)
9years
Average Contract Terms
12years
8years
8years
5years
10years
Achieved Peak Delivery Days in
2017
(1) Includes Texas Eastern, Gulfstream, Algonquin, East Tennessee, Southeast Supply Header, Ozark Gas Transmission, Big Sandy and Maritimes & Northeast US
16years
Life of lease
26years
3years
7 years
N/A
Stable core business provides platform for growth
N/A
Enbridge Investor Day 17

Optimizing the Base – Rate Base Growth
Key Drivers:• Growth in system net plant value
• Realignment of the depreciation rate/ negative salvage
• System maintenance and modernization increases in the U.S. and Canada
7
Texas Eastern BC Pipeline
East Tennessee Algonquin
Rate base growth drives 1-2% DCF growth per year post 2020
Robust Portfolio of Secured Growth Projects
8
~$3Bin execution
2019+
$6B+in service
2018
Valley Crossing
PennEastNEXUSTEAL
T-South
High Pine
Wyndwood
Spruce Ridge
RAM
Pomelo
Gulf Coast Express
Atlantic Bridge
STEPGulfstream Phase VI
Sabal Trail Phase 2 & 3
Cameron LateralStampede Lateral
Stratton Ridge
Vito
Enbridge Investor Day 18

Well-positioned for Future Growth
9
$2-3Bper year
in opportunitiespost 2020
Western Canada
Southeast Markets
Gulf Coast Markets
Northeast & New England
Our assets have the first & last
mile advantage
Northeast & New England
10
Northeast / New England• Continued commercial / residential load growth
• Proven approach to bring affordable natural gas to the region
Power Generation Market• Incremental demand market will drive Marcellus
gas expansion opportunities
LNG• Well positioned to serve LNG export
opportunities
• Opportunity to optimize existing LNG import facilities to deliver flexible services
Philly Market Expansions
New England Opportunities
BOSTON
NYC
PHILADELPHIA
DC
DETROIT Dawn Hub
Natural gas fired generation is replacing retiring generation
Power Generation
$1-3Bin opportunities
Enbridge Investor Day 19

ORLANDO
TAMPA
Power GenerationOpportunities
NOLA
FL
AL
GAMS
Southeast Markets
11
Southeast Markets
• Generating capacity in Florida is expected to grow by 15+% by 2026
• Majority of this growth is projected to be natural gas-fired generation
Continued growth in natural gas fired power generation
$1-2Bin opportunities
Gulf Coast Markets
12
Exports to Gulf Coast & Mexico• Texas Eastern, Brazoria Interconnector Gas and Valley Crossing assets well connected to deliver to Gulf Coast LNG and Mexico markets
Permian• Expanding Permian supply pushing to feed growing Gulf Coast export markets, including LNG and Mexico
Offshore • Continue pursuing offshore opportunities for attractive incremental investments in the U.S. Gulf Coast
Exports to Mexico
Permian
NOLA
MT BELVIEU
OffshoreMexico
TXLA
MS
LNG & Industrial
New Gulf Coast natural gas demand drives solid growth opportunities
$2-4Bin opportunities
Enbridge Investor Day 20

Western Canada
13
Western Canada • Growing supply presents many
infrastructure opportunities to support Montney and Duvernay:
− Pipeline expansions: T-North, T-South, Alliance
− NGL infrastructure solutions
− Greenfield LNG
SEATTLE CALGARY
VANCOUVER
Montney / DuvernayExpansions
Transmission Opportunities
Alliance
T-South
ABBC
T-North
Enbridge ideally positioned to capture opportunities
$4-6Bin gas & NGL
pipelineopportunities
$5-10Bin LNG specific
opportunities
Gas Transmission – Summary
• Rate cases • System modernization
14
$3BSecured projects
in execution
$2-3Bper year in future
development opportunities
post-2020
1-2%per year
base businessgrowth
post-2020
• T-South expansion• T-North expansions• Vito offshore pipelines (new)• Cameron Lateral (new)
• USGC & Canadian LNG connections• Further W. Canadian expansions
• Premier demand-pull driven asset base serving key regional markets
• Positioned for significant in 4 key regions
Enbridge Investor Day 21

Q&A
Enbridge Investor Day 22

Executive Vice President, Utilities and Power OperationsCynthia Hansen
Utilities
Our Premium Utility
Tier 1 North American Gas Utility • Largest volume and fastest growing franchise
– 12+ million people and businesses
– 3.7 million meters
– 50,000+ annual customer additions
• Investing $1+ B capital per year
Dawn Storage Hub and Transmission• 280 Bcf of Dawn storage with growth potential
– 2nd most liquid trading hub in North America
• Dawn-Parkway Transmission connects multiplesupply basins with strategic growth markets– Ontario, Quebec, US Northeast
Largest and fastest growing natural gas utility in North America
2018 2020 2025 2030 2035 2040
Ontario Population Growth Forecast
14million
18.5million
Combined Rate Base Growth (C$,B)
0
2
4
6
8
10
12
2008 2009 2010 2011 2012 2013 2014 2015 2016 2017
Union Gas
EGD
2
Enbridge Investor Day 23

Utilities - Strategic Priorities
3
Pursuing amalgamation efficiencies and growth while maintaining customer focus & safe reliable operations
Optimize theBase Business
• Focus on operational efficiencies and capture synergies from amalgamation
− Grow earnings through cost reduction
− Leverage Enbridge’s transformation experience
− Build best in class utility operating model
ExecuteSecured Projects
• Deliver near-term in-franchise rate base growth
Grow the Business
• Secure future in-franchise growth and expand to new communities
• Expand Dawn Hub storage and transmission
• Extend with additional regulated assets, natural gas transport and renewable natural gas opportunities
Focus on Amalgamation
Incentive mechanism enhances earnings• Day One benefits• Five year O&M synergy capture • Low capital investments to achieve O&M savings• Inflation protection• Retain 150 bps of earnings above regulated ROE • Reliable cash flow growth
Enhanced organic growth• Capital threshold ensures renewal of rate base • Incremental Capital Module allows for capital above
threshold to be included in rate base earnings
Incentive Rate Structure Term 5 years
Annual Inflation GDP index
Stretch Factor 0.3%
Earnings ThresholdEarnings sharing at 50%:50%above 150 bps over OEB allowed ROE
Unbudgeted Capital Expenditures Incremental Capital Module
Start Date January 1, 2019
An attractive regulatory outcome on Day One enables potential to achieve premium ROE
4
Enbridge Investor Day 24

7%
8%
9%
10%
2015 2016 2017 2018 2019+
OEB allowed ROE Actual ROE
Amalgamation Benefits
Low risk earnings growth• Benefits accrue immediately to Enbridge
Amalgamation activities underway• Integration has already commenced
• Common enterprise platforms
Major synergy capture areas• Operations & work management
• Customer care
• Shared services
• Storage & transmission, gas control and supply
• Management and other area functions
Utility ROE
Ability to consistently earn above 9% OEB allowed ROE
~9% Allowed ROE
Expected range of Actual ROE
5
Organic Growth in Rate Base
• Utility Growth – 50,000 new customer additions
annually
– Over 50 new expansion communities
• Maintenance/Renewal– Execution of an optimized asset plan
– Continued investment for safe and reliable operations
• Incremental Capital Module (ICM)
– Rate protected funding of additional core utility projects
Secured CapitalHighly transparent investments in regulated rate base drives DCF growth
Over $1B/year in capital additions Utility Cap Ex ($B)
0.0
0.2
0.4
0.6
0.8
1.0
1.2
2018 2019 2020 2021+
6
Expansion community
Enbridge Investor Day 25
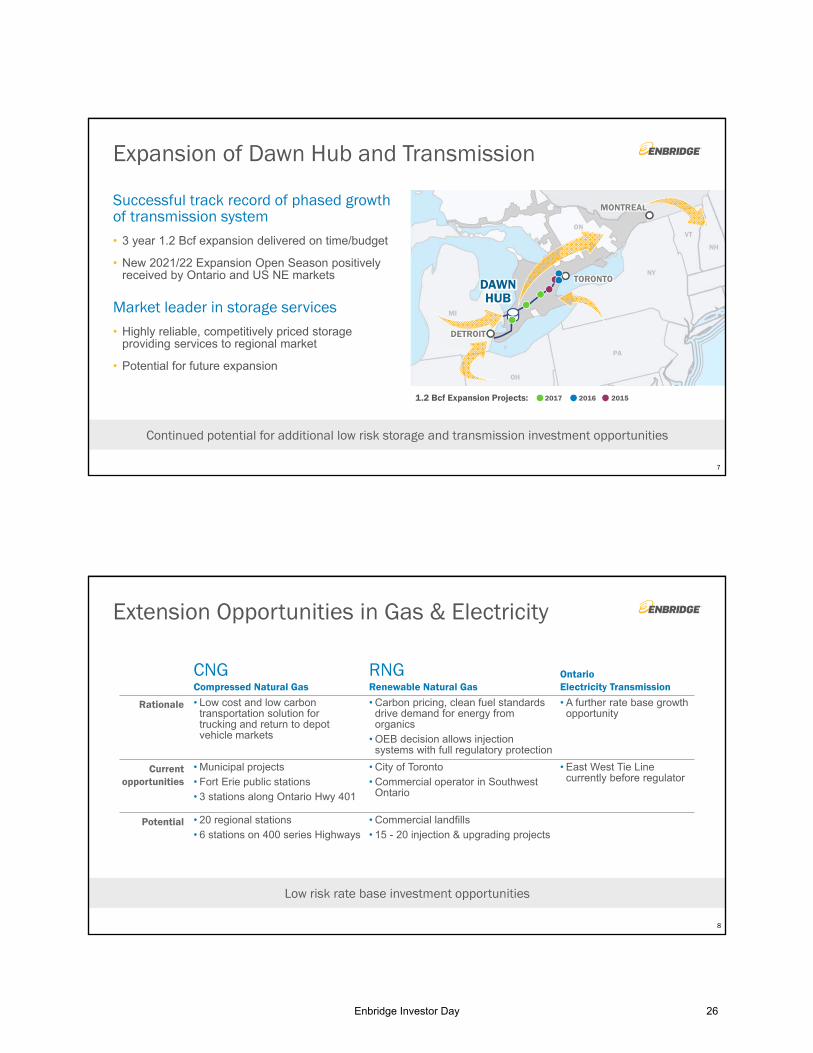
Expansion of Dawn Hub and Transmission
Successful track record of phased growth of transmission system • 3 year 1.2 Bcf expansion delivered on time/budget
• New 2021/22 Expansion Open Season positively received by Ontario and US NE markets
Market leader in storage services• Highly reliable, competitively priced storage
providing services to regional market
• Potential for future expansion
Continued potential for additional low risk storage and transmission investment opportunities
TORONTO
MONTREAL
DAWN HUB
ON
NY
PA
OH
MI
DETROIT
1.2 Bcf Expansion Projects: 2017 2016 2015
VT
NH
7
CNGCompressed Natural Gas
RNGRenewable Natural Gas
OntarioElectricity Transmission
Rationale • Low cost and low carbon transportation solution for trucking and return to depot vehicle markets
• Carbon pricing, clean fuel standards drive demand for energy from organics
• OEB decision allows injection systems with full regulatory protection
• A further rate base growth opportunity
Current opportunities
• Municipal projects
• Fort Erie public stations
• 3 stations along Ontario Hwy 401
• City of Toronto
• Commercial operator in Southwest Ontario
• East West Tie Line currently before regulator
Potential • 20 regional stations
• 6 stations on 400 series Highways
• Commercial landfills
• 15 - 20 injection & upgrading projects
Extension Opportunities in Gas & Electricity
Low risk rate base investment opportunities
8
Enbridge Investor Day 26

Utilities - Summary
9
TORONTO
OTTAWA
DAWN HUB
ONTARIO
• Largest and fastest growing gas utility franchise in North America
• Steady annual growth opportunities through new customer additions and system expansions
• Amalgamation synergies• Cost management• Revenue escalators• Storage & transportation optimization
$1BSecured projects
in execution(through 2020)
~$1B per year future development opportunities
post-2020
• Rate base additions driven by customer growth
• Post-2020 customer additions• Community expansions• Dawn-Parkway expansions• RNG/CNG growth• Ontario electricity transmission
1-2%per year
base businessgrowth
post-2020
Q&A
Enbridge Investor Day 27
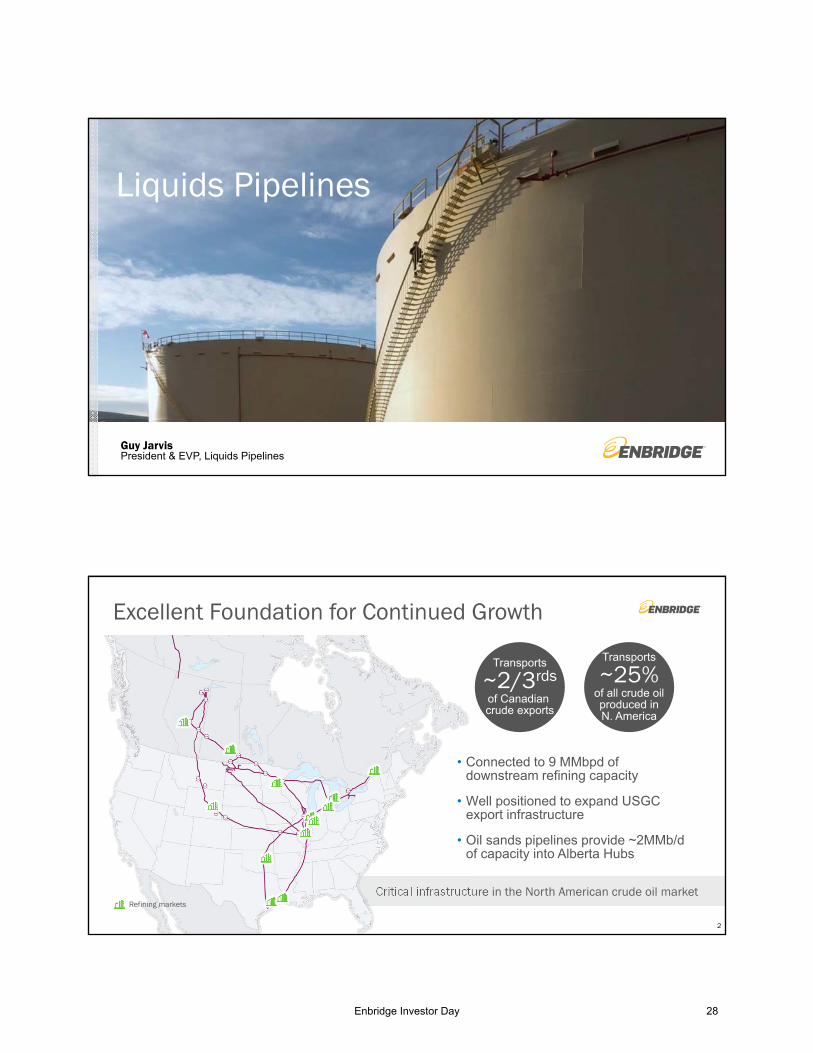
President & EVP, Liquids PipelinesGuy Jarvis
Liquids Pipelines
Critical infrastructure in the North American crude oil market
Excellent Foundation for Continued Growth
2
• Connected to 9 MMbpd ofdownstream refining capacity
• Well positioned to expand USGCexport infrastructure
• Oil sands pipelines provide ~2MMb/dof capacity into Alberta Hubs
Transports
~2/3rdsof Canadian crude exports
Transports
~25%of all crude oilproduced inN. America
Refining markets
Enbridge Investor Day 28

-
1,000
2,000
3,000
4,000
5,000
6,000
2015 2020 2025 2030 2035
CAPP 2018Supply Forecast
>1MMb/dGrowth by 2035
WCSB Fundamentals
3
Source: CAPP 2018
WCSB Oil Supply (kbpd)
Producers Focusing on Cost Efficiency and Technology
Supply is expected to grow sustainably with deployment of new technology that lowers costs and emissions
Conventional
Oil sands heavy
Upgraded light
North American Crude Export Fundamentals
4Sources: EIA, IEA
Current Exports
Tight Oil Increase
Demand Increase
2025 Exports
U.S. Export Growth (MMb/d)
Current Exports
~2 MMb/d
USGC is the Refining/Export Epicenter
>8.5MMb/d
refining capacityin USGC
>2.5MMb/d
tight oil exportgrowth by 2025
Tight oil growth drives USGC exports higher & USGC demand for Canadian heavy grows
Tight oil increase
+3MMb/d
Demand decrease
-0.5MMb/d
2025 Exports
~4.5MMb/d
SeawayETCOP
Gray Oak
Enbridge Investor Day 29

Liquids Pipeline - Strategic Priorities
5
Optimize the Base Business
• Execute Mainline systemoptimizations
− 2019 optimizations
− 2020+ solutions
• Finalize post-CTS Mainlinetolling framework
Execute Secured Projects Grow the Business
• Continued Mainlineoptimization
• Expand the Market Accesspipelines
• Secure USGC exportopportunity
• Leverage asset portfolio toexpand regional systems
• Place Line 3 replacementinto service 2H 2019
• Place Southern AccessExpansion into service 2H2019
• Place Gray Oak intoservice 2H 2019
Immediate focus on Mainline system optimization with a longer view towards export development
6
Proven track record of success with Mainline capacity optimization efforts
Increasing Mainline Throughput
2015 2018
+230 +120 +100
Capacity Expansion
Capacity Recovery
Optimization
Ex-WCSB Egress
Enbridge Investor Day 30

Mainline Positioning & Competitiveness
7
Strong Demand from Premium Markets
-
1,000
2,000
3,000
4,000
5,000
6,000
2018 2022 2026 2030
Enbridge Mainline
Contracted Capacity
Western Canada Demand
3rd Party Spot
CAPP 2018
WCSB Capacity Dispatch (kbpd)
1.9 mmbpdSole sourced supply
>1.1 mmbpdDownstream take-or-pay
commitments
Mainline is highly competitive, offering premium value and access to multiple refining markets
KXLTMX
Mainline Tolling Approach - Aligning with Customers
8
Shippers Interests
Priority Access to Mainline capacity
Long-term toll certainty & predictability
Align Mainline and downstream market access capacity
Market Optionality
Mainline optimization/Market Access expansion
Next Mainline tolling agreement must meet evolving shipper needs
Enbridge Interests
Level playing field with other contracted pipelines
Long-term revenue certainty
Full utilization of Market Access pipelines
Leverages competitive advantage
Revenue certainty to underpin Mainline and Market Extensions
Enbridge Investor Day 31

Mainline Tolling Approach - Overview of offering
Key Features of Offering
• Priority Access for contracted volume
• Contract term up to 20 years
• Contracts tailored to shipper type
• Toll discounts for high volume shippers
• Spot capacity reserve – 10%
9
Strong shipper interest in obtaining clear path to markets
Next steps
• Finalize commercial framework
• Submit regulatory applications
• Effective mid-2021
Edmonton
HardistyKerrobert
Gretna
ND
WIMN
Regina
Superior
Cromer
Additional Mainline Optimizations 2019
Bakken Pipeline (BPEP) Delivery Reduction• Reduce deliveries into Cromer to increase available
capacity for WCSB egress (Q3)
Line 3 Replacement – Canada• Begin line-fill and terminal injections in Canada
ahead of downstream work completion to reduce Alberta inventory (Q3)
System Delivery Optimization• Develop solutions to fill available downstream
capacity created by deliveries into Regina (TBD)
10
50 -100kbpd of immediate optimization to provide incremental WCSB egress
50-100kbpd
Enbridge Investor Day 32

Line 3 Replacement
• Canadian construction program well underway – over 80% of pipeline laid
– Expected completion – July 1, 2019
• Wisconsin segment complete and in-service
• Regulatory and permitting activities progressing well in Minnesota
– PUC approval and written orders in place
– Permitting process ongoing
– Tribal Cultural Survey – complete
– Army Corp/BIA requirements on track
• Continue to target 2H19 ISD
11
Edmonton
Hardisty
Kerrobert
Gretna
ND
WIMN
Regina
Construction complete
In service segments
to date
Approved MN route
Superior
Execution progressing well; continue to target full in-service for the second half of 2019
370kbpd
$9BSecured growth
Southern Access Expansion
• Line 3 Replacement increases capacity into Superior by 370kbpd
• Southern Access will be expanded by 300kbpd to 1.2MMbpd
• Project is fully permitted and execution is already well progressed
• 2H 2019 ISD
12
Effectively balances and optimizes the Enbridge mainline post Line 3 Replacement
Superior
FlanaganChicago$0.5B
Secured growth
Enbridge Investor Day 33

Edmonton
HardistyKerrobert
Gretna
ND
WIMN
Regina
Superior
Cromer
Mainline Optimizations 2020
Bakken Pipeline (BPEP) Idle• Idle pipeline to free up the remaining
capacity for WCSB egress
System Optimization• Crude slates/DRA
Line 4 Restoration• Terminal and scheduling optimization to
restore Line 4 to its nameplate capacity
13
200 kbpd of optimization potential in 2020 to provide incremental WCSB throughput
200kbpd
Mainline System – Potential Growth
• Condensate supply /demand fundamentals in WCSB expected to reduce requirement for imported supply
• Developing commercial proposal to reverse the line and place into light crude service
• Limited, manageable regulatory permitting
• Targeted ISD – 202314
$1.5Bin opportunities
Southern Lights ReversalEdmonton
Hardisty
ND
WIMN
Flanagan
Superior
• System optimization and enhancements
• +100kbpd of incremental throughput
• Targeted ISD – 2022
100kbpd
Further Mainline Optimizations
$1.5Bin opportunities
Edmonton
Hardisty
ND
WIMN
Manhattan
150kbpd
Current Flow Direction
Proposed Flow Direction
Enbridge Investor Day 34

Ex-WCSB Egress
15
Assets allow for incremental throughput to be brought on line for an industry solution
Additional Throughput Planned & Achievable
2015 2018 2023
+370+300
L3 Replacement
Capacity
System Optimizations & Enhancements
+150Southern
Lights Reversal
Market Access - Potential Growth
• Mainline optimizations provide an opportunity to increase market access pipelines by 350kbpd
– Flanagan South expansion of 250kbpd along with corresponding Seaway expansion
– Southern Access Extension expansion of 100kbpd to Patoka region
• ISD tied to Mainline optimizations
16
Gulf Coast Markets
+250kbpd
Flanagan South
Patoka
Chicago
Hardisty
Cushing
+100kbpdSouthern Access
Extension
$1-2Bin opportunities
+250kbpd
Seaway Expansion
Enbridge Investor Day 35
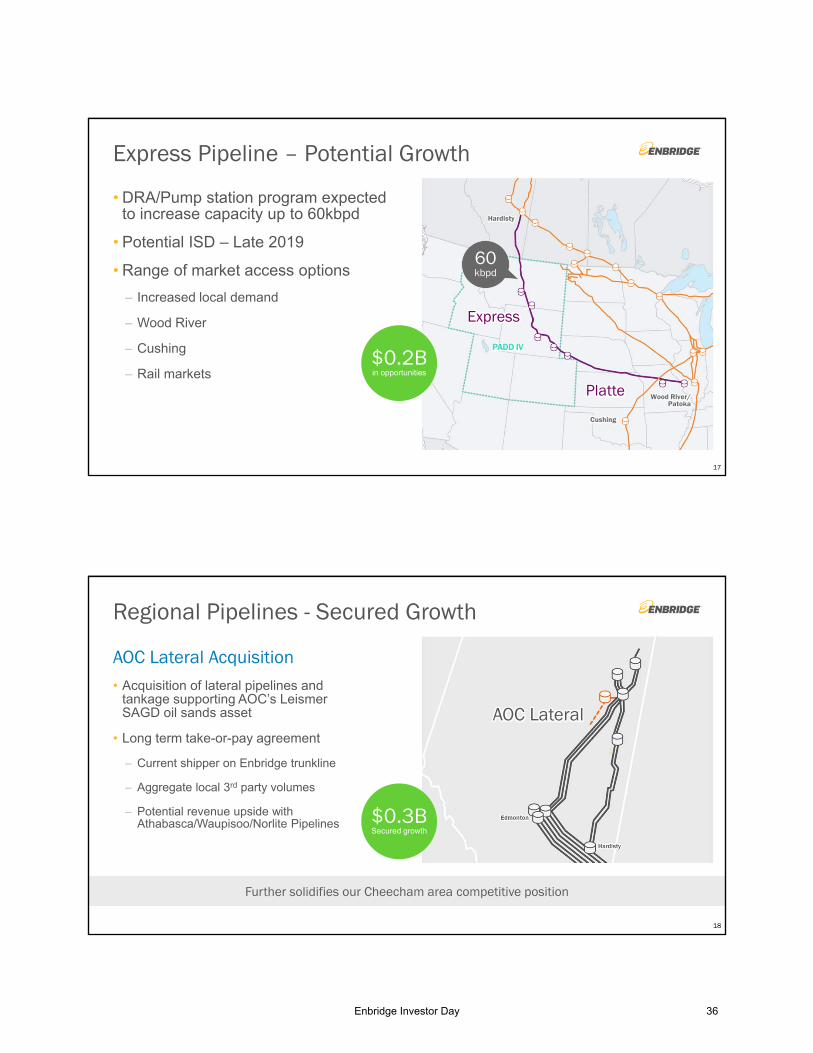
Express Pipeline – Potential Growth
• DRA/Pump station program expected to increase capacity up to 60kbpd
• Potential ISD – Late 2019
• Range of market access options
– Increased local demand
– Wood River
– Cushing
– Rail markets
17
Wood River/Patoka
Express
Platte
Hardisty
PADD IV
Cushing
$0.2Bin opportunities
60kbpd
Regional Pipelines - Secured Growth
AOC Lateral Acquisition• Acquisition of lateral pipelines and
tankage supporting AOC’s LeismerSAGD oil sands asset
• Long term take-or-pay agreement
– Current shipper on Enbridge trunkline
– Aggregate local 3rd party volumes
– Potential revenue upside with Athabasca/Waupisoo/Norlite Pipelines
18
Further solidifies our Cheecham area competitive position
$0.3BSecured growth
AOC Lateral
Enbridge Investor Day 36

Regional Pipelines – Potential Growth
19
BAKKEN
DAPL
Patoka
• Oil sands development will continue to drive need for regional infrastructure to support growth
• Trunkline expansion potential – Athabasca, Woodland, Wood Buffalo
• Norlite diluent pipeline expansion potential
• Lateral connections
• Growing Bakken production will drive the need for additional pipeline solutions
• DAPL open season underway
Extremely well positioned to serve growing regional production
$1.0Bin opportunities
USGC – Refinery Access and Export Strategy
Portfolio additions provide the foundation for future growth
– Pipeline capacity of 2.3 MMbpdserving the region
– Export capability
Seaway Docks
VLCC loading opportunity
– Existing/planned connections will solidify/enhance revenue streams
20
Competitive and strategic collection of assets connecting supply to the USGC and export market
Cushing
Flanagan South
Seaway
ETCOP
Gray Oak
$5Bin opportunities
Enbridge Investor Day 37

USGC - Secured Growth
21
Gray Oak Pipeline• 22.8% joint venture interest
• Partners include P66 and Marathon
• Crude oil transportation from the Permian and Eagle Ford basins to destinations in Corpus Christi and Freeport
• Capacity of 900,000 barrels per day with strong customer commitments
• In service by the end of 2019
Premier export pipeline from the Permian and Eagle Ford Basins
Strategic FitPermian Connection
USGC Exports
PERMIAN
EAGLE FORD
Gray Oak
Freeport
Corpus Christi$0.8BSecured growth
Texas COLT Offshore Loading Terminal• Partners: Kinder Morgan and Oiltanking
• Direct full loading of VLCCs from Freeport, TX
• Superior connectivity to all key North American supply basins via Enbridge systems and others
• Strong interest from a broad base of potential customers
• In service late 2021/early 2022
USGC - Potential Growth
22
Superior supply access and low cost export solution with VLCC loading capability
Genoa Junction
$0.8BIn opportunities
Strategic Fit
Permian Connection
USGC Exports
Enbridge Investor Day 38

Base Business Post-2020 Growth Opportunities
23
Total annual base business growth of 2 - 3% DCF per year
Efficiencies
Toll Escalators
Throughput Optimization
Mainline Toll Framework
• Productivity
• Power management
• Index tolls
• CTS toll escalation
• Toll certainty underpins optimization efforts
• Mainline
• Alberta Regional assets
• Market Access pipelines
Liquids Pipelines - Summary
• Mainline toll framework• Throughput optimization • Toll indexing• Efficiency & productivity
24
$11BSecured projects
in execution
~$2Bper year future development opportunities
post-2020
2-3%per year
base businessgrowth
post-2020
• Line 3 replacement• Southern Access Expansion• AOC lateral (new)• Gray Oak pipeline (new)
• System optimizations & enhancements• Market extension expansions• Regional systems expansions• USGC export infrastructure
• Critical link from WCSB to premium Midwest and USGC refining markets
• Leverage existing footprint to expand crude export capacity and develop integrated USGC platform
Enbridge Investor Day 39

Q&A
Enbridge Investor Day 40
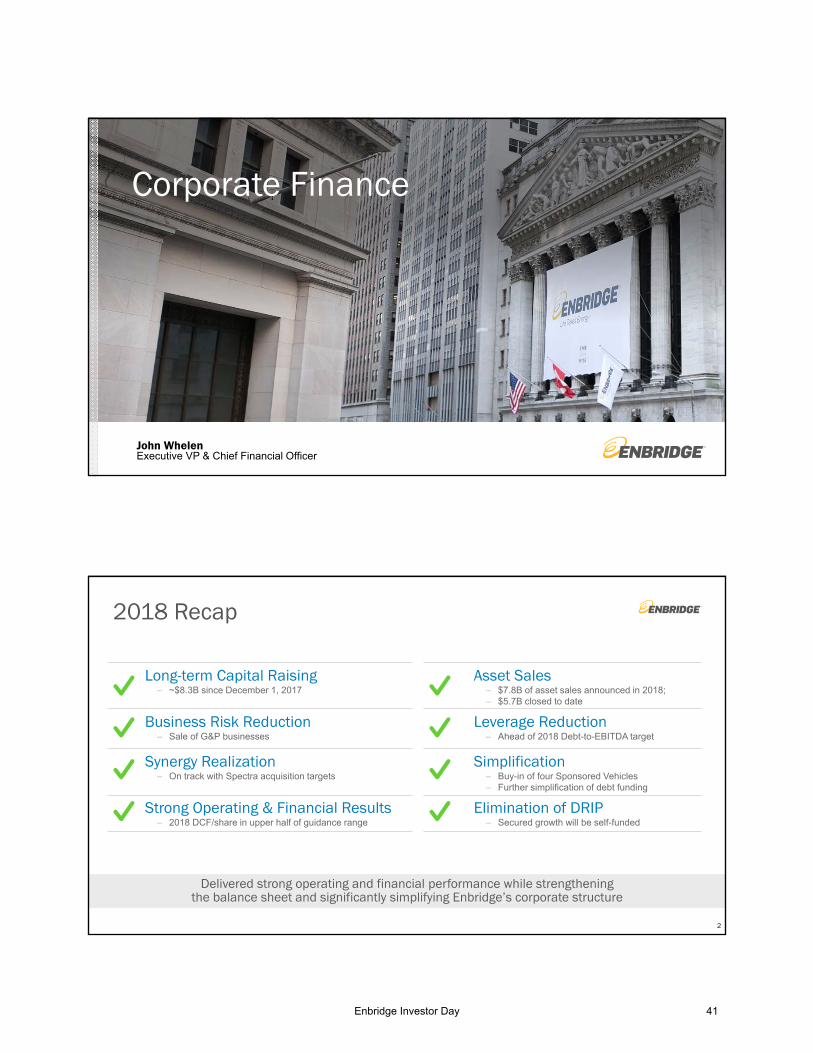
Executive VP & Chief Financial OfficerJohn Whelen
Corporate Finance
2018 Recap
2
Long-term Capital Raising– ~$8.3B since December 1, 2017
Asset Sales– $7.8B of asset sales announced in 2018; – $5.7B closed to date
Business Risk Reduction– Sale of G&P businesses
Leverage Reduction– Ahead of 2018 Debt-to-EBITDA target
Synergy Realization– On track with Spectra acquisition targets
Simplification– Buy-in of four Sponsored Vehicles– Further simplification of debt funding
Strong Operating & Financial Results– 2018 DCF/share in upper half of guidance range
Elimination of DRIP– Secured growth will be self-funded
Delivered strong operating and financial performance while strengthening the balance sheet and significantly simplifying Enbridge’s corporate structure
Enbridge Investor Day 41

Looking Forward – 2019 and Beyond
Enduring Finance Priorities Current Implementation Focus
• Financial strength and flexibility • Self funding of secured capital program
• Access to low cost of capital • Strong investment grade ratings
• Managing controllable risks • Proactive hedging of market prices
• Simplification and optimization • Restructure debt; reduce cost of capital
• Strict investment discipline • Rigorous capital allocation
Delivering reliable results Drive performance from low risk businesses
Key Finance priorities have not changed –ongoing focus on financial flexibility, capital allocation and optimization of financing costs
3
Our Low Risk Business Model
4
Commercial Foundation
Business Risk Assessment Scale
S&P3 Excellent
Moody’s4 A2%
98%TOP / COS / Fixed Fee/CTS
7%
93%Investment Grade
Take-or-Pay / Cost-of-service Fixed Fee
Competitive Tolling Settlement (CTS)1 Commodity Sensitive
“A” rated or higher
“BBB” rated
Sub-investment grade
• Inflation escalators
• ROE adjusters
• Toll/Rate resets
Enbridge’s best in class business profile is even stronger post-divestiture of non-core G&P assets
Contractual Profile of 2019e EBITDA
Counter PartyCredit Exposure2 Embedded Risk Mitigation
(1) EBITDA generated under current Liquids Mainline Tolling Agreement; ability to revert to cost of service or other negotiated settlement on expiry.(2) Reflected after the impact of any credit enhancement. (3) Moody’s credit opinion dated November 11, 2018. (4) S&P ratings direct dated October 1, 2018.
Enbridge Investor Day 42

Fixed Rate Total Debt
Planned term debt hedge position
0% 20% 40% 60% 80% 100%
FX - Cash Flow Basis
FX - Earnings Basis
(1) Cash flow at risk measures the maximum cash flow loss that could result from adverse Market Price movements over a specified time horizon with a pre-determined level of statistical confidence under normal market conditions (2) as at October 31, 2018 (3) current position, including impact of hedges (4) Average 2019 hedge rate: ~1.22 CAD/USD.
2019 Consolidated FX Hedge Position4
2019 Consolidated Debt Position
~85%
~60%
~95%
~70%
Fixed Rate/ Total Debt3
5
Any residual exposure to foreign exchange, interest rate & commodity price movements is well contained
Consolidated Cash Flow at Risk1
<2%Cash flow at risk2
Our Low Risk Business ModelHedging Controllable Risks
Planned term debt hedge position
6
Highly predictable financial performance
EPS guidance range DCF/share guidance rangeActual results
$0.00
$0.50
$1.00
$1.50
$2.00
$2.50
$3.00
2008 2009 2010 2011 2012 2013 2014$0.00
$0.50
$1.00
$1.50
$2.00
$2.50
$3.00
$3.50
$4.00
$4.50
2015 2016 2017 2018e
Adjusted EPS DCF/share
Stable cash flow from highly utilized assets
2014 2015 2016 2017 2018e
Adjusted EBITDA
Our Low Risk Business ModelDelivering Reliable and Predictable Results
Gas Transmission & MidstreamLiquids Pipelines Gas Distribution Other
$5B$6B
$7B
$10B
~$12.5B
Low risk asset base, proactive risk management and investment discipline generate highly reliable and predictable earnings and cash flow
Enbridge Investor Day 43

Financial Strength & Flexibility
7
Consolidated DEBT to EBITDA1
Standard & Poors BBB+ stable
Fitch BBB+stable
DBRS BBB Highstable
Moody’s Baa3positive
Enbridge Inc. Sr. Unsecured Debt Ratings2
0.0x
1.0x
2.0x
3.0x
4.0x
5.0x
6.0x
7.0x
2014 2015 2016 2017 2018e
2018 Target ≤ 5.0x
(1) Management methodology. Individual rating agency calculations will differ.(2) Current as of December 11, 2018
Consolidated Cap Ex ($B) $11 $8 $6 $12 $9
A significant reduction in leverage has been accomplished, while funding a $40B+ capital program; further strengthening the balance sheet and credit profile
Simplification and Optimization
Sponsored Vehicle Buy-ins
• Eliminates complexity
• Enhances earnings and cashflow transparency
• Increases cash flow to Enbridge -parent company
• Reduces consolidated payout
• Increases non-taxable horizon
• Eliminates public company costs
• Mitigates regulatory risk
Before Proposed Buy-ins*
8* Simplified organization charts for illustrative purposes
Public Public Public
83% 35% 83%
Operating Assets
Operating Assets
Operating Assets
Operating Assets
OtherSEPEEP/EEQ
ENF/EIF
100% 100% 100%
Operating Assets
Operating Assets
Operating Assets
Operating Assets
OtherSEPEEP/EEQ
ENF/EIF
After Proposed Buy-ins*
Less Encumbered Cash Flows
Enbridge Investor Day 44

Simplification and Optimization
• Discontinuation of issuance by intermediate HoldCos - EIF, SEP, EEP, Westcoast, SE Capital
• Enbridge Income Fund exchange of senior term notes
• Cross guarantees of Enbridge Inc. senior term notes with remaining senior term notes of SEP and EEP
• Continued stand-alone debt issuance by certain principal regulated subsidiares1
• Selected partial funding of joint ventures
• Debt and equity needs of operating subsidiaries generally met through inter-company funding from Enbridge Inc.
9
After Proposed Sponsored Vehicle Buy-ins*
1) Includes Enbridge Pipelines Inc., Enbridge Gas Inc. (amalgamated utility), Texas Eastern Transmission, LP, and other FERC regulated gas transmission pipelines.
* Simplified organization charts for illustrative purposes
100% 100% 100%
Operating Assets
Operating Assets
Operating Assets
Operating Assets
OtherSEPEEP/EEQ
ENF/EIF
Intermediate HoldCos
Debt Funding Structure and Strategy
Long-term Financial Planning Parameters
10(1) Trailing twelve-month as at September 30, 2018. (2) Calculated based on Factset Enbridge 2018e consensus .(3) Management projection.
Metric Long-term Targets Current Position
Credit Rating Strong Investment Grade
Consolidated Debt to EBITDA
4.5x to
comfortably below 5.0x 4.7x1
Consolidated FFO to Debt >13% ~16%1
Dividend Payout ~65%of DCF/share
~61%of DCF/share2
Liquidity >1x forward 12-month requirement
~1.6x3
Floating Rate Debt (% of total debt) <30% ~13%3
Cashflow at Risk <5%forward 12 months
~2%3
Designed to preserve financial strength & flexibility
3.0x
4.0x
5.0x
2018e 2019e 2020e
Consolidated DEBT to EBITDA
Flex
“Secured-only capital” scenario metrics
Enbridge Investor Day 45

Enterprise-wide Secured Growth Project Inventory
Segments: Liquids Pipelines Gas Transmission & MidstreamGas Distribution Green Power & Transmission
Project Expected ISD Capital ($B)
2019
Stratton Ridge 1H19 0.2 USD
Hohe See Wind & Expansion – Germany 2H19 1.1 CAD
AOC Lateral Acquisition 1H19 0.3 CAD
Line 3 Replacement – Canadian Portion 2H19 5.3 CAD
Line 3 Replacement – U.S. Portion 2H19 2.9 USD
Southern Access to 1,200 kbpd 2H19 0.4 USD
Gray Oak Pipeline 2H19 0.6 USD
Utility Core Capital 2019 0.7 CAD
2019 TOTAL $13B*
2020
+
T-South Expansion 2020 1.0 CAD
PennEast 2020 0.3 USD
Spruce Ridge 2020 0.5 CAD
Other expansions 2020/23 0.6 USD
Utility Core Capital 2020 0.7 CAD
2020+ TOTAL $3B*
TOTAL 2019-2020+ Capital Program $16B** Rounded, USD capital has been translated to CAD using an exchange rate of $1 U.S. dollar = $1.30 Canadian dollars.
Project Expected ISD Capital ($B)
201
8
High Pine In service 0.4 CAD
Stampede Lateral In service 0.2 USD
Wyndwood In service 0.2 CAD
Rampion Wind – UK In service 0.8 CAD
RAM In service 0.5 CAD
NEXUS In service 1.3 USD
TEAL In service 0.2 USD
Other Misc. Liquids In service 0.1 CAD
Valley Crossing Pipeline In service 1.6 USD
STEP/Pomelo Connector In service 0.4 USD
Atlantic Bridge In service + 2020 0.6 USD
Utility Core Capital In service 0.5 CAD
2018 TOTAL $7B*
$16B of secured, low-risk capital projects drives near term growth outlook
11
2019 EBITDA Guidance 2019e ($MM) Growth Drivers: 2019e vs 2018
Liquids Pipelines ~6,800 + Line 3 – Nov 1 ISD+ Higher Bakken Pipeline volumes
Gas Transmission & Midstream ~4,000 + New projects placed into service- Asset monetization
Gas Distribution ~1,800 + Amalgamation synergies+ Rate base growth
Green Power & Transmission ~450 + New projects placed into service
Energy Services ~75 + Continued arbitrage opportunities
Eliminations & Other ~(125) + More favorable f/x hedge rates+ Enterprise-wide cost saving initiatives
Consolidated EBITDA1: ~13,000
12
2018e 2019e
~$13,000
Consolidated EBITDA1($MM)
~$12,5002
(1) Adjusted EBITDA is a non-GAAP measure. Reconciliations to GAAP measures can be found at www.enbridge.com.(2) Based on guidance provided at 2017 Enbridge Day.
Financial Outlook2019 Consolidated EBITDA guidance
Enbridge Investor Day 46

2018e 2019e 2020e
13
($MM, except per share amounts) 2019 Guidance 2020 GuidanceAdjusted EBITDA1 ~$13,000 ~$14,800
Maintenance capital ~(1,200) ~(1,200)
Current income taxes2 ~(400) ~(500)
Financing costs ~(3,000)
Distributions to non-controlling interests ~(200)
Cash distributions in excess of equity earnings ~500
Other non-cash adjustments ~200
DCF1 ~$8,900 ~$10,000
DCF/Share Guidance1 $4.30 - 4.60 $4.85 - 5.15
2019 DCF Sensitivities - after hedging
Market Prices Movements Annualized Base Plan Assumption DCF/ Share
+/- .25% Interest Rates Current market rates3 ~$0.005
+/- $.01 CAD/USD $1.30 ~$0.01
Consolidated EBITDA1
Consolidated DCF1
2018e 2019e 2020e
$4.15 - 4.45 $4.30 - 4.60$4.85 - 5.15
~$13,000~$12,5004
~$14,800
Financial OutlookDistributable Cash Flow (DCF)
(1) Adjusted EBITDA, DCF and DCF/share are non-GAAP measures. Reconciliations to GAAP measures can be found at www.enbridge.com. (2) Book income tax rate forecast of 20%. (3) 3M CDOR: 2.4%; 3M LIBOR 3.0%; 10Y GoC 2.7%; 10Y UST: 3.2% (4) Based on guidance provided at 2017 Enbridge Day.
14
Consolidated Adj. EBITDA (% of Full Year Projection)
2019e Quarterly Drivers
• Seasonality of businesses
− Gas utility
− Interruptible gas and storage service
− Renewables
• Maintenance capital profile
• Customer refinery or plant turnarounds
• Project in-service timing
0%
30%
Q1 Q2 Q3 Q40%
30%
Q1 Q2 Q3 Q4
Consolidated DCF (% of Full Year Projection)
Financial Outlook2019 Illustrative Quarterly Profile
Enbridge Investor Day 47

Dimensioning Organic Growth Potential
15
2020 and beyond
Potential Opportunity Set
Expected Investment Opportunity
(probability weighted)
Target Core Growth
Portfolio
~$5-6B Annual Average
Utilities
Natural Gas
Liquids
Organic GrowthExtensionsExpansionsGreenfield
Asset acquisitions
Project Evaluation & Portfolio Assessment
• Investment return
• Relative project ranking
• Comparison with other capital allocation alternatives
Initial Screen• Fundamental analysis
• Commercial model
• Strategic alignment
• “Executability”
Capital Allocation
AlternativesDebt repayment
Share repurchaseDividend policy
Asset salesM&A
Illustrative Self-funded Growth Potential
16(1) Incremental DCF = incremental EBITDA, less estimated incremental interest expense, maintenance capital and current income taxes
Representative year post-2020 ($MM)
Free cash flows after dividends ~$3,500Incremental Debt Capacity(@ 4.5x EBITDA generated by investment of free cash flow) ~$2,000
Total annual capital available to reinvest ~$5,500Total Incremental EBITDA (8-9x multiple) $610 $690
Incremental DCF generated1 $445 $510
DCF per share growth ~$0.22 ~$0.25
DCF per share growth rate (vs 2020e of $5/share) ~4% ~5%Annual base business growth ~1% ~2%
Total annual organic growth per share ~5% ~7%
On a self-funded basis, with no pressure on Debt:EBITDA, Enbridge can grow DCF/share at an average rate of 5%-7% post 2020
Enbridge Investor Day 48

Longer-term Financial Outlook• Embedded Growth: 1-2%
– Indexed tolls
– Volume ramp-up
– Efficiency gains
• Self-funded investment: 4-5%– $5-6B of capital annually
17
2017 2018e 2019e 2020e 2021+
Consolidated DCF/share
$4.15-4.45
$4.30-4.60
$4.85-5.15
$3.68
5-7% Long Term
Growth Outlook
Attractive longer term growth can be achieved with relatively modest, self-funded investment
Summary
• Low risk business model
• Financial strength and flexibility
• Ongoing access to low cost capital
• Prudently managed risks
• Ongoing simplification and optimization
• Strict investment discipline
• Reliable and predictable results
18
Enbridge Investor Day 49

Q&A
Enbridge Investor Day 50

New York CityDecember 11, 2018
Concluding Remarks
Enbridge’s Value Proposition
2
• Leading energy infrastructure position
• Low-risk pure regulated business model
• Strong investment grade credit profile
• 10% DCF and dividend through 2020
• 5-7% DCF growth beyond 2020
Long-life attractive growing yield with lowest risk profile in the sector
Enbridge Investor Day 51

Q&A
Enbridge Investor Day 52

Enbridge200, 425 1st Street S.W.Calgary, Alberta, Canada T2P 3L8
www.enbridge.com
Contact us:[email protected]
Enbridge Investor Day 53