Embed Size (px)
Citation preview

Enbridge Investor Update Meeting
2017

06
16
24
30
Legal Notice
Opening Remarks
Strategic Overview
Gas Transmission and Midstream
Utilities
Liquids Pipelines
Corporate Finance
Concluding Remarks
Contents
04
01
38
49

Legal Notice Forward Looking Information
This presentation includes certain forward looking statements and information (FLI) to provide potential investors and shareholders of Enbridge Inc. (“Enbridge”), Enbridge Income Fund Holdings Inc. (“ENF”), Enbridge Energy Partners, L.P. (“EEP”) and Spectra Energy Partners, LP (“SEP”) with information about Enbridge, ENF, EEP, SEP and their respective subsidiaries and affiliates, including management’s assessment of their future plans and operations, which FLI may not be appropriate for other purposes. FLI is typically identified by words such as “anticipate”, “expect”, “project”, “estimate”, “forecast”, “plan”, “intend”, “target”, “believe”, “likely” and similar words suggesting future outcomes or statements regarding an outlook. All statements other than statements of historical fact may be FLI. In particular, this presentation contains FLI pertaining to, but not limited to, information with respect to the following: strategic priorities and capital allocation; guidance with respect to any or all of 2017 through 2020; adjusted EBIT and EBITDA; ACFFO; distributable and free cash flow; payout ratios; debt/EBITDA ratios; funding requirements; financing plans and targets; secured growth projects and future development program; future business prospects and performance, including organic growth outlook; annual dividend growth and anticipated dividend increases; shareholder return; run rate synergies; integration and streamlining plans; project execution, including capital costs, expected construction and in service dates and regulatory approvals; system throughput and capacity; industry and market conditions, including economic growth, population and rate base growth, and energy demand, capacity, sources, prices, costs and exports; and investor communications plans.
Although we believe that the FLI is reasonable based on the information available today and processes used to prepare it, such statements are not guarantees of future performance and you are cautioned against placing undue reliance on FLI. By its nature, FLI involves a variety of assumptions, which are based upon factors that may be difficult to predict and that may involve known and unknown risks and uncertainties and other factors which may cause actual results, levels of activity and achievements to differ materially from those expressed or implied by the FLI, including, but not limited to, the following: the realization of anticipated benefits and synergies of the merger of Enbridge and Spectra Energy Corp; the success of integration plans; expected future adjusted EBIT, adjusted EBITDA, adjusted earnings and ACFFO; estimated future dividends; financial strength and flexibility; debt and equity market conditions, including the ability to access capital markets on favorable terms or at all; cost of debt and equity capital; expected supply, demand and prices for crude oil, natural gas, natural gas liquids and renewable energy; economic and competitive conditions; expected exchange rates; inflation; interest rates; changes in tax laws and tax rates; completion of growth projects; anticipated construction and in-service dates; changes in tariff rates; permitting at federal, state and local level or renewals of rights of way; capital project funding; success of hedging activities; the ability of management to execute key priorities; availability and price of labour and construction materials; operational performance and reliability; customer, shareholder, regulatory
Enbridge Investor Day 1

and other stakeholder approvals and support; hazards and operating risks that may not be covered fully by insurance; regulatory and legislative decisions and actions and costs complying therewith; effectiveness of the various actions resulting from strategic review processes; public opinion; and weather. We caution that the foregoing list of factors is not exhaustive. Additional information about these and other assumptions, risks and uncertainties can be found in applicable filings with Canadian and U.S. securities regulators (including the most recently filed Form 10-K and any subsequently filed Form 10-Q, as applicable). Due to the interdependencies and correlation of these factors, as well as other factors, the impact of any one assumption, risk or uncertainty on FLI cannot be determined with certainty.
Except to the extent required by applicable law, we assume no obligation to publicly update or revise any FLI made in this presentation or otherwise, whether as a result of new information, future events or otherwise. All FLI in this presentation and all subsequent FLI, whether written or oral, attributable to Enbridge, ENF, EEP or SEP, or any of their subsidiaries or affiliates, or persons acting on their behalf, are expressly qualified in its entirety by these cautionary statements.
Non-GAAP Measures
This presentation makes reference to non-GAAP measures, including adjusted earnings before interest and taxes (EBIT), adjusted earnings before interest, income taxes, depreciation and amortization (EBITDA), adjusted earnings and available cash flow from operations (ACFFO). Adjusted EBIT or Adjusted EBITDA represents EBIT or EBITDA, respectively, adjusted for unusual, non-recurring or non-operating factors. Adjusted earnings represents earnings attributable to common shareholders adjusted for unusual, non-recurring or non-operating factors included in adjusted EBIT, as well as adjustments for unusual, non-recurring or non-operating factors in respect of interest expense, income taxes, non-controlling interests and redeemable non-controlling interests on a consolidated basis. ACFFO is defined as cash flow provided by operating activities before changes in operating assets and liabilities (including changes in environmental liabilities) less distributions to non-controlling interests and redeemable non-controlling interests, preference share dividends and maintenance capital expenditures, and further adjusted for unusual, non-recurring or non-operating factors.
Management believes the presentation of these measures provides useful information to investors, shareholders and unitholders as they provide increased transparency and insight into the performance of Enbridge and its subsidiaries and affiliates. Management uses adjusted EBIT, adjusted EBITDA and adjusted earnings to set targets and to assess operating performance. Management uses ACFFO to assess performance and to set its dividend payout targets. These measures are not measures that have a standardized meaning prescribed by generally accepted accounting principles in the United States of America (U.S. GAAP) and may not be comparable with similar measures presented by other issuers.
EEP: Reconciliations of forward looking non-GAAP financial measures to comparable GAAP measures are not available due to the challenges with estimating some of the items, particularly with estimating non-cash unrealized derivative fair value losses and gains, which are subject to market variability and therefore a reconciliation is not available without unreasonable effort.
Enbridge Investor Day 2

SEP: A reconciliation of forward non-GAAP measures for 2018 to the most directly comparable GAAP measures is available on the SEP website. The reconciliations of forward looking non-GAAP financial measures to comparable GAAP measures beyond 2018 are not available due to the challenges with estimating certain items and therefore a reconciliation is not available without unreasonable effort.
Enbridge & ENF: A reconciliation of historical non-GAAP measures to the most directly comparable GAAP measures is available on Enbridge’s website. Reconciliations of forward looking non-GAAP financial measures to comparable GAAP measures are not available due to the challenges and impracticability with estimating some of the items, particularly with estimates for certain contingent liabilities, and estimating non-cash unrealized derivative fair value losses and gains and ineffectiveness on hedges which are subject to market variability and therefore a reconciliation is not available without unreasonable effort.
Additional information on non-GAAP measures may be found in the Management’s Discussion and Analysis (MD&A) available on Enbridge’s website, www.sedar.com or www.sec.gov.
Enbridge Investor Day 3
New York City & TorontoDecember 12 – 13, 2017
Enbridge Investor Days
Building Evacuation Procedures
safety moment
Enbridge Investor Day 4

Strategic Overview Al Monaco 8:30
Business Unit Updates:
Gas Transmission & Midstream Bill Yardley 9:30
Utilities Cynthia Hansen 10:00
Liquids Pipelines Guy Jarvis 10:20
Corporate Finance John Whelen 10:50
Concluding Remarks Al Monaco 11:50
Sponsored Vehicle Breakout Q&A Session to follow
Agenda
33
Legal Notice
Forward Looking InformationThis presentation includes certain forward looking statements and information (FLI) to provide potential investors and shareholders of Enbridge Inc. (“Enbridge”), Enbridge Income Fund Holdings Inc. (“ENF”), Enbridge Energy Partners, L.P. (“EEP”) and Spectra Energy Partners, LP (“SEP”) with information about Enbridge, ENF, EEP, SEP and their respective subsidiaries and affiliates, including management’s assessment of their future plans and operations, which FLI may not be appropriate for other purposes. FLI is typically identified by words such as “anticipate”, “expect”,“project”, “estimate”, “forecast”, “plan”, “intend”, “target”, “believe”, “likely” and similar words suggesting future outcomes or statements regarding an outlook. All statements other than statements of historical fact may be FLI. In particular, this presentation contains FLI pertaining to, but not limited to, information with respect to the following:strategic priorities and capital allocation; guidance with respect to any or all of 2017 through 2020; adjusted EBIT and EBITDA; ACFFO; distributable and free cash flow; payout ratios; debt/EBITDA ratios; funding requirements; financing plans and targets; secured growth projects and future development program; future business prospects and performance, including organic growth outlook; annual dividend growth and anticipated dividend increases;shareholder return; run rate synergies; integration and streamlining plans; project execution, including capital costs, expected construction and in service dates and regulatory approvals; system throughput and capacity; industry and market conditions, including economic growth, population and rate base growth, and energy demand, capacity,sources, prices, costs and exports; and investor communications plans.
Although we believe that the FLI is reasonable based on the information available today and processes used to prepare it, such statements are not guarantees of future performance and you are cautioned against placing undue reliance on FLI. By its nature, FLI involves a variety of assumptions, which are based upon factors that may be difficult to predict and that may involve known and unknown risks and uncertainties and other factors which may cause actual results, levels of activity and achievements to differ materially from those expressed or implied by the FLI, including, but not limited to, the following: the realization of anticipated benefits and synergies of the merger of Enbridge and Spectra Energy Corp; the success of integration plans; expected future adjusted EBIT, adjusted EBITDA, adjusted earnings and ACFFO; estimated future dividends; financial strength and flexibility; debt and equity market conditions, including the ability to access capital markets on favorable terms or at all; cost of debt and equity capital; expected supply, demand and prices for crude oil, natural gas, natural gas liquids and renewable energy; economic and competitive conditions; expected exchange rates; inflation; interest rates; changes in tax laws and tax rates; completion of growth projects; anticipated construction and in-service dates; changes in tariff rates; permitting at federal, state and local level or renewals of rights of way; capital project funding; success of hedging activities; the ability of management to execute key priorities; availability and price of labour and construction materials; operational performance and reliability; customer, shareholder, regulatory and other stakeholder approvals and support; hazards and operating risks that may not be covered fully by insurance; regulatory and legislative decisions and actions and costs complying therewith; effectiveness of the various actions resulting from strategic review processes; public opinion; and weather. We caution that the foregoing list of factors is not exhaustive. Additional information about these and other assumptions, risks and uncertainties can be found in applicable filings with Canadian and U.S. securities regulators (including the most recently filed Form 10-K and any subsequently filed Form 10-Q, as applicable). Due to the interdependencies and correlation of these factors, as well as other factors, the impact of any one assumption, risk or uncertainty on FLI cannot be determined with certainty.
Except to the extent required by applicable law, we assume no obligation to publicly update or revise any FLI made in this presentation or otherwise, whether as a result of new information, future events or otherwise. All FLI in this presentation and all subsequent FLI, whether written or oral, attributable to Enbridge, ENF, EEP or SEP, or any of their subsidiaries or affiliates, or persons acting on their behalf, are expressly qualified in its entirety by these cautionary statements.
Non-GAAP MeasuresThis presentation makes reference to non-GAAP measures, including adjusted earnings before interest and taxes (EBIT), adjusted earnings before interest, income taxes, depreciation and amortization (EBITDA), adjusted earnings and available cash flow from operations (ACFFO). Adjusted EBIT or Adjusted EBITDA represents EBIT or EBITDA, respectively, adjusted for unusual, non-recurring or non-operating factors. Adjusted earnings represents earnings attributable to common shareholders adjusted for unusual, non-recurring or non-operating factors included in adjusted EBIT, as well as adjustments for unusual, non-recurring or non-operating factors in respect of interest expense, income taxes, non-controlling interests and redeemable non-controlling interests on a consolidated basis. ACFFO is defined as cash flow provided by operating activities before changes in operating assets and liabilities (including changes in environmental liabilities) less distributions to non-controlling interests and redeemable non-controlling interests, preference share dividends and maintenance capital expenditures, and further adjusted for unusual, non-recurring or non-operating factors.
Management believes the presentation of these measures provides useful information to investors, shareholders and unitholders as they provide increased transparency and insight into the performance of Enbridge and its subsidiaries and affiliates. Management uses adjusted EBIT, adjusted EBITDA and adjusted earnings to set targets and to assess operating performance. Management uses ACFFO to assess performance and to set its dividend payout targets. These measures are not measures that have a standardized meaning prescribed by generally accepted accounting principles in the United States of America (U.S. GAAP) and may not be comparable with similar measures presented by other issuers.
EEP: Reconciliations of forward looking non-GAAP financial measures to comparable GAAP measures are not available due to the challenges with estimating some of the items, particularly with estimating non-cash unrealized derivative fair value losses and gains, which are subject to market variability and therefore a reconciliation is not available without unreasonable effort.
SEP: A reconciliation of forward non-GAAP measures for 2018 to the most directly comparable GAAP measures is available on the SEP website. The reconciliations of forward looking non-GAAP financial measures to comparable GAAP measures beyond 2018 are not available due to the challenges with estimating certain items and therefore a reconciliation is not available without unreasonable effort.
Enbridge & ENF: A reconciliation of historical non-GAAP measures to the most directly comparable GAAP measures is available on Enbridge’s website. Reconciliations of forward looking non-GAAP financial measures to comparable GAAP measures are not available due to the challenges and impracticability with estimating some of the items, particularly with estimates for certain contingent liabilities, and estimating non-cash unrealized derivative fair value losses and gains and ineffectiveness on hedges which are subject to market variability and therefore a reconciliation is not available without unreasonable effort.
Additional information on non-GAAP measures may be found in the Management’s Discussion and Analysis (MD&A) available on Enbridge’s website, www.sedar.com or www.sec.gov.
4
Enbridge Investor Day 5

Strategic Overview
President & CEOAl Monaco
North America’s Leading Energy Infrastructure Company
2
Enbridge % of N.A. Inland Flows
Crude Oil Transported
Natural Gas Transported
Natural Gas Processed
~28% ~20% ~12%• Premium portfolio of strategically positioned franchises
• Serving critical supply basins and consuming markets
• Low risk business profile with minimal volume andcommodity price exposure
Unique and diversified portfolio of premium energy infrastructure assets
51%32%
13%
4%
74%
8%
12%6%
EBITDA = C$6.9BTotal Assets = C$86B
EBITDA = ~ C$12.5BTotal Assets = ~ C$171B
2016 2018e
Liquids pipelines
Gas transmission & midstream
Gas distribution
Renewables & other
Enbridge Investor Day 6
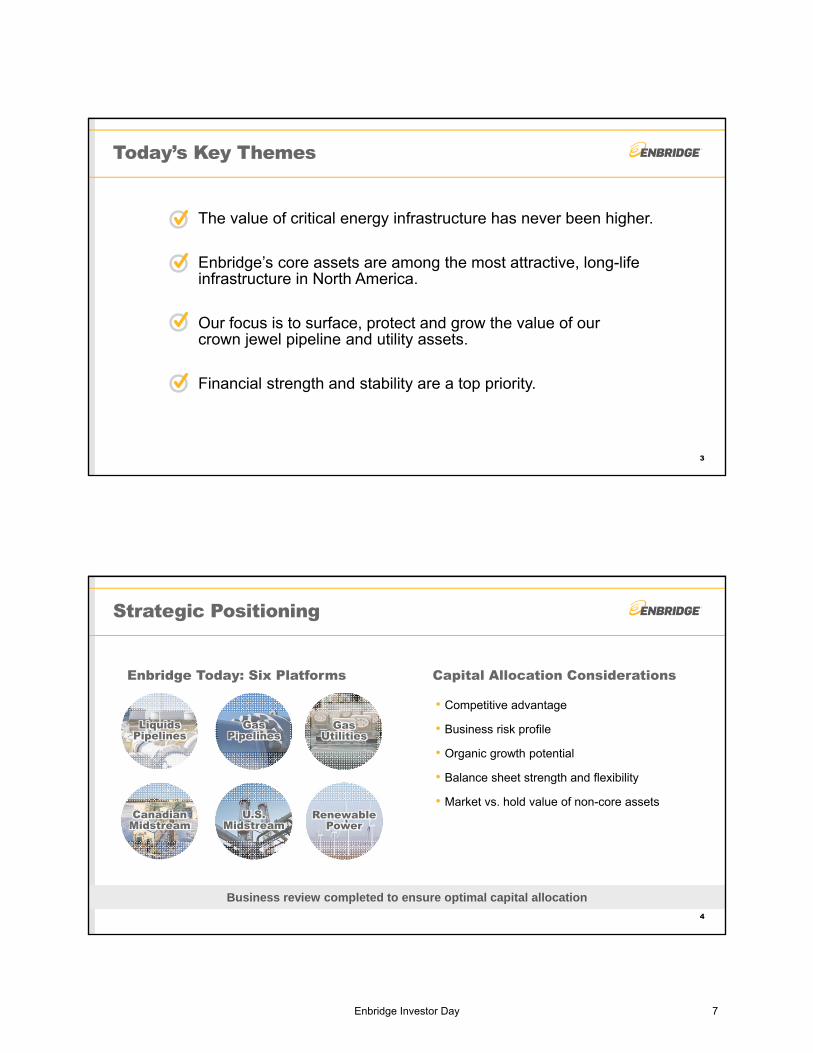
Today’s Key Themes
1. The value of critical energy infrastructure has never been higher.
2. Enbridge’s core assets are among the most attractive, long-lifeinfrastructure in North America.
3. Our focus is to surface, protect and grow the value of ourcrown jewel pipeline and utility assets.
4. Financial strength and stability are a top priority.
3
Strategic Positioning
4
Enbridge Today: Six Platforms
Business review completed to ensure optimal capital allocation
Capital Allocation Considerations
• Competitive advantage
• Business risk profile
• Organic growth potential
• Balance sheet strength and flexibility
• Market vs. hold value of non-core assets
Gas Pipelines
CanadianMidstream
U.S.Midstream
RenewablePower
Gas Utilities
Liquids Pipelines
Enbridge Investor Day 7
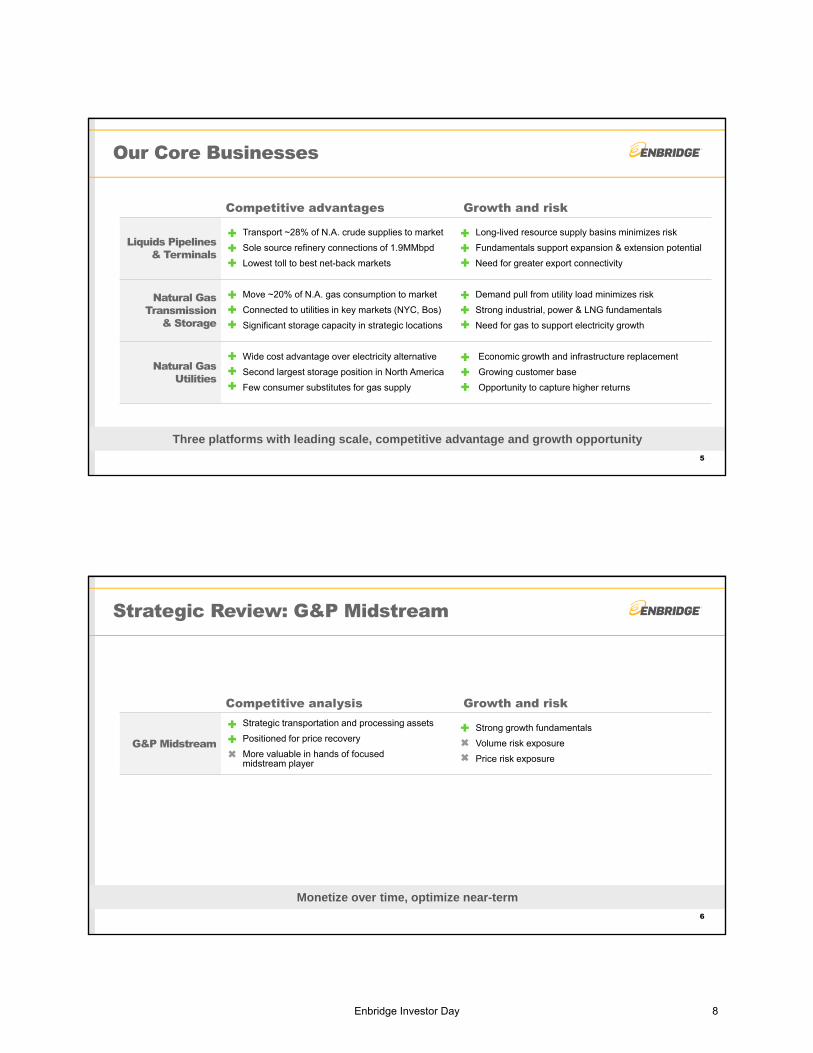
Our Core Businesses
5
Three platforms with leading scale, competitive advantage and growth opportunity
Competitive advantages Growth and risk
Liquids Pipelines & Terminals
• Transport ~28% of N.A. crude supplies to market
• Sole source refinery connections of 1.9MMbpd
• Lowest toll to best net-back markets
• Long-lived resource supply basins minimizes risk
• Fundamentals support expansion & extension potential
• Need for greater export connectivity
Natural Gas Transmission
& Storage
• Move ~20% of N.A. gas consumption to market
• Connected to utilities in key markets (NYC, Bos)
• Significant storage capacity in strategic locations
• Demand pull from utility load minimizes risk
• Strong industrial, power & LNG fundamentals
• Need for gas to support electricity growth
Natural Gas Utilities
• Wide cost advantage over electricity alternative
• Second largest storage position in North America
• Few consumer substitutes for gas supply
• Economic growth and infrastructure replacement
• Growing customer base
• Opportunity to capture higher returns
Strategic Review: G&P Midstream
6
Monetize over time, optimize near-term
Competitive analysis Growth and risk
G&P Midstream
• Strategic transportation and processing assets
• Positioned for price recovery
• More valuable in hands of focused midstream player
• Strong growth fundamentals
• Volume risk exposure
• Price risk exposure
Enbridge Investor Day 8

Strategic Review: Renewable Power
7
Monetize certain onshore assets; Continue to execute offshore capital program
Competitive advantages Growth and risk
North AmericaOnshore
• Good scale and diversification
• Strong stable PPA’s
• Competitive development landscape
• Strong demand for renewable power
• Long-term contracted cash flows
• Market value exceeds hold value
• Fewer long-term PPAs available
EuropeanOffshore
• Large scale offshore project execution and operating experience
• Financial strength
• Co-development experience
• Very strong growth fundamentals
• Long-term contracted cash flows
• Numerous large-scale investment opportunities
Repositioning the Business Mix
8
Current 2020+ Results:
Leading North American pipeline & utility company with three crown jewel platforms
Utility
Regulated Crude
Pipelines
Regulated Gas
Pipelines
U.S. Midstream
Cdn Midstream
Onshore Renewable
Offshore Renewable
Regulated Gas
Pipelines
Regulated Crude
Pipelines
Utility
Reposition toLeading North American
Pipeline & Utility Company
Multi-Faceted North American Energy Infrastructure
Company
Renewables & other
• Low risk business model
• Highly predictable cash flows
• Aligns with competitiveadvantages
• Strong organic growth potential
Enbridge Investor Day 9

Capital Expenditure Program, 2018–2020
9
Secured capital program drives significant EBITDA growth through 2020
-
3
6
9
12
15
2017 2018 2019 20200
3
6
9
12
15
2017 2018e 2019e 2020e
~$14
~$9~$8
~$5
Annual Cap Ex by Segment (C$ Billion) EBITDA by Segment (C$ Billion)
Green Power
Gas Distribution
Gas Transmission
Liquids Pipelines
Maintenance Capital
$22
e eeee
Balance Sheet Strengthening Actions
10
Significant actions to further strengthen the balance sheet
2016 – Nov 2017:2018 Pre-Funding Completed: 2018 – 2020 Plan:
• ~$8B of common equityequivalent from Jan 2016to Nov 2017
• 100% equity financed SpectraEnergy deal
• $2.6B of asset sales
• $1.5B of ENB common equity
• $0.6B of ENF common equity
• $0.5B of ENB C$ preferred equity
• $3.5B of hybrids throughend of 2018
• $3B of asset sales in 2018
Enbridge Investor Day 10

$22
$14
$4$3
$13
Uses Sources
Conservative Funding Plan, 2018-2020
11
Capital Expenditures
Sr. Debt Reduction
DRIPOptional hybrid securities Optional SV equity
Secured growth plan readily financeable
Optional asset sales
$4
2018 – 2020 Funding ($C billions)
$23B
• $26B of funding required
• $23B of internally generated cash flow and identified funding actions
• Significant buffer to meet remaining funding requirement
– DRIP by itself can meet this need
• Potential to turn off DRIP during plan period
Internal cash flow net of dividends
Common equity
Hybrid securities
Asset sales
$2
Balance Sheet Strength
• Conservative balance sheet management
– Significant deleveraging under way
– Driven by cash from growth projects and proactive financings
• Target credit metrics to be achieved in 2018, exceeded by 2020
• Financial strength and flexibility
12(1) Normalized for absence of two months contribution from legacy Spectra assets.
Actions taken and funding plan achieve target metrics by 2018 and additional flexibility by 2020 & beyond
0%
5%
10%
15%
20%
2015 2016 2017e 2018e 2019e 2020e
0
2
4
6
8
2015 2016 2017e 2018e 2019e 2020e
Consolidated DEBT to EBITDA
Consolidated FFO to Debt
Target: ≤ 5.0x
Target: ≥ 15%
1
1
Enbridge Investor Day 11

10% ACFFO/share CAGR through 2020; Strong fundamentals drive post 2020 growth
–
$1.00
$2.00
$3.00
$4.00
$5.00
$6.00
2017E 2018E 2019E 2020E 2021+
ACFFO/Share Growth Outlook
13
Future Growth Drivers 2021+• Organic growth
opportunities in corebusiness platforms
• Annual cash flow, net ofdividends, of ~$5Bavailable for reinvestment
Significant opportunities across core platforms to extend growth beyond 2020
Post-2020 Growth Potential
14
Liquids Pipelines & Terminals
Gas Transmission & Storage Gas Utilities
Offshore Renewables
• Mainline expansions
• Regional growth: Oil Sands, DAPL, Express-Platte
• Permian & USGC exports
• Texas Eastern expansions and extensions
• New infrastructure serving:gas-fired power generation,USGC markets, Southeast markets, export markets
• WCSB egress solutions
• Annual customer additions and community expansion capital
• Dawn Hub infrastructure
• $4.5B in late stage development
• Other European offshore projects under development
$5-10B $5+B$5-10B $5-10B
Enbridge Investor Day 12

Streamlining Our Operations
15
Maximizing the value of our assets
On Track$800Million
Other costs
General O&A costs
Supply chain optimization
Tax
Spectra Transaction Synergy Targets
Timing 2017 2018 2019
Cost synergy capture ~50% ~80% 100%Tax synergy capture 0% 0% 100%
Objectives• Capture Spectra acquisition cost and tax synergies
• Optimize supply chain
• Achieve top quartile cost performance
Streamlining Our Operations: Corporate Structure
16
Continue to monitor for opportunities to maximize value
2017 Actions taken: 2018 Actions planned:
• EEP capital restructure
• MEP buy-in
• DCP simplification
• Proposing to eliminate SEP IDRand 2% GP interest
‒ Exchange for LP units
‒ Optimize SEP cost of capital
‒ Position for further growth
ENF
EEP
SEP
Enbridge Investor Day 13

Key Priorities
17
$22B secured capitalexpenditure plan
Drives strong ACFFO growththrough 2020
Developing new prospects forextension/expansion/replacement
Disciplined capital allocation
Focus on safety and reliability
Regulated pipeline and utilitymodel
Balance sheet strength andflexibility
Cost and tax synergies
Top quartile cost performance
Sponsored vehicle actions
An Attractive Investor Value Proposition
ENB
SuperiorLow Risk Business
Model
Steady &Growing
Cash Flow
Strong Organic Growth
Superior low risk business model
Strong organic growth
Steady & growing cash flow
18
Enbridge Investor Day 14

Long history of strong and sustainable dividend growth
Dividend Growth Outlook
1996 2017e
10%3 Year CAGR
• 22 years of sustained dividend increases
• 10% dividend growth in 2018
• 10% 3-year CAGR, 2018-2020
• Conservative payout ratio of below 65%
19
11%22 Year CAGR
(1996-2017)
Q&A
Enbridge Investor Day 15

Gas Transmission& Midstream
EVP & President Gas Transmission & MidstreamBill Yardley
Premier Gas Transmission Footprint
2
Canadian Gas Transmission & Midstream
U.S. Transmission
U.S. Midstream
Gas Transmission Value Proposition• Unparalleled asset footprint
• Safe, reliable operations
• Connecting diverse supply basinswith growing demand markets
• Stable and predictable cash flow
• No direct commodity exposure
• Minimal volume exposure
• Strong investment-grade customers
• Track record of successful projectexecution
Enbridge Investor Day 16

Strong, Growing & Stable Contributorto Enbridge EBITDA
3
• Transmission business predominantlydrives GTM earnings
• Significant contribution to stable, fee-basedearnings from transmission businesses
• GTM’s transmission EBITDA is primarily:
– Take-or-pay contracts
– Limited volume risk
– No direct commodity exposure
Gas Utilities & Power
LiquidsPipelines
Gas Transmission & Midstream (GTM)
Gas transmission assets are core to regulated pipeline and utility business model
2018e EBITDA
Other
Enbridge
Midstream17%
GasTransmission
85%Midstream
15%
13%
51%
32%
4%
Compelling Gas Transmission Business
Strategically located assets
Fully contracted
Regulated cost of service or negotiated rate contracts
Consistent high renewal rates
Primarily LDCs and producers
First mile to last mile advantage
4* TETLP and AGT
Existing transmission assets provide long-term value and stability
~98%Annual contract
renewal*
~45%Regulated,
cost of service*
~75%Revenues from
LDCs*
Colerain Compressor Station, Ohio
Enbridge Investor Day 17

Solid Gas Transmission Base
5
94% 98% 97% 99% 97% 95% 99.5% 97%
72%
94% 92%
Texas Eastern Gulfstream Algonquin East Tennessee Southeast Supply Header
Maritimes & Northeast
(US & Canada)
Sabal Trail Vector Offshore Alliance BC Pipeline
2016 Reservation Revenue 2016 Usage & Other Revenue
GTM Reservation Revenue (Based on revenues for 12 months ended 12/31/16)
8years
Average Contract
Terms13years
7years
9years
6years
8years
Achieved Peak Delivery Days in 2016
(1) Includes Texas Eastern, Gulfstream, Algonquin, East Tennessee, Southeast Supply Header, Ozark Gas Transmission, Big Sandy and Maritimes & Northeast USStable core business highlights valuable footprint and provides platform for growth
17years
Life of lease
25years
5years
8 years
N/A
Robust Portfolio of Secured Growth Projects
6
Project Est. Capital ($MM) SEP
2017
In-S
ervi
ce Jackfish Lake – T-North $245 CAD
Sabal Trail (@50%) $1,600 USD
Access South, Adair SW & Lebanon Extension
$450 USD
Gulf Markets – Phase 2 $110 USD
2018
Wyndwood – T-North $250 CAD
RAM – T-South $525 CAD
High Pine – T-North $425 CAD
Stampede Lateral $150 USD
NEXUS (@50%) $1,300 USD
TEAL $200 USD
Valley Crossing $1,500 USD
Atlantic Bridge* $500 USD
STEP $130 USD
2019
+
Stratton Ridge $200 USD
PennEast (@20%) $260 USD
Lambertville-East $45 USD
Sabal Trail Phase II & III **
Spruce Ridge – T-North $525 CAD
T-South Expansion $1,000 CAD
*Atlantic Bridge – Partial in-service Nov 2017 with remaining in 2H2018** Sabal Trail II & III est. capital is part of original project totalValley Crossing
Atlantic Bridge
Gulf Markets
PennEast
NEXUS
TEAL
Access South
Adair Southwest
Lebanon Extension
STEP
Stratton Ridge
T-South
High Pine
WynwoodSpruce
Ridge
RAM
Stampede
Sabal Trail II - III
Jackfish Lake
Enbridge Investor Day 18

Sabal Trail Valley Crossing
Sabal Trail & Valley Crossing
7
GAAL
FL
Sabal Trail
TX
Mexico
Valley Crossing
Nueces Header
516 miles of greenfield pipeline successfully and safely placed into service on time and on budget
Great progress on construction, project is currently ahead of schedule and on budget
NEXUS:Delivering Prolific Supply to Premium Markets
• 255 miles of greenfield pipe, moving1.5 Bcf/d of Marcellus gas to markets inOhio, Michigan and Ontario
• Provides a diverse, competitive supplyof natural gas to markets along the route
8
Vector
Enbridge Gas Distribution & Union Gas
Dawn Hub
Texas Eastern
Interconnects:LDCPower / IndustrialStoragePipeline
Route:NEXUSDTE GasVector
Enbridge Investor Day 19

0
20
40
60
80
100
120
140
2017 2020 2025 2030 2035
N. American Natural Gas DemandGrows & Diversifies
9
Natural Gas Demand Growth by Region(Bcf/d increases by 2035)
NA Natural Gas Demand by Sector(Bcf/d)
LNG ExportsMexico Exports
Other
Power Gen
Industrial
Residential
E. Canada
+0.6W. Canada
+3.5
W. North Central
+2.1Mountain
+1.8Pacific
+1.6
Mexico Exports
+3.2LNG Exports
+10.6
E. North Central
+2.1
Northeast
+3.5
South Atlantic
+6.1EastS. Central
+4.7West
S. Central
+8.9
Source: Wood Mac, PIRA Source: Wood Mac, PIRA
Natural Gas Supports Growing Demand
10
ISO-NE winter stats… natural-gas-firedgeneration at risk of not being able to get fuel when pipelines are constrained:
more than 4,000MW(number will increase in future years as more coal, oil, and nuclear plants retire and are replaced with gas-fired units)
source: ISO NE 2017/2018 Winter Outlook
Natural gas generating capacity will increase from 28% of PJM’s total generating capacity mix to 35%, slightly exceeding total coal-fired generating capacity.
source: PJM
New York: Natural gas is 57% of current operating capacity and over 50% of proposed new generation capacity
source: NY ISO, Power Trends 2017
Mexico is constructing dozens of new natural gas-fired power plants across the country to meet increasing electricity demand.
To fuel these new power plants, many natural gas pipelines are being constructed to import larger amounts of natural gas from the United States.
source: EIA
Enbridge Investor Day 20

Northeast & New England
11
Development opportunities in next 5 years
Natural gas fired generation replaces other retiring generation sources
Northeast / New England• Demand continues to increase
• Solution needed to bring affordablegas to the region
Philadelphia Market• Market opportunities for industrialand exports
Philly Market Expansions
New England Opportunities
BOSTON
NYC
PHILADELPHIA
DC
DETROIT
NEXUS
Dawn Hub
$1-3Bin opportunities
ORLANDO
TAMPA
Power generationopportunities
NOLA
FL
AL
GAMS
Southeast Markets
12
Development opportunities in next 5 years
Continued growth in natural gas fired power generation
Southeast Markets• Natural gas power generation
- Coal-to-gas conversions- Increase in Florida demand
$1-2Bin opportunities
Enbridge Investor Day 21

Gulf Coast Markets
13
Development opportunities in next 5 years
New Gulf Coast natural gas demand drives solid growth opportunities
Gulf Coast • Epicenter of demand for LNG andMexico exports
Permian• DCP offers Permian solutions toproducers
Offshore US Gulf Coast
Exports to Mexico
Permian
NOLA
MT BELVIEU
OffshoreMexico
TXLA
MS
LNG & Industrial $2-4Bin opportunities
Western Canada
14
Development opportunities in next 5 years
Egress solutions drive Western Canada opportunities
Western Canada• Producers looking for egress solutions
‒Alliance
‒ T-South
‒NGL transmission opportunities
‒Montney/Duvernay expansions
‒ LNG opportunities
SEATTLE CALGARY
VANCOUVER
Montney / DuvernayExpansions
Transmission Opportunities
Alliance
T-South
ABBC
$1-2Bin opportunities
Enbridge Investor Day 22

Key Priorities
15
Gas Transmission & Midstream
• Advance execution projectssafely and successfully
• Deliver projects on time andon budget
• Secure sustainable, highreturn growth opportunities
• Grow stable, take-or-paybusiness
• Ensure re-contracting ofbase revenue
• Maintain little or nocommodity and volume risk
• Leverage scale of enterprise
• Take advantage of synergyopportunities
Q&A
Enbridge Investor Day 23
Utilities
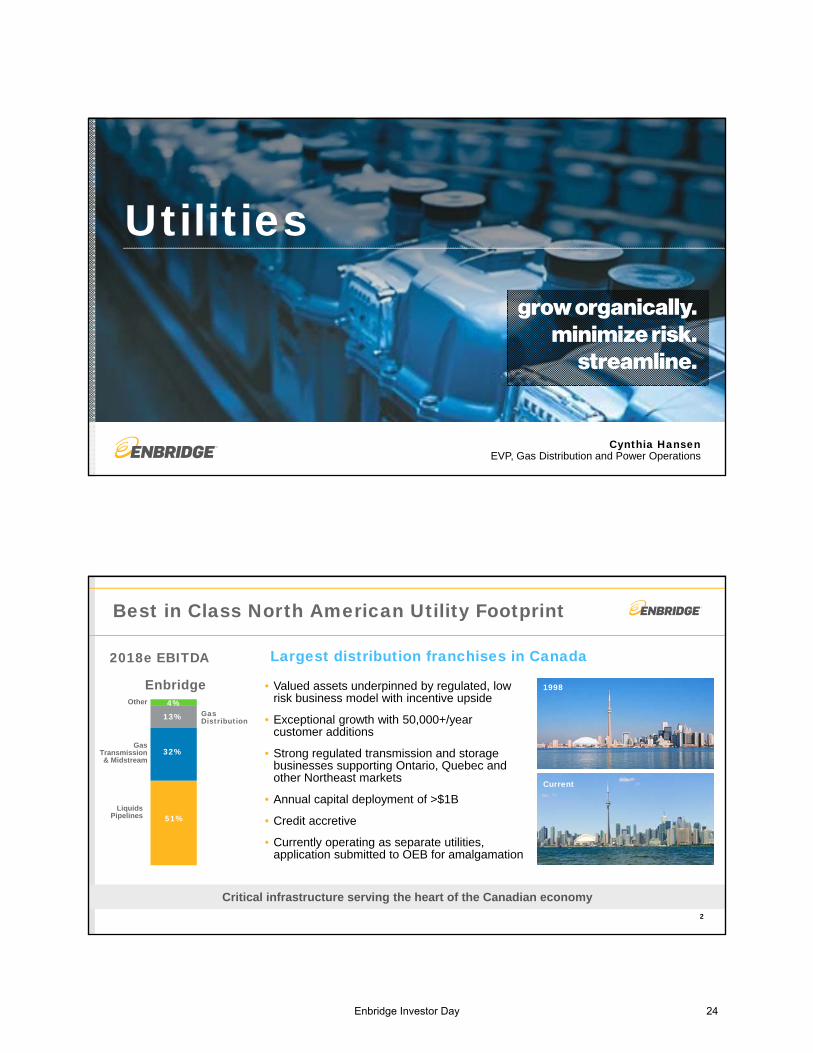
EVP, Gas Distribution and Power OperationsCynthia Hansen
Critical infrastructure serving the heart of the Canadian economy
Best in Class North American Utility Footprint
2
• Valued assets underpinned by regulated, lowrisk business model with incentive upside
• Exceptional growth with 50,000+/yearcustomer additions
• Strong regulated transmission and storagebusinesses supporting Ontario, Quebec andother Northeast markets
• Annual capital deployment of >$1B
• Credit accretive
• Currently operating as separate utilities,application submitted to OEB for amalgamation
4%Gas Distribution13%
51%
32%
2018e EBITDA
Other
Enbridge
Gas Transmission& Midstream
Current
1998
Liquids Pipelines
Largest distribution franchises in Canada
Enbridge Investor Day 24

$893
$2,440 $2,302$2,021
$0
$500
$1,000
$1,500
$2,000
$2,500
$3,000
Natural Gas Heating Oil Electricity Propane
1 New York City
2 Los Angeles
3 Chicago
4 Dallas-Fort Worth
5 Houston
Strong and Consistent Growth
3
Highly transparent rate base growth driven by position and competiveness
Ontario Growth Outlook (population, millions)
Largest Cities in North America
0
2
4
6
8
10
12
14
2008 2009 2010 2011 2012 2013 2014 2015 2016 2017
Union Gas
0
3
6
9
12
15
18
21
2006 2011 2016 2021 2026 2031 2036 2041
Combined Rate Base Growth (C$ B)
FORECAST
Residential Annual Heating Bills by Fuel
63%Savings
61%Savings
56%Savings
6 Toronto7 Washington DC
8 Philadelphia
9 Miami
EGD
Ontario
Greater Toronto Area
Dawn Hub
Detroit
NEXUS
Marcellus/ Utica Supply
Toronto
Texas Eastern
Union Gas
EGD
ON QC
NY
MI
PA
OH
Sarnia
Dawn Hub provides Opportunities for Growth
Dawn is 2nd most liquid physical hub in N. America• Connects multiple supply basins with strategic markets
• Dawn supply growing rapidly:
– TransCanada LTFP in service 4Q17
– Rover flowing to Dawn in 1Q18
– NEXUS in service 3Q18
• 278 Bcf of storage asset capacity with growth post 2020
• Dawn-Parkway transmission system
– 2017 Dawn-Parkway expansion brings capacity to 8.2 Bcf/d
– Regulated rates, highly contracted, high quality customers
– Northeast U.S. LDCs looking to increase supply at Dawn
– Further opportunity for utilities to move supply to Dawn
4
Infrastructure positioned to serve both growing supply basins and growing end use markets
Enbridge Investor Day 25

Incentive mechanisms have benefited customers and shareholders
5
Excellent history of maximizing efficiencies through incentive mechanisms
0%
2%
4%
6%
8%
10%
12%
14%
2008 2009 2010 2011 2012 2013 2014 2015 2016 2017F0%
2%
4%
6%
8%
10%
12%
2008 2009 2010 2011 2012 2013 2014 2015 2016 2017F
EGD: Custom IR– Rates adjusted for forecasted capital
– ROE reset each year
– Excess above allowed ROE shared 50% withratepayers
Union Gas: Price Cap– Price cap increasing revenues by 40% of inflation/year
– “Capital pass through” mechanism
– ROE fixed at 8.93%
– Excess >100 bps shared 50%, >200 bps shared 90%
Current Incentive Regulation:
EGD Historical Returns Union Gas Historical Returns
Utility Amalgamation Plan
6
Predictable customer rates with opportunity to earn higher returns through efficiencies
Enbridge Gas Distribution Union Gas Total
Customers 2.1MM 1.5MM 3.6MM
2016 new customers
~30,000 ~22,000 ~52,000
Rate base $5.9B $4.8B $10.7B
Union Gas
EGD
ON
QC
NYMI
Toronto
Detroit
MN
Mergers Amalgamations Acquisitions & Divestitures (MAADs) filing
Key Points:– Price Cap Index– 10 year term– Incremental Capital Module– Base Rate Adjustments– Customer Protection Measures– Deferral and Variance Accounts– Earnings Sharing Mechanism for incentive
upside Years 1-5: No sharing
Years 6-10: 50% above 300 bps
Enbridge Investor Day 26

Utility Amalgamation Benefits Customers & Shareholders
Synergy potential:
• Customer care
• Distribution work management
• Utility shared services
• Storage and transmission, gassupply and gas control
• Management functions andother functions
7
Early investment supports synergy capture over the 10-year plan
Top Natural Gas Utilities in N. America by Volume
U.S. Rank Company Name
Total Annual Volumes
(Bcf)Total Customers
(Millions)
Enbridge Utilities 884.0 3.61 Southern California Gas Co 294.6 5.7
2 Atmos Energy Corporation 260.7 3.1
3 Nicor Gas 228.9 1.9
4 Consumers Energy Company 204.6 1.7
5 Pacific Gas 196.7 4.0
6 Public Service Electric & Gas Co 170.1 1.7Source: American Gas Association: Utility Rankings, excluding pipeline only companies
* Earnings in excess of 300 bps over allowed ROE.
Jan 2019
Implement 2019 RatesDay One -Amalgamated Utility
Q42017
Q32018
Q1 2019
OEBMAAD
application
Rates mechanism filing
PotentialOEB decisions
10 Year MAAD FrameworkNov 2, 2017 Nov 23, 2017
2024
Investments/savings100% shareholder
Savings*50% shareholder; 50% customer
2029
Jan 2029
Amalgamation Implementation Timeline
8
Applications filed with Ontario Energy Board support commencing integration in 2019
Enbridge Investor Day 27

Future Growth
• Rate base renewal and growth:– Customer additions 50,000/year
– Community Expansion
– $1 B/year + capital program
– Continue to optimize infrastructure inamalgamated utility
• Other opportunities:– Renewable Natural Gas (RNG)
– Compressed Natural Gas (CNG)
– Integrated gas & electric infrastructure
– Geothermal
9
$5+Bin opportunities
Key Priorities
10
Utilities
• Strong continued rate basegrowth
• Expansions of Dawn areainfrastructure
• Attach new communities
• Establish new, balancedregulatory framework withincentive upside
• Significant opportunity toachieve customer andshareholder benefits withintegrated utility
Enbridge Investor Day 28

Q&A
Enbridge Investor Day 29
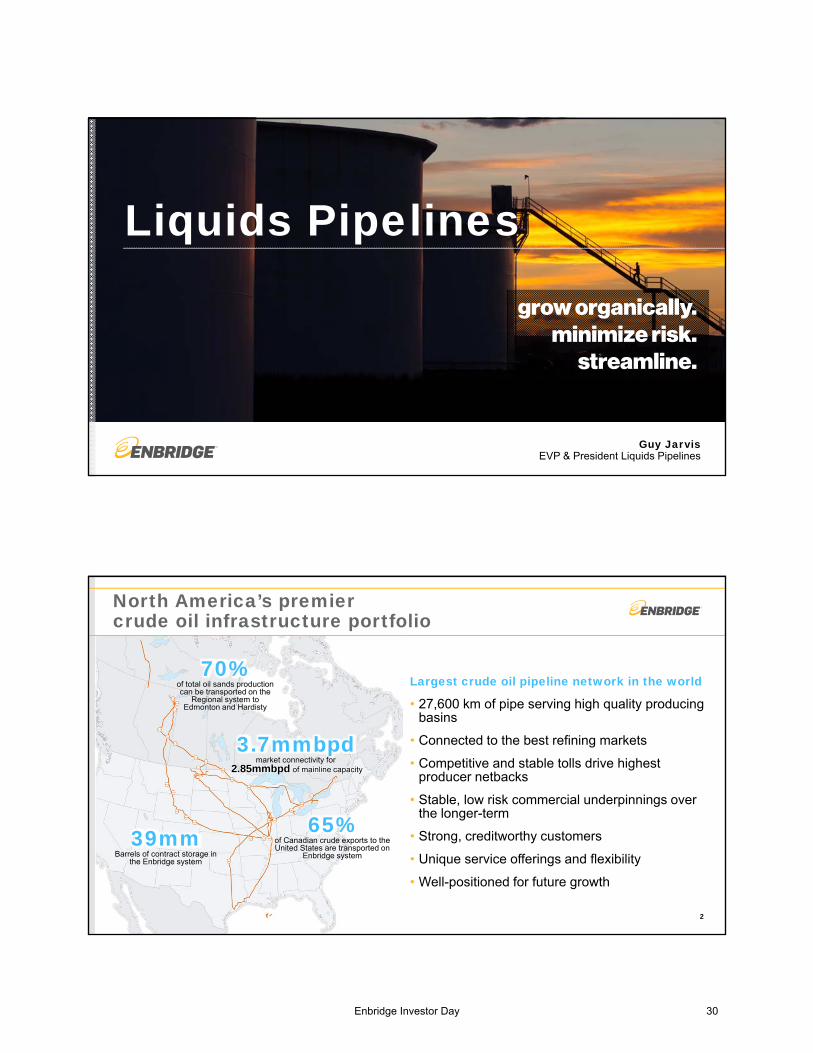
Liquids Pipelines
EVP & President Liquids PipelinesGuy Jarvis
North America’s premier crude oil infrastructure portfolio
2
Largest crude oil pipeline network in the world
• 27,600 km of pipe serving high quality producingbasins
• Connected to the best refining markets
• Competitive and stable tolls drive highestproducer netbacks
• Stable, low risk commercial underpinnings overthe longer-term
• Strong, creditworthy customers
• Unique service offerings and flexibility
• Well-positioned for future growth
39mm Barrels of contract storage in
the Enbridge system
65% of Canadian crude exports to the United States are transported on
Enbridge system
70% of total oil sands production can be transported on the
Regional system to Edmonton and Hardisty
3.7mmbpd market connectivity for
2.85mmbpd of mainline capacity
Enbridge Investor Day 30

Liquids Pipelines are core to regulated pipeline and utility business model
Liquids Pipelines
Large Stable Contributor to Enbridge EBITDA
3
2018e LP EBITDA by Business4% Other Highly Contracted4% Southern Lights Long Term Take-or-Pay3% Bakken System Common carrier with indexed rate*; Long Term Take-or-Pay
14% Regional Oil Sands Long Term Take-or-Pay
5% Express-Platte Long Term Take-or-Pay on Express
9% Mid-Continent &Gulf Coast Long Term Take-or-Pay
27% Lakehead System 100% Cost of service or equivalent agreements*
33% Canadian Mainline Competitive Tolling Settlement
4%Gas Utilities
& Power13%
51%
32%
2018e EBITDA
Other
Enbridge
Gas Transmission& Midstream
*Contract terms for our Lakehead system expansion projects mitigate volume risk for all expansions subsequent to Alberta Clipper. In the event volumes were to decline significantly the pipeline could potentially file cost of service rates. Similarly, the Bakken Classic system can also file cost of service rates if there is a substantial divergence between costs and revenues on the pipeline.
Enbridge system throughput to grow from 2.5 to 3.0 MMBPD by 2020
Enbridge System Likely to be at Maximum Capacity
4
0
500
1000
1500
2000
2500
3000
3500
2013 2014 2015 2016 2017e 2018e 2019e 2020e
• Focused on maximizing throughput andoperating efficiencies
• Additional system optimizations increasedthroughput by 87kbpd in 2H 2017
• Expect to be at or near capacity throughexpiry of CTS in 2021
‒ Strong supply growth
‒ Competitive tolls
‒ Limited pipeline alternatives
• Line 3 Replacement project restores+375 kbpd in 2H 2019
Line 3 in-service
AlbertaClipper
Expansion
Mainline Volume OutlookEx-Gretna Deliveries (KBPD)
Annual Capacity
System Optimization
Enbridge Investor Day 31

Liquids Pipelines Project Execution
5
Project ISD Contract life
Athabasca Pipeline Twin Jan 25 yrs
Norlite Diluent Pipeline May 25 yrs
Bakken Pipeline System June 7-10 yrs
JACOS Hangingstone Aug 20 yrs
Wood Buffalo Extension Dec 25 yrs
2019Mainline Secured Projects
2017Projects Completed
~$6BProjects placed
into service2017
~$9BProjects to be
placed intoservice 2019
Project execution driving significant near term cash flow growth
Line 3 Replacement Progressing Well
6
Edmonton
Hardisty
Kerrobert
Gretna
SuperiorND
WI
MN
Regina
Construction underway
~50% complete
Completed segments
to date
Construction underway
~90% complete
Regulatory Milestones:
• Critical infrastructure replacement
• Construction progressing well in Canada & Wisconsin
• Minnesota regulatory process ongoing
• Target ISD 2H 2019
1Q 2Q 3Q 4Q 1H 2H
2017 2018
Q1 2018FEIS adequacy determination
MPUCdecision
anticipated2Q18
Aug 2017Final Environmental Impact Statement (FEIS) published
Sept/Oct 2017Route Permit / Certificate of Need testimony submitted
Oct/Nov 2017 Route Permit / Certificate of Need hearings
Q1 2018ALJ Route/Need recommendation
Enbridge Investor Day 32

Canadian Oil Sands Positioned for Steady, Longer Term Growth
7
• Expected continued growth in the oil sandssupports Enbridge systems upstream, mainlineand market access
• Independent forecasts expect growth of~850 KBPD in oil sands supply, 2016-2022
• Long term resource potential
‒ 170 billion barrels of long lived reserves
‒ In-situ break-even <$60 WTI
‒ Average operating costs $5.75 – 7.50/Bbl
‒ Emissions/unit reductions of 20% since 2012(tonnes CO2/Bbl)0
1,000
2,000
3,000
4,000
5,000
6,000
2016 2017 2018 2019 2020 2021 2022 2023 2024 2025 2026 2027 2028 2029 2030
*NEB and CERI raw bitumen forecasts altered to reflect blended supply forecasts
CAPP
NEB
CERI
Canadian Oil Sands Supply Forecasts* (KBPD)
-
1,000
2,000
3,000
4,000
5,000
6,000
2017 2018 2019 2020 2021 2022 2023 2024 2025 2026 2027 2028 2029 2030 -
1,000
2,000
3,000
4,000
5,000
6,000
2017 2018 2019 2020 2021 2022 2023 2024 2025 2026 2027 2028 2029 2030
Enbridge Mainline Expected to Remain Highly Utilized
2017 CAPP Supply
Forecast
Two New Pipelines Scenario (KBPD)
Western Canadian demand
Contracted pipeline capacity
Enbridge Mainline capacity
Third party uncontracted capacity
Ord
er
of
Ca
pa
cit
y U
tili
zati
on
8
Western Canadian demand
Contracted pipeline capacity
Enbridge Mainline capacity
Third party uncontracted capacity
One New Pipeline Scenario (KBPD)
2017 CAPP Supply
Forecast2022 in service scenario
• Downstream commitments and strong netbacks ensure the Mainline is first choice for uncommitted WCSB barrels
• Mainline is expected to remain at full capacity in one export pipeline scenario
Export capacity picture remains unclear post 2021
ENB downstream take-or-pay commitments
ENB downstream take-or-pay commitments
WCSB Pipeline Utilization Scenarios Post-2021
• Two new pipeline scenario unlikely to impact revenue through 2021
• Post 2021, Mainline competitiveness and new incentive tolling mechanism with volume protection ensures minimal financial impact
• Mainline returns to full capacity as production growth continues
Enbridge Investor Day 33

Mainline Competitive Positioning beyond 2021
9
• PADD II market provides the highestnetback for WCSB producers
• Spot barrels on 3rd party pipelines toUSGC erodes WCSB producer netback
• Mainline connected to 1.9 mmbpd of‘sole sourced’ refining demand in thisregion
• Over 1 mmbpd of long term take or paydownstream contracts
1.9 mmbpdSole sourced supply
>1.0 mmbpdDownstream take-or-pay
commitments
USGC Netback on Competing Spot Barrel
USGC Pricing* $50
Third Party Toll ($8)
WCS Netback $42
* USGC pricing assumes Maya/WCS pricing at $50/barrel** WCS price in Chicago is price set by Maya + inland pipeline toll of $3/bbl from USGC
Chicago NetbackChicago Pricing** $53
Enbridge Toll ($5.50)
WCS Netback $47.50
Long Track Record of Mutually Beneficial Agreements with Customers
10
1994 - 2004 2005-2011 2011-2021e 2022+0%
2%
4%
6%
8%
10%
12%
Mainline Return on Capital Employed
• Interest alignment through incentivebased frameworks
• Progressive and adaptive throughmarket cycles and customer needs
• Appropriate sharing ofvalue/risk/reward
• Fair return on capital
CTS Re-negotiation Principles
Target ROCE
Incentive Tolling
Settlement (ITS)
ITS extended to 2009
Competitive Tolling
Settlement (CTS)
Operating cost management & efficiency incentives
Quality & schedule incentives added
TBD
• Toll certainty & stability
• Upside volumeincentive
• COS floor
• Shipper alignment • Volume protection• Incentives• Fair return on
capital
Enbridge Investor Day 34

Mainline Expansion Opportunities
11
Low cost, highly executable, staged expansions to match supply growth
Incremental Capacity 2019 Capacity (KBPD)
System DRA Optimization +75
BEP Idle* +100
Incremental Capacity 2019+System Station Upgrades +100
Line 4 Capacity Restoration +25
Line 13 Reversal +150
Total Unsecured Incremental Capacity +450
*Incremental capacity refers to long-haul volumes
+450 kbpdMainline
expansioncapability
Gulf Coast Markets
300+ kbpdpotential Caplinereversal
+250 kbpdFlanagan
South / Seawayexpansion capability
Patoka
Chicago
Hardisty
Mt Belvieu
Cushing
$2-4Bin opportunities
Oil Sands System DAPL Expansion Express-Platte
• Well positioned in oil sands to capture future supply growth
• Connected to growing projects
• Geographically diversified
• Additional capacity on trunk lines
• Bakken supply growth could drive future DAPL expansion
• Leveraging highly competitive tolls
• Strong Patoka/USGC markets
• Express-Platte system optimization or expansion
• Market access to Cushing/USGC
• Extension to Patoka
Other Development Opportunities
12
BAKKEN
DAPL
PatokaWood River/
Patoka
Express
Platte
Hardisty
PADD IV
$1-3Bin opportunities
Enbridge Investor Day 35

Permian Strategy – Gray Oak USGC Strategy
Objective: Expand liquids footprint into Permian Basin
Opportunity: High drilling activity and supply growth point to pipeline shortage.
Project Gray Oak: Joint venture with Phillips 66
Objective: Leverage expertise to expand footprint in USGC
Opportunity: Growing crude exports drive the need for deep water export facilities development
Leverage expertise in fee-for-service, independent terminal and pipeline operation
New Platform Development Opportunities
13
Mt Belvieu
Freeport
Cushing
PERMIAN
Mt Belvieu
Freeport
Strong fundamentals present opportunity to expand into new markets
$2-3Bin opportunities
Key Priorities
14
Liquids Pipelines
• Execute Line 3 ReplacementProject
• Additional expansions ofmainline and market accessfootprint
• Re-negotiate mainlinecommercial agreement withappropriate risk mitigationframework
• Assess revenue synergyopportunities
• Cost efficiency focus
Enbridge Investor Day 36

Q&A
Enbridge Investor Day 37

Corporate Finance
Executive VP & Chief Financial OfficerJohn Whelen
Finance in 2017A busy year; solid execution progress
21 Pro-forma based on transaction close date of February 27, 2017
Spectra closing– ~$37B all stock transaction
Integration and synergy realization– Initial reorganization completed; >50% of targeted cost synergies realized
Capital raising– ~$14B of new long-term capital raised
Balance sheet strengthening– $5.4B of new common equity equivalent; $2.6B asset sales since Spectra announcement
Simplification– MEP buy-in; EEP and DCP restructuring; SE Capital tender offer; utility integration plan
“Top-up” dividend post merger closing– To bring total annualized increase to 15%1
– Further 10% increase announced in December 2017, effective March 1, 2018
Enbridge Investor Day 38

Finance: Ongoing Priorities 2018-2020
3
Financial Objectives• Fund secured growth program
• Strengthen balance sheet
• Reinforce reliable business model
• Maximize value of existing/new assets
• Simplification
• Position for growth beyond 2020
supportsFinancial Strength & Stability• Strong investment grade credit profile
• Ready access to capital
• Ample liquidity
• Proactive risk management
• Strict investment discipline
• Cost of capital optimization
Best in class business profile; disposition of non-core asset further enhances business position
Corporate Risk Profile: Building on Strength
4(1) EBITDA generated under current Liquids Mainline Tolling Agreement; ability to revert to cost of service or other negotiated settlement on expiry. (2) Reflected after the impact of any credit enhancement. Enbridge Inc.exposure includes all direct exposure plus ownership interest in EIF, EEP and SEP. (3) Moody’s credit opinion dated April 7, 2017. (4) S&P ratings direct dated December 8, 2017.
Business Risk Assessment Scale
S&P3 Excellent
Moody’s4 A
Contractual Support
Counter PartyCredit Exposure2
2018e EBITDA
4%
96%TOP / COS / Fixed
Fee/CTS
8%
92%Investment Grade
Take-or-Pay / Cost-of-service Fixed Fee
Competitive Tolling Settlement (CTS) 1 Commodity Sensitive
“A” rated or higher
“BBB” rated
Sub-investment grade
Enbridge Investor Day 39

0% 20% 40% 60% 80% 100%
FX - Cash Flow Basis
FX - Earnings Basis
Fixed Rate Total Debt
Planned term debt hedgeposition
Market Price Risk Exposure
(1) Cash flow at risk measures the maximum cash flow loss that could result from adverse Market Price movements over a specified time horizon within a pre-determined level of statistical confidence under normal market conditions. (2) Current position, including impact of hedges. (3) Average 2018 hedge rate: ~1.18 CAD/USD
Consolidated Cash Flow at Risk1
(CFaR)
2018 – 2020 Avg: 40%
2018 Consolidated FX Hedge Position3
2018 Consolidated Debt Position
2018 – 2020 Avg: ~30%
Exposure to market prices pro-actively managed
<3%Cash Flow at Risk (as at September 30, 2017)
Minimal Direct Exposure to Commodity & Other Market Prices
2018 – 2020Avg: 65%~75%
~45%
~85%
~65%Planned term debthedge position
5
Fixed Rate/ Total Debt2
2017 Funding ProgressDemonstrated access to diversified sources of capital
6
Market AmountEquity and Equivalent
Follow-on Common Equity (ENB) US/Can Private $1.5Follow-on Common Equity (ENF) Can Public $0.6ENB Common Shares (DRIP) Can Public $1.2Sponsored Vehicles (ATM/DRIP)2 US/Can Public $0.4
Enbridge Inc. Hybrid Securities (50% equity) US/Can Public $1.7
DebtEnbridge Inc. US/Can Public $5.4
Wholly-owned Subsidiaries Can Public $0.8Sponsored Vehicles US Public $0.5Enbridge Inc. Hybrid Securities (50% debt) US/Can Public $1.7
Total Capital Raised $13.8Asset Monetization 1.1
Total 3 $14.9
1. Before deduction of fees and commissions where applicable; 2. Inclusive of funds raised through ENB and ENF DRIP, EnbridgeEnergy Management, L.L.C. (EEQ) PIK and SEP ATM programs. 3. USD values have been translated to CAD at rates at time of issuance.
Committed Credit Facilities (C$ Billion)
0
5
10
15
20
25
30
Dec-17Forecast
Committed Credit Lines
drawn
Committed Credit Lines
available
Capital Raised (C$ Billion)1
availableliquidity
Issuance of long term capital subsequent to the mergerhas replenished liquidity and created additional flexibility
~$14B
~$25B
Enbridge Investor Day 40

Consolidated Capital Expenditure Profile, 2018-2020
7
$0
$2
$4
$6
$8
$10
2018e 2019e 2020e
~$9.0 ~$8.0
~$5.0
Total Capital Expenditures by Segment(C$ Billion)
Consolidated MaintenanceCapital
46%34%
12%8%
Total Growth Capital Program by Segment
Liquids Pipelines Gas Transmission Gas Distribution Green Power
~$22B
Growth capital diversified across business platforms
$22
$14
$4$3
$13
Uses Sources
Secured Capital ProgramConsolidated Funding Plan, 2018-2020
8
Capital Expenditures
Sr. Debt Reduction
Substantial alternate sources of equity funding
Potential asset sales
$4
Sources and Uses($C billions)
Internal cash flow net of dividends
Common equity
Hybrid securities
Asset sales
$2
Planned fundingENB common shares $1.5
ENF common shares 0.6
ENB hybrid securities 0.5
ENB hybrid securities (2018) 3.5
TOTAL $6.1B
Additional potential sources, 2018-2020Ongoing DRIP/PIK $6.0
Additional hybrid securities (2019-2020) 4.0
Sponsored vehicle equity 3.0
TOTAL ~$13B
Sources and Uses ($C billions)
Capital expenditures (includes maintenance capital) $22.0
Debt reduction 4.0
Internal cash flow net of dividends (14.0)
Asset sales (3.0)
TOTAL $9.0B
Prefunded in 4Q17
Enbridge Investor Day 41

Balance Sheet Strengthening
91) As of December 12, 20172) Normalized for absence of two months contribution from legacy Spectra assets.
0%
5%
10%
15%
20%
2015 2016 2017e 2018e 2019e 2020e
0
2
4
6
8
2015 2016 2017e 2018e 2019e 2020e
Consolidated DEBT to EBITDA
Consolidated FFO to Debt
De-levering continues as secured growth capital plan is executed
Target: ≤ 5.0x
Target: ≥ 15%
Enbridge Unsecured Debt Ratings1
DBRS BBB High (stable)
Fitch BBB+ (stable)
Moody’s Baa2 (negative)
Standard & Poors BBB+ (stable)
Current Credit Rating
Improving credit profile should maintain strong investment grade credit ratings
2
2
2018 Outlook: Reporting Changes
10(1) Formerly called Gas Pipelines and Processing
• ENB will become a U.S. Domestic Filer
– File annual report on Form 10-K for YE 2017
– Regular periodic reports thereafter (Form 10-Q, Form 8-K,
– Prospectus offerings (S-3 Registration Statement)
• Business Unit Reporting at EBITDA level
– Comparative periods to be conformed
• ACFFO to be re-labelled Distributable Cash Flow (DCF)
– No changes to calculation or reporting
Illustrative Presentation YE 2017
Adjusted EBITDA by SegmentLiquids Pipeline XX
Gas Transmission & Midstream1 XX
Gas Distribution XX
Green Power & Transmission XX
Energy Services XX
Eliminations and Other XX
Consolidated Adjusted EBITDA 2018 XX
Reconciliation to ACFFO
Adjusted EBITDA
Maintenance capital (XX)
Current income taxes (XX)
Financing Costs (XX)
Distributions to non-controlling interests (XX)
Cash distributions in excess equity earnings XX
Other non-cash adjustments XX
ACFFO= DCF XX
Enbridge Investor Day 42

Secured Capital Program Drives EBITDA Growth over Planning Horizon
11*Rounded, USD capital has been translated to CAD using an exchange rate of $1 U.S. dollar= $1.24 Canadian dollars.(1) Partial in-service Nov 2017 with remaining in 2H2018.
~$2B
~$12B
~$7B
~$13B
0
3
6
9
12
15
2017 2018e 2019e 2020e
Secured Capital by In Service Date (C$ Billion)
Gas Distribution Green PowerLiquids Pipelines Gas Transmission
2020eT-South Expansion 1.0 CAD
Utility Core Capital 0.7 CAD
2020 TOTAL $2B*Total
Capital Program $22B
2018eHigh Pine 0.4 CAD
Rampion Wind 0.8 CAD
Stampede Lateral 0.2 USD
Wyndwood 0.3 CAD
NEXUS 1.3 USD
TEAL 0.2 USD
Valley Crossing 1.5 USD
STEP 0.1 USD
Atlantic Bridge1 0.5 USD
RAM 0.5 CAD
Utility Core Capital 0.5 CAD
Other 0.1 CAD
2018 TOTAL $7B*
2019eStratton Ridge 0.2 USD
PennEast 0.3 USD
Hohe See Wind 2.1 CAD
L3R – Canada 5.3 CAD
L3R – U.S. 2.9 USD
SA expansion 0.4 USD
Spruce Ridge 0.5 CAD
Utility Core Capital 0.8 CAD
2019 TOTAL $13B*
Financial Outlook: 2018e Consolidated EBITDA growth
12
Year-over-year EBITDA growth driven by new projects coming into service, volume growth and cost saving initiatives, bolstered by a full year’s contribution from legacy Spectra assets
Consolidated EBITDA
0
1
2
3
4
5
6
7
8
9
10
11
12
13
2017e 2018e
Drivers of Growth2018 Guidance by Segment
2018e EBITDA ($MM)
2018e versus 2017e Growth Drivers
Liquids Pipelines ~$6,350+ New projects placed into service+ Capacity optimization and supply growth+ Realized FX rates
Gas Transmission & Midstream ~$3,900
+ New projects placed into service+ Full year results from legacy Spectra assets- Planned asset monetization
Gas Distribution ~$1,650 + Full year results from legacy Spectra assets+ Rate base growth
Green Power & Transmission ~$425 + New projects
- Planned asset monetization
Energy Services ~$25 + Termination of capacity commitments
Eliminations & Other ~$150 + Enterprise-wide cost saving initiatives
Total EBITDA 2018e: ~$12,500
Liquids Pipelines
Gas Transmission
Gas Distribution
Green Power
Energy Services
Eliminations & Other
Enbridge Investor Day 43
Enbridge Inc. Financial Outlook –2018e Available Cash Flow from Operations (ACFFO)
13
After looking at accretive existing hedges
(1) ACFFO 2018 Estimate
Adjusted EBITDA ~$12,500
Maintenance capital ~(1,300)
Current income taxes ~(300)
Financing Costs ~(3,000)
Distributions to non-controlling interests ~(1,300)
Cash distributions in excess of equity earnings ~350
Other non-cash adjustments ~300
ACFFO ~$7,250
ACFFO/Share Guidance $4.15-$4.45
2018 Guidance Key Sensitivities
DriverAnnualized Base Plan
AssumptionACFFO/ Share
OperationsLP Mainline Volumes
(+/-50 Kbpd)~2,650 Kbpd
Ex-Gretna~$0.03
LP Mainline Apportionment(+/-10%) - downstream impacts
15% ~$0.02
Utility Heating Degree Days-HDD(+/-5%)
~4,000 HDD ~$0.03
Market Prices - Direct Impacts*+/- $0.10/MMBtu Natural Gas Prices ~$2.95/MMBtu1 < $0.005
+/- $1/Bbl NGL Prices ~$24/Bbl2 ~$0.008
+/- .25% Interest Rates Current market rates3 ~$0.02
+/- $.01 CAD/USD $1.24 ~$0.015
*Taking into account existing hedges.(1) Henry Hub (US$/MMBtu) (2) US$/composite bbl(3) 3M CDOR: 1.8%; 3M LIBOR 1.9%; 10Y GoC 2.3%; 10Y UST: 2.6%
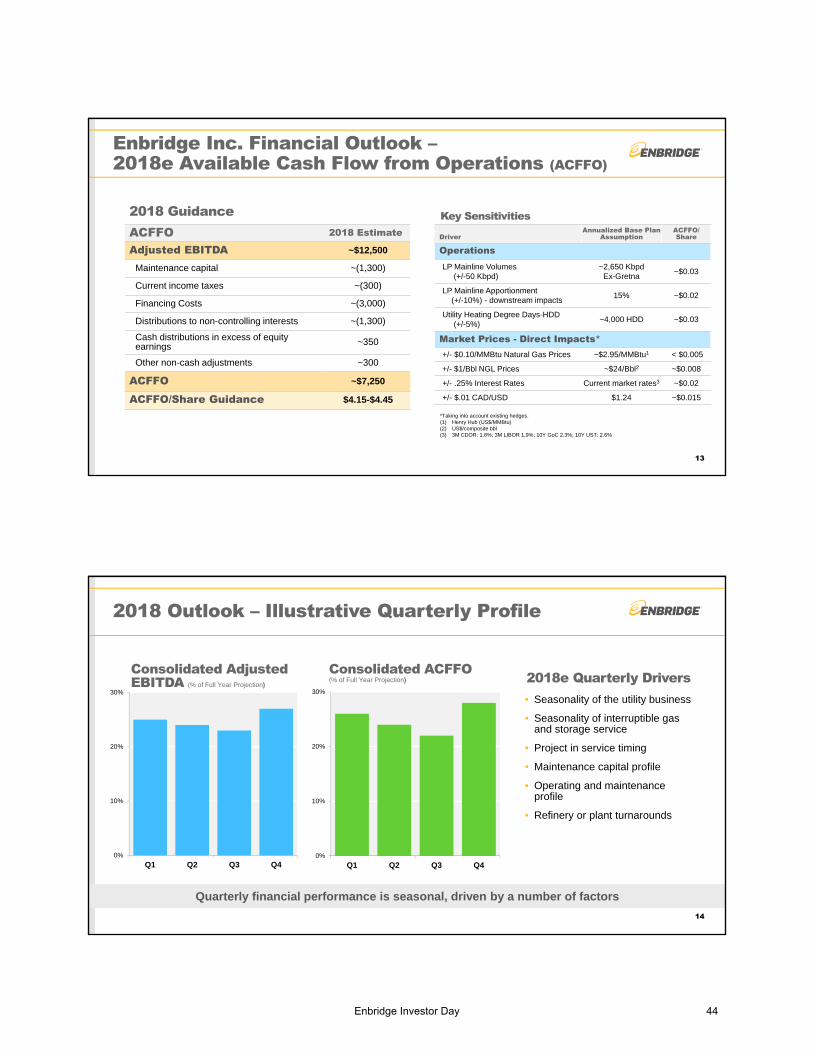
2018 Outlook – Illustrative Quarterly Profile
14
Consolidated Adjusted EBITDA (% of Full Year Projection)
2018e Quarterly Drivers • Seasonality of the utility business
• Seasonality of interruptible gasand storage service
• Project in service timing
• Maintenance capital profile
• Operating and maintenanceprofile
• Refinery or plant turnarounds
0%
10%
20%
30%
Q1 Q2 Q3 Q40%
10%
20%
30%
Q1 Q2 Q3 Q4
Quarterly financial performance is seasonal, driven by a number of factors
Consolidated ACFFO (% of Full Year Projection)
Enbridge Investor Day 44

Longer Term Financial Outlook, 2018 – 2020
15
ACFFO 2018Estimate
2019Estimate
2020Estimate
Adjusted EBITDA ~$12,500 ~$13,100 ~$15,000
Maintenance capital ~(1,300) ~(1,400) ~(1,400)
Current income taxes ~(300) ~(400) ~(500)
ACFFO ~$7,250 ~$7,600 ~$8,700
ACFFO/Share $4.15-$4.45 $4.30 - $4.60 $4.85 - $5.15
$-
$1.00
$2.00
$3.00
$4.00
$5.00
$6.00
2017e 2018e 2019e 2020e
DPS ACFFO/Share
Growth through 2020 continues to be driven by system expansions and volume growth
Sponsored Vehicle Financial Outlook
Enbridge Investor Day 45

ENF Financial Outlook, 2018e-2020e
171 Includes Enbridge Income Fund and Enbridge Commercial Trust operating, administrative and interest expense, and ECT incentive fee and related costs
Distributable Cash Flow 2018e 2019e 2020eEIPLP Adjusted EBITDA ~$3,550 ~$3,650 ~$4,350
Maintenance capital ~(80) ~(85) ~(85)
Current income taxes ~(230) ~(300) ~(450)
Financing Costs ~(550)
Cash distributions in excess (less than) equity earnings ~50
Special interest rights distributions – IDR and Incentive fees1 ~(250)
Other non-cash adjustments ~60
Fund Group ACFFO $2,450 - $2,650 ~$2,600 ~$2,900
Fund Group Payout Ratio 80-90% 80-90% 80-90%
Coverage 1.2x-1.3x 1.2x-1.3x 1.2x-1.3x
EBITDA Growth Drivers
Liquids Pipelines ++
Gas Pipelines ~
Green Power ~
Cost management +
Distribution GrowthSecured Capital Program
2018: $2.26 (10% vs 2017)
2019/20 10% Growth
Liquids pipelines expansion and volume growth drives attractive cash flow and dividend growth
SEP Financial Outlook, 2018e-2020e
18(1) Subject to BOD approval.
Distributable Cash Flow 2018e 2019e 2020e
Ongoing EBITDA ~$2,300 ~$2,320 ~$2,350
Earnings from equity investments ~(280) ~(215) ~(295)
Distributions from equity investments ~260 ~315 ~360
Maintenance capital ~(230) ~(250) ~(200)
Financing Costs ~(315)
Distributions to non-controlling interests ~(50)
Equity AFUDC ~(45)
Other ~10
Distributable Cash Flow $1,630 - $1,670 ~$1,730 ~$1,800
Coverage 1.1x - 1.2x 1.1x – 1.2x 1.1x – 1.2x
DCF Growth Drivers
UST Expansion Projects ++
Lower Maintenance Capital +
Cost management +
Distribution GrowthSecured Capital Program
2018:$0.0125/qtr1
(~7% vs 2017)
2019/20: 4-6% per year
7% dividend increase in 2017; secured capital program alone delivers 4-6% annual distribution growth through 2020
Enbridge Investor Day 46

EEP Financial Outlook, 2018e-2020e
19(1) Bakken Pipeline System (DakTex): from 25% to 45%; Mainline Expansions: from 25% to 40%; Line 3: from 1% to 40%.
Distributable Cash Flow 2018e 2019e 2020e
Adjusted EBITDA ~$1,680 ~$1,800 ~$2,100
Maintenance capital ~(40) ~(50) ~(75)
Financing Costs ~(410)
Non-controlling interests ~(400)
Cash distributions in excess (less than) equity earnings ~30
Allowance for equity during construction ~(60)
Distributable Cash Flow $775 - $825 ~$875 ~$1,050
Distribution Coverage ~1.2x ~1.2x ~1.2x
EBITDA Growth Drivers
Book value call options1 ++
Index rates ~
Cushing storage ~
Cost management +
Restructured to a low risk, pure play liquids business with highly transparent growth
DCF Growth/unit GrowthSecured Capital Program
2018-2020: ~3%
Finance: Ongoing Priorities 2018-2020
20
Financial Objectives• Fund secured growth program
• Strengthen balance sheet
• Reinforce reliable business model
• Maximize value of existing/new assets
• Simplification
• Position for growth beyond 2020
supportsFinancial Strength & Stability• Strong investment grade credit profile
• Ready access to capital
• Ample liquidity
• Proactive risk management
• Strict investment discipline
• Cost of capital optimization
Enbridge Investor Day 47

Q&A
Enbridge Investor Day 48

Concluding Remarks
President & CEOAl Monaco
Key Takeaways
• Pure regulated pipelines/utility model
– Focused on crown jewel businesses
– De-emphasize, sell, monetize non-core assets
• Further strengthen balance sheet
– Achieve target metrics by end of 2018
• Deliver premium cash flow & dividend growth
– 10% ACFFO and dividend CAGR through 2020
• Extend growth beyond 2020
– Disciplined capital allocation
• Streamline the business
– Effective sponsored vehicles
– Top quartile cost performance
2
Enbridge Investor Day 49

Q&A
New York City & TorontoDecember 12 – 13, 2017
Enbridge Investor Days
Enbridge Investor Day 50

Enbridge Investor [email protected]: 1-800-481-2804
Enbridge Inc. 200, 425 - 1st Street S.W. Calgary, Alberta, Canada T2P 3L8www.enbridge.com