Embed Size (px)
Citation preview
1
2017 UTAH HIGHWAY SAFETY PROBLEM IDENTIFICATION
Each year, the Utah Department of Public Safety’s Highway Safety Office is tasked with developing
a Highway Safety Plan (HSP) that is reviewed and approved by our federal partners, the National
Highway Traffic Safety Administration (NHTSA). The HSP is a performance-based and data-driven
plan that outlines how federal funds, allocated to the state, will be used to support programs
designed to reduce traffic crashes and the resulting deaths and injuries.
Data-driven problem identification is the first step in completing the HSP. This document provides
crash data used to identify Utah’s traffic safety problems and includes data that supports the
following program areas: drowsy driving, impaired driving, occupant protection, older drivers,
police traffic services, teen drivers, traffic records, and vulnerable roadway users.
This document was developed to assist grant applicants as they prepare their grant proposal. In
addition, grant applicants are encouraged to include local data that may be available.
Grant applications that support a data-driven traffic safety problem will be considered for
funding.
1. DROWSY DRIVING PROGRAM
Drowsy driving has much the same effects on driving as driving under the influence of alcohol or
drugs. Driving while tired decreases awareness, slows reaction time and impairs judgement,
putting the driver and others around them in danger. As a result of the similarities in driver
behavior, the drowsy driving program was placed within the Impaired Driving Program.
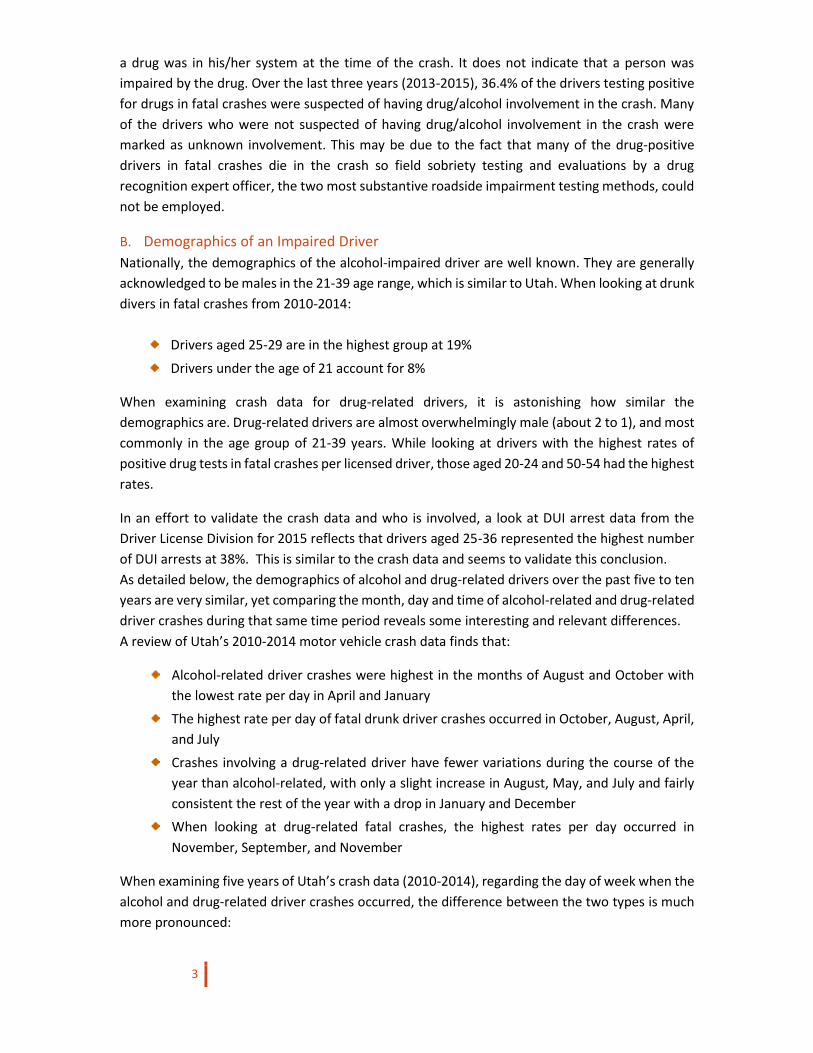
After several years of declining traffic fatalities in Utah, overall fatalities have increased over the
past two years. In 2013 there were 220 deaths; 2014 saw 256; and 2015 had 276. The number of
drowsy driving related fatalities decreased from 14 in 2013 to 6 in 2014 then increased in 2015 to
15. Fatal drowsy driver-related crashes have fluctuated around the ten-year average (2006-2015)
of 6.1% of all Utah fatal crashes. While these numbers are significant, they may not show the true
size of the problem, since the identification of drowsiness or fatigue and its role in the crash by
law enforcement can be very difficult.
Utah crash data for a three-year period (2012-2014) was examined and showed that drowsy
driving-related crashes are:
Highest among drivers aged 15-29 years (53.5% of drowsy drivers)
More common among males (71.9% of drowsy drivers), who are 2.0 times more likely to
be drowsy in a crash than female drivers

2
Highest on Friday, Saturday, and Sunday
More frequent during the months of May through October
Highest during the early morning hours from 5:00 a.m. - 8:59 a.m. and then again in the
afternoon from 2:00 p.m. - 5:59 p.m.
Rural crashes were 2.7 times more likely to involve a drowsy driver than urban crashes.
The counties of Grand, Emery, Millard, and Juab, had the highest percentage of crashes
involving drowsy drivers. In fact, these four counties had over 7.5% of drowsy-driving
related crashes compared to the statewide average of 1.9%.
2. DRUNK/DRUGGED DRIVING PROGRAM
Motor vehicle crashes involving an impaired driver continue to occur in Utah, often resulting in
fatalities and injuries to the impaired driver, their passengers, and other motor vehicle occupants.
On average, 32 people die each year in Utah from crashes involving an impaired driver.
Unfortunately, alcohol-impaired driver fatal crashes almost doubled from 2013 to 2014.
In reviewing five years of Utah crash data (2010-2014), crashes involving an alcohol-impaired
driver are 4.2 times more likely to result in a fatality than crashes not involving an alcohol-related
driver. While only 3.4% of Utah’s traffic crashes in 2010-2014 involved an alcohol-related driver,
they accounted for almost 13% or 136 of the fatal crashes during that same period.
Interestingly, the drunk driver is most often the one killed in fatal traffic crashes involving an
alcohol-impaired driver. From 2010 to 2014, the drunk driver accounted for 95, or 63%, of the
152 deaths involving an impaired driver. During that same period; passengers in the drunk driver’s
vehicle accounted for 25, or 16%; occupants (drivers and passengers) of another vehicle
represented 22 , or 14%; and nonoccupants numbered 10, or 7%.
A. Drugged Driving
Impairment from alcohol is not the only concerning trend in Utah. The number of crashes
involving drug-positive drivers, whether impaired from prescription or illicit drugs, continue to
increase. On average, 34 people die each year in Utah in crashes where the driver tested positive
for drugs. A drug-positive driver was involved in nearly one-fifth (17.9%) of the traffic deaths in
2010-2014. Whereas, in 2006 there were 31 motor vehicle deaths involving a drug-positive driver;
ten years later, in 2015, there were 71 deaths. The test results from Utah fatal crashes 2006-2015
show that marijuana is by far the most common drug that drivers are testing positive for in fatal
crashes. Out of the 322 drug-positive driver test results in fatal crashes, 121 tested positive for
marijuana/THC; methamphetamine is a clear second place with 72 positive test results.
The challenge with drug-positive drivers is determining whether the person was impaired, as
there isn’t a national standard for impairment, such as the 0.08 level for alcohol impairment. Drug
test data provides information about drug presence, rather than whether the driver was impaired
by a drug at the time of the crash. Data identifying a driver as “drug-positive” indicates only that
3
a drug was in his/her system at the time of the crash. It does not indicate that a person was
impaired by the drug. Over the last three years (2013-2015), 36.4% of the drivers testing positive
for drugs in fatal crashes were suspected of having drug/alcohol involvement in the crash. Many
of the drivers who were not suspected of having drug/alcohol involvement in the crash were
marked as unknown involvement. This may be due to the fact that many of the drug-positive
drivers in fatal crashes die in the crash so field sobriety testing and evaluations by a drug
recognition expert officer, the two most substantive roadside impairment testing methods, could
not be employed.
B. Demographics of an Impaired Driver
Nationally, the demographics of the alcohol-impaired driver are well known. They are generally
acknowledged to be males in the 21-39 age range, which is similar to Utah. When looking at drunk
divers in fatal crashes from 2010-2014:
Drivers aged 25-29 are in the highest group at 19%
Drivers under the age of 21 account for 8%
When examining crash data for drug-related drivers, it is astonishing how similar the
demographics are. Drug-related drivers are almost overwhelmingly male (about 2 to 1), and most
commonly in the age group of 21-39 years. While looking at drivers with the highest rates of
positive drug tests in fatal crashes per licensed driver, those aged 20-24 and 50-54 had the highest
rates.
In an effort to validate the crash data and who is involved, a look at DUI arrest data from the
Driver License Division for 2015 reflects that drivers aged 25-36 represented the highest number
of DUI arrests at 38%. This is similar to the crash data and seems to validate this conclusion.
As detailed below, the demographics of alcohol and drug-related drivers over the past five to ten
years are very similar, yet comparing the month, day and time of alcohol-related and drug-related
driver crashes during that same time period reveals some interesting and relevant differences.
A review of Utah’s 2010-2014 motor vehicle crash data finds that:
Alcohol-related driver crashes were highest in the months of August and October with
the lowest rate per day in April and January
The highest rate per day of fatal drunk driver crashes occurred in October, August, April,
and July
Crashes involving a drug-related driver have fewer variations during the course of the
year than alcohol-related, with only a slight increase in August, May, and July and fairly
consistent the rest of the year with a drop in January and December
When looking at drug-related fatal crashes, the highest rates per day occurred in
November, September, and November
When examining five years of Utah’s crash data (2010-2014), regarding the day of week when the
alcohol and drug-related driver crashes occurred, the difference between the two types is much
more pronounced:
4
Alcohol-related driver crashes are highest on Saturdays and Sundays and lowest on
Mondays and Tuesdays.
Drug-related driver crashes peak on Fridays and are the lowest on Sundays with the
remaining days being quite similar.
The difference between alcohol and drugs seem to indicate a significant number of people
consume alcohol on a recreational basis (weekends), while drugs are used on an ongoing
basis.
The time of day when alcohol versus drug-related driver crashes occurred is quite different. When
looking at ten years of crash data (2005-2014):
Alcohol-related driver crashes increase in the evening and early morning hours between
4:00 p.m. to 2:59 a.m., peaking around 1:00 a.m.
Fatal crashes involving a drunk driver had the highest numbers between 7:00 p.m. to 2:50
a.m., with the same peak around 1:00 a.m.
Drug-related crashes peaked in the afternoon and evening hours between 1:00 p.m. to
10:00 p.m. with a notable decrease from 10:00 p.m. thru the morning hours.
Interesting to note that alcohol-related driver crashes peak at night and are lowest around
mid-day, while drug-related driver crashes peak in the afternoon and are lowest during
the nighttime hours.
Diverse groups have also been identified as a focus for impaired driving programs with a focus on
Hispanics and Latinos, which are the state’s largest minority group, making up 13.5% of Utah’s
population. In examining BAC of Hispanic drivers killed in motor vehicle crashes in Utah from
2007-2014, 21 of 110 drivers killed or 19.1% tested with a BAC of .08 and above. Among Hispanic
drivers killed in motor vehicle crashes and tested for alcohol, 21 of the 69 or 30.4% tested with a
BAC of .08 and above. This is slightly higher than the non-Hispanic population where 13.0% of all
non-Hispanic drivers killed tested with a BAC of .08 and above, and 25.2% of non-Hispanic drivers
killed and tested had a BAC of .08 and above.
When examining where impaired driving crashes most often occur, it was determined that
drunk/drugged driving is a statewide problem, most commonly occurring, and somewhat
proportionally, in relation to the population density within the area. It is no surprise that impaired-
driving crashes most often occur in the more urban areas, such as Northern Utah which includes
the urbanized Wasatch Front that houses 75% of the state’s population. Crash data over a five-
year period (2010-2014) involving an alcohol-related or drug-related driver shows that:
One-third (32%) of fatal drug positive driver crashes occurred in Salt Lake County with
Utah, Weber, and Tooele Counties the next highest.
Over one-fourth (27%) of fatal drunk driver crashes occurred in Salt Lake County with
Duchesne, Utah, and Davis Counties the next highest.
Nearly one-half (48%) of alcohol-related crashes occurred in Salt Lake County. Utah,
Weber, and Davis Counties were the next highest.
5
Duchesne, Uintah, Salt Lake, Daggett, Weber, and Summit Counties were highest for
alcohol-related crashes when ranked by rate per 100 million VMT
39% of drug-related crashes occurred in Salt Lake County. Utah, Davis, and Weber
Counties were the next highest.
Weber, Salt Lake, Tooele, Utah, Duchesne, and Sevier Counties were highest for drug-
related crashes when ranked by rate per 100 million VMT.
C. Challenges and Solutions
One of the challenges the state impaired driving program faces is the decrease of DUI arrests. In
examining five years (2011-2015) of DUI arrest records, including per se (alcohol and/or drug),
refusal, not-a-drop, CDL 0.04 and metabolite arrests, the number has shown a marked downward
trend with a 29% reduction in just 5 years. This reduction in arrests is greater than the downward
trend in alcohol or drug-related fatal and injury crashes. Impromptu inquiries to law enforcement
agencies have returned information which suggests that officers are less interested in working
DUI overtime enforcement shifts because of the increasingly aggressive and intimidating tactics
of defense attorneys, often resulting in a dismissal by the court.
Another challenge is that people continue to drink and use drugs for various reasons, and many
decide to drive. Numerous studies reveal that very few people set out to drive while impaired by
alcohol or drugs, and most are aware of the consequences of being stopped by law enforcement.
They also acknowledge the hugely increased risk of causing a fatal or serious injury crash if they
drive while impaired. Unfortunately, impaired driving is most often the result of a long chain of
decisions made by the person, both before and after consuming alcohol or taking drugs. The
decision about drinking or drug use, and the parallel decision whether to drive or make alternate
arrangements, is the sequence which brings the two acts together in place and time. When you
consider that almost three-fourths or 73.0% of the drunk drivers in fatal crashes who tested over
the legal limit for alcohol had BAC levels at or above twice the legal limit of 0.08., if the decision
to not drive wasn’t made long before the impairment, and appropriate arrangements made, then
impaired driving is almost a certainty.
There are several reasons people drink: peer pressure, stress, to feel good, but the biggest factor
is social. "Ninety percent of all drunk driving happens after drinking with family, friends, or
coworkers," Allen Porter, President of DrinkingandDriving.Org said. "Drunk driving does not just
happen when men or women leave bars or parties. It happens after holiday gatherings,
restaurants, work functions, cookouts and picnics, everywhere people get together." He also said
that people drive when they have been drinking because they have not been confronted. When
they are not challenged, the person who is drunk gets behind the steering wheel.
Another reason for drinking and driving is that the person feels like the chances of being caught
are very small. The average drunk driver has driven drunk 80 times before first arrest, always
believing they will not be caught or cause a crash.
6
D. Conclusion
Even though Utah has one of the lowest rates of DUI fatal crashes in the nation, impaired driving
remains a persistent problem. People ages 21-39, with a majority being male, continue to make
the decision to drive after drinking or taking impairing drugs, with the frequency of fatal and injury
crashes being mostly proportional to the density of population living in the area or region. In
addition, drivers younger than age 21 and Hispanic populations are also identified as high risk. An
average of 10% of drunk drivers in fatal crashes are under age 21. The Hispanic population is 1.3
times more likely to have a BAC of .08 and above than non-Hispanic drivers who are killed in motor
vehicle crashes were the driver was tested for alcohol.
To combat this traffic safety concern, the Impaired Driving Program will:
Continue to focus on reaching drivers, ages 21-39, with the message to not drive after
drinking.
Continue to educate drivers under the age of 21 about the zero tolerance laws and
dangers of driving impaired.
Continue high-visibility enforcement, using a combination of checkpoints and blitzes, as a
companion to the media efforts.
Continue to advocate social norming to engage the community, family, friends and co-
workers in confronting or challenging a person who has been drinking or taking impairing
drugs and intends to drive.
Continue to promote designated drivers or alternate transportation methods.
Focus the majority of enforcement resources in areas with high numbers of fatal and
injury crashes.
Continue to promote officer, prosecutor and judge training on the importance and
methods to remove the impaired driver from Utah’s roadways.
3. OCCUPANT PROTECTION PROGRAM
According to the 2014 Utah Crash Summary, 97% of persons who survived a crash reported being
restrained compared to half of the persons killed. To reinforce the importance of buckling up,
unrestrained crash occupants were 37 times more likely to be killed than restrained crash
occupants. In order to dissect and fully understand the state’s occupant protection issues, the
Utah Highway Safety Office (UHSO) has chosen to use a five-year average, using data from 2010
to 2014, unless otherwise noted.
Wearing a seat belt is one of the best ways to decrease injuries and deaths in motor vehicle
crashes. With the passage of a primary seat belt law in 2015, Utah’s seat belt usage rate increased
3.8 percentage points reporting 87.2 percent; falling in line with the national average. This
equates to about 377,000 drivers and passengers on Utah’s roads who continue to ride unbuckled.
With the passage of a primary seat belt law during the 2015 legislative session, a goal of achieving
a 10 percent increase in seat belt use by 2016 was established. The state is hopeful in reaching
7
this goal; however, effective countermeasures must be supported to reach those motorists who
continue to ride unbuckled.
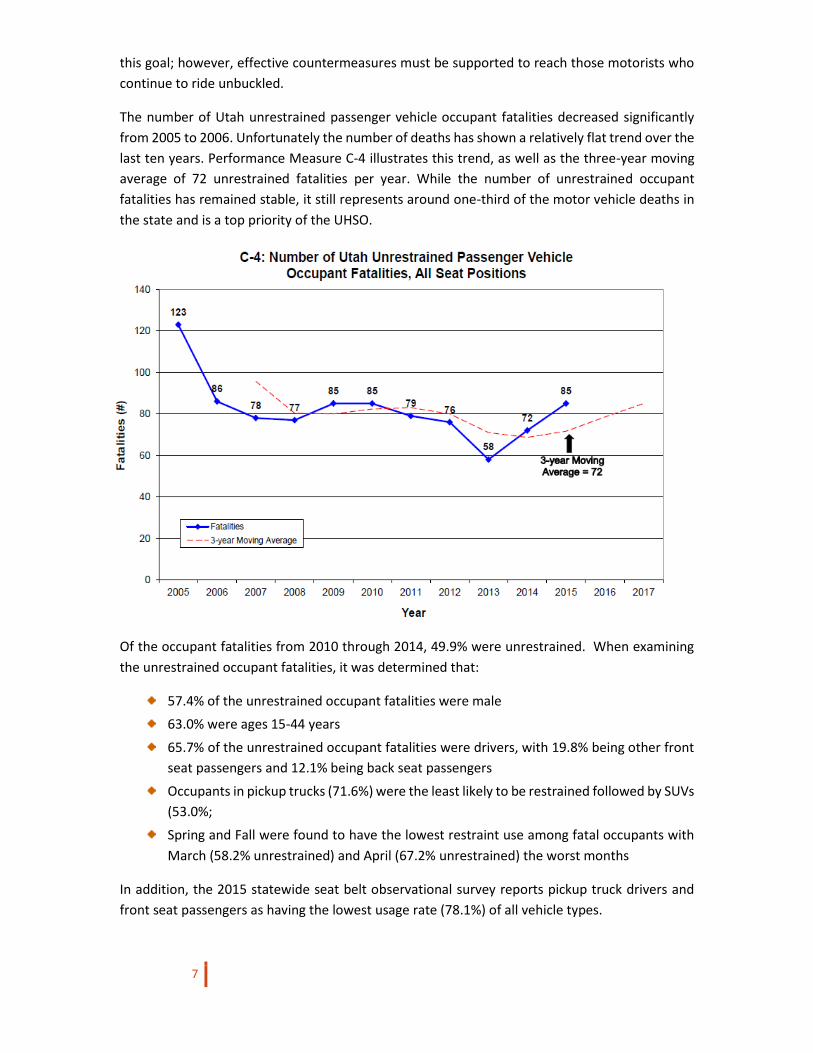
The number of Utah unrestrained passenger vehicle occupant fatalities decreased significantly
from 2005 to 2006. Unfortunately the number of deaths has shown a relatively flat trend over the
last ten years. Performance Measure C-4 illustrates this trend, as well as the three-year moving
average of 72 unrestrained fatalities per year. While the number of unrestrained occupant
fatalities has remained stable, it still represents around one-third of the motor vehicle deaths in
the state and is a top priority of the UHSO.
Of the occupant fatalities from 2010 through 2014, 49.9% were unrestrained. When examining
the unrestrained occupant fatalities, it was determined that:
57.4% of the unrestrained occupant fatalities were male
63.0% were ages 15-44 years
65.7% of the unrestrained occupant fatalities were drivers, with 19.8% being other front
seat passengers and 12.1% being back seat passengers
Occupants in pickup trucks (71.6%) were the least likely to be restrained followed by SUVs
(53.0%;
Spring and Fall were found to have the lowest restraint use among fatal occupants with
March (58.2% unrestrained) and April (67.2% unrestrained) the worst months
In addition, the 2015 statewide seat belt observational survey reports pickup truck drivers and
front seat passengers as having the lowest usage rate (78.1%) of all vehicle types.

8
Of Utah’s 29 counties, 6 are considered urban, contributing to 85% of the state’s population and
23 are rural. When examining the differences between urban and rural counties using crash data
from 2010 to 2014, it was determined that:
More than half (56.6%) of the unbuckled fatalities occur in rural counties
Urban counties, which include Cache, Davis, Salt Lake, Utah, Washington and Weber,
contribute to 43.4% of occupant fatalities
64.1% of all occupant deaths in rural counties were unrestrained compared to 49.2% in
urban counties
In addition, according to the 2015 seat belt observational study, 80.1% of rural motorists
wear seat belts compared to 89.6% in urban counties
When determining funding priorities, counties with sparse populations below 7,500 residents and
counties that are not included in the NHTSA-approved annual seat belt observational survey were
not considered a priority. The 10 low-priority counties include, Beaver, Daggett, Duchesne,
Emery, Garfield, Juab, Kane, Piute, Rich, and Wayne. These counties contribute to 15% of the
total number of occupant fatalities.
When examining the remaining 13 rural counties, nine were identified as having a high percentage
of unrestrained occupant fatalities that was above the state average of 50%. These counties
include Box Elder, Carbon, Grand, Millard, Morgan, Sanpete, Summit, Tooele, and Uintah.
When examining diverse populations, Hispanics and Latinos were found to have the highest
unrestrained fatality rates among all minority groups. This is mainly due to the fact that they are
the largest ethnic minority group making up approximately 13.3% of the state’s population.
Approximately 78% of the state’s Hispanic population lives in three urban counties including Salt
Lake, Weber and Utah. In addition, 56% of the traffic fatalities involving this population occur in
these areas. More Hispanic motorists are being killed in crashes than in the past. Over a five year
period from 2010 to 2014, 61% of Hispanic occupants were unrestrained compared to 48% of
non-Hispanic occupants. Similar to state and national trends, young males continue to be higher
risk for being killed in a traffic crash. Hispanic motorists ages 15-19 and 20-24 had the highest
number of deaths and more than two-thirds were male.
Child passengers have also been identified as a high risk population. Despite Utah having a law
that requires child passengers to ride in appropriate safety restraints to age 8, as children grow
they are less likely to be restrained, leaving them at risk for death or serious injury. Among child
occupants in crashes over the last five years, 85.9% of children ages 0-1 years were restrained in
a child safety seat compared to 82.5% of children ages 2-4 years and 41.0% of children ages 5-8
years.
When examining the time period when occupant fatalities occur, it was determined that 71.6% of
the unrestrained fatalities occur during daytime hours of 6:00 a.m. and 9:59 p.m. However, when
examining restraint use in fatal crashes by the time of day, restraint use is lowest during nighttime
hours. Between the hours of 10:00 p.m. and 5:59 a.m., 66.0% of fatal occupants were
unrestrained, which is markedly higher than the daytime unrestrained fatality rate of 45.5%. In
9
addition, restraint use is lowest between midnight and 3:59 a.m. with 71.6% of occupants killed
being unbuckled. Urban counties also contribute to more than 90% of the nighttime occupant
fatalities. Cities with the highest number of unrestrained fatalities include Salt Lake City and West
Valley City, which are located in Salt Lake County, and Ogden in Weber County.
4. OLDER DRIVER PROGRAM
Analyzing the last three years of crash data (2012-2014) involving older drivers shows that:
Older drivers were involved in 20,258 motor vehicle crashes which resulted in 9,907
injured persons and 129 deaths;
Although older drivers have the lowest crash rates of any drivers, the percent of crashes
involving an older driver has been increasing for over a decade;
Salt Lake and Utah Counties have the highest amount of older driver crashes while
Washington County has the highest percent of crashes involving an older driver;
Weekdays had the highest number of crashes involving an older driver;
Compared with drivers of other ages in crashes, older driver crashes were more likely to
occur during the daytime hours of 10:00 a.m. to 4:59 p.m. and less likely to occur at
night;
Older drivers had a contributing factor in a crash at about the same rate as drivers of
other ages;
The leading contributing factors for older drivers in crashes were failed to yield right of
way, followed too closely, and failed to keep in proper lane.
5. POLICE TRAFFIC SERVICES PROGRAM
The Police Traffic Services Program focuses much of its resources on traffic safety issues that are
not supported through the Occupant Protection and Impaired Driving Programs and their
associated funding streams. This includes projects aimed at decreasing distracted, aggressive,
and speed-related crashes.
A. Speeding
A review of the 2012-2014 speed-related crash data indicates the following:
Speed is the number one factor in traffic deaths and number three in crashes
There were 258 speed-related fatal crashes with 289 fatalities
Drivers in fatal and non-fatal crashes where speeding is a factor are overwhelmingly male
Younger drivers, ages 15 to 34, have the highest total number of speed crashes
July, October, and November were the deadliest months for speed-related fatal crashes
For overall speed-related crashes (fatal and non-fatal) January and December had the
highest rates of crashes

10
Saturday holds the highest number of speed-related fatal crashes at 23.0%, with Thursday
following at 15.6%
Urban areas had a lower rate of speeding-related fatal crashes as compared to rural areas
Urban areas had a higher rate per vehicle miles traveled for speed-related non-fatal
crashes as compared to rural areas
The counties with the highest number of total speed-related crashes over the last three
years were: Salt Lake, Utah, Davis, Weber, and Cache Counties
The counties with the highest percent of total crashes that were speed-related over the
last three years were: Morgan, Millard, Beaver, Rich, and Sevier Counties
The counties with the highest number of fatal speed-related crashes over the last three
years were: Salt Lake, Utah, Davis, Weber, Washington, and Tooele Counties
The counties with the highest percent of fatal crashes that were speed-related over the
last three years were: Rich, Uintah, Davis, Utah, Summit, Morgan, and Daggett Counties
B. Distracted Driving
A review of the 2012-2014 distracted driver crash data indicates the following:
There were 53 distracted driver fatal crashes with 59 fatalities
Drivers ages 15 to 24 had the highest distracted driving overall crash rates per licensed
drivers
Males were drivers in 56.2% of the distracted-related crashes
Distracted driver crashes occur more often on Wednesday and Friday, however the
highest percentage of fatal distracted driver crashes occurred on Monday and Friday
Distracted driver total crashes were highest from 12:00 p.m. to 6:59 p.m.
Salt Lake County had the most distracted driver crashes accounting for 44.5% of the
distracted driver crashes in the state
Distracted driver crashes composed 12.5% (6,060) of the total for injury crashes and 8.5%
(53) of fatal crashes
The counties with the highest number of total distracted driver crashes over the last three
years were: Salt Lake, Utah, Davis, Weber, and Washington Counties
The counties with the highest percent of total crashes that involved a distracted driver
over the last three years were: Grand, Cache, Washington, Carbon, and Utah Counties
The counties with the highest number of fatal distracted driver crashes over the last three
years were: Salt Lake, Utah, Weber, Washington, and Davis Counties
The counties with the highest percent of fatal crashes that involved a distracted driver
over the last three years were: Beaver, Carbon, Wasatch, Box Elder, and Utah Counties
Due to the challenge law enforcement agencies experience with identifying distraction and its
role in a crash, crash statistics may not fully capture the significance and extent of the problem.
When the crash data and potential for under-reporting is examined with behavioral surveys on
driving behavior in mind, the need to address distracted driving becomes even more critical.
11
According to a 2011 study led by the Centers for Disease Control and Prevention, 69% of drivers
ages 18 to 64 years old reported that they had talked on their cell phone while driving within the
30 days before they were surveyed. Additionally, a quarter of teens respond to a text message
once or more every time they drive. Alarmingly, 20 percent of teens and 10 percent of parents
admit that they have extended, multi-message text conversations while driving.
C. Aggressive Driving
A review of the 2012-2014 aggressive driver crash data indicates the following:
There were 35 drivers in fatal crashes that were aggressive or reckless
There were 1,835 drivers in total crashes that were aggressive or reckless
Aggressive/reckless driving was the 23rd highest contributing factor in crashes
6. TEEN DRIVING PROGRAM
Teen drivers (ages 15-19 years) are a special concern in Utah, as they are over-represented in
crashes. Over the last three years (2012-2014) they accounted for only 8.6% of licensed drivers
but were involved in 19.8% of all motor vehicle crashes and 12.8% of fatal crashes. Teenage
drivers are a special concern because of their high crash rates and lack of driving experience. Teen
crash risk is impacted by developmental and behavioral issues coupled with inexperience. In a
recent article from the Governor’s Highway Safety Association (GHSA), most crashes occur
because the novice behind the wheel doesn’t have the skills or experience needed to recognize a
hazard and take corrective action.
The 10-year trend shows that 22.1% of all crashes in Utah involved a teenage driver with a
decreasing trend over the last 10 years. Fatal teenage driver crashes have also shown a decreasing
trend although less dramatic than total crashes. Though the trend is decreasing, the number of
teenage crashes compared to other ages is significantly disproportionate, thus it is a priority of
the Utah Highway Safety Office (UHSO). In the past 5 years (2010-2014) over half (57.9% or 55 out
of 95) of all teen occupants killed in motor vehicle crashes were not restrained.
When examining the age and gender of young drivers involved in crashes in 2012-2014, it was
determined that:
Drivers aged 17 and 18 years had the highest total crash rate per licensed driver
Drivers aged 16 and 18 years had the highest fatal crash rate per licensed driver
Slightly more teen drivers in all motor vehicle crashes were male
When examining when and where crashes involving young drivers occur in 2012-2014, it was
determined that:
Teenage-driver crashes peak during after-school hours (2:00pm-6:59pm)
12
Teenage driver crashes were more likely to occur in the afternoon and evening than
other crashes
December, October, and September had the highest rates per day for teenage driver
crashes
Cache, Washington, Davis, Utah, and Sanpete counties had the highest percentages
of crashes involving a teenage driver
When examining the causes of young driver-related crashes in 2012-2014, it was determined that:
Teens are more likely than older drivers to speed and allow shorter headways (the
distance from the front of one vehicle to the front of the next)
The presence of male teenage passengers increases the likelihood of this risky driving
behavior
Teens are more likely than older drivers to underestimate dangerous situations or not be
able to recognize hazardous situations
The leading contributing factors for all teenage driver crashes were followed too closely,
failed to yield right of way, speed too fast, and driver distraction
The leading contributing factors in fatal teenage driver crashes were speed too fast and
failed to keep in proper lane
Compared to drivers of all ages, teenage drivers were more likely to have a contributing
factor of failure to yield right of way, followed too closely, and driver distraction
Overall, most teen drivers and their passengers were restrained (96.7%)
However only 46.0% of occupants killed in teenage driven vehicles were restrained
Utah teens are just like other teens in the country: novice drivers involved in more than their fair
share of crashes. It’s no surprise that motor vehicle crashes are the leading cause of teen deaths.
Driver education classes can only take teens so far. After they get their driver license, the only
way to get an education about safe driving is through trial and error on the roads.
7. TRAFFIC RECORDS PROGRAM
Traffic records are the backbone for problem identification in all of the various traffic safety areas.
Data is what drives the ability to identify trends, recognize emerging problem areas, and to
measure the success of previous efforts. While Utah has made great strides in the timeliness and
completeness of most traffic records, the performance attributes of accuracy, integration, and
accessibility could use improvement.
Utah completed a transition to all-electronic crash reporting in mid-2013, but subsequent crash
data reviews have shown that the accuracy level of the reports is lower than desired. The ability
to use innovative tools to analyze and distribute accuracy information to stakeholder and data-
user agencies is limited.

13
Performance measures for accuracy, completeness and timeliness are either not in place or
ineffective in some traffic record systems. The emphasis in the crash records and injury
surveillance systems over the past several years has been to transition to an all-electronic
reporting or access system. U-13 shows how effective the crash record transition has been as the
average number of days between submission and occurrence for Utah motor vehicle crashes has
reduced from 139.91 days in 2011 to 8.06 days in 2014. There has not been as much emphasis on
setting system performance measures due to the limited resources.
Utah’s traffic records systems do not integrate with one another at a level to be efficient or
effective. While Roadway may integrate many of the crash data features, the effectiveness of this
integration is only felt at the roadway system level. The same can be said for several of the injury
surveillance systems. Emergency Room and Hospital Data may integrate with the Pre-hospital
Data, but that integration remains at the Injury Surveillance level only and is not timely. An
effective traffic records system would have data integration opportunities that cross data
systems. For example, roadway data integrating with crash data and then with injury surveillance
data.
8. VULNERABLE ROADWAY USERS PROGRAMS
The Vulnerable Roadway Users Program was created to house all programs associated with those
using our public roadways that are the most exposed in terms of crash scenarios. These programs
include bicyclists, pedestrians, motorcycles and older drivers.
A. Bicycle Safety
The rising popularity of using bicycles for recreation, exercise and as an alternate or active means
of commuting to work has increased the number of bicycles on Utah roadways. The number of
fatalities resulting from a bicycle-motor vehicle crash has remained relatively low.
139.12 139.91
85.47
45.70
8.06
0
25
50
75
100
125
150
2010 2011 2012 2013 2014 2015 2016
Ave
rage
Nu
mb
er
of D
ays
U-13: Average Number of Days Between Submission and Occurrence for Utah Motor Vehicle Crashes
Average…

14
The rising popularity of using bicycles for recreation, exercise
and as an alternate or active means of commuting to work has
increased the number of bicycles on Utah roadways. The
number of fatalities resulting from a bicycle-motor vehicle
crash has remained relatively low. Analysis of the bicycle-
related crash data over a three-year period (2012-2014) has
shown that:
There were 2,443 bicyclists in a reportable motor
vehicle crash. Of these 2211 were injured, 215 were
not injured, and 17 were killed
57% of the crashes involved bicyclists under the age
of 30 years
79% of the bicyclists involved in crashes were male
54% of the motor vehicle drivers were under the age of 40 years
53% of the motor vehicle drivers were male
Crashes occurred more frequently May through October, likely due to weather conditions
Crashes are more frequent during the weekdays (Monday through Friday)
Crashes peak between 3:00 pm and 6:00 pm
94% of crashes occur in the six most populated counties (Salt Lake, Utah, Weber, Davis,
Cache, and Washington)
93% of crashes occur on roads with speed limits between 20-45 mph
30% of all bicycle-motor vehicle crashes occurred in a marked crosswalk
Further analysis showed that the most common contributing factors in bicycle-motor vehicle
crashes are:
failure to yield the right of way by the motor vehicle driver (39%)
motor vehicle was turning (56%)
Bicyclist was on the wrong side of the road (12%)
B. Pedestrian Safety
Everyday, Utahns choose whether they want to drive a motor vehicle, be a motor vehicle
occupant, ride a motorcycle, or a bicycle, yet almost all of us are a pedestrian for much of every
day. While Utah’s overall traffic fatalities have followed the national upward trend with a 25%
increase from 2013 to 2015, during this same time period pedestrian fatalities have outpaced this
trend with an increase of 60%. Analysis of three years of pedestrian-related crash data (2012-
2014) has shown that:
2,828 pedestrians were hit by motor vehicles with 98 pedestrians killed
38% of the pedestrians in crashes are between the ages of 10-24
Fatal1%
Injury90%
No Injury
9%
Bicyclists Involved in a Motor Vehicle Crash
15
The majority of pedestrians hit were male while the majority of drivers involved in
pedestrian crashes were male
55% of the drivers involved in pedestrian-related crashes are between the ages of 15-39
Crashes occur more frequently in March, September, October, November and December
Crashes peak between 2:00 pm and 7:00 pm
Majority of the crashes occur in the urban counties (Salt Lake, Utah, Davis and Weber)
23% of pedestrians killed had a BAC of 0.08 or over (2013-2015)
Both drivers and pedestrians share a responsibility in preventing pedestrian fatalities. The leading
contributing factors for pedestrians in fatalities are failing to yield and improper crossing. The
leading contributing factors for drivers in pedestrian fatalities are failing to yield and speed.
C. Motorcycle Safety
Motorcyclists are much more vulnerable than other motorists and consequences of crashes are
frequently much more severe for motorcyclists. The number of registered motorcycles in Utah
increased from 43,271 in 2005 to 75,593 in 2014. Although motorcycles account for only 3% of
Utah’s registered vehicles, motorcyclists accounted for 18% of Utah’s traffic-related fatalities in
2014. Motorcyclist fatalities reached an all-time high of 45 in 2014.
Utah does not have a universal helmet law and statewide-observed usage is only 65%. Wearing
helmets that meet the Department of Transportation (DOT) standard is the single most effective
means of reducing the number of people who get injured or die from motorcycle crashes,
according to NHTSA. When examining helment use in motorcycle-related crashes, several data
resources showed that:
60% of motorcyclists involved in a traffic crash were wearing a helmet, according to all
crash data over a three-year period (2012-2014)
49% of motorcyclists killed were wearing a helmet, according to crash data (2012–2014)
65.9% of motorcyclists use helmets in 17 counties, as reflected in the Utah Observation
Helmet Use Survey (include what year and who conducted it)
Analysis of 2012-2014 crash data for motorcycle-related crashes has shown that:
3,848 motorcyclists were in crash and 108 motorcyclists were killed
The majority of motorcyclists involved in crashes were male
50% of motorcyclists in crashes were between the ages of 15-34 years
40% of motorcycle crashes involved the motorcycle only. Of these crashes, 79% of
motorcycle drivers had a contributing factor in the crash
60% of motorcycle crashes involve another motor vehicle. Of these 43% of motorcycle
drivers and 64% of drivers of the other vehicles had contributing factors
The leading contributing factor for motorcycle drivers in a crash were speed too fast,
failed to keep in proper lane, and followed too closely
The leading contributing factor for other drivers in motorcycle crashes were failed to
yield, followed to closely, and improper turn