Embed Size (px)
Citation preview
2017 THIRD QUARTER RESULTS
(1) CNH Industrial reports quarterly and annual consolidated financial results under U.S. GAAP and EU-IFRS. The tables and discussion related to the financial results of the Company and its segments shown in this press release are prepared in accordance with U.S. GAAP. Financial results under EU-IFRS are shown in specific tables at the end of this press release.
(2) This item is a non-GAAP financial measure. Refer to the “Non-GAAP Financial Information” section of this press release for information regarding non-GAAP financial measures.
(3) Refer to the specific table in the “Other Supplemental Financial Information” section of this press release for the reconciliation between the non-GAAP financial measure and the most comparable GAAP financial measure.
CNH Industrial N.V.
Corporate Office: 25 St. James’s Street London, SW1A 1HA United Kingdom
CNH Industrial 2017 third quarter revenues up 15.3% to $6.6 billion, net income at $57 million, with adjusted net income(2)(3) more than doubling to $148 million
or $0.11 per share. Net industrial debt(2)(3) at $2.6 billion Financial results presented under U.S. GAAP
(1)
Industrial Activities’ revenues up 16% (up 12% on a constant currency basis) led by solid
improvements in all segments
Operating profit(2)(3)
of Industrial Activities increased 41% to $351 million, with an operating
margin of 5.5%, with positive performance in Agricultural Equipment, Construction Equipment
and Powertrain
Adjusted net income increased to $148 million in the third quarter of 2017, with adjusted
diluted EPS(2)(3)
of $0.11
Net industrial debt was $2.6 billion at September 30, 2017, up $0.5 billion compared to June 30,
2017, due to the typical seasonal increase in net working capital
In the quarter, the Company repurchased a total of €800 million in principal amount of 6.250%
Notes due 2018 and 2.750% Notes due 2019 issued by CNH Industrial Finance Europe S.A., and
issued €650 million in principal amount of 1.750% Notes due 2025
Today the Company announced the early redemption of all of the outstanding $600 million in
principal amount of CNH Industrial Capital LLC 3⅞% Notes due July 2018
On October 24, Fitch Ratings initiated coverage of CNH Industrial N.V. and assigned its long-
term issuer default rating of “BBB-” with stable outlook; CNH Industrial securities will be eligible
for the main investment grade indices in the U.S. market
Full year guidance for Industrial Activities revenues increased to $25.0 to $25.5 billion and
Adjusted diluted EPS increased to $0.44 to $0.46; year-end net industrial debt increased to $1.5
to $1.7 billion as a result of the strengthening euro to the U.S. dollar
Summary of Results ($ million except EPS)
Nine Months Ended September 30, Three Months Ended September 30,
2017 2016 Change 2017 2016 Change
19,259 17,874 7.7% Revenues 6,630 5,749 15.3%
353 (345) 698 Net income (loss) 57 39 18
472 285 187 Adjusted net income 148 68 80
0.25 (0.25) 0.50 Basic EPS ($) 0.04 0.03 0.01
0.25 (0.25) 0.50 Diluted EPS ($) 0.04 0.03 0.01
0.34 0.21 0.13 Adjusted diluted EPS ($) 0.11 0.05 0.06
London (UK) – (October 31, 2017) CNH Industrial N.V. (NYSE:CNHI / MI:CNHI) today announced
consolidated revenues of $6,630 million for the third quarter of 2017, up 15.3% compared to the third quarter
of 2016. Net sales of Industrial Activities were $6,331 million in the third quarter of 2017, up 15.9%
2017 THIRD QUARTER RESULTS
(1) This item is a non-GAAP financial measure. Refer to the “Non-GAAP Financial Information” section of this press release for information regarding non-GAAP financial measures.
(2) Refer to the specific table in the “Other Supplemental Financial Information” section of this press release for the reconciliation between the non-GAAP financial measure and the most comparable GAAP financial measure.
2
compared to the third quarter of 2016. Net income was $57 million for the third quarter of 2017 and includes
$53 million of restructuring charges as part of the Company’s Efficiency Program. It also includes a charge of
$39 million related to the September 2017 repurchase of an aggregate nominal amount of €800 million of the
outstanding CNH Industrial Finance Europe S.A. Notes due 2018 and 2019. Adjusted net income was
$148 million for the third quarter compared to $68 million in the third quarter of 2016. Adjusted diluted EPS in
the third quarter was $0.11, up 120% compared to the third quarter of 2016.
Operating profit of Industrial Activities increased 41% to $351 million for the third quarter of 2017 compared to
the $248 million in the third quarter of 2016, with an operating margin of 5.5%, up 1.0 percentage points
(“p.p.”) compared to the third quarter of 2016.
Income taxes were $64 million in the third quarter of 2017 ($32 million in the third quarter of 2016). Adjusted
income taxes(1)(2)
for the third quarter of 2017 were $65 million ($47 million in the third quarter of 2016). The
adjusted effective tax rate (adjusted ETR)(1)(2)
was 34%, down from 46% in the third quarter of 2016, primarily
due to favorable changes in our jurisdictional profit mix.
Net industrial debt was $2.6 billion at September 30, 2017, up $0.5 billion compared to June 30, 2017, due to
the typical seasonal increase in net working capital. Total debt was $25.5 billion at September 30, 2017, in line
with June 30, 2017. At September 30, 2017, available liquidity(1)(2)
was $7.9 billion, down $0.4 billion
compared to June 30, 2017.
During the quarter, CNH Industrial Finance Europe S.A. issued €650 million in principal amount of 1.750%
Notes due 2025. In addition, CNH Industrial Finance Europe S.A. repurchased €347 million of its outstanding
€1.2 billion 6.250% Notes due 2018, and €453 million of its outstanding €1.0 billion 2.750% Notes due 2019.
The $39 million one-time charge related to the repurchase of the Notes will be offset by interest cost savings
achieved through the remaining original term of the notes. In addition, the Company announced today the
early redemption of all of the outstanding $600 million in principal amount of CNH Industrial Capital LLC 3⅞%
Notes due July 2018.
On October 24, 2017, Fitch Ratings assigned CNH Industrial N.V. and CNH Industrial Capital LLC long-term
issuer default ratings of “BBB-”. The outlook of both companies is stable. Fitch Ratings also assigned a short-
term issuer default rating to CNH Industrial Capital LLC of “F3”. This rating action follows the upgrade of
Standard and Poor’s, on June 15, 2017, of the long-term corporate rating of CNH Industrial N.V. and CNH
Industrial Capital LLC to “BBB-” with stable outlook. These two actions will make the Company’s securities
eligible for the main investment grade indices in the U.S. market.
2017 THIRD QUARTER RESULTS
3
Segment Results
Agricultural Equipment’s net sales increased 12.4% in the third quarter of 2017 compared to the third
quarter of 2016 (up 9.4% on a constant currency basis). Net sales increased in EMEA, primarily due to
improved volume for combines and low horsepower tractors and to favorable net price realization. Net sales
also increased in APAC, mainly in India, and in LATAM, mainly in Brazil and Argentina. Net sales in NAFTA
were flat, as stable row crop market conditions and improved tractor mix were offset by reduced market
demand for hay and forage products.
Operating profit was $208 million in the third quarter of 2017, a 34% increase over the $155 million in the third
quarter of 2016. Operating margin increased 1.2 p.p. to 7.8% as a result of the favorable volume and product
CNH INDUSTRIAL Revenues by Segment ($ million)
Nine Months Ended September 30, Three Months Ended September 30,
2017 2016 % change
% change excl. FX
(1)
2017 2016 % change
% change excl. FX
(1)
7,890 7,291 8.2 6.8 Agricultural Equipment 2,651 2,359 12.4 9.4
1,841 1,726 6.7 5.9 Construction Equipment 642 595 7.9 6.0
7,203 6,754 6.6 6.6 Commercial Vehicles 2,537 2,114 20.0 14.7
3,213 2,755 16.6 16.8 Powertrain 1,075 850 26.5 20.4
(1,777) (1,539) - - Eliminations and other (574) (457) - -
18,370 16,987 8.1 7.5 Total Industrial Activities 6,331 5,461 15.9 12.0
1,205 1,173 2.7 0.8 Financial Services 409 386 6.0 3.4
(316) (286) - - Eliminations and other (110) (98) - -
19,259 17,874 7.7 7.0 Total 6,630 5,749 15.3 11.5
(1) “Change excl. FX” or “constant currency” is a non-GAAP financial measure. Refer to the “Non-GAAP Financial Information” section of this press release
for information regarding non-GAAP financial measures.
CNH INDUSTRIAL Operating Profit (loss)
(1) by Segment ($ million)
Nine Months Ended September 30, Three Months Ended September 30,
2017 Profit
2016 Profit
$ change
2017 Margin
2016 Margin
2017 Profit
2016 Profit
$ change
2017 Margin
2016 Margin
670 546 124 8.5% 7.5% Agricultural Equipment 208 155 53 7.8% 6.6%
8 32 -24 0.4% 1.9% Construction Equipment 13 1 12 2.0% 0.2%
178 202 -24 2.5% 3.0% Commercial Vehicles 59 64 -5 2.3% 3.0%
260 171 89 8.1% 6.2% Powertrain 88 52 36 8.2% 6.1%
(65) (72) 7 - - Eliminations and other (17) (24) 7 - -
1,051 879 172 5.7% 5.2%
Total Industrial Activities 351 248 103 5.5% 4.5%
365 363 2 30.3% 30.9% Financial Services 120 114 6 29.3% 29.5%
(248) (244) -4 - - Eliminations and other (83) (84) 1 - -
1,168 998 170 6.1% 5.6% Total 388 278 110 5.9% 4.8%
(1) Operating profit of Industrial Activities (a non-GAAP financial measure) is defined as net sales less cost of goods sold, selling, general and administrative expenses, and research and development expenses. Operating profit of Financial Services (a non-GAAP financial measure) is defined as revenues less selling, general and administrative expenses, interest expense and certain other operating expenses.

2017 THIRD QUARTER RESULTS
4
mix, the positive net price realization more than offsetting raw material cost increases, and improved quality
costs, while the Company increased its investments in research and development.
Construction Equipment’s net sales increased 7.9% in the third quarter of 2017 compared to the third
quarter of 2016 (up 6.0% on a constant currency basis), driven by market growth in all regions, particularly in
light equipment in NAFTA and in APAC, where we have seen a sustained rebound in demand since last year.
The current worldwide order book is over 50% higher than the previous year.
Operating profit was $13 million in the third quarter of 2017, a $12 million increase compared to the third
quarter of 2016, with an operating margin of 2.0% (up 1.8 p.p. compared to the third quarter of 2016). The
increase was mainly driven by higher volumes and favorable product mix, as well as slightly positive price
realization.
Commercial Vehicles’ net sales increased 20.0% in the third quarter of 2017 compared to the third quarter of
2016 (up 14.7% on a constant currency basis). In EMEA, net sales increased as a result of price realization,
fleet-related sales of heavy tractor trucks and commercial vans, and timing of specialty vehicle deliveries. In
LATAM and APAC, net sales improved as a result of favorable industry trends in Argentina, Turkey, and
Australia.
Operating profit was $59 million for the third quarter of 2017 ($64 million in the third quarter of 2016), with an
operating margin of 2.3% (down 0.7 p.p. compared to the third quarter of 2016), and was affected by
unfavorable product and channel mix, more than offsetting the favorable volume impact, as well as increased
investments in research and development on new product programs. The price realization achieved was more
than offset by Euro 6 emissions content costs and the impact of the devaluation of the British pound. In
general, pricing conditions in the main European markets remained very competitive during the quarter.
At the end of the quarter, the Company initiated additional capacity realignments in its firefighting business as
part of the Efficiency Program. The Company recognized a total pre-tax restructuring charge of $47 million, of
which $14 million is non-cash charge, and will result in $18 million of total annual pre-tax savings which the
Company anticipates will be fully realized by 2019.
Powertrain’s net sales increased 26.5% in the third quarter of 2017 compared to the third quarter of 2016
(up 20.4% on a constant currency basis), due to higher sales volumes with both captive and external
customers. Sales to external customers accounted for 48% of total net sales, in line with the third quarter of
2016.
Operating profit was $88 million for the third quarter of 2017, a $36 million increase compared to the third
quarter of 2016 as a result of higher volume, favorable engine mix, and manufacturing efficiencies. Operating
margin increased 2.1 p.p. to 8.2%, the highest third quarter margin ever reported in the segment’s history,
reflecting the profitability of a well-balanced portfolio of engine applications.
Financial Services’ revenues totaled $409 million in the third quarter of 2017, an increase of 6.0% compared
to the third quarter of 2016 (up 3.4% on a constant currency basis), due to higher activity in LATAM and
APAC. Retail loan originations (including unconsolidated joint ventures) were $2.3 billion, flat compared to the
third quarter of 2016. The managed portfolio (including unconsolidated joint ventures) was $26.0 billion as of
September 30, 2017 (of which retail was 63% and wholesale 37%), up $1.2 billion compared to September 30,
2016 (up $0.5 billion on a constant currency basis).
2017 THIRD QUARTER RESULTS
(1) Outlook is not provided on diluted EPS, the most comparable GAAP financial measure of this non-GAAP financial measure, as the income or expense excluded from the calculation of adjusted diluted EPS and instead included in the calculation of diluted EPS are, by definition, not predictable and uncertain.
5
Net income was $86 million in the third quarter of 2017, an increase of $9 million compared to the third quarter
of 2016, primarily due to the higher activity in LATAM and APAC, lower provisions for credit losses, and the
positive impact of currency translation.
2017 Outlook
Market conditions across our major segments have been solid year-to-date, despite continued inventory
destocking efforts in high horsepower tractors in the NAFTA row crop market segment and weakened demand
in hay and forage products. The weakening of the U.S. dollar against most of our trading currencies,
especially the euro, has had a positive translation impact on our revenues. However, the strengthening of the
euro has had an unfavorable translation impact on the euro-denominated portion of our net industrial debt.
The exchange impacts on profit have been less significant due to balanced foreign currency positions between
revenue and costs. Therefore, the Company is increasing its 2017 guidance for sales and EPS, and is slightly
increasing the net industrial debt guidance as follows:
Net sales of Industrial Activities of $25.0 to $25.5 billion;
Adjusted diluted EPS(1)
of $0.44 to $0.46;
Net industrial debt at the end of 2017 at $1.5 to $1.7 billion.
2017 THIRD QUARTER RESULTS
6
About CNH Industrial
CNH Industrial N.V. (NYSE: CNHI /MI: CNHI) is a global leader in the capital goods sector with established industrial
experience, a wide range of products and a worldwide presence. Each of the individual brands belonging to the Company
is a major international force in its specific industrial sector: Case IH, New Holland Agriculture and Steyr for tractors and
agricultural machinery; Case and New Holland Construction for earth moving equipment; Iveco for commercial vehicles;
Iveco Bus and Heuliez Bus for buses and coaches; Iveco Astra for quarry and construction vehicles; Magirus for
firefighting vehicles; Iveco Defence Vehicles for defence and civil protection; and FPT Industrial for engines and
transmissions. More information can be found on the corporate website: www.cnhindustrial.com
Additional Information
Today, at 2:30 p.m. CET / 1:30 p.m. GMT / 9:30 a.m. EDT, management will hold a conference call to present 2017 third
quarter and first nine months results. The call can be followed live online at: http://bit.ly/CNH_Industrial_Q3_2017 and a
recording will be available later on the Company’s website (www.cnhindustrial.com). A presentation will be made available
on the CNH Industrial website prior to the conference call.
Non-GAAP Financial Information
CNH Industrial monitors its operations through the use of several non-GAAP financial measures. CNH Industrial’s
management believes that these non-GAAP financial measures provide useful and relevant information regarding its
results and allow management and investors to assess CNH Industrial’s operating trends, financial performance and
financial position. Management uses these non-GAAP measures to identify operational trends, as well as make decisions
regarding future spending, resource allocations and other operational decisions as they provide additional transparency
with respect to our core operations. These non-GAAP financial measures have no standardized meaning presented in
U.S. GAAP or EU-IFRS and are unlikely to be comparable to other similarly titled measures used by other companies due
to potential differences between the companies in calculations. As a result, the use of these non-GAAP measures has
limitations and they should not be considered as substitutes for measures of financial performance and financial position
as prepared in accordance with U.S. GAAP and/or EU-IFRS.
CNH Industrial non-GAAP financial measures are defined as follows:
Operating Profit under U.S. GAAP: Operating Profit of Industrial Activities is defined as net sales less cost of goods
sold, selling, general and administrative expenses, and research and development expenses. Operating Profit of
Financial Services is defined as revenues less selling, general and administrative expenses, interest expense and
certain other operating expenses.
Trading Profit under EU-IFRS: Trading Profit is derived from financial information prepared in accordance with EU-
IFRS and is defined as net revenues less cost of sales, selling, general and administrative costs, research and
development costs, and other operating income and expenses.
Operating Profit under EU-IFRS: Operating Profit under EU-IFRS is computed starting from Trading Profit under EU-
IFRS plus/minus restructuring costs, other income (expenses) that are unusual in the ordinary course of business
(such as gains and losses on the disposal of investments and other unusual items arising from infrequent external
events or market conditions).
Adjusted Net Income (Loss): is defined as net income (loss), less restructuring charges and non-recurring items, after
tax. In particular, non-recurring items are specifically disclosed items that management considers rare or discrete
events that are infrequent in nature and not reflective of on-going operational activities.
Adjusted Diluted EPS: is computed by dividing Adjusted Net Income (loss) attributable to CNH Industrial N.V. by a
weighted-average number of common shares outstanding during the period that takes into consideration potential
common shares outstanding deriving from the CNH Industrial share-based payment awards, when inclusion is not
anti-dilutive. When we provide guidance for adjusted diluted EPS, we do not provide guidance on an earnings per
2017 THIRD QUARTER RESULTS
7
share basis because the GAAP measure will include potentially significant items that have not yet occurred and are
difficult to predict with reasonable certainty prior to year-end.
Adjusted Income Taxes: is defined as income taxes less the tax effect of restructuring expenses and non-recurring
items and non-recurring tax charges.
Adjusted Effective Tax Rate (Adjusted ETR): is computed by dividing a) adjusted income taxes by b) income (loss)
before income taxes and equity in income of unconsolidated subsidiaries and affiliates, less restructuring expenses
and non-recurring items.
Net Debt and Net Debt of Industrial Activities (or Net Industrial Debt): Net Debt is defined as total debt less
intersegment notes receivable, cash and cash equivalents, restricted cash and derivative hedging debt. CNH
Industrial provides the reconciliation of Net Debt to Total Debt, which is the most directly comparable measure
included in the consolidated balance sheets. Due to different sources of cash flows used for the repayment of the debt
between Industrial Activities and Financial Services (by cash from operations for Industrial Activities and by collection
of financing receivables for Financial Services), management separately evaluates the cash flow performance of
Industrial Activities using Net Debt of Industrial Activities.
Available Liquidity: is defined as cash and cash equivalents plus restricted cash and undrawn committed facilities.
Change excl. FX or Constant Currency: CNH Industrial discusses the fluctuations in revenues on a constant currency
basis by applying the prior year average exchange rates to current year’s revenues expressed in local currency in
order to eliminate the impact of foreign exchange rate fluctuations.
The tables attached to this press release provide reconciliations of the non-GAAP measures used in this press release to
the most directly comparable GAAP measures.
Forward-looking statements
All statements other than statements of historical fact contained in this earning release including statements regarding our
competitive strengths; business strategy; future financial position or operating results; budgets; projections with respect to
revenue, income, earnings (or loss) per share, capital expenditures, dividends, capital structure or other financial items;
costs; and plans and objectives of management regarding operations and products, are forward-looking statements.
These statements may include terminology such as “may”, “will”, “expect”, “could”, “should”, “intend”, “estimate”,
“anticipate”, “believe”, “outlook”, “continue”, “remain”, “on track”, “design”, “target”, “objective”, “goal”, “forecast”,
“projection”, “prospects”, “plan”, or similar terminology. Forward-looking statements are not guarantees of future
performance. Rather, they are based on current views and assumptions and involve known and unknown risks,
uncertainties and other factors, many of which are outside our control and are difficult to predict. If any of these risks and
uncertainties materialize or other assumptions underlying any of the forward-looking statements prove to be incorrect, the
actual results or developments may differ materially from any future results or developments expressed or implied by the
forward-looking statements. Factors, risks and uncertainties that could cause actual results to differ materially from those
contemplated by the forward-looking statements include, among others: the many interrelated factors that affect consumer
confidence and worldwide demand for capital goods and capital goods-related products; general economic conditions in
each of our markets; changes in government policies regarding banking, monetary and fiscal policies; legislation,
particularly relating to capital goods-related issues such as agriculture, the environment, debt relief and subsidy program
policies, trade and commerce and infrastructure development; government policies on international trade and investment,
including sanctions, import quotas, capital controls and tariffs; actions of competitors in the various industries in which we
compete; development and use of new technologies and technological difficulties; the interpretation of, or adoption of new,
compliance requirements with respect to engine emissions, safety or other aspects of our products; production difficulties,
including capacity and supply constraints and excess inventory levels; labor relations; interest rates and currency
exchange rates; inflation and deflation; energy prices; prices for agricultural commodities; housing starts and other
construction activity; our ability to obtain financing or to refinance existing debt; a decline in the price of used vehicles; the
resolution of pending litigation and investigations on a wide range of topics, including dealer and supplier litigation, follow-
on private litigation in various jurisdictions after the settlement of the EU antitrust investigation announced on July 19,
2016, intellectual property rights disputes, product warranty and defective product claims, and emissions and/or fuel
economy regulatory and contractual issues; our pension plans and other post-employment obligations; political and civil
unrest; volatility and deterioration of capital and financial markets, including further deterioration of the Eurozone
2017 THIRD QUARTER RESULTS
8
sovereign debt crisis, possible effects of “Brexit”, terror attacks in Europe and elsewhere, and other similar risks and
uncertainties and our success in managing the risks involved in the foregoing. Further information concerning factors,
risks, and uncertainties that could materially affect the Company’s financial results is included in our annual report on
Form 20-F for the year ended December 31, 2016, prepared in accordance with U.S. GAAP, and in the Company’s EU
Annual Report at December 31, 2016, prepared in accordance with EU-IFRS. Investors should refer to and consider the
incorporated information on risks, factors, and uncertainties in addition to the information presented here.
Forward-looking statements are based upon assumptions relating to the factors described in the earnings release, which
are sometimes based upon estimates and data received from third parties. Such estimates and data are often revised.
Our actual results could differ materially from those anticipated in such forward-looking statements. Forward-looking
statements speak only as of the date on which such statements are made, and we undertake no obligation to update or
revise publicly our forward-looking statements. Further information concerning CNH Industrial and its businesses,
including factors that potentially could materially affect CNH Industrial’s financial results, is included in CNH Industrial’s
reports and filings with the U.S. Securities and Exchange Commission (“SEC”), the Autoriteit Financiële Markten (“AFM”)
and Commissione Nazionale per le Società e la Borsa (“CONSOB”).
All future written and oral forward-looking statements by CNH Industrial or persons acting on the behalf of CNH Industrial
are expressly qualified in their entirety by the cautionary statements contained herein or referred to above.
Contacts Media Inquiries Investor Relations United Kingdom United Kingdom Richard Gadeselli Federico Donati Tel: +44 207 7660 346 Tel: +44 207 7660 386 Laura Overall United States Tel: +44 207 7660 338 Noah Weiss Tel: +1 630 887 3745 E-mail: [email protected]
www.cnhindustrial.com
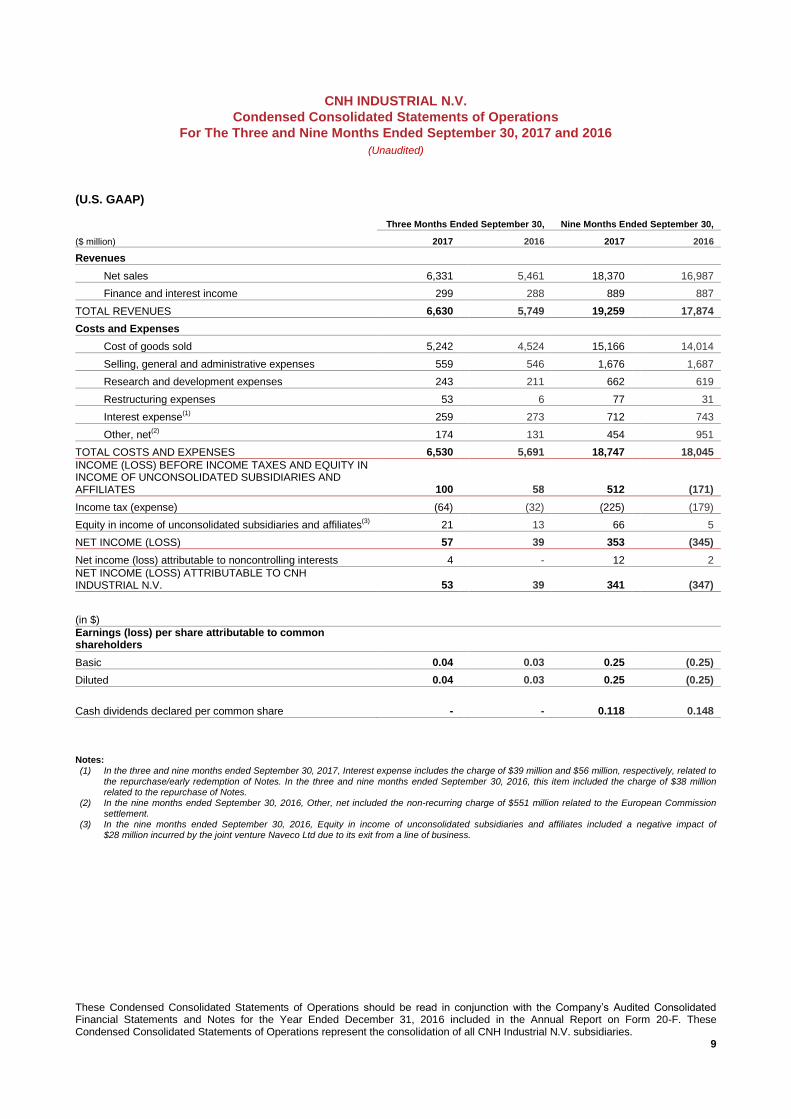
These Condensed Consolidated Statements of Operations should be read in conjunction with the Company’s Audited Consolidated Financial Statements and Notes for the Year Ended December 31, 2016 included in the Annual Report on Form 20-F. These Condensed Consolidated Statements of Operations represent the consolidation of all CNH Industrial N.V. subsidiaries.
9
CNH INDUSTRIAL N.V.
Condensed Consolidated Statements of Operations
For The Three and Nine Months Ended September 30, 2017 and 2016
(Unaudited)
(U.S. GAAP)
($ million)
Three Months Ended September 30, Nine Months Ended September 30,
2017 2016 2017 2016
Revenues
Net sales 6,331
5,461 18,370 16,987
Finance and interest income 299
288 889 887
TOTAL REVENUES 6,630
5,749 19,259 17,874
Costs and Expenses
Cost of goods sold 5,242
4,524 15,166 14,014
Selling, general and administrative expenses 559
546 1,676 1,687
Research and development expenses 243
211 662 619
Restructuring expenses 53
6 77 31
Interest expense(1)
259
273 712 743
Other, net(2)
174
131 454 951
TOTAL COSTS AND EXPENSES 6,530
5,691 18,747 18,045
INCOME (LOSS) BEFORE INCOME TAXES AND EQUITY IN INCOME OF UNCONSOLIDATED SUBSIDIARIES AND AFFILIATES 100
58 512
(171)
Income tax (expense) (64)
(32) (225) (179)
Equity in income of unconsolidated subsidiaries and affiliates(3)
21
13 66 5
NET INCOME (LOSS) 57
39 353 (345)
Net income (loss) attributable to noncontrolling interests 4
- 12 2
NET INCOME (LOSS) ATTRIBUTABLE TO CNH INDUSTRIAL N.V. 53
39 341
(347)
(in $)
Earnings (loss) per share attributable to common shareholders
Basic 0.04
0.03 0.25 (0.25)
Diluted 0.04
0.03 0.25 (0.25)
Cash dividends declared per common share - - 0.118
0.148
Notes: (1) In the three and nine months ended September 30, 2017, Interest expense includes the charge of $39 million and $56 million, respectively, related to
the repurchase/early redemption of Notes. In the three and nine months ended September 30, 2016, this item included the charge of $38 million related to the repurchase of Notes.
(2) In the nine months ended September 30, 2016, Other, net included the non-recurring charge of $551 million related to the European Commission settlement.
(3) In the nine months ended September 30, 2016, Equity in income of unconsolidated subsidiaries and affiliates included a negative impact of $28 million incurred by the joint venture Naveco Ltd due to its exit from a line of business.
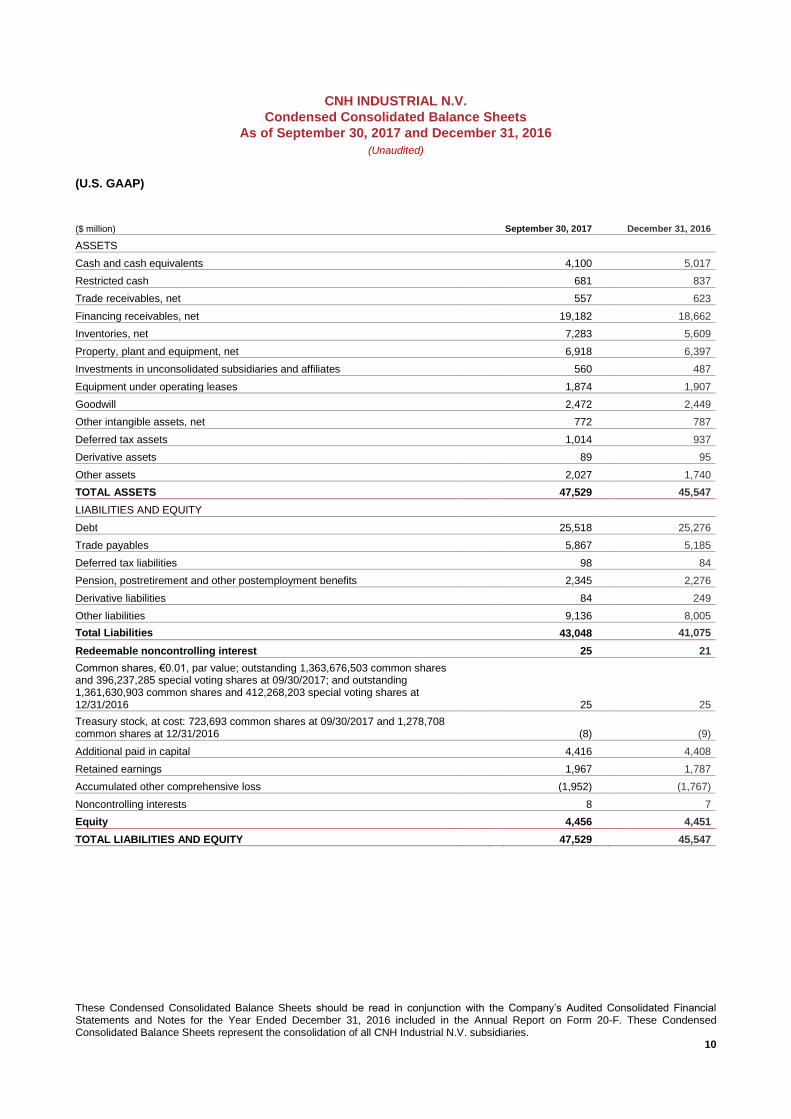
These Condensed Consolidated Balance Sheets should be read in conjunction with the Company’s Audited Consolidated Financial Statements and Notes for the Year Ended December 31, 2016 included in the Annual Report on Form 20-F. These Condensed Consolidated Balance Sheets represent the consolidation of all CNH Industrial N.V. subsidiaries.
10
CNH INDUSTRIAL N.V.
Condensed Consolidated Balance Sheets
As of September 30, 2017 and December 31, 2016
(Unaudited)
(U.S. GAAP)
($ million)
September 30, 2017
December 31, 2016
ASSETS
Cash and cash equivalents 4,100 5,017
Restricted cash 681 837
Trade receivables, net 557 623
Financing receivables, net 19,182 18,662
Inventories, net 7,283 5,609
Property, plant and equipment, net 6,918 6,397
Investments in unconsolidated subsidiaries and affiliates 560 487
Equipment under operating leases 1,874 1,907
Goodwill 2,472 2,449
Other intangible assets, net 772 787
Deferred tax assets 1,014 937
Derivative assets 89 95
Other assets 2,027 1,740
TOTAL ASSETS 47,529 45,547
LIABILITIES AND EQUITY
Debt 25,518 25,276
Trade payables 5,867 5,185
Deferred tax liabilities 98 84
Pension, postretirement and other postemployment benefits 2,345 2,276
Derivative liabilities 84 249
Other liabilities 9,136 8,005
Total Liabilities 43,048 41,075
Redeemable noncontrolling interest 25 21
Common shares, €0.01, par value; outstanding 1,363,676,503 common shares and 396,237,285 special voting shares at 09/30/2017; and outstanding 1,361,630,903 common shares and 412,268,203 special voting shares at 12/31/2016 25 25
Treasury stock, at cost: 723,693 common shares at 09/30/2017 and 1,278,708 common shares at 12/31/2016 (8) (9)
Additional paid in capital 4,416 4,408
Retained earnings 1,967 1,787
Accumulated other comprehensive loss (1,952) (1,767)
Noncontrolling interests 8 7
Equity 4,456 4,451
TOTAL LIABILITIES AND EQUITY 47,529 45,547
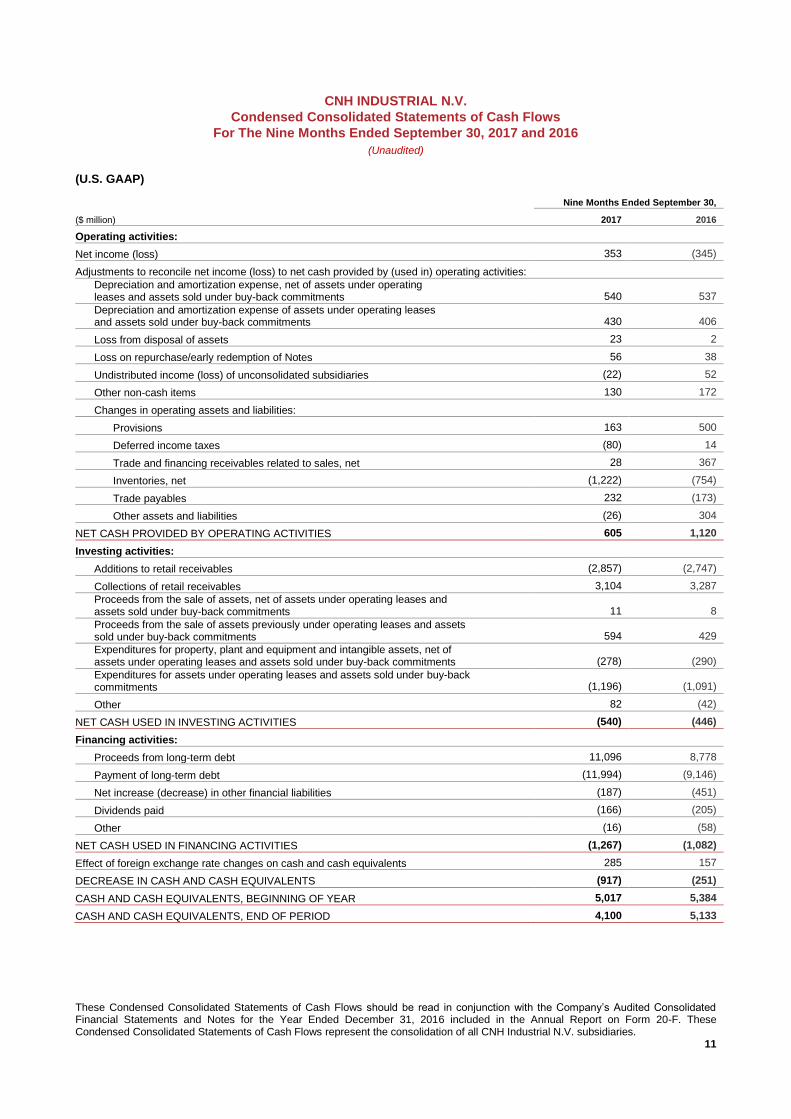
These Condensed Consolidated Statements of Cash Flows should be read in conjunction with the Company’s Audited Consolidated Financial Statements and Notes for the Year Ended December 31, 2016 included in the Annual Report on Form 20-F. These Condensed Consolidated Statements of Cash Flows represent the consolidation of all CNH Industrial N.V. subsidiaries.
11
CNH INDUSTRIAL N.V.
Condensed Consolidated Statements of Cash Flows
For The Nine Months Ended September 30, 2017 and 2016
(Unaudited)
(U.S. GAAP)
($ million)
Nine Months Ended September 30,
2017 2016
Operating activities:
Net income (loss) 353 (345)
Adjustments to reconcile net income (loss) to net cash provided by (used in) operating activities:
Depreciation and amortization expense, net of assets under operating leases and assets sold under buy-back commitments 540 537
Depreciation and amortization expense of assets under operating leases and assets sold under buy-back commitments 430 406
Loss from disposal of assets 23 2
Loss on repurchase/early redemption of Notes 56 38
Undistributed income (loss) of unconsolidated subsidiaries (22) 52
Other non-cash items 130 172
Changes in operating assets and liabilities:
Provisions 163 500
Deferred income taxes (80) 14
Trade and financing receivables related to sales, net 28 367
Inventories, net (1,222) (754)
Trade payables 232 (173)
Other assets and liabilities (26) 304
NET CASH PROVIDED BY OPERATING ACTIVITIES 605 1,120
Investing activities:
Additions to retail receivables (2,857) (2,747)
Collections of retail receivables 3,104 3,287
Proceeds from the sale of assets, net of assets under operating leases and assets sold under buy-back commitments 11 8
Proceeds from the sale of assets previously under operating leases and assets sold under buy-back commitments 594 429
Expenditures for property, plant and equipment and intangible assets, net of assets under operating leases and assets sold under buy-back commitments (278) (290)
Expenditures for assets under operating leases and assets sold under buy-back commitments (1,196) (1,091)
Other 82 (42)
NET CASH USED IN INVESTING ACTIVITIES (540) (446)
Financing activities:
Proceeds from long-term debt 11,096 8,778
Payment of long-term debt (11,994) (9,146)
Net increase (decrease) in other financial liabilities (187) (451)
Dividends paid (166) (205)
Other (16) (58)
NET CASH USED IN FINANCING ACTIVITIES (1,267) (1,082)
Effect of foreign exchange rate changes on cash and cash equivalents 285 157
DECREASE IN CASH AND CASH EQUIVALENTS (917) (251)
CASH AND CASH EQUIVALENTS, BEGINNING OF YEAR 5,017 5,384
CASH AND CASH EQUIVALENTS, END OF PERIOD 4,100 5,133
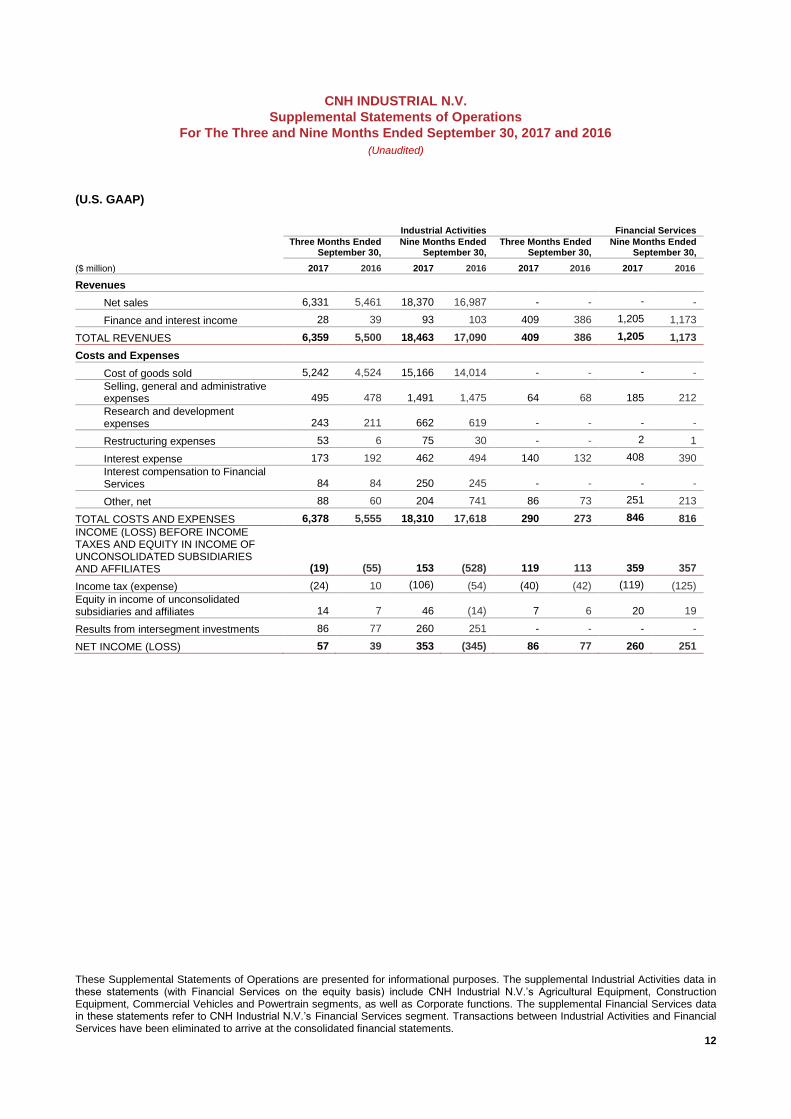
These Supplemental Statements of Operations are presented for informational purposes. The supplemental Industrial Activities data in these statements (with Financial Services on the equity basis) include CNH Industrial N.V.’s Agricultural Equipment, Construction Equipment, Commercial Vehicles and Powertrain segments, as well as Corporate functions. The supplemental Financial Services data in these statements refer to CNH Industrial N.V.’s Financial Services segment. Transactions between Industrial Activities and Financial Services have been eliminated to arrive at the consolidated financial statements.
12
CNH INDUSTRIAL N.V.
Supplemental Statements of Operations
For The Three and Nine Months Ended September 30, 2017 and 2016
(Unaudited)
(U.S. GAAP)
Industrial Activities Financial Services
($ million)
Three Months Ended September 30,
Nine Months Ended September 30,
Three Months Ended September 30,
Nine Months Ended September 30,
2017 2016 2017 2016 2017 2016 2017 2016
Revenues
Net sales 6,331 5,461 18,370 16,987 - - - -
Finance and interest income 28 39 93 103 409 386 1,205 1,173
TOTAL REVENUES 6,359 5,500 18,463 17,090 409 386 1,205 1,173
Costs and Expenses
Cost of goods sold 5,242 4,524 15,166 14,014 - - - -
Selling, general and administrative expenses 495 478 1,491 1,475 64 68 185 212
Research and development expenses 243 211 662 619 - - - -
Restructuring expenses 53 6 75 30 - - 2 1
Interest expense 173 192 462 494 140 132 408 390
Interest compensation to Financial Services 84 84 250 245 - - - -
Other, net 88 60 204 741 86 73 251 213
TOTAL COSTS AND EXPENSES 6,378 5,555 18,310 17,618 290 273 846 816
INCOME (LOSS) BEFORE INCOME TAXES AND EQUITY IN INCOME OF UNCONSOLIDATED SUBSIDIARIES AND AFFILIATES (19) (55) 153 (528) 119 113 359 357
Income tax (expense) (24) 10 (106) (54) (40) (42) (119) (125)
Equity in income of unconsolidated subsidiaries and affiliates 14 7 46 (14) 7 6 20 19
Results from intersegment investments 86 77 260 251 - - - -
NET INCOME (LOSS) 57 39 353 (345) 86 77 260 251
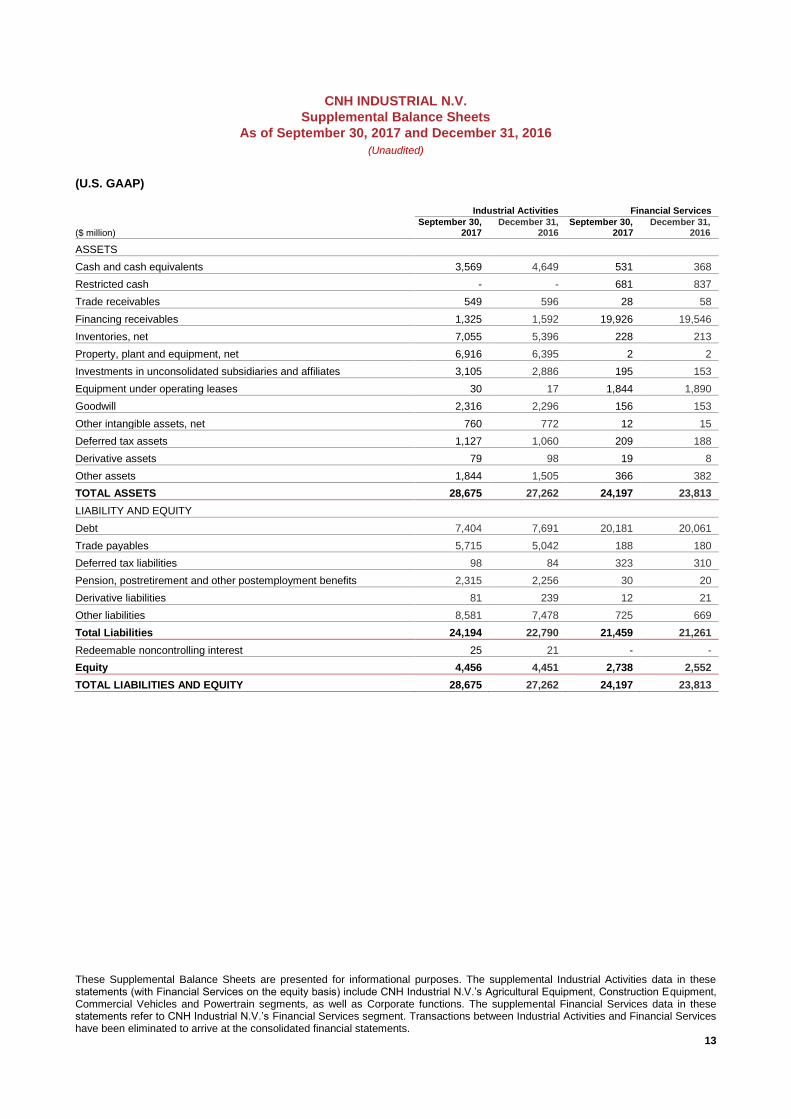
These Supplemental Balance Sheets are presented for informational purposes. The supplemental Industrial Activities data in these statements (with Financial Services on the equity basis) include CNH Industrial N.V.’s Agricultural Equipment, Construction Equipment, Commercial Vehicles and Powertrain segments, as well as Corporate functions. The supplemental Financial Services data in these statements refer to CNH Industrial N.V.’s Financial Services segment. Transactions between Industrial Activities and Financial Services have been eliminated to arrive at the consolidated financial statements.
13
CNH INDUSTRIAL N.V.
Supplemental Balance Sheets
As of September 30, 2017 and December 31, 2016
(Unaudited)
(U.S. GAAP)
Industrial Activities Financial Services
($ million) September 30,
2017 December 31,
2016 September 30,
2017 December 31,
2016
ASSETS
Cash and cash equivalents 3,569 4,649 531 368
Restricted cash - - 681 837
Trade receivables 549 596 28 58
Financing receivables 1,325 1,592 19,926 19,546
Inventories, net 7,055 5,396 228 213
Property, plant and equipment, net 6,916 6,395 2 2
Investments in unconsolidated subsidiaries and affiliates 3,105 2,886 195 153
Equipment under operating leases 30 17 1,844 1,890
Goodwill 2,316 2,296 156 153
Other intangible assets, net 760 772 12 15
Deferred tax assets 1,127 1,060 209 188
Derivative assets 79 98 19 8
Other assets 1,844 1,505 366 382
TOTAL ASSETS 28,675 27,262 24,197 23,813
LIABILITY AND EQUITY
Debt 7,404 7,691 20,181 20,061
Trade payables 5,715 5,042 188 180
Deferred tax liabilities 98 84 323 310
Pension, postretirement and other postemployment benefits 2,315 2,256 30 20
Derivative liabilities 81 239 12 21
Other liabilities 8,581 7,478 725 669
Total Liabilities 24,194 22,790 21,459 21,261
Redeemable noncontrolling interest 25 21 - -
Equity 4,456 4,451 2,738 2,552
TOTAL LIABILITIES AND EQUITY 28,675 27,262 24,197 23,813
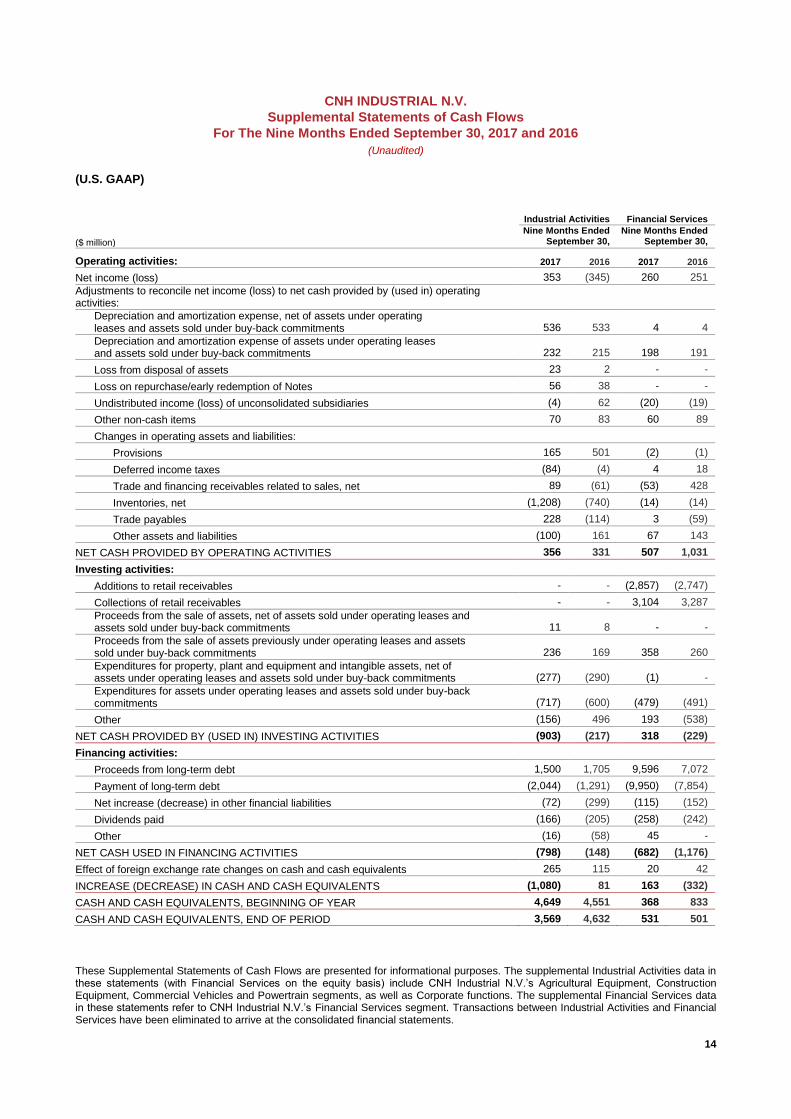
These Supplemental Statements of Cash Flows are presented for informational purposes. The supplemental Industrial Activities data in these statements (with Financial Services on the equity basis) include CNH Industrial N.V.’s Agricultural Equipment, Construction Equipment, Commercial Vehicles and Powertrain segments, as well as Corporate functions. The supplemental Financial Services data in these statements refer to CNH Industrial N.V.’s Financial Services segment. Transactions between Industrial Activities and Financial Services have been eliminated to arrive at the consolidated financial statements.
14
CNH INDUSTRIAL N.V.
Supplemental Statements of Cash Flows
For The Nine Months Ended September 30, 2017 and 2016
(Unaudited)
(U.S. GAAP)
Industrial Activities Financial Services
($ million) Nine Months Ended
September 30, Nine Months Ended
September 30,
Operating activities: 2017 2016 2017 2016
Net income (loss) 353 (345) 260 251
Adjustments to reconcile net income (loss) to net cash provided by (used in) operating activities:
Depreciation and amortization expense, net of assets under operating leases and assets sold under buy-back commitments 536 533 4 4
Depreciation and amortization expense of assets under operating leases and assets sold under buy-back commitments 232 215 198 191
Loss from disposal of assets 23 2 - -
Loss on repurchase/early redemption of Notes 56 38 - -
Undistributed income (loss) of unconsolidated subsidiaries (4) 62 (20) (19)
Other non-cash items 70 83 60 89
Changes in operating assets and liabilities:
Provisions 165 501 (2) (1)
Deferred income taxes (84) (4) 4 18
Trade and financing receivables related to sales, net 89 (61) (53) 428
Inventories, net (1,208) (740) (14) (14)
Trade payables 228 (114) 3 (59)
Other assets and liabilities (100) 161 67 143
NET CASH PROVIDED BY OPERATING ACTIVITIES 356 331 507 1,031
Investing activities:
Additions to retail receivables - - (2,857) (2,747)
Collections of retail receivables - - 3,104 3,287
Proceeds from the sale of assets, net of assets sold under operating leases and assets sold under buy-back commitments 11 8 - -
Proceeds from the sale of assets previously under operating leases and assets sold under buy-back commitments 236 169 358 260
Expenditures for property, plant and equipment and intangible assets, net of assets under operating leases and assets sold under buy-back commitments (277) (290) (1) -
Expenditures for assets under operating leases and assets sold under buy-back commitments (717) (600) (479) (491)
Other (156) 496 193 (538)
NET CASH PROVIDED BY (USED IN) INVESTING ACTIVITIES (903) (217) 318 (229)
Financing activities:
Proceeds from long-term debt 1,500 1,705 9,596 7,072
Payment of long-term debt (2,044) (1,291) (9,950) (7,854)
Net increase (decrease) in other financial liabilities (72) (299) (115) (152)
Dividends paid (166) (205) (258) (242)
Other (16) (58) 45 -
NET CASH USED IN FINANCING ACTIVITIES (798) (148) (682) (1,176)
Effect of foreign exchange rate changes on cash and cash equivalents 265 115 20 42
INCREASE (DECREASE) IN CASH AND CASH EQUIVALENTS (1,080) 81 163 (332)
CASH AND CASH EQUIVALENTS, BEGINNING OF YEAR 4,649 4,551 368 833
CASH AND CASH EQUIVALENTS, END OF PERIOD 3,569 4,632 531 501
15
CNH INDUSTRIAL N.V.
Other Supplemental Financial Information
(Unaudited)
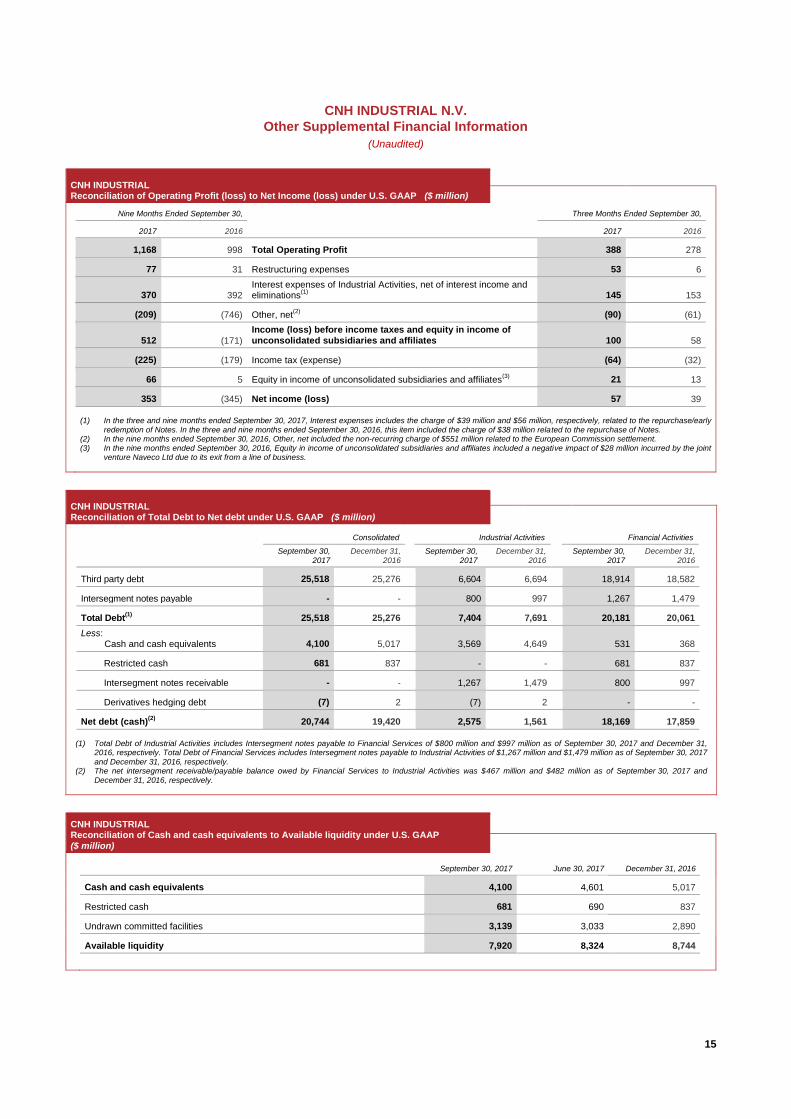
CNH INDUSTRIAL Reconciliation of Operating Profit (loss) to Net Income (loss) under U.S. GAAP ($ million)
Nine Months Ended September 30, Three Months Ended September 30,
2017 2016 2017 2016
1,168 998 Total Operating Profit 388 278
77 31 Restructuring expenses 53 6
370 392 Interest expenses of Industrial Activities, net of interest income and eliminations
(1) 145 153
(209) (746) Other, net(2)
(90) (61)
512 (171)
Income (loss) before income taxes and equity in income of unconsolidated subsidiaries and affiliates 100 58
(225) (179) Income tax (expense) (64) (32)
66 5 Equity in income of unconsolidated subsidiaries and affiliates(3)
21 13
353 (345) Net income (loss) 57 39
(1) In the three and nine months ended September 30, 2017, Interest expenses includes the charge of $39 million and $56 million, respectively, related to the repurchase/early
redemption of Notes. In the three and nine months ended September 30, 2016, this item included the charge of $38 million related to the repurchase of Notes. (2) In the nine months ended September 30, 2016, Other, net included the non-recurring charge of $551 million related to the European Commission settlement. (3) In the nine months ended September 30, 2016, Equity in income of unconsolidated subsidiaries and affiliates included a negative impact of $28 million incurred by the joint
venture Naveco Ltd due to its exit from a line of business.
CNH INDUSTRIAL Reconciliation of Total Debt to Net debt under U.S. GAAP ($ million)
\
Consolidated
Industrial Activities
Financial Activities
September 30, 2017
December 31, 2016
September 30, 2017
December 31, 2016
September 30, 2017
December 31, 2016
Third party debt 25,518 25,276 6,604 6,694 18,914 18,582
Intersegment notes payable - - 800 997 1,267 1,479
Total Debt(1)
25,518 25,276 7,404 7,691 20,181 20,061
Less: Cash and cash equivalents 4,100 5,017
3,569 4,649
531 368
Restricted cash 681 837
- -
681 837
Intersegment notes receivable - - 1,267 1,479 800 997
Derivatives hedging debt (7) 2 (7) 2 - -
Net debt (cash)(2)
20,744 19,420 2,575 1,561 18,169 17,859
(1) Total Debt of Industrial Activities includes Intersegment notes payable to Financial Services of $800 million and $997 million as of September 30, 2017 and December 31, 2016, respectively. Total Debt of Financial Services includes Intersegment notes payable to Industrial Activities of $1,267 million and $1,479 million as of September 30, 2017 and December 31, 2016, respectively.
(2) The net intersegment receivable/payable balance owed by Financial Services to Industrial Activities was $467 million and $482 million as of September 30, 2017 and December 31, 2016, respectively.
CNH INDUSTRIAL Reconciliation of Cash and cash equivalents to Available liquidity under U.S. GAAP ($ million)
September 30, 2017
June 30, 2017
December 31, 2016
Cash and cash equivalents 4,100 4,601 5,017
Restricted cash 681 690 837
Undrawn committed facilities 3,139 3,033 2,890
Available liquidity 7,920 8,324 8,744
16
CNH INDUSTRIAL N.V.
Other Supplemental Financial Information
(Unaudited)
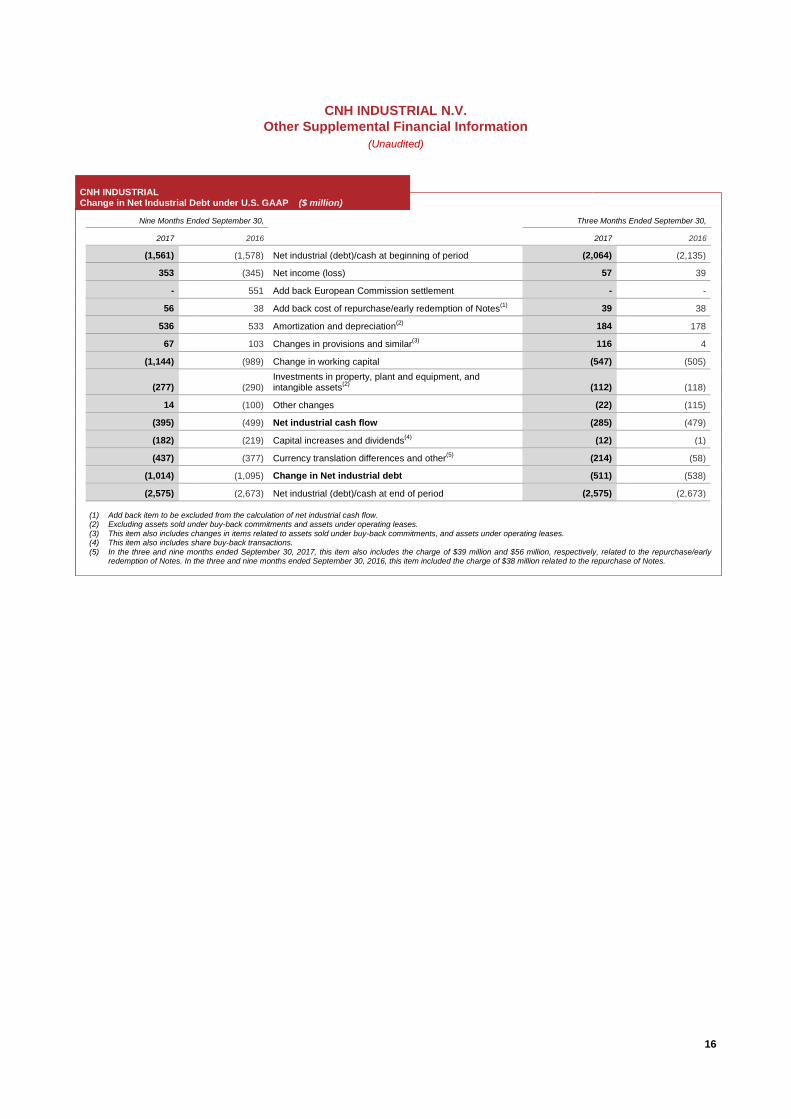
CNH INDUSTRIAL Change in Net Industrial Debt under U.S. GAAP ($ million)
Nine Months Ended September 30,
Three Months Ended September 30,
2017 2016
2017 2016
(1,561)
(1,578) Net industrial (debt)/cash at beginning of period (2,064) (2,135)
353 (345) Net income (loss) 57 39
- 551 Add back European Commission settlement - -
56 38 Add back cost of repurchase/early redemption of Notes(1)
39 38
536 533 Amortization and depreciation(2)
184 178
67 103 Changes in provisions and similar(3)
116 4
(1,144) (989) Change in working capital (547) (505)
(277) (290) Investments in property, plant and equipment, and intangible assets
(2) (112) (118)
14 (100) Other changes (22) (115)
(395) (499) Net industrial cash flow (285) (479)
(182) (219) Capital increases and dividends(4)
(12) (1)
(437) (377) Currency translation differences and other(5)
(214) (58)
(1,014) (1,095) Change in Net industrial debt (511) (538)
(2,575) (2,673) Net industrial (debt)/cash at end of period (2,575) (2,673)
(1) Add back item to be excluded from the calculation of net industrial cash flow. (2) Excluding assets sold under buy-back commitments and assets under operating leases. (3) This item also includes changes in items related to assets sold under buy-back commitments, and assets under operating leases. (4) This item also includes share buy-back transactions. (5) In the three and nine months ended September 30, 2017, this item also includes the charge of $39 million and $56 million, respectively, related to the repurchase/early
redemption of Notes. In the three and nine months ended September 30, 2016, this item included the charge of $38 million related to the repurchase of Notes.
17
CNH INDUSTRIAL N.V.
Other Supplemental Financial Information
(Unaudited)
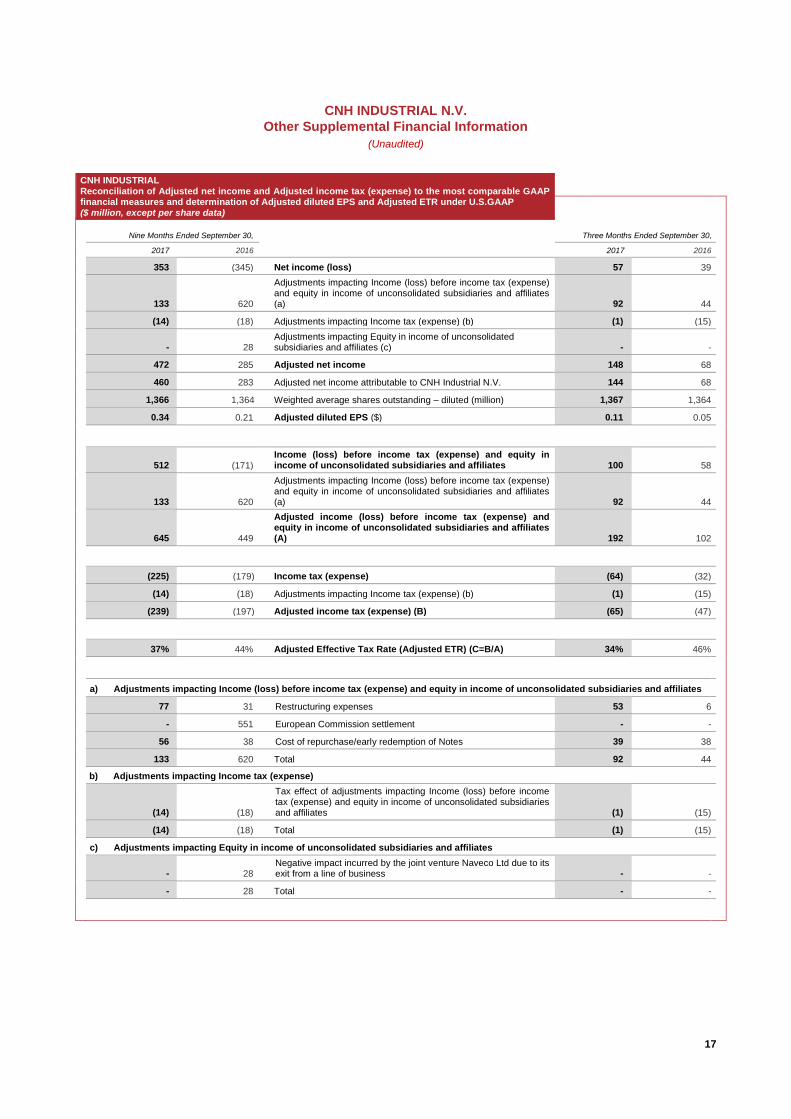
CNH INDUSTRIAL Reconciliation of Adjusted net income and Adjusted income tax (expense) to the most comparable GAAP financial measures and determination of Adjusted diluted EPS and Adjusted ETR under U.S.GAAP ($ million, except per share data)
Nine Months Ended September 30,
Three Months Ended September 30,
2017 2016 2017 2016
353 (345) Net income (loss) 57 39
133 620
Adjustments impacting Income (loss) before income tax (expense) and equity in income of unconsolidated subsidiaries and affiliates (a) 92 44
(14) (18) Adjustments impacting Income tax (expense) (b) (1) (15)
- 28 Adjustments impacting Equity in income of unconsolidated
subsidiaries and affiliates (c) - -
472 285 Adjusted net income 148 68
460 283 Adjusted net income attributable to CNH Industrial N.V. 144 68
1,366 1,364 Weighted average shares outstanding – diluted (million) 1,367 1,364
0.34 0.21 Adjusted diluted EPS ($) 0.11 0.05
512 (171) Income (loss) before income tax (expense) and equity in
income of unconsolidated subsidiaries and affiliates 100 58
133 620
Adjustments impacting Income (loss) before income tax (expense) and equity in income of unconsolidated subsidiaries and affiliates (a) 92 44
645 449
Adjusted income (loss) before income tax (expense) and equity in income of unconsolidated subsidiaries and affiliates (A) 192 102
(225) (179) Income tax (expense) (64) (32)
(14) (18) Adjustments impacting Income tax (expense) (b) (1) (15)
(239) (197) Adjusted income tax (expense) (B) (65) (47)
37% 44% Adjusted Effective Tax Rate (Adjusted ETR) (C=B/A) 34% 46%
a) Adjustments impacting Income (loss) before income tax (expense) and equity in income of unconsolidated subsidiaries and affiliates
77 31 Restructuring expenses 53 6
- 551 European Commission settlement - -
56 38 Cost of repurchase/early redemption of Notes 39 38
133 620 Total 92 44
b) Adjustments impacting Income tax (expense)
(14) (18)
Tax effect of adjustments impacting Income (loss) before income tax (expense) and equity in income of unconsolidated subsidiaries and affiliates (1) (15)
(14) (18) Total (1) (15)
c) Adjustments impacting Equity in income of unconsolidated subsidiaries and affiliates
- 28 Negative impact incurred by the joint venture Naveco Ltd due to its
exit from a line of business - -
- 28 Total - -
18
CNH INDUSTRIAL N.V.
Other Supplemental Financial Information
(Unaudited)
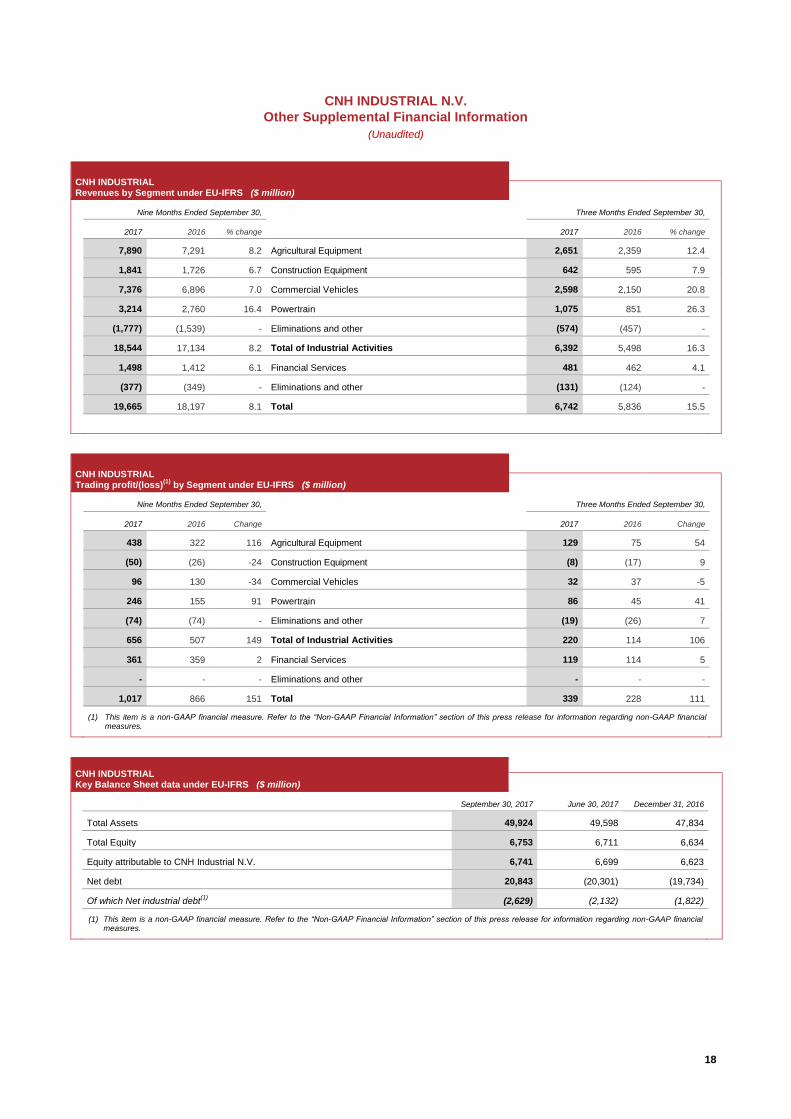
CNH INDUSTRIAL Revenues by Segment under EU-IFRS ($ million)
Nine Months Ended September 30, Three Months Ended September 30,
2017 2016 % change 2017 2016 % change
7,890 7,291 8.2 Agricultural Equipment 2,651 2,359 12.4
1,841 1,726 6.7 Construction Equipment 642 595 7.9
7,376 6,896 7.0 Commercial Vehicles 2,598 2,150 20.8
3,214 2,760 16.4 Powertrain 1,075 851 26.3
(1,777) (1,539) - Eliminations and other (574) (457) -
18,544 17,134 8.2 Total of Industrial Activities 6,392 5,498 16.3
1,498 1,412 6.1 Financial Services 481 462 4.1
(377) (349) - Eliminations and other (131) (124) -
19,665 18,197 8.1 Total 6,742 5,836 15.5
CNH INDUSTRIAL Trading profit/(loss)
(1) by Segment under EU-IFRS ($ million)
Nine Months Ended September 30, Three Months Ended September 30,
2017 2016 Change 2017 2016 Change
438 322 116 Agricultural Equipment 129 75 54
(50) (26) -24 Construction Equipment (8) (17) 9
96 130 -34 Commercial Vehicles 32 37 -5
246 155 91 Powertrain 86 45 41
(74) (74) - Eliminations and other (19) (26) 7
656 507 149 Total of Industrial Activities 220 114 106
361 359 2 Financial Services 119 114 5
- - - Eliminations and other - - -
1,017 866 151 Total 339 228 111
(1) This item is a non-GAAP financial measure. Refer to the “Non-GAAP Financial Information” section of this press release for information regarding non-GAAP financial measures.
CNH INDUSTRIAL Key Balance Sheet data under EU-IFRS ($ million)
September 30, 2017 June 30, 2017 December 31, 2016
Total Assets 49,924 49,598 47,834
Total Equity 6,753 6,711 6,634
Equity attributable to CNH Industrial N.V. 6,741 6,699 6,623
Net debt 20,843 (20,301) (19,734)
Of which Net industrial debt(1)
(2,629) (2,132) (1,822)
(1) This item is a non-GAAP financial measure. Refer to the “Non-GAAP Financial Information” section of this press release for information regarding non-GAAP financial measures.
19
CNH INDUSTRIAL N.V.
Other Supplemental Financial Information
(Unaudited)
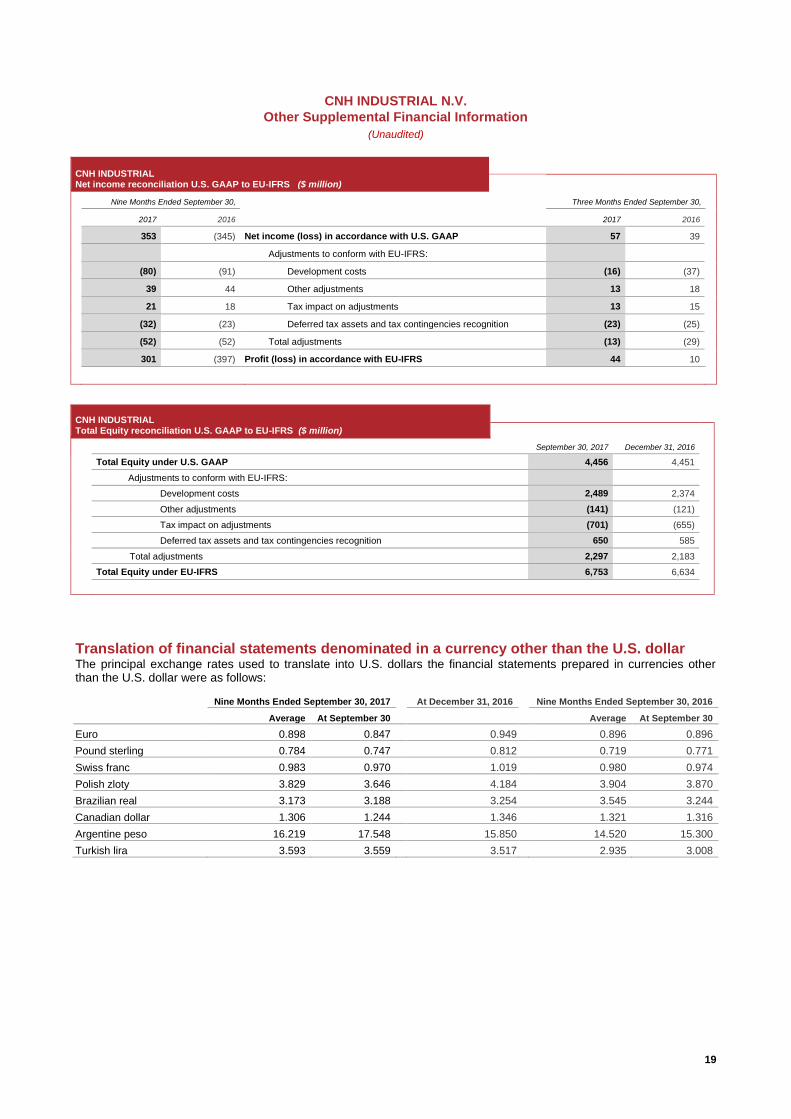
CNH INDUSTRIAL Net income reconciliation U.S. GAAP to EU-IFRS ($ million)
Nine Months Ended September 30, Three Months Ended September 30,
2017 2016 2017 2016
353 (345) Net income (loss) in accordance with U.S. GAAP 57 39
Adjustments to conform with EU-IFRS:
(80) (91) Development costs (16) (37)
39 44 Other adjustments 13 18
21 18 Tax impact on adjustments 13 15
(32) (23) Deferred tax assets and tax contingencies recognition (23) (25)
(52) (52) Total adjustments (13) (29)
301 (397) Profit (loss) in accordance with EU-IFRS 44 10
CNH INDUSTRIAL Total Equity reconciliation U.S. GAAP to EU-IFRS ($ million)
September 30, 2017 December 31, 2016
Total Equity under U.S. GAAP 4,456 4,451
Adjustments to conform with EU-IFRS:
Development costs 2,489 2,374
Other adjustments (141) (121)
Tax impact on adjustments (701) (655)
Deferred tax assets and tax contingencies recognition 650 585
Total adjustments 2,297 2,183
Total Equity under EU-IFRS 6,753 6,634
Translation of financial statements denominated in a currency other than the U.S. dollar The principal exchange rates used to translate into U.S. dollars the financial statements prepared in currencies other than the U.S. dollar were as follows:
Nine Months Ended September 30, 2017 At December 31, 2016 Nine Months Ended September 30, 2016
Average At September 30 Average At September 30
Euro 0.898 0.847 0.949 0.896 0.896
Pound sterling 0.784 0.747 0.812 0.719 0.771
Swiss franc 0.983 0.970 1.019 0.980 0.974
Polish zloty 3.829 3.646 4.184 3.904 3.870
Brazilian real 3.173 3.188 3.254 3.545 3.244
Canadian dollar 1.306 1.244 1.346 1.321 1.316
Argentine peso 16.219 17.548 15.850 14.520 15.300
Turkish lira 3.593 3.559 3.517 2.935 3.008
This Condensed Consolidated Income Statement should be read in conjunction with the Company’s Audited Consolidated Financial Statements and Notes for the Year Ended December 31, 2016 included in the EU Annual Report. This Condensed Consolidated Income Statement represents the consolidation of all CNH Industrial N.V. subsidiaries.
20
CNH INDUSTRIAL N.V.
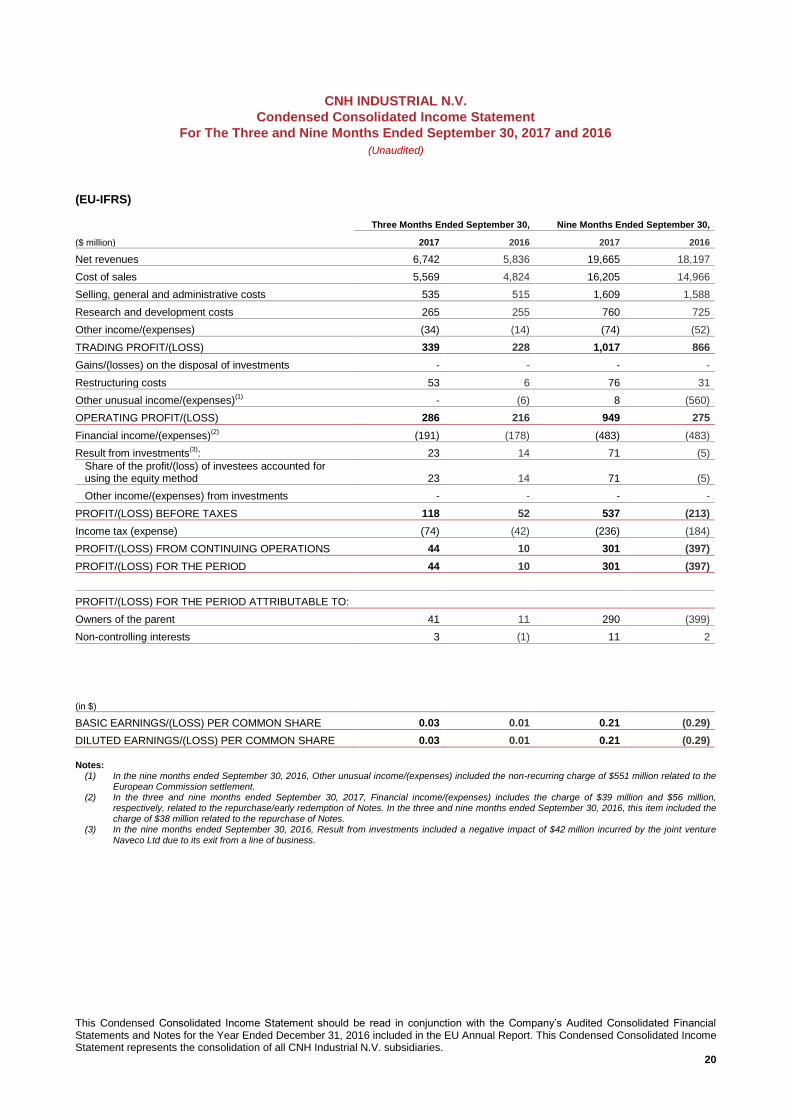
Condensed Consolidated Income Statement
For The Three and Nine Months Ended September 30, 2017 and 2016
(Unaudited)
(EU-IFRS)
Three Months Ended September 30, Nine Months Ended September 30,
($ million) 2017 2016 2017 2016
Net revenues 6,742 5,836 19,665 18,197
Cost of sales 5,569 4,824 16,205 14,966
Selling, general and administrative costs 535 515 1,609 1,588
Research and development costs 265 255 760 725
Other income/(expenses) (34) (14) (74) (52)
TRADING PROFIT/(LOSS) 339 228 1,017 866
Gains/(losses) on the disposal of investments - - - -
Restructuring costs 53 6 76 31
Other unusual income/(expenses)(1)
- (6) 8 (560)
OPERATING PROFIT/(LOSS) 286 216 949 275
Financial income/(expenses)(2)
(191) (178) (483) (483)
Result from investments(3)
: 23 14 71 (5)
Share of the profit/(loss) of investees accounted for using the equity method 23 14 71 (5)
Other income/(expenses) from investments - - - -
PROFIT/(LOSS) BEFORE TAXES 118 52 537 (213)
Income tax (expense) (74) (42) (236) (184)
PROFIT/(LOSS) FROM CONTINUING OPERATIONS 44 10 301 (397)
PROFIT/(LOSS) FOR THE PERIOD 44 10 301 (397)
PROFIT/(LOSS) FOR THE PERIOD ATTRIBUTABLE TO:
Owners of the parent 41 11 290 (399)
Non-controlling interests 3 (1) 11 2
(in $)
BASIC EARNINGS/(LOSS) PER COMMON SHARE 0.03 0.01 0.21 (0.29)
DILUTED EARNINGS/(LOSS) PER COMMON SHARE 0.03 0.01 0.21 (0.29)
Notes:
(1) In the nine months ended September 30, 2016, Other unusual income/(expenses) included the non-recurring charge of $551 million related to the European Commission settlement.
(2) In the three and nine months ended September 30, 2017, Financial income/(expenses) includes the charge of $39 million and $56 million, respectively, related to the repurchase/early redemption of Notes. In the three and nine months ended September 30, 2016, this item included the charge of $38 million related to the repurchase of Notes.
(3) In the nine months ended September 30, 2016, Result from investments included a negative impact of $42 million incurred by the joint venture
Naveco Ltd due to its exit from a line of business.
This Condensed Consolidated Statement of Financial Position should be read in conjunction with the Company’s Audited Consolidated Financial Statements and Notes for the Year Ended December 31, 2016 included in the EU Annual Report. This Condensed Consolidated Statement of Financial Position represents the consolidation of all CNH Industrial N.V. subsidiaries.
21
CNH INDUSTRIAL N.V.
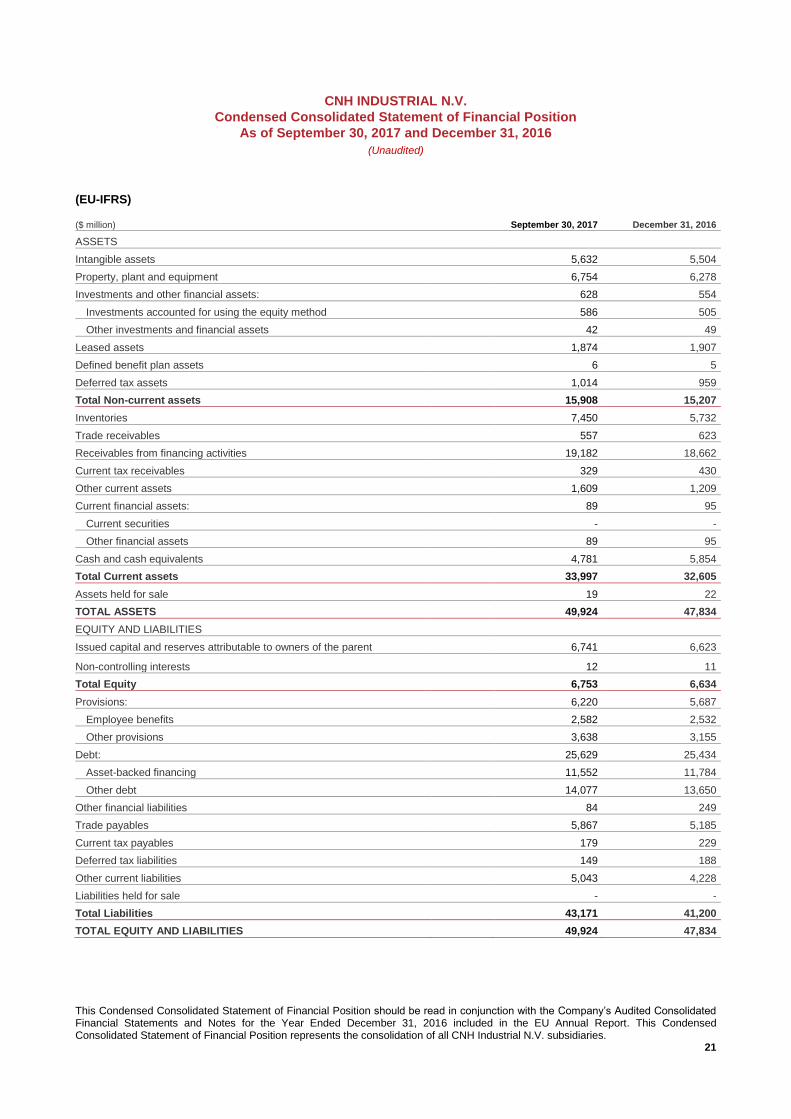
Condensed Consolidated Statement of Financial Position
As of September 30, 2017 and December 31, 2016
(Unaudited)
(EU-IFRS)
($ million) September 30, 2017 December 31, 2016
ASSETS
Intangible assets 5,632 5,504
Property, plant and equipment 6,754 6,278
Investments and other financial assets: 628 554
Investments accounted for using the equity method 586 505
Other investments and financial assets 42 49
Leased assets 1,874 1,907
Defined benefit plan assets 6 5
Deferred tax assets 1,014 959
Total Non-current assets 15,908 15,207
Inventories 7,450 5,732
Trade receivables 557 623
Receivables from financing activities 19,182 18,662
Current tax receivables 329 430
Other current assets 1,609 1,209
Current financial assets: 89 95
Current securities - -
Other financial assets 89 95
Cash and cash equivalents 4,781 5,854
Total Current assets 33,997 32,605
Assets held for sale 19 22
TOTAL ASSETS 49,924 47,834
EQUITY AND LIABILITIES
Issued capital and reserves attributable to owners of the parent 6,741 6,623
Non-controlling interests 12 11
Total Equity 6,753 6,634
Provisions: 6,220 5,687
Employee benefits 2,582 2,532
Other provisions 3,638 3,155
Debt: 25,629 25,434
Asset-backed financing 11,552 11,784
Other debt 14,077 13,650
Other financial liabilities 84 249
Trade payables 5,867 5,185
Current tax payables 179 229
Deferred tax liabilities 149 188
Other current liabilities 5,043 4,228
Liabilities held for sale - -
Total Liabilities 43,171 41,200
TOTAL EQUITY AND LIABILITIES 49,924 47,834
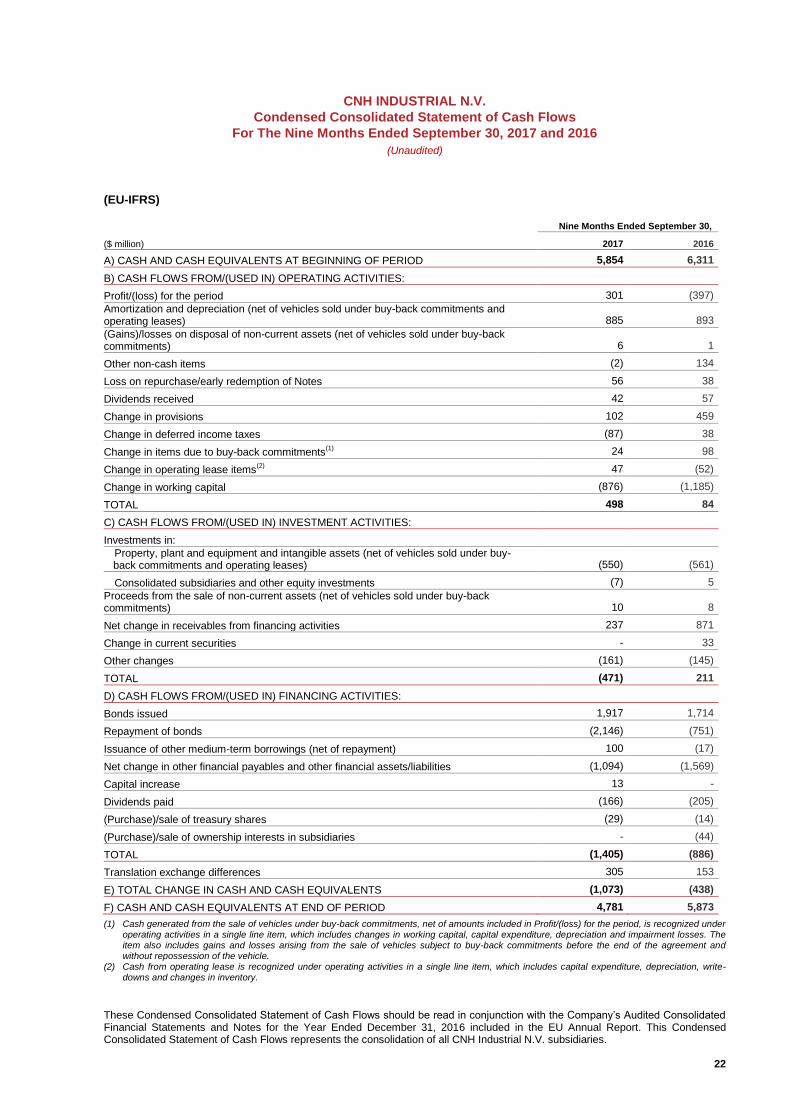
These Condensed Consolidated Statement of Cash Flows should be read in conjunction with the Company’s Audited Consolidated Financial Statements and Notes for the Year Ended December 31, 2016 included in the EU Annual Report. This Condensed Consolidated Statement of Cash Flows represents the consolidation of all CNH Industrial N.V. subsidiaries.
22
CNH INDUSTRIAL N.V.
Condensed Consolidated Statement of Cash Flows
For The Nine Months Ended September 30, 2017 and 2016
(Unaudited)
(EU-IFRS)
Nine Months Ended September 30,
($ million) 2017 2016
A) CASH AND CASH EQUIVALENTS AT BEGINNING OF PERIOD 5,854 6,311
B) CASH FLOWS FROM/(USED IN) OPERATING ACTIVITIES:
Profit/(loss) for the period 301 (397)
Amortization and depreciation (net of vehicles sold under buy-back commitments and operating leases) 885 893
(Gains)/losses on disposal of non-current assets (net of vehicles sold under buy-back commitments) 6 1
Other non-cash items (2) 134
Loss on repurchase/early redemption of Notes 56 38
Dividends received 42 57
Change in provisions 102 459
Change in deferred income taxes (87) 38
Change in items due to buy-back commitments(1)
24 98
Change in operating lease items(2)
47 (52)
Change in working capital (876) (1,185)
TOTAL 498 84
C) CASH FLOWS FROM/(USED IN) INVESTMENT ACTIVITIES:
Investments in:
Property, plant and equipment and intangible assets (net of vehicles sold under buy-back commitments and operating leases) (550) (561)
Consolidated subsidiaries and other equity investments (7) 5
Proceeds from the sale of non-current assets (net of vehicles sold under buy-back commitments) 10 8
Net change in receivables from financing activities 237 871
Change in current securities - 33
Other changes (161) (145)
TOTAL (471) 211
D) CASH FLOWS FROM/(USED IN) FINANCING ACTIVITIES:
Bonds issued 1,917 1,714
Repayment of bonds (2,146) (751)
Issuance of other medium-term borrowings (net of repayment) 100 (17)
Net change in other financial payables and other financial assets/liabilities (1,094) (1,569)
Capital increase 13 -
Dividends paid (166) (205)
(Purchase)/sale of treasury shares (29) (14)
(Purchase)/sale of ownership interests in subsidiaries - (44)
TOTAL (1,405) (886)
Translation exchange differences 305 153
E) TOTAL CHANGE IN CASH AND CASH EQUIVALENTS (1,073) (438)
F) CASH AND CASH EQUIVALENTS AT END OF PERIOD 4,781 5,873
(1) Cash generated from the sale of vehicles under buy-back commitments, net of amounts included in Profit/(loss) for the period, is recognized under operating activities in a single line item, which includes changes in working capital, capital expenditure, depreciation and impairment losses. The item also includes gains and losses arising from the sale of vehicles subject to buy-back commitments before the end of the agreement and without repossession of the vehicle.
(2) Cash from operating lease is recognized under operating activities in a single line item, which includes capital expenditure, depreciation, write-downs and changes in inventory.