Embed Size (px)
Citation preview

1
2019 Third Quarter ResultsNovember 5, 2019

2
Certain statements contained herein constitute forward-looking information and statements (collectively, "forward-looking statements"). When used the words "expect", "will", "could", "would", "believe", "continue", "pursue" and similar expressions are intended to identify forward-looking
statements. In particular, this presentation contains forward-looking statements with respect to among other things: Adjusted EBITDA Guidance; business and segment objectives, including organic growth initiatives, growth of supply and trading business in the U.S. and Caribbean, expansion
of cardlock and propane businesses, growth opportunities in LPG, aviation, retail, commercial and wholesale in the Sol business; capital and maintenance expenditure forecasts; strategic marketing and operational efforts to increase fuel volume; launch of JOURNIE™ Rewards and CIBC
partnership; synergies in connection with the acquisition of Tropic Oil; preparations for the 2020 turnaround; HDRD blending activities; and supply improvement and optimization and plans and objectives of or involving Parkland. These statements involve known and unknown risks,
uncertainties and other factors that may cause actual results or events to differ materially from those anticipated in such forward-looking statements. No assurance can be given that these expectations will prove to be correct and such forward-looking statements included in this presentation
should not be unduly relied upon. These forward-looking statements speak only as of the date of this presentation. Parkland does not undertake any obligations to publicly update or revise any forward-looking statements except as required by securities law. Actual results could differ
materially from those anticipated in these forward-looking statements as a result of numerous risks and uncertainties including, but not limited to, general economic, market and business conditions; industry capacity; competitive action by other companies; refining and marketing margins; the
ability of suppliers to meet commitments; actions by governmental authorities and other regulators including but not limited to increases in taxes or restricted access to markets; changes and developments in environmental and other regulations; and other factors, many of which are beyond
the control of Parkland. See also the risks and uncertainties described in "Forward-Looking Information" and "Risk Factors" included in Parkland's Annual Information Form dated March 27, 2019 and in "Forward-Looking Information" and "Risk Factors" in the Q3 2019 Management’s
Discussion and Analysis (“Q3 2019 MD&A”), each as filed on SEDAR and available on the Parkland website at www.parkland.ca.
Additionally, readers are directed to, and encouraged to read, the 2019 Adjusted EBITDA Guidance Range section of Parkland's press release dated November 4, 2019 and material factors and assumptions contained therein. Parkland believes its estimation of annual Adjusted EBITDA based
on such information is reasonable, but no assurance can be given that this expectation will prove to be correct and such estimate should not be unduly relied upon. The forward-looking statements contained in this presentation are expressly qualified by this cautionary statement.
Financial Measures
This presentation refers to certain non-GAAP financial measures that are not determined in accordance with International Financial Reporting Standards ("IFRS"). Distributable cash flow per share, dividend payout ratio and adjusted dividend payout ratio are not measures recognized under
IFRS and do not have standardized meanings prescribed by IFRS. Management considers these to be important supplemental measures of Parkland's performance and believes these measures are frequently used by securities analysts, investors and other interested parties in the
evaluation of companies in its industries. See Section 13 of the Q3 2019 MD&A for a discussion of non-GAAP measures and their reconciliations to the nearest applicable IFRS measure. Adjusted EBITDA and adjusted gross profit are measures of segment profit. See Section 13 of the Q3
2019 MD&A and Note 20 of the Q3 2019 Interim Condensed Consolidated Financial Statements (“Q1 2019 FS”) for a reconciliation of these measures of segment profit. Annual Synergies is an annualized measure and is considered to be forward-looking information. See Section 13 of the Q3
2019 MD&A. Investors are encouraged to evaluate each measure and the reasons Parkland considers it appropriate for supplemental analysis.
Effective January 1, 2019, Parkland adopted the new accounting standard, IFRS 16 - Leases ("IFRS 16"). The adoption of IFRS 16 has a significant effect on Parkland's reported results. Due to Parkland's selected transition method, it has not restated its prior year comparatives. Certain
financial statement measures are presented excluding the impact of IFRS 16 ("Pre-IFRS 16 measures"). Refer to the Q3 2019 FS and Q3 2019 MD&A for reconciliations of Pre-IFRS 16 measures.
Investors are cautioned, however, that these measures should not be construed as an alternative to net earnings determined in accordance with IFRS as an indication of Parkland's performance. The forward-looking statements contained in this presentation are expressly qualified by this
cautionary statement.
Forward Looking Statement Disclaimer & Note on Non-GAAP Measures

3
Business MilestonesRecord third quarter 2019 results and increased guidance
• Increased Guidance to $1.24 billion
• Launch of JOURNIE™ Rewards & CIBC partnership
• Further capture of CST/Chevron synergies
• Tropic Oil acquisition
See End notes for further information

4
$302
$963
$0
$200
$400
$600
$800
$1,000
$1,200
2017 2018 2019 2017 2018 2019
Q3 YTD
YTD '1 9 YTD '1 8 Change
Adjusted EBITDA 963 602 361
Adjusted EBITDA pre-IFRS 1 6 871 -
Net Interest (1 57) (92) (65)
Total tax expense (1 50) (43) (1 07)
Maintenance capital (1 41 ) (1 35) (6)
Reverse: turnaround capital 0 75 (75)
Other (5) (1 4) 9
Adjusted distributable
cash flow41 8 393 25
Weighted average
shares outstanding (millions)1 47 1 32 1 5
Adjusted distributable
cash flow per share ($/shr)$2.84 $2.98 ($0.1 4)
Parkland posts another quarter of record resultsThree and nine months ended September 30, 2019
Adjusted EBITDA attributable to Parklandmillions
Adjusted Distributable Cash Flow attributable to Parkland$ millions
See End notes for further information

5
Q3 2019 vs. Q3 2018 Adjusted EBITDA highlights$ millionsAdjusted EBITDA attributable to Parkland Pre-IFRS 16 amounts attributable to Parkland
See End notes for further information
$200 $0
$8
$49
$17 $268
($3)
($3)
Q318 asreported
CanadaRetail
CanadaCommercial
USA Intl. Supply Corporate Q319Adj. EBITDAas reported
$200 $4 $2
$9
$63
$26 $302 ($2)
Q318 asreported
CanadaRetail
CanadaCommercial
USA Intl. Supply Corporate Q319Adj. EBITDAas reported

6
20,837
0
5,000
10,000
15,000
20,000
25,000
Q4 2017 Q1 2018 Q2 2018 Q3 2018 Q4 2018 Q1 2019 Q2 2019 Q3 2019
36%
0%
5%
10%
15%
20%
25%
30%
35%
40%
45%
Q4 2017 Q1 2018 Q2 2018 Q3 2018 Q4 2018 Q1 2019 Q2 2019 Q3 2019
4.3%
0.0%
1.0%
2.0%
3.0%
4.0%
5.0%
6.0%
7.0%
Q4 2017 Q1 2018 Q2 2018 Q3 2018 Q4 2018 Q1 2019 Q2 2019 Q3 2019
2.6x
0.0x
0.5x
1.0x
1.5x
2.0x
2.5x
3.0x
3.5x
4.0x
Q4 2017 Q1 2018 Q2 2018 Q3 2018 Q4 2018 Q1 2019 Q2 2019 Q3 2019
Other Corporate HighlightsConsistent KPI’s and continued growth in Fuel and petroleum product volume
Total Funded Debt to Credit Facility EBITDA Ratio (TTM)(j) Trailing twelve month Fuel and petroleum product volume (ML)
Corporate MG&A(f) as a % of Consolidated Adjusted Gross ProfitAdjusted Dividend Payout Ratio(h)
See End notes for further information

7
Q3 '1 9 Q3 '1 8 Change YTD '1 9 YTD '1 8 Change
Adjusted EBITDA ($mm) $91 $87 $4 ✓ $227 $238 ($1 1 )
Fuel and petroleum product
volume (ML)1 ,831 1 ,852 (21 ) 5,1 72 5,1 63 9 ✓
KPI
NUOC (TTM, cpl)(a) 3.01 3.32 (0.31 ) ✓
Company volume SSSG(b) (0.3%) (0.9%) 0.6p.p. ✓ 1 .0% (1 .5%) 2.5p.p. ✓
Company c-store SSSG(c) 0.9% 5.6% (4.7p.p.) 3.8% 5.3% (1 .5p.p.)
Fuel and petroleum product
adjusted gross profit (cpl)7.65 7.78 (0.1 3) 7.33 7.88 (0.55)
Operating costs (cpl) 4.1 5 4.32 (0.1 7) ✓ 4.22 4.61 (0.39) ✓
MG&A (cpl) 0.76 0.81 (0.05) ✓ 0.91 0.85 0.06
Operations overview: Canada RetailContinuing to enhance our customer value proposition
• Increasing non-fuel gross profit margin
• Continued decrease in net unit operating cost (breakeven)
• Launched JOURNIE™ Rewards with CIBC as strategic banking partner
• Area of focus: Continue rollout of On-the-Run and JOURNIE™ loyalty program
See End notes for further information
8
Q3 '1 9 Q3 '1 8 Change YTD '1 9 YTD '1 8 Change
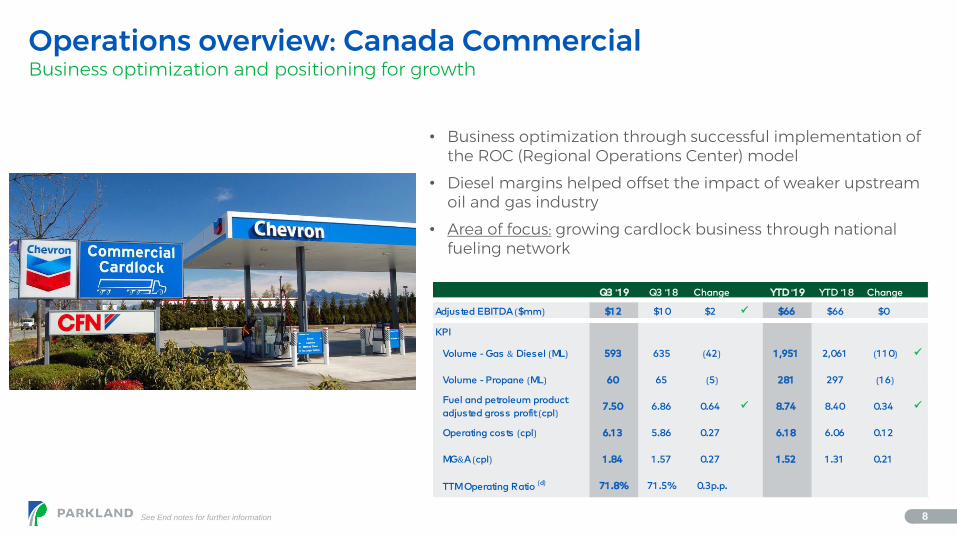
Adjusted EBITDA ($mm) $1 2 $1 0 $2 ✓ $66 $66 $0
KPI
Volume - Gas & Diesel (ML) 593 635 (42) 1 ,951 2,061 (1 1 0) ✓
Volume - Propane (ML) 60 65 (5) 281 297 (1 6)
Fuel and petroleum product
adjusted gross profit (cpl)7.50 6.86 0.64 ✓ 8.74 8.40 0.34 ✓
Operating costs (cpl) 6.1 3 5.86 0.27 6.1 8 6.06 0.1 2
MG&A (cpl) 1 .84 1 .57 0.27 1 .52 1 .31 0.21
TTM Operating Ratio (d) 71 .8% 71 .5% 0.3p.p.
Operations overview: Canada CommercialBusiness optimization and positioning for growth
• Business optimization through successful implementation of the ROC (Regional Operations Center) model
• Diesel margins helped offset the impact of weaker upstream oil and gas industry
• Area of focus: growing cardlock business through national fueling network
See End notes for further information
9
Q3 '1 9 Q3 '1 8 Change YTD '1 9 YTD '1 8 Change
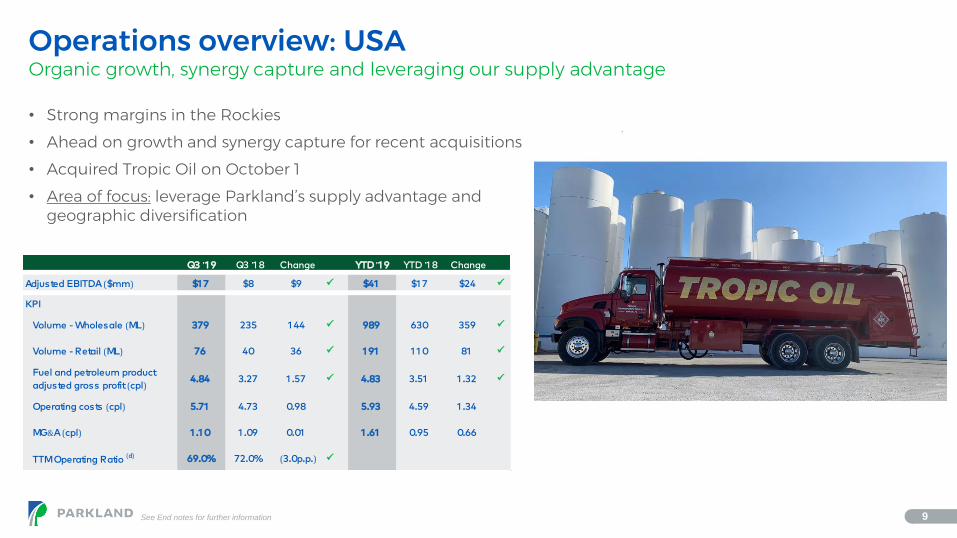
Adjusted EBITDA ($mm) $1 7 $8 $9 ✓ $41 $1 7 $24 ✓
KPI
Volume - Wholesale (ML) 379 235 1 44 ✓ 989 630 359 ✓
Volume - Retail (ML) 76 40 36 ✓ 1 91 1 1 0 81 ✓
Fuel and petroleum product
adjusted gross profit (cpl)4.84 3.27 1 .57 ✓ 4.83 3.51 1 .32 ✓
Operating costs (cpl) 5.71 4.73 0.98 5.93 4.59 1 .34
MG&A (cpl) 1 .1 0 1 .09 0.01 1 .61 0.95 0.66
TTM Operating Ratio (d) 69.0% 72.0% (3.0p.p.) ✓
Operations overview: USAOrganic growth, synergy capture and leveraging our supply advantage
• Strong margins in the Rockies
• Ahead on growth and synergy capture for recent acquisitions
• Acquired Tropic Oil on October 1
• Area of focus: leverage Parkland’s supply advantage and geographic diversification
See End notes for further information

10
Q2 '1 9 YTD '1 9
Adjusted EBITDA ($mm) $63 $208
KPI
Volume - Retail (ML) 458 1 ,351
Volume - Commercial
& Other (ML)746 2,1 86
Fuel and petroleum product
adjusted gross profit (cpl)1 0.22 1 0.91
Operating costs (cpl) 3.57 3.65
MG&A (cpl) 2.24 2.09
Operations overview: InternationalVolume growth, synergy capture and cost control
• Stronger than expected volumes despite seasonally low quarter
• Focus on synergy capture and cost control
• Business performing ahead of initial expectations
• Area of focus: Organic growth and leveraging Parkland’s supply advantage
Comparative information not available
See End notes for further information

11
Q3 '1 9 Q3 '1 8 Change YTD '1 9 YTD '1 8 Change
Adjusted EBITDA ($mm) $1 47 $1 21 $26 ✓ $506 $362 $1 44 ✓
KPI
Crude throughput (000’s bpd) 52.9 53.7 (0.8) 51 .9 40.8 1 1 .1 ✓
Refinery Utilization (e) 96.2% 97.7% (1 .5p.p.) 94.4% 74.1 % 20.3p.p. ✓
Operations overview: SupplyHigh refinery utilization and reliability, strong logistics performance
• High refinery utilization enabled capture of strong refining margins
• Supply and Distribution & Elbow River Marketing supporting integrated margins
• Co-processing establishes Parkland as a leader in low-carbon fuel refining
• Area of focus: Preparing for Q1 2020 turnaround, HDRD blending, and continuing to build supply capability
See End notes for further information

12
Increased 2019 Adjusted EBITDA Guidance Range
$1,240 million ± 5%Adjusted EBITDA attributable to ParklandIncreased from $1,165 million ± 5%
$420 millionTotal Capital expenditures $220 million of growth capital (increase from $200 million)$200 million of maintenance capital
See End notes for further information

13
Questions?

14
0%
50%
100%
150%
200%
250%
9/2016 12/2016 3/2017 6/2017 9/2017 12/2017 3/2018 6/2018 9/2018 12/2018 3/2019 6/2019 9/2019
Rolling average A relative indicator to be used in conjunction with operational metrics
Appendix: Indicative crack spread5-3-1-1 Generic Vancouver Crack: estimated actual indexed vs. 3-year average
See End notes for further information

15
End NotesEffective January 1, 2019, Parkland adopted the new accounting standard, IFRS 16 - Leases ("IFRS 16"). The adoption of IFRS 16 has a significant effect on Parkland's reported results. Due to Parkland's selected transition method, it has not restated its prior year comparatives. Certain financial statement measures are presented excluding the impact of IFRS 16 ("Pre-IFRS 16 measures"). Refer to the Q3 2019 FS and Q3 2019 MD&A for reconciliations of Pre-IFRS 16 measures.
Slide 4-12Adjusted EBITDA (“Adj. EBITDA”) and Adjusted Distributable Cash Flow in this presentation refers to the portion attributable to Parkland, and excludes to portion attributable to non-controlling interest (“NCI”)
Adjusted EBITDA is a measure of segment profit as outlined in Section 12 of the Q3 2019 MD&A.
Adjusted Distributable Cash Flow is a non-GAAP measure used to monitor core distributable cash flows of the business without the impact of expenditures used in acquisitions, integration and other activities, which fluctuate significantly.Refer to Section 12 of the Q3 2019 MD&A for more information.
Adjusted gross profit is a measure of segment profit as reported in Section 12 of the Q3 2019 MD&A.
Slide 4: Parkland posts another quarter of record results
“Net interest” includes interest on long term debt and interest income. “Net tax expense” includes income tax expense from the consolidated statements of income and deferred taxes in the consolidated statements of cash flows. “Other” includes, but is not limited to, minor asset disposals, cash expenditures on ARO, and NCI tax impacts.
Slide 9: Operations overview: USA
Acquired all of the issued and outstanding equity interests of Tropic Oil Company, Inc., as well as equity interests and the assets of certain of its affiliates (collectively, “Tropic Oil”), as outlined in our press dated September 5, 2019.
Slide 12: 2019 Outlook & Guidance RangeSee Parkland’s press release dated November 4, 2019 for more additional information, including material factors and assumptions related to the 2019 Guidance Range
Slide 14: Indicative crack spreadWhile not the actual crack spreads experienced by our Burnaby Refinery, the 5-3-1-1 Generic Vancouver Crack spread can serve as a reasonable proxy for the Vancouver Crack, and should provide investors with a reasonable benchmark for comparison to their own crack spread computations. We continue to refine this indicative spread to be more in-line with our actual performance at the Burnaby refinery, and it now reflects more specific input costs of Edmonton Par and Syncrude. The index plots historical values against the three year average
Illustrative proxy for generic Vancouver Crack Spread based on Supply of 5 barrels of crude (4 barrels of Edmonton Light and 1 Barrel of Syncrude) plus transportation costs); Products are Vancouver Rack pricing for 3 barrels of gasoline and 1 barrel ofdiesel plus 1 barrel of Jet fuel (L.A.). Source: Bloomberg (Bloomberg codes): CL1 Comdty, CIL1 Index, USCRSYNC Index, MOGPV87R Index, CRUMVNAG Index, JETFLAPL Index)
KPI EndnotesSee section 12 of the Q3 2019 MD&A for more information.
a) Net Unit Operating Cost (“NUOC”) TTM: This metric represents the fuel gross margin required (per litre) for the Retail business unit to break-even. It is calculated using data specific to the Retail business unit: (Operating Cost + MG&A – Non-Fuel Adjusted Gross Profit) / Fuel & petroleum product volume on a trailing-twelve- month basis.
b) Company Volume Same Store Sales Growth (“SSSG”): Derived by comparing the current year volume of active sites to the prior year volume of comparable sites.
c) Company C-Store Same Store Sales Growth (“SSSG”): Derived from comparing the current year Point-of-Sale (“POS”, i.e. cash register) of active sites to the prior year POS sales of comparable sites. See Section 12 of the Q3 2019 MD&A for more information. Excludes results of sites acquired under the Chevron Acquisition
d) TTM Operating Ratio: This metric represents expenses as a percentage of gross profit for the business segment. It is calculated as: (Operating Cost + MG&A) / (Adjusted Gross Profit) on a trailing-twelve-month basis.
e) Refinery Utilization: Refinery utilization is a key performance indicator that measures crude oil throughput and is expressed as a percentage of the 55,000 bpd total crude distillation capacity at the Burnaby Refinery. Crude oil throughput does not reflect the processing of intermediary products and bio-fuels.
f) Corporate MG&A: Represents Parkland’s Corporate Marketing, General and Administration expenses.
g) Dividend Payout Ratio: The dividend payout ratio is calculated as dividends divided by distributable cash flow. See Section 5 of Parkland’s most current MD&A for reconciliation.
h) Adjusted Dividend Payout Ratio: The adjusted dividend payout ratio is calculated as dividends divided by adjusted distributable cash flow. See Section 5 of Parkland’s most current MD&A for reconciliation.
i) Adjusted Distributable Cash Flow Per Share: The adjusted distributable cash flow per share is calculated as adjusted distributable cash flow divided by the weighted average number of common shares. See Section 5 of Parkland’s most current MD&A for reconciliation.
j) Total Funded Debt to Credit Facility EBITDA Ratio TTM: This metric represents the total funded debt as a percentage of Credit Facility EBITDA. It is calculated using the TTM results as follows: (Senior funded debt + Senior unsecured notes) / Credit Facility EBITDA.
k) Total Recordable Injury Frequency (“TRIF”) TTM: Industry measure of health and safety that provides the total recordable incidents that occurred within a given period relative to a standardized number of hours worked. This metric is calculated by multiplying the number of total recordable incidents by 200,000, divided by the total number of employee hours worked.