Embed Size (px)
Citation preview

THIRD QUARTER 2014 RESULTS13 NOVEMBER 2014
LUCA BETTONTE, CEO
2
DISCLAIMER
This document contains certain forward-looking information that is subject to a number of factors that may influence the accuracy of the statements and the projections upon which the statements are based.There can be non assurance that the projections or forecasts will ultimately prove to be accurate; accordingly, the Company makes no representation or warranty as to the accuracy of such information or the likelihood that the Company will perform as projected.

3
AGENDA
3Q 2014 Highlights✓ Key Figures
Results Review✓ Business Environment✓ 3Q 2014 Group EBITDA✓ Results by Segments
Key Financials✓ Profit & Loss✓ Investments ✓ Cash Flow Statement
2014 Guidance and ConclusionsAppendix

4
RC Ebitda Adj (€ mn)
HIGHLIGHTS: KEY FIGURESRC Net Profit (€ mn)
Strong bottom line and reduction in NFP
POWER
RENEWABLES
INTEGRATED DOWNSTREAM
CORPORATE
437
275
201
(2) (22)3613(6)
9M 20133Q 2014
9M 2014 3Q 2013
143
183
186
(19)35
35100
5218(5)
9M 20133Q 2014
36
11
9M 2014 3Q 2013
Highlights
Leverage
DERIVATIVES
ADJ. NFP EXCL. DERIVATIVES
34%
26%
640
30/09/2014
446
194
868
147
31/12/2013
1,015
400
100
75
12
Adj NFP (€ mn)

5
RESULTS REVIEW
CFO
PAOLO MERLI

6
BUSINESS ENVIRONMENT
3Q 2013 4Q 2013 1Q 2014 2Q 2014 3Q 2014
ITALIAN PRICE ZONAL PRICE SICILY CIP6
Electricity Prices (€/MWh)
116
100103
66
Results Review
3Q 2013 4Q 2013 1Q 2014 2Q 2014 3Q 2014
Renewables: Electricity Prices (€/MWh)
155
148
90 91
97 96
(1) Italian price is theoretical price based on National Average Electricity Price (PUN) + GC
94
80
FRANCE ITALY BULGARIA GERMANY ROMANIA(1)
95
50 95
3Q 2013 4Q 2013 1Q 2014 2Q 2014 3Q 2014
Industry Retail Fuels Volumes (M tons)
5.935.82
3Q 2013 4Q 2013 1Q 2014 2Q 2014 3Q 2014
EMC Margin ($/bbl)
(3.45)
(0.5)
97

7
1,292
3Q 2013
14316
4
(65)
1
Power(1)Renewables Integrated Downstream Corporate 3Q 2014
100
3Q 2014 GROUP EBITDA
Improved results in Renewables
Decrease in Power figures due to ISAB Energy plant disposal
Results Review
(1) ISAB Energy EBITDA in 3Q13 was at €73mn, while in 3Q14 it is at €2mn (related to price adjustements in 1H14 productions)

8
RC Ebitda (€ mn)
RENEWABLES RESULTS
1,809
Volumes (GWh)
5
170
Results Review
4
(1) LUKERG: ERG ‘s stake = 50% in Bulgaria and Romania
7
ERG Wind
14
870
ERG Wind
409
60
330
27170
ERG Wind
186
36
31
2
ERG Wind
92
ITALY FRANCE LUKERG(1)GERMANY
84
32
103
20
21
1,561
3Q 2013
9M 2013
3Q 2014
9M 2014
3Q 2013
9M 2013
3Q 2014
9M 2014
Higher production both in Italy and abroad
1,948
1,570
187
90102
443
18 5625
542
90
ERG Wind
214
ERG Wind
201
52
6
178
10
8
47
13
1
837
ERG Wind
21
ERG Wind

9
RC Ebitda (€ mn)
POWER RESULTS
Volumes (GWh)
Strong ERG Power results
ISAB Energy plant disposal effective as of July, 1Results Review
80 80
27 33
195
102
73
2
ERG POWERISAB ENERGY
183
100
9M 2013
3Q 2013
9M 2014
3Q 2014
275
35
3,963
9M 2013
3Q 2013
5,213
736
1,790
9M 2014
3Q 2014
2,042
1,921
736
3,219
1,9941,109
681

(10) (6)2 3
5 4
3 2
(2)
35
1318
(37)
(10)
3936
18
15
10
RC Ebitda (€ mn)
INTEGRATED DOWNSTREAM RESULTS
TOTALERG Market Share (%)
Still tough environment in Marketing
11.2%
10.4%
Results Review
RC Ebitda (€ mn)
1Q 20143Q 2013 4Q 2013 2Q 2014 3Q 2014
Refining: processed Volumes(2) (k tons)
1,009 1,071340 389
1,668
640
2,677
980
(1) TOTALERG Refining EBITDA includes Logistics(2) Volumes relate to 100% of TOTALERG stake in Sarpom (24%)
TOTALERG REFININGCOASTAL REFINING
TOTAL INTEGRATED DOWNSTREAMTOTALERG REFININGTOTALERG MARKETINGEOSERG SUPPLY & TRADINGCOASTAL REFINING
(1)
9M 20133Q 2013
9M 20143Q 2014
9M 20133Q 20139M 2014
3Q 2014
389
1,071
0.7
(1.4)

11
KEY FINANCIALS

12
PRO-FORMA REPLACEMENT COST P&L
Note: figures based on NO GAAP measures
Key Financials
9M 2014 9M 2013 Euro millions 3Q 2014 3Q 2013
400 437 RC Adjusted EBITDA 100 143
(182) (215) Amortization and depreciation (52) (72)
218 221 RC Adjusted EBIT 48 71
(60) (64) Net financial income (expenses) (25) (17)
3 4 Net income (loss) from equity investments (0) 1
161 161 RC Results before taxes 23 55
(61) (82) Income taxes (10) (28)
100 79 RC Results for the period 12 27
(25) (43) Minority interests (0) (17)
75 36 RC Net profit 12 11

13
ADJUSTED INVESTMENTS
Key Financials
CORPORATEINTEGRATED DOWNSTREAMRENEWABLESPOWER
(2)(1)
27 2310 7
119
2945
16
15
10 5
3
64
9M 20133Q 2013
(€ mn)
9M 20143Q 2014
162
60
1 2
(3)
(4)
(1) Renewables adjusted for LUKERG Renew (50%)(2) Integrated Downstream adjusted for TOTALERG (51%)(3) It includes investment for the acquisition of Gebeleisis (ca. €55mn) and Hrabrovo (ca. €9mn)(4) It includes investment for the acquisition of Hrabrovo (ca. €9mn)
28
0.31

14
41%
26%
18%
Adj. Net Debt
30/06/2014
Cash Flowfrom operation
WorkingCapital
CAPEX Financial Charges
Adj. Net Debt
30/09/2014
NFP 51% TotalErg and
50% LUKERG Renew
Net Debt30/09/2014reported
Leverage
3Q 2014 ADJUSTED CASH FLOW STATEMENT
(253)
Taxesand Other
Key Financials
(100)
387
1,234
18
25
(515)
Cash-in from CIP6
early termination
640
(50) 28
15
2014 GUIDANCE AND CONCLUSIONS
CEO
LUCA BETTONTE

16
400
9M 2014
2014 GUIDANCE AND CONCLUSIONS
2014 FCST
64
LIQUIDITY PF OTHER AT MLT
640
RENEWABLES CORPORATEIDPOWER
9M 20142014 FCST
9M 20142014 FCST
EBITDA:
CAPEX:
NFP:
✓Like-for-like growth driven by Renewables and exit from
Coastal Refining
✓Guidance revised downward for optimization in the
Downstream segment
✓CAPEX consistent with 2013-2015 Business Plan
✓New Business Plan under definition
Group’s transformation still ongoing
≈470
≈100
≈700
✓Guidance updated from ≈800 to ≈700

17
APPENDIX

18
1,292
9M 2013
43715 (93)
37 4
PowerRenewables Corporate 9M 2014
400
9M 2014 GROUP EBITDA
Appendix
Integrated Downstream

19
640
34%
26%
18%
Adj. Net Debt
31/12/2013
Cash Flowfrom
operation
WorkingCapital
CAPEX Financial Charges
Adj. Net Debt
30/09/2014
NFP 51% TotalErg and
50% LUKERG Renew
Net Debt30/09/2014reported
Leverage
9M 2014 ADJUSTED CASH FLOW STATEMENT
(253)
Capital Increase
Dividends Acquisition 49% IE/IES
(358)
1,799
1,015
143
Disposal IE plant to
ISAB
1,234
1,041
72
153
Appendix
(515)
Dividends to
minorities
Taxesand Other
22
(26)
Cash-in from CIP6
early termination
6460
387
(50) 60

20
9M AND 3Q 2014 RESULTS
Appendix
9M 2014 9M 2013 Euro millions 3Q 2014 3Q 2013
3,411 7,525 Adjusted Revenues 1,081 2,762
400 437 RC EBITDA Adjusted 100 143
201 186 - Renewables 52 36
183 275 - Power 35 100
35 (2) - Integrated Downstream 18 13
(19) (22) - Corporate (5) (6)

21
9M 2014 9M 2013 3Q 2014 3Q 2013
1,341 1,265 Installed capacity (end-period, MW) 1,341 1,265
of which:
1,087 1,053 - Italy 1,087 1,053
86 86 - Germany 86 86
64 64 - France 64 64
27 27 - Bulgaria (1) 27 27
77 35 - Romania (1) 77 35
1,948 1,809 Electricity Production (GWh) 542 409
of which:
1,570 1,561 - Italy 443 330
102 103 - Germany 25 27
90 84 - France 18 20
45 40 - Bulgaria (1) 14 12
141 21 - Romania (1) 43 21
RENEWABLES: KEY FIGURES (1/2)
Appendix(1) ERG ‘s stake = 50%

22
9M 2014 9M 2013 Euro millions 3Q 2014 3Q 2013
RC EBITDA:
178 170 Italy 47 31
8 7 Germany 1 2
6 5 France 1 1
10 4 LUKERG (1) 3 2
of which:
3 3 - Bulgaria (1) 1 1
7 1 - Romania (1) 2 1
201 186 Total RC EBITDA 52 36
(97) (94) Depreciation (32) (31)
104 92 RC EBIT 19 5
Appendix(1) ERG ‘s stake = 50%
RENEWABLES: KEY FIGURES (2/2)

23
ISAB ENERGY: KEY FIGURES
Appendix
9M 2014 9M 2013 3Q 2014 3Q 2013
2,042 3,219 Sales (GWh) 0 1,109
250 481 Sales (€ mn) 5 169
102 195 RC EBITDA (€ mn) 2 73
77 158 RC EBIT (€ mn) 2 61
100 116 CIP6 tariffs (€/MWh) 100 116
60 128 EBITDA IT GAAP (€ mn) 2 49

24
ERG POWER: KEY FIGURES
Appendix
9M 2014 9M 2013 Euro millions 3Q 2014 3Q 2013
1,921 1,994 Electricity Production (GWh) 736 681
80 80 RC EBITDA 33 27
(22) (21) Depreciation (7) (7)
59 59 RC EBIT 26 20

25
INTEGRATED DOWNSTREAM: KEY FIGURES
Appendix
(1) Estimated market share referring to 100% of TOTALERG
9M 2014 9M 2013 Euro millions 3Q 2014 3Q 2013
35 (2) Adjusted RC EBITDA 18 13
30 29 - TOTALERG (51%) 17 20
4 5 - ERG Oil Sicilia 2 3
1 n.a. - ERG Supply & Trading (1) n.a.
n.a. (37) - Coastal Refining n.a. (10)
(36) (61) Adjusted Depreciation (12) (20)
(1) (63) Adjusted RC EBIT 6 (7)
23 27 Investments 7 10
10.7% 11.3% TOTALERG retail market share(1) 10.4% 11.2%
26
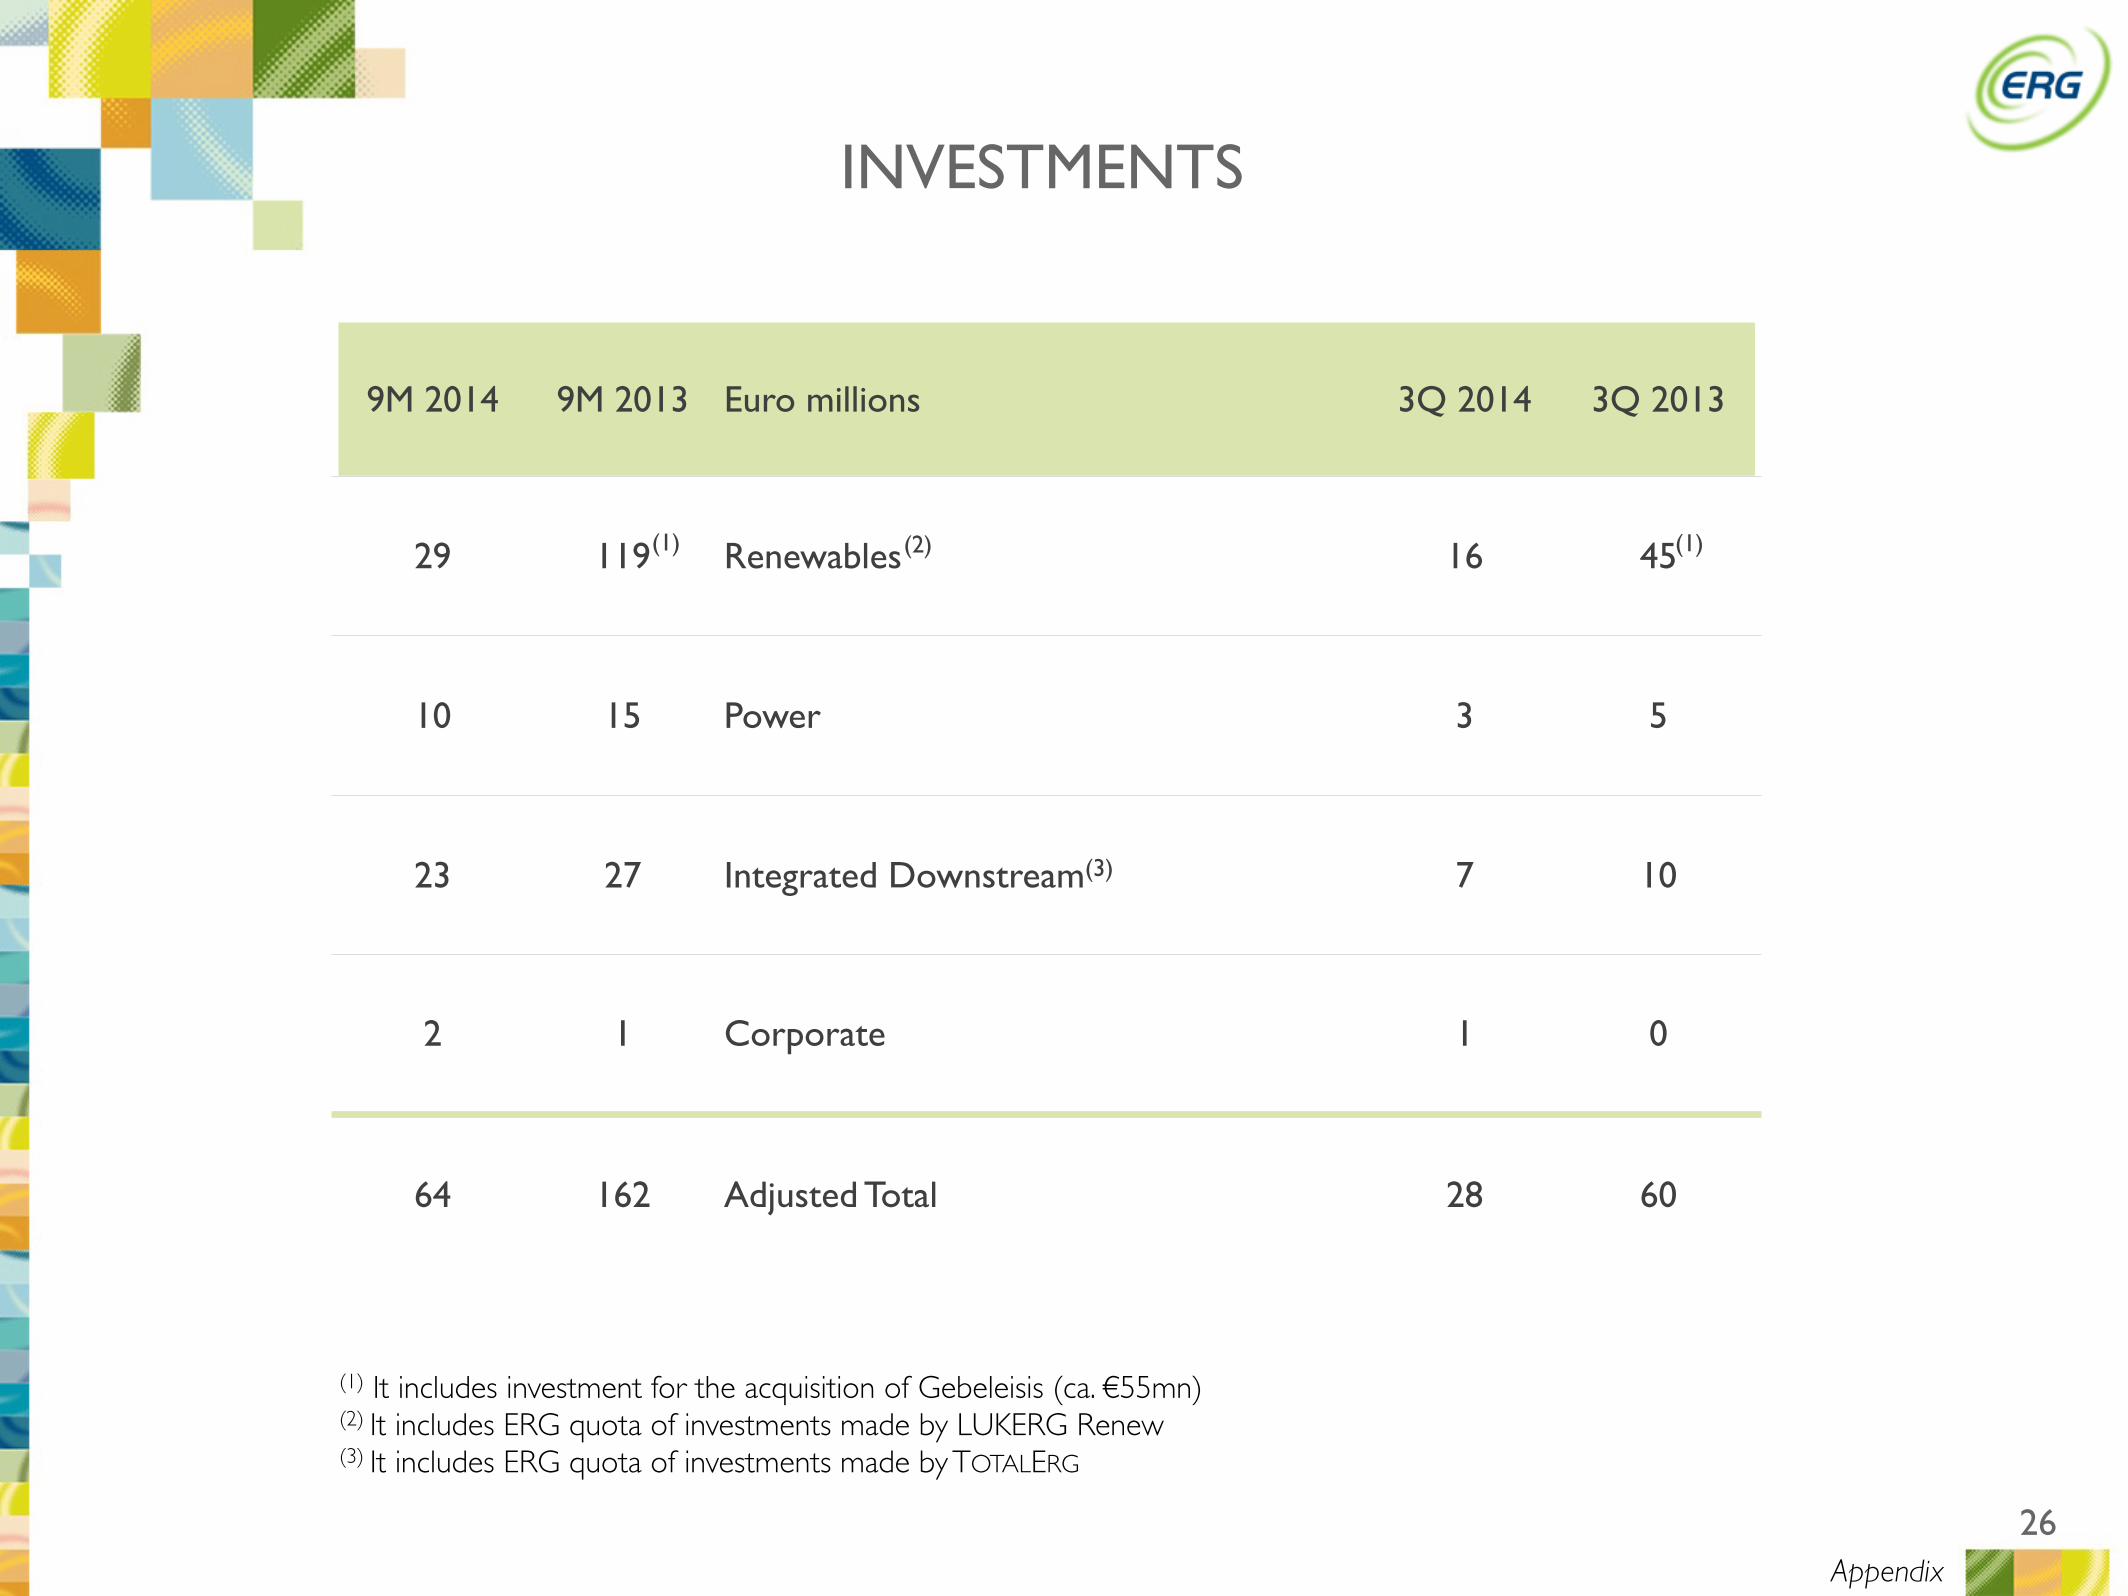
9M 2014 9M 2013 Euro millions 3Q 2014 3Q 2013
29 119 Renewables 16 45
10 15 Power 3 5
23 27 Integrated Downstream(3) 7 10
2 1 Corporate 1 0
64 162 Adjusted Total 28 60
INVESTMENTS
(1) It includes investment for the acquisition of Gebeleisis (ca. €55mn)(2) It includes ERG quota of investments made by LUKERG Renew(3) It includes ERG quota of investments made by TOTALERG
(1) (2)
Appendix
(1)