Embed Size (px)
Citation preview
2017 Regional
Wage and Benefit Study:
Union County
Conducted by
Wendy Gradwohl, Ph.D.
Released September 2017
Sponsored by
Champaign, Clark, Logan, Madison and Union Counties
Union County Results
2
Table of Contents Executive Summary ....................................................................................................................................... 4
Research Objectives ...................................................................................................................................... 6
Methodology ................................................................................................................................................. 6
Analysis of Benefit Data ................................................................................................................................ 6
Company Information ............................................................................................................................... 7
Contact Information .............................................................................................................................. 7
Organization Name ............................................................................................................................... 7
Type of Firm .......................................................................................................................................... 7
Size of Firm ............................................................................................................................................ 8
Organizations’ Union Profile ................................................................................................................. 8
Average Employee Tenure (i.e., Number of Years with the Company) ................................................ 9
Pre-employment Processes ...................................................................................................................... 9
Where Organizations Post Job Openings .............................................................................................. 9
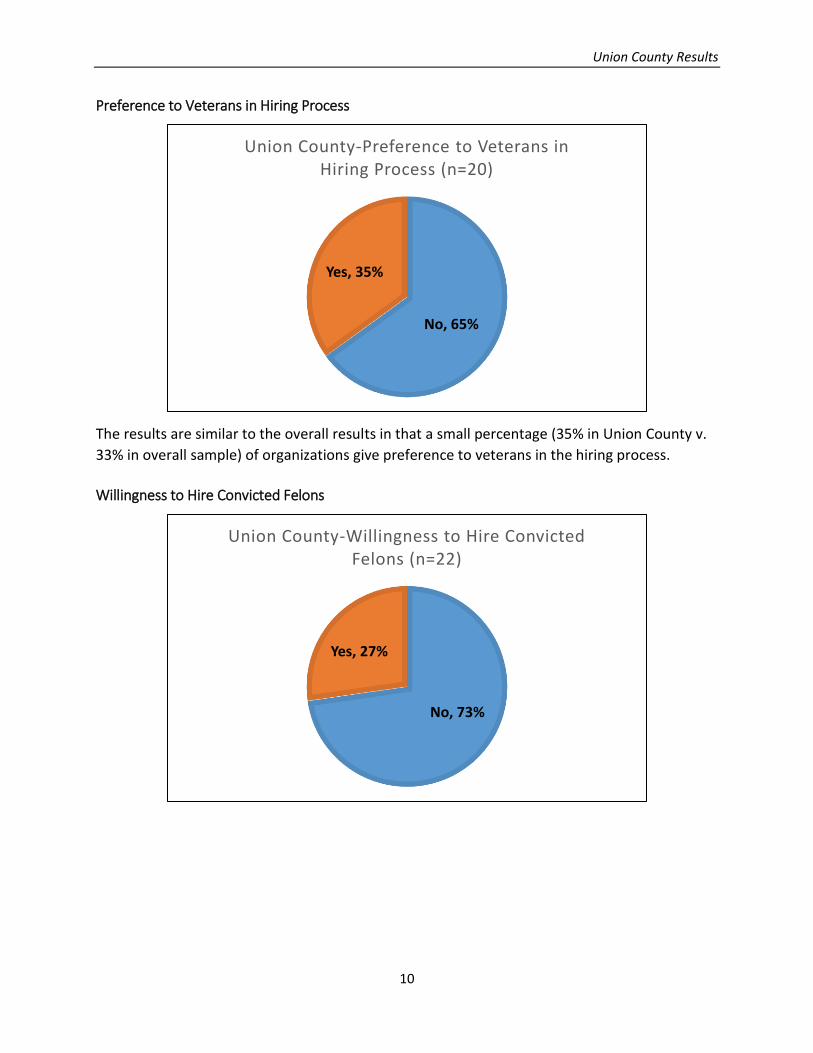
Preference to Veterans in Hiring Process ........................................................................................... 10
Willingness to Hire Convicted Felons .................................................................................................. 10
Conditions Under Which Organization Would Hire a Convicted Felon .............................................. 11
Background Check ............................................................................................................................... 11
Credit Check ........................................................................................................................................ 12
Drug and/or Alcohol Testing ............................................................................................................... 12
Second Chance Policy for Drug and/or Alcohol Violations ................................................................. 13
Job Shadowing .................................................................................................................................... 13
Apprenticeships .................................................................................................................................. 14
Internships .......................................................................................................................................... 14
Type of Individual Organizations are Likely to Hire as Intern ............................................................. 15
Insurance ................................................................................................................................................. 16
Does organization offer a Flexible Spending Account? ...................................................................... 16
Does organization offer a Health Reimbursement Account? ............................................................. 16
If organization offers a Health Reimbursement Account (H.R.A.), what is the dollar amount per
coverage level contributed by the organization? ............................................................................... 17
Does organization offer a Health Savings Account? ........................................................................... 17
If organization offers a Health Savings Account (H.S.A.), what is the dollar amount per coverage
level contributed by the organization? ............................................................................................... 17
Does organization offer traditional co-pay health insurance plans? .................................................. 18
Union County Results
3
Types of Traditional Health Insurance Coverage Plans ....................................................................... 18
If organization offers traditional health insurance plan, does it have a working spouse provision? . 19
Health Insurance Cost (i.e., annual total employer-paid premiums, as well as H.R.A. and H.S.A.
contributions, divided by the number of enrolled employees) per Employee per Year .................... 19
Average Percentage of Wages to provide Health Insurance Benefits (employer-paid premiums,
Health Reimbursement Account and Health Savings Account contributions) Per Employee per Year
............................................................................................................................................................ 20
Other Types of Insurance .................................................................................................................... 20
Benefits and Incentives ........................................................................................................................... 21
Retirement Plans ................................................................................................................................. 21
Organization’s Contribution to Retirement ........................................................................................ 21
Paid Time Off Plan ............................................................................................................................... 22
Average Number of Days Employees Receive in Paid Time Off by Years of Service (n=18) ............... 22
Oher Types of Paid Leave .................................................................................................................... 23
Incentives ............................................................................................................................................ 24
Does organization offer professional development or tuition reimbursement? ............................... 25
Does organization offer professional development? ......................................................................... 25
What is the maximum employer contribution toward professional development per employee per
year? .................................................................................................................................................... 25
Does organization offer tuition reimbursement? ............................................................................... 26
What is the maximum employer contribution toward tuition reimbursement per employee per
year? .................................................................................................................................................... 26
Average Percentage of Salary to Provide Fringe Benefits (insurance, retirement, paid time off, and
incentives) for Salary Employees Per Year .......................................................................................... 27
Average Percentage of Wages to Provide Fringe Benefits (insurance, retirement, paid time off, and
incentives) for Hourly Employees Per Year ......................................................................................... 27
Workers’ Compensation ..................................................................................................................... 28
Limitations .................................................................................................................................................. 28
Union County Results
4
Executive Summary
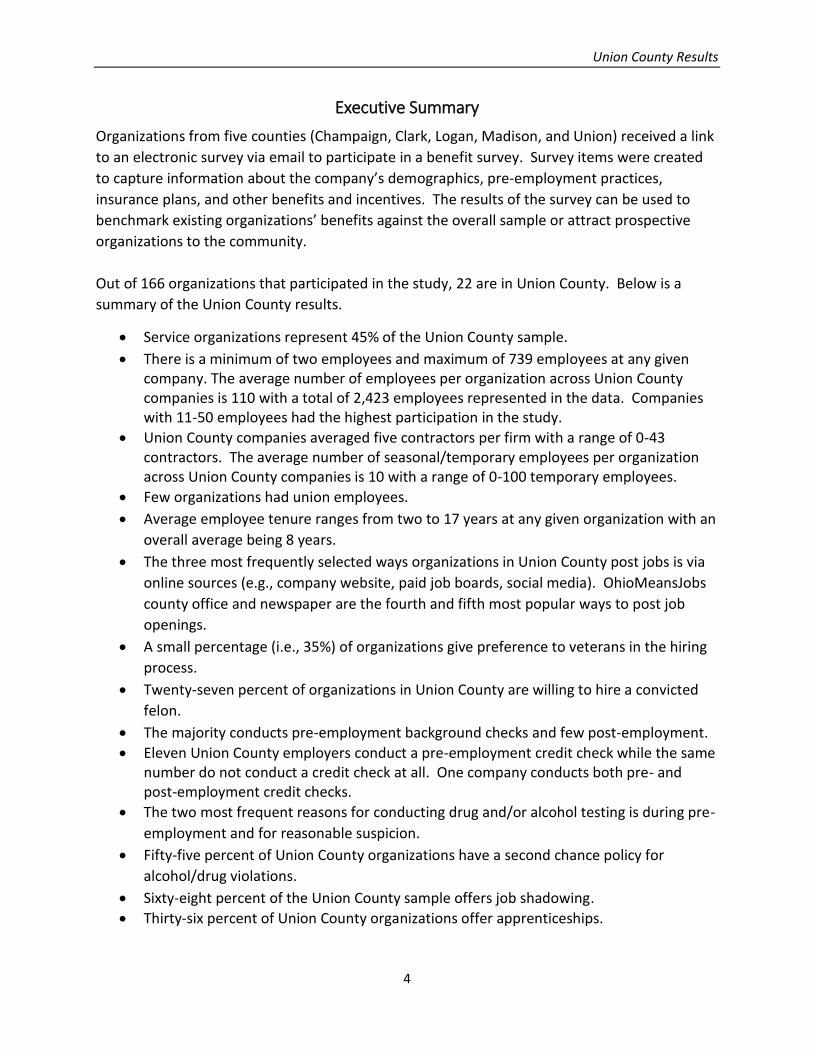
Organizations from five counties (Champaign, Clark, Logan, Madison, and Union) received a link
to an electronic survey via email to participate in a benefit survey. Survey items were created
to capture information about the company’s demographics, pre-employment practices,
insurance plans, and other benefits and incentives. The results of the survey can be used to
benchmark existing organizations’ benefits against the overall sample or attract prospective
organizations to the community.
Out of 166 organizations that participated in the study, 22 are in Union County. Below is a
summary of the Union County results.
Service organizations represent 45% of the Union County sample.
There is a minimum of two employees and maximum of 739 employees at any given company. The average number of employees per organization across Union County companies is 110 with a total of 2,423 employees represented in the data. Companies with 11-50 employees had the highest participation in the study.
Union County companies averaged five contractors per firm with a range of 0-43 contractors. The average number of seasonal/temporary employees per organization across Union County companies is 10 with a range of 0-100 temporary employees.
Few organizations had union employees.
Average employee tenure ranges from two to 17 years at any given organization with an
overall average being 8 years.
The three most frequently selected ways organizations in Union County post jobs is via
online sources (e.g., company website, paid job boards, social media). OhioMeansJobs
county office and newspaper are the fourth and fifth most popular ways to post job
openings.
A small percentage (i.e., 35%) of organizations give preference to veterans in the hiring
process.
Twenty-seven percent of organizations in Union County are willing to hire a convicted
felon.
The majority conducts pre-employment background checks and few post-employment.
Eleven Union County employers conduct a pre-employment credit check while the same number do not conduct a credit check at all. One company conducts both pre- and post-employment credit checks.
The two most frequent reasons for conducting drug and/or alcohol testing is during pre-
employment and for reasonable suspicion.
Fifty-five percent of Union County organizations have a second chance policy for
alcohol/drug violations.
Sixty-eight percent of the Union County sample offers job shadowing.
Thirty-six percent of Union County organizations offer apprenticeships.
Union County Results
5
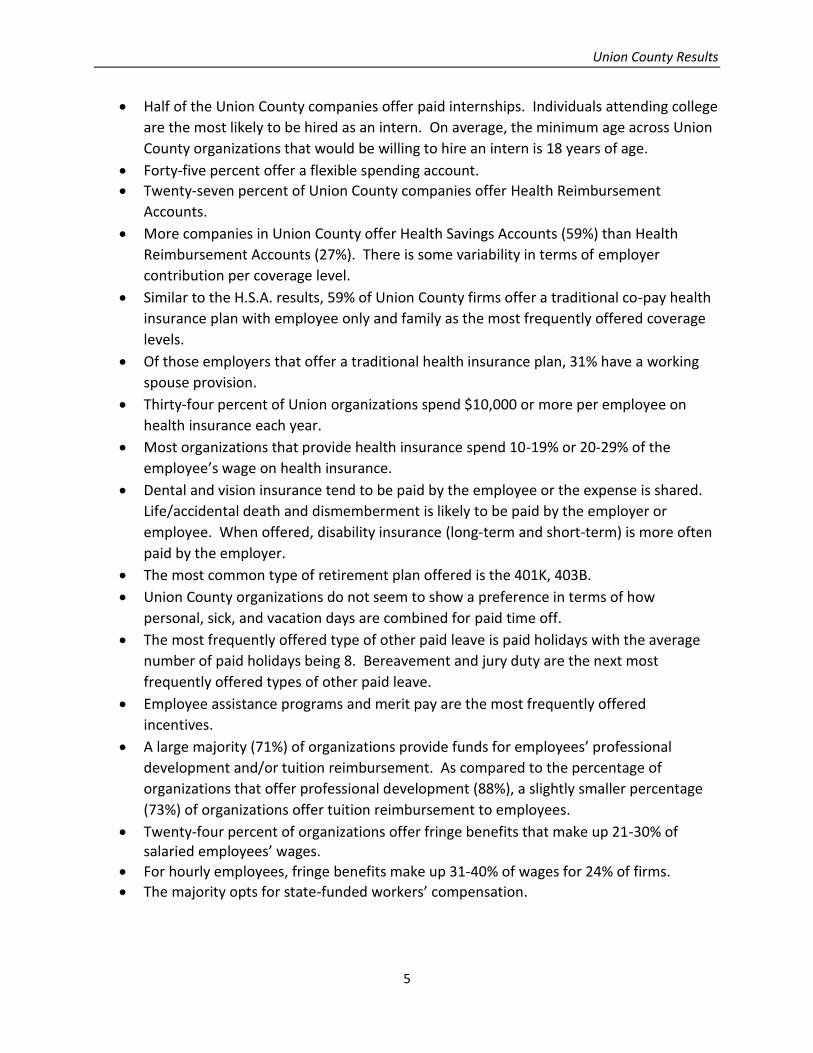
Half of the Union County companies offer paid internships. Individuals attending college
are the most likely to be hired as an intern. On average, the minimum age across Union
County organizations that would be willing to hire an intern is 18 years of age.
Forty-five percent offer a flexible spending account.
Twenty-seven percent of Union County companies offer Health Reimbursement
Accounts.
More companies in Union County offer Health Savings Accounts (59%) than Health
Reimbursement Accounts (27%). There is some variability in terms of employer
contribution per coverage level.
Similar to the H.S.A. results, 59% of Union County firms offer a traditional co-pay health
insurance plan with employee only and family as the most frequently offered coverage
levels.
Of those employers that offer a traditional health insurance plan, 31% have a working
spouse provision.
Thirty-four percent of Union organizations spend $10,000 or more per employee on
health insurance each year.
Most organizations that provide health insurance spend 10-19% or 20-29% of the
employee’s wage on health insurance.
Dental and vision insurance tend to be paid by the employee or the expense is shared.
Life/accidental death and dismemberment is likely to be paid by the employer or
employee. When offered, disability insurance (long-term and short-term) is more often
paid by the employer.
The most common type of retirement plan offered is the 401K, 403B.
Union County organizations do not seem to show a preference in terms of how
personal, sick, and vacation days are combined for paid time off.
The most frequently offered type of other paid leave is paid holidays with the average
number of paid holidays being 8. Bereavement and jury duty are the next most
frequently offered types of other paid leave.
Employee assistance programs and merit pay are the most frequently offered
incentives.
A large majority (71%) of organizations provide funds for employees’ professional
development and/or tuition reimbursement. As compared to the percentage of
organizations that offer professional development (88%), a slightly smaller percentage
(73%) of organizations offer tuition reimbursement to employees.
Twenty-four percent of organizations offer fringe benefits that make up 21-30% of salaried employees’ wages.
For hourly employees, fringe benefits make up 31-40% of wages for 24% of firms.
The majority opts for state-funded workers’ compensation.
Union County Results
6
Research Objectives
The main purpose of this research is to provide wage and benefit benchmarks for businesses in Champaign, Clark, Logan, Madison, and Union counties. By providing data on common benefits, incentives, and wage averages, businesses will be able to determine if they lag behind, match, or lead the market in terms of compensation practices. Employee turnover and productivity issues may be avoided if businesses are able to use this information to become more competitive in attracting and retaining reliable and effective employees. In addition, the information provided by the data in this report should assist economic development in our communities. Having knowledge of the competitive market may result in a more beneficial strategy to attract new businesses to the area and spur the growth of economic development.
Methodology
A detailed explanation is provided in the Overall Results.
Analysis of Benefit Data
Excel was used to analyze the survey data. The data were screened for missing data and data entry errors. Respondents were contacted if data were missing (e.g., indicated paid holidays as a benefit but didn’t provide the average number of paid holidays provided). Not all organizations that were contacted responded, even after repeated attempts. In addition, variables with responses outside the expected range were either corrected or considered outliers and deleted from analyses. For example, the PTO portion of the survey asked respondents to indicate the number of paid days off that employees were given. Some respondents answered the question in hours; these companies were contacted and the data were changed from hours to days. If the contact person could not be reached the responses for that item were not included in analyses. Thus, the number of responses (i.e., n-size) for each item will vary. Frequencies and/or descriptive statistics were then calculated for each survey item. For questions in which the organization could select more than one option, data is represented in terms of frequency count. For questions in which the organization could only select one option, data is represented in terms of percentage of organizations. Finally, it is important to note that the data comes from a self-selected non-probability sample. Thus, results should not be generalized to all organizations in Union County. Instead, data are only representative of those companies that responded to the survey.
Union County Results
7
Company Information
Contact Information
Information of who completed the questionnaire was useful when there was a need to clarify data.
Organization Name
The company name was collected but will remain confidential.
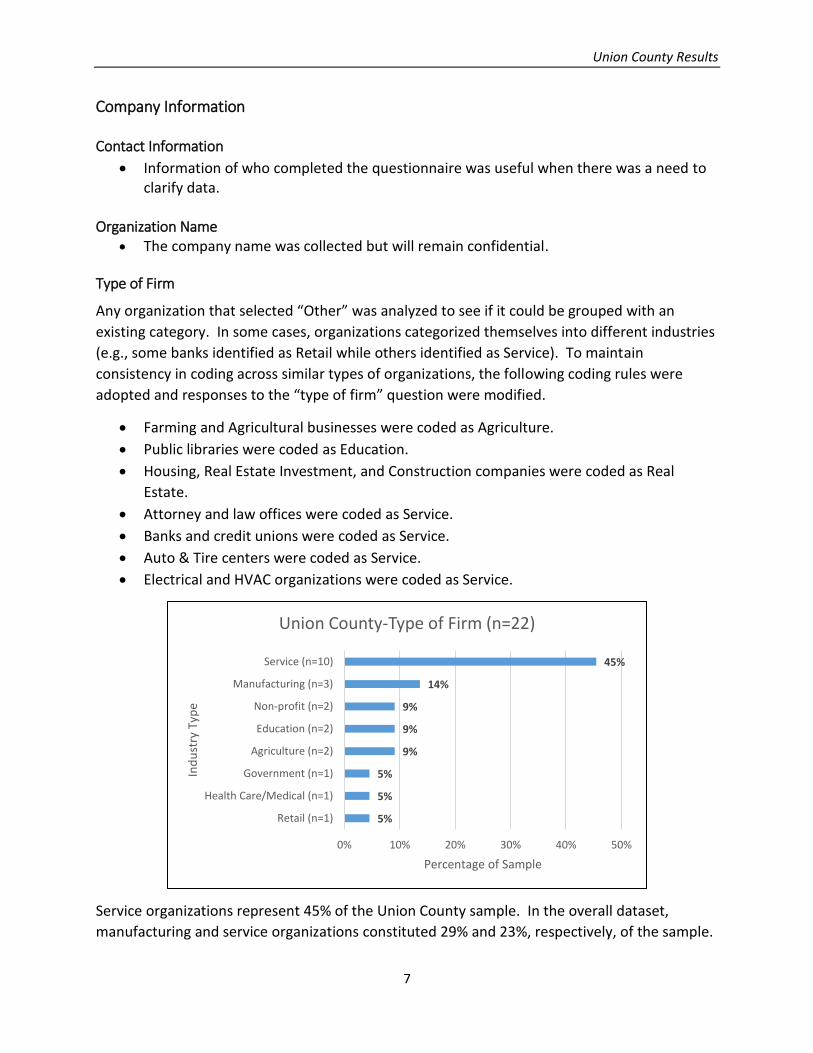
Type of Firm
Any organization that selected “Other” was analyzed to see if it could be grouped with an
existing category. In some cases, organizations categorized themselves into different industries
(e.g., some banks identified as Retail while others identified as Service). To maintain
consistency in coding across similar types of organizations, the following coding rules were
adopted and responses to the “type of firm” question were modified.
Farming and Agricultural businesses were coded as Agriculture.
Public libraries were coded as Education.
Housing, Real Estate Investment, and Construction companies were coded as Real
Estate.
Attorney and law offices were coded as Service.
Banks and credit unions were coded as Service.
Auto & Tire centers were coded as Service.
Electrical and HVAC organizations were coded as Service.
Service organizations represent 45% of the Union County sample. In the overall dataset,
manufacturing and service organizations constituted 29% and 23%, respectively, of the sample.
5%
5%
5%
9%
9%
9%
14%
45%
0% 10% 20% 30% 40% 50%
Retail (n=1)
Health Care/Medical (n=1)
Government (n=1)
Agriculture (n=2)
Education (n=2)
Non-profit (n=2)
Manufacturing (n=3)
Service (n=10)
Percentage of Sample
Ind
ust
ry T
ype
Union County-Type of Firm (n=22)
Union County Results
8
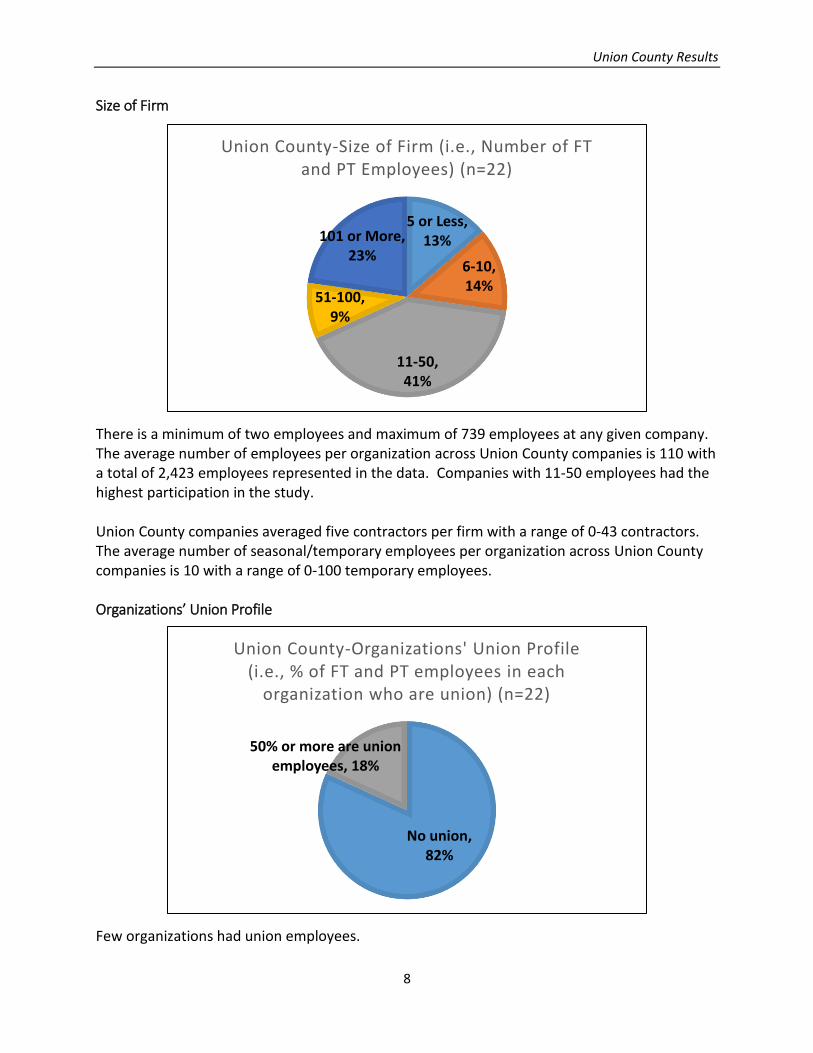
Size of Firm
There is a minimum of two employees and maximum of 739 employees at any given company. The average number of employees per organization across Union County companies is 110 with a total of 2,423 employees represented in the data. Companies with 11-50 employees had the highest participation in the study. Union County companies averaged five contractors per firm with a range of 0-43 contractors. The average number of seasonal/temporary employees per organization across Union County companies is 10 with a range of 0-100 temporary employees. Organizations’ Union Profile
Few organizations had union employees.
5 or Less,13%
6-10,14%
11-50,41%
51-100,9%
101 or More,23%
Union County-Size of Firm (i.e., Number of FT and PT Employees) (n=22)
No union, 82%
50% or more are union employees, 18%
Union County-Organizations' Union Profile (i.e., % of FT and PT employees in each
organization who are union) (n=22)
Union County Results
9
Average Employee Tenure (i.e., Number of Years with the Company)
Average employee tenure ranges from two to 17 years at any given organization with an overall
average being 8 years.
Pre-employment Processes
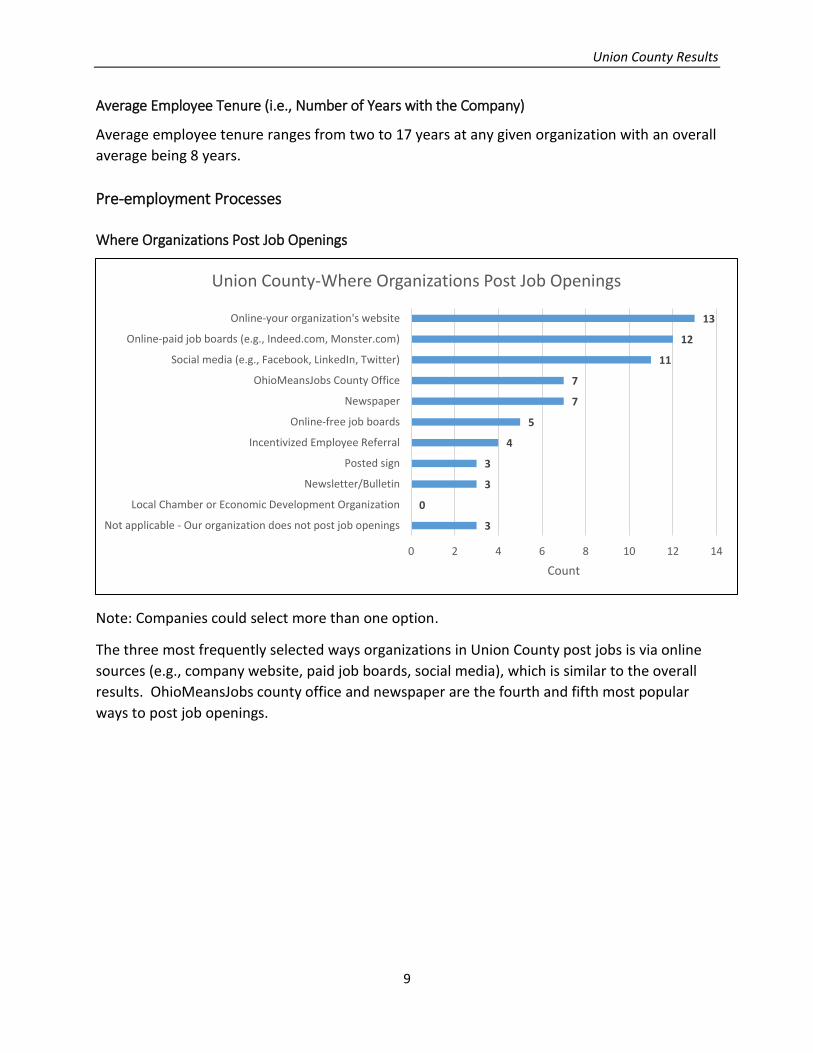
Where Organizations Post Job Openings
Note: Companies could select more than one option.
The three most frequently selected ways organizations in Union County post jobs is via online
sources (e.g., company website, paid job boards, social media), which is similar to the overall
results. OhioMeansJobs county office and newspaper are the fourth and fifth most popular
ways to post job openings.
3
0
3
3
4
5
7
7
11
12
13
0 2 4 6 8 10 12 14
Not applicable - Our organization does not post job openings
Local Chamber or Economic Development Organization
Newsletter/Bulletin
Posted sign
Incentivized Employee Referral
Online-free job boards
Newspaper
OhioMeansJobs County Office
Social media (e.g., Facebook, LinkedIn, Twitter)
Online-paid job boards (e.g., Indeed.com, Monster.com)
Online-your organization's website
Count
Union County-Where Organizations Post Job Openings
Union County Results
10
Preference to Veterans in Hiring Process
The results are similar to the overall results in that a small percentage (35% in Union County v.
33% in overall sample) of organizations give preference to veterans in the hiring process.
Willingness to Hire Convicted Felons
No, 65%
Yes, 35%
Union County-Preference to Veterans in Hiring Process (n=20)
No, 73%
Yes, 27%
Union County-Willingness to Hire Convicted Felons (n=22)
Union County Results
11
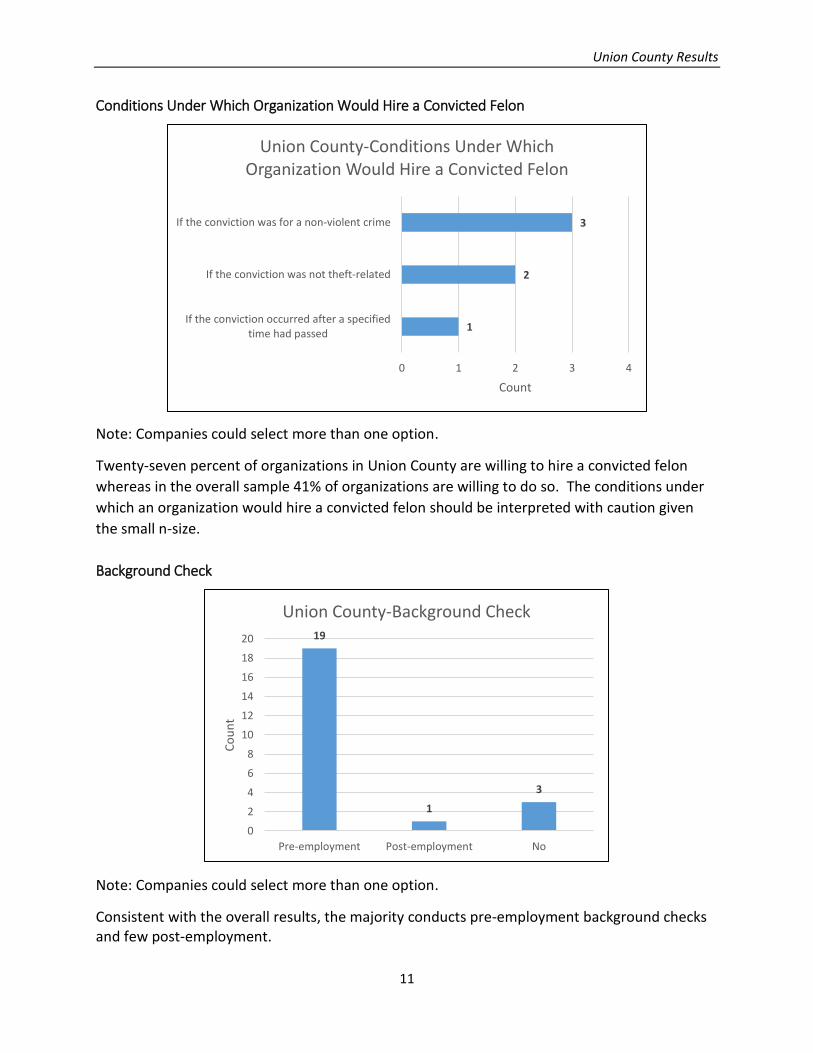
Conditions Under Which Organization Would Hire a Convicted Felon
Note: Companies could select more than one option.
Twenty-seven percent of organizations in Union County are willing to hire a convicted felon
whereas in the overall sample 41% of organizations are willing to do so. The conditions under
which an organization would hire a convicted felon should be interpreted with caution given
the small n-size.
Background Check
Note: Companies could select more than one option.
Consistent with the overall results, the majority conducts pre-employment background checks and few post-employment.
1
2
3
0 1 2 3 4
If the conviction occurred after a specifiedtime had passed
If the conviction was not theft-related
If the conviction was for a non-violent crime
Count
Union County-Conditions Under Which Organization Would Hire a Convicted Felon
19
1
3
0
2
4
6
8
10
12
14
16
18
20
Pre-employment Post-employment No
Co
un
t
Union County-Background Check
Union County Results
12
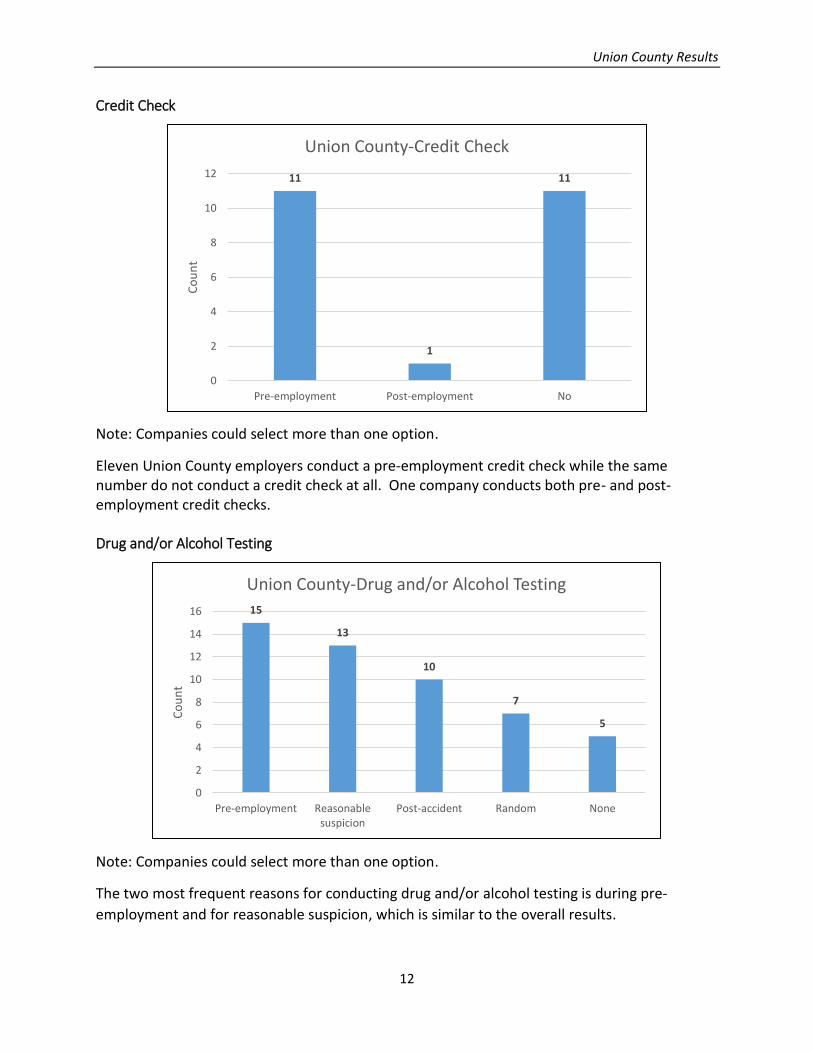
Credit Check
Note: Companies could select more than one option.
Eleven Union County employers conduct a pre-employment credit check while the same number do not conduct a credit check at all. One company conducts both pre- and post-employment credit checks.
Drug and/or Alcohol Testing
Note: Companies could select more than one option.
The two most frequent reasons for conducting drug and/or alcohol testing is during pre-
employment and for reasonable suspicion, which is similar to the overall results.
11
1
11
0
2
4
6
8
10
12
Pre-employment Post-employment No
Co
un
t
Union County-Credit Check
15
13
10
7
5
0
2
4
6
8
10
12
14
16
Pre-employment Reasonablesuspicion
Post-accident Random None
Co
un
t
Union County-Drug and/or Alcohol Testing
Union County Results
13
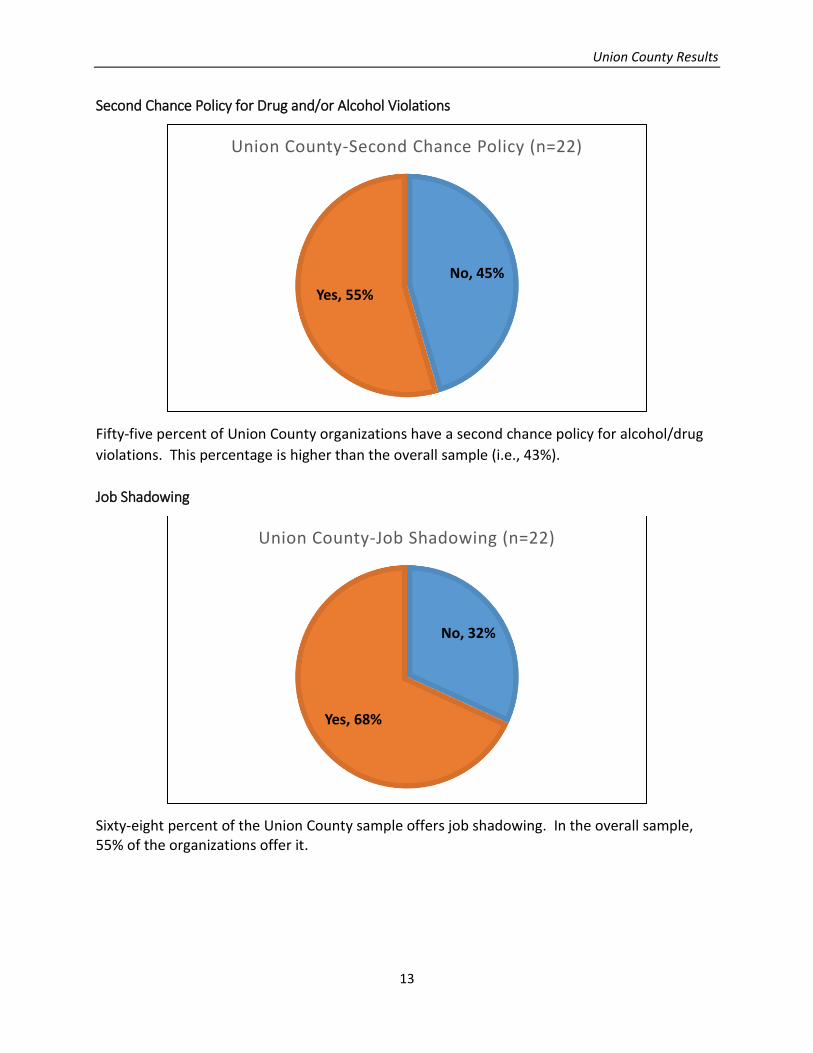
Second Chance Policy for Drug and/or Alcohol Violations
Fifty-five percent of Union County organizations have a second chance policy for alcohol/drug
violations. This percentage is higher than the overall sample (i.e., 43%).
Job Shadowing
Sixty-eight percent of the Union County sample offers job shadowing. In the overall sample, 55% of the organizations offer it.
No, 45%
Yes, 55%
Union County-Second Chance Policy (n=22)
No, 32%
Yes, 68%
Union County-Job Shadowing (n=22)
Union County Results
14
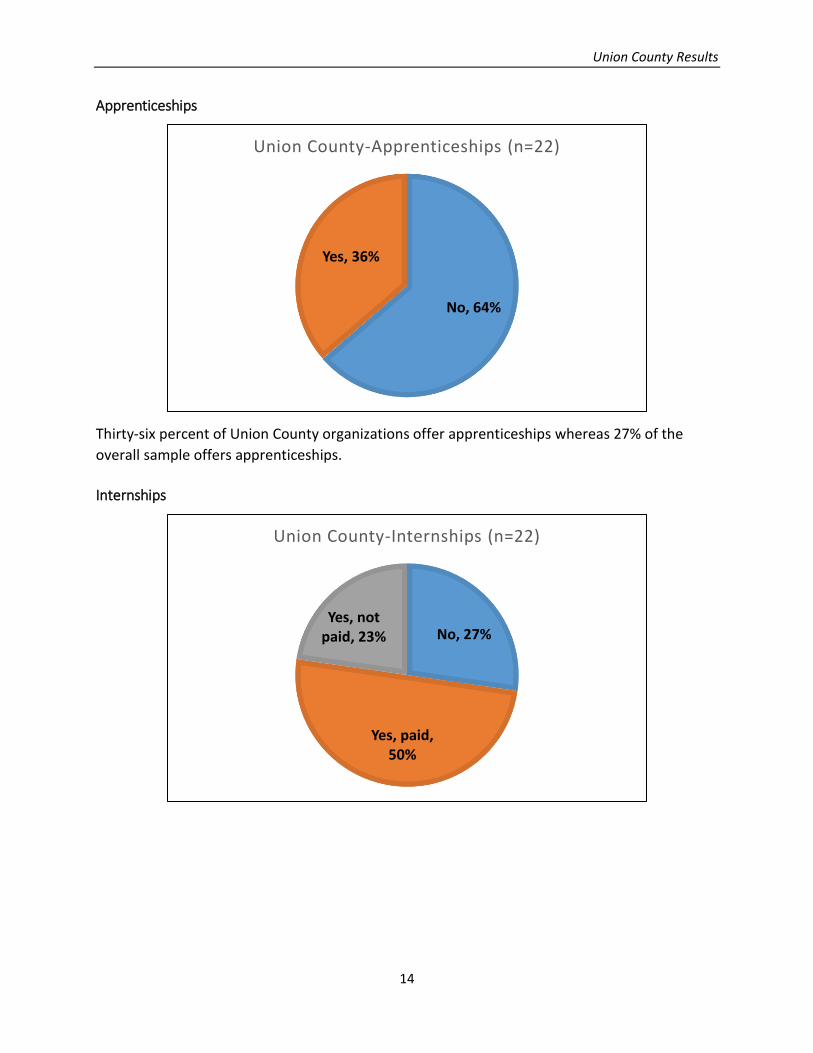
Apprenticeships
Thirty-six percent of Union County organizations offer apprenticeships whereas 27% of the
overall sample offers apprenticeships.
Internships
No, 64%
Yes, 36%
Union County-Apprenticeships (n=22)
No, 27%
Yes, paid, 50%
Yes, not paid, 23%
Union County-Internships (n=22)
Union County Results
15
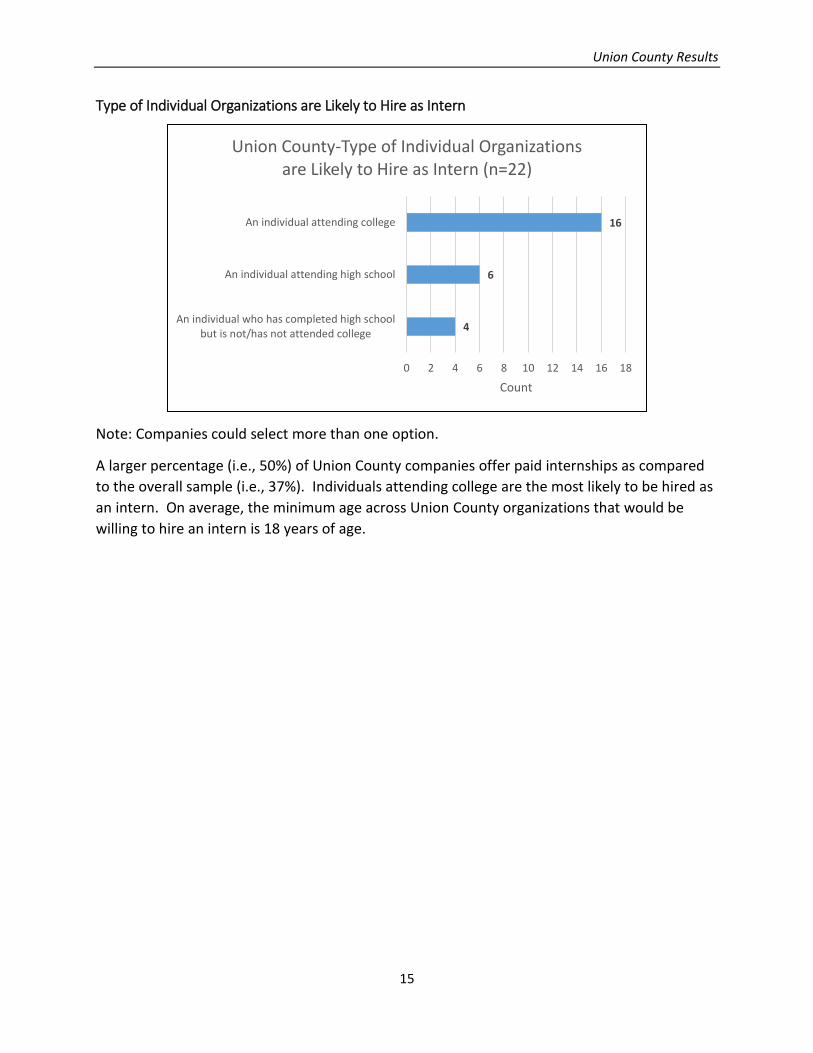
Type of Individual Organizations are Likely to Hire as Intern
Note: Companies could select more than one option.
A larger percentage (i.e., 50%) of Union County companies offer paid internships as compared
to the overall sample (i.e., 37%). Individuals attending college are the most likely to be hired as
an intern. On average, the minimum age across Union County organizations that would be
willing to hire an intern is 18 years of age.
4
6
16
0 2 4 6 8 10 12 14 16 18
An individual who has completed high schoolbut is not/has not attended college
An individual attending high school
An individual attending college
Count
Union County-Type of Individual Organizations are Likely to Hire as Intern (n=22)
Union County Results
16
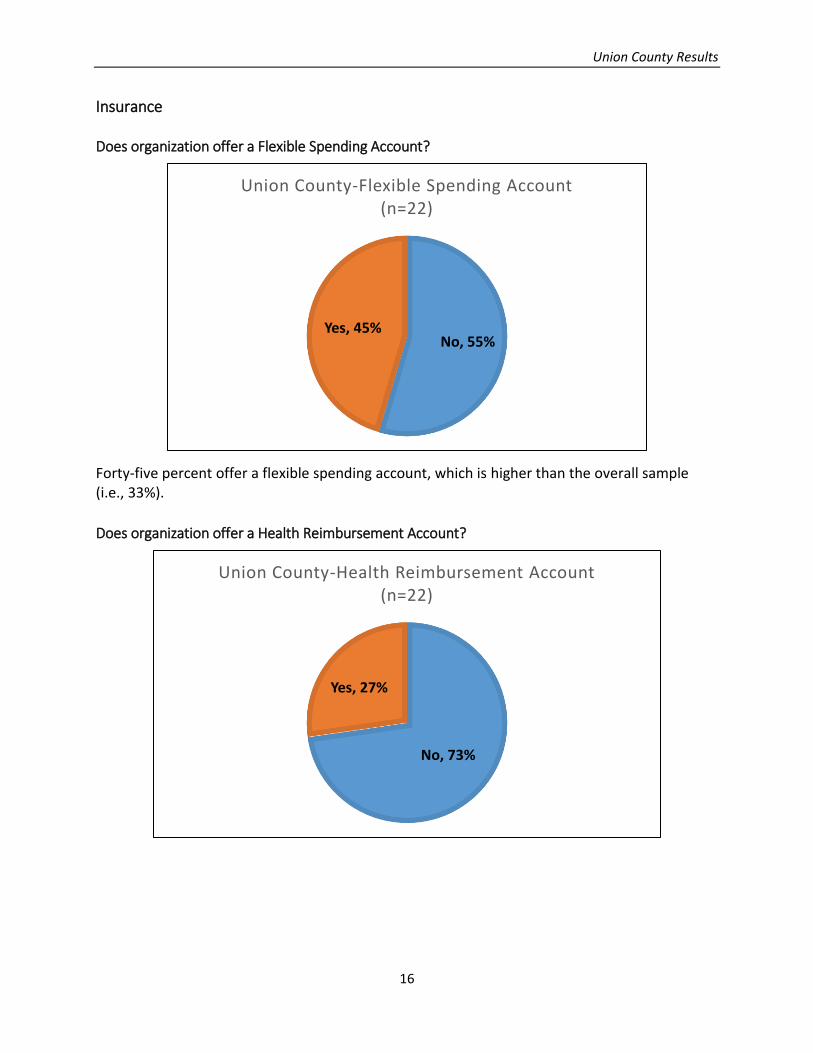
Insurance
Does organization offer a Flexible Spending Account?
Forty-five percent offer a flexible spending account, which is higher than the overall sample (i.e., 33%).
Does organization offer a Health Reimbursement Account?
No, 55%Yes, 45%
Union County-Flexible Spending Account (n=22)
No, 73%
Yes, 27%
Union County-Health Reimbursement Account (n=22)
Union County Results
17
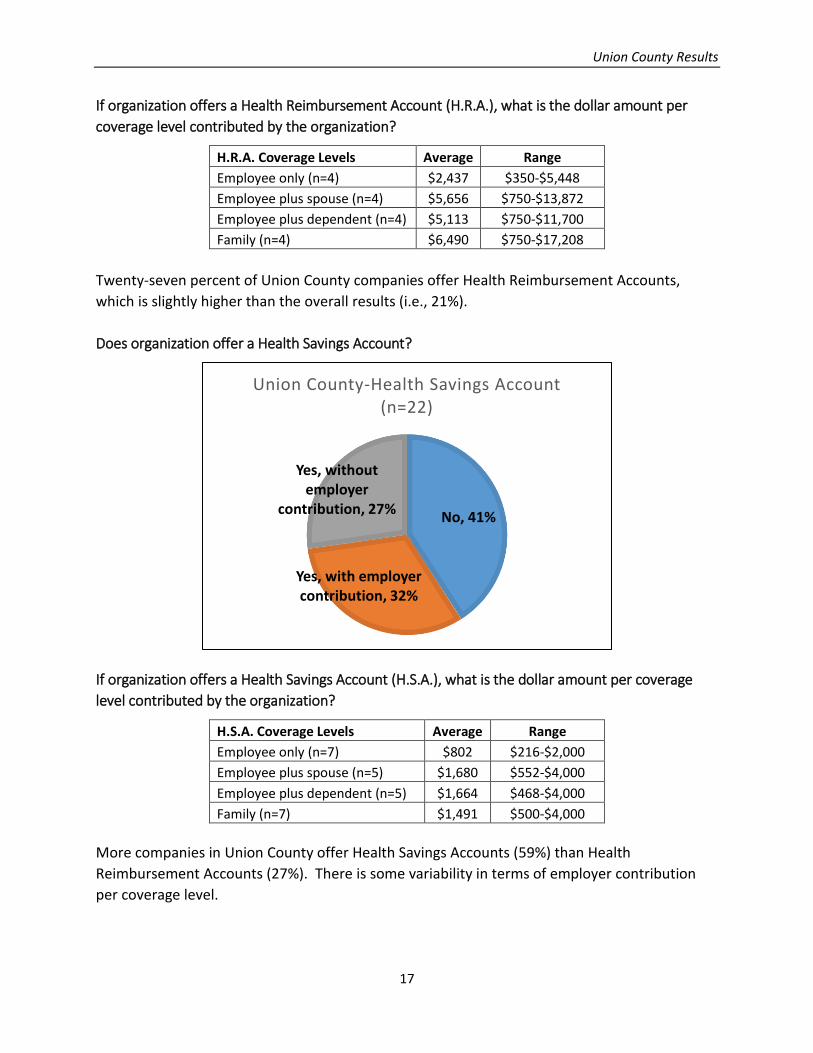
If organization offers a Health Reimbursement Account (H.R.A.), what is the dollar amount per
coverage level contributed by the organization?
H.R.A. Coverage Levels Average Range
Employee only (n=4) $2,437 $350-$5,448
Employee plus spouse (n=4) $5,656 $750-$13,872
Employee plus dependent (n=4) $5,113 $750-$11,700
Family (n=4) $6,490 $750-$17,208
Twenty-seven percent of Union County companies offer Health Reimbursement Accounts,
which is slightly higher than the overall results (i.e., 21%).
Does organization offer a Health Savings Account?
If organization offers a Health Savings Account (H.S.A.), what is the dollar amount per coverage
level contributed by the organization?
H.S.A. Coverage Levels Average Range
Employee only (n=7) $802 $216-$2,000
Employee plus spouse (n=5) $1,680 $552-$4,000
Employee plus dependent (n=5) $1,664 $468-$4,000
Family (n=7) $1,491 $500-$4,000
More companies in Union County offer Health Savings Accounts (59%) than Health
Reimbursement Accounts (27%). There is some variability in terms of employer contribution
per coverage level.
No, 41%
Yes, with employer contribution, 32%
Yes, without employer
contribution, 27%
Union County-Health Savings Account (n=22)
Union County Results
18
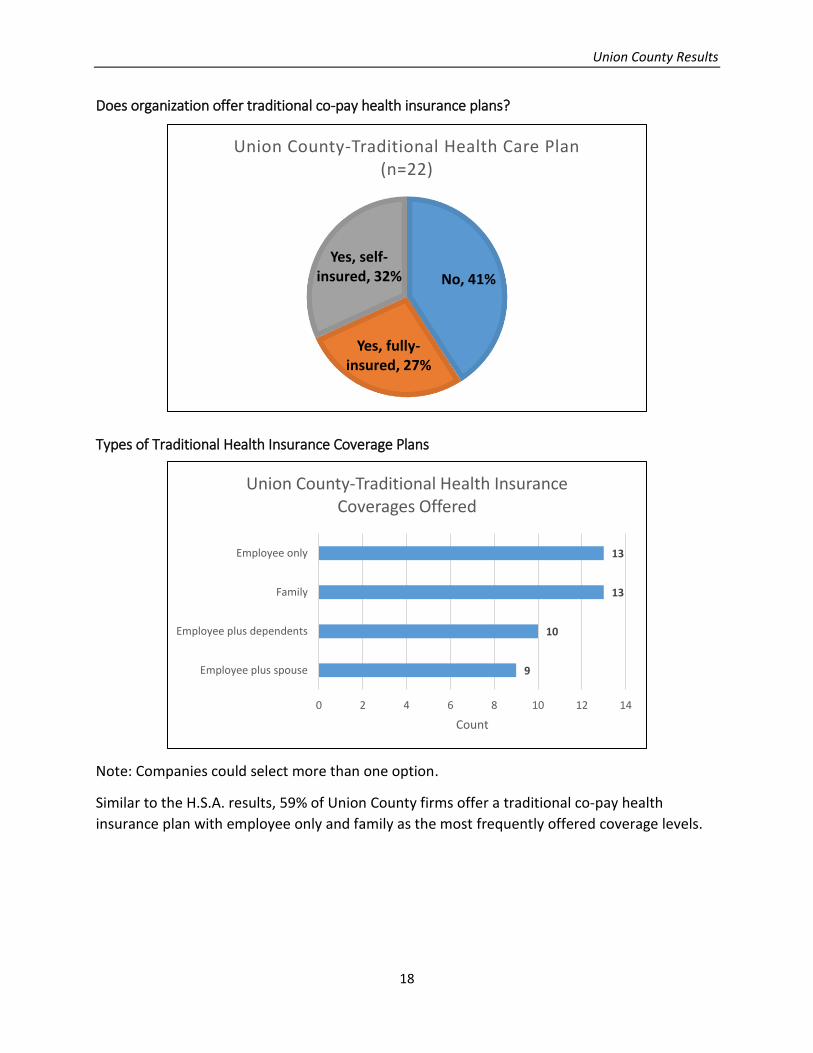
Does organization offer traditional co-pay health insurance plans?
Types of Traditional Health Insurance Coverage Plans
Note: Companies could select more than one option.
Similar to the H.S.A. results, 59% of Union County firms offer a traditional co-pay health
insurance plan with employee only and family as the most frequently offered coverage levels.
No, 41%
Yes, fully-insured, 27%
Yes, self-insured, 32%
Union County-Traditional Health Care Plan (n=22)
9
10
13
13
0 2 4 6 8 10 12 14
Employee plus spouse
Employee plus dependents
Family
Employee only
Count
Union County-Traditional Health Insurance Coverages Offered
Union County Results
19
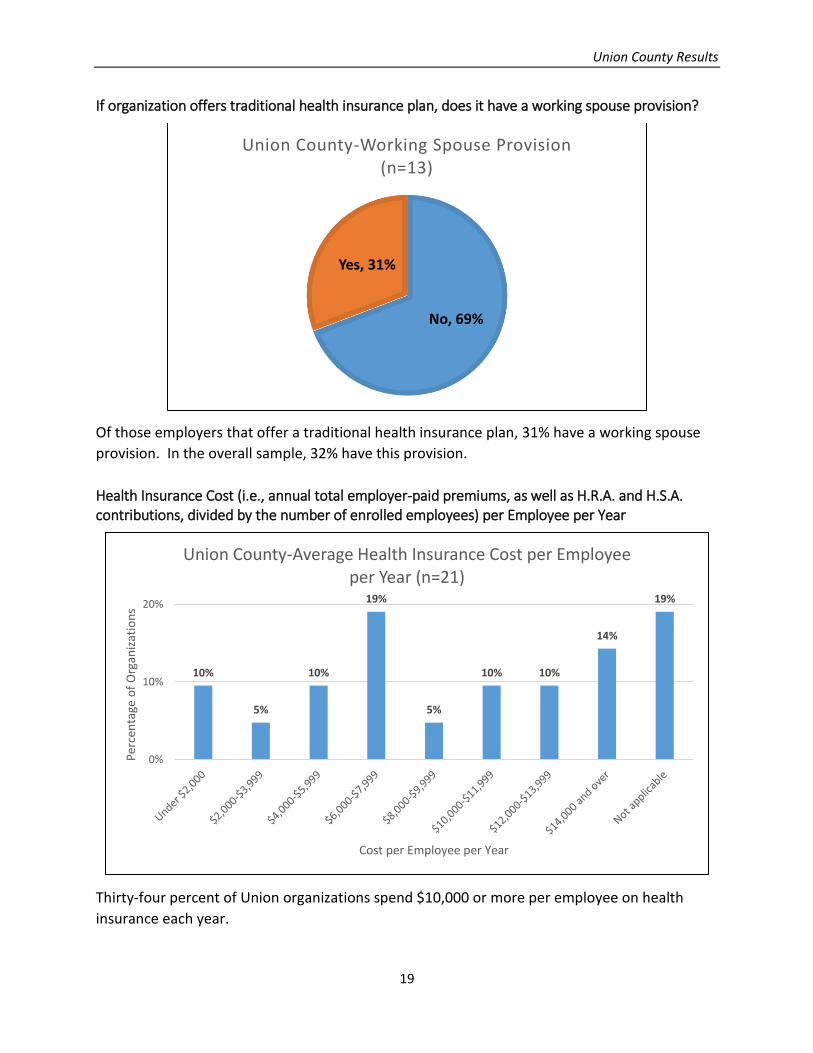
If organization offers traditional health insurance plan, does it have a working spouse provision?
Of those employers that offer a traditional health insurance plan, 31% have a working spouse
provision. In the overall sample, 32% have this provision.
Health Insurance Cost (i.e., annual total employer-paid premiums, as well as H.R.A. and H.S.A. contributions, divided by the number of enrolled employees) per Employee per Year
Thirty-four percent of Union organizations spend $10,000 or more per employee on health
insurance each year.
No, 69%
Yes, 31%
Union County-Working Spouse Provision (n=13)
10%
5%
10%
19%
5%
10% 10%
14%
19%
0%
10%
20%
Per
cen
tage
of
Org
aniz
atio
ns
Cost per Employee per Year
Union County-Average Health Insurance Cost per Employee per Year (n=21)
Union County Results
20
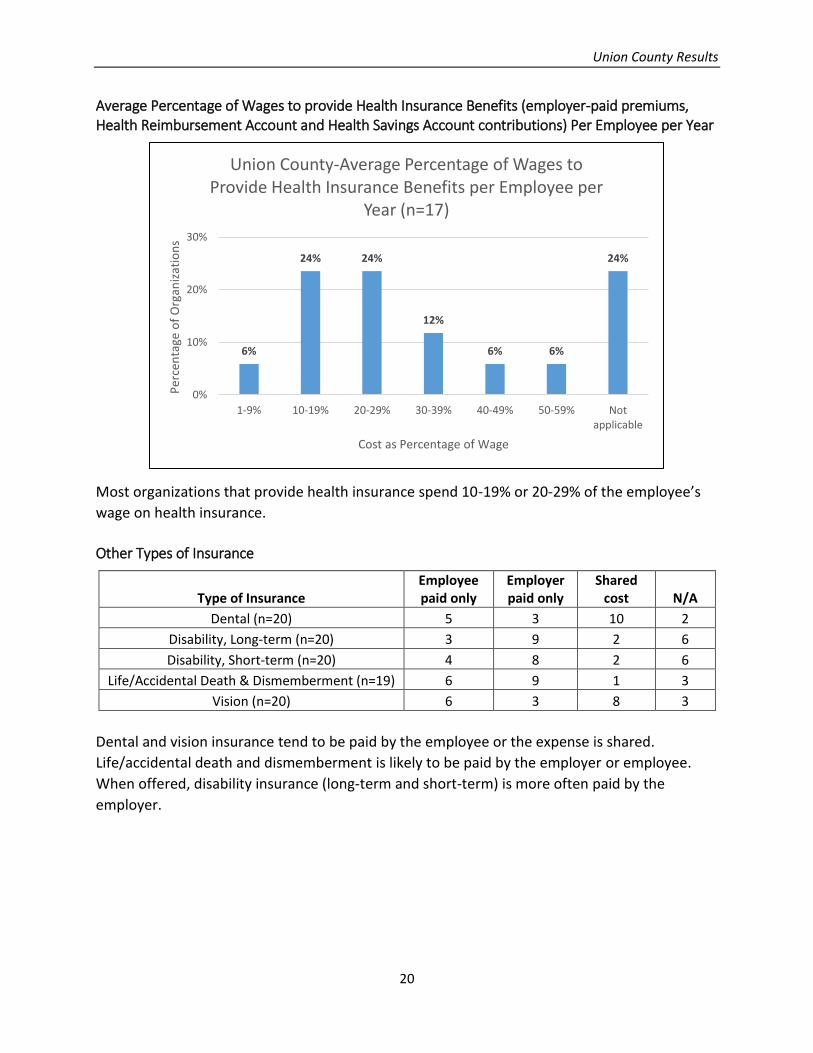
Average Percentage of Wages to provide Health Insurance Benefits (employer-paid premiums, Health Reimbursement Account and Health Savings Account contributions) Per Employee per Year
Most organizations that provide health insurance spend 10-19% or 20-29% of the employee’s
wage on health insurance.
Other Types of Insurance
Type of Insurance Employee paid only
Employer paid only
Shared cost N/A
Dental (n=20) 5 3 10 2
Disability, Long-term (n=20) 3 9 2 6
Disability, Short-term (n=20) 4 8 2 6
Life/Accidental Death & Dismemberment (n=19) 6 9 1 3
Vision (n=20) 6 3 8 3
Dental and vision insurance tend to be paid by the employee or the expense is shared.
Life/accidental death and dismemberment is likely to be paid by the employer or employee.
When offered, disability insurance (long-term and short-term) is more often paid by the
employer.
6%
24% 24%
12%
6% 6%
24%
0%
10%
20%
30%
1-9% 10-19% 20-29% 30-39% 40-49% 50-59% Notapplicable
Per
cen
tage
of
Org
aniz
atio
ns
Cost as Percentage of Wage
Union County-Average Percentage of Wages to Provide Health Insurance Benefits per Employee per
Year (n=17)
Union County Results
21
Benefits and Incentives
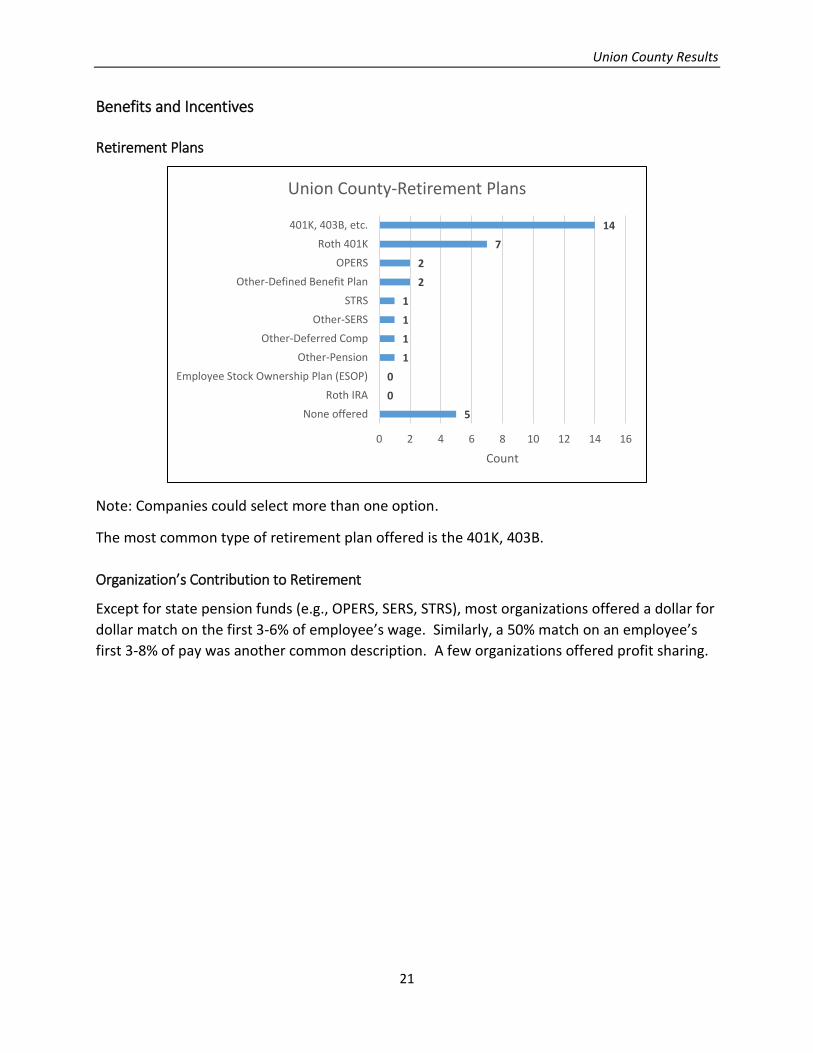
Retirement Plans
Note: Companies could select more than one option.
The most common type of retirement plan offered is the 401K, 403B.
Organization’s Contribution to Retirement
Except for state pension funds (e.g., OPERS, SERS, STRS), most organizations offered a dollar for
dollar match on the first 3-6% of employee’s wage. Similarly, a 50% match on an employee’s
first 3-8% of pay was another common description. A few organizations offered profit sharing.
5
0
0
1
1
1
1
2
2
7
14
0 2 4 6 8 10 12 14 16
None offered
Roth IRA
Employee Stock Ownership Plan (ESOP)
Other-Pension
Other-Deferred Comp
Other-SERS
STRS
Other-Defined Benefit Plan
OPERS
Roth 401K
401K, 403B, etc.
Count
Union County-Retirement Plans
Union County Results
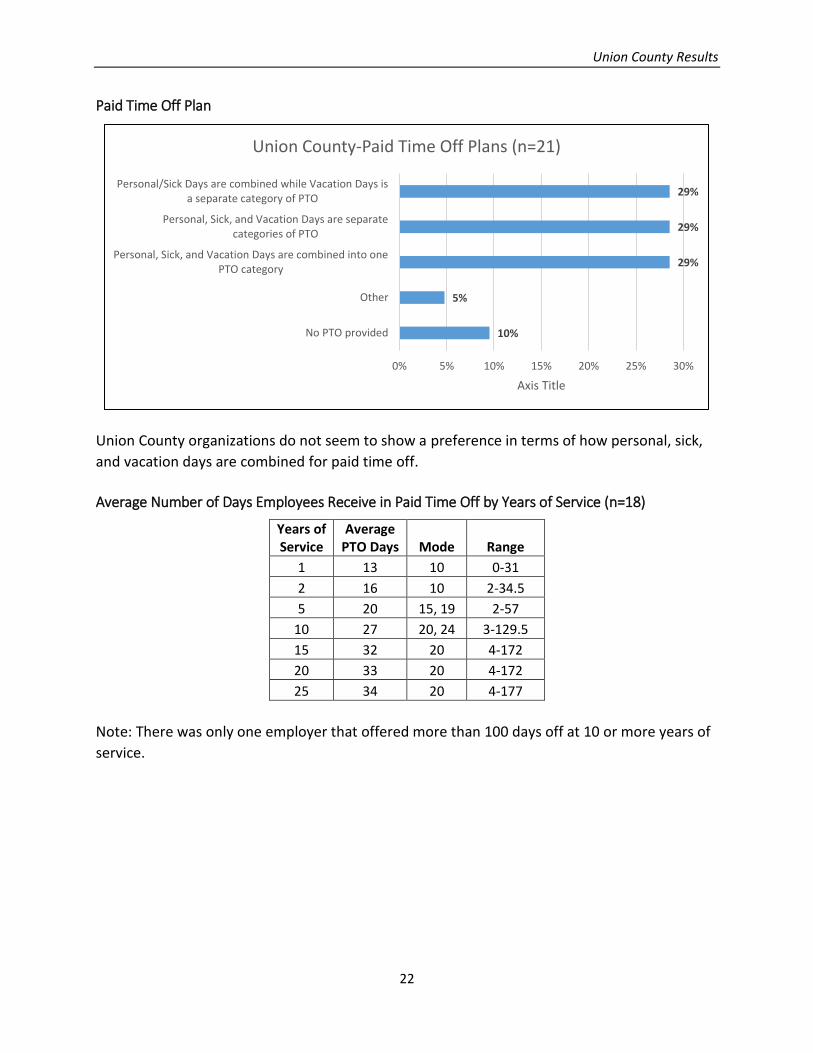
22
Paid Time Off Plan
Union County organizations do not seem to show a preference in terms of how personal, sick,
and vacation days are combined for paid time off.
Average Number of Days Employees Receive in Paid Time Off by Years of Service (n=18)
Years of Service
Average PTO Days Mode Range
1 13 10 0-31
2 16 10 2-34.5
5 20 15, 19 2-57
10 27 20, 24 3-129.5
15 32 20 4-172
20 33 20 4-172
25 34 20 4-177
Note: There was only one employer that offered more than 100 days off at 10 or more years of
service.
10%
5%
29%
29%
29%
0% 5% 10% 15% 20% 25% 30%
No PTO provided
Other
Personal, Sick, and Vacation Days are combined into onePTO category
Personal, Sick, and Vacation Days are separatecategories of PTO
Personal/Sick Days are combined while Vacation Days isa separate category of PTO
Axis Title
Union County-Paid Time Off Plans (n=21)
Union County Results
23
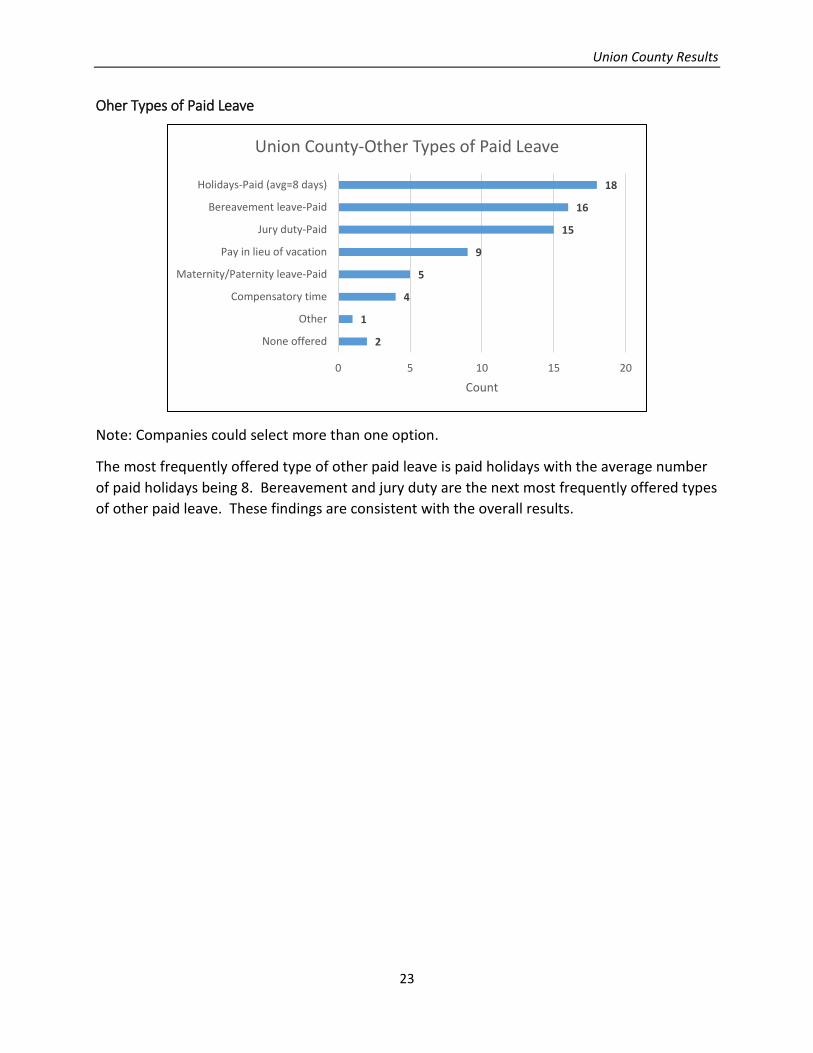
Oher Types of Paid Leave
Note: Companies could select more than one option.
The most frequently offered type of other paid leave is paid holidays with the average number
of paid holidays being 8. Bereavement and jury duty are the next most frequently offered types
of other paid leave. These findings are consistent with the overall results.
2
1
4
5
9
15
16
18
0 5 10 15 20
None offered
Other
Compensatory time
Maternity/Paternity leave-Paid
Pay in lieu of vacation
Jury duty-Paid
Bereavement leave-Paid
Holidays-Paid (avg=8 days)
Count
Union County-Other Types of Paid Leave
Union County Results
24
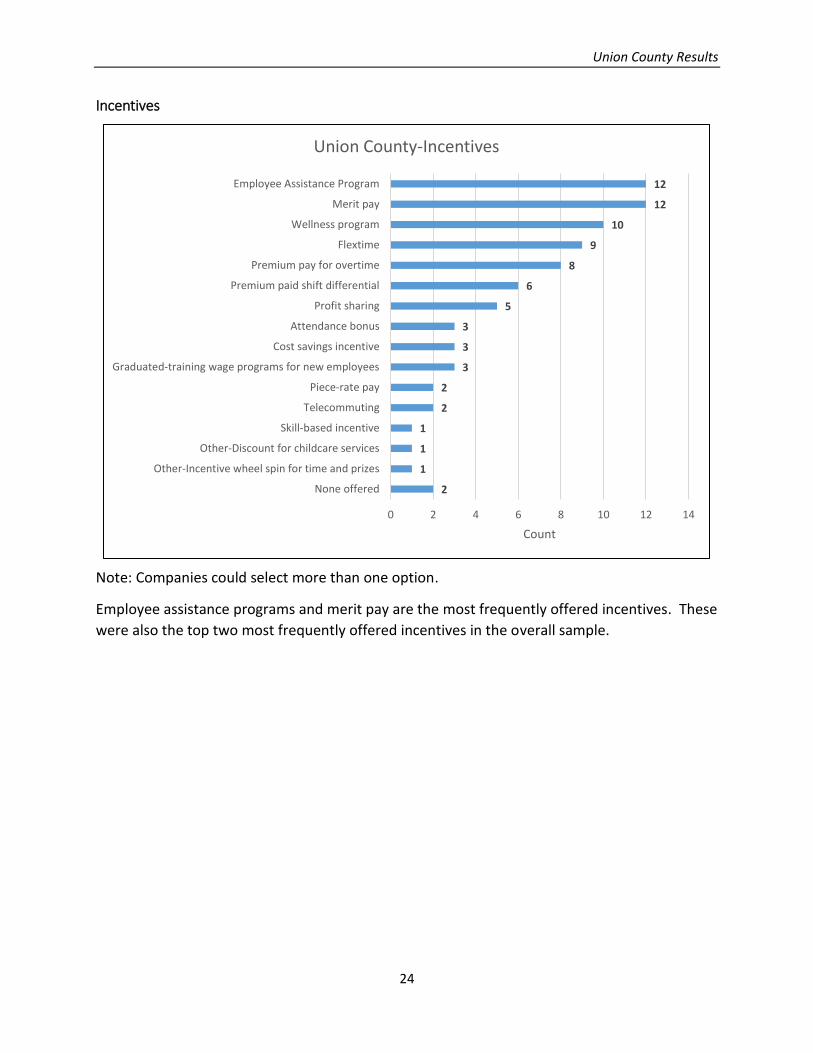
Incentives
Note: Companies could select more than one option.
Employee assistance programs and merit pay are the most frequently offered incentives. These
were also the top two most frequently offered incentives in the overall sample.
2
1
1
1
2
2
3
3
3
5
6
8
9
10
12
12
0 2 4 6 8 10 12 14
None offered
Other-Incentive wheel spin for time and prizes
Other-Discount for childcare services
Skill-based incentive
Telecommuting
Piece-rate pay
Graduated-training wage programs for new employees
Cost savings incentive
Attendance bonus
Profit sharing
Premium paid shift differential
Premium pay for overtime
Flextime
Wellness program
Merit pay
Employee Assistance Program
Count
Union County-Incentives
Union County Results
25
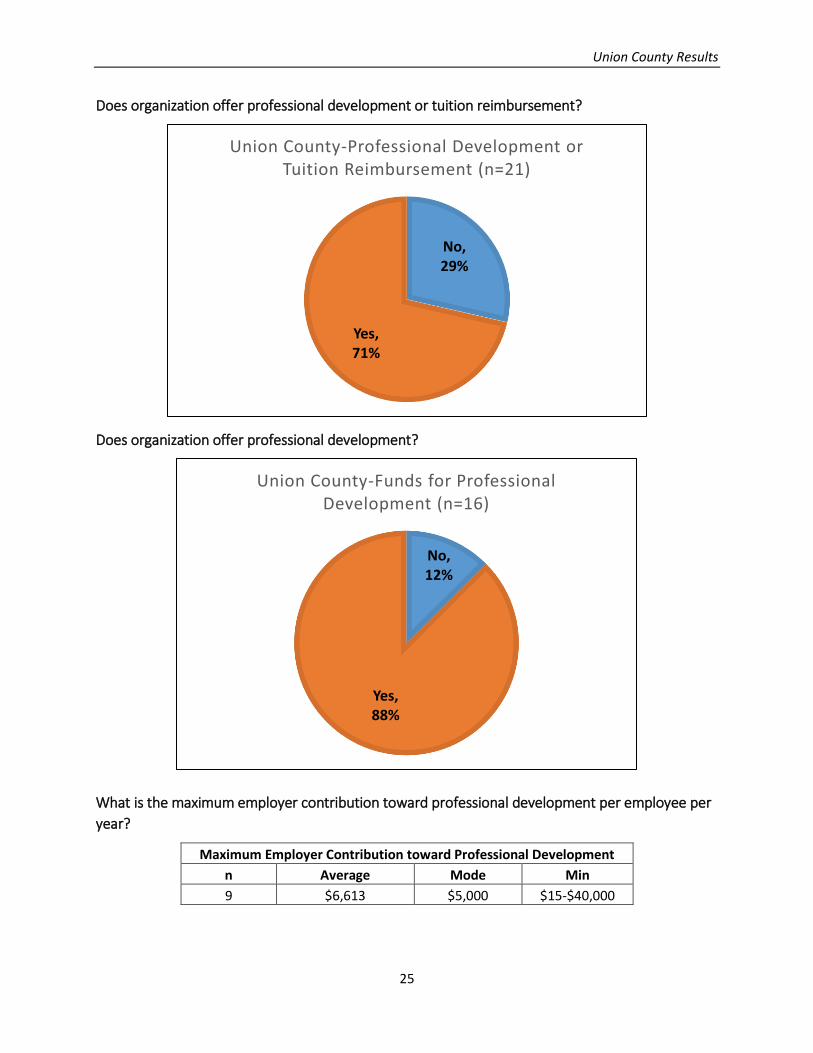
Does organization offer professional development or tuition reimbursement?
Does organization offer professional development?
What is the maximum employer contribution toward professional development per employee per
year?
Maximum Employer Contribution toward Professional Development
n Average Mode Min
9 $6,613 $5,000 $15-$40,000
No,29%
Yes,71%
Union County-Professional Development or Tuition Reimbursement (n=21)
No,12%
Yes,88%
Union County-Funds for Professional Development (n=16)
Union County Results
26
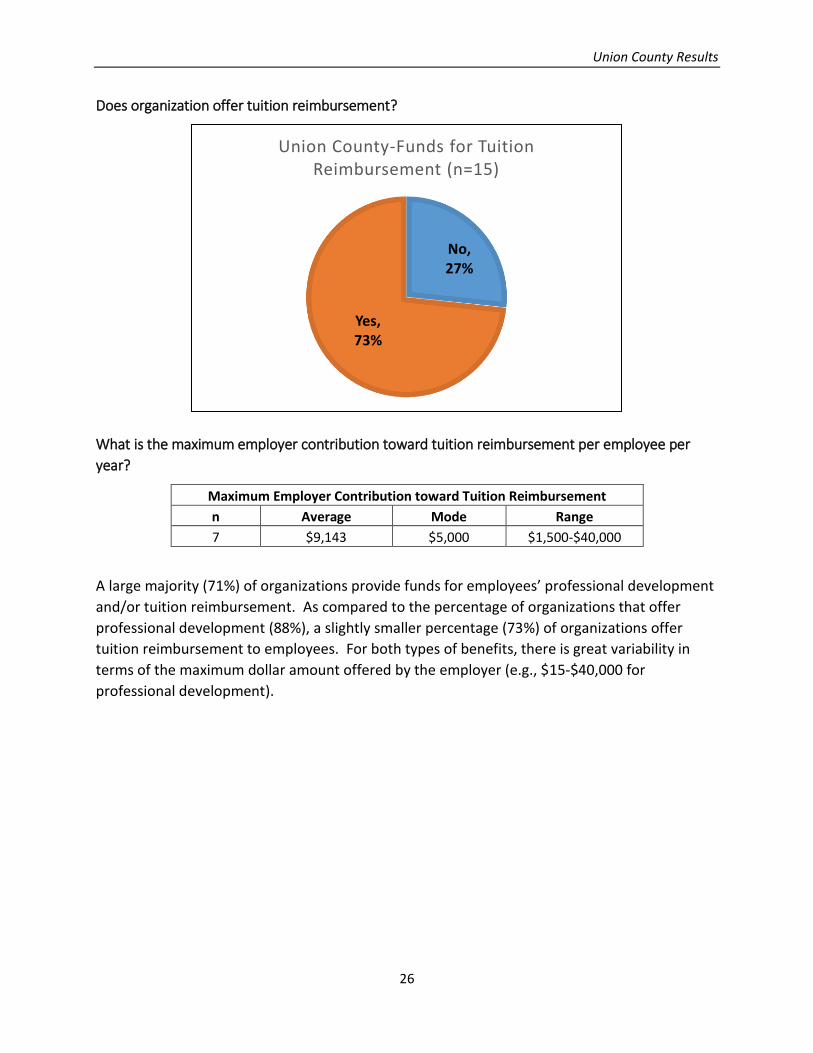
Does organization offer tuition reimbursement?
What is the maximum employer contribution toward tuition reimbursement per employee per
year?
Maximum Employer Contribution toward Tuition Reimbursement
n Average Mode Range
7 $9,143 $5,000 $1,500-$40,000
A large majority (71%) of organizations provide funds for employees’ professional development
and/or tuition reimbursement. As compared to the percentage of organizations that offer
professional development (88%), a slightly smaller percentage (73%) of organizations offer
tuition reimbursement to employees. For both types of benefits, there is great variability in
terms of the maximum dollar amount offered by the employer (e.g., $15-$40,000 for
professional development).
No,27%
Yes,73%
Union County-Funds for Tuition Reimbursement (n=15)
Union County Results
27
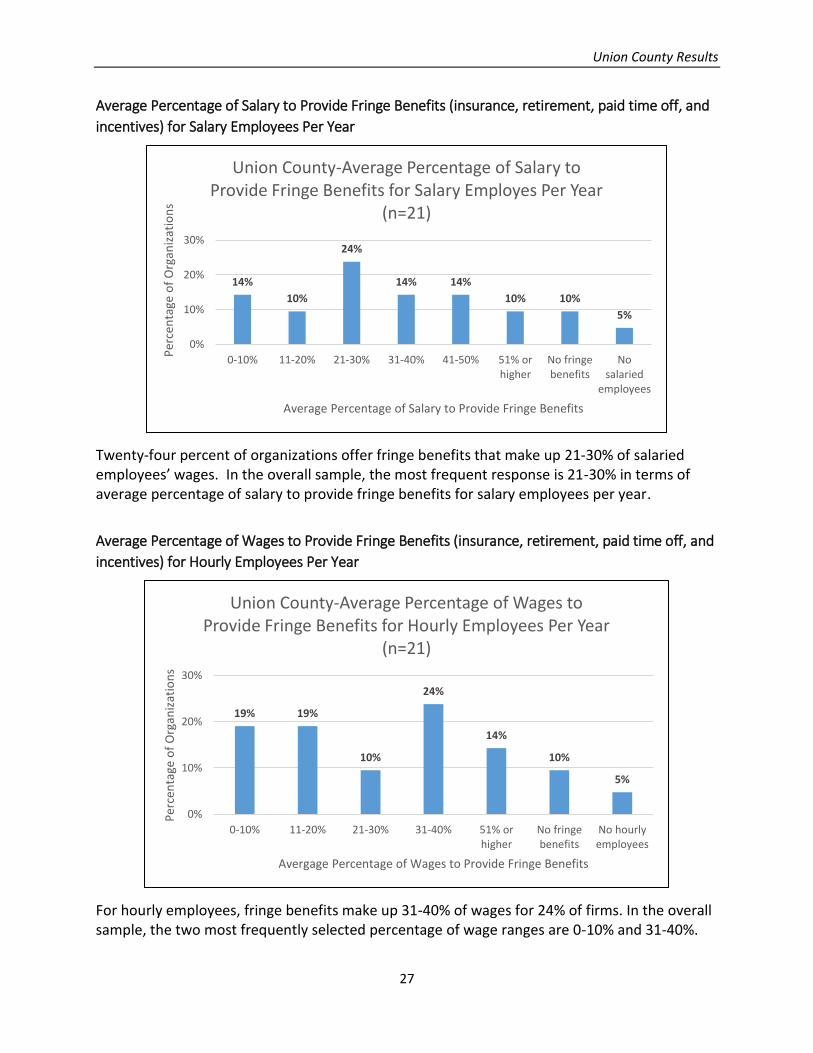
Average Percentage of Salary to Provide Fringe Benefits (insurance, retirement, paid time off, and
incentives) for Salary Employees Per Year
Twenty-four percent of organizations offer fringe benefits that make up 21-30% of salaried employees’ wages. In the overall sample, the most frequent response is 21-30% in terms of average percentage of salary to provide fringe benefits for salary employees per year.
Average Percentage of Wages to Provide Fringe Benefits (insurance, retirement, paid time off, and
incentives) for Hourly Employees Per Year
For hourly employees, fringe benefits make up 31-40% of wages for 24% of firms. In the overall sample, the two most frequently selected percentage of wage ranges are 0-10% and 31-40%.
14%
10%
24%
14% 14%
10% 10%
5%
0%
10%
20%
30%
0-10% 11-20% 21-30% 31-40% 41-50% 51% orhigher
No fringebenefits
Nosalaried
employees
Per
cen
tage
of
Org
aniz
atio
ns
Average Percentage of Salary to Provide Fringe Benefits
Union County-Average Percentage of Salary to Provide Fringe Benefits for Salary Employes Per Year
(n=21)
19% 19%
10%
24%
14%
10%
5%
0%
10%
20%
30%
0-10% 11-20% 21-30% 31-40% 51% orhigher
No fringebenefits
No hourlyemployees
Per
cen
tage
of
Org
aniz
atio
ns
Avergage Percentage of Wages to Provide Fringe Benefits
Union County-Average Percentage of Wages to Provide Fringe Benefits for Hourly Employees Per Year
(n=21)
Union County Results
28
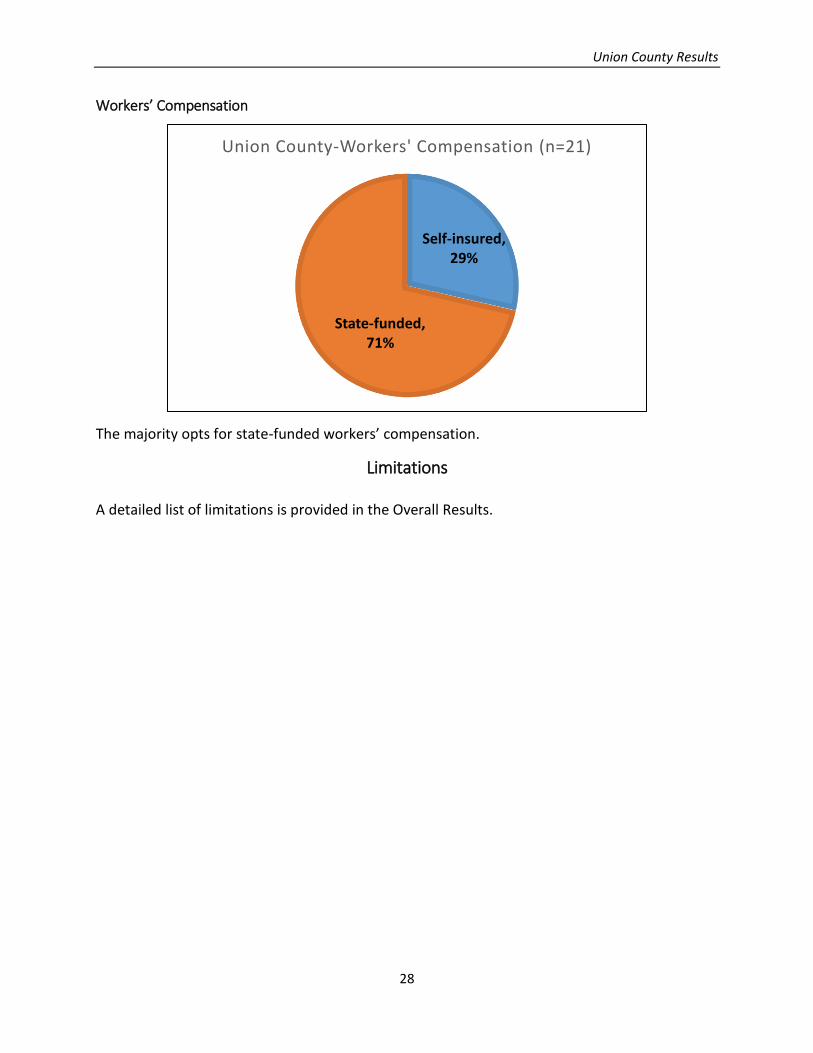
Workers’ Compensation
The majority opts for state-funded workers’ compensation.
Limitations A detailed list of limitations is provided in the Overall Results.
Self-insured, 29%
State-funded, 71%
Union County-Workers' Compensation (n=21)