Embed Size (px)
Citation preview
Reconsidering Union Wage Effects: Surveying New Evidence on an Old Topic
B A R R Y T. H I R S C H
Trinity University, San Antonio, TX 78212 and IZA Bonn
I examine evidence on private sector union wage gaps in the United States. The con- sensus opinion among labor economists of an average union premium of roughly 15 per- cent is called into question. Two forms of measurement error bias downward standard wage gap estimates. Match bias results from Census earnings imputation procedures that do not include union status as a match criterion. Downward bias is" roughly equal to the proportion of workers with imputed earnings, currently about 30 percent. Misclassifi- cation of union status causes additional attenuation in union gap measures. This bias has worsened as private sector density has declined, since an increasing proportion of workers designated as union are instead nonunion workers. Corrections for misclassi- fication and match bias lead to estimated union gaps substantially higher than standard estimates, but with less of a downward trend since the mid 1980s. Private sector union gaps corrected for these biases are estimated from the CPS for 1973-2001. The uncor- rected estimate for 2001 is. 13 log points. Correction for match bias increases the gap to. 18 log points; further correction for misclassification bias, based on an assumed 2 percent error rate, increases the gap to .24. Reexamination of the skill-upgrading hypoth- esis leads to the conclusion that higher union gap estimates are plausible. The conven- tional wisdom of a 15 percent union wage premium warrants reexamination.
I. Introduction
The effect of labor unions on wages is one of the more heavily studied topics in empir- ical labor economics. There exists a reasonably strong consensus among economists that the average union-nonunion wage gap is about 15 percent, a consensus based in no small part on the influence of work by H. Gregg Lewis (1963, 1986). A survey of labor economists at leading universities by Fuchs, Krueger, and Poterba (1998) asked the question: "What is your best estimate of the percentage impact of unions on the earn- ings of their average member'?" The median response was 15 percent and mean response 13.1 percent; dispersion was low. A meta-analysis by Jarrell and Stanley (1990), reex- amining the studies surveyed by Lewis (1986), places the range of average union wage gaps at 9-12 percent, a bit lower than Lewis's summary of these same studies, with union gaps rising with unemployment. Likewise, labor economics textbooks place the union wage gap in the range of 10-20 percent.
I interpret recent evidence on the union impact on wages and make no attempt to provide a comprehensive survey of union wage gap studies. Rather, my analysis focuses
JOt31tNAL OF LABOR RESEARCH
Volume XXV, Number 2 Spring 2004
234 JOURNAL OF LABOR RESEARCH
in depth on recent strands in the literature, with particular attention given to my own work. The evidence on union wage effects is found to be far less clear-cut than might be expected given the consensus among labor economists. In the end, one concludes that the "Lewis consensus" centering on 15 percent (or less) is too low. Current private sector union wage gaps from the CPS appear well in excess of 20 percent, even fol- lowing a gradual decline since the mid 1990s. How one arrives at this conclusion makes for an interesting story, one involving arguments and evidence not so well known among labor economists.
Although standard estimates of the union gap in the United States are in the neigh- borhood of 15 percent, these estimates fail to account for two measurement problems in CPS data (as well as other data sets), each of which causes a downward bias to wage gap estimates. The first problem, misclassification error in the reporting of union status, is well understood by labor economists and a central focus of studies using longitudi- nal analysis. Misclassification (measurement error) bias has not been considered a seri- ous concern for standard wage level studies. This assumption is no longer tenable. As true union density in the U.S. private sector has fallen to below 9 percent, the noise-sig- nal ratio in union status has risen and downward bias from misclassification has become a serious problem. I provide corrected estimates of union wage gaps based on alterna- tive assumptions about rates of misclassification (1, 2, and 3 percent).
The second source of downward bias (currently about 5 percentage points) is the result of imputation "match bias" (Hirsch and Schumacher, 2004). Workers who do not report earnings have them assigned (imputed) based on the earnings of a matched donor with a set of characteristics identical to the nonrespondent. CPS match criteria do not include union status, however, so most union workers who fail to report earn- ings are assigned the earnings of nonunion workers, while a few nonunion workers are assigned the earnings of union workers. Hirsch and Schumacher show that the proportional attrition in the union coefficient is roughly equal to the proportion of work- ers with imputed earnings, currently about 30 percent.
The combined effect of match bias and misclassification error is substantial - - a downward bias in union wage gap estimates on the order of. 10 log points, from roughly .25 to. 15 in recent years. Match bias and misclassification error have roughly equal effects, although the magnitude of the latter bias depends critically on the assumed rate of misclassification, something about which we know far too little. Each of these sources of bias has become more severe over time, with rising imputation rates leading to increased match bias and falling private sector density leading to greater misclassifica- tion bias. Standard estimates of union wage gaps, therefore, substantially understate the level of the union wage gap, but overstate decline in the union wage gap since the mid-1980s. Independent of the biases addressed herein, the magnitude of the decline in the union wage gap is uncertain due to conflicting evidence from alternative data surveys (Hirsch et al., 2004).
My principal focus centers on the level and changes over time in the union- nonunion wage gap in the U.S. private sector, following accounting for measurement
BARRY T. HIRSCH 235
biases. The analysis is based on OLS wage level estimates, which raises the question of whether such methods are appropriate, given the possibility of unmeasured skills correlated with union status and skill upgrading by union employers who pay high wages. I discuss alternative estimation approaches, in particular selection models and longitudinal analyses accounting for worker fixed effects. Longitudinal evidence shows that selection is two-sided, with positive selection among workers with low measured skills and negative selection among workers with high measured skills (Card, 1996; Hirsch and Schumacher, 1998). As emphasized by Card, this form of two-sided selec- tion is inconsistent with single-index selection models, calling into question gap esti- mates from such studies (Lee, 1978; Robinson, 1989).
The theoretical basis for the skill-upgrading hypothesis also warrants examina- tion. Theory and evidence suggest that unions may have little effect on average worker skills (Wessels, 1994). Union wage effects following sorting by employers and employ- ees may differ little across worker skill groups, contrary to standard evidence. The aver- age wage gap obtained across a broad sample of workers may be a better measure of the causal impact of unions on wages than are wage level estimates disaggregated by worker group, based on schooling, occupation, race, gender, etc. Absent good instruments for union status (i.e., predictors of union status that do not affect earnings), wage level analysis producing an average union wage effect may provide a reasonable approach for many (but not all) applications.
I first present an overview of union wage gap theory and estimation. This is fol- lowed by an analysis of two important measurement issues - - match bias in wage gap estimates due to earnings imputation and bias from misclassification of union sta- tus. Estimates of union wage gaps that account for these biases are presented for the U.S. private sector for 1973-2001. That is followed by an appraisal of the skill-upgrad- ing hypothesis and longitudinal union gap estimates. A final section examines briefly such topics as unions and earnings inequality, union wage effects in the public sector, differences in wage effects for union members and covered nonmembers, union effects on compensation (wages plus benefits), and the relationship between union status and working conditions.
II. Union Wage Gaps: Estimation Methods and Measurement Issues
What Wage Effects Are Being Measured? Union Gaps and Gains. Unions affect wages in a number of ways. Most important, union bargaining power leads to higher wages among covered workers. Collective bargaining leads to a more formalized governance structure and wage determination process, reducing management discretion. A result of this process is lower wage dispersion, evident through both a flattening of skill dif- ferentials and the standardizing of wages within job-seniority classifications (Freeman, 1980, 1982). As argued subsequently, the decrease in skill differentials is far less than suggested by standard wage regressions.
Unions also affect nonunion wages, albeit to a far lesser extent than union wages. On the one hand, "threat effects" lead nonunion employers to increase wages to deter
236 JOURNAL OF LABOR RESEARCH
union organizing. Threat effects are most apparent in sectors with highly unionized labor markets, defined by industry (e.g., airlines) or location. "Spillover" effects, on the other hand, produce downward pressure on nonunion wages. Such effects follow from a two-sector model in which the decrease in employment in the union sector increases labor supply in the nonunion sector. A number of studies find evidence con- sistent with threat effects, based on a positive relationship between nonunion wages and industry union density. The weight of the evidence suggests that union wages grow with respect to industry density at a rate equivalent to or greater than nonunion wages, implying a constant or increasing union wage gap with respect to density. Evidence is less clear-cut with respect to metropolitan area density, l
Spillover effects are difficult to detect since they are widely dispersed. Were the negative effects on nonunion wages from spillovers sufficiently large to offset both the wage gains among union members and positive threat effects on nonunion wages, the total wage bill or labor's share of income should be unaffected by unionization. But isolating how union density affects labor's share is not easy. Aggregate time series data require that one distinguish the effect of changes in (highly trended) union density from that of other time-series variables that may influence labor's share. Considerable cross- sectional variation occurs in union density across industry, but this reflects differences among industries heavily affected by threat effects and those most affected by spillover effects, rather than their net effect economy-wide. 2
Lewis makes a useful distinction between wage "gaps" and "gains." Gaps are wage differentials between union and nonunion workers. Gains are the effect of union- ism on union wages, relative to what wages would be absent unionism. Were the net effect of unionism on nonunion wages zero, union gaps and gains would be equiva- lent. If union threat effects are dominant (thus raising nonunion wages), estimates of union gaps understate union gains. If spillover effects are dominant, gaps exceed gains. The focus in the literature (and in this paper) has been on estimates of the average union wage gap. Union gains are difficult to estimate given that we do not observe what wages would be in absence of unionization or the institutional structure (e.g., labor law) that enables unions. One can estimate union and nonunion wages including a control for union density (say at the industry level), thus providing estimates of union gaps and gains for each level of union density (e.g., Freeman and Medoff, 1981). Lewis (1986) is skeptical about the reliability of this approach. He is concerned that union density coefficients capture more than the effects of unionization (for example, employer size), as seen by their sensitivity with respect to choice of control variables.
Finally, it is worth clarifying terminology. A term used frequently in the litera- ture is union wage premium. The terms premium and gap are largely interchangeable, typically referring to the excess of union wages over wages for similar nonunion workers and jobs. As a matter of taste, I prefer the term gap; the term premium is used sparingly.
Specification. My focus is on union gaps estimated with cross-sectional wage level regressions. A subsequent section discusses longitudinal gap estimates and vari- ation in wage effects across worker groups. The obvious starting point is the standard semilogarithmic wage equation. This earnings function can be interpreted, rather hero-
B A R R Y T. HIRSCH 237
ically, as a structural human capital model (Mincer, 1974; Willis, 1986) or, more gen- erally, as a reduced form price equation in which supply and demand determinants, including union status, are explanatory variables. The semilog form of the earnings function is justified by theory (both human capital and probabilistic descriptions of the earnings generations process) and statistical evidence on functional form (Heckman and Polachek, 1974). Given a semilog wage equation, a natural metric for measuring union gaps is the log wage differential, which is simply the difference in mean union log wages and mean nonunion log wages, conditional on worker and (ideally)job char- acteristics. Although log wage gaps can be readily converted to (approximate) per- centage differentials, I present gaps in log point form. 3
A logical starting point is a general model of both wage and union status deter- mination.
u = z v + ~(w~-w~) +/a~. (1)
w = x 1 3 u + ~t 2. (2)
W n = Xn~ n -I- ~.13. (3)
Here U is union status; subscripts u and n designate union and nonunion; W is the individual log wage; X is a vector of wage determinants; 13 is the corresponding coefficient vector; and g is the error term. Interpreted as a structural union choice equation, individual workers select a U job conditional on a vector Z of individual char- acteristics and their relative wage opportunities in union and nonunion jobs. As empha- sized by Abowd and Farber (1982), workers must select the union job queue and be selected from the queue by union employers. Thus, the union status equation might better be interpreted as a reduced form equation in which vector Z includes job char- acteristics (employer size, working conditions, etc.) that influence the benefits and costs of union organizing and provision of union services (Hirsch and Berger, 1984).
Although reliable estimation of the general model is not typically possible, it is useful to think about what such a model involves, if for no other reason than to help understand the limitations inherent in models estimated in the literature. In the Heck- man-Lee selection approach (Lee, 1978; Duncan and Leigh, 1980; Hirsch and Berger, 1984; Robinson, 1989), a reduced form union status probit equation is first estimated (i.e., with W,-W n, the log wage gap, excluded), from which selectivity variables for the union and nonunion wage equations are constructed (so-called lambda's). In prin- ciple, these are intended to yield unbiased estimates of wage equation parameters and thus each worker's wage in the union and nonunion sectors. Once such information is available, one can calculate both "unbiased" union-nonunion wage gaps and "struc- tural" estimates of the union status equation (i.e., with inclusion of Wu-Wn). Such mod- els can be identified and estimated in a statistical sense, based on (sometimes arbitrary) exclusion of a union status determinant from the wage equations or due to nonlinear- ity in the probit equation error term.
238 JOURNAL OF LABOR RESEARCH
The reliability of results obtained from selection models has been questioned by prominent labor economists (Lewis, 1986; Freeman and Medoff, 1984). Skepticism initially stemmed from the enormous variance of estimates produced by such meth- ods and because the high gap estimates sometimes obtained in such studies violated most economists' priors that skill upgrading should result in selectivity-adjusted esti- mates that are lower than standard estimates. Robinson (1989) provides a careful defense of such methods, but also obtains gap estimates exceeding those obtained from standard (nonselection) models. 4
Selection model estimates of the union gap are unreliable for two principal rea- sons. First, economically meaningful identification of the selection model requires that there be at least one variable that determines union status but not the wage. Unfortu- nately, there are few obvious candidates among available measures. A less recognized but no less important shortcoming is that the selection model (as typically employed in the literature) is incompatible with the two-sided selection process that character- izes union status determination. Longitudinal evidence (Section V) implies that there is positive selection into unions (i.e., positive unmeasured attributes) among workers with low levels of measured skill and negative selection among workers with high levels of measured skill. As discussed by Card (1996), however, selection models used in the literature produce identical selectivity terms for those with equivalent probabil- ities of being a union member. Those in the bottom and top of the skill distribution have roughly equal union density rates (Card, 1996), implying that these workers are assigned similar selectivity adjustment terms, wholly inconsistent with there being two- sided selection. It is not surprising that selection models produce unreliable estimates of union wage effects. 5
Absent the ability to estimate the full model shown above, a natural approach would be to "instrument" union status in order to avoid bias in the wage equations due to unmeasured wage determinants correlated with union status. But such an approach does not avoid the inherent problem of identifying appropriate instruments (i.e., good predictors of union status not correlated with unmeasured skills or other wage deter- minants). Apart from the issue of unmeasured skills, a union wage effect identified through IV methods would strictly apply only to the exogenous variation in union sta- tus associated with that particular variable(s) (Angrist and Krueger, 2001). It is uncer- tain whether such an estimate would be close to the average gap obtained (theoretically) with respect to all exogenous variation in union status. Despite these concerns, "dis- covery" of appropriate instruments, or other sources of exogenous variation in union status, would provide an important step toward estimation of unbiased union gaps.
In practice, union wage gaps are typically estimated with union status treated as exogenous. Union wage gaps can be and sometimes are estimated based on separate union and nonunion wage equations (Bloch and Kuskin, 1978). Decomposition of the union-nonunion wage differential into portions explained by differences in the X's and a portion that is a union wage premium (i.e., due to different coefficients or payoffs in the union sector), begins with the following (nonunique) identity:
BARRY T. HIRSCH 239
W u - W n -- (Xu-Xn)~n + (~u -~n)Xu ' (4)
where lowercase w and x now represent m e a n values. Here the total union wage dif- ferential w u - w n is shown as the sum of the portion explained by differences in the X's, evaluated using nonunion betas, and the union wage premium or gap, measured by union mean characteristics (X's) times the difference in coefficients (note that this portion includes the difference in intercepts). Coefficients (apart from the intercept) tend to be smaller or "flatter" in the union than in the nonunion sector due to greater wage standardization in the union sector and because of greater homogeneity in the union work force for a given set of measured characteristics. In calculating the union gap (the right-hand-side term in (4)), "flatter" union betas are more than offset by a larger union intercept. 6
The simplest and most common method for obtaining union wage gap estimates is the single equation approach:
w = xl] + FU + ~. (5)
This is simply a restricted form of the general model, making the assumptions that union status is exogenous and slope coefficients equal, with the union gap F meas- ured by the difference in the union and nonunion intercepts. For estimates from the pri- vate sector, this simple method produces an estimate not too different from that obtained from the right-hand-side term in equation (4). Estimates of the private sector wage gaps shown in subsequent sections will be based on a single equation (by year), as seen in equation (5).
Cho ice o f Con t ro l Variables. Estimates of the union gap can differ depending on the choice of control variables. That being said, most wage equations contain a fairly standard set of controls and, with a few exceptions noted below, estimates do not vary too greatly because of differences in controls (for an analysis, see Lewis, 1986; Blanch- flower and Bryson, 2002). One of the more important choices is the use of occupa- tion and industry controls (dummies). In general, control for occupation (even at a very broad level) is associated with higher union wage gap estimates, since union workers are concentrated in lower skill broad occupational categories. Detailed controls for industry, by contrast, tend to lower union gap estimates, since industry controls cap- ture the effects of unions on industry-wide wages and may control for compensating differentials associated with adverse working conditions.
Blanchflower and Bryson (2002), for example, omit occupation dummies and include relatively detailed industry (and state) dummies. Using otherwise similar data and estimation methods, they obtain lower CPS union wage gap estimates than do Hirsch and Schumacher (2004), who include broad occupation and industry dummies. My own preference is that broad occupation be included and interpreted as a crude control for unmeasured skills, since the schooling and potential experience variables available in the CPS are incomplete measures of human capital. Supporting this propo- sition is Hirsch and Schumacher's (1998) evidence that inclusion of occupation dum-
240 JOURNAL OF LABOR RESEARCH
mies sharply increases estimated union gaps in wage level equations but have little effect in wage change equations where unmeasured worker-specific skills (fixed effects) have been netted out.
Including industry dummies are appropriate to the extent that they measure dif- ferences in working conditions or skills not captured by occupation or other controls. 7 They also may be appropriate as controls if substantial industry rents exist independ- ent of union coverage. The concern with inclusion of detailed industry dummies is that they entangle industry differentials and union wage effects. For example, union bar- gaining power within industries included in the Census transportation category (e.g., airlines, railroads, the U.S. Postal Service) increases wages for union and nonunion workers. With detailed industry controls, one roughly makes a comparison of wages between union members and nonmembers within each detailed industry (since all get "credit" for the industry dummy), whereas absent industry dummies one makes a com- parison between union and nonunion workers with similar characteristics within broad industries. 8
Two controls typically excluded from regression estimates of union wage gaps are employer size (company and establishment size) and years of tenure with a worker's current employer. Neither of these wage correlates is available in the monthly CPS earnings files. Each of these exclusions leads to higher union gap estimates since employer size and tenure are positively correlated with earnings and union status. Whether it is better or worse to include these variables is not clear. The union wage gap is largest among small employers and relatively small among large employers. That is, unions do not increase wages by very much over and beyond what is obtained by nonunion employees in large firms and establishments. The wage advantage associ- ated with employer size appears to be some combination of human capital (measured and unmeasured) matched with physical capital and economic rents (Brown and Med- off, 1989; Oi and Idson, 1999). If the size advantage were entirely due to skill, the ques- tion would then arise whether the matching on skill seen among nonunion employers applies equally to union employers. (Section V discusses unions and unmeasured skills.) If not, inclusion of employer size would bias downward union gap estimates. If matching on skill by large employers were the sole source of the size-wage advan- tage and occurred in both union and nonunion firms, control for employer size would be appropriate. My reading of the literature is that skill differences are insufficient to account for size-wage advantage in general and that selection on skill is less likely in union than in nonunion establishments. If my assessment is correct, exclusion of employer size may produce a less biased estimate of the union gap than would inclu- sion, albeit in opposite directions.
Control for tenure when estimating a union wage gap is problematic. The argu- ment for inclusion is based on the presumption that tenure measures accumulated skills beyond those captured by an experience (or potential experience) variable. But length of tenure with an employer is simply an inverse function of quits (Farber, 1999). Quits are lower in union firms because of higher wages, benefits (e.g., defined-benefit pen-
BARRY T. HIRSCH 241
sion plans that penalize mid-career quits), and union voice (Freeman, 1980). Thus, causality runs not only from tenure to wages but also from wages to tenure (Abowd and Kang, 2001; Farber, 1999). Inclusion of tenure necessarily biases the union gap downward since the tenure coefficient reflects in part how wages affect quits. To the extent that tenure measures skills not reflected in general experience and other con- trol variables, its exclusion biases the union gap upward.
III. Measurement Issues: Match Bias and Misclassification of Union Status
Data quality is an important concern in most empirical endeavors. Estimation of union wage gaps is no exception. This section provides discussion of two measurement issues. The first issue, "match bias," refers to the downward bias in union gap estimates due to earnings imputation procedures that do not include union status as a match criterion. This problem is not well known, but has a major impact on union gap estimates. The second issue - - misclassification in union status - - is a well-known problem. Mis- classification is generally thought to cause a substantial bias in longitudinal estimates of the union wage gap, but to have little effect on wage level estimates. Discussion here suggests that misclassification has a sizable effect on wage level estimates when true union density is low, as in the U.S. private sector. Taken together, match bias asso- ciated with earnings imputation and measurement error from misclassification of union status cause a large downward bias in estimates of union wage effects.
Match Bias from Earnings Imputation. A substantial proportion of workers sur- veyed in the CPS and in other household surveys do not report earnings, and these indi- viduals have their earnings imputed by the Census. As analyzed by Hirsch and Schumacher (2004), earnings imputation in the CPS causes a substantial downward bias in union wage gap estimates, currently about 5 percentage points. Because of increases in nonresponse over time, match bias affects the trend as well as level of union gap estimates. CPS estimates that fail to account for match bias greatly under- state the magnitude of the union gap and overstate a downward trend in the gap evi- dent since the mid 1980s.
The monthly CPS-ORG (outgoing rotation group) files are a principal source of union gap estimates. Individuals who either refuse or are unable to report weekly earn- ings have earnings imputed using a "cell hot deck" method that matches each nonre- spondent to an earnings "donor" with an identical set of match characteristics. There are 14,976 "cells" or combinations of match variables. Match criteria include categor- ical variables for schooling, age, occupation, hours worked, gender, and receipt of tips, commissions, or overtime. They do not include sectoral variables such as union status or industry.
Even if the Census matching provides an unbiased measure of average earnings, wage differential estimates are systematically understated when the attribute being stud- ied is not a criterion used by the Census to match donors to nonrespondents. These include, among others, union-nonunion, industry, and public-private wage gap esti-
242 JOURNAL OF LABOR RESEARCH
mates. Hirsch and Schumacher (2004) derive a general expression for match bias. 9 Bias in the union wage gap, absent covariates, is shown to equal
B = [(1-pu)fl u + Pn~nlF, (6)
where F is the unbiased log wage gap and the term in brackets is the attenuation in the gap estimate. The terms i l u and fl n measure the rate of imputation or nonresponse for union and nonunion workers, whereas Pu and Pn measure the proportion of union donors matched to union and nonunion workers. The attenuation term in brackets is equal to the sum of match error rates, the proportion of false negatives (nonunion donors matched to union nonrespondents) and false positives (union donors matched to nonunion nonrespondents), l0
Note that if the nonresponse rate for union and nonunion workers is similar (f2 u = fl,,) and the rate at which each is matched to a union donor is equivalent (Pu = P,,), equation (6) reduces to:
B = f~r. (7)
In this case, match bias can be approximated by f2F, where f2 is the proportion of work- ers with imputed earnings, and F is a log wage gap estimate free of match bias. Stan- dard wage gap estimates from CPS samples including allocated earners must be multiplied by 1/(1-~) to approximate a wage gap free of match bias. For example, if 30 percent of the estimation sample has earnings imputed, the gap estimate is attenu- ated by about 30 percent. Intuitively, the 30 percent of the sample for whom earnings is imputed displays little or no union gap, since both union and nonunion nonrespon- dents are matched to similar proportions of union and nonunion donors.
Introduction of covariates increases the downward bias in gap estimates due to earnings imputation. Hirsch and Schumacher explain how this can be likened to right- hand-side measurement error bias and employ a bias expression developed by Card (1996).1i Correlation between union status and other match criteria reduces bias via improvements in imputation match quality. For a given match quality, however, cor- relation between union status and right-hand-side covariates exacerbates bias in the union coefficient, since bias increases with the ratio of error variance to total variance conditional on covariates.
Hirsch and Schumacher compare the difference in union gap estimates in sam- ples including and excluding nonrespondents with the theoretical match bias (from Card) based on union and nonunion imputation and donor match rates and the corre- lation between union status and all other control variables. They conclude that exclud- ing imputed earners from the estimation sample is a reasonable approach, the degree of observed attenuation being highly similar to the nonresponse or imputation rate. They show, however, that true bias exceeds the observed attenuation, with the nonre- spondent population having a set of characteristics associated with a relatively high union gap. In short, the simplest approach for researchers is to exclude imputed earn- ers from their estimation samples. This avoids the severe match bias that accompa-
BARRY T. HIRSCH 243
nies wage gap estimates associated with non-match criteria. In the case of union wage gaps, however, even this approach leaves gap estimates slightly biased downward.
Census imputation rates and the ability to identify imputed earners have varied over time, making it difficult to obtain time-consistent union gap estimates. For example, the 1973-1978 May CPS files do not provide imputed earnings for nonrespondents (earnings are recorded as missing). The apparent sharp decline in CPS union wage gap estimates after 1978, viewed as a puzzle in the literature (Freeman, 1984; Lewis, 1986), is in large part a result of the inclusion of imputed earners in CPS estimation samples beginning in 1979 following their exclusion in 1973-1978. During the period 1989-1993, only about a fifth of those with imputed earnings are identified as such by the Census allocation flag. For those years, Hirsch and Schumacher identify imputed earnings based on whether or not the "unedited" earnings field value is missing or con- tains an earnings value. Revisions in the earnings questions beginning in 1994 increased complexity and rates of imputation. There were no valid allocated earnings flags included with the CPS-ORG during 1994 and most of 1995. Hirsch and Schumacher address these issues and construct time-consistent union gap estimates for 1973-2001 that are purged of match bias.
Misclassification Bias. A second measurement issue concerns bias from the mis- classification of union status. Random measurement error on a right-hand-side variable, such as union status, biases the coefficient toward zero, with attenuation increasing with the ratio of noise to signal. 12 The principal source of information on CPS report- ing error in union status comes from a January 1977 CPS validation study that com- pared employer reports of union status with worker-reported union status in the CPS (Mellow and Sider, 1983). Freeman (1984) and Card (1996) have used information from the validation study to adjust longitudinal union wage gaps for misclassification bias. Card concludes that both workers and employers misreport union status and that misreporting is roughly symmetrical, the probability of a nonunion worker misreport- ing union status is equal to the probability of a union worker misreporting. Card's best estimate is that the misclassification rate for union status is between 2.5 and 3 per- cent. Based on Card's analysis, Farber and Western (2002), for example, assume a sym- metric misclassification rate of 2.7 percent in order to calculate a "corrected" union density series for the United States.
I am not aware of any other data source with which to compare the 1977 CPS val- idation results. But there are reasons to be cautious in placing too much weight on esti- mates from this single survey. First, the sample size is small: Card's calculations from the validation survey were based on 1,718 men age 24-66. Second, as pointed out by Card, the union status question asked of employers and employees in the CPS valida- tion survey is not identical to the union question(s) asked of employees in the CPS. 13 Misclassification rates could differ across the two sets of questions, although it is not obvious which set of questions should produce a higher error rate. Finally, the valida- tion survey is now a quarter century old. Because of the small sample sizes, differences in the union question, and age of the survey, it is easy to imagine that the true union misclassification rate is below or above, say, 2.7 percent. In the discussion below, I use
244 JOURNAL OF LABOR RESEARCH
a "conservative" estimate of a 2 percent misclassification rate. Subsequent analysis presents union gap estimates adjusted for 1, 2, and 3 percent misclassification rates.
Misclassification bias is a first-order concern for longitudinal studies, which iden- tify the union wage effect by the partial correlation of wage change with respect to changes in union status. Because true changes in union status over short time periods is a low-frequency event, much of the measured union status change reflects report- ing error (Mincer, 1983; Freeman, 1984; Card, 1996)J 4 Freeman and Card conclude that following adjustment for misclassification bias, longitudinal union wage gap esti- mates are similar to those obtained from OLS wage level regressions.
In contrast to the longitudinal studies, misclassification bias has not been regarded as serious for the estimation of union gaps from wage level regressions. 15 This assump- tion should be reconsidered. As Farber and Western (2002) show in their analysis of union density, were true union density 50 percent, symmetric misclassification would not bias density estimates, but bias becomes more serious as union density moves toward zero or one hundred percent. For example, if true union density were zero and there were a 2 percent misclassification rate, all 2 percent of the measured union den- sity would be due to misclassification.
Letting u* be the true but unobserved union status and u be observed union sta- tus, Farber and Western (2002) derive the following relationship between true union density fi* and observed union density t~ (likewise, see Card, 1996):
a* = (~-z,)/(l-2z,), (8)
where ~ is the union misclassification rate, assumed in (8) to be the same for union and nonunion workers. For example, given an observed union density in the private sector of 9 percent in 2001and assuming that the misclassification rate is 2 percent, true union density is 7.3 percent (that is, (.09-.02)/(1-.04) = .0729).
I am concerned with bias in the estimation of union wage gaps, and not the meas- urement of union density. Given high nonunion density, a 2 percent misreporting rate distorts by very little observed nonunion wages. However, observed private sector union density is below 10 percent, implying that the proportion misclassified in the union sample is high and that union wages are understated accordingly. Thus, a sub- stantial downward bias exists for standard union wage gap estimates, at least those for the private sector.
To estimate the bias in union gap estimates resulting from misclassification error, I rely on Card's attenuation coefficients. An attenuation coefficient, y, is bounded [0, 1], with y = 1.0 implying no attenuation or bias, and 7= 0 implying complete attenu- ation or a coefficient that goes to zero. Absent covariants, Card (1996, p. 959) derives the attenuation coefficient ~ equal to:
= t~*/a [(q~-ti) / (l-a)]. (9)
Here ql = Prob(u = 1 I a* = 1), the probability of a true union member being clas- sified as union. This is simply equal to (l-A,) or .98, if we assume a misclassification
BARRY T. HIRSCH 245
rate ~, equal to .02. As previously stated, t~* and a are the true and observed union densities, respectively, with a* = (t~-~,)/(1-2~).
Based on equation (9) above and assuming a misclassification rate ~, equal to .02 and an observed private sector union density ~ = .09, the implied attenuation is 7O = .792. Thus, private sector union wage gaps (unadjusted for covariates) are biased down- ward by a fifth (.208) given a misclassification rate of 2 percent, and by considerably more if misclassification exceeds 2 percent.
Attenuation is more severe given positive correlation between union status and other regression covariates. Letting R 2 be the coefficient of determination from a regres- sion of observed union status on other covariates, Card (1996, p. 960) derives an atten- uation coefficient that for our application is equal to:
= [7~ 1-2~))]/( 1 -R2). (10)
If R e were equal to zero, ~t I = 7 ~ Assuming that R 2 = . 1 I, its average value across recent years (Hirsch and Schumacher, 2004), the attenuation coefficient is ~,l = .761, which implies that private sector union gap estimates are biased downward by almost a quarter (.239). Stated alternatively, private sector union wage gap estimates (for recent years) must be multiplied by 1/~ = 1.31 to eliminate misclassification bias.
Downward bias in the union coefficient is highly sensitive to the rate of mis- classification, which I have assumed to be 2 percent (1 person in 50). A misclassifi- cation rate of ~ = .03 or 3 percent implies 7O = .686 and yl = .642. In short, downward bias in standard union gap estimates may be far more severe than previous figures sug- gest. Unfortunately, we simply know far too little about actual union misclassifica- tion rates. Given the importance of attenuation bias for low-frequency outcomes (e.g., union status in the private sector), future CPS validation surveys by the Census and BLS would have high value added.
The misclassification bias discussed in this section adds to what is already a sub- stantial downward bias from imputation mismatch on union status. Obviously, atten- uation from measurement error is less severe if misclassification rates are low or union density is high. 16 The clear implication of this section is that measurement error bias should be carefully considered not only in longitudinal analyses of union wage gaps, but also in wage level analyses. Moreover, the severity of this bias has increased over time as union density has fallen in the private sector, at the same time that match bias from imputation has worsened as CPS nonresponse rates have increased. Both mis- classification and match bias result in standard analyses understating the level of the union wage gap and overstating its decline. We turn to this evidence below.
IV. Private Sector Union Wage Effects Over Time
In this section, changes over time in the U.S. private sector union wage gap are exam- ined, based on regression results from the CPS. Following the analysis in the previ- ous section, results are presented based on standard CPS samples with imputed earners included, with imputed earners excluded, and with alternative assumptions about the
246 JOURNAL OF LABOR RESEARCH
rate of union misclassification (1, 2, and 3 percent). Union wage gap estimates increase substantially once imputed earners are excluded, consistent with a downward match bias from imputation described in Hirsch and Schumacher (2004). As described in the previous section, union gap estimates also increase substantially with the assumed rate of misclassification. The downward trend in the private sector union gap seen in standard estimates from the CPS is shown to result in part from attenuation due to match bias and misclassification bias.
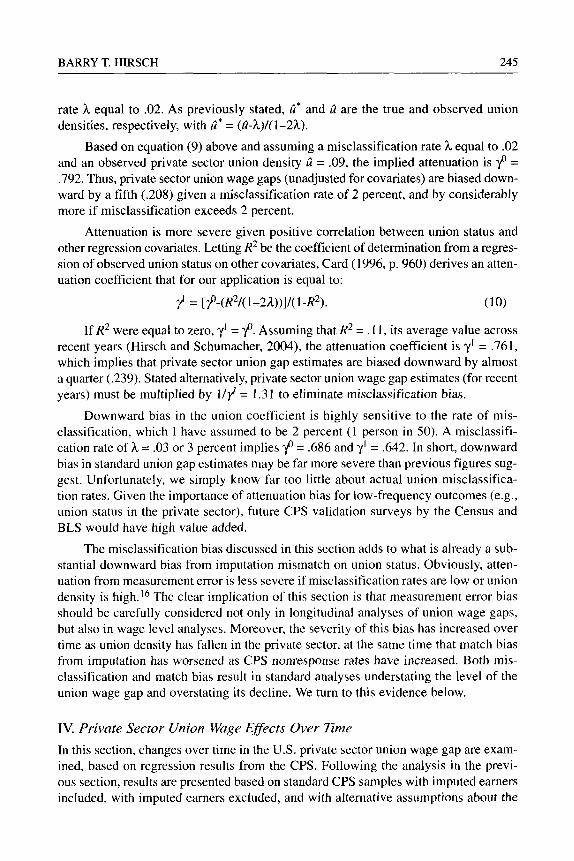
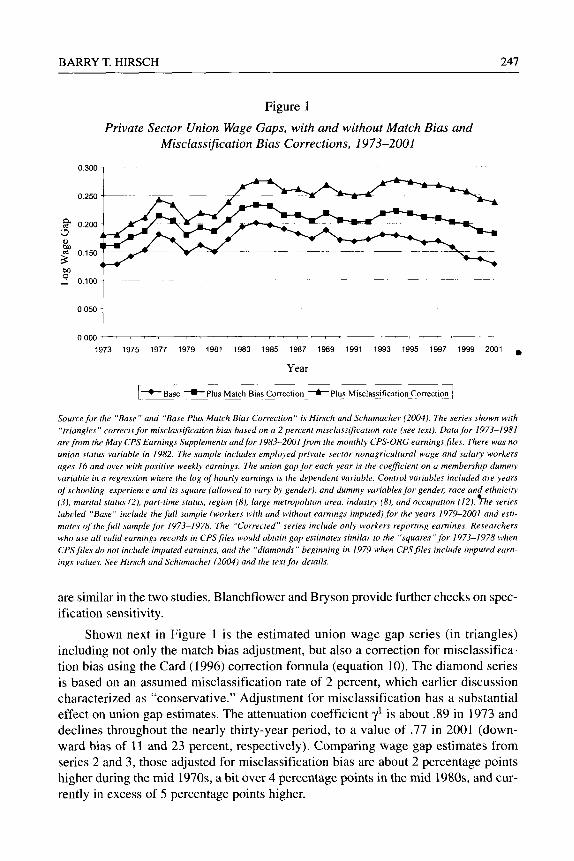
Union Wage Gaps with Match Bias and Misclassification Rate Adjustments. Fig- ure l shows estimates of private nonagricultural sector union wage gaps from the CPS for 1973-2001, taken from recent work by Hirsch and Schumacher (2004). 17 The base series in Figure 1 (shown in diamonds) provides estimates from the sample including workers with imputed as well as reported earnings; hence, these estimates suffer from the downward match bias described in the previous section. 18 The next series (in squares) provides correction for match bias by omitting workers whose earnings are allocated (for details, see Hirsch and Schumacher, 2004). As evident from the two series, inclusion of imputed earners biases union estimates gap downward roughly 3 4 percentage points prior to 1994 and by roughly 5 percentage points in years since 1999. Standard estimates including workers with imputed earnings tend to understate the magnitude of the union wage gap, but exaggerate its decline.
Relying on estimates from the series corrected for match bias, the average pri- vate sector union gap rose during the 1970s, hit a high of .23 in 1984, and has slowly declined since that time, the exception being the early 1990s economic slowdown. By 2001, the private sector union gap is estimated to be . 18 log points, not too far above the 15 percent "conventional wisdom" based on a much earlier period. The CPS sam- ple including imputed earners, which makes up 30 percent of the CPS sample, pro- duces a union wage gap estimate of . 13 in 2001. The differences between series 1 and 2 illustrate clearly that union wage gap estimates from the CPS must account for what is a severe downward bias, either through removal of imputed earners or the use of alternative imputation methods (Hirsch and Schumacher, 2004).
Apart from the issue of match bias due to Census earnings imputation, are the esti- mates in Figure 1 consistent with what other researchers would obtain? A recent paper by Blanchflower and Bryson (2002) helps answer this question. Blanchflower and Bryson also use the CPS for 1973-2001 and provide adjustments for imputation bias based on the methods described in Hirsch and Schumacher. However, they choose a specifica- tion that excludes broad occupation dummies but includes rather detailed industry dum- mies and state fixed effects. For reasons described in an earlier section, each of these adjustments drive down the union premium. Moreover, correlation between union sta- tus and the other covariates in the Blanchflower-Bryson specification will be higher than in Hirsch-Schumacher, since union status differs substantially by detailed indus- try and state. As seen in the previous section, such correlation exacerbates downward bias in the union gap estimate owing to misclassification error in union status. Whereas our log wage gap estimate for 2001, corrected for match bias, is .18, the correspon- ding Blanchflower-Bryson estimate is . 14. Changes in the union wage gap over time
BARRY T. HIRSCH 247
Figure 1
Private Sector Union Wage Gaps, with and without Match Bias and Misclassification Bias Corrections, 1973-2001
0.300
0.250
r~ 0.200
0.150
o ~,3 0.100 . . . . . . . . . . . . .
0.050
0.000 1973 1975 1977 1979 1981 1983 1985 1987 1989 1991 1993 1995 1997 1999 2001 i ,
Year
I_ Base Plus Match Bias Correction Plus Misclassification Correction ! ----II--- at
Source for the "Base" and "Base Plus Match Bias Correction" is Hirsch and Schumacher (2004). The series shown with "triangles" corrects for misclassification bias based on a 2 percent misclassification rate (see text). Data for 1973-1981 are from the May CPS Earnings' Supplements and fi)r 1983-2001 from the monthly CPS-ORG earnings tiles. There was no union status variable in 1982. The sample includes employed private sector nonagricultural wage and s'alary workers ages 16 and over with positive weekly earnings. The union gap for each year is the coefficient on a membership dummy variable in a regression where the log of hourly earnings is the dependent variable. Control variables included are years o f schooling, experience and its square (allowed to v a ~ by gender), and dummy variables for gender, race and ethnicity (3), marital status (2), part-time status, region (8), large metropolitan area industry (8), and occupation (12). The series labeled "Base" include the full sample (workers with and without earnings imputed)for the years 1979-2001 and esti- mates of the full sample for 1973 1978. The "Corrected" series include only workers reporting earnings'. Researehers who use all valid earnings records in CPS files would obtain gap estimates similar to the "squares " for 1973-1978 when CPS files do not include imputed earnings, and the "diamonds" beginning in 1979 when CPS files include imputed earn- ings values. See Hirsch and Schumacher (2004) and the text fi)r details.
are similar in the two studies. Blanchflower and Bryson provide further checks on spec- ification sensitivity.
Shown next in Figure 1 is the estimated union wage gap series (in triangles) including not only the match bias adjustment, but also a correction for misclassifica- tion bias using the Card (1996) correction formula (equation 10). The diamond series is based on an assumed misclassification rate of 2 percent, which earlier discussion characterized as "conservative." Adjustment for misclassification has a substantial effect on union gap estimates. The attenuation coefficient 71 is about .89 in 1973 and declines throughout the nearly thirty-year period, to a value of .77 in 2001 (down- ward bias of 11 and 23 percent, respectively). Comparing wage gap estimates from series 2 and 3, those adjusted for misclassification bias are about 2 percentage points higher during the mid 1970s, a bit over 4 percentage points in the mid 1980s, and cur- rently in excess of 5 percentage points higher.
Fig
ure
2
Pri
vate
Sec
tor
Uni
on W
age
Gap
s w
ith
Alt
erna
tive
Mis
clas
sifi
cati
on R
ate
Ass
umpt
ions
, 19
73-2
001
0.35
0.3
]
0.25
,ol
0.2
0.15
0.1 19
73
1975
19
77
1979
19
81
1983
19
85
1987
19
89
1991
19
93
1995
19
97
1999
20
01
Yea
r
[+
1% R
ate
2% R
ate
3% R
ate
--B
--
A
See
the
note
to
Fig
ure
1.
Eac
h se
t of w
age
gap
esti
mat
es s
tart
s w
ith
the
seri
es c
orre
cted
fo
r m
atch
bia
s, fo
llow
ed b
y co
rrec
tion
s fo
r m
iscl
assi
fica
tion
bi
as b
ased
on
assu
med
rat
es o
f l
pere
ent
(dia
mon
ds),
2 p
erce
nt (
squa
res)
, an
d 3
perc
ent
(tri
angl
es).
Se
e th
e te
xt fo
r de
tail
s.
4~
Z > O
;>
0 >
BARRY T. HIRSCH 249
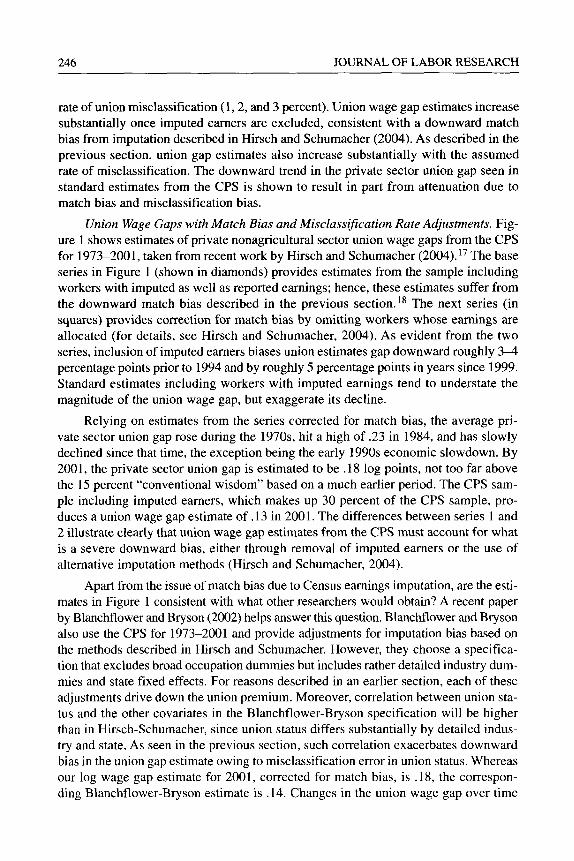
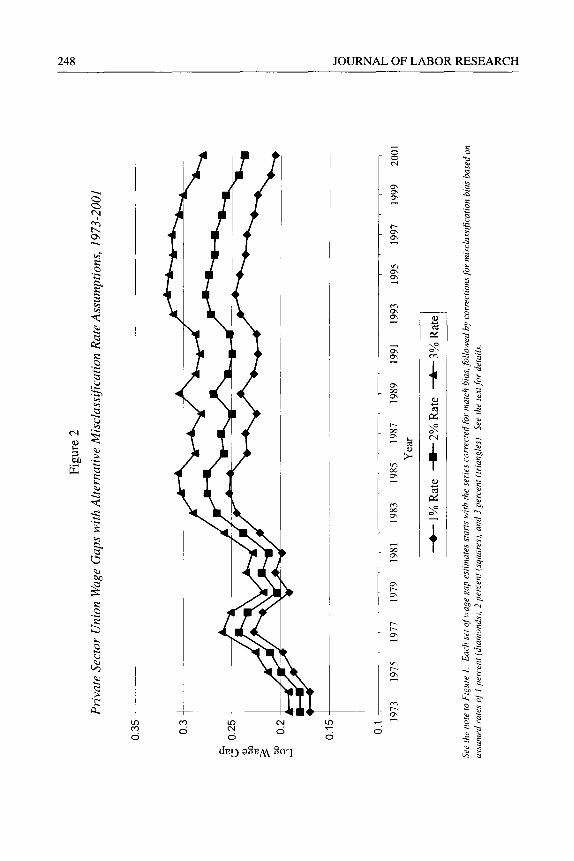
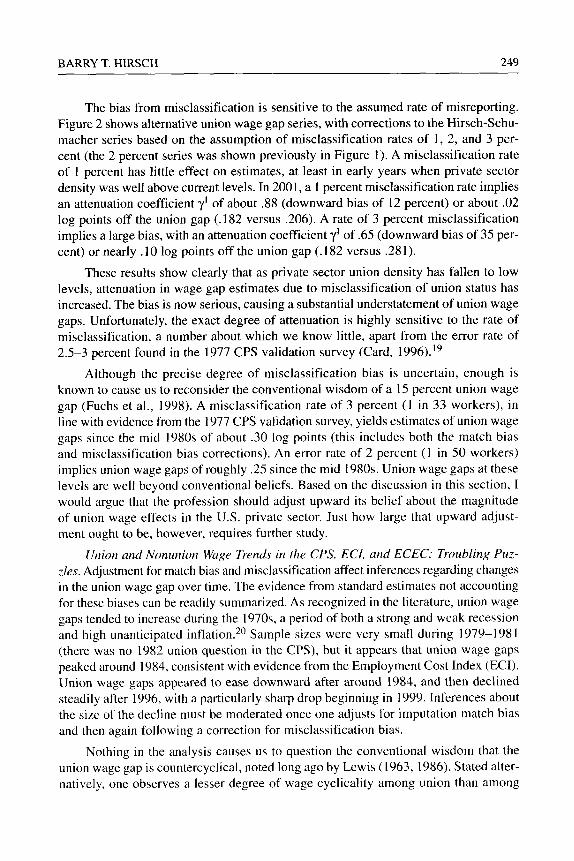
The bias from misclassification is sensitive to the assumed rate of misreporting. Figure 2 shows alternative union wage gap series, with corrections to the Hirsch-Schu- macher series based on the assumption of misclassification rates of 1, 2, and 3 per- cent (the 2 percent series was shown previously in Figure 1). A misclassification rate of 1 percent has little effect on estimates, at least in early years when private sector density was well above current levels. In 2001, a 1 percent misclassification rate implies an attenuation coefficient 71 of about .88 (downward bias of 12 percent) or about .02 log points off the union gap (.182 versus .206). A rate of 3 percent misclassification implies a large bias, with an attenuation coefficient 71 of .65 (downward bias of 35 per- cent) or nearly. 10 log points off the union gap (. 182 versus .281).
These results show clearly that as private sector union density has fallen to low levels, attenuation in wage gap estimates due to misclassification of union status has increased. The bias is now serious, causing a substantial understatement of union wage gaps. Unfortunately, the exact degree of attenuation is highly sensitive to the rate of misclassification, a number about which we know little, apart from the error rate of 2.5-3 percent found in the 1977 CPS validation survey (Card, 1996). 19
Although the precise degree of misclassification bias is uncertain, enough is known to cause us to reconsider the conventional wisdom of a 15 percent union wage gap (Fuchs et al., 1998). A misclassification rate of 3 percent (1 in 33 workers), in line with evidence from the 1977 CPS validation survey, yields estimates of union wage gaps since the mid 1980s of about .30 log points (this includes both the match bias and misclassification bias corrections). An error rate of 2 percent (1 in 50 workers) implies union wage gaps of roughly .25 since the mid 1980s. Union wage gaps at these levels are well beyond conventional beliefs. Based on the discussion in this section, I would argue that the profession should adjust upward its belief about the magnitude of union wage effects in the U.S. private sector. Just how large that upward adjust- ment ought to be, however, requires further study.
Union and Nonunion Wage Trends" in the CPS, ECI, and ECEC: Troubling Puz- zles. Adjustment for match bias and misclassification affect inferences regarding changes in the union wage gap over time. The evidence from standard estimates not accounting for these biases can be readily summarized. As recognized in the literature, union wage gaps tended to increase during the 1970s, a period of both a strong and weak recession and high unanticipated inflation. 2~ Sample sizes were very small during 1979-1981 (there was no 1982 union question in the CPS), but it appears that union wage gaps peaked around 1984, consistent with evidence from the Employment Cost Index (ECI). Union wage gaps appeared to ease downward after around 1984, and then declined steadily after 1996, with a particularly sharp drop beginning in 1999. Inferences about the size of the decline must be moderated once one adjusts for imputation match bias and then again following a correction for misclassification bias.
Nothing in the analysis causes us to question the conventional wisdom that the union wage gap is countercyclical, noted long ago by Lewis (l 963, 1986). Stated alter- natively, one observes a lesser degree of wage cyclicality among union than among
250 J O U R N A L OF L A B O R R E S E A R C H
em
~a
i<_.,
0 0 0 0 0 0 CO O,,I ~ 0 ~ 04 0 0 0 0 0 0 o o o o o, o
oau~JaJJ.~(1 a~ueqD a~'eA~ N-fl
O r O
v~oo~ ~ .~
s ,~
vooo~ .~ ~
l'666I ~ "~ ~ ~
ffL661 m -s ~ .~ ~-~
~.966, ~ ~ ~, ~~66~ ~ ~ l '~66| ~ ~ .~
ffE661 ~ ~
g'|66I ~ ' ~ ~'066I ~ ~ . ~
I'6861 ~ ~%
IfL86! ~ ~ e
ff9861 ~ ~
E'~861 ~ ~
1"#86I ~ -~
t7E861
Z:086!
1"6L61 ~ ~ .~
~"LL6I ~= ~
ff9L61 ~ ~ ~ . . ~
BARRY T. HIRSCH 251
nonunion workers. An article by Grant (2001) surveys the literature and provides new evidence, concluding that nonunion wages tend to be somewhat procyclical and union wages largely acyclical.
As seen in Figures 1 and 2, all union gap series indicate a decline in the gap since 1984, but the extent of the decline is affected by adjustments for imputation and mis- classification bias. Each of these adjustments lessens the decline in the union gap. In our preferred series with the 2 percent misclassification rate, much of the decline that occurs takes place in the years after 1997, a period when the labor market was relatively strong. This evidence supports the conclusion reached by Blanchflower and Bryson (2002) that there has been little underlying change in the union wage premium, the 1990s decline being the result of an unusually strong economy and likely to be temporary.
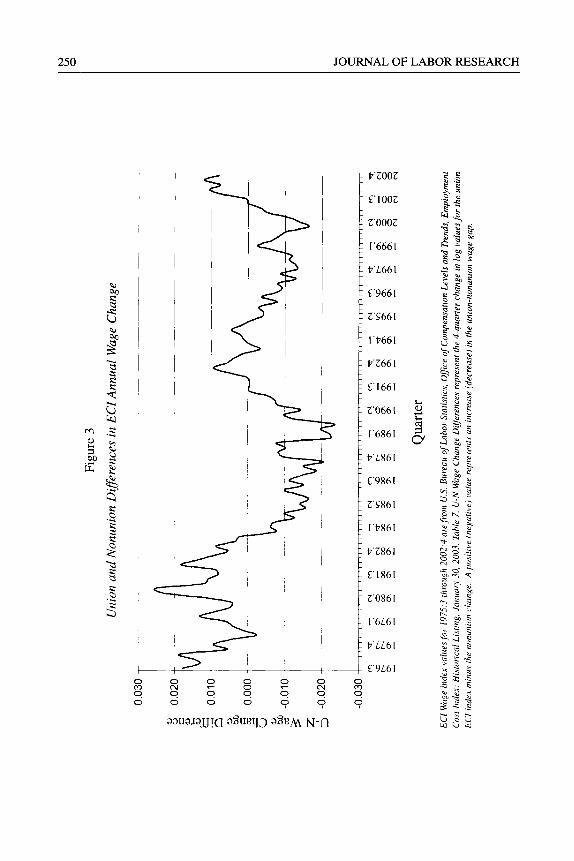
Does evidence on union and nonunion wages from other data surveys match the CPS? The most commonly used measure of wage growth is the Employer Cost Index (ECI), derived from the National Compensation Survey, published by BLS (USDOL, 2003). Its observational unit is occupation-by-establishment job cells observed in con- secutive quarters. The ECI measures quarterly wage and compensation growth and has separate indices for private sector union and nonunion jobs beginning in 1975:3. Shown in Figure 3 is an updated version of a figure from Hirsch, Macpherson, and Schumacher (2003) (hereinafter HMS). It provides ECI union-nonunion differences, by quarter, in rates of wage growth during the previous four quarters (thus beginning with 1976:3). A positive value indicates faster union than nonunion wage growth (a rising union gap) and a negative value indicates slower growth (a falling gap).
The ECI evidence is qualitatively the same as that seen in the CPS. As evident in Figure 3, union wage growth exceeded nonunion growth during the late 1970s and early 1980s, briefly during the early 1990s recession, and once again in late 2001 and 2002 during the most recent recession, consistent with a countercyclical wage gap (BLS, 2003). Despite the recent pattern, for most of the years since the early to mid-1980s, union wages have risen more slowly than have nonunion wages. Figures on total com- pensation indicate less of a decline in the union compensation gap than in the wage gap, with greater growth in union than in nonunion benefits (Hirsch et al., 2004).
Despite the broad similarity in the ECI and CPS evidence on relative union- nonunion wage growth, HMS identify several troubling puzzles. The ECI indicates far more rapid decline in relative union wages than seen in CPS regression analysis of union wage gaps. Decline in the ECI is similar to that seen in the unadjusted (i.e., non-regression) CPS figures. HMS show that about half of the CPS decline in the unad- justed union gap is accounted for by changes in the relative composition of union to nonunion wage attributes, with the remaining half representing decline in the adjusted gap. The puzzle is that the ECI is intended to represent a fixed-weight index, much akin to what is effected through regression controls. The ECI unit of observation holds the occupation, occupation skill level, industry, and establishment constant, as well as changes in employment (through the use of fixed weights). It cannot take into account (i.e., hold constant) worker characteristics such as schooling, age, or gender.
252 JOURNAL OF LABOR RESEARCH
Even more puzzling is that the Employer Costs for Employee Compensation (ECEC), also drawn from the NCS, shows a different pattern than the ECI. The ECEC uses current rather than fixed weights and allows job cells to move into and out of the sample. In principle, the ECEC should yield results more similar to the unadjusted CPS, rather than regression estimates. Surprisingly, the ECEC indicates highly simi- lar union and nonunion wage growth, at odds with both the ECI and the CPS (unad- justed or adjusted for worker characteristics and sector). HMS are unable to resolve these puzzles in a satisfactory manner.
A reasonable conclusion seems to be that the weight of the evidence shows a decline in relative union to nonunion wages. The magnitude of the decline is in doubt, as is the question of whether the decline since the mid- 1990s will be short-lived or per- manent. Closing over time between union and nonunion compensation has been less than the closing in wages. Blanchflower and Bryson (2002) conclude that the 1990s decline in the union gap is likely to be temporary, primarily the result of the unusually strong economy. Focusing on the CPS evidence in Figure l, it is clear that the series corrected for match bias and misclassification bias (the triangles) is more consistent with the "no trend thesis" than are uncorrected estimates (the diamonds). Given the increased competitiveness of the U.S. economy and the continuing decline in private sector union density, a rebound in the union gap to its peak level would be surprising. Evidence will tell (or may tell), but not for some time.
V. Employer~Employee Selection, the Skill-Upgrading Hypothesis, and Longitudinal Wage Gaps
Preceding sections have argued that union wage gaps are higher than standard esti- mates and conventional wisdom suggest. Whether union gap estimates well above 15 percent are plausible depends to no small degree on one's priors regarding the rela- tionship between union status and worker skills. This section addresses the issue, focus- ing on the skill-upgrading hypothesis.
Interpretation of union wage gap estimates depends in part on the correlation between union status and worker skills that are unmeasured in typical wage equations. 21 If unmeasured skills are positively correlated with union status, union gap estimates are likely to be biased upward, and vice-versa. A conventional argument, sometimes referred to as the "skill-upgrading" hypothesis, is that a union wage premium both allows and provides incentive for employers to upgrade the skill level of their work forces, offsetting part of the higher wage. Despite a substantial empirical effort to account for unmeasured skills and facilitate estimation of unbiased union gap estimates, the literature does not point clearly toward the existence of substantial skill upgrading in union workplaces.
Absence of clear-cut evidence in favor of skill upgrading by union employers is not so surprising once one realizes that such behavior need not follow from theory. Wessels (1994) has provided a simple but persuasive challenge to the skill-upgrading hypothesis. If firms upgrade in response to a union wage increase, the union can then
BARRY T. HIRSCH 253
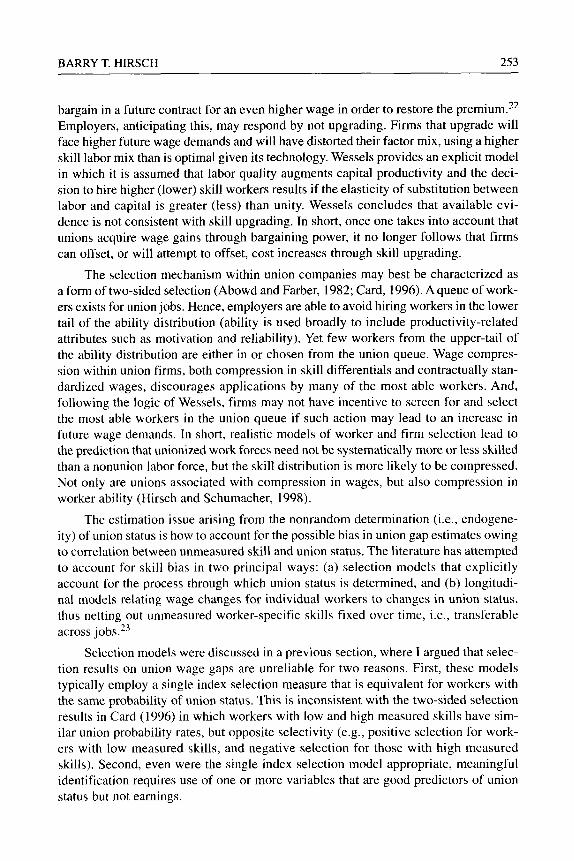
bargain in a future contract for an even higher wage in order to restore the premium. 22 Employers, anticipating this, may respond by not upgrading. Firms that upgrade will face higher future wage demands and will have distorted their factor mix, using a higher skill labor mix than is optimal given its technology. Wessels provides an explicit model in which it is assumed that labor quality augments capital productivity and the deci- sion to hire higher (lower) skill workers results if the elasticity of substitution between labor and capital is greater (less) than unity. Wessels concludes that available evi- dence is not consistent with skill upgrading. In short, once one takes into account that unions acquire wage gains through bargaining power, it no longer follows that firms can offset, or will attempt to offset, cost increases through skill upgrading.
The selection mechanism within union companies may best be characterized as a form of two-sided selection (Abowd and Farber, 1982; Card, 1996). A queue of work- ers exists for union jobs. Hence, employers are able to avoid hiring workers in the lower tail of the ability distribution (ability is used broadly to include productivity-related attributes such as motivation and reliability). Yet few workers from the upper-tail of the ability distribution are either in or chosen from the union queue. Wage compres- sion within union firms, both compression in skill differentials and contractually stan- dardized wages, discourages applications by many of the most able workers. And, following the logic of Wessels, firms may not have incentive to screen for and select the most able workers in the union queue if such action may lead to an increase in future wage demands. In short, realistic models of worker and firm selection lead to the prediction that unionized work forces need not be systematically more or less skilled than a nonunion labor force, but the skill distribution is more likely to be compressed. Not only are unions associated with compression in wages, but also compression in worker ability (Hirsch and Schumacher, 1998).
The estimation issue arising from the nonrandom determination (i.e., endogene- ity) of union status is how to account for the possible bias in union gap estimates owing to correlation between unmeasured skill and union status. The literature has attempted to account for skill bias in two principal ways: (a) selection models that explicitly account for the process through which union status is determined, and (b) longitudi- nal models relating wage changes for individual workers to changes in union status, thus netting out unmeasured worker-specific skills fixed over time, i.e., transferable across jobs. 23
Selection models were discussed in a previous section, where I argued that selec- tion results on union wage gaps are unreliable for two reasons. First, these models typically employ a single index selection measure that is equivalent for workers with the same probability of union status. This is inconsistent with the two-sided selection results in Card (1996) in which workers with low and high measured skills have sim- ilar union probability rates, but opposite selectivity (e.g., positive selection for work- ers with low measured skills, and negative selection for those with high measured skills). Second, even were the single index selection model appropriate, meaningful identification requires use of one or more variables that are good predictors of union status but not earnings.
254 JOURNAL OF LABOR RESEARCH
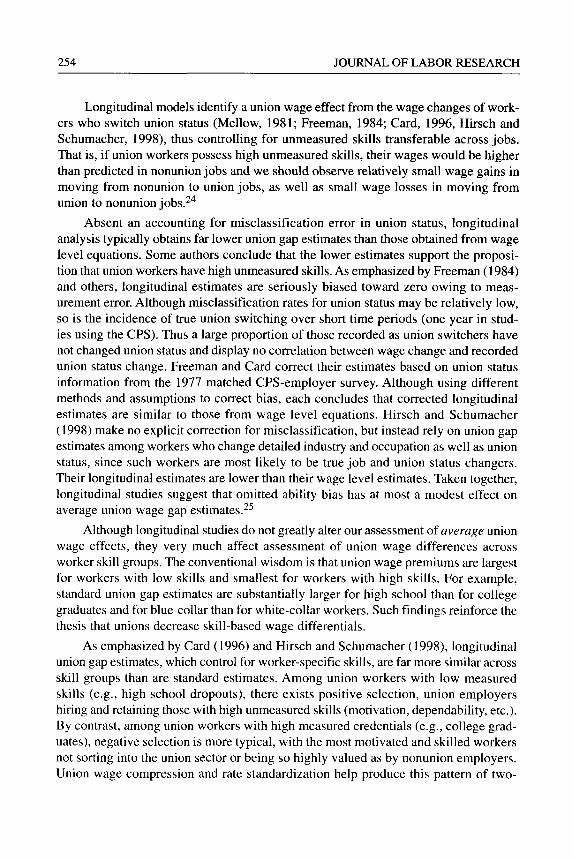
Longitudinal models identify a union wage effect from the wage changes of work- ers who switch union status (Mellow, 1981; Freeman, 1984; Card, 1996, Hirsch and Schumacher, 1998), thus controlling for unmeasured skills transferable across jobs. That is, if union workers possess high unmeasured skills, their wages would be higher than predicted in nonunion jobs and we should observe relatively small wage gains in moving from nonunion to union jobs, as well as small wage losses in moving from union to nonunion jobs. 24
Absent an accounting for misclassification error in union status, longitudinal analysis typically obtains far lower union gap estimates than those obtained from wage level equations. Some authors conclude that the lower estimates support the proposi- tion that union workers have high unmeasured skills. As emphasized by Freeman (1984) and others, longitudinal estimates are seriously biased toward zero owing to meas- urement error. Although misclassification rates for union status may be relatively low, so is the incidence of true union switching over short time periods (one year in stud- ies using the CPS). Thus a large proportion of those recorded as union switchers have not changed union status and display no correlation between wage change and recorded union status change. Freeman and Card correct their estimates based on union status information from the 1977 matched CPS-employer survey. Although using different methods and assumptions to correct bias, each concludes that corrected longitudinal estimates are similar to those from wage level equations. Hirsch and Schumacher (1998) make no explicit correction for misclassification, but instead rely on union gap estimates among workers who change detailed industry and occupation as well as union status, since such workers are most likely to be true job and union status changers. Their longitudinal estimates are lower than their wage level estimates. Taken together, longitudinal studies suggest that omitted ability bias has at most a modest effect on average union wage gap estimates. 25
Although longitudinal studies do not greatly alter our assessment of average union wage effects, they very much affect assessment of union wage differences across worker skill groups. The conventional wisdom is that union wage premiums are largest for workers with low skills and smallest for workers with high skills. For example, standard union gap estimates are substantially larger for high school than for college graduates and for blue-collar than for white-collar workers. Such findings reinforce the thesis that unions decrease skill-based wage differentials.
As emphasized by Card (1996) and Hirsch and Schumacher (1998), longitudinal union gap estimates, which control for worker-specific skills, are far more similar across skill groups than are standard estimates. Among union workers with low measured skills (e.g., high school dropouts), there exists positive selection, union employers hiring and retaining those with high unmeasured skills (motivation, dependability, etc.). By contrast, among union workers with high measured credentials (e.g., college grad- uates), negative selection is more typical, with the most motivated and skilled workers not sorting into the union sector or being so highly valued as by nonunion employers. Union wage compression and rate standardization help produce this pattern of two-
BARRY T. HIRSCH 255
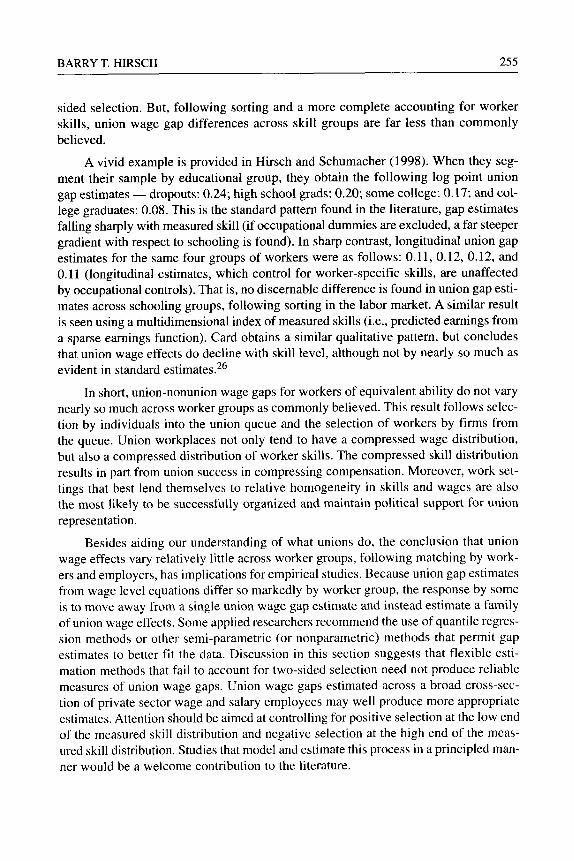
sided selection. But, following sorting and a more complete accounting for worker skills, union wage gap differences across skill groups are far less than commonly believed.
A vivid example is provided in Hirsch and Schumacher (1998). When they seg- ment their sample by educational group, they obtain the following log point union gap estimates - - dropouts: 0.24; high school grads: 0.20; some college: 0.17; and col- lege graduates: 0.08. This is the standard pattern found in the literature, gap estimates falling sharply with measured skill (if occupational dummies are excluded, a far steeper gradient with respect to schooling is found). In sharp contrast, longitudinal union gap estimates for the same four groups of workers were as follows: 0.11, 0.12, 0.12, and 0.11 (longitudinal estimates, which control for worker-specific skills, are unaffected by occupational controls). That is, no discernable difference is found in union gap esti- mates across schooling groups, following sorting in the labor market. A similar result is seen using a multidimensional index of measured skills (i.e., predicted earnings from a sparse earnings function). Card obtains a similar qualitative pattern, but concludes that union wage effects do decline with skill level, although not by nearly so much as evident in standard estimates. 26
In short, union-nonunion wage gaps for workers of equivalent ability do not vary nearly so much across worker groups as commonly believed. This result follows selec- tion by individuals into the union queue and the selection of workers by firms from the queue. Union workplaces not only tend to have a compressed wage distribution, but also a compressed distribution of worker skills. The compressed skill distribution results in part from union success in compressing compensation. Moreover, work set- tings that best lend themselves to relative homogeneity in skills and wages are also the most likely to be successfully organized and maintain political support for union representation.
Besides aiding our understanding of what unions do, the conclusion that union wage effects vary relatively little across worker groups, following matching by work- ers and employers, has implications for empirical studies. Because union gap estimates from wage level equations differ so markedly by worker group, the response by some is to move away from a single union wage gap estimate and instead estimate a family of union wage effects. Some applied researchers recommend the use of quantile regres- sion methods or other semi-parametric (or nonparametric) methods that permit gap estimates to better fit the data. Discussion in this section suggests that flexible esti- mation methods that fail to account for two-sided selection need not produce reliable measures of union wage gaps. Union wage gaps estimated across a broad cross-sec- tion of private sector wage and salary employees may well produce more appropriate estimates. Attention should be aimed at controlling for positive selection at the low end of the measured skill distribution and negative selection at the high end of the meas- ured skill distribution. Studies that model and estimate this process in a principled man- ner would be a welcome contribution to the literature.
256 JOURNAL OF LABOR RESEARCH
VI. Further Topics: Inequality, Public Sector Unions, Membership vs. Coverage, Compensation, and Working Conditions
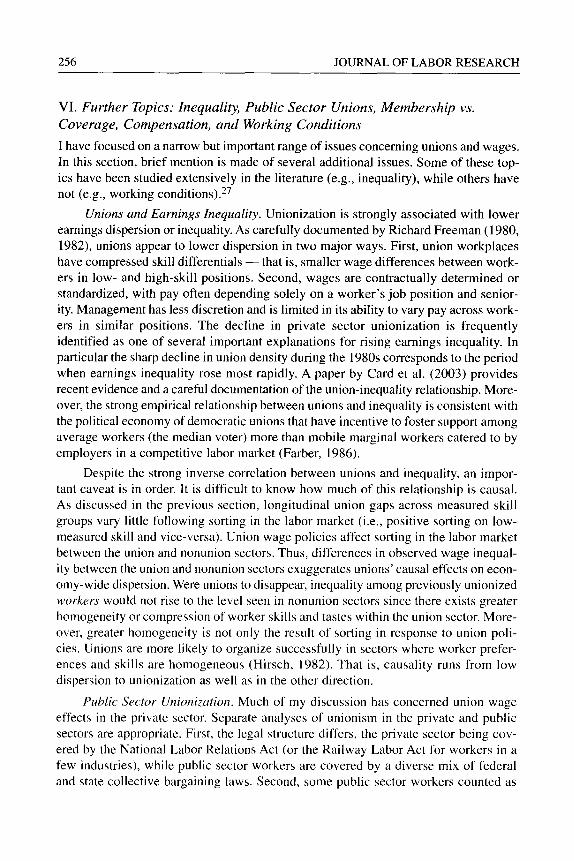
I have focused on a narrow but important range of issues concerning unions and wages. In this section, brief mention is made of several additional issues. Some of these top- ics have been studied extensively in the literature (e.g., inequality), while others have not (e.g., working conditions). 27
Unions and Earnings Inequality. Unionization is strongly associated with lower earnings dispersion or inequality. As carefully documented by Richard Freeman (1980, 1982), unions appear to lower dispersion in two major ways. First, union workplaces have compressed skill differentials - - that is, smaller wage differences between work- ers in low- and high-skill positions. Second, wages are contractually determined or standardized, with pay often depending solely on a worker's job position and senior- ity. Management has less discretion and is limited in its ability to vary pay across work- ers in similar positions. The decline in private sector unionization is frequently identified as one of several important explanations for rising earnings inequality. In particular the sharp decline in union density during the 1980s corresponds to the period when earnings inequality rose most rapidly. A paper by Card et al. (2003) provides recent evidence and a careful documentation of the union-inequality relationship. More- over, the strong empirical relationship between unions and inequality is consistent with the political economy of democratic unions that have incentive to foster support among average workers (the median voter) more than mobile marginal workers catered to by employers in a competitive labor market (Farber, 1986).
Despite the strong inverse correlation between unions and inequality, an impor- tant caveat is in order. It is difficult to know how much of this relationship is causal. As discussed in the previous section, longitudinal union gaps across measured skill groups vary little following sorting in the labor market (i.e., positive sorting on low- measured skill and vice-versa). Union wage policies affect sorting in the labor market between the union and nonunion sectors. Thus, differences in observed wage inequal- ity between the union and nonunion sectors exaggerates unions' causal effects on econ- omy-wide dispersion. Were unions to disappear, inequality among previously unionized workers would not rise to the level seen in nonunion sectors since there exists greater homogeneity or compression of worker skills and tastes within the union sector. More- over, greater homogeneity is not only the result of sorting in response to union poli- cies. Unions are more likely to organize successfully in sectors where worker prefer- ences and skills are homogeneous (Hirsch, 1982). That is, causality runs from low dispersion to unionization as well as in the other direction.
Public Sector Unionization. Much of my discussion has concerned union wage effects in the private sector. Separate analyses of unionism in the private and public sectors are appropriate. First, the legal structure differs, the private sector being cov- ered by the National Labor Relations Act (or the Railway Labor Act for workers in a few industries), while public sector workers are covered by a diverse mix of federal and state collective bargaining laws. Second, some public sector workers counted as
BARRY T. HIRSCH 257
members belong to employee associations that do not have collective bargaining rights or, more generally, the bargaining rights of public workers vary considerably across jurisdictions. Third, the impact of public sector workers may take place as much through the political process as through collective bargaining and show up not only in higher wages, but also in public appropriations and employment (Freeman and Med- off, 1984). Fourth, there is likely to be more misclassification error in union status in the public sector since what constitutes union membership and coverage may not be clear to s o m e workers. 28
As discussed previously, downward bias in union wage estimates from misclas- sification is a more serious problem than generally believed. Bias is a function of the ratio of noise to signal in the union measure. Misclassification in the public sector is probably more severe than in the private sector. Yet true density is far higher in the public than private sector. We simply do not have enough information to know whether misclassification bias is more or less severe in the public than in the private sector.
For the above reasons, estimation of private and public sector union gaps are best kept separate. My focus on private sector gaps should not be taken to imply that study of the public sector is not important. It is important and increasingly so. Whereas 26 percent of all union members and 28 percent of covered workers were government employees in 1977 (the year the CPS adopted its current set of union status ques- tions), corresponding figures were 44 and 45 percent in 2001 (Hirsch and Macpher- son, 2003).
Membership versus Coverage. Most of the literature on union wage gaps uses as its measure of union status a binary variable either for membership or coverage, com- paring the selected union group to everyone else. Few studies distinguish between the three groups - - union members, covered nonmembers, and non-covered nonmembers. Were there identical union wage effects from being a member and being a nonmem- ber covered by a collective bargaining agreement, one would get a lower union gap estimate using membership, since covered nonmembers would be included in the con- trol group (Jones, 1982). Just the opposite is found. As seen in Lewis (1986), the choice of union status variable typically has a small effect on union gap estimates, but mem- bership gaps typically are a little larger than are coverage gaps.
In the work shown in this study, a union membership variable is used, since the coverage variable was not available until 1977. The number of private sector covered nonmembers is sufficiently small so that their inclusion in the nonunion control group produces union wage effect estimates nearly equivalent to what would be obtained were covered nonmembers included as a distinct group (or removed from the analysis).
In U.S. studies that distinguish among the three groups, union members display a substantial wage advantage relative to covered nonmembers (Jones, 1982; Schu- macher, 1999; Budd and Na, 2000). For example, focusing exclusively on right-to- work states, where union gaps tend to be higher than across all states, Schumacher (1999) finds a -. 14 lower union gap for covered nonmembers than for members (and a - . 10 log wage difference when the estimation sample is limited to covered workers,
258 JOURNAL OF LABOR RESEARCH
members and nonmembers). An interesting question then arises. Why is there a wage advantage to membership versus coverage? Schumacher investigates a number of sources. He finds little evidence to support the following explanations for the gap: (a) higher unmeasured skills among members than covered nonmembers; (b) lower job tenure among covered nonmembers than among members; (c) higher misclassification rates for covered nonmembers; or (d) industry and occupational wage effects.
Schumacher (1999) and Budd and Na (2000) conclude that union wage gaps are lowest in industry-occupation sectors in which there are large numbers of "free rid- ers" (the ratio of nonmembers to total covered). What is not clear is the direction of causation. One possibility is that less free riding provides unions with greater bargaining power. Alternatively, covered workers may be less likely to free ride in jobs where they realize a substantial wage advantage. Both explanations are plausible and likely to mat- ter. It will be up to future studies to sort out the relative importance of these two expla- nations. 29
Compensation. Discussion to this point has been in terms of union wage effects. Ideally we would like to focus on compensation (wages plus benefits). The difficulty is that micro data sets providing worker characteristics (e.g., the CPS) at most pro- vide indicator variables on the receipt of benefits (e.g., pension payments and health insurance) but not the dollar value of benefits. Published data on employer costs for benefits, for example, from the BLS's Employer Costs for Employee Compensation surveys, do not permit the matching of dollar benefits to individual workers and their characteristics.
Although evidence is limited, that which exists indicates clearly that higher ben- efits are received by union than by nonunion workers. Work by Freeman (1981) finds that the union benefit gaps greatly exceed wage gaps, leading to a union compensa- tion gap that exceeds the wage gap by about 2 percentage points. Freeman finds the union benefit advantage particularly large for insurance and pensions.
Recent wage and benefit data from the Employer Costs for Employee Compen- sation indicates the large gap in benefits between union and nonunion workers. In 2001, the ECEC data (USDOL, 2002) show hourly compensation for nonunion workers of $19.98, $14.81 in wages and $5.18 in benefits (included those government mandated). Compensation for union workers is $27.80, $18.36 in wages and $9.45 in benefits. Cur- rent data confirm that union wage gaps understate union compensation gaps, perhaps substantially so. 3~
Working Conditions. A shortcoming of most union wage gap estimates, includ- ing those herein, is that they fail to control (at least directly) for working conditions. To the extent that union jobs have more adverse working conditions than do nonunion jobs (Duncan and Stafford, 1980), union gap estimates are biased upward. The extent of this bias is not known. Even if appropriate data were available, estimation of com- pensating differentials associated with working conditions is notoriously difficult (Rosen, 1986; Hwang et al., 1992). To some extent, working conditions are controlled for through the inclusion of occupation and industry dummies. As discussed previously,
BARRY T. HIRSCH 259
control for occupation drives union gap estimates upward while control for industry drives gap estimates downward. Use of detailed industry controls, while helping con- trol for working conditions, also captures some of what we consider a union effect and exacerbates downward bias from misclassification error in union status.
The literature on compensating differentials finds that union workers are com- pensated more highly for risks than are nonunion workers (Viscusi and Aldy, 2003). One explanation is that this reflects a lack of information or some form of market fail- ure in nonunion companies, one that is mitigated by union voice. Alternatively, if com- pensating differentials in the nonunion sector reflect competitive returns, higher differentials in union jobs is simply one way in which unions produce a premium for their members. It is difficult to distinguish between these explanations (for an infor- mal effort to do so with respect to workers' compensation claims, see Hirsch et al., 1997).
VII. Summary
Conventional wisdom among labor economists holds that the average union wage premium is approximately 15 percent. Accompanying this loose consensus have been various arguments that can lead one to argue that union gaps are either higher or lower than 15 percent. Whatever one's view, arguments presented herein show that there exists a substantial downward bias in standard union gap estimates. The bias emanates from two sources of measurement error. The first source, not well known among econ- omists, is the "match bias" associated with Census earnings imputation procedures. The second is a well-know source of bias, but one thought to be unimportant for wage level estimates of union gaps - - measurement error resulting from the misclassifica- tion of union status.
Based on a 2001 CPS sample of private sector nonagricultural workers, a . 13 log wage gap is obtained using the full sample of workers with and without imputed earnings. The union gap rises to. 18 when nonrespondents are excluded from the sam- ple. Correcting for misclassification bias (with an assumed 2 percent rate) raises the private sector union wage gap from .18 to .24 log points in 2001. Based on misclas- sification rates of 1 or 3 percent, the union gap increases from. 18 to .21 or .28, respec- tively.
The combined effect of misclassification and match bias is not only sizable, but has become larger over time as nonresponse rates have risen and private sector den- sity has declined. 1 have presented time-consistent private sector union wage gaps for 1973-2001, with correction for match bias and misclassification bias. Absent these cor- rections, standard estimates substantially understate the true union wage gap and over- state decline in the union gap since the mid-1980s. The precise magnitude of the private sector gap and its decline depends very much on assumed rates of misclassifi- cation. Unfortunately, when one turns to data sources other than the CPS to clarify trends in union and nonunion wage growth, further puzzles arise.
260 JOURNAL OF LABOR RESEARCH
How plausible is a union wage gap substantially greater than 15 percent? The answer depends in part on one's beliefs about employers ' ability and incentives to off- set union wage increases with skill upgrading of their work forces. It is argued herein that in a repeated bargaining framework, skill upgrading need not follow. Nor does empirical evidence reveal substantial skill upgrading among union employers. Longi- tudinal studies indicate that two-sided selection produces a skill distribution among union workers that is more compressed than among a nonunion work force with the same distribution of measured earnings attributes. Although wage level evidence pro- duces union wage gap estimates that decline sharply with respect to measured skill attributes (e.g., schooling), true union gaps may differ little across skill groups fol-
lowing labor market sorting and an accounting for two-sided selection.
Union wage gaps in the United States, long thought to be about 15 percent, have been considered high as compared to union gaps in other countries (Blanchflower and Freeman, 1992; Blanchflower and Bryson, 2002). l argue that the average union wage gap in the U.S. private sector is substantially higher than previously believed. An even higher U.S. union wage gap makes the international comparison all the more notable. 31 One cannot avoid the conclusion that a relatively high wage premium in the United States explains part of the fierce management opposition to union organizing and the inability of unions to maintain private sector union density at past or current rates.
The study of union wage gaps has a long history in labor economics, although interest in this topic may be waning as density declines. Recent research suggests that there remains much to be learned. There never has been a consensus on the most appro- priate methods by which union gaps should be estimated. The literature continues to await modeling and estimation approaches that can reliably identify the causal effects of unions on wages. Independent of the approach, the measurement issues addressed herein require one to revise one's assessment of both the level and trend in the aver- age union wage gap. The conventional wisdom of a 15 percent union gap requires reconsideration. Whether a new consensus will emerge is uncertain.
NOTES
lOne of the first micro-level wage equation papers to include measures of union density at the industry level was Freeman and Medoff (1981). Curme and Macpherson (1991) include union density in union and nonunion wage equations at the industry and metropolitan-area levels.
2Macpherson (1990) examines union effects on labor's share based on cross-sectional variation in union density within manufacturing for the years 1973-1975 and 1983-1985. He obtains a positive relationship in each of the periods and concludes that unionization increases labor's share.
3A simple approximation of the percentage gap is [exp(~3-1)] 100, where 13 is the log wage gap. Giles (1982) provides a comparison between this simple measure and more precise approximations.
4Robinson (1989) offers the explanation that skills are heterogenous, with union workers having an absolute advantage in skills in union jobs and nonunion workers an absolute advantage in nonunion jobs.
5Closely related critiques of the selection model, as applied to union wage gap estimates, are provided in Farber (1983) and Lemieux (1998). It is not surprising that estimation of a structural model is difficult, given
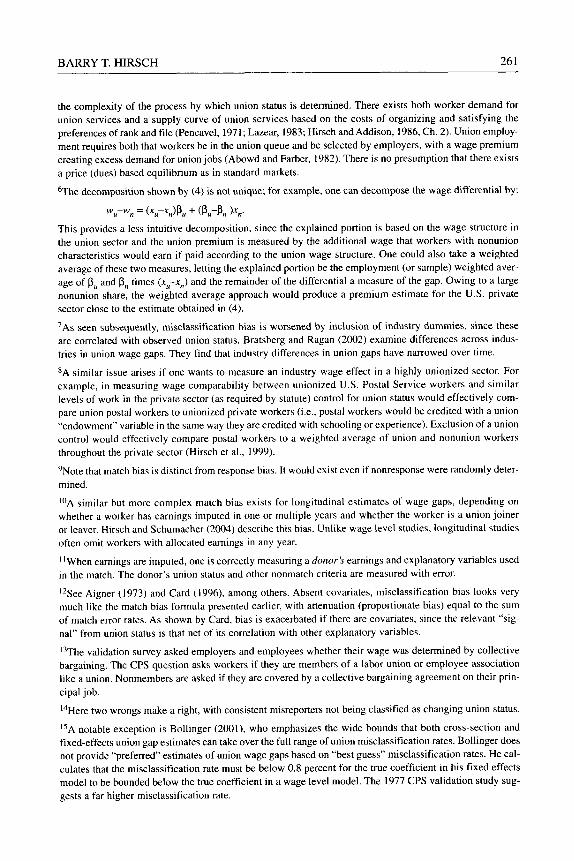
BARRY T. HIRSCH 261
the complexity of the process by which union status is determined. There exists both worker demand for union services and a supply curve of union services based on the costs of organizing and satisfying the preferences of rank and file (Pencavel, 1971 ; Lazear, 1983; Hirsch and Addison, 1986, Ch. 2). Union employ- ment requires both that workers be in the union queue and be selected by employers, with a wage premium creating excess demand for union jobs (Abowd and Farber, 1982). There is no presumption that there exists
a price (dues) based equilibrium as in standard markets.
6The decomposition shown by (4) is not unique; for example, one can decompose the wage differential by:
w - w n = ( x - x )f~ u + ( f~u- f~n ) x .
This provides a less intuitive decomposition, since the explained portion is based on the wage structure in the union sector and the union premium is measured by the additional wage that workers with nonunion characteristics would earn if paid according to the union wage structure. One could also take a weighted average of these two measures, letting the explained portion be the employment (or sample) weighted aver- age of 13~ and 13, times (xu-x n) and the remainder of the differential a measure of the gap. Owing to a large nonunion share, the weighted average approach would produce a premium estimate for the U.S. private
sector close to the estimate obtained in (4).
7As seen subsequently, misclassification bias is worsened by inclusion of industry dummies, since these are correlated with observed union status. Bratsberg and Ragan (2002) examine differences across indus- tries in union wage gaps. They find that industry differences in union gaps have narrowed over time.
8A similar issue arises if one wants to measure an industry wage effect in a highly unionized sector. For example, in measuring wage comparability between unionized U.S. Postal Service workers and similar levels of work in the private sector (as required by statute) control for union status would effectively com- pare union postal workers to unionized private workers (i.e., postal workers would be credited with a union "endowment" variable in the same way they are credited with schooling or experience). Exclusion of a union control would effectively compare postal workers to a weighted average of union and nonunion workers throughout the private sector (Hirsch et al., 1999).
9Note that match bias is distinct from response bias. It would exist even if nonresponse were randomly deter-
mined.
t~ similar but more complex match bias exists for longitudinal estimates of wage gaps, depending on whether a worker has earnings imputed in one or multiple years and whether the worker is a union joiner or leaver. Hirsch and Schumacher (2004) describe this bias. Unlike wage level studies, longitudinal studies
often omit workers with allocated earnings in any year.
I IWhen earnings are imputed, one is correctly measuring a donor's earnings and explanatory variables used in the match. The donor's union status and other nonmatch criteria are measured with error.
J2See Aigner (1973) and Card (1996), among others. Absent covariates, misclassification bias looks very much like the match bias formula presented earlier, with attenuation (proportionate bias) equal to the sum of match error rates. As shown by Card, bias is exacerbated if there are covariates, since the relevant "sig- nal" from union status is that net of its correlation with other explanatory variables.
13The validation survey asked employers and employees whether their wage was determined by collective bargaining. The CPS question asks workers if they are members of a labor union or employee association like a union. Nonmembers are asked if they are covered by a collective bargaining agreement on their prin-
cipal job.
14Here two wrongs make a right, with consistent misreporters not being classified as changing union status.
15A notable exception is Bollinger (2001), who emphasizes the wide bounds that both cross-section and fixed-effects union gap estimates can take over the full range of union misclassification rates. Bollinger does not provide "preferred" estimates of union wage gaps based on "best guess" misclassification rates. He cal- culates that the misclassification rate must be below 0.8 percent for the true coefficient in his fixed effects model to be bounded below the true coefficient in a wage level model. The 1977 CPS validation study sug-
gests a far higher misclassification rate.
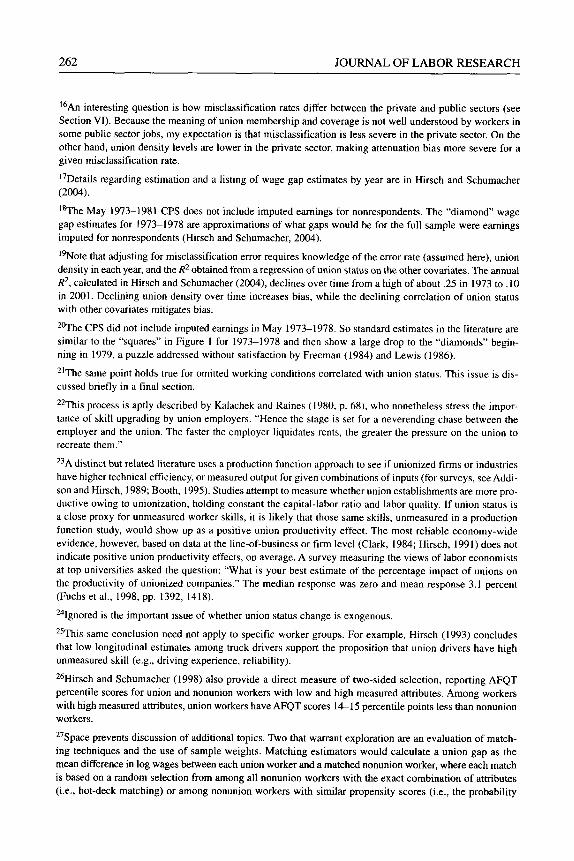
262 J O U R N A L O F L A B O R R E S E A R C H
16An interesting question is how misclassification rates differ between the private and public sectors (see Section VI). Because the meaning of union membership and coverage is not well understood by workers in some public sector jobs, my expectation is that misclassification is less severe in the private sector. On the other hand, union density levels are lower in the private sector, making attenuation bias more severe for a given misclassification rate.
17Details regarding estimation and a listing of wage gap estimates by year are in Hirsch and Schumacher (2004).
~SThe May 1973-1981 CPS does not include imputed earnings for nonrespondents. The "diamond" wage gap estimates for 1973-1978 are approximations of what gaps would be for the full sample were earnings imputed for nonrespondents (Hirsch and Schumacher, 2004).
19Note that adjusting for misclassification error requires knowledge of the error rate (assumed here), union density in each year, and the R 2 obtained from a regression of union status on the other eovariates. The annual R 2, calculated in Hirsch and Schumacher (2004), declines over time from a high of about .25 in 1973 to. 10 in 2001. Declining union density over time increases bias, while the declining correlation of union status with other covariates mitigates bias.
2~ CPS did not include imputed earnings in May 1973-1978. So standard estimates in the literature are similar to the "squares" in Figure 1 for 1973-1978 and then show a large drop to the "diamonds" begin- ning in 1979, a puzzle addressed without satisfaction by Freeman (1984) and Lewis (1986).
21The same point holds true for omitted working conditions correlated with union status. This issue is dis- cussed briefly in a final section.
22This process is aptly described by Kalachek and Raines (1980, p. 68), who nonetheless stress the impor- tance of skill upgrading by union employers. "Hence the stage is set for a neverending chase between the employer and the union. The faster the employer liquidates rents, the greater the pressure on the union to recreate them."
23A distinct but related literature uses a production function approach to see if unionized firms or industries have higher technical efficiency, or measured output for given combinations of inputs (for surveys, see Addi- son and Hirsch, 1989; Booth, 1995). Studies attempt to measure whether union establishments are more pro- ductive owing to unionization, holding constant the capital-labor ratio and labor quality. If union status is a close proxy for unmeasured worker skills, it is likely that those same skills, unmeasured in a production function study, would show up as a positive union productivity effect. The most reliable economy-wide evidence, however, based on data at the line-of-business or firm level (Clark, 1984; Hirsch, 1991) does not indicate positive union productivity effects, on average. A survey measuring the views of labor economists at top universities asked the question: "What is your best estimate of the percentage impact of unions on the productivity of unionized companies." The median response was zero and mean response 3.1 percent (Fuchs et al., 1998, pp. 1392, 1418).
24Ignored is the important issue of whether union status change is exogenous.
25This same conclusion need not apply to specific worker groups. For example, Hirsch (1993) concludes that low longitudinal estimates among truck drivers support the proposition that union drivers have high unmeasured skill (e.g., driving experience, reliability).
26Hirsch and Schumacher (1998) also provide a direct measure of two-sided selection, reporting AFQT percentile scores for union and nonunion workers with low and high measured attributes. Among workers with high measured attributes, union workers have AFQT scores 14-15 percentile points less than nonunion workers.
27Space prevents discussion of additional topics. Two that warrant exploration are an evaluation of match- ing techniques and the use of sample weights. Matching estimators would calculate a union gap as the mean difference in log wages between each union worker and a matched nonunion worker, where each match is based on a random selection from among all nonunion workers with the exact combination of attributes (i.e., hot-deck matching) or among nonunion workers with similar propensity scores (i.e., the probability
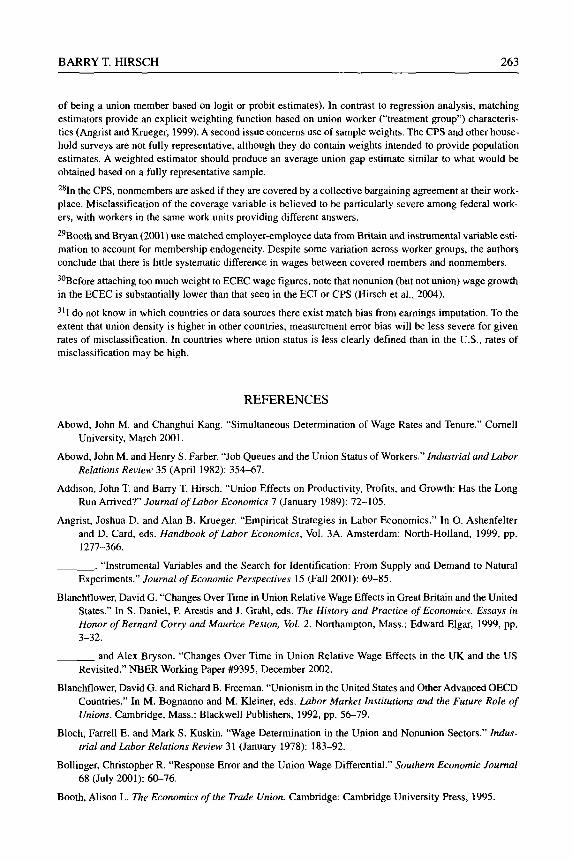
B A R R Y T. H I R S C H 263
of being a union member based on logit or probit estimates). In contrast to regression analysis, matching estimators provide an explicit weighting function based on union worker ("treatment group") characteris- tics (Angrist and Krueger, 1999). A second issue concerns use of sample weights. The CPS and other house- hold surveys are not fully representative, although they do contain weights intended to provide population estimates. A weighted estimator should produce an average union gap estimate similar to what would be obtained based on a fully representative sample.
281n the CPS, nonmembers are asked if they are covered by a collective bargaining agreement at their work- place. Misclassification of the coverage variable is believed to be particularly severe among federal work- ers, with workers in the same work units providing different answers.
29Booth and Bryan (2001) use matched employer-employee data from Britain and instrumental variable esti- mation to account for membership endogeneity. Despite some variation across worker groups, the authors conclude that there is little systematic difference in wages between covered members and nonmembers.
3~ attaching too much weight to ECEC wage figures, note that nonunion (but not union) wage growth in the ECEC is substantially lower than that seen in the ECI or CPS (Hirsch et al., 2004).
31I do not know in which countries or data sources there exist match bias from earnings imputation. To the extent that union density is higher in other countries, measurement error bias will be less severe for given rates of misclassification. In countries where union status is less clearly defined than in the U.S., rates of misclassification may be high.
R E F E R E N C E S
Abowd, John M. and Changhui Kang. "Simultaneous Determination of Wage Rates and Tenure." Cornell University, March 2001.
Abowd, John M. and Henry S. Father. "Job Queues and the Union Status of Workers." Industrial and Labor Relations Review 35 (April 1982): 354-67.
Addison, John T. and Barry T. Hirsch. "Union Effects on Productivity, Profits, and Growth: Has the Long Run Arrived?" Journal of Labor Economics 7 (January 1989): 72-105.
Angrist, Joshua D. and Alan B. Krueger. "Empirical Strategies in Labor Economics." In O. Ashenfelter and D. Card, eds. Handbook of Labor Economics, Vol. 3A. Amsterdam: North-Holland, 1999, pp. 1277-366.
. "Instrumental Variables and the Search for Identification: From Supply and Demand to Natural Experiments." Journal of Economic Perspectives 15 (Fall 2001): 69-85.
Blanchflower, David G. "Changes Over Time in Union Relative Wage Effects in Great Britain and the United States." In S. Daniel, E Arestis and J. Grahl, eds. The History and Practice of Economics. Essays in Honor of Bernard Corry and Maurice Peston, Vol. 2. Northampton, Mass.: Edward Elgar, 1999, pp. 3-32.
_ _ and Alex Bryson. "Changes Over Time in Union Relative Wage Effects in the UK and the US Revisited." NBER Working Paper #9395, December 2002.
Blanchflower, David G. and Richard B. Freeman. "Unionism in the United States and Other Advanced OECD Countries." In M. Bognanno and M. Kleiner, eds. Labor Market Institutions and the Future Role of Unions. Cambridge, Mass.: Blackwell Publishers, 1992, pp. 56-79.
Bloch, Farrell E. and Mark S. Kuskin. "Wage Determination in the Union and Nonunion Sectors." Indus- trial and Labor Relations Review 31 (January 1978): 183-92.
Bollinger, Christopher R. "Response Error and the Union Wage Differential." Southern Economic Journal 68 (July 2001): 60-76.
Booth, Alison L. The Economics of the Trade Union. Cambridge: Cambridge University Press, 1995.
264 J O U R N A L OF L A B O R R E S E A R C H
_ _ and Mark L. Bryan�9 "The Union Membership Wage-Premium Puzzle: Is There a Free-Rider Prob- lem?" Center for Economic Policy Research, Discussion Paper No. 2879, July 2001.
Bratsberg, Bernt and James F. Ragan, Jr. "Changes in the Union Wage Premium by Industry." Industrial and Labor Relations Review 56 (October 2002): 65-83.
Brown, Charles and James Medoff. "The Employer Size-Wage Effect." Journal of Political Economy 97 (October 1989): 1027-59�9
Budd, John W. and In-Gang Na. "The Union Membership Wage Premium for Employees Covered by Col- lective Bargaining Agreements." Journal of Labor Economics 18 (October 2000): 783-807.
Card, David. "The Effect of Unions on the Structure of Wages: A Longitudinal Analysis." Econometrica 64 (July 1996): 957-79.
, Thomas Lemieux, and W. Craig Riddell. "Unionization and Wage Inequality: A Comparative Study of the U.S., the U.K., and Canada." NBER Working Paper #9473, January 2003.
Clark, Kim B. "Unionization and Firm Performance: The Impact on Profits, Growth, and Productivity." American Economic Review 74 (December 1984): 893-919�9
Curme, Michael and David A. Macpherson. "Union Wage Differentials and the Effects of Industry and Local Union Density: Evidence from the 1980s." Journal of Labor Research 12 (Fall 1991): 419-27.
Duncan, Greg J. and Frank P. Stafford�9 "Do Union Members Receive Compensating Wage Differentials?" American Economic Review 70 (June 1980): 355-71.
Duncan, Gregory M. and Duane E. Leigh. "Wage Determination in the Union and Nonunion Sectors: A Sam- ple Selectivity Approach." Industrial and Labor Relations Review 34 (October 1980): 24-34.
Farber, Henry S. "The Determination of the Union Status of Workers." Econometrica 51 (September 1983): 1417-38.
. "The Analysis of Union Behavior." In O. Ashenfelter and R. Layard, eds. Handbook of Labor Eco- nomics, Vol. 11. Amsterdam: North-Holland, 1986, pp. 1039-89.
�9 "Mobility and Stability: The Dynamics of Job Change in Labor Markets." In O. Ashenfelter and D. Card, eds. Handbook of Labor Economics, Vol. 3B. Amsterdam: North-Holland, 1999, pp. 2439-83.
_ _ and Bruce Western. "Accounting for the Decline of Unions in the Private Sector, 1973-1988." In James T. Bennett and Bruce E. Kaufman, eds. The Future of Private Sector Unionism in the United States. Armonk, N.Y.: M.E. Sharpe, 2002, pp. 28-58.
Freeman, Richard B. "The Exit-Voice Tradeoff in the Labor Market: Unionism, Job Tenure, Quits and Sep- arations." Quarterly Journal of Economics 94 (June 1980): 643-74.
�9 "Unionism and the Dispersion of Wages�9 Industrial and Labor Relations Review 34 (October 1980): 3-23.
�9 "The Effect of Unionism on Fringe Benefits�9 Industrial and Labor Relations Review 34 (July 1981): 489-509.
. "Union Wage Practices and Wage Dispersion within Establishments." Industrial and Labor Rela- tions Review 36 (October 1982): 3-21.
�9 "Longitudinal Analyses of the Effects of Trade Unions." Journal of Labor Economics 2 (January 1984): 1-26.
. "In Search of Union Wage Concessions in Standard Data Sets." Industrial Relations 25 (Spring 1986): 131-45.
_ _ and James L. Medoff. "The Impact of the Percent Organized on Union and Nonunion Wages." Review of Economics and Statistics 63 (November 1981): 561-72.
�9 What Do Unions Do? New York: Basic Books, 1984.
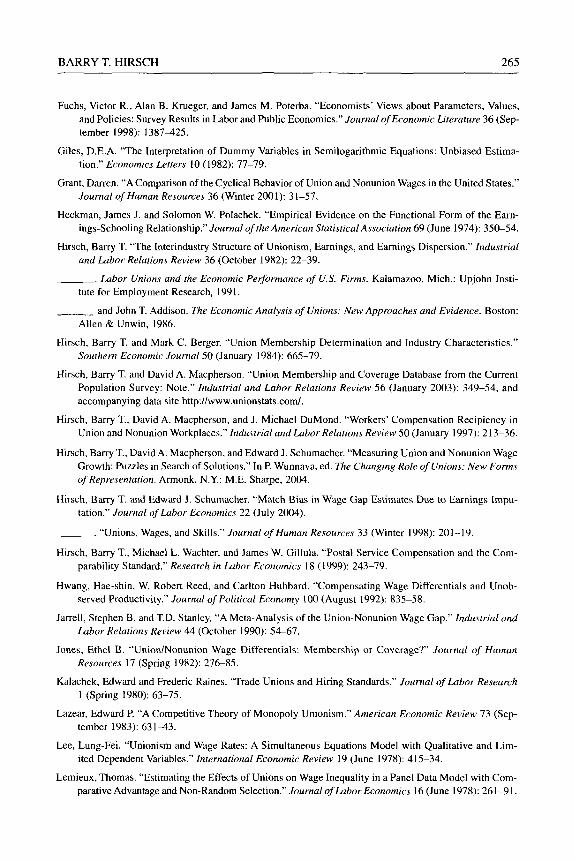
BARRY T. HIRSCH 265
Fuchs, Victor R., Alan B. Krueger, and James M. Poterba. "Economists' Views about Parameters, Values, and Policies: Survey Results in Labor and Public Economics." Journal o f Economic Literature 36 (Sep- tember 1998): 1387425.
Giles, D.E.A. "The Interpretation of Dummy Variables in Semilogarithmic Equations: Unbiased Estima- tion." Economics Letters 10 (1982): 77-79.
Grant, Darren. "A Comparison of the Cyclical Behavior of Union and Nonunion Wages in the United States." Journal o f Human Resources 36 (Winter 200l): 31-57.
Heckman, James J. and Solomon W. Polachek. "Empirical Evidence on the Functional Form of the Earn- ings-Schooling Relationship." Journal of the American Statistical Association 69 (June 1974): 350-54.
Hirsch, Barry T. "The Interindustry Structure of Unionism, Earnings, and Earnings Dispersion." Industrial and Labor Relations Review 36 (October 1982): 22-39.
. Labor Unions and the Economic Performance of U.S. Firms. Kalamazoo, Mich.: Upjohn Insti- tute for Employment Research, 1991.
_ _ and John T. Addison. The Economic Analysis o f Unions: New Approaches and Evidence. Boston: Allen & Unwin, 1986.
Hirsch, Barry T. and Mark C. Berger. "Union Membership Determination and Industry Characteristics." Southern Economic Journal 50 (January 1984): 665-79.
Hirsch, Barry T. and David A. Macpherson. "Union Membership and Coverage Database from the Current Population Survey: Note." Industrial and Labor Relations Review 56 (January 2003): 349-54, and accompanying data site http://www.unionstats.com/.
Hirsch, Barry T., David A. Macpherson, and J. Michael DuMond. "Workers' Compensation Recipiency in Union and Nonunion Workplaces." Industrial and Labor Relations Review 50 (January 1997): 213-36.
Hirsch, Barry T., David A. Macpherson, and Edward J. Schumacher. "Measuring Union and Nonunion Wage Growth: Puzzles in Search of Solutions." In P. Wunnava, ed. The Changing Role of Unions: New Forms of Representation. Armonk, N,Y.: M.E. Shar~e, 2004.
Hirsch, Barry T. and Edward J. Schumacher. "Match Bias in Wage Gap Estimates Due to Earnings Impu- tation." Journal of Labor Economics 22 (July 2004).
. "Unions, Wages, and Skills." Journal o f Human Resources 33 (Winter 1998): 201-19.
Hirsch, Barry T., Michael L. Wachter, and James W. Gillula. "Postal Service Compensation and the Com- parability Standard." Research in Labor Economics 18 (1999): 243-79.
Hwang, Hae-shin, W. Robert Reed, and Carlton Hubbard. "Compensating Wage Differentials and Unob- served Productivity." Journal of Political Economy 100 (August 1992): 835 58.
Jarrell, Stephen B. and T.D. Stanley. "A Meta-Analysis of the Union-Nonunion Wage Gap." Industrial and Labor Relations Review 44 (October 1990): 54-67.
Jones, Ethel B. "Union/Nonunion Wage Differentials: Membership or Coverage?" Journal of Human Resources 17 (Spring 1982): 276-85.
Kalachek, Edward and Frederic Raines. "Trade Unions and Hiring Standards." Journal o f Labor Research 1 (Spring 1980): 63-75.
Lazear, Edward P. "A Competitive Theory of Monopoly Unionism." American Economic Review 73 (Sep- tember 1983): 631-43.
Lee, Lung-Fei. "Unionism and Wage Rates: A Simultaneous Equations Model with Qualitative and Lim- ited Dependent Variables." International Economic Review 19 (June 1978): 415-34.
Lemieux, Thomas. "Estimating the Effects of Unions on Wage Inequality in a Panel Data Model with Com- parative Advantage and Non-Random Selection." Journal o f Labor Economics 16 (June 1978): 261-91.
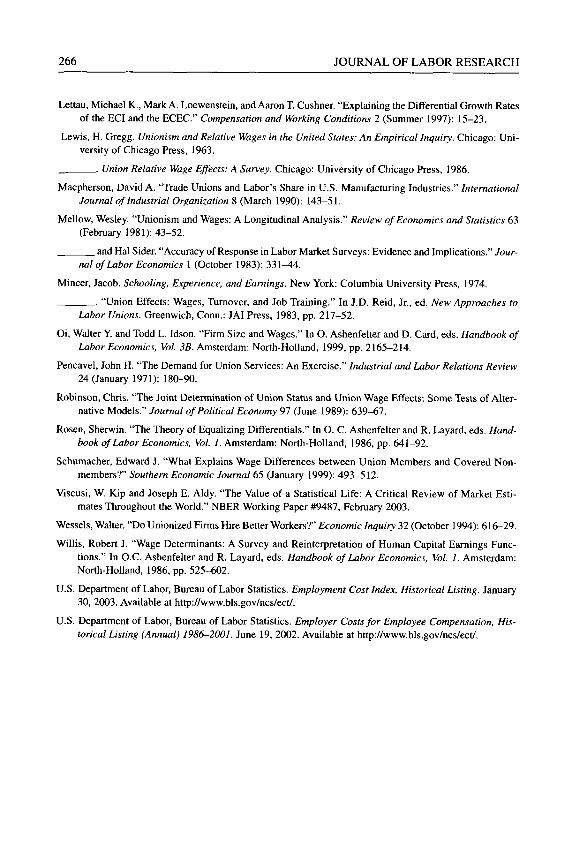
266 JOURNAL OF LABOR RESEARCH
Lettau, Michael K., Mark A. Loewenstein, and Aaron T. Cushner. "Explaining the Differential Growth Rates of the ECI and the ECEC." Compensation and Working Conditions 2 (Summer 1997): 15-23.
Lewis, H. Gregg. Unionism and Relative Wages in the United States: An Empirical Inquiry. Chicago: Uni- versity of Chicago Press, 1963.
�9 Union Relative Wage Effects: A Survey. Chicago: University of Chicago Press, 1986.
Macpherson, David A. "Trade Unions and Labor's Share in U.S. Manufacturing Industries." International Journal of Industrial Organization 8 (March 1990): 143-51.
Mellow, Wesley. "Unionism and Wages: A Longitudinal Analysis." Review of Economics and Statistics 63 (February 1981): 43-52.
_ _ and Hal Sider�9 "Accuracy of Response in Labor Market Surveys: Evidence and Implications�9 Jour- nal of Labor Economics l (October 1983): 331-44.
Mincer, Jacob. Schooling, Experience, and Earnings. New York: Columbia University Press, 1974.
. "Union Effects: Wages, Turnover, and Job Training." In J.D. Reid, Jr., ed. New Approaches to Labor Unions. Greenwich, Conn.: JAI Press, 1983, pp. 217-52.
Oi, Waiter Y. and Todd L. Idson. "Firm Size and Wages." In O. Ashenfelter and D. Card, eds. Handbook of Labor Economics, Vol. 3B. Amsterdam: North-Holland, 1999, pp. 2165-214.
Pencavel, John H. "The Demand for Union Services: An Exercise." Industrial and Labor Relations Review 24 (January 1971): 180-90.
Robinson, Chris�9 "The Joint Determination of Union Status and Union Wage Effects: Some Tests of Alter- native Models." Journal of Political Economy 97 (June 1989): 639-67.
Rosen, Sherwin. "The Theory of Equalizing Differentials." In O. C. Ashenfelter and R. Layard, eds. Hand- book of Labor Economics, Vol. 1. Amsterdam: North-Holland, 1986, pp. 641-92.
Schumacher, Edward J. "What Explains Wage Differences between Union Members and Covered Non- members?" Southern Economic Journal 65 (January 1999): 493-512.
Viscusi, W. Kip and Joseph E. Aldy. "The Value of a Statistical Life: A Critical Review of Market Esti- mates Throughout the World�9 NBER Working Paper #9487, February 2003.
Wessels, Walter. "Do Unionized Firms Hire Better Workers?" Economic Inquiry 32 (October 1994): 616-29.
Willis, Robert J. "Wage Determinants: A Survey and Reinterpretation of Human Capital Earnings Func- tions." In O.C. Ashenfelter and R. Layard, eds. Handbook of Labor Economics, Vol. 1. Amsterdam: North-Holland, 1986, pp. 525-602.
U.S. Department of Labor, Bureau of Labor Statistics. Employment Cost Index, Historical Listing�9 January 30, 2003. Available at http://www.bls.gov/ncs/ect/.
U.S. Department of Labor, Bureau of Labor Statistics. Employer Costs for Employee Compensation, His- torical Listing (Annual) 1986-2001�9 June 19, 2002. Available at http://www.bls.gov/ncs/ect/.