Embed Size (px)
Citation preview
2017 DRIVE CLEAN SEATTLE Implementation Strategy
JUNE 2017
Seattle Office ofSustainability &Environment
TABLEOFCONTENTS
1|EXECUTIVESUMMARY..................................................................................................3
2|INTRODUCTION.............................................................................................................6
3|BARRIERS&OPPORTUNITIESFORACCELERATINGELECTRICVEHICLEADOPTION..10
4|INTERDEPARTMENTALSTRATEGIES............................................................................19
5|RACIALEQUITYANALYSIS............................................................................................31
6|CONCLUSION...............................................................................................................34
ACKNOWLEDGEMENTS
SeattleOfficeofSustainability&EnvironmentAuthors
• JessicaFinnCoven,Director • ChrisBast,ClimateandTransportationAdvisor • TracyMorgenstern,ClimateProtectionProgramManager
Contributors
• BrendanO’Donnell,SeattleCityLight• EvanCorey,SeattleDepartmentofTransportation• MikePodowski,SeattleDepartmentofConstructionandInspections
EXECUTIVE SUMMARY
1
4
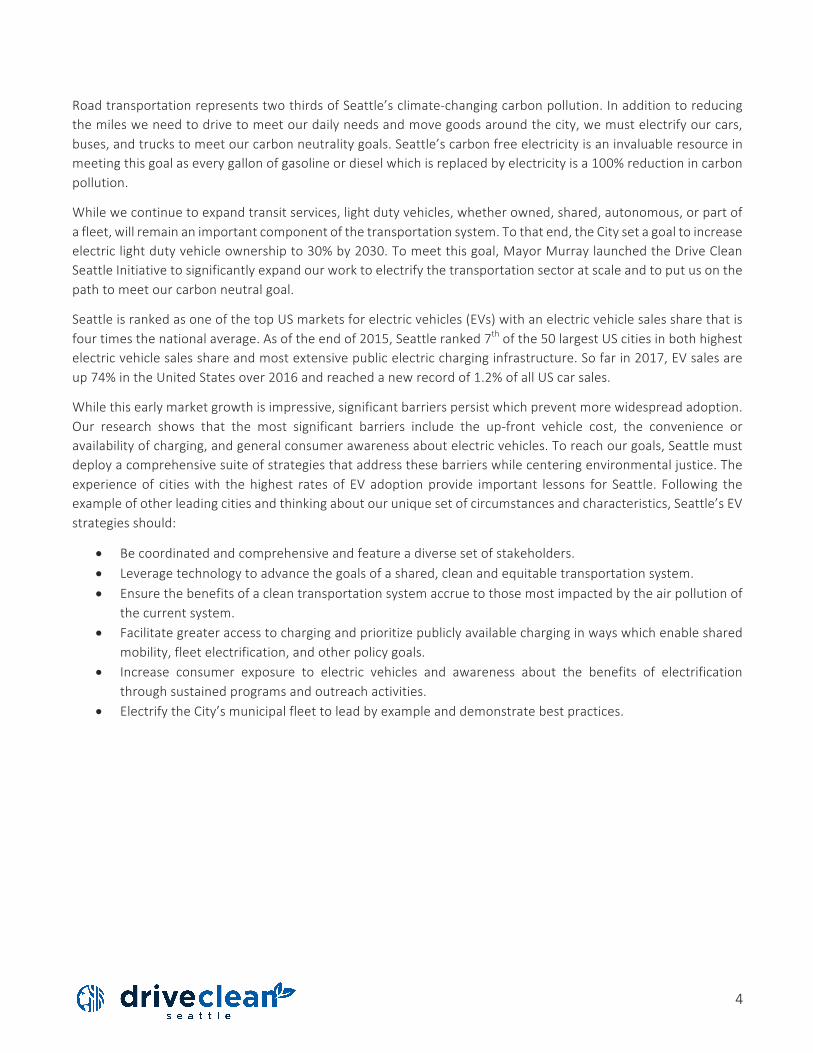
RoadtransportationrepresentstwothirdsofSeattle’sclimate-changingcarbonpollution.Inadditiontoreducingthemilesweneedtodrivetomeetourdailyneedsandmovegoodsaroundthecity,wemustelectrifyourcars,buses,andtruckstomeetourcarbonneutralitygoals.Seattle’scarbonfreeelectricityisaninvaluableresourceinmeetingthisgoalaseverygallonofgasolineordieselwhichisreplacedbyelectricityisa100%reductionincarbonpollution.
Whilewecontinuetoexpandtransitservices,lightdutyvehicles,whetherowned,shared,autonomous,orpartofafleet,willremainanimportantcomponentofthetransportationsystem.Tothatend,theCitysetagoaltoincreaseelectriclightdutyvehicleownershipto30%by2030.Tomeetthisgoal,MayorMurraylaunchedtheDriveCleanSeattleInitiativetosignificantlyexpandourworktoelectrifythetransportationsectoratscaleandtoputusonthepathtomeetourcarbonneutralgoal.
SeattleisrankedasoneofthetopUSmarketsforelectricvehicles(EVs)withanelectricvehiclesalessharethatisfourtimesthenationalaverage.Asoftheendof2015,Seattleranked7thofthe50largestUScitiesinbothhighestelectricvehiclesalesshareandmostextensivepublicelectriccharginginfrastructure.Sofarin2017,EVsalesareup74%intheUnitedStatesover2016andreachedanewrecordof1.2%ofallUScarsales.
Whilethisearlymarketgrowthisimpressive,significantbarrierspersistwhichpreventmorewidespreadadoption.Our research shows that the most significant barriers include the up-front vehicle cost, the convenience oravailabilityofcharging,andgeneralconsumerawarenessaboutelectricvehicles.Toreachourgoals,Seattlemustdeployacomprehensivesuiteofstrategiesthataddressthesebarrierswhilecenteringenvironmentaljustice.Theexperienceof citieswith thehighest rates of EV adoptionprovide important lessons for Seattle. Following theexampleofotherleadingcitiesandthinkingaboutouruniquesetofcircumstancesandcharacteristics,Seattle’sEVstrategiesshould:
• Becoordinatedandcomprehensiveandfeatureadiversesetofstakeholders.• Leveragetechnologytoadvancethegoalsofashared,cleanandequitabletransportationsystem.• Ensurethebenefitsofacleantransportationsystemaccruetothosemostimpactedbytheairpollutionof
thecurrentsystem.• Facilitategreateraccesstochargingandprioritizepubliclyavailablecharginginwayswhichenableshared
mobility,fleetelectrification,andotherpolicygoals.• Increase consumer exposure to electric vehicles and awareness about the benefits of electrification
throughsustainedprogramsandoutreachactivities.• ElectrifytheCity’smunicipalfleettoleadbyexampleanddemonstratebestpractices.
5
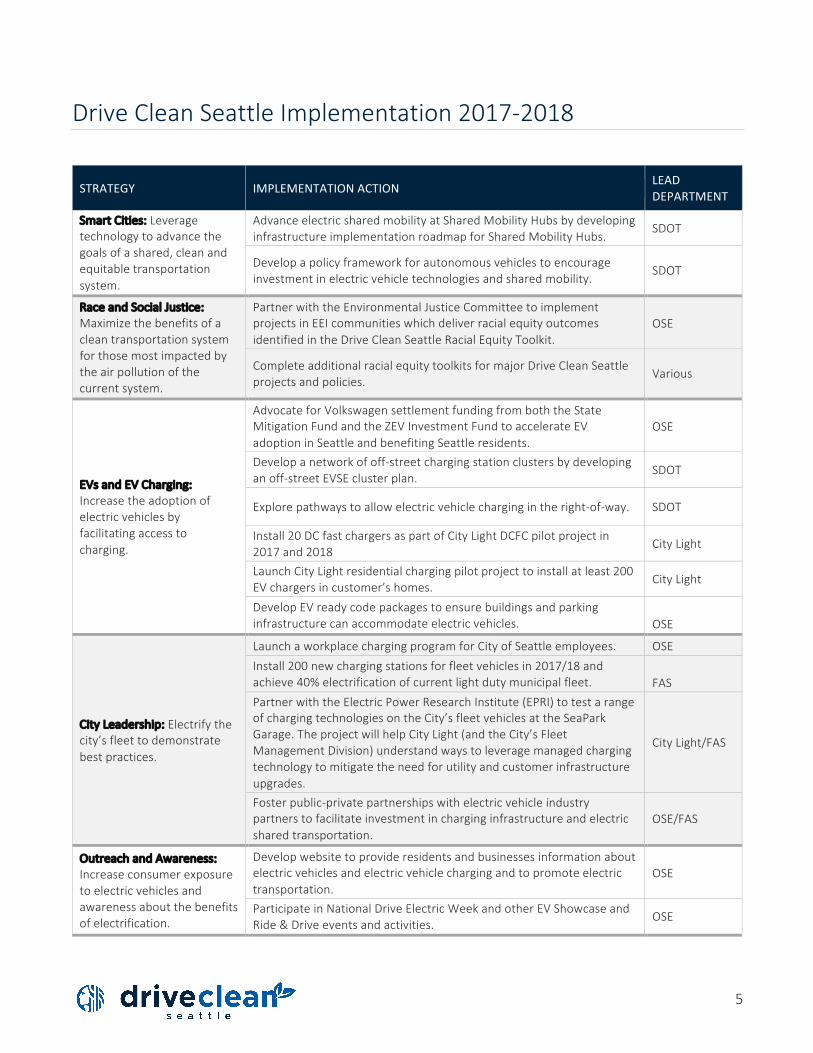
DriveCleanSeattleImplementation2017-2018
STRATEGY IMPLEMENTATIONACTION LEADDEPARTMENT
SmartCities:Leveragetechnologytoadvancethegoalsofashared,cleanandequitabletransportationsystem.
AdvanceelectricsharedmobilityatSharedMobilityHubsbydevelopinginfrastructureimplementationroadmapforSharedMobilityHubs.
SDOT
Developapolicyframeworkforautonomousvehiclestoencourageinvestmentinelectricvehicletechnologiesandsharedmobility.
SDOT
RaceandSocialJustice:Maximizethebenefitsofacleantransportationsystemforthosemostimpactedbytheairpollutionofthecurrentsystem.
PartnerwiththeEnvironmentalJusticeCommitteetoimplementprojectsinEEIcommunitieswhichdeliverracialequityoutcomesidentifiedintheDriveCleanSeattleRacialEquityToolkit.
OSE
CompleteadditionalracialequitytoolkitsformajorDriveCleanSeattleprojectsandpolicies.
Various
EVsandEVCharging:Increasetheadoptionofelectricvehiclesbyfacilitatingaccesstocharging.
AdvocateforVolkswagensettlementfundingfromboththeStateMitigationFundandtheZEVInvestmentFundtoaccelerateEVadoptioninSeattleandbenefitingSeattleresidents.
OSE
Developanetworkofoff-streetchargingstationclustersbydevelopinganoff-streetEVSEclusterplan.
SDOT
Explorepathwaystoallowelectricvehiclechargingintheright-of-way. SDOT
Install20DCfastchargersaspartofCityLightDCFCpilotprojectin2017and2018
CityLight
LaunchCityLightresidentialchargingpilotprojecttoinstallatleast200EVchargersincustomer’shomes.
CityLight
DevelopEVreadycodepackagestoensurebuildingsandparkinginfrastructurecanaccommodateelectricvehicles.
OSE
CityLeadership:Electrifythecity’sfleettodemonstratebestpractices.
LaunchaworkplacechargingprogramforCityofSeattleemployees. OSEInstall200newchargingstationsforfleetvehiclesin2017/18andachieve40%electrificationofcurrentlightdutymunicipalfleet.
FAS
PartnerwiththeElectricPowerResearchInstitute(EPRI)totestarangeofchargingtechnologiesontheCity’sfleetvehiclesattheSeaParkGarage.TheprojectwillhelpCityLight(andtheCity’sFleetManagementDivision)understandwaystoleveragemanagedchargingtechnologytomitigatetheneedforutilityandcustomerinfrastructureupgrades.
CityLight/FAS
Fosterpublic-privatepartnershipswithelectricvehicleindustrypartnerstofacilitateinvestmentincharginginfrastructureandelectricsharedtransportation.
OSE/FAS
OutreachandAwareness:Increaseconsumerexposuretoelectricvehiclesandawarenessaboutthebenefitsofelectrification.
Developwebsitetoprovideresidentsandbusinessesinformationaboutelectricvehiclesandelectricvehiclechargingandtopromoteelectrictransportation.
OSE
ParticipateinNationalDriveElectricWeekandotherEVShowcaseandRide&Driveeventsandactivities.
OSE
INTRODUCTION
2
7
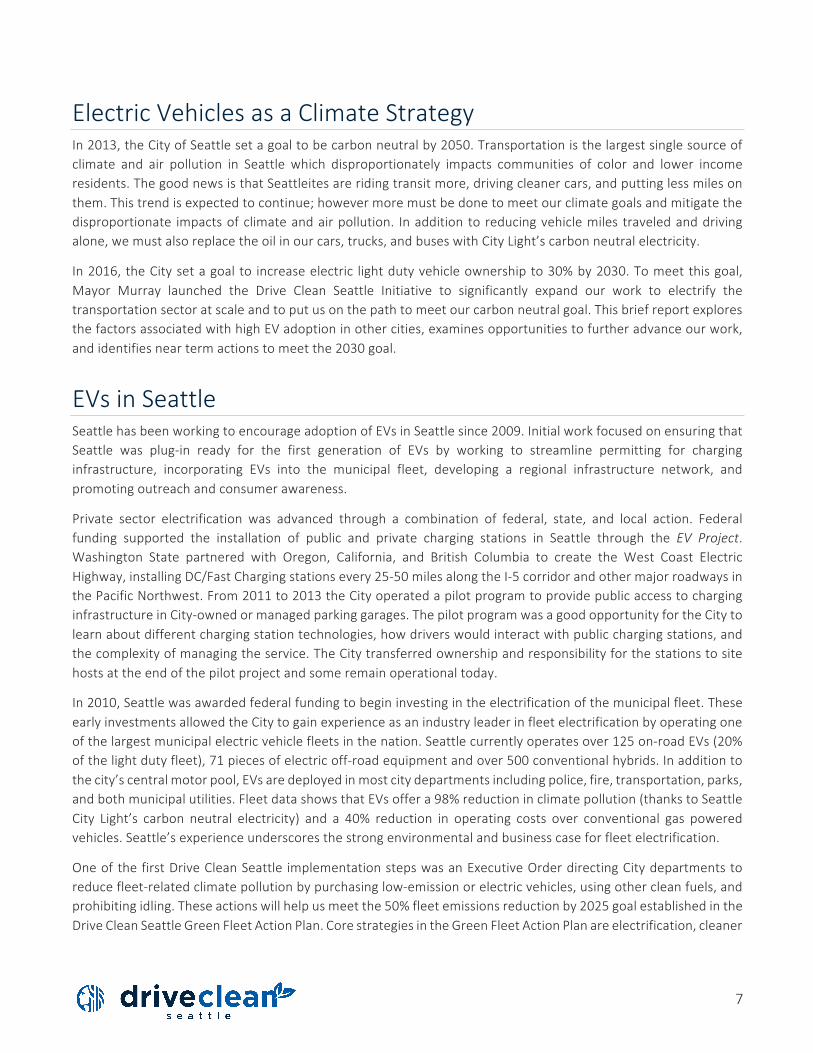
ElectricVehiclesasaClimateStrategyIn2013,theCityofSeattlesetagoaltobecarbonneutralby2050.Transportationisthelargestsinglesourceofclimate and air pollution in Seattle which disproportionately impacts communities of color and lower incomeresidents.ThegoodnewsisthatSeattleitesareridingtransitmore,drivingcleanercars,andputtinglessmilesonthem.Thistrendisexpectedtocontinue;howevermoremustbedonetomeetourclimategoalsandmitigatethedisproportionate impactsofclimateandairpollution. Inadditiontoreducingvehiclemiles traveledanddrivingalone,wemustalsoreplacetheoilinourcars,trucks,andbuseswithCityLight’scarbonneutralelectricity.
In2016,theCitysetagoalto increaseelectric lightdutyvehicleownershipto30%by2030.Tomeetthisgoal,Mayor Murray launched the Drive Clean Seattle Initiative to significantly expand our work to electrify thetransportationsectoratscaleandtoputusonthepathtomeetourcarbonneutralgoal.ThisbriefreportexploresthefactorsassociatedwithhighEVadoptioninothercities,examinesopportunitiestofurtheradvanceourwork,andidentifiesneartermactionstomeetthe2030goal.
EVsinSeattleSeattlehasbeenworkingtoencourageadoptionofEVsinSeattlesince2009.InitialworkfocusedonensuringthatSeattle was plug-in ready for the first generation of EVs by working to streamline permitting for charginginfrastructure, incorporating EVs into the municipal fleet, developing a regional infrastructure network, andpromotingoutreachandconsumerawareness.
Private sector electrification was advanced through a combination of federal, state, and local action. Federalfunding supported the installation of public and private charging stations in Seattle through the EV Project.Washington State partnered with Oregon, California, and British Columbia to create the West Coast ElectricHighway,installingDC/FastChargingstationsevery25-50milesalongtheI-5corridorandothermajorroadwaysinthePacificNorthwest.From2011to2013theCityoperatedapilotprogramtoprovidepublicaccesstocharginginfrastructureinCity-ownedormanagedparkinggarages.ThepilotprogramwasagoodopportunityfortheCitytolearnaboutdifferentchargingstationtechnologies,howdriverswouldinteractwithpublicchargingstations,andthecomplexityofmanagingtheservice.TheCitytransferredownershipandresponsibilityforthestationstositehostsattheendofthepilotprojectandsomeremainoperationaltoday.
In2010,Seattlewasawardedfederalfundingtobegininvestingintheelectrificationofthemunicipalfleet.TheseearlyinvestmentsallowedtheCitytogainexperienceasanindustryleaderinfleetelectrificationbyoperatingoneofthelargestmunicipalelectricvehiclefleetsinthenation.Seattlecurrentlyoperatesover125on-roadEVs(20%ofthelightdutyfleet),71piecesofelectricoff-roadequipmentandover500conventionalhybrids.Inadditiontothecity’scentralmotorpool,EVsaredeployedinmostcitydepartmentsincludingpolice,fire,transportation,parks,andbothmunicipalutilities.FleetdatashowsthatEVsoffera98%reductioninclimatepollution(thankstoSeattleCity Light’s carbon neutral electricity) and a 40% reduction in operating costs over conventional gas poweredvehicles.Seattle’sexperienceunderscoresthestrongenvironmentalandbusinesscaseforfleetelectrification.
OneofthefirstDriveCleanSeattle implementationstepswasanExecutiveOrderdirectingCitydepartmentstoreducefleet-relatedclimatepollutionbypurchasinglow-emissionorelectricvehicles,usingothercleanfuels,andprohibitingidling.Theseactionswillhelpusmeetthe50%fleetemissionsreductionby2025goalestablishedintheDriveCleanSeattleGreenFleetActionPlan.CorestrategiesintheGreenFleetActionPlanareelectrification,cleaner
8
fuels, increased efficiency, and a green fleet standard for fleet procurement. Specific fleet actions underwayinclude:
• Purchase100newEVsthrough2017(toachieve40%electrificationofcurrentlightdutyfleet);250EVsby2020(70%oflightdutyfleet)withatargetof400EVsby2023(100%oflightdutyfleet).
• Install200EVSEforfleetvehiclesin2017/2018,300EVSEby2020and400EVSEinstalledforfleetby2023.• WorkwithequipmentmanufacturerstoparticipateinfleetdemonstrationsofEVtechnologyinmedium
andheavydutyvehiclesoverthenextfiveyears.
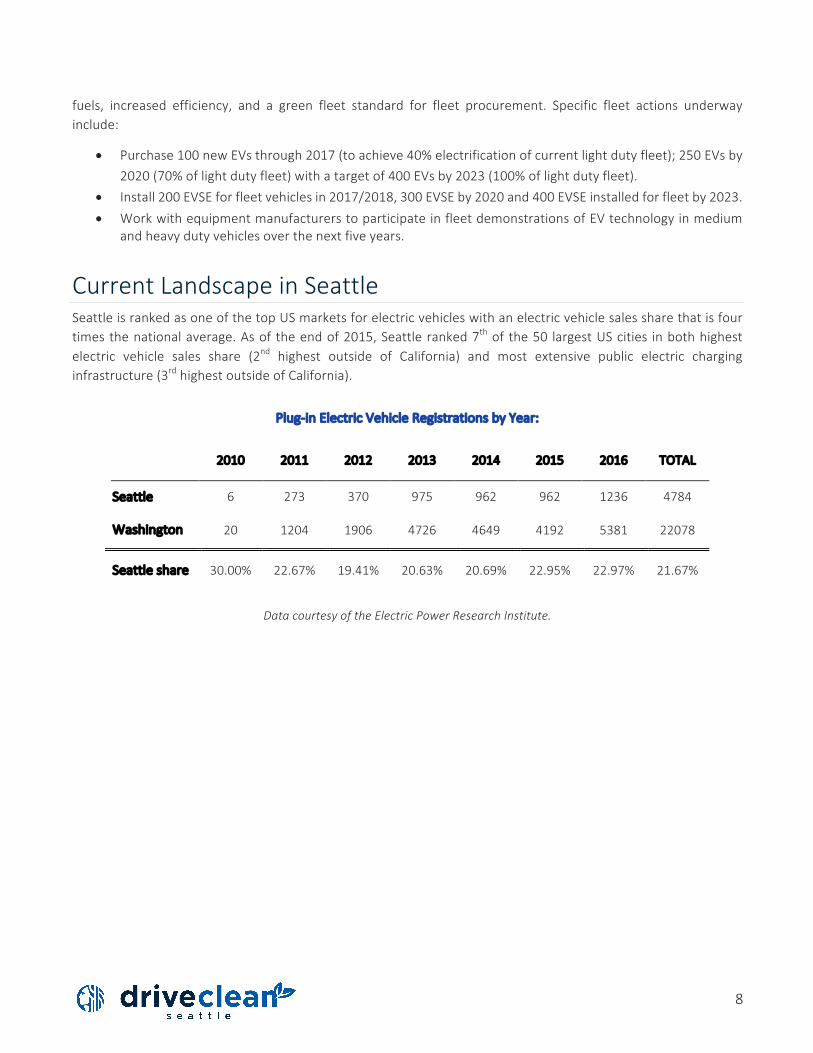
CurrentLandscapeinSeattleSeattleisrankedasoneofthetopUSmarketsforelectricvehicleswithanelectricvehiclesalessharethatisfourtimesthenationalaverage.Asoftheendof2015,Seattleranked7thof the50 largestUScities inbothhighestelectric vehicle sales share (2nd highest outside of California) and most extensive public electric charginginfrastructure(3rdhighestoutsideofCalifornia).
Plug-inElectricVehicleRegistrationsbyYear:
2010 2011 2012 2013 2014 2015 2016 TOTAL
Seattle 6 273 370 975 962 962 1236 4784
Washington 20 1204 1906 4726 4649 4192 5381 22078
Seattleshare 30.00% 22.67% 19.41% 20.63% 20.69% 22.95% 22.97% 21.67%
DatacourtesyoftheElectricPowerResearchInstitute.
9
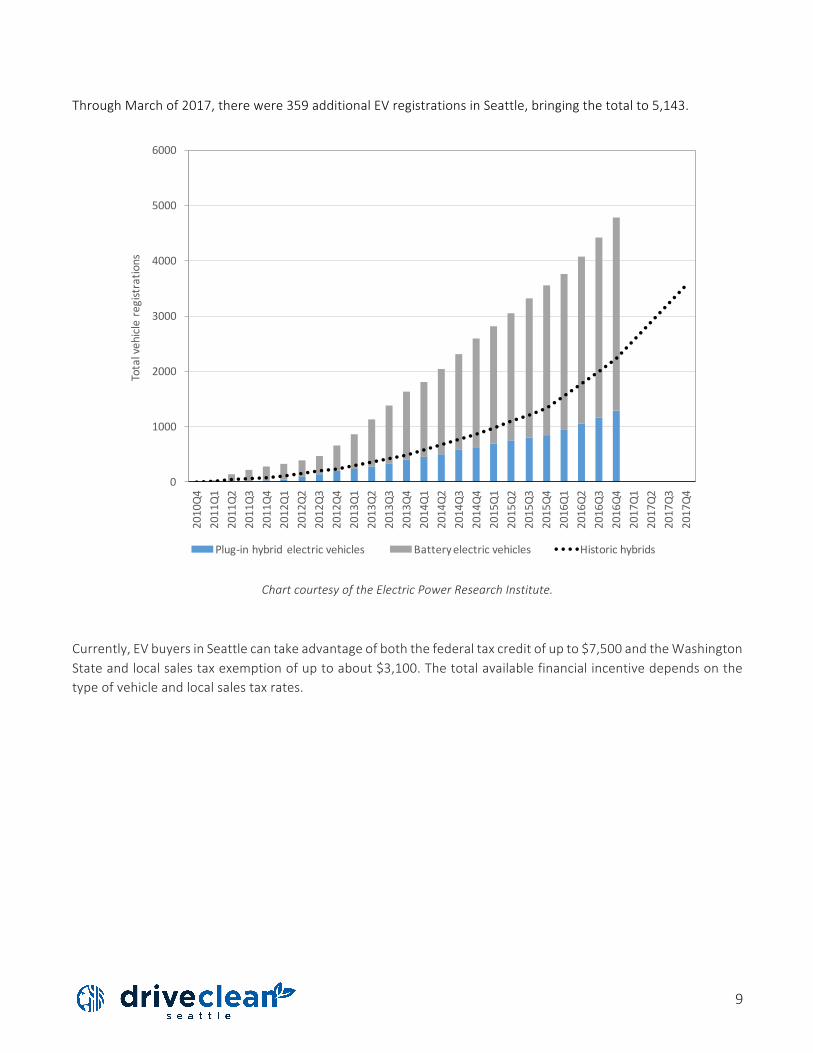
ThroughMarchof2017,therewere359additionalEVregistrationsinSeattle,bringingthetotalto5,143.
ChartcourtesyoftheElectricPowerResearchInstitute.
Currently,EVbuyersinSeattlecantakeadvantageofboththefederaltaxcreditofupto$7,500andtheWashingtonStateandlocalsalestaxexemptionofuptoabout$3,100.Thetotalavailablefinancialincentivedependsonthetypeofvehicleandlocalsalestaxrates.
0
1000
2000
3000
4000
5000
6000
2010Q4
2011Q1
2011Q2
2011Q3
2011Q4
2012Q1
2012Q2
2012Q3
2012Q4
2013Q1
2013Q2
2013Q3
2013Q4
2014Q1
2014Q2
2014Q3
2014Q4
2015Q1
2015Q2
2015Q3
2015Q4
2016Q1
2016Q2
2016Q3
2016Q4
2017Q1
2017Q2
2017Q3
2017Q4
Totalvehicleregistratio
ns
Plug-inhybrid electricvehicles Batteryelectricvehicles Historichybrids
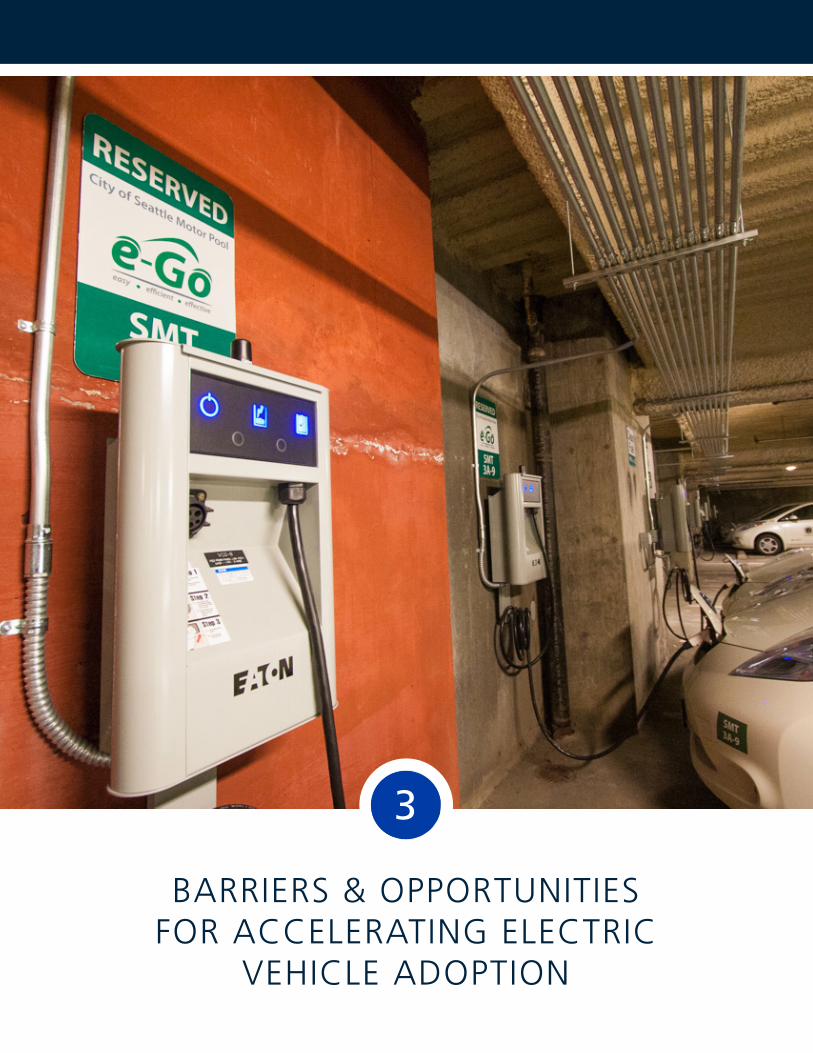
BARRIERS & OPPORTUNITIES FOR ACCELERATING ELECTRIC
VEHICLE ADOPTION
3
11
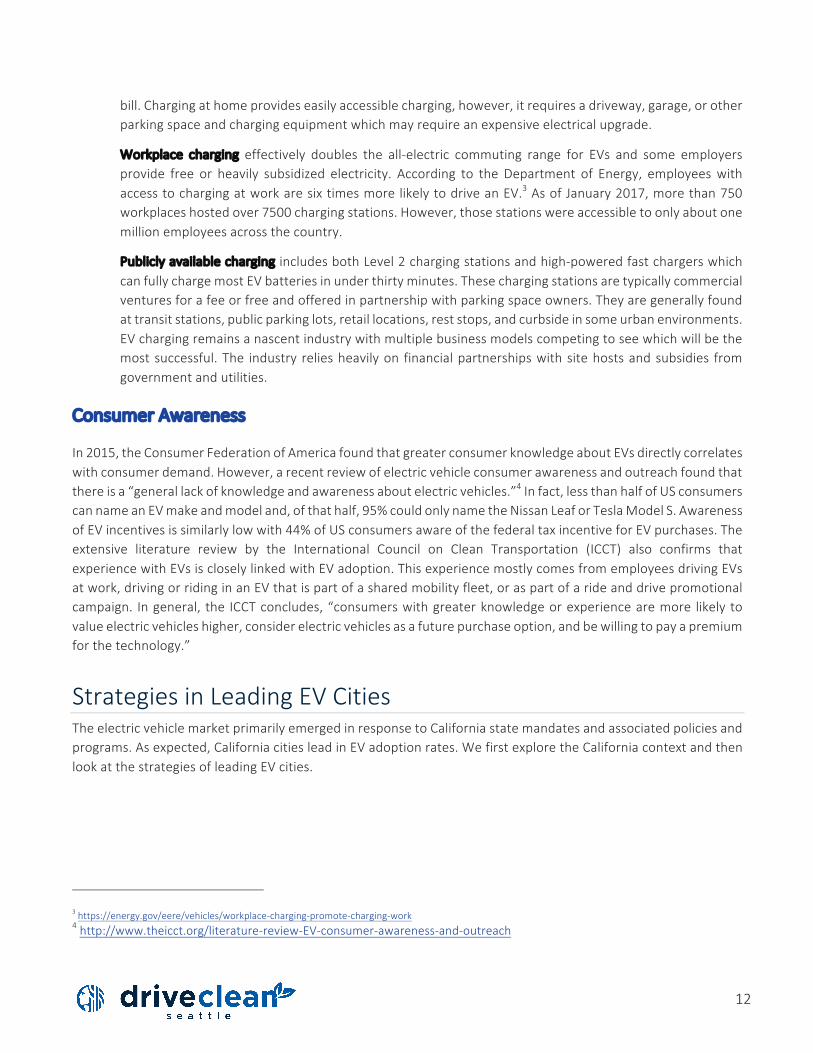
BarrierstoElectricVehicleAdoptionModernelectric vehicleswere introduced in2010and reached1million inglobal sales inSeptember2015.ByJanuary2017,globalsalesdoubledto2million.ThroughQ12017,EVsalesareup74%intheUnitedStatesover2016andreachedanewrecordof1.2%ofallUScarsales.Whilethisearlymarketgrowthisimpressive,significantbarrierspersistwhichpreventmorewidespreadadoption.Bybetterunderstandingthebarriersandstrategiesinleadingcitiesforaddressingthebarriers,wecanbetteridentifythebestapproachforacceleratingEVadoptioninSeattle.Ourresearchshowsthatthemostsignificantbarriersincludetheup-frontvehiclecost,theconvenienceoravailabilityofcharging,andgeneralconsumerawarenessaboutelectricvehicles.
Cost
Thoughelectricvehiclesoffersignificantfuelandmaintenancesavingscomparedwithnon-electricvehicles,theup-front cost of an EV remains a barrier for many, particularly for lower income residents, who aredisproportionately impacted by the climate, air, andwater pollution from fossil fuel use in our transportationsystem. At just over $30,000, theMSRPof a 2017Nissan Leaf ($30,680) is significantly higher than that of itsconventional counterparts: the 2017 Nissan Sentra ($16,990) and Altima ($22,500). Leading, perhaps, to areputationasanicheluxuryproduct,moreexpensivemodelshavedominatedtheearlymarketforelectricvehiclesintheUnitedStates.In2016,TeslasoldmoreelectricvehiclesintheUnitedStatesthananyothercarmakerandtwomodels–theTeslaS($71,200)andtheTeslaX($85,500)wereamongthefivemodelsofEVswhichsoldatleast10,000units(of159,139vehiclestotal)in2016.1
Thismaybechanging:A2016studybyBloombergNewEnergyFinanceforecaststhat“duringthe2020sEVswillbecomeamoreeconomicoptionthangasolineordieselcars inmostcountries”andthatby2040,“long-rangeelectriccarswillcostlessthan$22,000(intoday’sdollars)”.2Still,theaffordabilitybarrierremainsandgovernmentsatalllevelsarelookingatinnovativewaystobringdowntheinitialcostofEVstoincreaseaffordabilityforresidentsofallincomelevels.
ConvenienceofCharging
Theability to conveniently chargeanelectric vehicle is a key factor forelectric vehicleadoption,however, theavailabilityofchargingiscurrentlylimited.Electricvehiclesaretypicallychargedathome,atwork,oratpublicly-accessiblechargingstations located incommunitiesoralonghighwaycorridors. Informationabout thetypesofchargingisprovidedbelow:
Residentialchargingisthemostcommontypeofchargingandtakesplaceatthedriver’spersonalchargingstationathomeovernightoratothertimeswhenthereislittledemandforthevehicle.ThisisusuallyaLevel1orLevel2chargingstationwhichchargesbatteriesoverseveralhoursdependingonthepowerofthechargerandthebattery’sstateofcharge.Thevehicleownerpaysfortheelectricitythroughtheirutility
1https://www.forbes.com/sites/rrapier/2017/02/05/u-s-electric-vehicle-sales-soared-in-2016/#51c97dc5217f2https://www.bloomberg.com/features/2016-ev-oil-crisis/
12
bill.Chargingathomeprovideseasilyaccessiblecharging,however,itrequiresadriveway,garage,orotherparkingspaceandchargingequipmentwhichmayrequireanexpensiveelectricalupgrade.
Workplace charging effectively doubles the all-electric commuting range for EVs and some employersprovide free or heavily subsidized electricity. According to the Department of Energy, employeeswithaccesstochargingatworkaresixtimesmorelikelytodriveanEV.3AsofJanuary2017,morethan750workplaceshostedover7500chargingstations.However,thosestationswereaccessibletoonlyaboutonemillionemployeesacrossthecountry.
PubliclyavailablechargingincludesbothLevel2chargingstationsandhigh-poweredfastchargerswhichcanfullychargemostEVbatteriesinunderthirtyminutes.Thesechargingstationsaretypicallycommercialventuresforafeeorfreeandofferedinpartnershipwithparkingspaceowners.Theyaregenerallyfoundattransitstations,publicparkinglots,retaillocations,reststops,andcurbsideinsomeurbanenvironments.EVchargingremainsanascentindustrywithmultiplebusinessmodelscompetingtoseewhichwillbethemostsuccessful.The industry reliesheavilyon financialpartnershipswithsitehostsandsubsidies fromgovernmentandutilities.
ConsumerAwareness
In2015,theConsumerFederationofAmericafoundthatgreaterconsumerknowledgeaboutEVsdirectlycorrelateswithconsumerdemand.However,arecentreviewofelectricvehicleconsumerawarenessandoutreachfoundthatthereisa“generallackofknowledgeandawarenessaboutelectricvehicles.”4Infact,lessthanhalfofUSconsumerscannameanEVmakeandmodeland,ofthathalf,95%couldonlynametheNissanLeaforTeslaModelS.AwarenessofEVincentivesissimilarlylowwith44%ofUSconsumersawareofthefederaltaxincentiveforEVpurchases.Theextensive literature review by the International Council on Clean Transportation (ICCT) also confirms thatexperiencewithEVsiscloselylinkedwithEVadoption.ThisexperiencemostlycomesfromemployeesdrivingEVsatwork,drivingorridinginanEVthatispartofasharedmobilityfleet,oraspartofarideanddrivepromotionalcampaign. Ingeneral, the ICCTconcludes,“consumerswithgreaterknowledgeorexperiencearemore likelytovalueelectricvehicleshigher,considerelectricvehiclesasafuturepurchaseoption,andbewillingtopayapremiumforthetechnology.”
StrategiesinLeadingEVCitiesTheelectricvehiclemarketprimarilyemergedinresponsetoCaliforniastatemandatesandassociatedpoliciesandprograms.Asexpected,CaliforniacitiesleadinEVadoptionrates.WefirstexploretheCaliforniacontextandthenlookatthestrategiesofleadingEVcities.
3https://energy.gov/eere/vehicles/workplace-charging-promote-charging-work4http://www.theicct.org/literature-review-EV-consumer-awareness-and-outreach
13
California
RepresentingabouthalfoftheUSelectricvehiclemarket,Californiaisagloballeaderinelectricvehicles.Californiahasmorethantwicethecharginginfrastructure,morethanthreetimestheelectricmodelavailability,andmorethanfourtimestheelectricvehiclemarketshareasnationalaverages.5
The California advantage can largely be attributed a comprehensive portfolio of regulations, policies, financialincentives, charging infrastructure investments, and public-private partnerships which have accelerated theadoptionofEVsinthestate.
ZEVMANDATECaliforniacurrentlyhasawaiverundertheCleanAirActallowingittosetstrictervehiclepollutionstandardsthanthefederalstandardssetbytheEnvironmentalProtectionAgency.OtherstatescanadopttheCaliforniastandards,butcannotadopttheirownstandards.Ninestates(Oregon,and8statesintheNortheast)haveadoptedCalifornia’sZEV program to require automakers to sell zero-emission vehicles in their states. The ZEV program requiresautomakerssellingvehiclesinCaliforniatosellacertainpercentageofelectricvehicles.ThecurrentiterationoftheZEVmandatewouldrequireapproximately15%ofvehiclessoldinCaliforniatobeelectricby2025.Asof2015,theZEVmarketrepresented65%ofUSEVsales.
TheZEVmandatehashadasignificantimpactonmodelavailabilityinCalifornia.TheleadingCaliforniacitiesinEVadoptionratehaveovertwentymodelsavailable.However,ICCTdatashowsthat80%ofmetropolitanareasacrossthecountryhavenomorethanfiveEVmodelsavailableandthat51%oftheUSpopulationliveinanareawithfiveorfewerEVmodelsavailable.TheaveragenumberofmodelsavailableinCaliforniacitiesisjustover15whiletheUSaverageisabout7.
LOWCARBONFUELSTANDARD(LCFS)TheLCFSwasadoptedinCaliforniain2009andisaperformance-basedregulationthatrequiresregulatedpartiestoreducethecarbon intensityof their fuelmixbyat least10%by2020.Theprogramestablishesanemissionscredit-tradingsystem.CreditsaregeneratedbycleantransportationfuelproviderswhoselllesscarbonintensefuelandthenselltheircreditstoaregulatedrefinerywhichusesthecredittomeetitsLCFSobligation.Thecreditsystemhas generatedmillions of dollars of investment in clean transportation choices for Californians.Municipal andcorporatefleetsandelectricvehiclesupplyequipmentprovidershaveleveragedthecredittradingmarketplacetofundtheirEV-relatedinvestments.
CLEANVEHICLEREBATEPROGRAMCalifornia’scarboncap-and-tradeprogramhasraisedbillionsofdollarsinrevenue.SomeofthisrevenuefundstheCleanVehicleRebateProjectwhichoffersrebatesofupto$7,000fornewzeroemissionvehicles inadditiontofederalincentives.Throughthisrebateandothertypesofincentivesspecificallydesignedforlowandmoderateincomedrivers,Californiahasincentivizedthepurchaseofover100,000cleanvehiclessince2010.
5http://www.theicct.org/sites/default/files/publications/ICCT_EV_Calif_Cities_201609.pdf
14
LessonsofLeadingEVCitiesAreviewofcitiesintheUnitedStatesandgloballyrevealsfourconditionspresentincitieswithhighEVadoptionrates:
1. CoordinatedandcomprehensiveactionbydiversestakeholdersCitieswithhighEVadoption rates featurebroadand coordinatedactionby government, utilities, non-profits,and theprivate sectoraddressing the threemajorbarriersof cost, convenience,andconsumerawareness.Governmentpoliciesandincentivescreatetheregulatoryandfinancialenvironmentnecessaryto foster private sector investment in EV infrastructure and services as well as individual purchases.Businesses invest in electrification of their fleets and workplace charging demonstrating innovationsolutions to electrification challenges. And the non-profit sector and government conduct consumeroutreachandadvocacyhelpingtomainstreamEVadoption.Togethertheseactions,particularlywhenwell-coordinated,createtheenvironmentwhichleadstowide-scaleEVadoption.
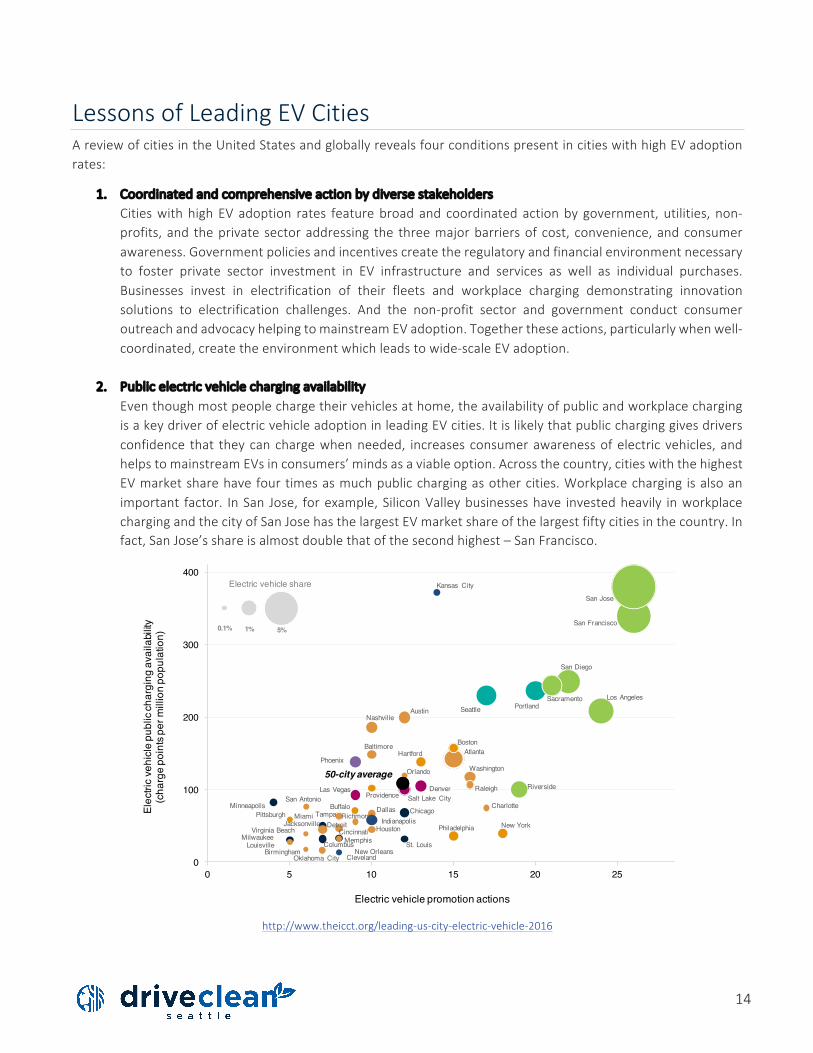
2. PublicelectricvehiclechargingavailabilityEventhoughmostpeoplechargetheirvehiclesathome,theavailabilityofpublicandworkplacechargingisakeydriverofelectricvehicleadoptioninleadingEVcities.Itislikelythatpubliccharginggivesdriversconfidence that theycanchargewhenneeded, increasesconsumerawarenessofelectricvehicles,andhelpstomainstreamEVsinconsumers’mindsasaviableoption.Acrossthecountry,citieswiththehighestEVmarketsharehavefourtimesasmuchpublicchargingasothercities.Workplacecharging isalsoanimportant factor. InSan Jose, forexample,SiliconValleybusinesseshave investedheavily inworkplacechargingandthecityofSanJosehasthelargestEVmarketshareofthelargestfiftycitiesinthecountry.Infact,SanJose’sshareisalmostdoublethatofthesecondhighest–SanFrancisco.
http://www.theicct.org/leading-us-city-electric-vehicle-2016
AtlantaBaltimore Boston
CharlotteChicagoDallas
Denver
Detroit Houston
Los Angeles
MiamiMinneapolis
New YorkPhiladelphia
Phoenix
Pittsburgh
Portland
RiversideSan Antonio
San Diego
San Francisco
Seattle
St. Louis
Tampa
WashingtonOrlando
Sacramento
Cincinnati
Cleveland
Kansas City
Las Vegas
Columbus
Indianapolis
San Jose
AustinNashville
Virginia Beach
Providence
Milwaukee
Jacksonville
Memphis
Oklahoma City
Louisville
Richmond
New Orleans
Hartford
RaleighSalt Lake City
Birmingham
Buffalo
50-city average
0.1% 1% 5%
0
100
200
300
400
0 5 10 15 20 25
Elec
tric
vehi
cle
publ
ic ch
argi
ng a
vaila
bility
(c
harg
e po
ints
per
mill
ion
popu
latio
n)
Electric vehicle promotion actions
Electric vehicle share

15
3. IncentivesIncentivesremainanimportantcomponentofgovernmentactiontodriveEVadoption.Incentivesincludepurchaseincentivesliketaxcreditsandrebates,operatingincentives,parkingincentives,orspecialaccesstoHOVlanesorotherbenefits.LeadingEVcitiesallhavesignificantlyhigherincentivesavailableforthepurchaseandoperationofelectricvehicles.ThisincludesWashingtonState,wherethesalestaxexemptionhashelpeddriveearlyadoptionofEVs.Thepowerofincentiveswasevidentwhenin2015,theGeorgiastatelegislaturesuspendeda$5000taxcreditforthepurchaseofanelectricvehicle,resultinginan80-90%declineinsales.
4. ElectricvehiclemodelavailabilityTheavailabilityofawiderangeofEVmodelsislinkedtohighadoptionrates.Avarietyofoptionsisneededtomeettherangeofconsumerneedsanddrivecompetitioninthemarket.ThestateswiththegreatestnumberofEVmodelsarethosewhereregulationsrequireautomanufacturerstosellzeroemissionvehicles(ZEV).Asof2015,65%ofnationwideEVsalesoccurinstateswithZEVmandates.California,thefirststatewithaZEVmandate,accountedfor54%oftheUSmarketin2015.ManufacturerstypicallyreleasemodelsinCalifornia,theninotherstateswithZEVmandates,andthenmorebroadly.Consequently,51%oftheUSpopulationlivesinacitywithfiveorfewerEVmodelsavailable.However,WashingtonState,whichdoesnothaveaZEVmandate,has relativelyhighEVmodelavailability.Localefforts to increasedemand forelectricvehiclesislikelytoincreasethenumberofmodelsavailableasautomakerswilllooktoleadingEVcitiesforinitialdeploymentofnewelectricvehiclemodels.
http://www.theicct.org/ev-markets-calif-cities-sept2016
0
50,000
100,000
150,000
2010 2011 2012 2013 2014 2015 2016
Elec
tric
vehic
le sa
les
Rest of U.S.
Other ZEV states
California
16
PotentialStrategiestoAccelerateEVDeploymentThereisnoonesingleactionthatcitiescantaketosignificantlyincreaseEVadoptionrates.Successfulcitiesdeployacomprehensivesuiteofstrategiesthataddressthebarriersofcost,convenience,andconsumerawareness.Thesestrategiesareexploredbelow.
Cost
PURCHASEINCENTIVESOneofthemostsuccessfulwaystoencouragethepurchaseofanelectricvehicleistoreducethepurchaseprice.Purchaseincentivesusuallytaketheformofataxcreditorrebateonthepurchaseofanewelectricvehiclebutcouldbedesignedtoapplytousedvehiclesaswell.Becausepurchaseincentivesinvolvesignificantcosts,federaland state governments are generally best positioned to offer these types of incentives. However, creativelydesignedpurchaseincentivesarepossibleatthecityleveltoo.Forexample,manycitiesinChinafeatureregionalpurchasesubsidiesandtaxexemptionsandthemetropolitangovernmentinParisoperatesacash-for-clunkersstylesubsidyprogramwhichprovides25%rebateswhenanoldervehicleisreplacedwithalowemissionvehicle.
OPERATINGINCENTIVESDecreasingthecostofoperatinganelectricvehicleandprovidingimprovedaccessindenseurbanenvironmentscanincreaseuptake.Examplesinclude:
• Reduceoreliminateregistrationfees• Reduceoreliminatetolls• Reduceoreliminatepublicparkingfees• Provideaccesstorestrictedtravellanes,suchasHOVlanesorbuslanes
Research indicates that these incentivesareeffective inadvancingEVadoption.However, these incentivescanworkatcrosspurposeswithotherimportantgoalssuchasgeneratingfundingtomaintaintheroadwaysystem,whichisalsousedbyEVs,andmanagingtraveldemandbyencouragingsharedmobilityandreducingcongestion.Therefore,theseincentivesneedtobebalancedwiththefullrangeoftransportationpolicygoals.Theseconcernsare increasingly relevantasadoptionrates increase.Alternately,operating incentivescouldalsobedesignedtoincreasethecostofoperatingpollutingvehicleseither throughregistration fees,variable tollingrates,orothermechanisms.Though,theseoptionscouldraiseconcernsaroundracialequityandsocialjustice.
ConvenienceofCharging
PUBLICCHARGINGThe availability of public charging infrastructure is significantly linked to high EV adoption rates in cities. Localgovernmentscanplayaroleinincreasingpublicchargingnetworksby:
• Streamliningpermittingandreducingpermitting-relatedcosts• Providingdirectfinancialincentivessuchasrebates,grants,orthroughpublicprivatepartnerships• Investingingovernment-ownedinfrastructure
17
• Developing codes and policies to allow and encourage charging stations to be installed inmore areasthroughoutthecity
• PartneringwithEVstakeholderstoensurechargingstationsareaccessibletothepublicthroughwebbasedmapsandotherEV-relatedappswhichshowtheavailabilityofpublicchargingstationsinanarea
WORKPLACECHARGINGAccordingtotheDepartmentofEnergy,anemployeewithaccesstochargingatworkissixtimesmorelikelytodrive an electric vehicle than the average worker. Local governments can adopt workplace charging policiesthemselves,providegrantsorrebates,promotesuccessfulworkplacechargingprogramsbyareabusinesses,andpartnerwithcommunitystakeholderstoprovideworkshopsandotherinformationtoencouragetheadoptionofworkplacechargingbylocalbusinesses.Itisimportanttodesignworkplacechargingpolicieswhichsupportthegoalofreducingdrivealonecommutetrips.Strategiesmayincludecombiningworkplacechargingwithlocalorregionalvanpoolorcarpoolprogramsorprioritizingtheseprogramsinareaswithpoortransitaccess.
HOMECHARGINGChargingathomeistheeasiestandmostpopularwayfordriverstochargetheirelectricvehicle.TherearetwoprimarywayscitiescanmakehomechargingmoreconvenientforresidentsandencouragegreaterEVadoption:
• Providinggrants,rebates,orreducedpermittingexpensesfortheinstallationofhomechargingstations• DevelopingEV-readycodesandpoliciestoencourageEVchargingstationsformulti-unitdwellings
ConsumerAwareness
FLEETSMany fleets have outpaced the public in the integration of electric vehicles. Government purchases, stateincentives,andprocurementguidelinesandtargetshavehelpeddrivethissegmentofthemarket.Itisalsolikelythat corporate and government fleets, with greater access to capital and a fiduciary duty to constituents orshareholders,areinabetterpositionthanindividualstoseekoutandrealizethereturnoninvestmentofelectricvehicles.
In addition to increasing electric vehicle adoption, fleet EVs increase awareness of EVs because they provideopportunities for people to drive and become familiarwith the technology. Research indicates that as peoplebecomemorefamiliarwithelectricvehiclesandhavemoreexperiencedrivingandridinginthem,theyaremorelikelytopurchaseonefortheirownuse.
Seattleparticipates in thePacificCoastCollaborative’sWestCoastElectric Fleets initiativewhichprovides fleetmanagersatoolkittohelpfacilitateEVdeployment.Manycompaniesinourregionarealsoworkingtoreducetheircarbonfootprintandhaveinvestedinelectricfleetvehicles.
Technologyisrevolutionizingthewaypeoplemovewithincities.Asthepopularityofsharedmobilityservicesgrows,sodoestheopportunitytoreducepollutionfromthetransportationsystem.Sharedmobilityfleetvehiclestypicallydrivemanymoremilesperyearthantheaveragevehicleincreasingtheeconomicandenvironmentalreturnoninvestment.TheCityofNewYorkrecentlysetagoaltoconvertathirdofthetaxifleettoEVsby2020andthecitiesofDenver,Portland,Seattle,andNewYorkrecentlycollaboratedwithmajortransportationsectorcompaniesonafederalgrantapplicationtoacceleratetheuseofEVsinlocalsharedmobilityfleets.
18
PUBLICOUTREACHANDENGAGEMENTACTIVITIESDifferenttypesofoutreachandawarenessactivitiesfromadiversesetofactorshelpincreasegeneralknowledgeandunderstandingaboutelectricvehicles.Researchshowsthatsustainedprogramsthatutilizeabroadrangeofoutreach activities are themost successful at capturing awide audienceof potential consumers. The rangeofactivitiesinleadingcitiesincludes:
• Informationalwebsites• Rideanddrives• NationalDriveElectricWeekpromotionalevents• Ribbon-cuttingsforpublicchargingstations• Advocacyandtradeassociationorganizations• Onlineorapp-basedmapsofchargingstations• Highlyvisiblesignage• EVTourism• Dealerawarenessactivities• EVgroupbuyprograms• EVshowcasesordemonstrationzones• Youtheducationandprofessionaldevelopment• Awardsandrecognition
INTERDEPARTMENTAL STRATEGIES
4
20
Meeting theCity’sgoals for reducing transportationpollution requiresacoordinatedeffortacrossmultiplecitydepartments:
• TheOfficeofSustainabilityandEnvironmentmanagestheDriveCleanSeattleinitiativecoordinatingtheCity’seffortacrossdepartments.
• TheDepartmentofTransportationmanagestheright-of-way,includingEVchargingandparking,andcoordinatestheintegrationofelectricvehiclesintoother“SmartCities”strategiessuchasautonomousandsharedmobility.
• AstheCity’smunicipalelectricutility,SeattleCityLightmanagesthecity’selectricgridandisworkingtoensurethecitycanmeettheelectricalneedsofthetransitiontoelectricityasatransportationfuel.Further,CityLightisresponsibleforinstallingandoperatinganycity-ownedpubliclyavailableelectricvehiclechargingstations.
• TheDepartmentofConstructionandInspectionsisresponsibleforthebuildingandenergycodesandensuringthatthecity’scodesarepreparedfortheincreaseinelectricvehicles.
• TheDepartmentofFinanceandAdministrativeServices’FleetManagementDivisionimplementstheDriveCleanSeattleGreenFleetActionPlantoelectrifythemunicipalfleet.
Thissectionofthereportexplorestheimpactsandtheopportunitytosupporttransportationelectrificationacrossdepartments,specificallyincludingSeattleCityLight,theDepartmentofTransportation,andincludingareviewofthecodeenvironmentforelectricvehiclesandEVcharging.
SeattleCityLightTechnicalReportAsthetransportationmarketevolvesinSeattle,itisincreasinglyclearthatadoptionofelectricvehiclesandotherelectrifiedtransportationwillcontinuetogrow.Thetechnology,too,israpidlychanging;newvehicleswithlargerbatteries and extended range have the potential to fundamentally change how customers use the electricitysystem.
EVsatscalehighlightsbothanopportunityandapotentialchallengeforSeattleCityLight.Combined,thesevehiclesarealargenewloadthatcouldaddvaluebymoreeffectivelyutilizingthesystem,whiledramaticallyreducingthecity’s largest sourceofgreenhouse-gasemissions.Unlikeotherdistributedenergy resources,EVs increase totalelectricitydemandandhelpdrivedownratesbyspreadingutilityfixedcostsacrossgreatervolumetricsales.Or,conversely, EVs could further constrain the electric grid. Vehicle charging may require the utility to procureadditionalgeneratingcapacityandupgradedistributioninfrastructuresoonerthanplanned.
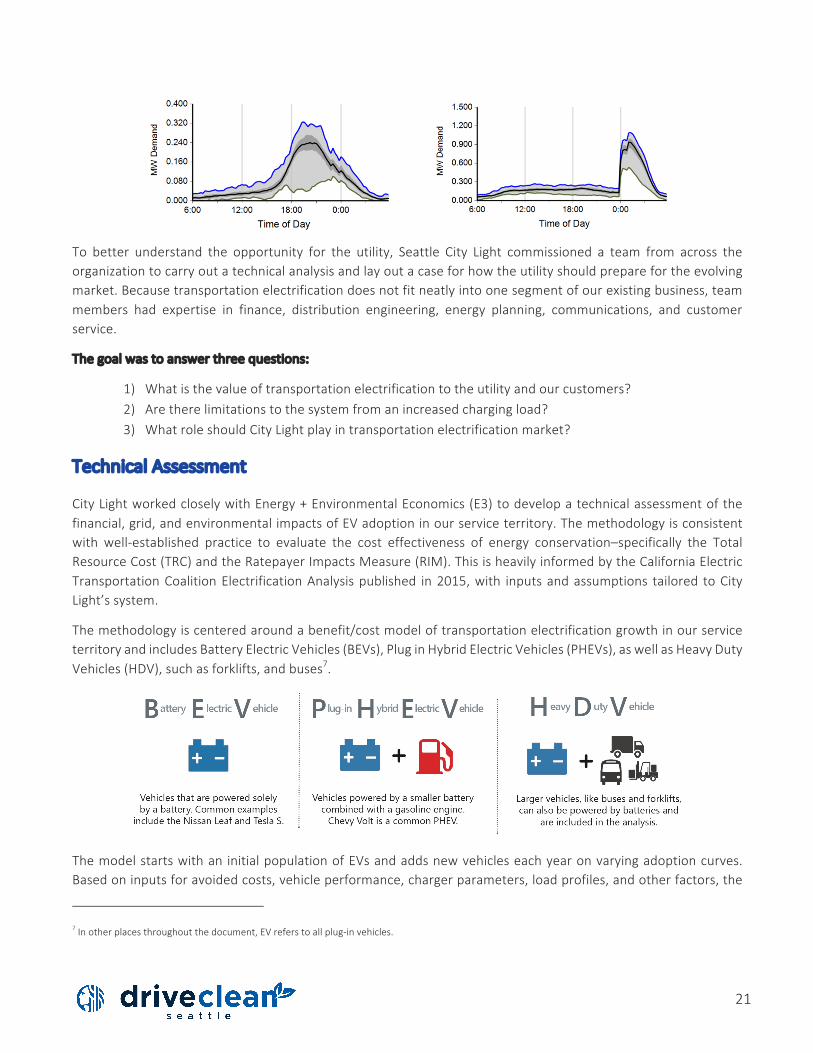
To illustrate this point, the figures below compare two cites studied in the EV Project.6 The graph on the leftillustratesatypicaldailyresidentialchargingpatternwherethere is little influencefromthelocalutility.Driversbegintochargetheirvehicleassoonastheygethomeintheevening,whichisalignedwiththeutility’seveningdistributionpeak.Incontrast,thegraphontherightillustratesadailyloadshapewheretheutilityoffersapricesignalencouragingcustomerstochargelaterintheeveningwhenthereisplentyofcapacityonthesystem.
6Francfort,J.2014DOEVehicleTechnologiesOfficeReview.EVProject.IdahoNationalLaboratory.June20,2014.INL/MIS-14-31743
21
To better understand the opportunity for the utility, Seattle City Light commissioned a team from across theorganizationtocarryoutatechnicalanalysisandlayoutacaseforhowtheutilityshouldpreparefortheevolvingmarket.Becausetransportationelectrificationdoesnotfitneatlyintoonesegmentofourexistingbusiness,teammembers had expertise in finance, distribution engineering, energy planning, communications, and customerservice.
Thegoalwastoanswerthreequestions:
1)Whatisthevalueoftransportationelectrificationtotheutilityandourcustomers?2)Aretherelimitationstothesystemfromanincreasedchargingload?3)WhatroleshouldCityLightplayintransportationelectrificationmarket?
TechnicalAssessment
CityLightworkedcloselywithEnergy+EnvironmentalEconomics(E3)todevelopatechnicalassessmentofthefinancial,grid,andenvironmentalimpactsofEVadoptioninourserviceterritory.Themethodologyisconsistentwith well-established practice to evaluate the cost effectiveness of energy conservation–specifically the TotalResourceCost(TRC)andtheRatepayerImpactsMeasure(RIM).ThisisheavilyinformedbytheCaliforniaElectricTransportationCoalitionElectrificationAnalysispublished in2015,with inputsandassumptions tailored toCityLight’ssystem.
Themethodologyiscenteredaroundabenefit/costmodeloftransportationelectrificationgrowthinourserviceterritoryandincludesBatteryElectricVehicles(BEVs),PluginHybridElectricVehicles(PHEVs),aswellasHeavyDutyVehicles(HDV),suchasforklifts,andbuses7.
Themodelstartswithan initialpopulationofEVsandaddsnewvehicleseachyearonvaryingadoptioncurves.Basedoninputsforavoidedcosts,vehicleperformance,chargerparameters,loadprofiles,andotherfactors,the
7Inotherplacesthroughoutthedocument,EVreferstoallplug-invehicles.
22
modelcalculatesannualEVcostsandbenefitsincurredwithinCityLight’sterritory.Themodelaccountsfornon-EVloadgrowthaswell,andisthusabletoseparatedistributionupgradestriggeredbybaselinegrowthfromthoseattributabledirectlytoEVs.
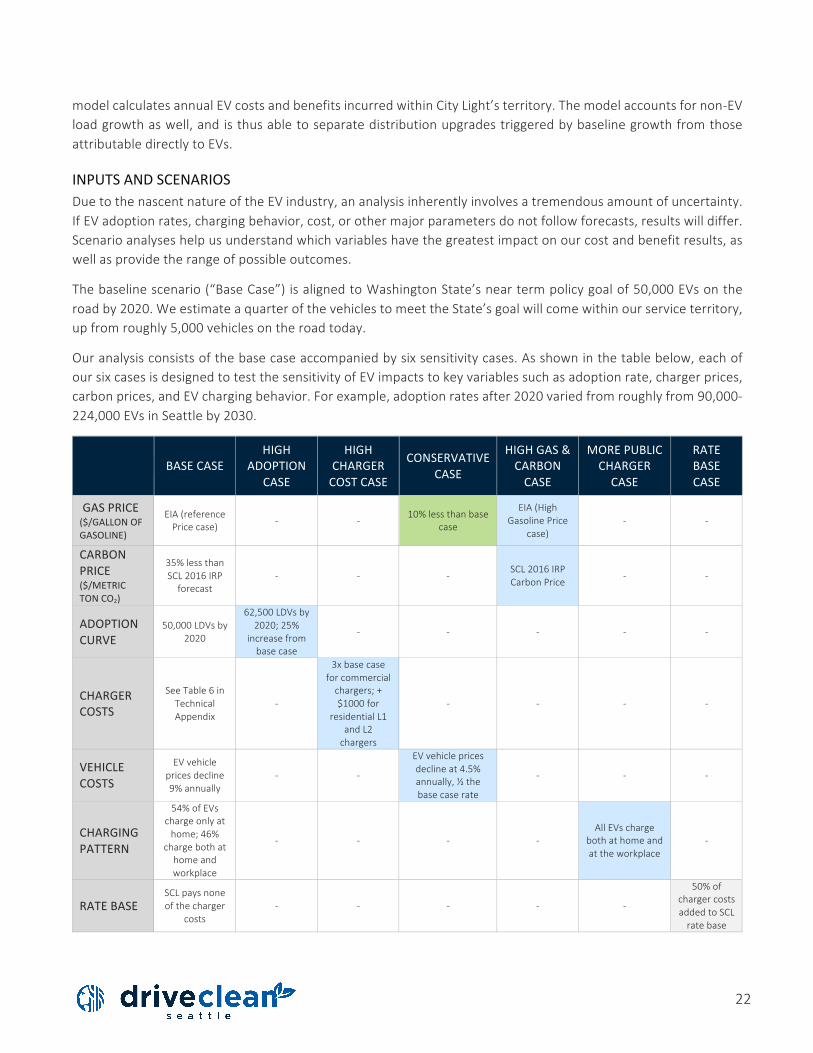
INPUTSANDSCENARIOSDuetothenascentnatureoftheEVindustry,ananalysisinherentlyinvolvesatremendousamountofuncertainty.IfEVadoptionrates,chargingbehavior,cost,orothermajorparametersdonotfollowforecasts,resultswilldiffer.Scenarioanalyseshelpusunderstandwhichvariableshavethegreatestimpactonourcostandbenefitresults,aswellasprovidetherangeofpossibleoutcomes.
Thebaselinescenario(“BaseCase”)isalignedtoWashingtonState’sneartermpolicygoalof50,000EVsontheroadby2020.WeestimateaquarterofthevehiclestomeettheState’sgoalwillcomewithinourserviceterritory,upfromroughly5,000vehiclesontheroadtoday.
Ouranalysisconsistsofthebasecaseaccompaniedbysixsensitivitycases.Asshowninthetablebelow,eachofoursixcasesisdesignedtotestthesensitivityofEVimpactstokeyvariablessuchasadoptionrate,chargerprices,carbonprices,andEVchargingbehavior.Forexample,adoptionratesafter2020variedfromroughlyfrom90,000-224,000EVsinSeattleby2030.
BASECASEHIGH
ADOPTIONCASE
HIGHCHARGERCOSTCASE
CONSERVATIVECASE
HIGHGAS&CARBONCASE
MOREPUBLICCHARGERCASE
RATEBASECASE
GASPRICE($/GALLONOFGASOLINE)
EIA(referencePricecase) - - 10%lessthanbase
case
EIA(HighGasolinePrice
case)- -
CARBONPRICE($/METRICTONCO2)
35%lessthanSCL2016IRPforecast
- - -SCL2016IRPCarbonPrice - -
ADOPTIONCURVE
50,000LDVsby2020
62,500LDVsby2020;25%
increasefrombasecase
- - - - -
CHARGERCOSTS
SeeTable6inTechnicalAppendix
-
3xbasecaseforcommercialchargers;+$1000for
residentialL1andL2chargers
- - - -
VEHICLECOSTS
EVvehiclepricesdecline9%annually
- -
EVvehiclepricesdeclineat4.5%annually,½thebasecaserate
- - -
CHARGINGPATTERN
54%ofEVschargeonlyathome;46%
chargebothathomeandworkplace
- - - -AllEVscharge
bothathomeandattheworkplace
-
RATEBASESCLpaysnoneofthecharger
costs- - - - -
50%ofchargercostsaddedtoSCLratebase
23
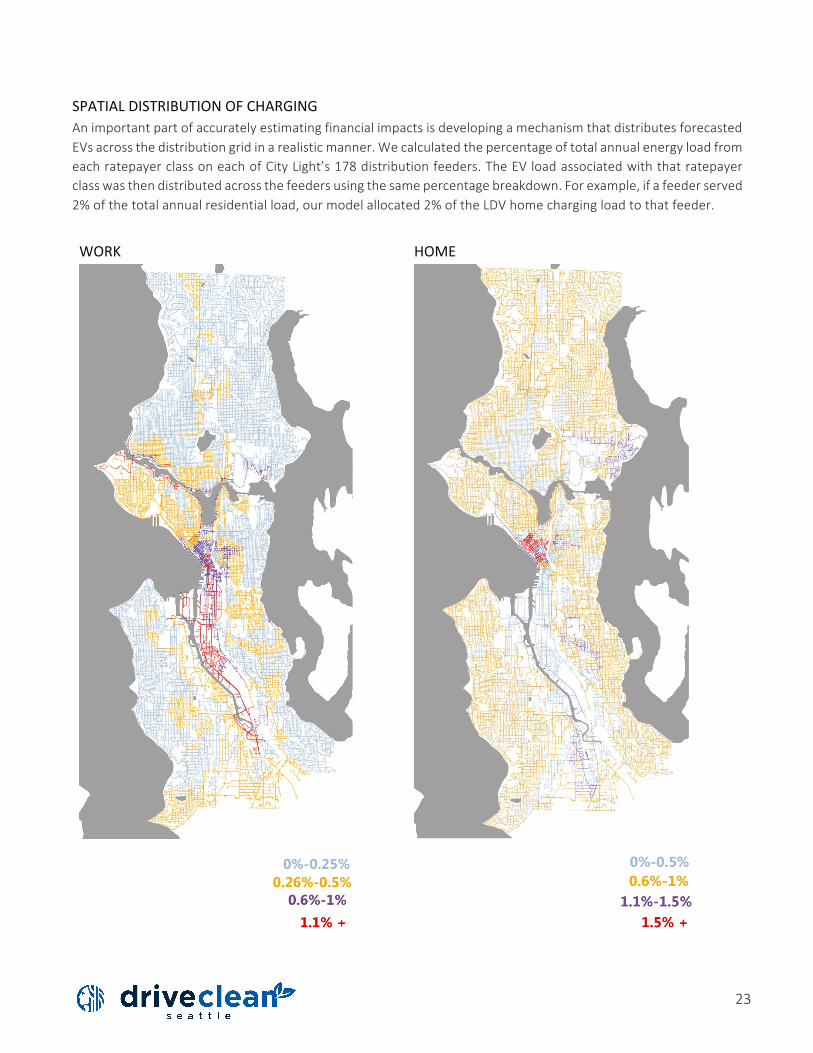
SPATIALDISTRIBUTIONOFCHARGINGAnimportantpartofaccuratelyestimatingfinancialimpactsisdevelopingamechanismthatdistributesforecastedEVsacrossthedistributiongridinarealisticmanner.WecalculatedthepercentageoftotalannualenergyloadfromeachratepayerclassoneachofCityLight’s178distributionfeeders.TheEVloadassociatedwiththatratepayerclasswasthendistributedacrossthefeedersusingthesamepercentagebreakdown.Forexample,ifafeederserved2%ofthetotalannualresidentialload,ourmodelallocated2%oftheLDVhomechargingloadtothatfeeder.
WORK HOME
24
BENEFITCOSTAPPROACHThisanalysisusestwoteststoevaluatethecost-effectivenessofEVs.ThesetestsaretheTotalResourceCostTest(TRC)andtheRatepayerImpactMeasure(RIM);botharecommoninutilityresourceplanning.Thebasicprincipleofbothtests isto identifyeachsourceofcostandbenefitassociatedwithatechnology,andthencomparethesummedcoststothesummedbenefits.Ifthebenefitsexceedthecosts,thetechnologyhasapositivenetbenefitandiscost-effective.Ifthecostsexceedthebenefits,thetechnologyisnotcost-effective.
The difference between the TRC and RIM is that they perform this evaluation from different stakeholderperspectives.TheTRCmeasurescostsandbenefitsaccruedacrosstheentireeconomyduetothetechnologybeingevaluated.TheTRCthereforeincludescostspaidbytheutilityaswellasthosebornebyEVcustomers.TheRIMlooksspecificallyatutilityratepayers.ThebenefitistherevenuetheutilitybringsinfromEVcharging,whiletheonlycoststhatareconsideredarethosethatfallontheutility.
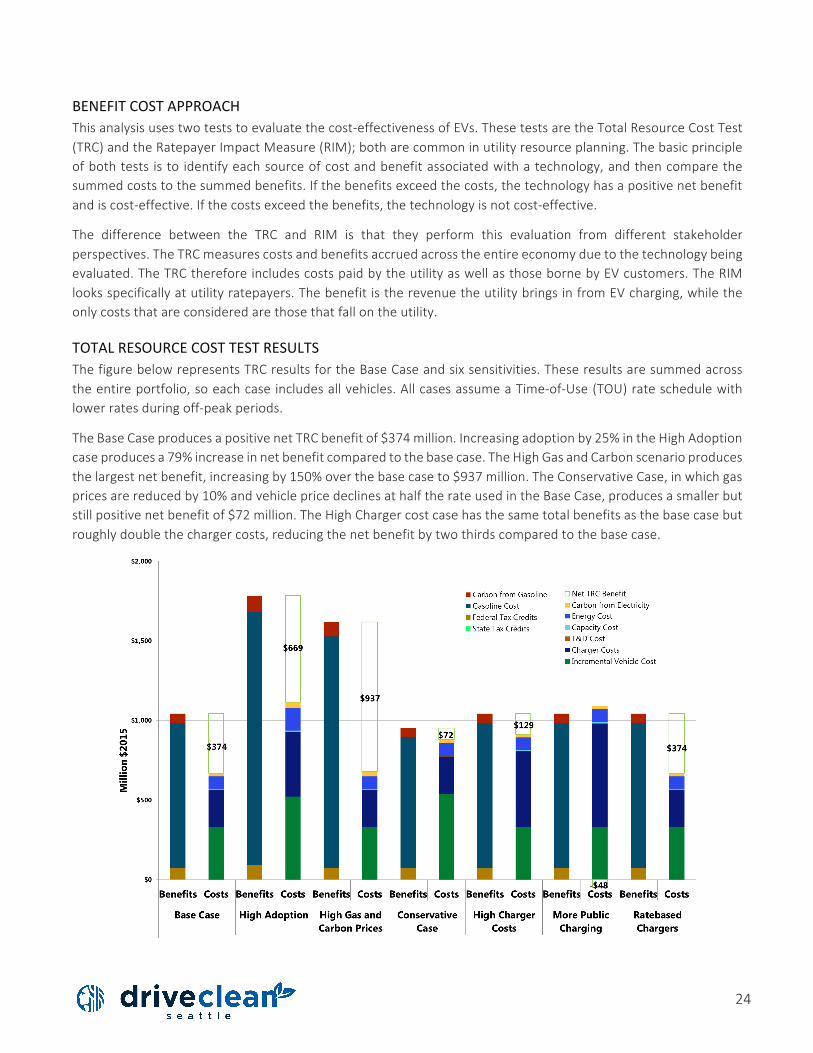
TOTALRESOURCECOSTTESTRESULTSThefigurebelowrepresentsTRCresultsfortheBaseCaseandsixsensitivities.Theseresultsaresummedacrosstheentireportfolio,soeachcaseincludesallvehicles.AllcasesassumeaTime-of-Use(TOU)rateschedulewithlowerratesduringoff-peakperiods.
TheBaseCaseproducesapositivenetTRCbenefitof$374million.Increasingadoptionby25%intheHighAdoptioncaseproducesa79%increaseinnetbenefitcomparedtothebasecase.TheHighGasandCarbonscenarioproducesthelargestnetbenefit,increasingby150%overthebasecaseto$937million.TheConservativeCase,inwhichgaspricesarereducedby10%andvehiclepricedeclinesathalftherateusedintheBaseCase,producesasmallerbutstillpositivenetbenefitof$72million.TheHighChargercostcasehasthesametotalbenefitsasthebasecasebutroughlydoublethechargercosts,reducingthenetbenefitbytwothirdscomparedtothebasecase.
25
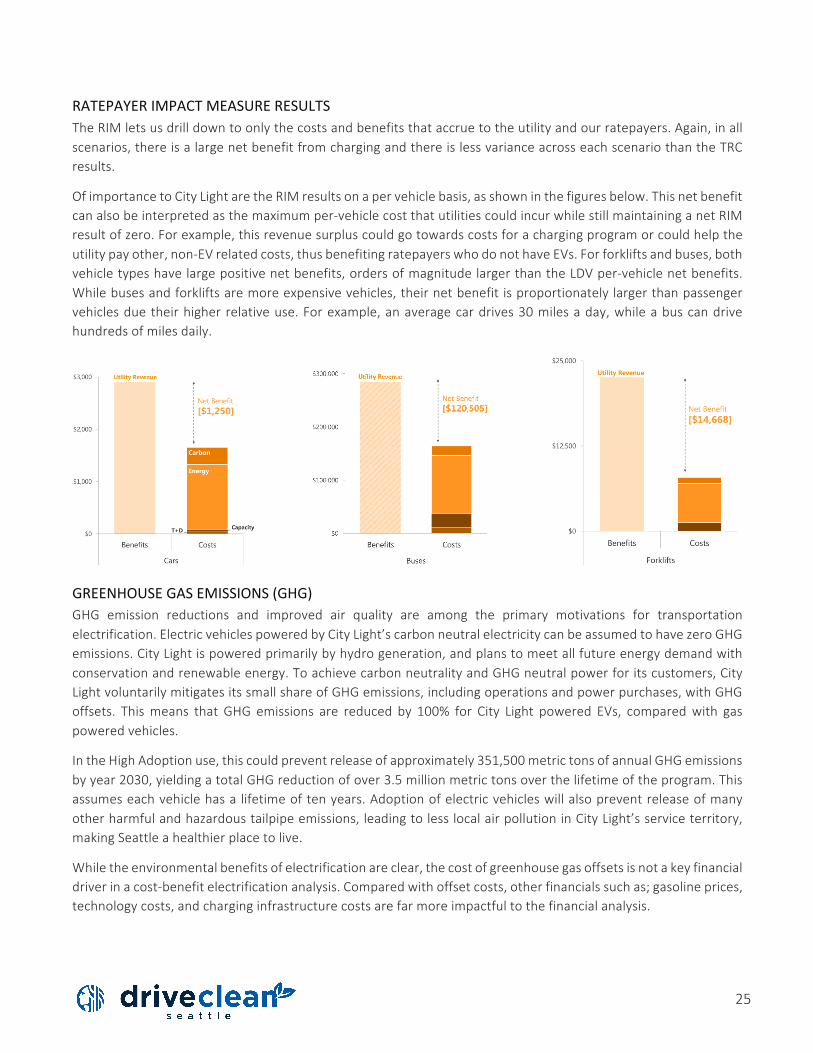
RATEPAYERIMPACTMEASURERESULTSTheRIMletsusdrilldowntoonlythecostsandbenefitsthataccruetotheutilityandourratepayers.Again,inallscenarios,thereisalargenetbenefitfromchargingandthereislessvarianceacrosseachscenariothantheTRCresults.
OfimportancetoCityLightaretheRIMresultsonapervehiclebasis,asshowninthefiguresbelow.Thisnetbenefitcanalsobeinterpretedasthemaximumper-vehiclecostthatutilitiescouldincurwhilestillmaintaininganetRIMresultofzero.Forexample,thisrevenuesurpluscouldgotowardscostsforachargingprogramorcouldhelptheutilitypayother,non-EVrelatedcosts,thusbenefitingratepayerswhodonothaveEVs.Forforkliftsandbuses,bothvehicletypeshavelargepositivenetbenefits,ordersofmagnitudelargerthantheLDVper-vehiclenetbenefits.Whilebusesandforkliftsaremoreexpensivevehicles,theirnetbenefitisproportionatelylargerthanpassengervehiclesduetheirhigherrelativeuse.Forexample,anaveragecardrives30milesaday,whileabuscandrivehundredsofmilesdaily.
GREENHOUSEGASEMISSIONS(GHG)GHG emission reductions and improved air quality are among the primary motivations for transportationelectrification.ElectricvehiclespoweredbyCityLight’scarbonneutralelectricitycanbeassumedtohavezeroGHGemissions.CityLightispoweredprimarilybyhydrogeneration,andplanstomeetallfutureenergydemandwithconservationandrenewableenergy.ToachievecarbonneutralityandGHGneutralpowerforitscustomers,CityLightvoluntarilymitigatesitssmallshareofGHGemissions,includingoperationsandpowerpurchases,withGHGoffsets. Thismeans that GHG emissions are reduced by 100% for City Light powered EVs, comparedwith gaspoweredvehicles.
IntheHighAdoptionuse,thiscouldpreventreleaseofapproximately351,500metrictonsofannualGHGemissionsbyyear2030,yieldingatotalGHGreductionofover3.5millionmetrictonsoverthelifetimeoftheprogram.Thisassumeseachvehiclehasa lifetimeoftenyears.Adoptionofelectricvehicleswillalsopreventreleaseofmanyotherharmfulandhazardoustailpipeemissions,leadingtolesslocalairpollutioninCityLight’sserviceterritory,makingSeattleahealthierplacetolive.
Whiletheenvironmentalbenefitsofelectrificationareclear,thecostofgreenhousegasoffsetsisnotakeyfinancialdriverinacost-benefitelectrificationanalysis.Comparedwithoffsetcosts,otherfinancialssuchas;gasolineprices,technologycosts,andcharginginfrastructurecostsarefarmoreimpactfultothefinancialanalysis.
26
GENERATIONIMPACTSProjectedEVadoptionwilladdadditionalelectric load thatCityLightmustservewith itsgenerationresources.However,webelievetheseloadscanbehandledlargelybyourexistingportfolio.Inthebasecase,weexpectEVstoaddarelativelymodest38aMWofloadperyearby2030,muchofwhichwillbeoffsetbyincreasesinbuildingefficiency.
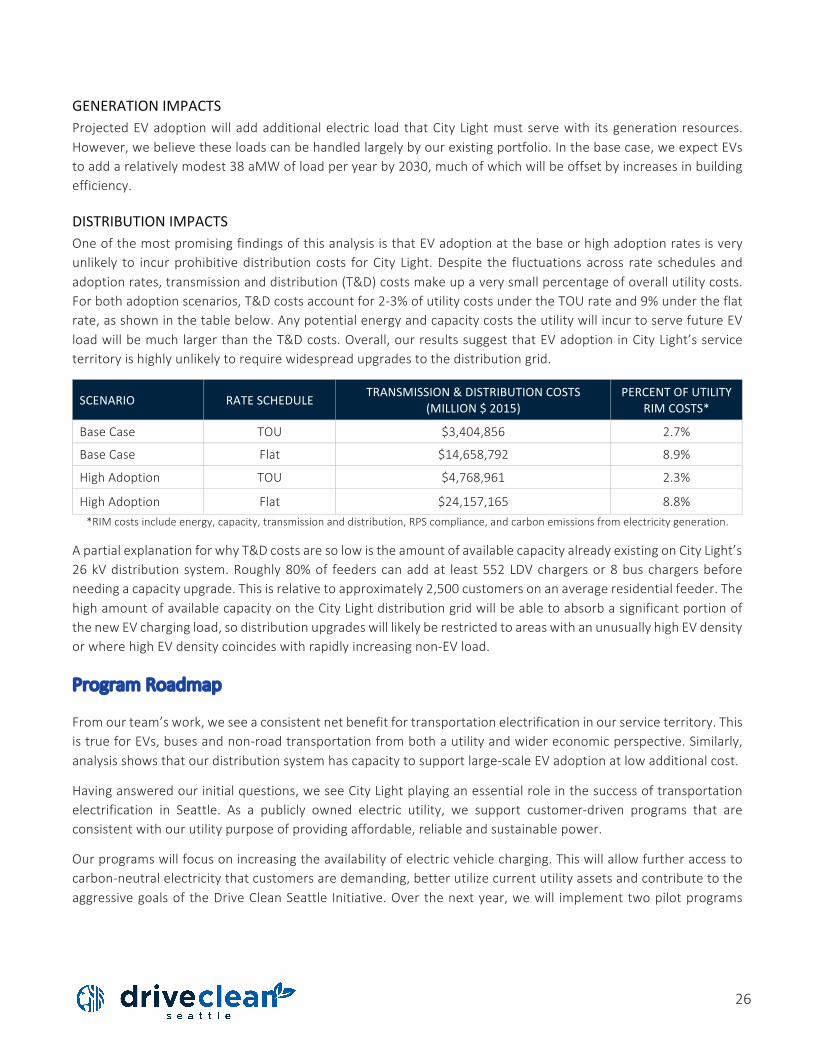
DISTRIBUTIONIMPACTSOneofthemostpromisingfindingsofthisanalysisisthatEVadoptionatthebaseorhighadoptionratesisveryunlikely to incurprohibitivedistribution costs forCity Light.Despite the fluctuations across rate schedules andadoptionrates,transmissionanddistribution(T&D)costsmakeupaverysmallpercentageofoverallutilitycosts.Forbothadoptionscenarios,T&Dcostsaccountfor2-3%ofutilitycostsundertheTOUrateand9%undertheflatrate,asshowninthetablebelow.AnypotentialenergyandcapacitycoststheutilitywillincurtoservefutureEVloadwillbemuchlargerthantheT&Dcosts.Overall,ourresultssuggestthatEVadoptioninCityLight’sserviceterritoryishighlyunlikelytorequirewidespreadupgradestothedistributiongrid.
SCENARIO RATESCHEDULE TRANSMISSION&DISTRIBUTIONCOSTS(MILLION$2015)
PERCENTOFUTILITYRIMCOSTS*
BaseCase TOU $3,404,856 2.7%
BaseCase Flat $14,658,792 8.9%
HighAdoption TOU $4,768,961 2.3%
HighAdoption Flat $24,157,165 8.8%*RIMcostsincludeenergy,capacity,transmissionanddistribution,RPScompliance,andcarbonemissionsfromelectricitygeneration.
ApartialexplanationforwhyT&DcostsaresolowistheamountofavailablecapacityalreadyexistingonCityLight’s26kVdistributionsystem.Roughly80%of feederscanaddat least552LDVchargersor8buschargersbeforeneedingacapacityupgrade.Thisisrelativetoapproximately2,500customersonanaverageresidentialfeeder.ThehighamountofavailablecapacityontheCityLightdistributiongridwillbeabletoabsorbasignificantportionofthenewEVchargingload,sodistributionupgradeswilllikelyberestrictedtoareaswithanunusuallyhighEVdensityorwherehighEVdensitycoincideswithrapidlyincreasingnon-EVload.
ProgramRoadmap
Fromourteam’swork,weseeaconsistentnetbenefitfortransportationelectrificationinourserviceterritory.ThisistrueforEVs,busesandnon-roadtransportationfrombothautilityandwidereconomicperspective.Similarly,analysisshowsthatourdistributionsystemhascapacitytosupportlarge-scaleEVadoptionatlowadditionalcost.
Havingansweredourinitialquestions,weseeCityLightplayinganessentialroleinthesuccessoftransportationelectrification in Seattle. As a publicly owned electric utility, we support customer-driven programs that areconsistentwithourutilitypurposeofprovidingaffordable,reliableandsustainablepower.
Ourprogramswillfocusonincreasingtheavailabilityofelectricvehiclecharging.Thiswillallowfurtheraccesstocarbon-neutralelectricitythatcustomersaredemanding,betterutilizecurrentutilityassetsandcontributetotheaggressivegoalsof theDriveCleanSeattle Initiative.Overthenextyear,wewill implementtwopilotprograms
27
focusedonpublic stations and residential charging. In addition,wewill support fleet and transit electrificationthroughtechnicalassistanceandtechnologydemonstrationprojects.
DCFASTCHARGINGPILOTCityLightwillconstruct20publicDCfastchargingstationsat10-15siteswithinourserviceterritory,whichwilltripletheiravailability.ThesestationsallowEVstochargemostoftheirbatterypackinquick30minutesessionsateitherCity-ownedpropertyorprivatesites.ThestationswillbecompatiblewithallavailableEVmodelsthataredesigned to accept fast charging. City Light will own and install the charging infrastructure, and will charge areasonablefeefortheiruse.
Procurement,designandsiteselectionwillprogressthrough2017,andthefirststationswillbeinoperationbytheendoftheyear.Thesiteswillbehighlyvisibleandeasy-to-accesslocations.ThevisibilityiskeytoshowCityLight’scommitmenttothetechnology,raisingconsumerawarenessaboutEVs,andalsoimprovingchargingavailabilityforresidentswithlimitedparkingandsharedusedmobilityapplications.
RESIDENTIALCHARGINGPILOTInadditiontopubliccharging,CityLightwillhelpinstallatleast200LevelIIstationsincustomers’homes.Thesestationswillfacilitatedatacollectionaboutlocationandusage,andallowustobetterunderstandinmoredetailthe impact to our distribution system. For the customer, itwill lower the initial cost and uncertainlywith thetechnology.
Initially,theprogramdesignwillbebasedontheutilityowningthechargingstationandthecustomerwillhaveamanageablepaymentontheirelectricitybill.WithadditionalauthorityfromtheState,theprogramdesignmightshift toa customer incentive.Weare still determiningeligibilityand if theprogramwillbe targetedbymarketsector,butitisscheduledtolaunchbytheendof2017.
ELECTRICFLEETSFleets,both largeandsmall,areaperfectopportunity toelectrifyvehicles thatsee regularandconsistentuse.However,theprimarychallengeinfleetelectrificationistheenormousquantityofcharginginfrastructurerequired,oftenatasinglelocation.
Toaddresstheseissues,CityLightiscommittedtobetterunderstandingbestpracticesandlowestcostmeanstosupportwidespreadfleetelectrification.Specifically,theSeaParkGarageEVChargingInfrastructureDemonstration,inpartnershipwithEPRI,will testa rangeofcharging technologieson theCity’s fleetvehicles.There isagreatdegree of variation in charging design, from simple charge stations that provide no external control orcommunicationstoadvancedunitsthataresupportedbyremotedatacollection,userauthenticationandcontrolcapabilities.ThisprojectwillhelpCityLightunderstandwaystoleveragemanagedchargingtechnologytomitigateutilityandcustomerinfrastructureupgrades.
TRANSITAll-batteryelectricbusesareanascentbutgrowingsegmentofthetransitmarket.KingCountyMetrohasacquiredthreeall-electricbuses,andhascommittedtohaving120inserviceby2020.Sucharapiddeploymentwillrequirea significant expansion in charging infrastructure, which will likely be located at a Seattle base. City Light willproactivelyworkwithMetrotoprovidetechnicalsupportandaddresselectricserviceopportunities.Wewilldesign

28
astrategythatmakesthemostsenseforbothorganizations–addressingMetro’sneedforflexibilityinthefutureandCityLight’sabilitytooptimizetheloadonourdistributionnetwork.
PENDINGLEGISLATIONWhiletheseprogramswillleverageutilityownershipandourtechnicalexpertise,wealsobelievethereisaroleforCity Light toencourageprivatedevelopmentof charging infrastructure.However,we lack the authority touseratepayerdollarsforthispurpose.Specifically,underArticleVIIIoftheWashingtonStateConstitution,incentivesoranyotherpaymentforprivatelyownedcharging infrastructurecurrentlycouldbeconsideredagiftofpublicfunds.
In parallel to program development, City Light will also pursue legislative authority for more flexibility in ourprogram design.We are closely followingHouse Bill 1335 in the current special session,whichwould provideauthority for using ratepayer funding to support private charging stations. This could affect program design,specificallyonresidentialandtransitopportunities.
SDOTOpportunitiesThe Seattle Department of Transportation (SDOT) is committed to helping the City achieve its climate goals,includingtheDriveCleanSeattleinitiative’sobjectivetoachieve30%ofallvehiclesbeingelectricby2030.Achievingthis goalwill requireamixtureofpolicy changes,procurement changes, infrastructure investment, andpublic-privatepartnerships.SDOT’sapproachistoenabletheexpansionofthesupplyofcharginginfrastructurecitywide(particularlyinthepublicright-of-way)andpromotetheexpansionofthesupplyofelectricvehiclesusedforsharedmobilityserviceslikefree-floatingcarshare,one-waycarshare,TNC-basedridesourcingandridesplittingservices,andothertaxiandfor-hireservices.
The following implementation strategies represent near-term and long-term opportunities that would expandaccesstochargingforpeoplewhodonothaveaccesstoaprivategaragewithparticularemphasisonoptimizingtheuseoflimitedEVchargingforsharedmobility.
AdvanceElectricSharedMobilityandEVSESupplyatSharedMobilityHubs
The Seattle Department of Transportation recently developed a Shared Mobility Hub program to aggregatetransportation connections and travel information into a seamless, understandable, and on-demand travelexperience.SDOTplanstocreateadensenetworkofsharedmobilityhubsthroughoutthecity,oftenco-locatedwithmajor transit facilities and in placeswhere frequent transit services intersect. A key objective for sharedmobilityhubsistoadvancetheuseofelectriccarshareandridesourcingvehiclesbyaccommodatingfastchargingatorverynearhublocations.
Strategicallysitingfastcharginginfrastructureatmajortransitconnectionswilltapintomultiplebenefits,including:
• Improvingaccesstotransit,particularlyinareaswithpoorfirstmile/lastmileconnections• Encouragingsharedmobilityserviceprovidersandtransportationnetworkcompanydriverstoinvestin
EVs• Expandingthesupplyofcleantransportationvehicles• Exchangingrelianceonprivately-ownedvehicleswithmoredemandforsharedEVfleetvehicles
29
Tofunnelchargingstationinvestmentatsharedmobilityhubs,SDOTwillimplementthefollowingoverthenexttwoyears:
• DevelopstrategytofacilitateuseofelectrictransportationatSharedMobilityHubs,focusingondemand,supplyneedsovertime,andimplementationpriorities
• Workwithelectriccharginginfrastructureproviderstotargetinvestmentsatsharedmobilityhubs• CoordinatewithSoundTransitandKingCountyMetrotositecharginginfrastructureontransitproperty
DevelopaNetworkofOff-streetSharedEVSEClusters
ManyneighborhoodsinSeattlehavelanduseswithcommercialorinstitutionalsurfaceparkinglotsandstructuresthatareusedintenselyduringweekdaybusinesshoursbutunderutilizedthroughthenight.Manyparkingfacilitiesaresparselyusedorvacantfrom7:00p.m.–7:00a.m.,creatingopportunitiestorenttheemptyparkingspotstoresidents interested inaccess tocharging.Thisstrategyrequires the following implementationactionsover thenexttwoyears:
• BeginapartnershipandcollaborationwithSeattleDepartmentofConstructionandInspectionstoimplementthisstrategy
• Developanoff-streetEVchargingclusterplantodeterminephasedsupplyforlease-basedEVcharging• Developaleaseagreementtemplateforcommercialpropertyownerstoexecuteshareduseleasesfor
overnightEVstorageandcharging• StudythefeasibilityandorganizationalstructuresforasharedEVSEparkingbrokerage(eitherpublicly
managedorinpartnershipwithoneormoreprivateappdevelopers)
EV-ReadyCodesCodesandregulationsare important tools toencouragethe installationofelectricvehiclechargingequipment.RecentcodechangesinSeattlehavehelpedsupportEVcharging.OurLandUseCodewasamendedin2011toallowchargingdevicesinyardsinsingle-familyzones.Inaddition,thedefinitionof“retailsalesandservices,automotive”wasclarifiedtoallowbatteryexchangestationsforelectricvehiclestobeincludedamongautomotiveretailsalesandserviceusesallowedincommercialzones.Finally,thedefinitionof“principaluseparking”wasclarifiedsothatbattery charging stations and rapid charging stations for electric vehicles are considered accessory to parkingfacilities.Thelandusecodepresentanopportunitytorequiretheelectrificationofparkingspaces.Forexample,San Francisco recently adopted a 100% EV Ready ordinance requiring parking spaces in new residential andcommercialbuildings.
30
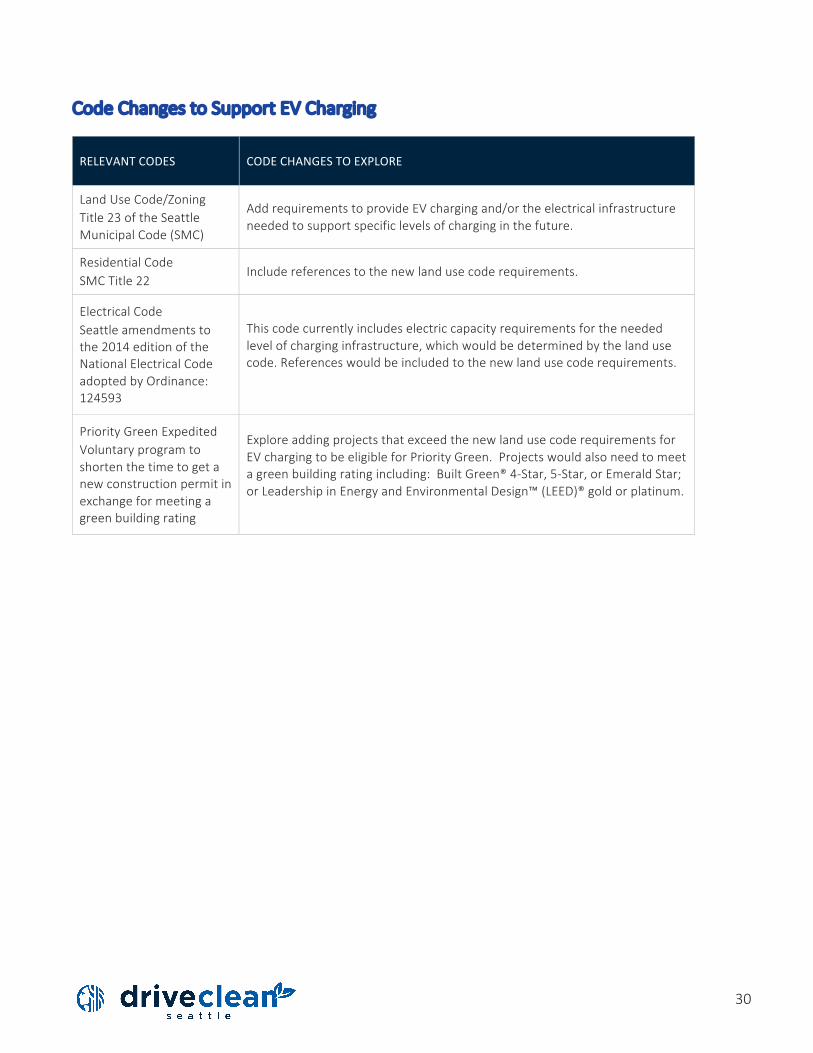
CodeChangestoSupportEVCharging
RELEVANTCODES CODECHANGESTOEXPLORE
LandUseCode/ZoningTitle23oftheSeattleMunicipalCode(SMC)
AddrequirementstoprovideEVchargingand/ortheelectricalinfrastructureneededtosupportspecificlevelsofcharginginthefuture.
ResidentialCodeSMCTitle22
Includereferencestothenewlandusecoderequirements.
ElectricalCodeSeattleamendmentstothe2014editionoftheNationalElectricalCodeadoptedbyOrdinance:124593
Thiscodecurrentlyincludeselectriccapacityrequirementsfortheneededlevelofcharginginfrastructure,whichwouldbedeterminedbythelandusecode.Referenceswouldbeincludedtothenewlandusecoderequirements.
PriorityGreenExpeditedVoluntaryprogramtoshortenthetimetogetanewconstructionpermitinexchangeformeetingagreenbuildingrating
ExploreaddingprojectsthatexceedthenewlandusecoderequirementsforEVchargingtobeeligibleforPriorityGreen.Projectswouldalsoneedtomeetagreenbuildingratingincluding:BuiltGreen®4-Star,5-Star,orEmeraldStar;orLeadershipinEnergyandEnvironmentalDesign™(LEED)®goldorplatinum.

RACIAL EQUITY ANALYSIS
5
32
2016RacialEquityToolkitAraceandsocial justice lens isessentialtoensurethebenefitsoftransportationelectrificationaccruetothosemostimpactedbythenegativeeffectsofafossilfuelbasedtransportationsystemandtoensuretransportationelectrificationstrategiesdonotexacerbateexistinginequities.AnimportantgoaloftheDriveCleanSeattleinitiative(DCS)istomaximizeairquality,cost-savings,andotherbenefitsofelectrictransportationforcommunitiesofcolor.In2016,theOfficeofSustainabilityandEnvironmentcompletedaRacialEquityToolkit(RET)fortheDriveCleanSeattleinitiative.
TheSeattleEquity&EnvironmentAgendaservedasthefoundationforthedevelopmentofracialequityoutcomes,whichwererefinedwithinputfromtheCommunityPartnersSteeringCommittee.
DriveCleanSeattleRacialEquityOutcomes
1. ImproveairqualityintheplaceswhereEEIcommunitieslive,learn,workandplay.2. BringeconomicbenefittoEEIcommunitiesthroughanincreaseingreentransportationjobsanda
decreaseintransportationcosts.3. EEIcommunitieshaveequitableaccess,accountability,anddecision-makingpowerinDriveCleanSeattle.4. HighlightthecleantransportationstoriesandexperiencesofEEIcommunities.
DriveCleanSeattleprogramhasbeencollaboratingwiththeEquity&EnvironmentInitiative(EEI)toidentifyactionstoadvancethesegoals.DriveCleanSeattleandEEIstaffcollaboratedtohostaworkshopwiththeEEICommunityPartnersSteeringCommittee.whichresultedin:
• Sharedgoals,identifiedexistingconnectedwork,identifiedandsharedcreativeandunusualideastoadvancetheEquity&EnvironmentAgenda.
• Surfacedbarriers,assumptions,andquestionsregardingparticipationinDCSfromcommunitiesofcolor.• Begantoestablishacollaborativerelationshipwithcommunityleaders.
DriveCleanSeattleseekstodeveloppoliciesandmakeinvestmentswhichcenterenvironmentaljustice.Reducingtransportation pollution is an important environmental justice strategy because the environmental benefits ofelectrictransportationsuchasbetterairquality,decreasedclimatepollution,and lessstormwaterpollutionalladdressenvironmentalhazardswhichdisproportionatelyaffectcommunitiesofcolor.Further,byelectrifyingthetransportation sector, theCity is creatinga less costlyandmoreconvenient transportationexperience.Electrictransportationprovidessignificantpotentialeconomicbenefitsforcommunitiesofcolorsuchasgreenjobsincleantransportationorinrelatedelectricalworkandmoremoneycirculatinginlocaleconomiesasfueldollarsarekeptat home. However, there is real concern that, without a diverse set of policies in place, simply increasing EVinfrastructure in communities could increase rents or other cost of living indicators and increase risks ofdisplacementandgentrification.
33
2017RaceandSocialJusticeStrategiesBuildingontheworkin2016,theDriveCleanSeattleteammetwiththeEnvironmentalJusticeCommitteeearlyin2017.ContinuingtobuildthispartnershipwillhelpdeliverontheracialequityoutcomesestablishedaspartoftheRET.Importantracialequityimplementationactionsfor2017include:
• Utilizecreative,culturallyrelevantstrategiesandfostercommunitycohesionbyconnectingEVandtransportationprogramstoculturalanchors,suchascommunitycenters,churches,andserviceproviders.Initialideasincludelocatingchargerstoservethesefacilities,providemapstolocalservicesatchargingstations,creatinginterpretativesignageaboutelectricvehicles,engaginglocalyouthincreatingartforthechargingstations.
• EngagecommunitytolearnhowincreasingEVinfrastructuremayundulyburdenEEIpopulationsandhaveunintendedconsequencesarounddisplacementandgentrification.Workwithcommunityandstakeholderstoidentifyandmitigateunintendedconsequencessuchasimpactstoparkingforlocalbusinesses,increasedpropertyvalues,andchangesintypesofjobsneededtoserviceelectricvehicles.
• Partnerdirectlywithcommunity-basedorganizations,workinclosecollaborationwiththeEEI,andbuildpartnershipswithserviceindustryanchorstodevelopasuiteofpolicyandprogramactionswhichwillworkintandemtoaddressracialequityintransportationelectrification.EarlyideasbrainstormedbytheEnvironmentalJusticeCommitteeincludedevelopingjobtrainingprograms,providinginterpretativesignageatchargingstationsdescribingthebenefitsofelectricvehicles,andcollaboratingwithlocalcommunityserviceproviderstouseelectricvehicles.WewillcontinuetoexploretheideasincollaborationwiththeCommittee.
• AssistinanyracialequityanalysesformajorprojectswithinDriveCleanSeattlebyprovidingdataandcoordinatingstakeholderengagementwiththeEnvironmentalJusticeCommitteeandothers.ThiswillhelpprojecttoolkitshaveintegratedoutcomesthatflowfromtheDCStoolkitsimilartohowtheDCSoutcomeswerecoordinatedextensionsoftheEquity&EnvironmentAgenda.
CONCLUSION
6
35
Tomeetourcarbonneutralitygoals, it iscriticalthatweelectrifythetransportationsector.Lightdutyvehicles,whetherowned,shared,autonomous,orpartofafleet,willremainanimportantcomponentofthetransportationsystem.Therefore,theCitysetagoaltoincreaseelectriclightdutyvehicleownershipto30%by2030.Tomeetthisgoal andbroaderelectrificationgoals,MayorMurray launched theDriveCleanSeattle Initiative to significantlyexpandourworktoelectrifythetransportationsectoratscaleandtoputusonthepathtocarbonneutrality.
The experienceof citieswith thehighest rates of EV adoptiondemonstrates that local government canplay asignificantroleinacceleratingthetransitiontoelectrictransportationbyaddressingthemostsignificantbarrierstoEVadoption.Seattleisdeployingacomprehensivesuiteofstrategiesthataddressthebarriersofcost,chargingconvenience, and consumer awarenesswhile centering environmental justice. Following the example of otherleading cities and thinking about our unique set of circumstances and characteristics, Seattle’s electrificationstrategiesarebeingdesignedto:
• Becoordinatedandcomprehensiveandfeatureadiversesetofstakeholders.• Leveragetechnologytoadvancethegoalsofashared,clean,andequitabletransportationsystem.• Ensurethebenefitsofacleantransportationsystemaccruetothosemostimpactedbytheairpollution
ofthecurrentsystem.• Facilitatinggreateraccesstochargingandprioritizepubliclyavailablecharginginwayswhichenable
sharedmobility,fleetelectrification,andotherpolicygoals.• Increaseconsumerexposuretoelectricvehiclesandawarenessaboutthebenefitsofelectrification
throughsustainedprogramsandoutreachactivities.• ElectrifytheCity’smunicipalfleettoleadbyexampleanddemonstratebestpractices.
As laboratories for innovation, citiesarewhere the futurehappens first.And,as the levelofgovernmentmostcloselyconnectedtopeople’sdailylives,citieshaveuniqueopportunitiestoimproveairqualityandpublichealth,advanceenvironmental justice,andreducetheeconomicrisksof fossil fueldependenceandworseningclimatechange through policies and programs which support electric vehicles. Seattle’s goals are bold, and ourcommunities’innovativespiritandcommitmenttoenvironmentalqualityforallpositionsustomeetthechallengeinwaysthatyieldenvironmental,communityandeconomicgoals.

WWW.SEATTLE.GOV/ENVIRONMENT