Embed Size (px)
Citation preview
1
2016 ANNUAL REPORT
Queensland State School Reporting
Inspiring minds. Creating opportunities. Shaping Queensland’s future. Every student succeeding. State Schools Strategy 2016-2020
Department of Education and Training
2
Contact Information
Postal address: PO Box 380 Helensvale 4212
Phone: (07) 5502 5111
Fax: (07) 5502 5100
Email: [email protected]
Webpages: Additional reporting information pertaining to Queensland state schools is located on the My School website and the Queensland Government data website.
Contact Person: Mr Mark Peggrem
School Overview
Our mission at Pacific Pines State High School is to support every student to be the very best they can be. To do this we have created a school culture that values each individual student and developed a range of pathways for students. Consistently outstanding Year 12 outcomes over a number of years are a testament to the achievement of our mission. Those extraordinary results include better than state average for the percentage of students receiving an OP 1- 15, the percentage of students receiving a Queensland Certificate of Education, the percentage of students completing Vocational Education Certificates and the number of students involved in a School based Apprenticeship or Traineeship. Most recently our NAPLAN focus has been on increasing the percentage of students in the top two bands and we are pleased to report improvement in most areas. Through our Pastoral Care programs and through a range of excellent sporting, recreational, cultural, performance and academic programs students are nurtured to explore their potential.
Principal’s Foreword
Pacific Pines State High is a happy, friendly school where strong relationships exist between staff, parents and students. We believe that these relationships underpin the teaching and learning journey which in turn creates a strong, positive school culture.
At PPSH we instill a sense of personal and collective integrity in our students which will serve them well throughout their lives regardless of what happens in the future. In conjunction with our families we nurture our students with a sense of purpose and a clear set of values.
We continue to cultivate an expert teaching team who are trained in understanding how each individual student learns and thus provide a comprehensive curriculum. Promoting school pride in our staff and students has enabled us to create a sense of belonging.
The staff at PPSH have a strong commitment to their ongoing professional development, with a significant number of them who undertake study in further understanding adolescent learning and improving student outcomes. Staff consistently provide students with immediate feedback and create lessons where students are actively engaged in class rather than passively sitting in a classroom just listening to their teacher. This approach enables students to improve their level of achievement in their respective subjects.
At PPSH we are proud to cater for all of our students whether they are interested in our Centre of Excellence Programs in academics, creative arts or physical education. We offer Centre of Excellence programs in mathematics, engineering, applied science, creative writing, creative arts, young innovators and sports as well as offering traineeships , design and construction which we believe expertly caters for our diverse range of student learning styles to strengthen our dynamic school.
3
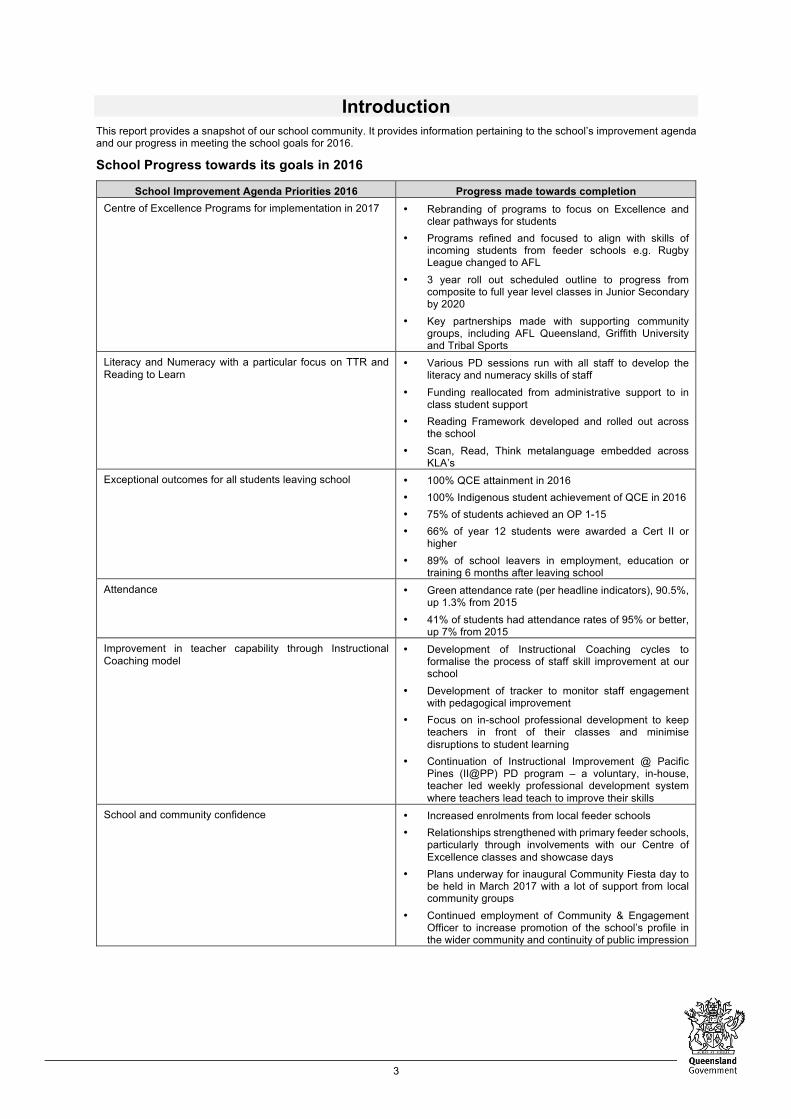
Introduction This report provides a snapshot of our school community. It provides information pertaining to the school’s improvement agenda and our progress in meeting the school goals for 2016.
School Progress towards its goals in 2016
School Improvement Agenda Priorities 2016 Progress made towards completion Centre of Excellence Programs for implementation in 2017 • Rebranding of programs to focus on Excellence and
clear pathways for students • Programs refined and focused to align with skills of
incoming students from feeder schools e.g. Rugby League changed to AFL
• 3 year roll out scheduled outline to progress from composite to full year level classes in Junior Secondary by 2020
• Key partnerships made with supporting community groups, including AFL Queensland, Griffith University and Tribal Sports
Literacy and Numeracy with a particular focus on TTR and Reading to Learn
• Various PD sessions run with all staff to develop the literacy and numeracy skills of staff
• Funding reallocated from administrative support to in class student support
• Reading Framework developed and rolled out across the school
• Scan, Read, Think metalanguage embedded across KLA’s
Exceptional outcomes for all students leaving school • 100% QCE attainment in 2016 • 100% Indigenous student achievement of QCE in 2016 • 75% of students achieved an OP 1-15 • 66% of year 12 students were awarded a Cert II or
higher • 89% of school leavers in employment, education or
training 6 months after leaving school Attendance • Green attendance rate (per headline indicators), 90.5%,
up 1.3% from 2015 • 41% of students had attendance rates of 95% or better,
up 7% from 2015 Improvement in teacher capability through Instructional Coaching model
• Development of Instructional Coaching cycles to formalise the process of staff skill improvement at our school
• Development of tracker to monitor staff engagement with pedagogical improvement
• Focus on in-school professional development to keep teachers in front of their classes and minimise disruptions to student learning
• Continuation of Instructional Improvement @ Pacific Pines (II@PP) PD program – a voluntary, in-house, teacher led weekly professional development system where teachers lead teach to improve their skills
School and community confidence • Increased enrolments from local feeder schools • Relationships strengthened with primary feeder schools,
particularly through involvements with our Centre of Excellence classes and showcase days
• Plans underway for inaugural Community Fiesta day to be held in March 2017 with a lot of support from local community groups
• Continued employment of Community & Engagement Officer to increase promotion of the school’s profile in the wider community and continuity of public impression
4
Future Outlook In 2017, the improvement agenda and priority areas for development were listed in the 2017 Annual Improvement Plan. These have a sharp and narrow focus to target key priority areas that will make a significant impact on our students’ learning.
1. Visible Learning • Instructional coaching and improvement
o data driven feedback cycles § Reading § Numeracy
• Embedding of e-Learning o BYOD o ICT’s
• Focus on skills and processes o Visible learning o CCE’s o Differentiation
2. Positive Behaviour for Learning (PBL)
• Culture of recognition
o Behaviour o Attendance o Achievements
• Student and Staff well-being • Community pride in school
5
Our School at a Glance
School Profile
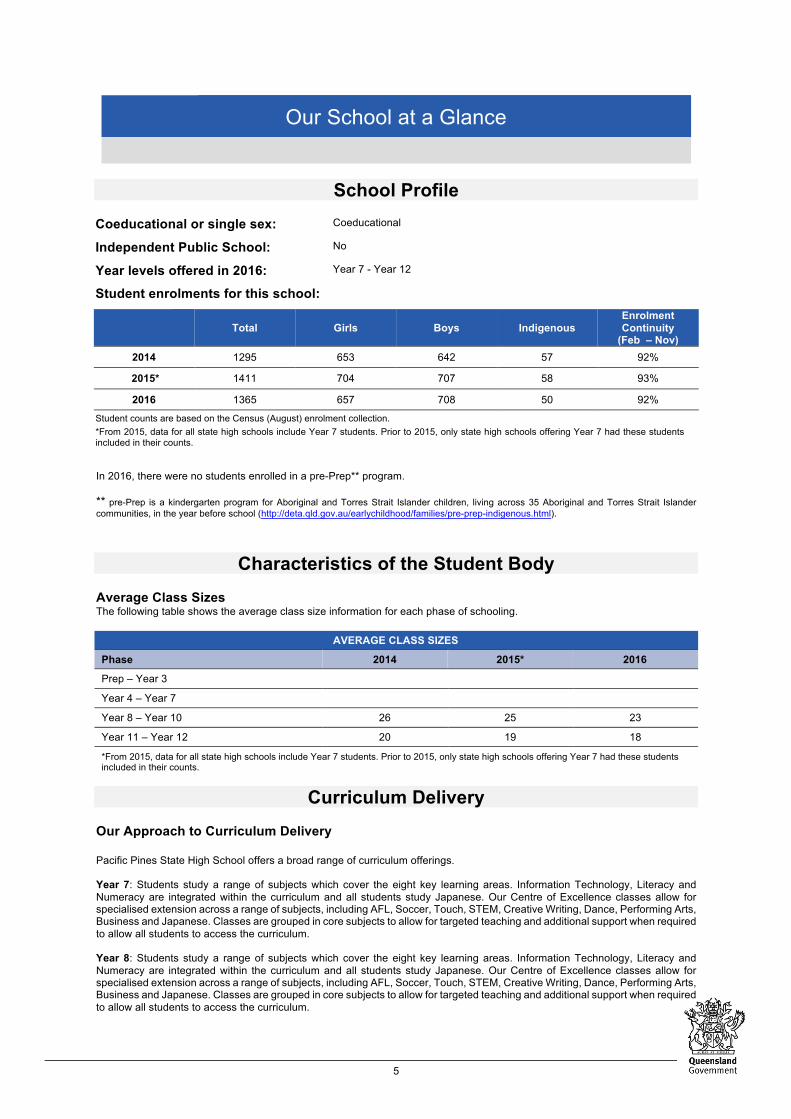
Coeducational or single sex: Coeducational
Independent Public School: No
Year levels offered in 2016: Year 7 - Year 12
Student enrolments for this school:
Total Girls Boys Indigenous Enrolment Continuity
(Feb – Nov) 2014 1295 653 642 57 92%
2015* 1411 704 707 58 93%
2016 1365 657 708 50 92%
Student counts are based on the Census (August) enrolment collection. *From 2015, data for all state high schools include Year 7 students. Prior to 2015, only state high schools offering Year 7 had these students included in their counts.
In 2016, there were no students enrolled in a pre-Prep** program. ** pre-Prep is a kindergarten program for Aboriginal and Torres Strait Islander children, living across 35 Aboriginal and Torres Strait Islander communities, in the year before school (http://deta.qld.gov.au/earlychildhood/families/pre-prep-indigenous.html).
Characteristics of the Student Body
Average Class Sizes The following table shows the average class size information for each phase of schooling.
AVERAGE CLASS SIZES
Phase 2014 2015* 2016
Prep – Year 3
Year 4 – Year 7
Year 8 – Year 10 26 25 23
Year 11 – Year 12 20 19 18
*From 2015, data for all state high schools include Year 7 students. Prior to 2015, only state high schools offering Year 7 had these students included in their counts.
Curriculum Delivery Our Approach to Curriculum Delivery Pacific Pines State High School offers a broad range of curriculum offerings. Year 7: Students study a range of subjects which cover the eight key learning areas. Information Technology, Literacy and Numeracy are integrated within the curriculum and all students study Japanese. Our Centre of Excellence classes allow for specialised extension across a range of subjects, including AFL, Soccer, Touch, STEM, Creative Writing, Dance, Performing Arts, Business and Japanese. Classes are grouped in core subjects to allow for targeted teaching and additional support when required to allow all students to access the curriculum. Year 8: Students study a range of subjects which cover the eight key learning areas. Information Technology, Literacy and Numeracy are integrated within the curriculum and all students study Japanese. Our Centre of Excellence classes allow for specialised extension across a range of subjects, including AFL, Soccer, Touch, STEM, Creative Writing, Dance, Performing Arts, Business and Japanese. Classes are grouped in core subjects to allow for targeted teaching and additional support when required to allow all students to access the curriculum.
6
Year 9: Students are required to study English, Maths, SOSE, Science and HPE. Students choose 4 semester subjects from the other key learning areas. Our Centre of Excellence classes allow for specialised extension across a range of subjects including AFL, Soccer, Touch, STEM, Creative Writing, Dance, Performing Arts, Business and Japanese. Classes are grouped in core subjects to allow for targeted teaching and additional support when required to allow all students to access the curriculum. Year 10: Students are required to study English, Maths, Science and History and choose four other subjects. Year 10 is seen as a preparation and transition to the senior years of schooling and students are encourage to try the elective subjects they are considering taking in years 11 & 12. Extension is offered through a semester Physics/Maths C elective for students considering this option. Year 11 & 12: Students are required to study an English subject and a Maths subject and four other subjects from an extensive list of authority, non-authority subjects and vocational subjects. Multiple pathways are available to students including OP, Vocational, School Based Apprenticeships and Traineeships. Other Academic and Vocational Programs: Pacific Pines State High School is a Griffith University Partner School. As part of the “Griffith University Guests Program” a number of students in Year 12 2015 studied a university subject at Griffith University. Success in that subject provides guaranteed entry into Griffith University when the students graduate. Our school is also part of the “GriffBiology” program. A guaranteed offer of university entry is provided to students who achieve particular results in Senior Biology and meet the course pre-requisites. Our school is also part of the “GriffEngineering” program. A guaranteed offer of university entry is provided to students who achieve particular results in Senior Physics/Maths B and meet the course pre-requisites. Pacific Pines State High School received a number of direct entries to Gold Coast TAFE on the basis of their Year 12 results. The school has a number of students who attend Gold Coast TAFE during the school week. Pacific Pines State High School has collaborated with neighbouring high schools to form the Northern Collegiate of Schools. Collectively these schools offer to students the opportunity to study in areas that could not be offered by individual schools. Many students participate in Vocational Education and the school is registered to teach and assess an extensive range of vocational subjects. Sport: Our school has an exclusive partnership with AFL Queensland for our Centre of Excellence AFL program. The school offers AFL, Touch Football, Soccer and Volleyball as subjects in Years 7 – 10 through our Excellence classes. The school participates in interschool sport as part of the Northern Cluster of Schools. Individual students can achieve representative honours through our affiliation with Broadwater District Sport and South Coast Regional Sport. The school participates in a number of external sport competitions including the Volleyball Schools’ Cup. Co-curricular Activities § Year 12 Formal - Bond University § Northern Collegiate Leadership § Australian Business Week § Transition program- Junior secondary students transitioning into high school from feeder primary schools § Work experience and work placement training § Year 10 Semi Formal - Brisbane River Cruise § Sports Awards Evening § Academic Awards Evening § Jazz Band, Concert Band and the String Ensemble all performed at the Gold Coast Eisteddfod § Dance groups performed at the Gold Coast and Beenleigh Eisteddfods § Brisbane Eisteddfod – Dance § Music ensembles – Fanfare § Senior Drama – Gold Coast Drama Festival § Danc’Ed in the Spotlight Festival § Energies Art exhibition § Our Indigenous students participate in a number of cultural activities. They also participated in the AIMES program and
took a leadership role in the celebration of NAIDOC Week and Harmony Day § Year 8 Camp - Maroon Dam § School Musical § NAPLAN breakfast run by school leaders § Volleyball Schools Cup Junior and Senior § Ballymore Cup – Rugby Union § Barry Honan Cup – Rugby § Benowa 7’s – Rugby § AFL Girls GOCL Coast Cup § Hillcrest Invitational – Basket Ball § Ski Trip § Life skills - living and social skills program for students with disabilities § Work skills-program developing workplace skills for senior students on transition to post-school options. § Community Access programs for students with disabilities - Orientation, mobility and functional capacity to engage in the
community. Weekly external school trips to various locations within the local and wider Gold Coast community § Vietnam trip for Tourism students § Northern Collegiate Leadership Camp
7
§ Catering for Harmony Day, School Musical, Sports Awards Evening and QCS breakfast § Charity work including: Go Blue for Autism, World Vision, Multiple Sclerosis, Jeans for Genes, Shave for a Cure, Animal
Welfare League § Tourism Expo § Bond University Mooting Competition § Vicky Wilson Netball Cup § Science and Engineering Challenge § Science, Technology, Engineering and Maths Ambassadors program (Griffith University) § Science Club § Japanese Trip in the September School holidays § Cross Country, Athletics and Swimming district competitions § Broadwater and South Coast representative sport trials § Year 11 & 12 Study Nights (twice a term, 3.30 – 7pm) § The visit to our school from Japanese school Hitsuyukan High is a highlight on the calendar each year and our school
community looks forward to the visit next year. § Established link through Griffith University as Griffith University Academy campus § Cutting edge for kids science day § Hasting Point Biology Camp § Junior STEM robotics Olympiad § Engineering and Applied Science challenge § Science and engineering challenge § Dreamworld physics day § World Science fair STEM ambassador conference § Griffith University STEM ambassador program § Science week activities – Gold Coast Science Competition, trivia night, and other engaging activities How Information and Communication Technologies are used to Assist Learning In 2016 we began our ‘Bring Your Own Device (BYOD)’ journey. In 2017, being part of the BYOD program will be mandatory for years 7 & 8 students, and in 2018 it will be mandatory for all students in years 7 – 11. To support these devices, we are currently investing in our infrastructure to allow more devices to simultaneously access our WIFI network to maximise learning. In addition to BYOD, we maintain a number of computer labs to assist students with subject specific technology that would otherwise be cost prohibitive for families and have a number of computer trolleys that house mobile laptops that can be moved around to various blocks in the schools to maximise access. Before school, at lunchtimes and after school desktop computers are available for student use in the school Resource Centre. All Teaching staff at Pacific Pines SHS have been provided laptops by Education Qld under the CFT “Computers for Teachers” scheme. As all teachers and an increasing number of students have a laptop, the change in teaching and learning to implement and reinforce the use of digital technologies was clearly evident around the school. Teaching pedagogy involving technology was greatly influenced by the consolidated use of the EQ developed “Symphony of Teaching and Learning” which maps elements of Blooms Taxonomy to digital and internet based web tools. We have run multiple professional development sessions for teachers through our Instructional Improvement @ Pacific Pines (II@PP) program that are designed to enhance the incorporation of e-Learning into their classrooms and it is an expectation in our unit and lesson plans that e-Learning opportunities occur on a daily basis for all students, initially in years 7 & 8 but as BYOD continues to roll out these expectations will increase across further year levels.
Social Climate Overview In 2016 we successfully applied to become a Positive Behaviour for Learning (PBL) school. Our implementation year is scheduled for 2017 and by 2018 our PBL program will be running across the school, with a heavy focus on positive rewards and teaching expected behaviours. Our school has implemented the key features of School Wide Positive Behaviour Support with the adoption of the school values - Be Safe, Be Respectful, Be Responsible and Be a Learner. These expectations have been elaborated into expectations of behaviour in the classroom and the playground. Clear expectations of student behaviour, the capacity for students to be involved in a range of extra- curricular activities and the support of staff including the School Chaplain, Health Nurse, Youth Support Coordinator and Guidance Counsellor contribute to a positive school climate. In addition, in 2016 our PE department volunteered to integrate our Pastoral Care program into the HPE curriculum for junior students. This move allows our students greater access to information regarding health and wellbeing and has been a very positively received by the students.
8
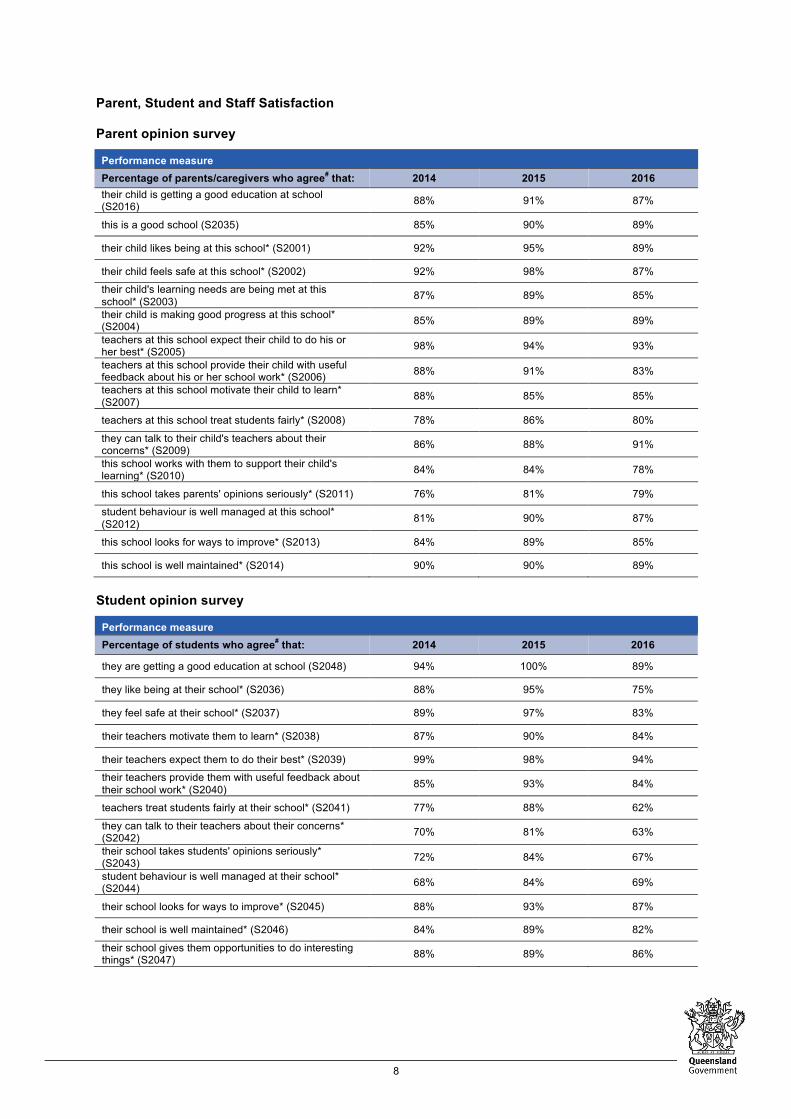
Parent, Student and Staff Satisfaction Parent opinion survey
Performance measure Percentage of parents/caregivers who agree# that: 2014 2015 2016 their child is getting a good education at school (S2016) 88% 91% 87%
this is a good school (S2035) 85% 90% 89%
their child likes being at this school* (S2001) 92% 95% 89%
their child feels safe at this school* (S2002) 92% 98% 87% their child's learning needs are being met at this school* (S2003) 87% 89% 85%
their child is making good progress at this school* (S2004) 85% 89% 89%
teachers at this school expect their child to do his or her best* (S2005) 98% 94% 93%
teachers at this school provide their child with useful feedback about his or her school work* (S2006) 88% 91% 83%
teachers at this school motivate their child to learn* (S2007) 88% 85% 85%
teachers at this school treat students fairly* (S2008) 78% 86% 80%
they can talk to their child's teachers about their concerns* (S2009) 86% 88% 91%
this school works with them to support their child's learning* (S2010) 84% 84% 78%
this school takes parents' opinions seriously* (S2011) 76% 81% 79% student behaviour is well managed at this school* (S2012) 81% 90% 87%
this school looks for ways to improve* (S2013) 84% 89% 85%
this school is well maintained* (S2014) 90% 90% 89%
Student opinion survey
Performance measure Percentage of students who agree# that: 2014 2015 2016
they are getting a good education at school (S2048) 94% 100% 89%
they like being at their school* (S2036) 88% 95% 75%
they feel safe at their school* (S2037) 89% 97% 83%
their teachers motivate them to learn* (S2038) 87% 90% 84%
their teachers expect them to do their best* (S2039) 99% 98% 94% their teachers provide them with useful feedback about their school work* (S2040) 85% 93% 84%
teachers treat students fairly at their school* (S2041) 77% 88% 62%
they can talk to their teachers about their concerns* (S2042) 70% 81% 63%
their school takes students' opinions seriously* (S2043) 72% 84% 67%
student behaviour is well managed at their school* (S2044) 68% 84% 69%
their school looks for ways to improve* (S2045) 88% 93% 87%
their school is well maintained* (S2046) 84% 89% 82%
their school gives them opportunities to do interesting things* (S2047) 88% 89% 86%
9
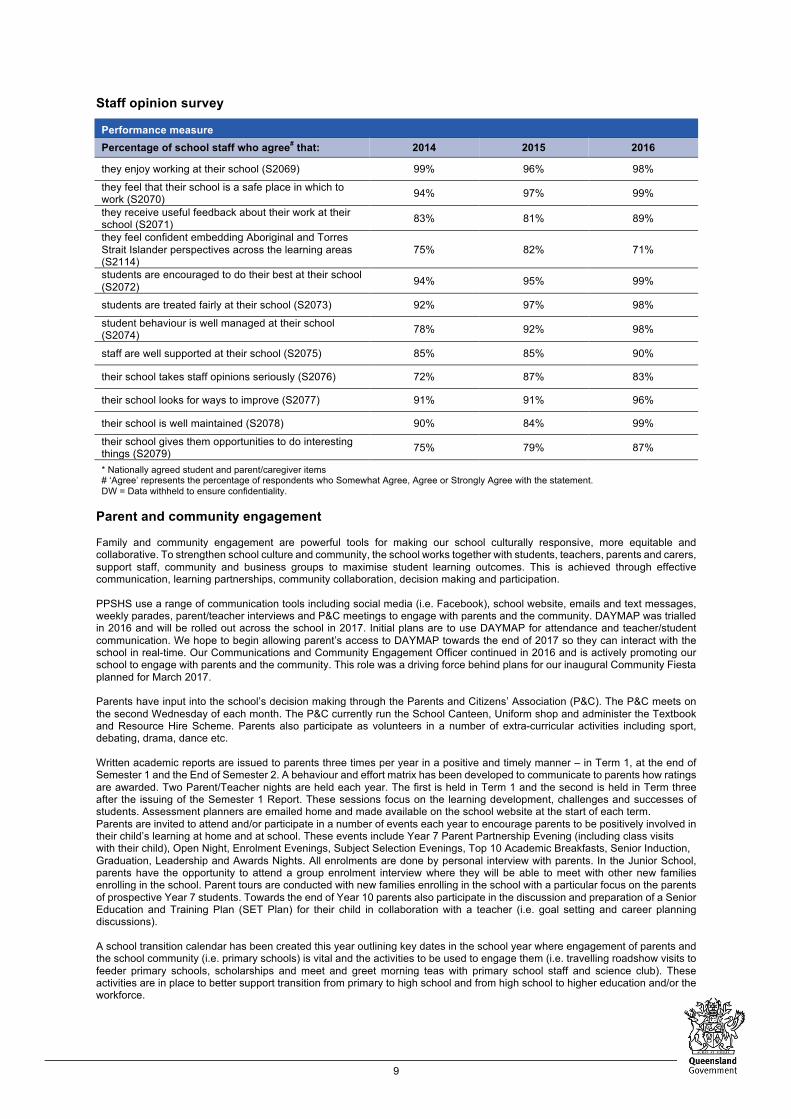
Staff opinion survey
Performance measure Percentage of school staff who agree# that: 2014 2015 2016
they enjoy working at their school (S2069) 99% 96% 98%
they feel that their school is a safe place in which to work (S2070) 94% 97% 99%
they receive useful feedback about their work at their school (S2071) 83% 81% 89%
they feel confident embedding Aboriginal and Torres Strait Islander perspectives across the learning areas (S2114)
75% 82% 71%
students are encouraged to do their best at their school (S2072) 94% 95% 99%
students are treated fairly at their school (S2073) 92% 97% 98%
student behaviour is well managed at their school (S2074) 78% 92% 98%
staff are well supported at their school (S2075) 85% 85% 90%
their school takes staff opinions seriously (S2076) 72% 87% 83%
their school looks for ways to improve (S2077) 91% 91% 96%
their school is well maintained (S2078) 90% 84% 99%
their school gives them opportunities to do interesting things (S2079) 75% 79% 87%
* Nationally agreed student and parent/caregiver items # ‘Agree’ represents the percentage of respondents who Somewhat Agree, Agree or Strongly Agree with the statement. DW = Data withheld to ensure confidentiality.
Parent and community engagement Family and community engagement are powerful tools for making our school culturally responsive, more equitable and collaborative. To strengthen school culture and community, the school works together with students, teachers, parents and carers, support staff, community and business groups to maximise student learning outcomes. This is achieved through effective communication, learning partnerships, community collaboration, decision making and participation. PPSHS use a range of communication tools including social media (i.e. Facebook), school website, emails and text messages, weekly parades, parent/teacher interviews and P&C meetings to engage with parents and the community. DAYMAP was trialled in 2016 and will be rolled out across the school in 2017. Initial plans are to use DAYMAP for attendance and teacher/student communication. We hope to begin allowing parent’s access to DAYMAP towards the end of 2017 so they can interact with the school in real-time. Our Communications and Community Engagement Officer continued in 2016 and is actively promoting our school to engage with parents and the community. This role was a driving force behind plans for our inaugural Community Fiesta planned for March 2017. Parents have input into the school’s decision making through the Parents and Citizens’ Association (P&C). The P&C meets on the second Wednesday of each month. The P&C currently run the School Canteen, Uniform shop and administer the Textbook and Resource Hire Scheme. Parents also participate as volunteers in a number of extra-curricular activities including sport, debating, drama, dance etc. Written academic reports are issued to parents three times per year in a positive and timely manner – in Term 1, at the end of Semester 1 and the End of Semester 2. A behaviour and effort matrix has been developed to communicate to parents how ratings are awarded. Two Parent/Teacher nights are held each year. The first is held in Term 1 and the second is held in Term three after the issuing of the Semester 1 Report. These sessions focus on the learning development, challenges and successes of students. Assessment planners are emailed home and made available on the school website at the start of each term. Parents are invited to attend and/or participate in a number of events each year to encourage parents to be positively involved in their child’s learning at home and at school. These events include Year 7 Parent Partnership Evening (including class visits with their child), Open Night, Enrolment Evenings, Subject Selection Evenings, Top 10 Academic Breakfasts, Senior Induction, Graduation, Leadership and Awards Nights. All enrolments are done by personal interview with parents. In the Junior School, parents have the opportunity to attend a group enrolment interview where they will be able to meet with other new families enrolling in the school. Parent tours are conducted with new families enrolling in the school with a particular focus on the parents of prospective Year 7 students. Towards the end of Year 10 parents also participate in the discussion and preparation of a Senior Education and Training Plan (SET Plan) for their child in collaboration with a teacher (i.e. goal setting and career planning discussions). A school transition calendar has been created this year outlining key dates in the school year where engagement of parents and the school community (i.e. primary schools) is vital and the activities to be used to engage them (i.e. travelling roadshow visits to feeder primary schools, scholarships and meet and greet morning teas with primary school staff and science club). These activities are in place to better support transition from primary to high school and from high school to higher education and/or the workforce.
10
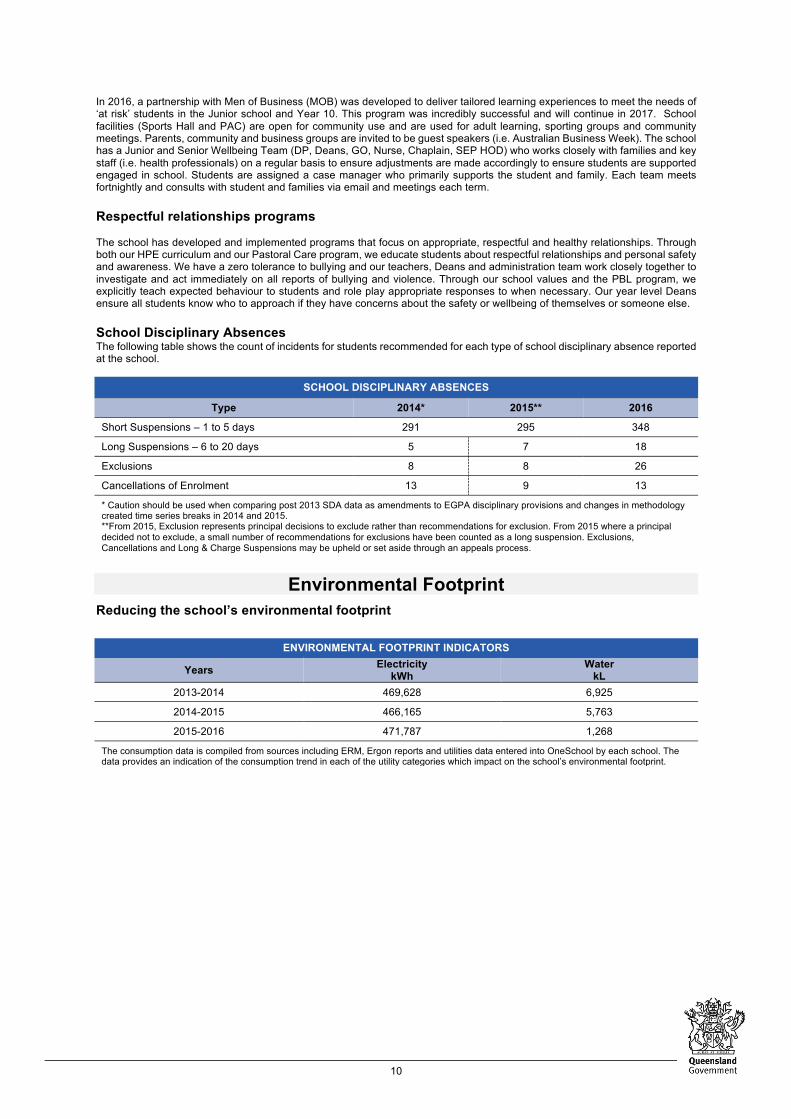
In 2016, a partnership with Men of Business (MOB) was developed to deliver tailored learning experiences to meet the needs of ‘at risk’ students in the Junior school and Year 10. This program was incredibly successful and will continue in 2017. School facilities (Sports Hall and PAC) are open for community use and are used for adult learning, sporting groups and community meetings. Parents, community and business groups are invited to be guest speakers (i.e. Australian Business Week). The school has a Junior and Senior Wellbeing Team (DP, Deans, GO, Nurse, Chaplain, SEP HOD) who works closely with families and key staff (i.e. health professionals) on a regular basis to ensure adjustments are made accordingly to ensure students are supported engaged in school. Students are assigned a case manager who primarily supports the student and family. Each team meets fortnightly and consults with student and families via email and meetings each term. Respectful relationships programs The school has developed and implemented programs that focus on appropriate, respectful and healthy relationships. Through both our HPE curriculum and our Pastoral Care program, we educate students about respectful relationships and personal safety and awareness. We have a zero tolerance to bullying and our teachers, Deans and administration team work closely together to investigate and act immediately on all reports of bullying and violence. Through our school values and the PBL program, we explicitly teach expected behaviour to students and role play appropriate responses to when necessary. Our year level Deans ensure all students know who to approach if they have concerns about the safety or wellbeing of themselves or someone else. School Disciplinary Absences The following table shows the count of incidents for students recommended for each type of school disciplinary absence reported at the school.
SCHOOL DISCIPLINARY ABSENCES
Type 2014* 2015** 2016
Short Suspensions – 1 to 5 days 291 295 348
Long Suspensions – 6 to 20 days 5 7 18
Exclusions 8 8 26
Cancellations of Enrolment 13 9 13
* Caution should be used when comparing post 2013 SDA data as amendments to EGPA disciplinary provisions and changes in methodology created time series breaks in 2014 and 2015. **From 2015, Exclusion represents principal decisions to exclude rather than recommendations for exclusion. From 2015 where a principal decided not to exclude, a small number of recommendations for exclusions have been counted as a long suspension. Exclusions, Cancellations and Long & Charge Suspensions may be upheld or set aside through an appeals process.
Environmental Footprint Reducing the school’s environmental footprint
ENVIRONMENTAL FOOTPRINT INDICATORS
Years Electricity kWh
Water kL
2013-2014 469,628 6,925
2014-2015 466,165 5,763
2015-2016 471,787 1,268
The consumption data is compiled from sources including ERM, Ergon reports and utilities data entered into OneSchool by each school. The data provides an indication of the consumption trend in each of the utility categories which impact on the school’s environmental footprint.
11
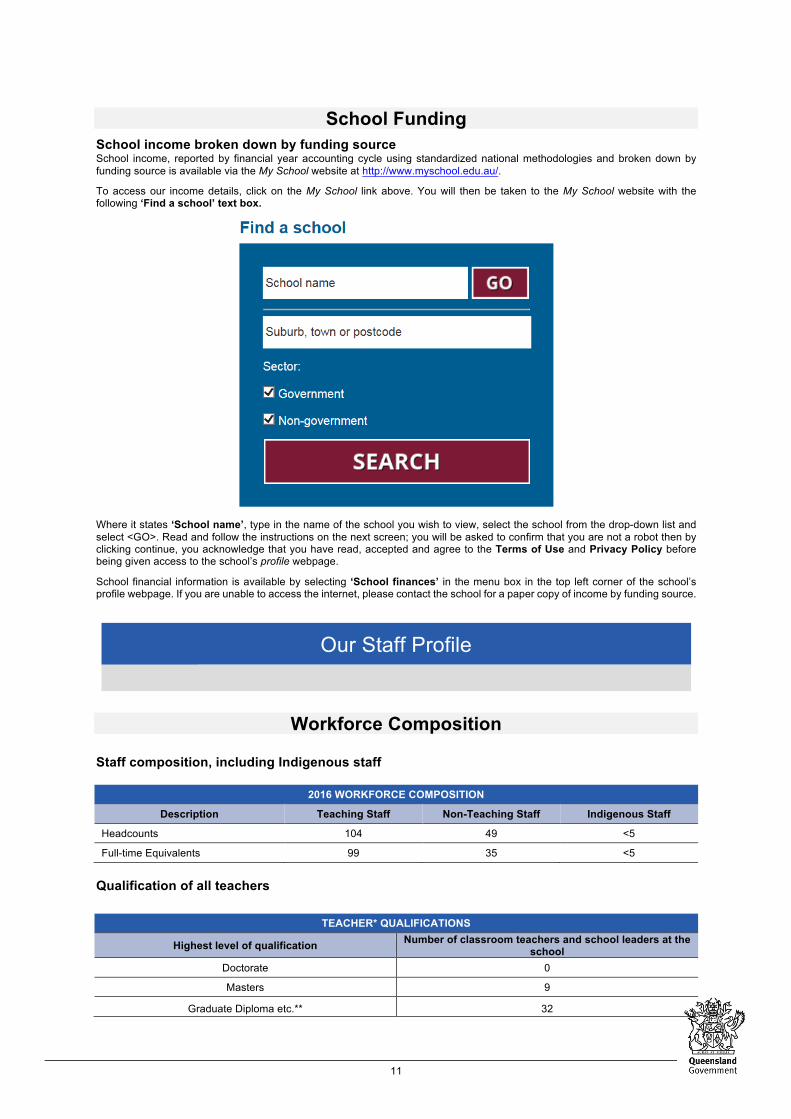
School Funding School income broken down by funding source School income, reported by financial year accounting cycle using standardized national methodologies and broken down by funding source is available via the My School website at http://www.myschool.edu.au/.
To access our income details, click on the My School link above. You will then be taken to the My School website with the following ‘Find a school’ text box.
Where it states ‘School name’, type in the name of the school you wish to view, select the school from the drop-down list and select <GO>. Read and follow the instructions on the next screen; you will be asked to confirm that you are not a robot then by clicking continue, you acknowledge that you have read, accepted and agree to the Terms of Use and Privacy Policy before being given access to the school’s profile webpage.
School financial information is available by selecting ‘School finances’ in the menu box in the top left corner of the school’s profile webpage. If you are unable to access the internet, please contact the school for a paper copy of income by funding source.
Our Staff Profile
Workforce Composition
Staff composition, including Indigenous staff
2016 WORKFORCE COMPOSITION
Description Teaching Staff Non-Teaching Staff Indigenous Staff
Headcounts 104 49 <5
Full-time Equivalents 99 35 <5
Qualification of all teachers
TEACHER* QUALIFICATIONS
Highest level of qualification Number of classroom teachers and school leaders at the school
Doctorate 0
Masters 9
Graduate Diploma etc.** 32
12
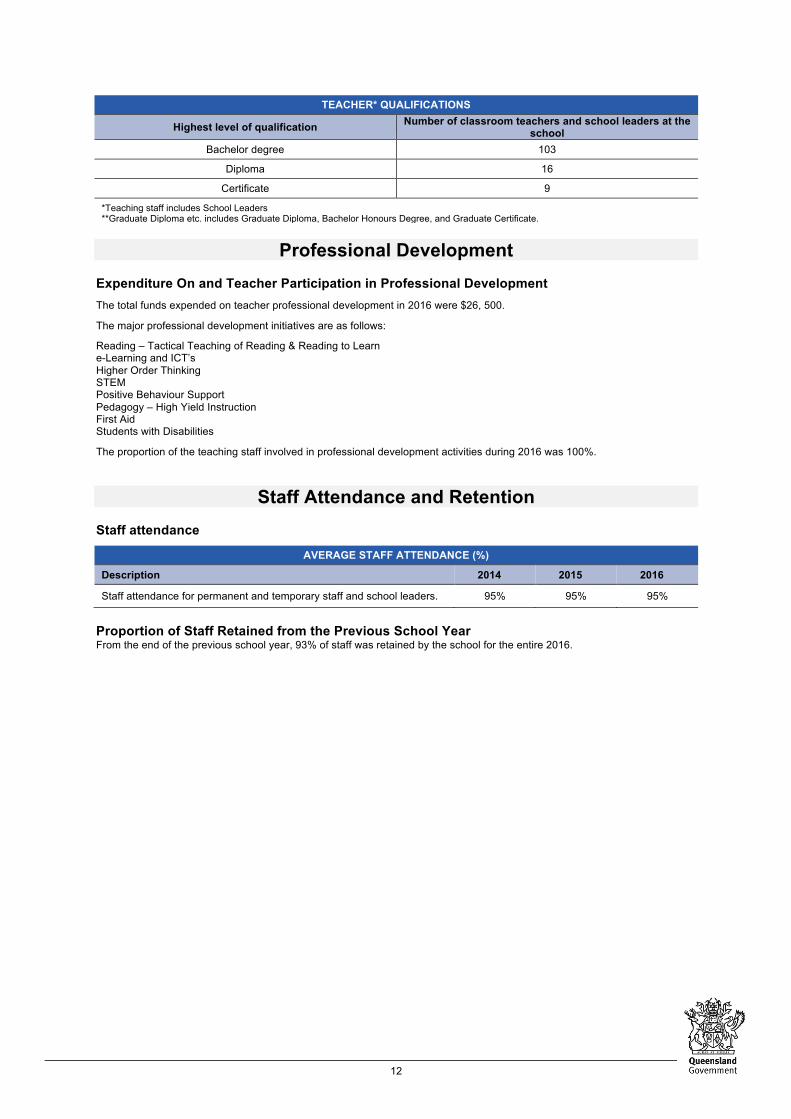
TEACHER* QUALIFICATIONS
Highest level of qualification Number of classroom teachers and school leaders at the school
Bachelor degree 103
Diploma 16
Certificate 9
*Teaching staff includes School Leaders **Graduate Diploma etc. includes Graduate Diploma, Bachelor Honours Degree, and Graduate Certificate.
Professional Development
Expenditure On and Teacher Participation in Professional Development The total funds expended on teacher professional development in 2016 were $26, 500.
The major professional development initiatives are as follows:
Reading – Tactical Teaching of Reading & Reading to Learn e-Learning and ICT’s Higher Order Thinking STEM Positive Behaviour Support Pedagogy – High Yield Instruction First Aid Students with Disabilities
The proportion of the teaching staff involved in professional development activities during 2016 was 100%.
Staff Attendance and Retention Staff attendance
AVERAGE STAFF ATTENDANCE (%)
Description 2014 2015 2016
Staff attendance for permanent and temporary staff and school leaders. 95% 95% 95%
Proportion of Staff Retained from the Previous School Year From the end of the previous school year, 93% of staff was retained by the school for the entire 2016.
13
Performance of Our Students
Key Student Outcomes
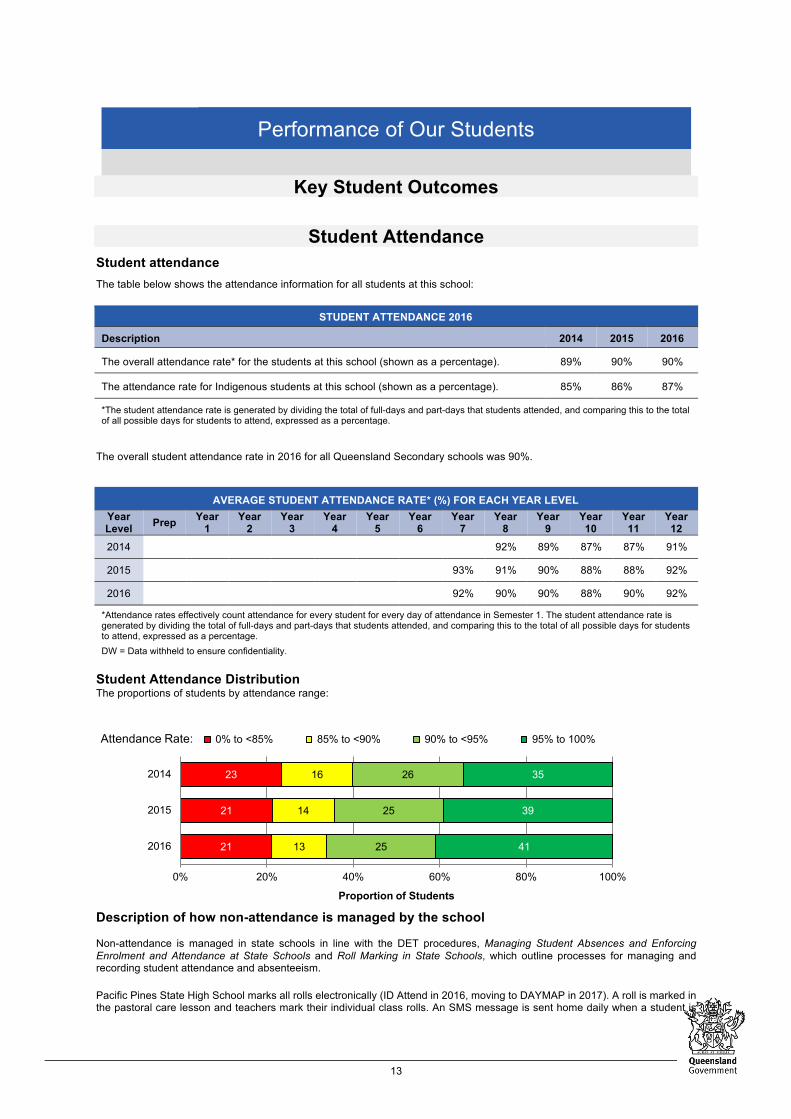
Student Attendance Student attendance The table below shows the attendance information for all students at this school:
STUDENT ATTENDANCE 2016
Description 2014 2015 2016
The overall attendance rate* for the students at this school (shown as a percentage). 89% 90% 90%
The attendance rate for Indigenous students at this school (shown as a percentage). 85% 86% 87%
*The student attendance rate is generated by dividing the total of full-days and part-days that students attended, and comparing this to the total of all possible days for students to attend, expressed as a percentage.
The overall student attendance rate in 2016 for all Queensland Secondary schools was 90%.
AVERAGE STUDENT ATTENDANCE RATE* (%) FOR EACH YEAR LEVEL Year Level Prep Year
1 Year
2 Year
3 Year
4 Year
5 Year
6 Year
7 Year
8 Year
9 Year 10
Year 11
Year 12
2014 92% 89% 87% 87% 91%
2015 93% 91% 90% 88% 88% 92%
2016 92% 90% 90% 88% 90% 92%
*Attendance rates effectively count attendance for every student for every day of attendance in Semester 1. The student attendance rate is generated by dividing the total of full-days and part-days that students attended, and comparing this to the total of all possible days for students to attend, expressed as a percentage. DW = Data withheld to ensure confidentiality.
Student Attendance Distribution The proportions of students by attendance range:
Description of how non-attendance is managed by the school Non-attendance is managed in state schools in line with the DET procedures, Managing Student Absences and Enforcing Enrolment and Attendance at State Schools and Roll Marking in State Schools, which outline processes for managing and recording student attendance and absenteeism. Pacific Pines State High School marks all rolls electronically (ID Attend in 2016, moving to DAYMAP in 2017). A roll is marked in the pastoral care lesson and teachers mark their individual class rolls. An SMS message is sent home daily when a student is
21
21
23
13
14
16
25
25
26
41
39
35
0% 20% 40% 60% 80% 100%
2016
2015
2014
Proportion of Students
Attendance Rate: 0% to <85% 85% to <90% 90% to <95% 95% to 100%
14
marked absent from pastoral care. The SMS message allows parents to respond by SMS with the reason for the absence. The attendance officer checks unexplained class absences and reports to the relevant year Dean of Students. Pastoral Care (PC) Teachers follow up absences through communication with parents (i.e. note in diary, email or phone call home). All contacts are record on ‘Contacts’ in One School. Roll class co-ordinators are assigned to PC classes to assist teachers when absences are unexplained for more than 3 days. If unexplained absence is continued, roll co-ordinator completes referral to Deputy Principal. Deputy Principals conduct attendance meetings with parent and student when student reaches attendance rate of <85% (present and approved) to support student and family and assist in re-engaging student to improve attendance. Student is referred to key staff from the Wellbeing Team as and when required to support student in improving their attendance and re-engage them in learning. Enforcement of attendance process is actioned if attendance continues to decline despite ongoing support and intervention by Wellbeing Team. Exemption forms are completed and approved by the principal for off campus studies (i.e. TAFE) and medical reasons (supported by medical documents). Deputy Principal and Dean of Students complete attendance tracker (spreadsheet) each week to monitor attendance. This process will be automatically done by DAYMAP. Top 20 students in each year level are identified and monitored weekly via attendance spreadsheet tracker. Expectations regarding attendance and every day counts is communicated and reinforced on a regular basis to students and families (i.e. weekly assemblies, email).
NAPLAN Our reading, writing, spelling, grammar and punctuation, and numeracy results for the Years 3, 5, 7 and 9 are available via the My School website at http://www.myschool.edu.au/.
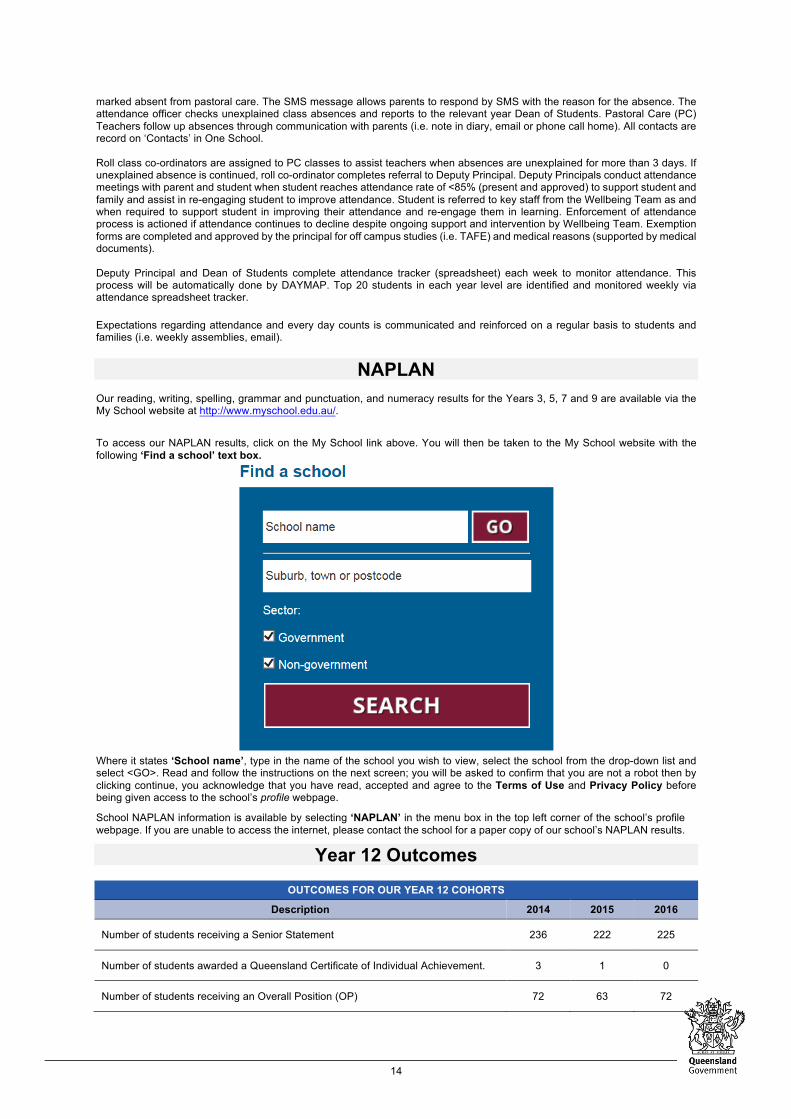
To access our NAPLAN results, click on the My School link above. You will then be taken to the My School website with the following ‘Find a school’ text box.
Where it states ‘School name’, type in the name of the school you wish to view, select the school from the drop-down list and select <GO>. Read and follow the instructions on the next screen; you will be asked to confirm that you are not a robot then by clicking continue, you acknowledge that you have read, accepted and agree to the Terms of Use and Privacy Policy before being given access to the school’s profile webpage.
School NAPLAN information is available by selecting ‘NAPLAN’ in the menu box in the top left corner of the school’s profile webpage. If you are unable to access the internet, please contact the school for a paper copy of our school’s NAPLAN results.
Year 12 Outcomes
OUTCOMES FOR OUR YEAR 12 COHORTS
Description 2014 2015 2016
Number of students receiving a Senior Statement 236 222 225
Number of students awarded a Queensland Certificate of Individual Achievement. 3 1 0
Number of students receiving an Overall Position (OP) 72 63 72
15
OUTCOMES FOR OUR YEAR 12 COHORTS
Description 2014 2015 2016
Percentage of Indigenous students receiving an Overall Position (OP) 0% 29% 14%
Number of students who are completing/continuing a School-based Apprenticeship or Traineeship (SAT). 61 48 50
Number of students awarded one or more Vocational Educational Training (VET) qualifications (incl. SAT).
162 181 205
Number of students awarded an Australian Qualification Framework Certificate II or above.
133 136 148
Number of students awarded a Queensland Certificate of Education (QCE) at the end of Year 12.
232 221 225
Percentage of Indigenous students awarded a Queensland Certificate of Education (QCE) at the end of Year 12.
100% 100% 100%
Number of students awarded an International Baccalaureate Diploma (IBD). 0 0 0
Percentage of OP/IBD eligible students with OP 1-15 or an IBD. 79% 87% 75%
Percentage of Year 12 students who are completing or completed a SAT or were awarded one or more of the following: QCE, IBD, VET qualification. 99% 100% 100%
Percentage of Queensland Tertiary Admissions Centre (QTAC) applicants receiving an offer. 97% 96% 99%
As at 3rd February 2017. The above values exclude VISA students.
OVERALL POSITION BANDS (OP) Number of students in each band for OP 1 - 25
Years OP 1-5 OP 6-10 OP 11-15 OP 16-20 OP 21-25 2014 13 18 26 15 0
2015 8 22 25 8 0
2016 9 16 29 17 1 As at 3rd February 2017. The above values exclude VISA students.
VOCATIONAL EDUCATIONAL TRAINING QUALIFICATION (VET)
Number of students awarded certificates under the Australian Qualification Framework (AQF)
Years Certificate I Certificate II Certificate III or above
2014 65 92 74
2015 115 95 71
2016 155 108 71 As at 3rd February 2017. The above values exclude VISA students.
Vocational Courses Offered to students in 2016 BSB10115 Certificate I in Business BSB20115 Certificate II in Business ICT20115 Certificate II in Information, digital media and technology ICT10115 Certificate I in Information, digital media and technology FSK10113 Certificate I in Access to Vocational Pathways FSK20113 Certificate II in Skills for Work and Vocational Pathways 10283NAT Certificate IV in Crime and Justice (through Unity College) BSB50215 Diploma of Business (through Barrintons College) CPC10111 Certificate I in Construction (Through Train Assess Australia) MSF10113 Certificate I in Furnishings (Through Train Assess Australia) SIT20316 Certificate II in Hospitality (Through Aurora Training Institute) Apparent Retention Rate – Year 10 to Year 12
16
APPARENT RETENTION RATES* YEAR 10 TO YEAR 12
Description 2014 2015 2016
Year 12 student enrolment as a percentage of the Year 10 student cohort. 82% 81% 81%
Year 12 Indigenous student enrolment as a percentage of the Year 10 Indigenous student cohort.
100% 82% 89%
* The Years 10 to 12 Apparent Retention Rate is defined as the number of full-time students in Year 12 in any given year expressed as the percentage of those students who were in Year 10 two years previously (this may be greater than 100%).
Student Destinations
Post-school destination information The results of the 2016 post-school destinations survey, Next Step – Student Destination Report (2016 Year 12 cohort), will be uploaded to the school’s website in September. The report will be available at: http://www.pacificpinesshs.eq.edu.au/Supportandresources/Formsanddocuments/Pages/Documents.aspx Early leavers information The destinations of young people who left the school in Years 10, 11 and prior to completing Year 12 are described below. A small number of students leave school by choice before the age of 17. These students traditionally enter the workforce or attend TAFE. There are also a small number of students not suited to traditional schooling who enter alternative education programs.
Conclusion
Our aim at Pacific Pines State High School is to position ourselves as one of the lead school in the Northern Gold Coast area. Our increasing enrolment trends reflect the increased confidence from our local community and we anticipate our enrolments and student numbers will continue to grow over the next five years. Our strategic direction aligns with our tight and narrow focus on Learning, for both our staff and students, with Positive Behaviour for Learning and Visible Learning forefront in our improvement agenda. The alignment of our school values, expectations and programs is creating a positive environment where students and staff feel safe, valued and able to strive to achieve to their full potential.