Embed Size (px)
Citation preview
amadeus.com
2016 Management Review
February 24, 2017
Page 2 of 54 amadeus.com
© 2
01
7 A
mad
eus
IT G
rou
p a
nd
its
affi
liate
s an
d s
ub
sid
iari
es
Index 1 Summary ........................................................................................................... 4
1.1 Introduction ................................................................................................... 5
1.2 Summary of operating and financial information ....................................... 7
2 Operating Review ............................................................................................. 8
2.1 Key recent business highlights ..................................................................... 9
2.2 Key ongoing R&D projects .......................................................................... 11
3 Presentation of financial information ........................................................... 13
3.1 Acquisitions completed in 2015 ................................................................. 15
3.2 Acquisitions completed in 2016 ................................................................. 16
3.3 Divestments completed in 2016 ................................................................ 16
3.4 Subsequent events ...................................................................................... 16
4 Main financial risks and hedging policy ........................................................ 17
4.1 Foreign exchange rate risk ......................................................................... 18
4.2 Interest rate risk .......................................................................................... 19
4.3 Own shares price evolution risk ................................................................. 19
5 Operating and financial performance by segment ...................................... 20
5.1 Distribution .................................................................................................. 22
5.2 IT Solutions .................................................................................................. 26
5.3 EBITDA ......................................................................................................... 30
6 Consolidated financial statements ................................................................ 31
6.1 Group income statement ........................................................................... 32
6.2 Statement of financial position (condensed) ............................................ 38
6.3 Group Cash Flow ......................................................................................... 42
7 Investor information ...................................................................................... 46
7.1 Capital stock. Share ownership structure .................................................. 47

Page 3 of 54 amadeus.com
© 2
01
7 A
mad
eus
IT G
rou
p a
nd
its
affi
liate
s an
d s
ub
sid
iari
es
7.2 Share price performance in 2016............................................................... 47
7.3 Dividend payments ..................................................................................... 48
8 Key terms ........................................................................................................ 49
9 Annexe. Amadeus social and environmental initiatives .............................. 51
Page 4 of 54 amadeus.com
© 2
01
7 A
mad
eus
IT G
rou
p a
nd
its
affi
liate
s an
d s
ub
sid
iari
es
1 Summary

Page 5 of 54 amadeus.com
© 2
01
7 A
mad
eus
IT G
rou
p a
nd
its
affi
liate
s an
d s
ub
sid
iari
es
1.1 Introduction Full year 2016 highlights (year ended December 31, 2016)
_ In Distribution, our travel agency air bookings increased by 5.9%, to 534.9 million
_ In IT Solutions, our total Passengers Boarded were 85.0% higher, reaching 1,382.5 million
_ Revenue expanded by 14.3%, to €4,472.9 million
_ EBITDA increased by 16.0%, to €1,700.1 million
_ Adjusted profit1 grew by 21.2%, to €911.0 million
_ Free Cash Flow amounted to €811.4 million, representing growth of 23.1%
_ Covenant net financial debt was €1,957.5 million at December 31, 2016 (1.14 times last-twelve-month covenant EBITDA)
Amadeus continued to progress positively through the fourth quarter of 2016, delivering another successful year of double-digit growth. In 2016, Revenue grew by 14.3% and EBITDA increased 16.0%, supporting Adjusted Profit growth of 21.2%. These results were driven by the positive performances of our Distribution and IT Solutions segments, as well as by the contribution from our 2015 (Hotel SystemsPro, Itesso, AirIT) and 2016 (Navitaire) acquisitions.
In Distribution and during the quarter, we successfully renewed or signed content agreements with 8 carriers - 46 in total over 2016 - as we continue to secure and expand content for our subscribers. Our air volumes continued to grow at a strong pace, driven by a 0.6 p.p. improvement of our competitive position2 in the quarter (0.8 p.p. in the year), further increasing our relevance to travel providers. As in the past quarters, Asia Pacific continued to be our fastest-growing region, expanding at a double-digit rate. In 2016, our TA air bookings increased by 5.9% and Distribution Revenue grew 6.8%.
Merchandising solutions remain key for the airlines and at Amadeus we are committed to supporting our customers in realising their full revenue potential. At quarter-end, 66% of air bookings processed through Amadeus could carry an attached ancillary service and 120 airlines had contracted Amadeus Airline Ancillary Services for the indirect channel. Additionally, Amadeus Fare Families Solution had 52 contracted customers and more than 40 online travel agencies (including Fareportal and Ozon, in the fourth quarter), had integrated Amadeus merchandising solutions at year-end.
In 2016, IT Solutions revenue expanded by 31.7%. This expansion was driven by (i) underlying double-digit growth, plus (ii) the consolidation of Navitaire and the full-year impact of our 2015 acquisitions. Total Passengers Boarded increased by 85.0% due to the inclusion of Navitaire’s Passengers Boarded (since late January 2016). Altéa Passengers Boarded grew 12.2%, positively impacted by organic growth and the migrations we have undertaken in the
1 Excluding after-tax impact of the following items: (i) accounting effects derived from PPA exercises and impairment losses, (ii) non-
operating exchange gains (losses) and (iii) other non-recurring items.
2 Competitive position as defined in section 3.
Page 6 of 54 amadeus.com
© 2
01
7 A
mad
eus
IT G
rou
p a
nd
its
affi
liate
s an
d s
ub
sid
iari
es
last twelve months: most importantly China Airlines, Swiss International Air Lines and Brussels Airlines (both part of the Lufthansa Group). All our Airline IT activities continued to grow well, supported by successful upselling activity with new contracts and implementations of DCS, e-commerce and standalone solutions in the areas of revenue optimisation and merchandising as well as by underlying organic growth.
In October, Ukraine International Airlines, the largest airline in Ukraine, implemented Altéa (Reservation and Inventory). In November, we announced Kuwait Airways had contracted a complete suite of Altéa solutions, including Revenue Management, e-Commerce, Loyalty Programmes, Inventory, Reservation, Departure Control, Payments, as well as Mobile and Travel Intelligence.
We were also pleased to announce at the beginning of 2017, that Ryanair had renewed its Passenger Service Systems agreement with Navitaire. Ryanair will continue using Navitaire´s advanced ancillary and reservations solution including merchandising, distribution, digital and departure control platforms until 2025, representing 25 years of collaboration between Ryanair and Navitaire.
We are making progress in our new businesses. We are advancing in the execution of our Hospitality IT strategy, by integrating Itesso and Hotel SystemsPro and by working with InterContinental Hotels Group (IHG) in the development of a new-generation Guest Reservation System for the hospitality industry. IHG and Amadeus plan to initiate a progressive roll-out in the fourth quarter of 2017 with the aim to complete the roll-out by the end of 2018. We are also progressing in the development of a next-generation Property Management System.
We continue to maintain a disciplined focus on technology. Our investment in R&D represented 15.8% of revenue in 2016. It was dedicated to support long-term growth through new customer implementations, product evolution, portfolio expansion, investment in new businesses and continued shift to open systems and cloud-based architecture, as well as system performance optimisation.
Our free cash flow grew 23.1% over 2016, to €811.4 million and our consolidated covenant net financial debt stood at €1,957.5 million at the end of the year, representing 1.14 times last-twelve-month covenant EBITDA.
In December 2016, the Board of Directors proposed a 50% pay-out target ratio for 2016. Accordingly, the Board of Directors will submit a final gross dividend of €0.94 per share from the 2016 reported profit to the General Shareholders Meeting for approval in June 2017, representing an increase of 21.3% vs. 2015. An interim gross dividend of €0.40 per share was paid on February 1, 2017. The complementary dividend of €0.54 per share will be paid after the General Shareholders Meeting approval.

Page 7 of 54 amadeus.com
© 2
01
7 A
mad
eus
IT G
rou
p a
nd
its
affi
liate
s an
d s
ub
sid
iari
es
1.2 Summary of operating and financial information Summary of KPI (figures in million euros)
Full year 2016 Full year 2015 % Change
Operating KPI TA air competitive position1 43.2% 42.5% 0.8 p.p. TA air bookings (m) 534.9 505.0 5.9% Non-air bookings (m) 60.4 61.2 (1.3%) Total bookings (m) 595.3 566.2 5.1% Passengers Boarded (m) 1,382.5 747.3 85.0% Financial results Distribution Revenue 2,925.0 2,737.8 6.8% IT Solutions Revenue 1,547.9 1,174.9 31.7% Revenue 4,472.9 3,912.7 14.3% Distribution Contribution 1,223.0 1,177.0 3.9% IT Solutions Contribution 1,040.7 760.8 36.8% Contribution 2,263.7 1,937.8 16.8% EBITDA 1,700.1 1,465.4 16.0% EBITDA margin (%) 38.0% 37.5% 0.6 p.p. Adjusted profit2 911.0 751.8 21.2% Adjusted EPS (euros)3 2.08 1.72 21.3% Cash flow Capital expenditure 595.1 550.1 8.2% Free cash-flow4 811.4 659.2 23.1% 31/12/2016 31/12/2015 % Change Indebtedness5 Covenant Net Financial Debt 1,957.5 1,611.6 21.5% Covenant Net Financial Debt / LTM Covenant EBITDA
1.14x 1.09x
1. Competitive position as defined in section 3. 2. Excluding after-tax impact of the following items: (i) accounting effects derived from PPA exercises and impairment losses, (ii) non-
operating exchange gains (losses) and (iii) other non-recurring items. 3. EPS corresponding to the Adjusted profit attributable to the parent company. Calculated based on weighted average outstanding
shares of the period. 4. Calculated as EBITDA minus capital expenditure plus changes in our operating working capital minus taxes paid minus interests and
financial fees paid. 5. Based on the definition included in the senior credit agreement covenants.
Page 8 of 54 amadeus.com
© 2
01
7 A
mad
eus
IT G
rou
p a
nd
its
affi
liate
s an
d s
ub
sid
iari
es
2 Operating Review

Page 9 of 54 amadeus.com
© 2
01
7 A
mad
eus
IT G
rou
p a
nd
its
affi
liate
s an
d s
ub
sid
iari
es
2.1 Key recent business highlights The following section includes selected recent business highlights.
Airline Distribution
_ 46 new contracts or renewals of content agreements were signed during 2016. In particular, in the last quarter of 2016, Amadeus signed new contracts or renewals of existing content agreements with 8 carriers, including Dana Airlines, Asian Wings Airways and Borajet, amongst others. In 2016, over 70% of airline bookings made through the Amadeus system worldwide were with airlines that had content agreements with Amadeus.
_ Kenya Airways renewed its full content agreement with Amadeus in January 2017. This new contract will ensure that travellers and travel agencies can easily access the full range of fares, availability and schedules accessible for Kenya Airways, whilst contributing to boost the airline’s business and leisure travel sales.
_ In January 2017, Amadeus and Thomas Cook Group announced the extension of their global distribution agreement until 2021. Thomas Cook will have access to Amadeus’ full range of content as well as book, manage, and fulfil traveller requests in the most complete and automated manner. Finally, the agreement will also allow Thomas Cook to use Amadeus Instant Search3, an innovative solution which delivers online search results in milliseconds with no compromise on accuracy.
_ Also, in February 2017, Amadeus and Fareportal announced a new distribution agreement whereby Amadeus, which has served as Fareportal’s global distribution provider in the US, Canada, Mexico, and the UK, will extend its services to empower Fareportal’s vision and plans for global expansion, providing it with access to over 40 countries across Europe, Asia-Pacific and Latin America. Amadeus provides a wide array of services to Fareportal from distribution of air, hotel and car content to merchandising solutions for selling ancillary services and fare families to leading search and shopping technology.
_ Subscribers to Amadeus’ inventory data can now access more than 90 low cost and hybrid carriers worldwide. Bookings of this segment grew 15% in 2016.
_ Our customers continued to contract our merchandising solutions. At the end of the year, 66% of the bookings made through the Amadeus system were eligible to carry a merchandising item, and more than 40 online travel agencies (including Fareportal and Ozon, in the fourth quarter), had integrated Amadeus merchandising solutions.
_ At year-end, 120 airlines had signed up for Amadeus Airline Ancillary Services to be able to offer ancillary services in the indirect channel and more than 90 had implemented the solution. At the end of the year, 165 airlines had contracted Amadeus Airline Ancillary Services to be able to offer ancillary services in either the indirect or direct channel (of which 125 had implemented the solution).
3 For more information on Amadeus Instant Search, please click here.
Page 10 of 54 amadeus.com
© 2
01
7 A
mad
eus
IT G
rou
p a
nd
its
affi
liate
s an
d s
ub
sid
iari
es
_ In turn, the Amadeus Fare Families solution, which allows airlines worldwide to distribute branded fares to travellers in the indirect channel, continued its expansion. At the end of the year, 52 airline customers had contracted the solution. Of these, 33 had implemented the solution.
Airline IT
_ At the end of 2016, more than 175 airlines had contracted one of the two Amadeus Passenger Service Systems (Altéa or Navitaire’s New Skies), and more than 165 had implemented them. Ukraine International Airlines, the largest airline in Ukraine, who is since October operating its reservation, inventory and ticketing processes through the Amadeus Altéa Suite, was among them.
_ Kuwait Airways unveiled in November its “Transformation Plan”, designed to reassert its pioneering legacy in the region’s aviation industry by 2021. To achieve this goal, Kuwait Airways has contracted for the complete suite of Altéa solutions, including Revenue Management, e-Commerce, Loyalty Programmes, Inventory, Reservation, Departure Control, Payments, as well as Mobile and Travel Intelligence. The Amadeus extensive portfolio will help the airline create more personalised travel experiences and adapt its offering to customer demand and preferences in real-time.
_ At the beginning of 2017, Ryanair renewed its Passenger Service Systems agreement with Navitaire. Ryanair will continue using the firm's advanced ancillary and reservations solution including merchandising, distribution, digital and departure control platforms until 2025, representing 25 years of collaboration between Ryanair and Navitaire.
_ Also, TAP Portugal implemented Amadeus Rich Merchandising4. This product adds a rich content layer to the airline’s merchandising strategy so that its customers and partners can see images of exactly what they are booking. It also allows TAP Portugal to launch highly targeted advertising campaigns for priority routes, down to specific points of sale.
_ In November, Amadeus announced a partnership with Optym, a unique software player in the airline network planning and scheduling space. Together, Amadeus and Optym will offer a complete suite of products5, known collectively as Amadeus SKY Suite by Optym, which will include SkyMAX (Schedule Optimizer) and SkySYM (Schedule Simulator), as well as SkyWORKS (Schedule Editor), SkyPLAN (Market Frequency Optimizer) and SKYCAST (Revenue Forecaster).
4 For more information on Amadeus Rich Merchandising, please click here.
5 Amadeus SkyMAX by Optym: Changes the schedule so as to achieve a particular goal (example of fleet assignment – identifies fleet type “i’’
on flight ‘’j’’ that maximizes total network profitability and is operationally feasible).
Amadeus SkySYM by Optym: Operates the schedule reliability simulation.
Amadeus SkyWORKS by Optym: Schedule editor, allows for manual manipulation of the schedule, shows multiple views – station, aircraft,
etc. and has a publish function to distribute schedules to internal and external entities.
Amadeus SkyPLAN by Optym: Module for route frequency optimization.
Amadeus SkyCAST by Optym: Produces profit forecasts for a given schedule, a “financial snapshot of the schedule”. Comparison of the
forecasts of two or more schedules, identifying profitable schedule changes.

Page 11 of 54 amadeus.com
© 2
01
7 A
mad
eus
IT G
rou
p a
nd
its
affi
liate
s an
d s
ub
sid
iari
es
Additional news
_ In November 2016, Laurens Leurink was appointed Senior Vice President, Distribution, Amadeus, taking over from his predecessor Holger Taubmann. Laurens brings financial, commercial and strategic acumen as well as deep travel industry knowledge to Amadeus. Laurens became a member of the Executive Committee of Amadeus in January 2017.
_ Also, Christophe Bousquet, Vice President, Airlines R&D and Denis Lacroix, Vice President, Core Shared Services R&D, were appointed members of the Executive Committee of Amadeus in January 2017.
_ In January 2017, Amadeus was included in the prestigious 'Global 100 Most Sustainable Corporations in the World' ranking from SCR magazine Corporate Knights. This ranking is based on an analysis of 14 quantitative indicators for more than 5,000 companies worldwide, with a focus on management of natural resources, financial performance and management of human resources.
2.2 Key ongoing R&D projects As a leading and differentiated technology provider for the travel industry, Amadeus undertakes significant R&D activities. In 2016, R&D investment related primarily to:
_ Ongoing efforts linked to our Distribution and Airline IT businesses:
Customer implementations and services:
Altéa implementation efforts related to carriers migrated in 2016 and future implementations (mainly Swiss International Air Lines, Brussels Airlines, China Airlines, Southwest Airlines –the domestic passengers business-, and Japan Airlines), as well as resources for Navitaire New Skies migrations (including Viva Group, recently implemented).
Implementation costs linked to our upselling activity (such as Revenue Management, e-commerce or standalone solutions).
Implementation of Distribution solutions for airlines, travel agencies, and corporations, including the implementation of new solutions such as Instant Search, the migration of low cost carriers to ticketless access, the expansion of our customer base in merchandising solutions and the migration of corporations to our self-booking tool.
Additionally, resources allocated to client specific bespoke developments or e-commerce services.
Product evolution and portfolio expansion:
For airlines: mostly solutions related to cloud availability, NDC compliant XML connectivity, and our revenue optimisation and financial suites.
For travel agencies, meta-search engines, travel management companies and corporations: efforts linked to our cloud-based new generation selling platform, search engines, front-office customisation and conversion tools.
Page 12 of 54 amadeus.com
© 2
01
7 A
mad
eus
IT G
rou
p a
nd
its
affi
liate
s an
d s
ub
sid
iari
es
Investment focused on merchandising solutions (including Amadeus Anytime Merchandising and Customer Experience Management), Amadeus Ancillary Services and Amadeus Fare Families, as well as enhanced shopping and booking solutions.
_ Efforts related to our new businesses (Hospitality, Rail, Airport IT, Payments and Travel Intelligence):
Development costs to build and implement the next-generation Guest Reservation System for the hospitality industry under our partnership with InterContinental Hotels Group and developments related to our Property Management System.
Continued development and evolution of our Airport IT, Payments and Travel Intelligence portfolios, as well as enhanced distribution capabilities for Hospitality and Rail.
Implementation efforts in the Airport IT space (in relation to our ground-handling, passenger processing and airport operations solutions), as well as related to Payments solutions.
Efforts dedicated to our partnership with Bene Rail to create a new rail community IT platform.
_ Cross-area technology investment:
Ongoing shift of the company’s platform to open systems, next-generation technologies and cloud-based architecture, which provides a flexible and powerful framework for massive deployment and distributed operations of very large transactional and data traffic.
System performance projects to deliver the highest possible reliability, availability, as well as service and security levels to our client base.
Projects related to our overall infrastructure and processes to improve efficiency and flexibility.

Page 13 of 54 amadeus.com
© 2
01
7 A
mad
eus
IT G
rou
p a
nd
its
affi
liate
s an
d s
ub
sid
iari
es
3 Presentation of financial information
Page 14 of 54 amadeus.com
© 2
01
7 A
mad
eus
IT G
rou
p a
nd
its
affi
liate
s an
d s
ub
sid
iari
es
The audited consolidated financial statements of Amadeus IT Group, S.A. and subsidiaries are the source to the financial information included in this document and have been prepared in accordance with International Financial Reporting Standards (IFRS) as adopted by the European Union.
Certain amounts and figures included in this report have been subject to rounding adjustments. Any discrepancies in any tables between the totals and the sums of the amounts listed are due to rounding.
This document includes unaudited Alternative Performance Measures such as EBITDA, covenant net financial debt and Adjusted profit, and its corresponding ratios. These Alternative Performance Measures have been prepared in accordance with the Guidelines issued by the European Securities and Markets Authority for regulated information published on or after July 3, 2016.
_ EBITDA corresponds to the segment contributions less net indirect costs as defined in note 6 ‘Segment Reporting’ of the Consolidated annual financial statements for the year ended December 31, 2016.
_ Covenant net financial debt is defined as current and non-current debt, less cash and cash equivalents, adjusted for non-debt items (such as deferred financing fees, accrued interest and fair value adjustments to an EIB loan). A reconciliation to the financial statements is included in section 6.2.5.
_ Adjusted profit corresponds to the reported Profit for the period, after adjusting for: (i) accounting effects derived from PPA exercises and impairment losses, (ii) non-operating exchange gains (losses), and (iii) other non-recurring items, as detailed in section 6.1.8.
We believe that these measures provide useful and relevant information to facilitate a better understanding of the performance of Amadeus and its economic position. These measures are not standard and therefore may not be comparable to those presented by other companies.
When we refer to our competitive position, we consider our TA air bookings in relation to the TA air booking industry, defined as the total volume of travel agency air bookings processed by the global CRS. It excludes air bookings made directly through in-house airline systems or single country operators, the latter primarily in China, Japan and Russia, which together combined represent an important part of the industry.

Page 15 of 54 amadeus.com
© 2
01
7 A
mad
eus
IT G
rou
p a
nd
its
affi
liate
s an
d s
ub
sid
iari
es
3.1 Acquisitions completed in 2015 AirIT On April 21, 2015, Amadeus acquired 100% of the voting rights of Air-Transport IT Services, Inc (“AirIT”), a US-based provider of airport technology solutions. The purchase consideration paid in cash was €13.0 million. The AirIT results were consolidated into Amadeus’ books from May 1, 2015.
A purchase price allocation exercise in relation to the consolidation of AirIT into Amadeus’ books was carried out in the fourth quarter of 2015.
Itesso On July 21, 2015, Amadeus acquired 100% of the voting rights of Itesso B.V. and subsidiaries, a provider of cloud-based property management systems, to expand its technology offering in the hospitality industry. The purchase consideration paid in cash was €32.7 million. The Itesso results were consolidated into Amadeus’ books from August 1, 2015.
A purchase price allocation exercise in relation to the consolidation of Itesso into Amadeus’ books was carried out in the second quarter of 2016.
Hotel SystemsPro On July 31, 2015, Amadeus acquired, through Newmarket, the business (assets acquired and liabilities assumed) of Hotel SystemsPro LLC, a leading provider of sales, catering and maintenance software to the hospitality industry. The purchase consideration paid in cash was €63.3 million. The results of the business of Hotel SystemsPro were consolidated into Amadeus’ books from August 1, 2015.
A purchase price allocation exercise in relation to the consolidation of the business of Hotel SystemsPro into Amadeus’ books was carried out in the fourth quarter of 2015.
Pyton On August 21, 2015, Amadeus acquired 100% of the voting rights of Pyton Communication Services B.V. and subsidiaries, a Netherlands-based leisure travel technology specialist. The purchase consideration paid in cash was €8.4 million. The Pyton results were consolidated into Amadeus’ books in the fourth quarter of 2015, retroactively since the date of acquisition.
A purchase price allocation exercise in relation to the consolidation of Pyton into Amadeus’ books was carried out in the second quarter of 2016.
Page 16 of 54 amadeus.com
© 2
01
7 A
mad
eus
IT G
rou
p a
nd
its
affi
liate
s an
d s
ub
sid
iari
es
3.2 Acquisitions completed in 2016 Navitaire On July 1, 2015, Amadeus announced its agreement to acquire Navitaire, a U.S-based provider of technology and business solutions to the airline industry, from Accenture. Amadeus received all the necessary regulatory approvals and the closing took place on January 26, 2016. The cash consideration in relation to this acquisition amounted to €760.1 million. The acquisition was 100% debt-financed, partially through the drawing of the €500 million bank loan facility executed on July 3, 2015 (structured as a “club deal” financing entered into with twelve banks, with maturity dates in 2019 and 2020 though cancelled and replaced in October 2016 by a four-year bond), and partially through the €500 million debt securities issued under our Euro Medium Term Note Programme in November 2015 (with maturity in 2021). The results of Navitaire were consolidated into Amadeus’ books from January 26, 2016.
A purchase price allocation exercise in relation to the consolidation of Navitaire into Amadeus’ books was carried out in the fourth quarter of 2016. The extraordinary costs of €6.7 million associated with the acquisition, incurred in the second half of 2015, were reported as indirect costs as of year-end 2015.
3.3 Divestments completed in 2016 Meeting Intelligence business On July 21, 2016, Amadeus Hospitality US (formerly Newmarket International) divested its non-core Meeting Intelligence business, which provides meetings market intelligence for the hospitality industry. The total net consideration of the transaction was €11.3 million.
3.4 Subsequent events i:FAO On January 13, 2017, Amadeus announced the closing of the acceptance period for the tender offer it had launched on October 21, 2016 for outstanding i:FAO shares Amadeus did not already own (29.74%). i:FAO was acquired on June 23, 2014, indirectly through Amadeus Corporate Business AG and, as of December 31, 2015 the Group owned 70.26% of the shares of i:FAO. As a result of the tender offer, Amadeus has increased its shareholding in i:FAO to 88.725%. The total amount paid for the shares acquired through the tender offer was €28.6 million (€30.0 per share). i:FAO has now been delisted from the Frankfurt Stock Exchange.
Page 17 of 54 amadeus.com
© 2
01
7 A
mad
eus
IT G
rou
p a
nd
its
affi
liate
s an
d s
ub
sid
iari
es
4 Main financial risks and hedging policy

Page 18 of 54 amadeus.com
© 2
01
7 A
mad
eus
IT G
rou
p a
nd
its
affi
liate
s an
d s
ub
sid
iari
es
4.1 Foreign exchange rate risk Our reporting currency is the Euro. However, as a result of Amadeus’ global activity and presence, part of our results are generated in currencies different from the Euro and therefore are impacted by foreign exchange fluctuations. Similarly, part of our cash inflows and outflows are denominated in non-Euro currencies.
Our revenue is almost entirely generated either in Euro or in US Dollar (the latter representing 30%-35% of our total revenue). Revenue generated in currencies other than the Euro or US Dollar is negligible.
In turn, 40%-50% of our operating costs6 are denominated in many currencies different from the Euro, including the USD which represents 20%-30% of our operating costs. The rest of the foreign currency operating expenses are denominated in a variety of currencies, GBP, INR, AUD and SEK being the most significant. A number of these currencies may fluctuate vs. the Euro similarly to the US Dollar - Euro fluctuations, and the degree of this correlation may vary with time.
Amadeus’ target is to reduce the volatility generated by foreign exchange fluctuations on its non-Euro denominated net cash flows. Our hedging strategy is as follows:
_ To manage our exposure to the US Dollar, we have a natural hedge to our net operating cash flow generated in US Dollar through, among others, payments of USD-denominated debt (when applicable) and taxes paid in the US. We enter into derivative arrangements when this natural hedge is not sufficient to cover our outstanding exposure.
_ We also hedge a number of currencies, including the GBP, AUD and INR, for which we enter into foreign exchange derivatives with banks.
When the hedges in place qualify for hedge accounting under IFRS, profits and losses are recognised within the revenue caption (under the non booking revenue line of Distribution). Our hedging arrangements typically qualify for hedge accounting under IFRS.
In 2016, the impact from foreign exchange fluctuations on revenue was negligible. However, the appreciation of the euro vs. several currencies (GBP, ARS, INR and ZAR for example) had a positive impact on costs, EBITDA and EBITDA margin. Excluding foreign exchange impacts and Navitaire, EBITDA margin was broadly stable and underlying EBITDA growth was at a high single-digit rate.
6 Including Cost of revenue, Personnel expenses and Other operating expenses. Excludes Depreciation and amortisation.
Page 19 of 54 amadeus.com
© 2
01
7 A
mad
eus
IT G
rou
p a
nd
its
affi
liate
s an
d s
ub
sid
iari
es
4.2 Interest rate risk Our target is to reduce volatility in net interest flows. In order to achieve this objective, Amadeus may enter into interest rate hedging agreements (interest rate swaps, caps, collars) to cover the floating rate debt.
At December 31, 2016, 24.3% of our total covenant financial debt was subject to floating interest rates, indexed to the EURIBOR. As of this date no interest rate hedges were in place.
The increase in the percentage of total covenant financial debt subject to floating interest rates vs. prior year is mostly due to a higher use of the European Commercial Paper programme and revolving credit facilities, as described in section 6.2.5, which are subject to floating interest rates.
4.3 Own shares price evolution risk Amadeus has three different staff remuneration schemes which are settled with Amadeus’ shares.
According to the rules of these plans, when they mature, their beneficiaries will receive a number of Amadeus shares which for the outstanding plans will be (depending on the evolution of certain performance conditions) between a minimum of 267,000 shares and a maximum of 1,817,000 shares, approximately. It is Amadeus’ intention to make use of its treasury shares to settle these plans at their maturity.

Page 20 of 54 amadeus.com
© 2
01
7 A
mad
eus
IT G
rou
p a
nd
its
affi
liate
s an
d s
ub
sid
iari
es
5 Operating and financial performance by segment

Page 21 of 54 amadeus.com
© 2
01
7 A
mad
eus
IT G
rou
p a
nd
its
affi
liate
s an
d s
ub
sid
iari
es
Segment Reporting (figures in million euros) Full year 2016 Full year 2015 % Change
Distribution revenue 2,925.0 2,737.8 6.8% IT Solutions revenue 1,547.9 1,174.9 31.7% Group Revenue 4,472.9 3,912.7 14.3% Distribution contribution 1,223.0 1,177.0 3.9% IT Solutions contribution 1,040.7 760.8 36.8% Total Contribution 2,263.7 1,937.8 16.8% Net indirect costs (563.6) (472.4) 19.3% EBITDA 1,700.1 1,465.4 16.0% EBITDA Margin (%) 38.0% 37.5% 0.6 p.p. The solid growth we achieved earlier in the year continued in the last quarter of 2016. Revenue increased 14.6% in the fourth quarter, driving full year revenue to €4,472.9 million, 14.3% higher than in 2015. Revenue growth was driven by the positive evolution of our segments.
_ In Distribution, revenue increased 6.8% in the year, supported by booking growth and expansive average pricing.
_ IT Solutions delivered a 31.7% revenue increase in 2016, resulting from underlying double-digit growth, as well as from the consolidation of Navitaire and our 2015 acquisitions. (See sections 3.1 and 3.2 for more details on acquisitions).
EBITDA expanded 16.0% in the year, supported by growth in contributions of Distribution (3.9%) and IT Solutions (36.8%). This growth was partially offset by net indirect costs, which increased 19.3%, highly impacted by the consolidation of Navitaire’s central costs (excluding Navitaire’s costs, indirect costs grew at a mid-single digit rate). EBITDA margin expanded 0.6 p.p. in the year, representing 38.0% of revenue in 2016 and was broadly stable excluding foreign exchange impacts and Navitaire.

Page 22 of 54 amadeus.com
© 2
01
7 A
mad
eus
IT G
rou
p a
nd
its
affi
liate
s an
d s
ub
sid
iari
es
5.1 Distribution Distribution (figures in million euros) Full year 2016 Full year 2015 % Change Operating KPI TA air competitive position1 43.2% 42.5% 0.8 p.p. Total bookings (m) 595.3 566.2 5.1%
Financial results Revenue 2,925.0 2,737.8 6.8% Operating costs (1.769.0) (1,626.8) 8.7% Direct capitalisations 67.0 66.1 1.4% Net operating costs (1,702.0) (1,560.8) 9.0% Contribution 1,223.0 1,177.0 3.9% As % of Revenue 41.8% 43.0% (1.2 p.p.)
1. Competitive position as defined in section 3.
Distribution includes our Global Distribution System business (including not only airline content but also hospitality and rail content, amongst others). We also provide solutions and services related to the distribution of content through the GDS to travel providers (such as solutions for the display and management of merchandising content), to travel sellers (such as search solutions and integrated front-, mid- and back-office solutions) and to corporations (such as self-booking tools and travel and expense management solutions). In addition, Distribution includes our Travel Intelligence business and part of our Payments offering (the Payer Hub, through which we help travel agencies and corporations pay travel providers).
Distribution delivered 6.8% revenue growth in 2016, supported by higher volumes coupled with average pricing expansion. Amadeus’ volumes once again outperformed the travel agency air booking industry, fuelled by a notable improvement of 0.8 p.p. in our competitive position. In this context, however, the Distribution contribution grew at a slower pace (3.9% in the year). As a percentage of revenue, Distribution contribution, which was impacted by competitive pressure and a negative country mix, declined by 1.2 p.p., to 41.8%.
Page 23 of 54 amadeus.com
© 2
01
7 A
mad
eus
IT G
rou
p a
nd
its
affi
liate
s an
d s
ub
sid
iari
es
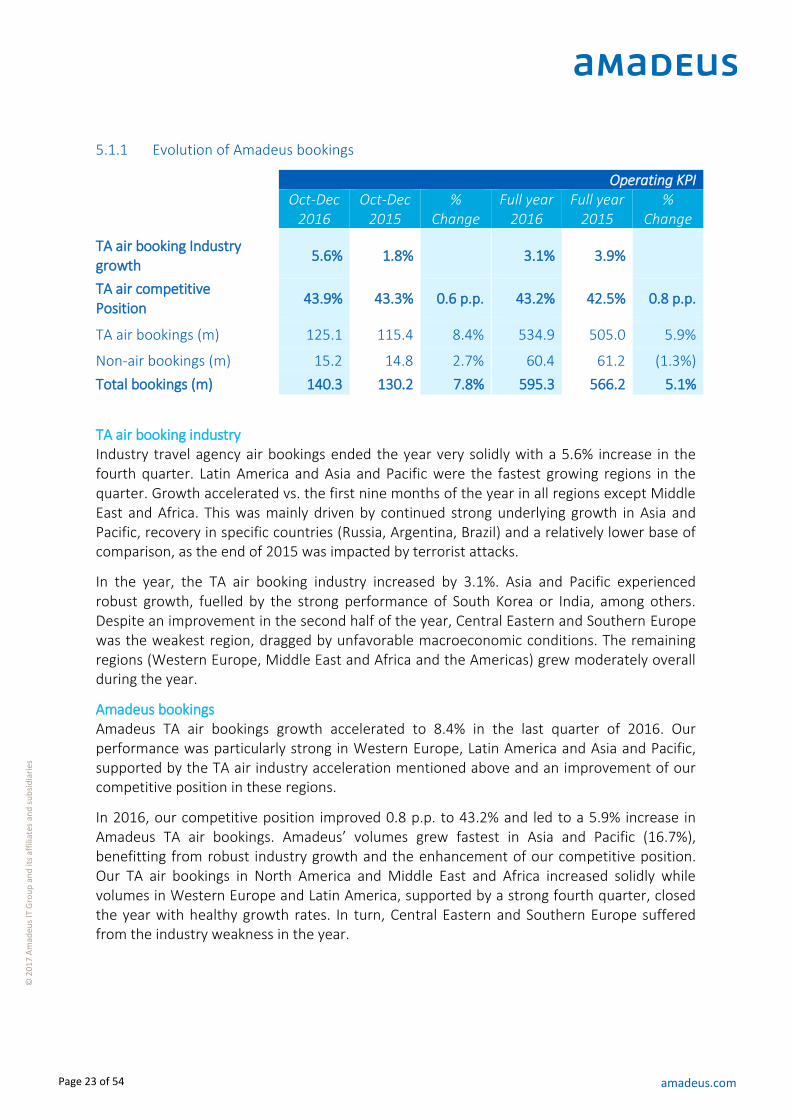
5.1.1 Evolution of Amadeus bookings
Operating KPI
Oct-Dec
2016 Oct-Dec
2015 %
Change Full year
2016 Full year
2015 %
Change TA air booking Industry growth
5.6% 1.8% 3.1% 3.9%
TA air competitive Position
43.9% 43.3% 0.6 p.p. 43.2% 42.5% 0.8 p.p.
TA air bookings (m) 125.1 115.4 8.4% 534.9 505.0 5.9%
Non-air bookings (m) 15.2 14.8 2.7% 60.4 61.2 (1.3%)
Total bookings (m) 140.3 130.2 7.8% 595.3 566.2 5.1%
TA air booking industry Industry travel agency air bookings ended the year very solidly with a 5.6% increase in the fourth quarter. Latin America and Asia and Pacific were the fastest growing regions in the quarter. Growth accelerated vs. the first nine months of the year in all regions except Middle East and Africa. This was mainly driven by continued strong underlying growth in Asia and Pacific, recovery in specific countries (Russia, Argentina, Brazil) and a relatively lower base of comparison, as the end of 2015 was impacted by terrorist attacks.
In the year, the TA air booking industry increased by 3.1%. Asia and Pacific experienced robust growth, fuelled by the strong performance of South Korea or India, among others. Despite an improvement in the second half of the year, Central Eastern and Southern Europe was the weakest region, dragged by unfavorable macroeconomic conditions. The remaining regions (Western Europe, Middle East and Africa and the Americas) grew moderately overall during the year.
Amadeus bookings Amadeus TA air bookings growth accelerated to 8.4% in the last quarter of 2016. Our performance was particularly strong in Western Europe, Latin America and Asia and Pacific, supported by the TA air industry acceleration mentioned above and an improvement of our competitive position in these regions.
In 2016, our competitive position improved 0.8 p.p. to 43.2% and led to a 5.9% increase in Amadeus TA air bookings. Amadeus’ volumes grew fastest in Asia and Pacific (16.7%), benefitting from robust industry growth and the enhancement of our competitive position. Our TA air bookings in North America and Middle East and Africa increased solidly while volumes in Western Europe and Latin America, supported by a strong fourth quarter, closed the year with healthy growth rates. In turn, Central Eastern and Southern Europe suffered from the industry weakness in the year.
Page 24 of 54 amadeus.com
© 2
01
7 A
mad
eus
IT G
rou
p a
nd
its
affi
liate
s an
d s
ub
sid
iari
es
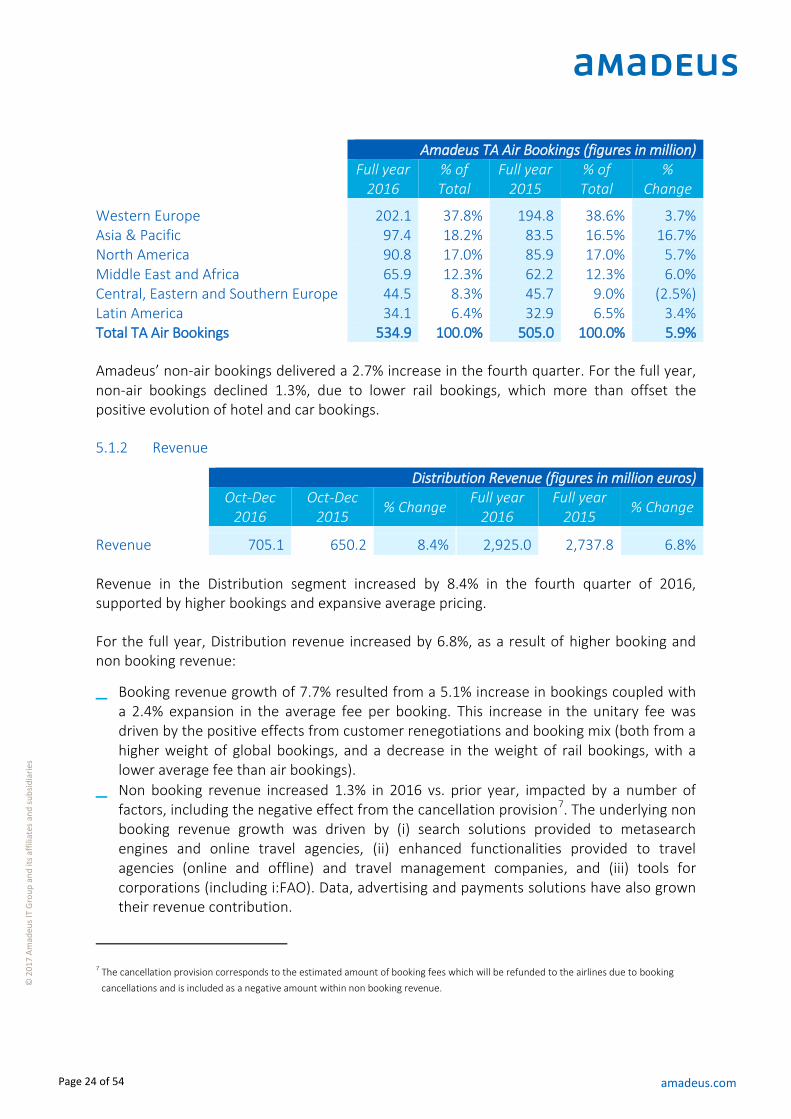
Amadeus TA Air Bookings (figures in million)
Full year
2016 % of Total
Full year 2015
% of Total
% Change
Western Europe 202.1 37.8% 194.8 38.6% 3.7% Asia & Pacific 97.4 18.2% 83.5 16.5% 16.7% North America 90.8 17.0% 85.9 17.0% 5.7% Middle East and Africa 65.9 12.3% 62.2 12.3% 6.0% Central, Eastern and Southern Europe 44.5 8.3% 45.7 9.0% (2.5%) Latin America 34.1 6.4% 32.9 6.5% 3.4% Total TA Air Bookings 534.9 100.0% 505.0 100.0% 5.9%
Amadeus’ non-air bookings delivered a 2.7% increase in the fourth quarter. For the full year, non-air bookings declined 1.3%, due to lower rail bookings, which more than offset the positive evolution of hotel and car bookings.
5.1.2 Revenue
Distribution Revenue (figures in million euros)
Oct-Dec
2016 Oct-Dec
2015 % Change
Full year 2016
Full year 2015
% Change
Revenue 705.1 650.2 8.4% 2,925.0 2,737.8 6.8%
Revenue in the Distribution segment increased by 8.4% in the fourth quarter of 2016, supported by higher bookings and expansive average pricing.
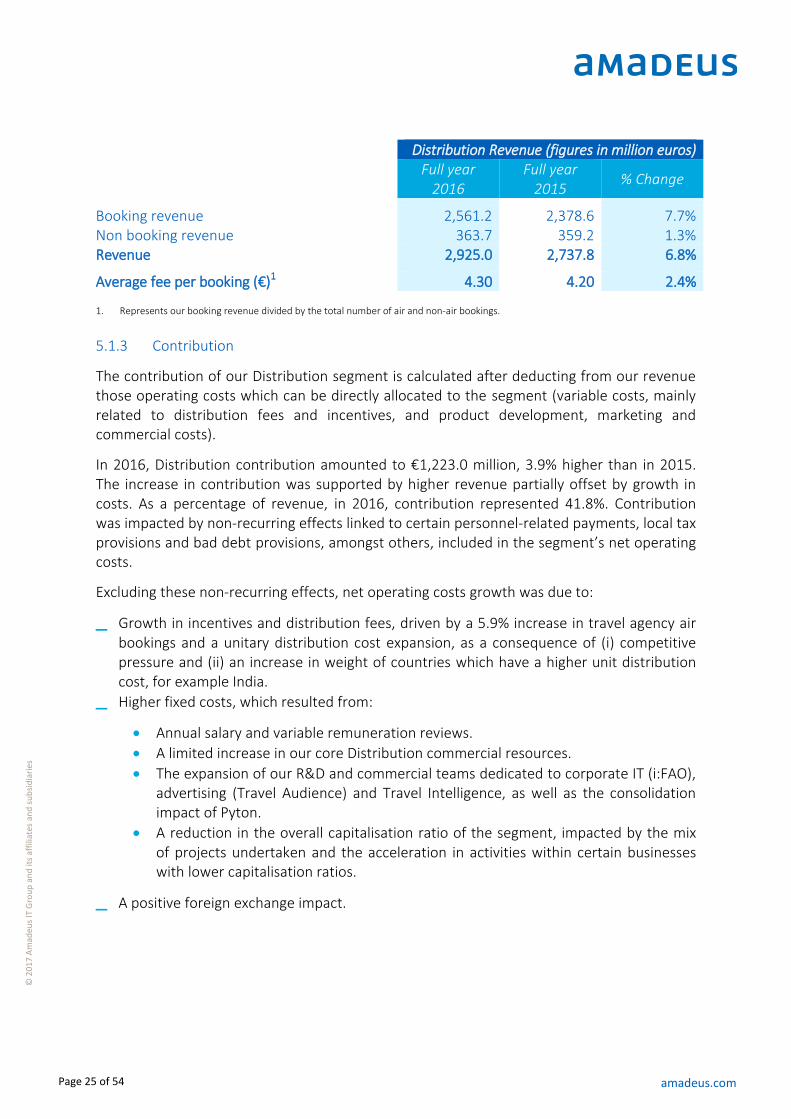
For the full year, Distribution revenue increased by 6.8%, as a result of higher booking and non booking revenue:
_ Booking revenue growth of 7.7% resulted from a 5.1% increase in bookings coupled with a 2.4% expansion in the average fee per booking. This increase in the unitary fee was driven by the positive effects from customer renegotiations and booking mix (both from a higher weight of global bookings, and a decrease in the weight of rail bookings, with a lower average fee than air bookings).
_ Non booking revenue increased 1.3% in 2016 vs. prior year, impacted by a number of factors, including the negative effect from the cancellation provision7. The underlying non booking revenue growth was driven by (i) search solutions provided to metasearch engines and online travel agencies, (ii) enhanced functionalities provided to travel agencies (online and offline) and travel management companies, and (iii) tools for corporations (including i:FAO). Data, advertising and payments solutions have also grown their revenue contribution.
7 The cancellation provision corresponds to the estimated amount of booking fees which will be refunded to the airlines due to booking
cancellations and is included as a negative amount within non booking revenue.
Page 25 of 54 amadeus.com
© 2
01
7 A
mad
eus
IT G
rou
p a
nd
its
affi
liate
s an
d s
ub
sid
iari
es
Distribution Revenue (figures in million euros)
Full year
2016 Full year
2015 % Change
Booking revenue 2,561.2 2,378.6 7.7% Non booking revenue 363.7 359.2 1.3% Revenue 2,925.0 2,737.8 6.8%
Average fee per booking (€)1 4.30 4.20 2.4%
1. Represents our booking revenue divided by the total number of air and non-air bookings.
5.1.3 Contribution
The contribution of our Distribution segment is calculated after deducting from our revenue those operating costs which can be directly allocated to the segment (variable costs, mainly related to distribution fees and incentives, and product development, marketing and commercial costs).
In 2016, Distribution contribution amounted to €1,223.0 million, 3.9% higher than in 2015. The increase in contribution was supported by higher revenue partially offset by growth in costs. As a percentage of revenue, in 2016, contribution represented 41.8%. Contribution was impacted by non-recurring effects linked to certain personnel-related payments, local tax provisions and bad debt provisions, amongst others, included in the segment’s net operating costs.
Excluding these non-recurring effects, net operating costs growth was due to:
_ Growth in incentives and distribution fees, driven by a 5.9% increase in travel agency air bookings and a unitary distribution cost expansion, as a consequence of (i) competitive pressure and (ii) an increase in weight of countries which have a higher unit distribution cost, for example India.
_ Higher fixed costs, which resulted from:
Annual salary and variable remuneration reviews.
A limited increase in our core Distribution commercial resources.
The expansion of our R&D and commercial teams dedicated to corporate IT (i:FAO), advertising (Travel Audience) and Travel Intelligence, as well as the consolidation impact of Pyton.
A reduction in the overall capitalisation ratio of the segment, impacted by the mix of projects undertaken and the acceleration in activities within certain businesses with lower capitalisation ratios.
_ A positive foreign exchange impact.

Page 26 of 54 amadeus.com
© 2
01
7 A
mad
eus
IT G
rou
p a
nd
its
affi
liate
s an
d s
ub
sid
iari
es
5.2 IT Solutions IT Solutions (figures in million euros) Full year 2016 Full year 2015 % Change Operating KPI Passengers Boarded (PB) (m) 1,382.5 747.3 85.0%
Financial results Revenue 1,547.9 1,174.9 31.7% Operating costs (712.4) (614.4) 16.0% Direct capitalisations 205.2 200.2 2.5% Net operating costs (507.2) (414.1) 22.5% Contribution 1,040.7 760.8 36.8% As % of Revenue 67.2% 64.8% 2.5 p.p.
IT Solutions includes our Airline IT business, which addresses airlines’ key operational requirements in the areas of Passenger Service Systems (PSS) (including reservation, ticketing, inventory management, departure control and disruption management), shopping and retailing (including e-commerce solutions), merchandising, personalisation and revenue optimisation solutions (including Revenue Management and financial solutions, such as Revenue Integrity or Revenue Accounting). Amadeus also supports airline customers through business consulting and process optimisation. Additionally, our Hospitality IT, Airport IT and Rail IT businesses, as well as a part of our Payments offering (the Merchant Hub, through which we help travel merchants get paid), also form part of the IT Solutions segment.
IT Solutions delivered underlying double-digit growth in 2016, which, together with the consolidation of Navitaire and our 2015 acquisitions, resulted in a 31.7% revenue increase. This positive evolution was supported by higher transactional revenue, in turn fuelled by PB volume growth and upselling activity, as well as an increase in non-transactional revenue.
Contribution amounted to €1,040.7 million and increased by 36.8% in 2016 vs. prior year. As a percentage of revenue, this represented 67.2%, expanding 2.5 p.p. vs. 2015.
5.2.1 Evolution of Passengers Boarded
Amadeus passengers boarded grew 91.3% in the fourth quarter of 2016 and 85.0% in the full year period, fuelled by the addition of passengers boarded from Navitaire (consolidated since January 26, 2016) and a 12% increase in Altéa passengers boarded, both in the quarter and the year.

Page 27 of 54 amadeus.com
© 2
01
7 A
mad
eus
IT G
rou
p a
nd
its
affi
liate
s an
d s
ub
sid
iari
es
Total PB (figures in million)
Oct-Dec
2016 Oct-Dec
2015 %
Change Full year
2016 Full year
2015 %
Change Altéa Passengers Boarded 207.8 185.0 12.3% 838.3 747.3 12.2%
Navitaire Passengers Boarded 146.2 - n.m. 544.1 - n.m.
Total PB 354.0 185.0 91.3% 1,382.5 747.3 85.0%
Altéa Passengers Boarded increased organically 5.0% in the fourth quarter, accelerating growth vs. the first nine months of the year and driving full year growth to 4.4%. This organic increase combined with the impact from the 2015 and 2016 implementations (mainly All Nippon Airways and Thomas Cook Group Airlines, in 2015, and Swiss International Air Lines, Brussels Airlines and China Airlines, in 2016) drove our volumes up by 12.3% in the fourth quarter, or 12.2% in the full year.
Navitaire contributed 544.1 million passengers to our 2016 passengers boarded (consolidated since January 26, 2016 and equivalent to 577.6 million passengers for the full year). Passengers boarded on the New Skies platform performed well in the year, growing double-digit organically and also benefitting from implementations such as Viva Group.
Additionally, Navitaire has supported the expansion of our international footprint. Asia and Pacific and North America gained relative weight in the year, representing 31.0% and 4.7% respectively. The shift towards these regions will continue as we implement the contracted migrations of Southwest Airlines (the domestic passengers business), Japan Airlines and Malaysia Airlines.
Total PB (figures in million)
Full year
2016 % of Total
Full year 2015
% of Total
% Change
Western Europe 562.4 40.7% 324.2 43.4% 73.5% Asia & Pacific 428.5 31.0% 201.3 26.9% 112.9% Latin America 134.9 9.8% 77.4 10.4% 74.4% Middle East and Africa 119.7 8.7% 103.7 13.9% 15.5% Central, Eastern and Southern Europe 72.0 5.2% 37.0 5.0% 94.5% North America 64.9 4.7% 3.8 0.5% n.m. Total PB 1,382.5 100.0% 747.3 100.0% 85.0%
5.2.2 Revenue
IT Solutions Revenue (figures in million euros)
Oct-Dec
2016 Oct-Dec
2015 %
Change Full year
2016 Full year
2015 %
Change Revenue 381.2 297.7 28.1% 1,547.9 1,174.9 31.7%
Page 28 of 54 amadeus.com
© 2
01
7 A
mad
eus
IT G
rou
p a
nd
its
affi
liate
s an
d s
ub
sid
iari
es
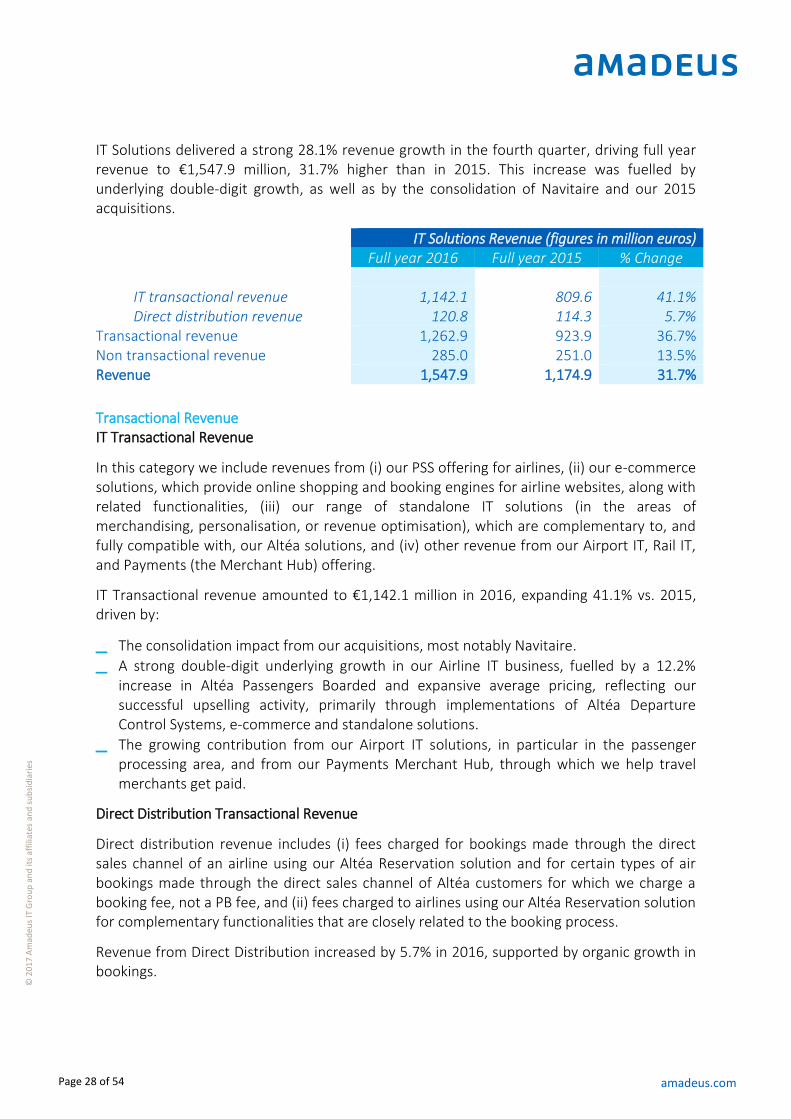
IT Solutions delivered a strong 28.1% revenue growth in the fourth quarter, driving full year revenue to €1,547.9 million, 31.7% higher than in 2015. This increase was fuelled by underlying double-digit growth, as well as by the consolidation of Navitaire and our 2015 acquisitions.
IT Solutions Revenue (figures in million euros) Full year 2016 Full year 2015 % Change
IT transactional revenue 1,142.1 809.6 41.1% Direct distribution revenue 120.8 114.3 5.7%
Transactional revenue 1,262.9 923.9 36.7% Non transactional revenue 285.0 251.0 13.5% Revenue 1,547.9 1,174.9 31.7%
Transactional Revenue IT Transactional Revenue
In this category we include revenues from (i) our PSS offering for airlines, (ii) our e-commerce solutions, which provide online shopping and booking engines for airline websites, along with related functionalities, (iii) our range of standalone IT solutions (in the areas of merchandising, personalisation, or revenue optimisation), which are complementary to, and fully compatible with, our Altéa solutions, and (iv) other revenue from our Airport IT, Rail IT, and Payments (the Merchant Hub) offering.
IT Transactional revenue amounted to €1,142.1 million in 2016, expanding 41.1% vs. 2015, driven by:
_ The consolidation impact from our acquisitions, most notably Navitaire.
_ A strong double-digit underlying growth in our Airline IT business, fuelled by a 12.2% increase in Altéa Passengers Boarded and expansive average pricing, reflecting our successful upselling activity, primarily through implementations of Altéa Departure Control Systems, e-commerce and standalone solutions.
_ The growing contribution from our Airport IT solutions, in particular in the passenger processing area, and from our Payments Merchant Hub, through which we help travel merchants get paid.
Direct Distribution Transactional Revenue
Direct distribution revenue includes (i) fees charged for bookings made through the direct sales channel of an airline using our Altéa Reservation solution and for certain types of air bookings made through the direct sales channel of Altéa customers for which we charge a booking fee, not a PB fee, and (ii) fees charged to airlines using our Altéa Reservation solution for complementary functionalities that are closely related to the booking process.
Revenue from Direct Distribution increased by 5.7% in 2016, supported by organic growth in bookings.
Page 29 of 54 amadeus.com
© 2
01
7 A
mad
eus
IT G
rou
p a
nd
its
affi
liate
s an
d s
ub
sid
iari
es
Non Transactional Revenue Non-transactional revenue comprises among others, (i) the recognition of deferred customisation and implementation fees of our solutions, (ii) the provision of bespoke services, application hosting and other customer support services and (iii) revenues related to our Hospitality IT solutions.
Non transactional revenue increased by 13.5% in 2016 vs. prior year, as a combination of:
_ Organic growth delivered by Hospitality IT, mainly in the Sales & Catering business (despite the negative impact from the divestment of a non-core Meeting Intelligence business in July 2016, as explained in section 3.3 of this report), and by Airline IT, mostly from the recognition of previously deferred revenue (which starts to be recognised after a customer implementation takes place) as well as from e-commerce related services.
_ The contribution of our 2015 acquisitions and Navitaire.
5.2.3 Contribution
The contribution of IT Solutions is calculated after deducting from our revenue those operating costs which can be directly allocated to this segment (variable costs, including certain distribution fees and product development, marketing and commercial costs).
In 2016, the contribution of IT Solutions reached €1,040.7 million, 36.8% higher than prior year. As a percentage of revenue, the segment contribution expanded to 67.2%, 2.5 p.p. higher than in 2015.
The increase in contribution was driven by revenue growth of 31.7% (as explained in section 5.2.2 above), partly offset by an increase in net operating costs of 22.5% (resulting from 16.0% growth in gross operating costs and a 2.5% increase in capitalisations). All captions were highly impacted by the consolidation of Navitaire and the 2015 acquisitions. Excluding acquisitions, the IT Solutions segment contribution grew at a strong double-digit rate.
The underlying growth in net operating costs was mainly due to:
_ Annual salary and variable remuneration reviews.
_ A reinforcement of our commercial teams to better support the expansion of our product offering and customer base.
_ Higher R&D expenditure dedicated to (i) our Airline IT portfolio evolution and expansion (in particular in the areas of merchandising, shopping and personalisation) as well as services, and (ii) our new businesses (mainly related to the development and implementation of our next-generation Guest Reservation System under our agreement with InterContinental Hotels Group).
_ A decline in the IT Solutions capitalisation ratio impacted by the mix of projects undertaken, as well as by a higher weight of activities which are not capitalised (such as bespoke developments or e-commerce related services).
_ A positive foreign exchange impact.

Page 30 of 54 amadeus.com
© 2
01
7 A
mad
eus
IT G
rou
p a
nd
its
affi
liate
s an
d s
ub
sid
iari
es
5.3 EBITDA In 2016, EBITDA increased by 16.0% to €1,700.1 million. EBITDA margin represented 38.0% of revenue in 2016, 0.6 p.p. higher than in 2015. Excluding foreign exchange impacts and Navitaire, margins remained broadly stable and EBITDA grew at a high single-digit rate.
EBITDA growth was the result of the positive underlying performances of Distribution and IT Solutions. The contribution from our latest acquisitions (most notably Navitaire) and certain foreign exchange effects impacting positively the evolution of our cost base, also supported our EBITDA growth in 2016 (see section 4.1 for details on the exposure of our operating results to foreign exchange fluctuations).
Distribution and IT Solutions contributions were partly offset by higher net indirect costs, which grew 19.3% in 2016. This was the result of gross indirect costs increasing by 16.6% and capitalisations by 7.8%.
Indirect costs were highly impacted by the consolidation of Navitaire central costs (such as costs related to hosting in Accenture’s data centres). Excluding these Navitaire costs, total indirect costs increased at a mid-single digit rate, mainly driven by:
_ Annual salary and variable remuneration reviews.
_ Additional resources to expand our corporate structure following our business and geographical expansion.
_ An increase in expenses related to cross area development and data centre projects (including the shift to open systems, in its final stage, and to cloud-based architecture), though most of these projects are capitalised.
_ A positive foreign exchange impact.
Indirect costs (figures in million euros) Full year 2016 Full year 2015 % Change Indirect costs (721.6) (618.9) 16.6% Indirect capitalisations & RTC1 158.0 146.5 7.8% Net indirect costs (563.6) (472.4) 19.3% 1. Includes the Research Tax Credit (RTC).
Page 31 of 54 amadeus.com
© 2
01
7 A
mad
eus
IT G
rou
p a
nd
its
affi
liate
s an
d s
ub
sid
iari
es
6 Consolidated financial statements
Page 32 of 54 amadeus.com
© 2
01
7 A
mad
eus
IT G
rou
p a
nd
its
affi
liate
s an
d s
ub
sid
iari
es
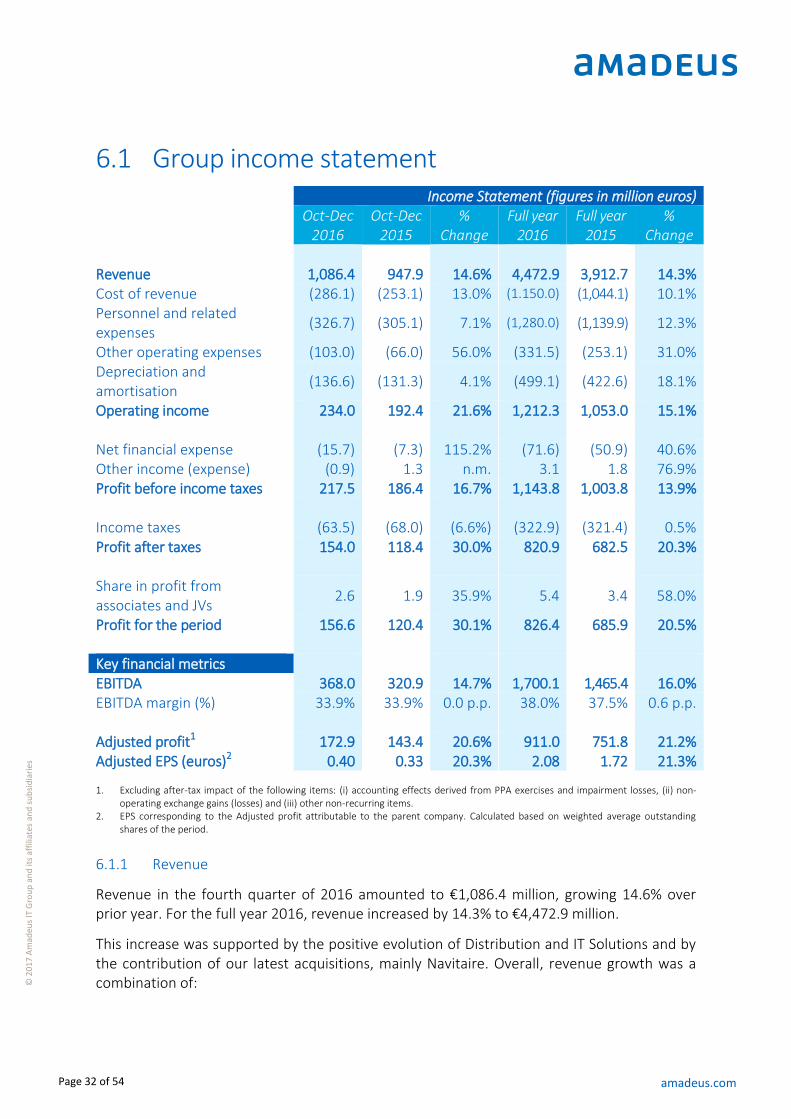
6.1 Group income statement Income Statement (figures in million euros)
Oct-Dec
2016 Oct-Dec
2015 %
Change Full year
2016 Full year
2015 %
Change Revenue 1,086.4 947.9 14.6% 4,472.9 3,912.7 14.3% Cost of revenue (286.1) (253.1) 13.0% (1.150.0) (1,044.1) 10.1% Personnel and related expenses
(326.7) (305.1) 7.1% (1,280.0) (1,139.9) 12.3%
Other operating expenses (103.0) (66.0) 56.0% (331.5) (253.1) 31.0% Depreciation and amortisation
(136.6) (131.3) 4.1% (499.1) (422.6) 18.1%
Operating income 234.0 192.4 21.6% 1,212.3 1,053.0 15.1% Net financial expense (15.7) (7.3) 115.2% (71.6) (50.9) 40.6% Other income (expense) (0.9) 1.3 n.m. 3.1 1.8 76.9% Profit before income taxes 217.5 186.4 16.7% 1,143.8 1,003.8 13.9% Income taxes (63.5) (68.0) (6.6%) (322.9) (321.4) 0.5% Profit after taxes 154.0 118.4 30.0% 820.9 682.5 20.3% Share in profit from associates and JVs
2.6 1.9 35.9% 5.4 3.4 58.0%
Profit for the period 156.6 120.4 30.1% 826.4 685.9 20.5% Key financial metrics EBITDA 368.0 320.9 14.7% 1,700.1 1,465.4 16.0% EBITDA margin (%) 33.9% 33.9% 0.0 p.p. 38.0% 37.5% 0.6 p.p. Adjusted profit1 172.9 143.4 20.6% 911.0 751.8 21.2% Adjusted EPS (euros)2 0.40 0.33 20.3% 2.08 1.72 21.3%
1. Excluding after-tax impact of the following items: (i) accounting effects derived from PPA exercises and impairment losses, (ii) non-
operating exchange gains (losses) and (iii) other non-recurring items. 2. EPS corresponding to the Adjusted profit attributable to the parent company. Calculated based on weighted average outstanding
shares of the period.
6.1.1 Revenue
Revenue in the fourth quarter of 2016 amounted to €1,086.4 million, growing 14.6% over prior year. For the full year 2016, revenue increased by 14.3% to €4,472.9 million.
This increase was supported by the positive evolution of Distribution and IT Solutions and by the contribution of our latest acquisitions, mainly Navitaire. Overall, revenue growth was a combination of:

Page 33 of 54 amadeus.com
© 2
01
7 A
mad
eus
IT G
rou
p a
nd
its
affi
liate
s an
d s
ub
sid
iari
es
_ An increase of 8.4% in our Distribution segment in the fourth quarter of 2016, leading to 6.8% growth for the full year period.
_ An increase of 28.1% in our IT Solutions segment in the fourth quarter of 2016 and 31.7% in the full year.
See sections 5.1.2. and 5.2.2. for more details on revenue growth within Distribution and IT Solutions.
Revenue (figures in million euros)
Oct-Dec
2016 Oct-Dec
2015 %
Change Full year
2016 Full year
2015 %
Change Distribution 705.1 650.2 8.4% 2,925.0 2,737.8 6.8% IT Solutions 381.2 297.7 28.1% 1,547.9 1,174.9 31.7% Revenue 1,086.4 947.9 14.6% 4,472.9 3,912.7 14.3%
6.1.2 Cost of revenue
These costs are mainly related to: (i) incentive fees paid to travel agencies, (ii) distribution fees paid to those local commercial organisations which act as a local distributor (mainly in the Middle East, North Africa, India, and South Korea) and (iii) data communication expenses related to the maintenance of our computer network, including connection charges.
Cost of revenue amounted to €286.1 million in the fourth quarter of 2016, 13.0% higher than in the same period of 2015, driving full year growth to 10.1%. This increase was mostly the result of:
_ A 5.9% increase in travel agency air bookings.
_ A higher unitary distribution cost, resulting from (i) competitive pressure and (ii) an increase in weight of countries which have a higher unit distribution cost, for example India.
_ A positive foreign exchange impact.
As a percentage of revenue, cost of revenue declined to 25.7% in 2016, 1.0 p.p. less than in 2015.
6.1.3 Personnel and related expenses and other operating expenses
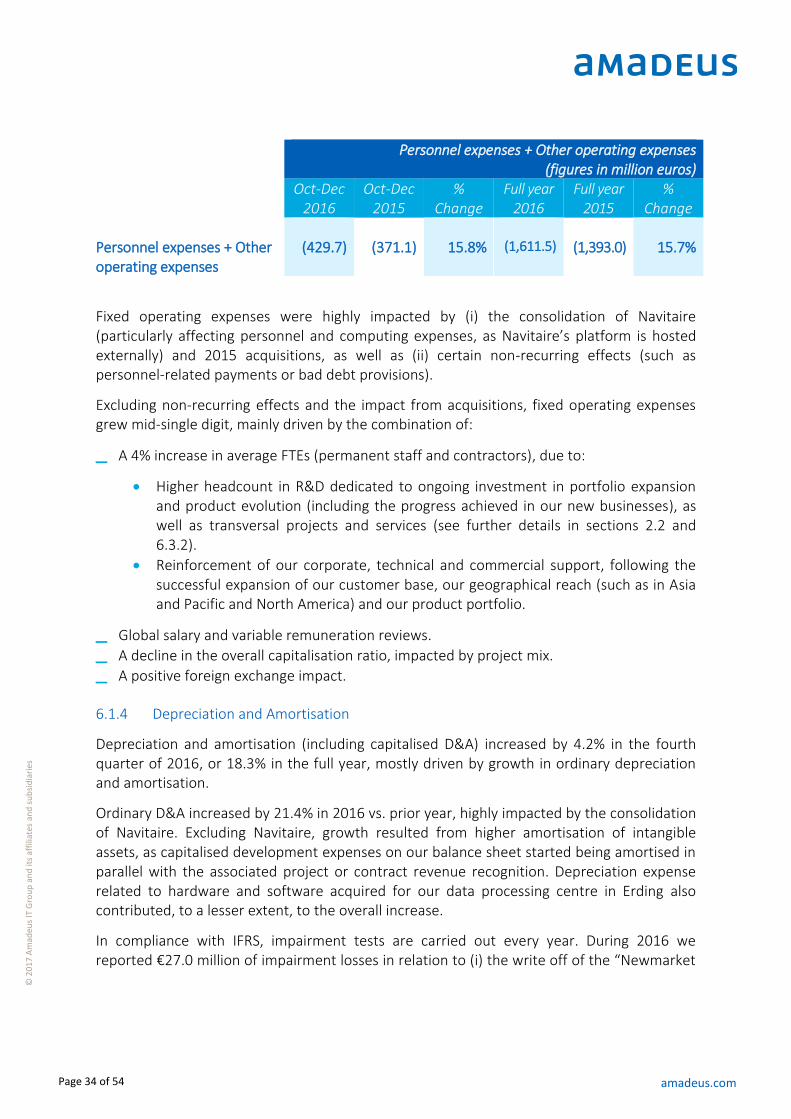
A large part of Amadeus’ employees are software developers. Amadeus also hires contractors to support its development activity, complementing the permanent staff. The overall ratio of permanent staff vs. contractors devoted to R&D fluctuates depending on business needs and project mix, therefore impacting the evolution of both “Personnel expenses” and “Other operating expenses” captions in our income statement.
Our combined operating expenses cost line, including both Personnel expenses and Other operating expenses, grew by 15.8% in the fourth quarter of 2016 vs. the same quarter of 2015, or 15.7% in the year vs. 2015.
Page 34 of 54 amadeus.com
© 2
01
7 A
mad
eus
IT G
rou
p a
nd
its
affi
liate
s an
d s
ub
sid
iari
es
Personnel expenses + Other operating expenses
(figures in million euros)
Oct-Dec
2016 Oct-Dec
2015 %
Change Full year
2016 Full year
2015 %
Change Personnel expenses + Other operating expenses
(429.7) (371.1) 15.8% (1,611.5) (1,393.0) 15.7%
Fixed operating expenses were highly impacted by (i) the consolidation of Navitaire (particularly affecting personnel and computing expenses, as Navitaire’s platform is hosted externally) and 2015 acquisitions, as well as (ii) certain non-recurring effects (such as personnel-related payments or bad debt provisions).
Excluding non-recurring effects and the impact from acquisitions, fixed operating expenses grew mid-single digit, mainly driven by the combination of:
_ A 4% increase in average FTEs (permanent staff and contractors), due to:
Higher headcount in R&D dedicated to ongoing investment in portfolio expansion and product evolution (including the progress achieved in our new businesses), as well as transversal projects and services (see further details in sections 2.2 and 6.3.2).
Reinforcement of our corporate, technical and commercial support, following the successful expansion of our customer base, our geographical reach (such as in Asia and Pacific and North America) and our product portfolio.
_ Global salary and variable remuneration reviews.
_ A decline in the overall capitalisation ratio, impacted by project mix.
_ A positive foreign exchange impact.
6.1.4 Depreciation and Amortisation
Depreciation and amortisation (including capitalised D&A) increased by 4.2% in the fourth quarter of 2016, or 18.3% in the full year, mostly driven by growth in ordinary depreciation and amortisation.
Ordinary D&A increased by 21.4% in 2016 vs. prior year, highly impacted by the consolidation of Navitaire. Excluding Navitaire, growth resulted from higher amortisation of intangible assets, as capitalised development expenses on our balance sheet started being amortised in parallel with the associated project or contract revenue recognition. Depreciation expense related to hardware and software acquired for our data processing centre in Erding also contributed, to a lesser extent, to the overall increase.
In compliance with IFRS, impairment tests are carried out every year. During 2016 we reported €27.0 million of impairment losses in relation to (i) the write off of the “Newmarket

Page 35 of 54 amadeus.com
© 2
01
7 A
mad
eus
IT G
rou
p a
nd
its
affi
liate
s an
d s
ub
sid
iari
es
International” trademark (replaced by the global Amadeus brand) amounting to €8.6 million and (ii) solutions that we estimated would not deliver their expected economic benefits.
Depreciation and Amortisation (figures in million euros)
Oct-Dec
2016 Oct-Dec
2015 %
Change Full year
2016 Full year
2015 %
Change Ordinary depreciation and amortisation
(104.1) (86.8) 20.0% (374.7) (308.6) 21.4%
Amortisation derived from PPA (24.1) (24.5) (1.8%) (97.5) (94.0) 3.7% Impairments (8.4) (19.9) (57.9%) (27.0) (20.0) 34.8% Depreciation and amortisation (136.6) (131.3) 4.1% (499.1) (422.6) 18.1% Capitalised depreciation and amortisation1
2.7 2.7 (2.9%) 11.3 10.2 10.6%
Depreciation and amortisation post-capitalisations
(134.0) (128.5) 4.2% (487.8) (412.4) 18.3%
1. Included within the other operating expenses caption in the Group Income Statement.
6.1.5 EBITDA and Operating income
EBITDA increased by 14.7% in the fourth quarter, delivering full year growth of 16.0%. This was supported by the positive underlying performance of Distribution and IT Solutions as well as by the contribution from our latest acquisitions (mainly Navitaire) and certain foreign exchange effects impacting positively the evolution of our cost base (see section 4.1 for details on the exposure of our operating results to foreign exchange fluctuations).
Operating Income in the fourth quarter of 2016 grew by 21.6%, or 15.1% to €1,212.3 million in the full year period, as a result of EBITDA growth offset by higher D&A charges.
Operating income - EBITDA (figures in million euros)
Oct-Dec
2016 Oct-Dec
2015 %
Change Full year
2016 Full year
2015 %
Change Operating income 234.0 192.4 21.6% 1,212.3 1,053.0 15.1% Depreciation and amortisation 136.6 131.3 4.1% 499.1 422.6 18.1% Capitalised depreciation and amortisation
(2.7) (2.7) (2.9%) (11.3) (10.2) 10.6%
EBITDA 368.0 320.9 14.7% 1,700.1 1,465.4 16.0% EBITDA margin (%) 33.9% 33.9% 0.0 p.p. 38.0% 37.5% 0.6 p.p.
Page 36 of 54 amadeus.com
© 2
01
7 A
mad
eus
IT G
rou
p a
nd
its
affi
liate
s an
d s
ub
sid
iari
es
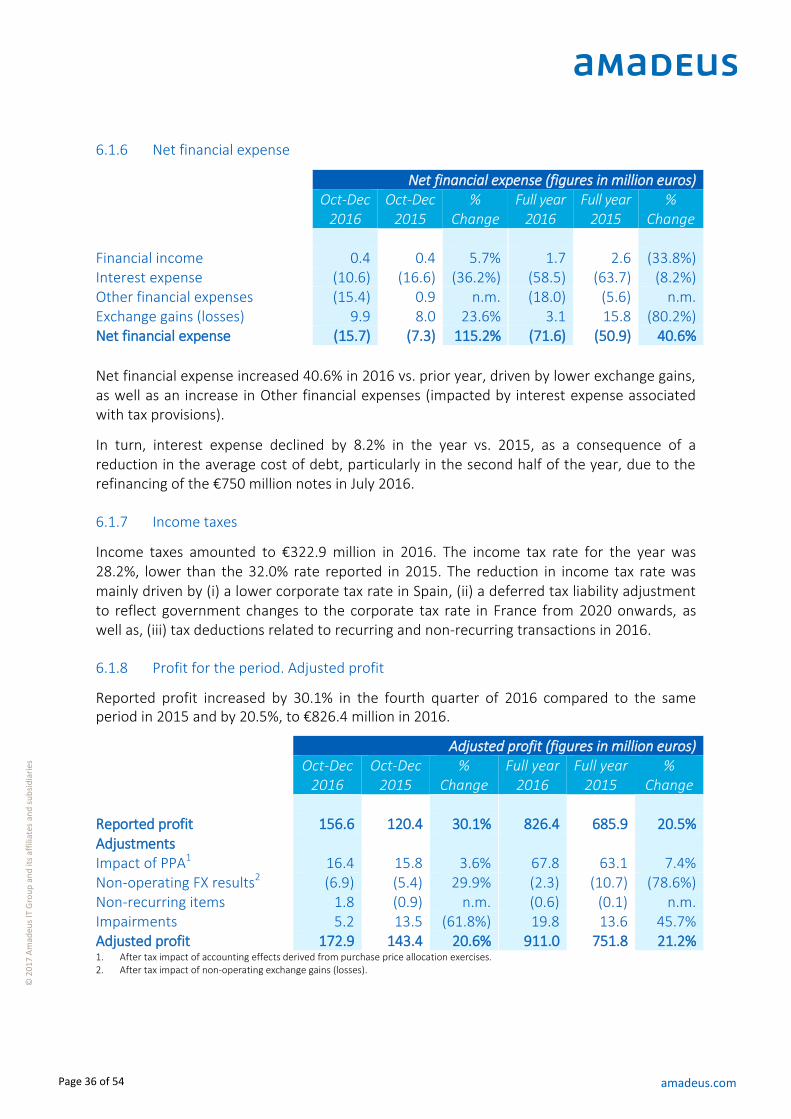
6.1.6 Net financial expense
Net financial expense (figures in million euros)
Oct-Dec
2016 Oct-Dec
2015 %
Change Full year
2016 Full year
2015 %
Change Financial income 0.4 0.4 5.7% 1.7 2.6 (33.8%) Interest expense (10.6) (16.6) (36.2%) (58.5) (63.7) (8.2%) Other financial expenses (15.4) 0.9 n.m. (18.0) (5.6) n.m. Exchange gains (losses) 9.9 8.0 23.6% 3.1 15.8 (80.2%) Net financial expense (15.7) (7.3) 115.2% (71.6) (50.9) 40.6%
Net financial expense increased 40.6% in 2016 vs. prior year, driven by lower exchange gains, as well as an increase in Other financial expenses (impacted by interest expense associated with tax provisions).
In turn, interest expense declined by 8.2% in the year vs. 2015, as a consequence of a reduction in the average cost of debt, particularly in the second half of the year, due to the refinancing of the €750 million notes in July 2016.
6.1.7 Income taxes
Income taxes amounted to €322.9 million in 2016. The income tax rate for the year was 28.2%, lower than the 32.0% rate reported in 2015. The reduction in income tax rate was mainly driven by (i) a lower corporate tax rate in Spain, (ii) a deferred tax liability adjustment to reflect government changes to the corporate tax rate in France from 2020 onwards, as well as, (iii) tax deductions related to recurring and non-recurring transactions in 2016.
6.1.8 Profit for the period. Adjusted profit
Reported profit increased by 30.1% in the fourth quarter of 2016 compared to the same period in 2015 and by 20.5%, to €826.4 million in 2016.
Adjusted profit (figures in million euros)
Oct-Dec
2016 Oct-Dec
2015 %
Change Full year
2016 Full year
2015 %
Change Reported profit 156.6 120.4 30.1% 826.4 685.9 20.5% Adjustments Impact of PPA1 16.4 15.8 3.6% 67.8 63.1 7.4% Non-operating FX results2 (6.9) (5.4) 29.9% (2.3) (10.7) (78.6%) Non-recurring items 1.8 (0.9) n.m. (0.6) (0.1) n.m. Impairments 5.2 13.5 (61.8%) 19.8 13.6 45.7% Adjusted profit 172.9 143.4 20.6% 911.0 751.8 21.2% 1. After tax impact of accounting effects derived from purchase price allocation exercises. 2. After tax impact of non-operating exchange gains (losses).

Page 37 of 54 amadeus.com
© 2
01
7 A
mad
eus
IT G
rou
p a
nd
its
affi
liate
s an
d s
ub
sid
iari
es
After adjusting for (i) accounting effects derived from PPA exercises and impairment losses, (ii) non-operating exchange gains (losses), and (iii) other non-recurring items, adjusted profit grew by 20.6% in the fourth quarter of 2016, and by 21.2 % to €911.0 million, in the year.
6.1.9 Earnings per share (EPS)
Earnings per share
Oct-Dec
2016
Oct-Dec 2015
% Change
Full year 2016
Full year 2015
% Change
Weighted average issued shares (m) 438.8 438.8 438.8 444.0 Weighted average treasury shares (m) (1.5) (2.2) (2.0) (7.4) Outstanding shares (m) 437.3 436.6 436.8 436.6 EPS (euros)1 0.36 0.28 29.8% 1.89 1.57 20.6% Adjusted EPS (euros)2 0.40 0.33 20.3% 2.08 1.72 21.3%
1. EPS corresponding to the Profit attributable to the parent company. Calculated based on weighted average outstanding shares of the
period. 2. EPS corresponding to the Adjusted profit attributable to the parent company. Calculated based on weighted average outstanding
shares of the period.
The table above shows EPS for the period, based on the profit attributable to the parent company (after minority interests), both on a reported basis and on an adjusted basis (adjusted profit as detailed above). In 2016, our reported EPS grew by 20.6% to €1.89 and our adjusted EPS by 21.3% to €2.08.
On December 11, 2014 the Board of Directors agreed to undertake a share buy-back programme. The programme was completed on May 12, 2015 as the maximum planned investment of €320 million was reached. A total of 8,759,444 own shares were acquired, representing 1.957% of share capital. The share capital reduction through the amortisation of the repurchased shares was approved by the General Shareholders Meeting on June 25, 2015 and was registered in the Commercial Registry of Madrid on August 4, 2015. In 2015, both the weighted average issued and treasury shares were impacted by this share capital reduction.
On March 11, 2016 the Board of Directors of Amadeus IT Holding, S.A. and that of Amadeus IT Group, S.A. approved a plan in relation to the merger of both companies (being Amadeus IT Holding, S.A. the surviving entity), subject to the approval by their respective General Shareholders’ Meetings, which took place on June 24 and 23, 2016. Following registration of the merger public deed with the Commercial Registry of Madrid on August 2, 2016 and the fulfilment of legal formalities, Amadeus IT Group, S.A. was legally dissolved and Amadeus IT Holding, S.A. adopted the name of Amadeus IT Group, S.A. As of December 31, 2016, 312,519 shares were delivered in exchange of the Amadeus IT Group, S.A. shares.
Page 38 of 54 amadeus.com
© 2
01
7 A
mad
eus
IT G
rou
p a
nd
its
affi
liate
s an
d s
ub
sid
iari
es
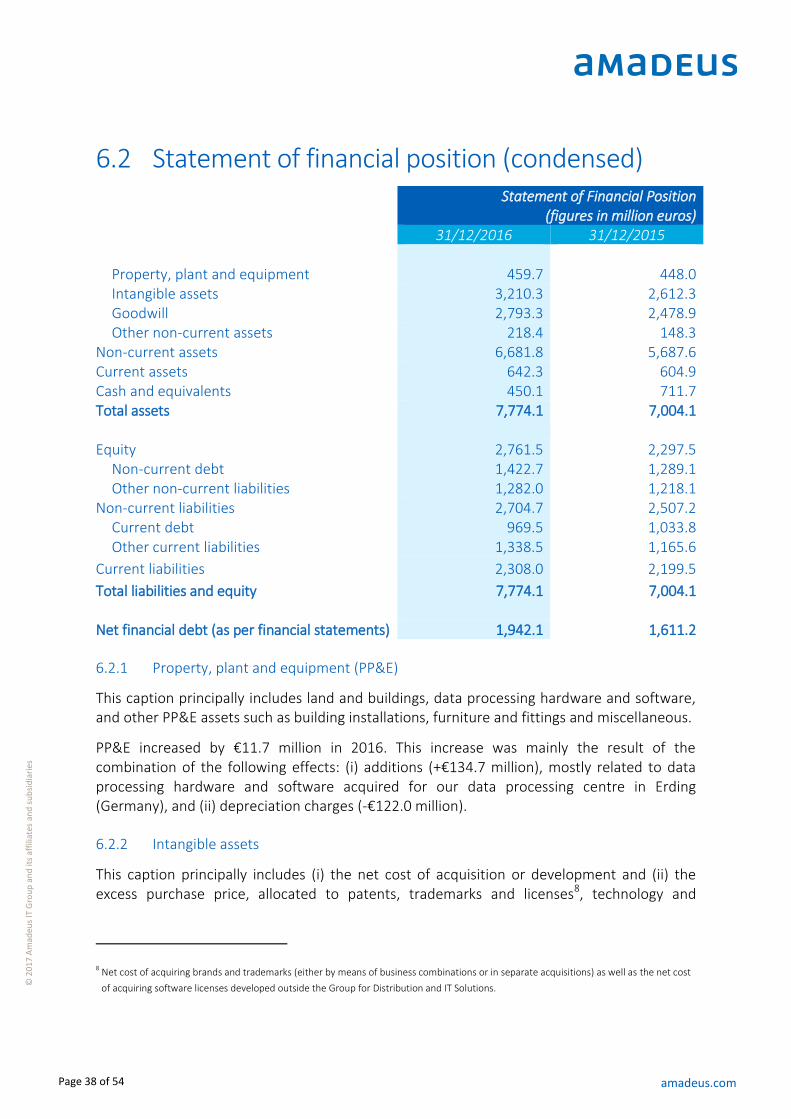
6.2 Statement of financial position (condensed)
Statement of Financial Position
(figures in million euros)
31/12/2016 31/12/2015
Property, plant and equipment 459.7 448.0 Intangible assets 3,210.3 2,612.3 Goodwill 2,793.3 2,478.9 Other non-current assets 218.4 148.3
Non-current assets 6,681.8 5,687.6 Current assets 642.3 604.9 Cash and equivalents 450.1 711.7 Total assets 7,774.1 7,004.1 Equity 2,761.5 2,297.5
Non-current debt 1,422.7 1,289.1 Other non-current liabilities 1,282.0 1,218.1
Non-current liabilities 2,704.7 2,507.2 Current debt 969.5 1,033.8 Other current liabilities 1,338.5 1,165.6
Current liabilities 2,308.0 2,199.5
Total liabilities and equity 7,774.1 7,004.1 Net financial debt (as per financial statements) 1,942.1 1,611.2
6.2.1 Property, plant and equipment (PP&E)
This caption principally includes land and buildings, data processing hardware and software, and other PP&E assets such as building installations, furniture and fittings and miscellaneous.
PP&E increased by €11.7 million in 2016. This increase was mainly the result of the combination of the following effects: (i) additions (+€134.7 million), mostly related to data processing hardware and software acquired for our data processing centre in Erding (Germany), and (ii) depreciation charges (-€122.0 million).
6.2.2 Intangible assets
This caption principally includes (i) the net cost of acquisition or development and (ii) the excess purchase price, allocated to patents, trademarks and licenses8, technology and
8 Net cost of acquiring brands and trademarks (either by means of business combinations or in separate acquisitions) as well as the net cost
of acquiring software licenses developed outside the Group for Distribution and IT Solutions.

Page 39 of 54 amadeus.com
© 2
01
7 A
mad
eus
IT G
rou
p a
nd
its
affi
liate
s an
d s
ub
sid
iari
es
content9 and contractual relationships10. In particular, it includes the excess purchase price derived from the business combination (acquisition) between Amadeus IT Group, S.A. (the former listed company in 2005) and Amadeus IT Group, S.A. (the currently listed company, formerly known as Amadeus IT Holding, S.A. or WAM Acquisition, S.A.) in 2005.
Intangible assets increased by €598.0 million in 2016. This increase was mainly the result of the combination of the following effects: (i) additions of software internally developed (+€422.0 million) and acquired assets (+€75.6 million), (ii) additions from the acquisitions, including the effects derived from the purchase price allocation exercises carried out as part of the consolidation process of Navitaire, Itesso and Pyton into Amadeus’ books (+€472.6 million), and (iii) amortisation charges and impairment losses (-€377.3 million).
6.2.3 Goodwill
Goodwill amounted €2,793.3 million as of December 31, 2016. Goodwill mainly relates to the unallocated amount of the excess purchase price derived from (i) the business combination (acquisition) between Amadeus IT Group, S.A. (the current listed company, formerly named Amadeus IT Holding, S.A. or WAM Acquisition, S.A.) and Amadeus IT Group, S.A. (the former listed company in 2005) in 2005, and (ii) acquisitions, most of them completed in 2014, 2015 and 2016. In particular, goodwill increased by €314.4 million in 2016, mostly due to the acquisition of Navitaire. Goodwill generated in the acquisitions of Itesso and Pyton was adjusted as a result of the purchase price allocation exercises that were carried out in 2016.
6.2.4 Equity, Share capital
As of December 31, 2016 the share capital of our Company was represented by 438,822,506 shares with a nominal value of €0.01 per share.
For information on dividend payments, see section 7.3 “Dividend payments”.
9 Net cost of acquiring technology software and travel content either by means of acquisitions through business combinations/separate
acquisitions or internally generated (software applications developed by the Group, including the development technology of the IT
solutions business). Travel content is obtained by Amadeus through its relationships with travel providers.
10 Net cost of contractual relationships with travel agencies, as acquired through business combinations, as well as costs subject to
capitalisations, related to travel agency incentives, that can be recognised as an asset.
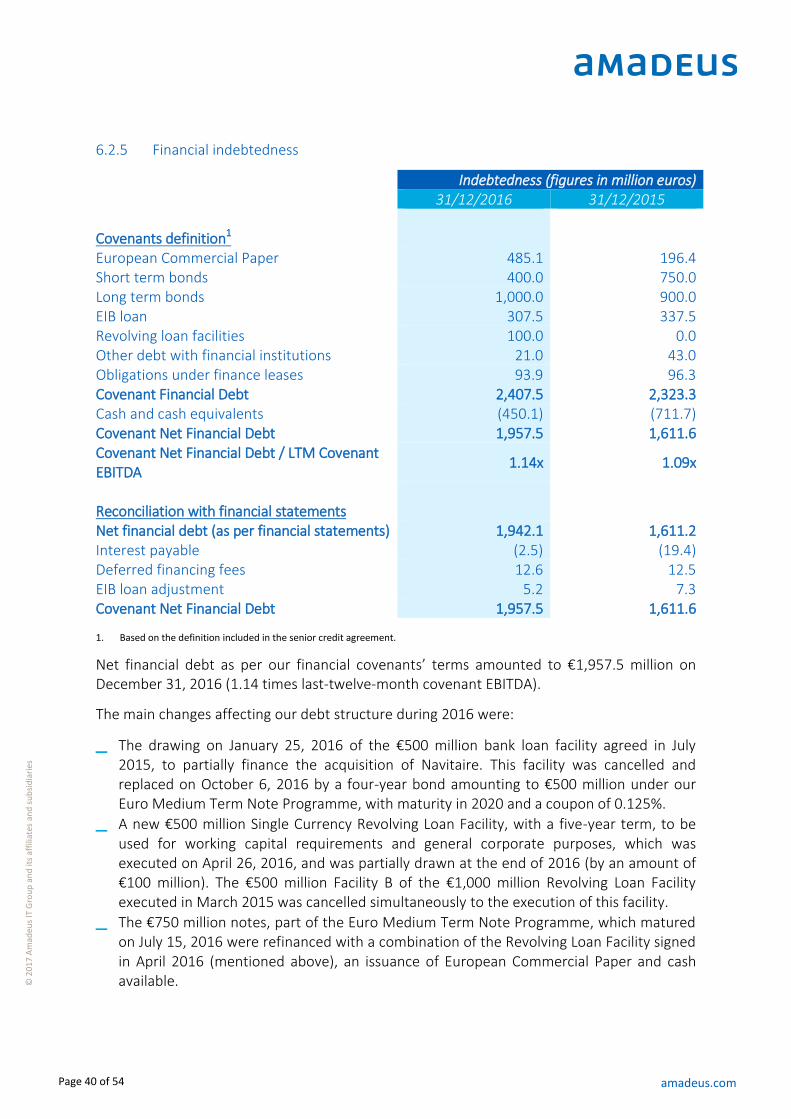
Page 40 of 54 amadeus.com
© 2
01
7 A
mad
eus
IT G
rou
p a
nd
its
affi
liate
s an
d s
ub
sid
iari
es
6.2.5 Financial indebtedness
Indebtedness (figures in million euros) 31/12/2016 31/12/2015 Covenants definition1 European Commercial Paper 485.1 196.4 Short term bonds 400.0 750.0 Long term bonds 1,000.0 900.0 EIB loan 307.5 337.5 Revolving loan facilities 100.0 0.0 Other debt with financial institutions 21.0 43.0 Obligations under finance leases 93.9 96.3 Covenant Financial Debt 2,407.5 2,323.3 Cash and cash equivalents (450.1) (711.7) Covenant Net Financial Debt 1,957.5 1,611.6 Covenant Net Financial Debt / LTM Covenant EBITDA
1.14x 1.09x
Reconciliation with financial statements Net financial debt (as per financial statements) 1,942.1 1,611.2 Interest payable (2.5) (19.4) Deferred financing fees 12.6 12.5 EIB loan adjustment 5.2 7.3 Covenant Net Financial Debt 1,957.5 1,611.6
1. Based on the definition included in the senior credit agreement.
Net financial debt as per our financial covenants’ terms amounted to €1,957.5 million on December 31, 2016 (1.14 times last-twelve-month covenant EBITDA).
The main changes affecting our debt structure during 2016 were:
_ The drawing on January 25, 2016 of the €500 million bank loan facility agreed in July 2015, to partially finance the acquisition of Navitaire. This facility was cancelled and replaced on October 6, 2016 by a four-year bond amounting to €500 million under our Euro Medium Term Note Programme, with maturity in 2020 and a coupon of 0.125%.
_ A new €500 million Single Currency Revolving Loan Facility, with a five-year term, to be used for working capital requirements and general corporate purposes, which was executed on April 26, 2016, and was partially drawn at the end of 2016 (by an amount of €100 million). The €500 million Facility B of the €1,000 million Revolving Loan Facility executed in March 2015 was cancelled simultaneously to the execution of this facility.
_ The €750 million notes, part of the Euro Medium Term Note Programme, which matured on July 15, 2016 were refinanced with a combination of the Revolving Loan Facility signed in April 2016 (mentioned above), an issuance of European Commercial Paper and cash available.

Page 41 of 54 amadeus.com
© 2
01
7 A
mad
eus
IT G
rou
p a
nd
its
affi
liate
s an
d s
ub
sid
iari
es
_ The increase in the use of the Multi-Currency European Commercial Paper (ECP) programme by a net amount of €288.6 million.
_ The repayment of €30 million related to the European Investment Bank Loan.
Reconciliation with net financial debt as per our financial statements Under the covenant terms, Covenant Financial Debt (i) does not include the accrued interest payable (€2.5 million at December 31, 2016) which is treated as debt in our financial statements, (ii) is calculated based on its nominal value, while in our financial statements our financial debt is measured at amortised cost, i.e., after deducting the deferred financing fees (that mainly correspond to fees paid upfront in connection with the set-up of new credit agreements and amount to €12.6 million at December 31, 2016), and (iii) does not include an adjustment for the difference between the nominal value of the loan granted by the EIB at below-market interest rate and its fair value (€5.2 million at December 31, 2016).
Debt structure as of December 31, 2016
Description Amount Maturity
Capital markets financing
Euro Bond €400m €500m €500m
Dec 2017 Oct 2020 Nov 2021
EIB Loans Development Loan €157.5m €150m
May 2021 May 2022
ECP European
Commercial Paper €485m Max 364 days
Revolving Loan Facilities
Revolving1 €500m €500m
Mar 2020 Jul 2021
1. As of December 31, 2016 the revolving credit facility maturing in July 2021 was partially drawn, by an amount of €100 million.
Debt maturity profile as of December 31, 2016
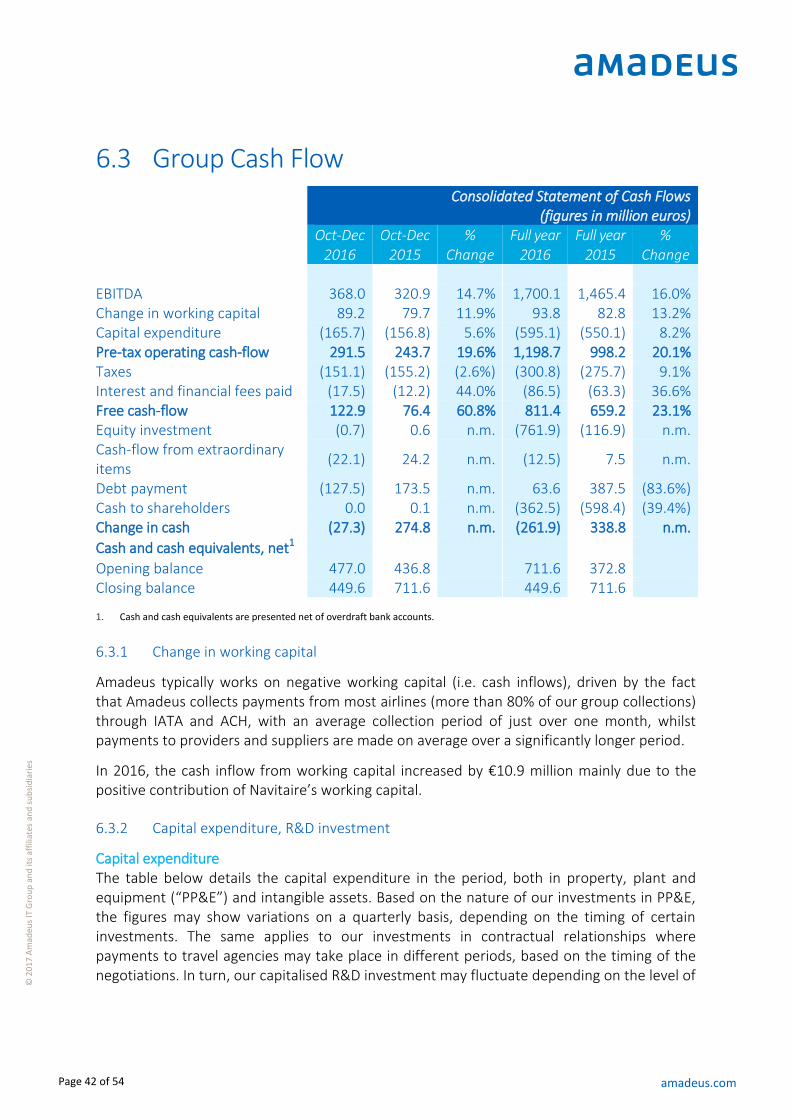
Page 42 of 54 amadeus.com
© 2
01
7 A
mad
eus
IT G
rou
p a
nd
its
affi
liate
s an
d s
ub
sid
iari
es
6.3 Group Cash Flow
Consolidated Statement of Cash Flows
(figures in million euros)
Oct-Dec
2016 Oct-Dec
2015 %
Change Full year
2016 Full year
2015 %
Change EBITDA 368.0 320.9 14.7% 1,700.1 1,465.4 16.0% Change in working capital 89.2 79.7 11.9% 93.8 82.8 13.2% Capital expenditure (165.7) (156.8) 5.6% (595.1) (550.1) 8.2% Pre-tax operating cash-flow 291.5 243.7 19.6% 1,198.7 998.2 20.1% Taxes (151.1) (155.2) (2.6%) (300.8) (275.7) 9.1% Interest and financial fees paid (17.5) (12.2) 44.0% (86.5) (63.3) 36.6% Free cash-flow 122.9 76.4 60.8% 811.4 659.2 23.1% Equity investment (0.7) 0.6 n.m. (761.9) (116.9) n.m. Cash-flow from extraordinary items
(22.1) 24.2 n.m. (12.5) 7.5 n.m.
Debt payment (127.5) 173.5 n.m. 63.6 387.5 (83.6%) Cash to shareholders 0.0 0.1 n.m. (362.5) (598.4) (39.4%) Change in cash (27.3) 274.8 n.m. (261.9) 338.8 n.m.
Cash and cash equivalents, net1
Opening balance 477.0 436.8 711.6 372.8 Closing balance 449.6 711.6 449.6 711.6
1. Cash and cash equivalents are presented net of overdraft bank accounts.
6.3.1 Change in working capital
Amadeus typically works on negative working capital (i.e. cash inflows), driven by the fact that Amadeus collects payments from most airlines (more than 80% of our group collections) through IATA and ACH, with an average collection period of just over one month, whilst payments to providers and suppliers are made on average over a significantly longer period.
In 2016, the cash inflow from working capital increased by €10.9 million mainly due to the positive contribution of Navitaire’s working capital.
6.3.2 Capital expenditure, R&D investment
Capital expenditure The table below details the capital expenditure in the period, both in property, plant and equipment (“PP&E”) and intangible assets. Based on the nature of our investments in PP&E, the figures may show variations on a quarterly basis, depending on the timing of certain investments. The same applies to our investments in contractual relationships where payments to travel agencies may take place in different periods, based on the timing of the negotiations. In turn, our capitalised R&D investment may fluctuate depending on the level of
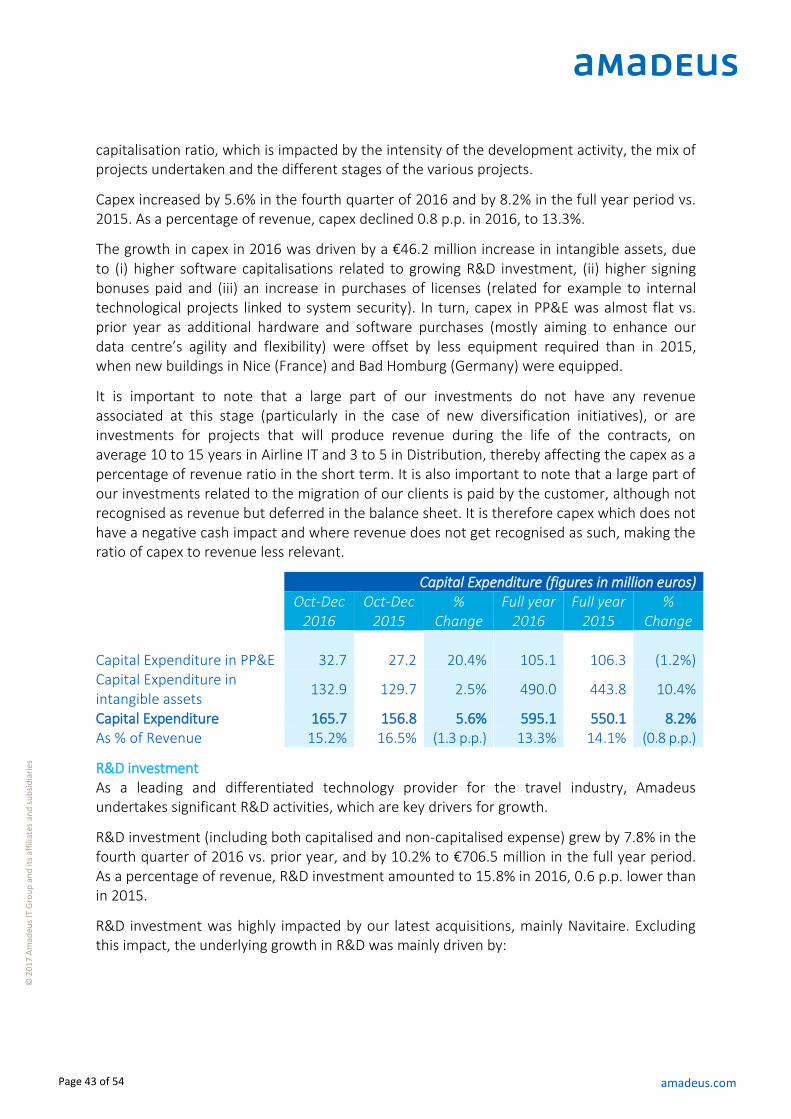
Page 43 of 54 amadeus.com
© 2
01
7 A
mad
eus
IT G
rou
p a
nd
its
affi
liate
s an
d s
ub
sid
iari
es
capitalisation ratio, which is impacted by the intensity of the development activity, the mix of projects undertaken and the different stages of the various projects.
Capex increased by 5.6% in the fourth quarter of 2016 and by 8.2% in the full year period vs. 2015. As a percentage of revenue, capex declined 0.8 p.p. in 2016, to 13.3%.
The growth in capex in 2016 was driven by a €46.2 million increase in intangible assets, due to (i) higher software capitalisations related to growing R&D investment, (ii) higher signing bonuses paid and (iii) an increase in purchases of licenses (related for example to internal technological projects linked to system security). In turn, capex in PP&E was almost flat vs. prior year as additional hardware and software purchases (mostly aiming to enhance our data centre’s agility and flexibility) were offset by less equipment required than in 2015, when new buildings in Nice (France) and Bad Homburg (Germany) were equipped.
It is important to note that a large part of our investments do not have any revenue associated at this stage (particularly in the case of new diversification initiatives), or are investments for projects that will produce revenue during the life of the contracts, on average 10 to 15 years in Airline IT and 3 to 5 in Distribution, thereby affecting the capex as a percentage of revenue ratio in the short term. It is also important to note that a large part of our investments related to the migration of our clients is paid by the customer, although not recognised as revenue but deferred in the balance sheet. It is therefore capex which does not have a negative cash impact and where revenue does not get recognised as such, making the ratio of capex to revenue less relevant.
Capital Expenditure (figures in million euros)
Oct-Dec
2016
Oct-Dec 2015
% Change
Full year 2016
Full year 2015
% Change
Capital Expenditure in PP&E 32.7 27.2 20.4% 105.1 106.3 (1.2%) Capital Expenditure in intangible assets
132.9 129.7 2.5% 490.0 443.8 10.4%
Capital Expenditure 165.7 156.8 5.6% 595.1 550.1 8.2% As % of Revenue 15.2% 16.5% (1.3 p.p.) 13.3% 14.1% (0.8 p.p.)
R&D investment As a leading and differentiated technology provider for the travel industry, Amadeus undertakes significant R&D activities, which are key drivers for growth.
R&D investment (including both capitalised and non-capitalised expense) grew by 7.8% in the fourth quarter of 2016 vs. prior year, and by 10.2% to €706.5 million in the full year period. As a percentage of revenue, R&D investment amounted to 15.8% in 2016, 0.6 p.p. lower than in 2015.
R&D investment was highly impacted by our latest acquisitions, mainly Navitaire. Excluding this impact, the underlying growth in R&D was mainly driven by:
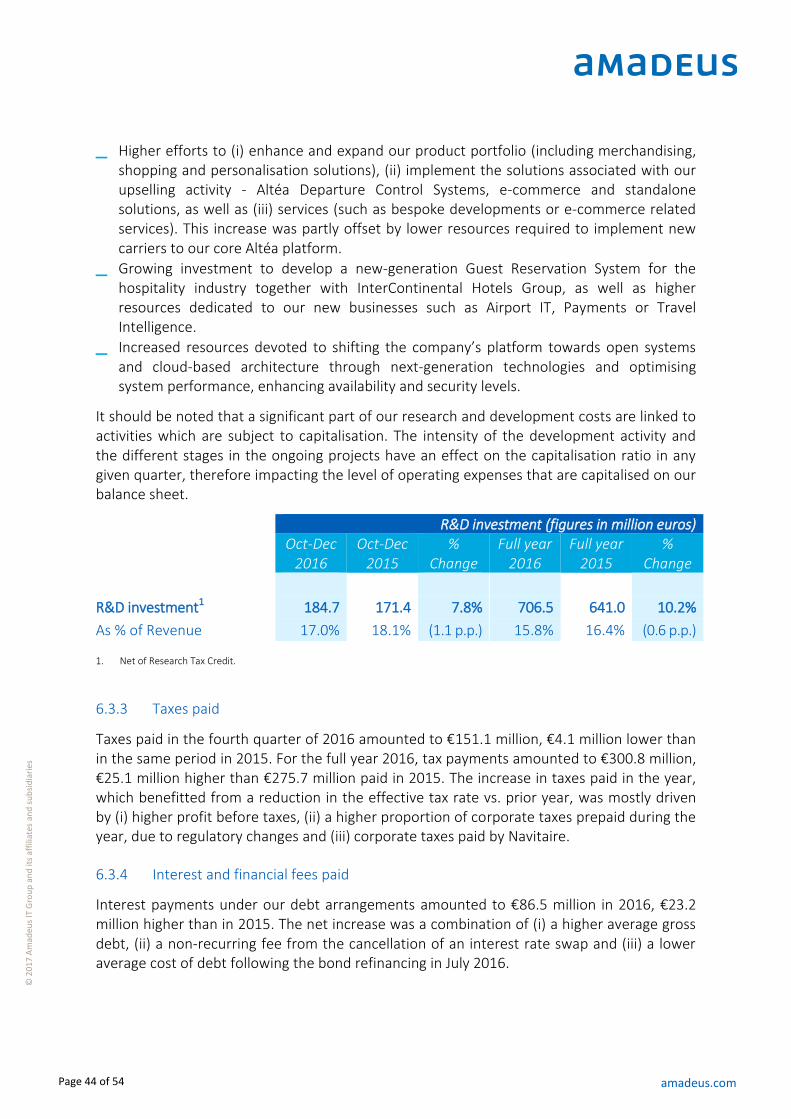
Page 44 of 54 amadeus.com
© 2
01
7 A
mad
eus
IT G
rou
p a
nd
its
affi
liate
s an
d s
ub
sid
iari
es
_ Higher efforts to (i) enhance and expand our product portfolio (including merchandising, shopping and personalisation solutions), (ii) implement the solutions associated with our upselling activity - Altéa Departure Control Systems, e-commerce and standalone solutions, as well as (iii) services (such as bespoke developments or e-commerce related services). This increase was partly offset by lower resources required to implement new carriers to our core Altéa platform.
_ Growing investment to develop a new-generation Guest Reservation System for the hospitality industry together with InterContinental Hotels Group, as well as higher resources dedicated to our new businesses such as Airport IT, Payments or Travel Intelligence.
_ Increased resources devoted to shifting the company’s platform towards open systems and cloud-based architecture through next-generation technologies and optimising system performance, enhancing availability and security levels.
It should be noted that a significant part of our research and development costs are linked to activities which are subject to capitalisation. The intensity of the development activity and the different stages in the ongoing projects have an effect on the capitalisation ratio in any given quarter, therefore impacting the level of operating expenses that are capitalised on our balance sheet.
R&D investment (figures in million euros)
Oct-Dec
2016
Oct-Dec 2015
% Change
Full year 2016
Full year 2015
% Change
R&D investment1 184.7 171.4 7.8% 706.5 641.0 10.2%
As % of Revenue 17.0% 18.1% (1.1 p.p.) 15.8% 16.4% (0.6 p.p.)
1. Net of Research Tax Credit.
6.3.3 Taxes paid
Taxes paid in the fourth quarter of 2016 amounted to €151.1 million, €4.1 million lower than in the same period in 2015. For the full year 2016, tax payments amounted to €300.8 million, €25.1 million higher than €275.7 million paid in 2015. The increase in taxes paid in the year, which benefitted from a reduction in the effective tax rate vs. prior year, was mostly driven by (i) higher profit before taxes, (ii) a higher proportion of corporate taxes prepaid during the year, due to regulatory changes and (iii) corporate taxes paid by Navitaire.
6.3.4 Interest and financial fees paid
Interest payments under our debt arrangements amounted to €86.5 million in 2016, €23.2 million higher than in 2015. The net increase was a combination of (i) a higher average gross debt, (ii) a non-recurring fee from the cancellation of an interest rate swap and (iii) a lower average cost of debt following the bond refinancing in July 2016.
Page 45 of 54 amadeus.com
© 2
01
7 A
mad
eus
IT G
rou
p a
nd
its
affi
liate
s an
d s
ub
sid
iari
es
6.3.5 Free cash flow
Free cash flow increased substantially by €46.5 million or 60.8% in the fourth quarter of 2016. Full-year growth was 23.1%, amounting to €811.4 million of free cash flow in 2016. This increase was the result of an increase in the EBITDA and a higher cash inflow from working capital, partly offset by growth in capex, taxes paid and interest and financial fees paid in the period.
6.3.6 Equity investments
Equity investments amounted to €761.9 million in 2016. This cash outflow mainly relates to the acquisition of Navitaire. Equity investments in 2015 (€116.9 million) mostly correspond to the acquisitions of AirIT, Itesso, Hotel SystemPro and Pyton.
6.3.7 Cash to shareholders
In 2016, the cash outflow to shareholders, amounting to €362.5 million, corresponds to (i) a payment of €338.5 million related to the ordinary dividend of €0.775 per share (gross) on the 2015 profit, and (ii) €24.0 million related to the acquisition of treasury shares in the year, part of which were acquired to cover the exchange ratio related to the merger of Amadeus IT Holding, S.A. and Amadeus IT Group, S.A. (see section 6.1.9).
Page 46 of 54 amadeus.com
© 2
01
7 A
mad
eus
IT G
rou
p a
nd
its
affi
liate
s an
d s
ub
sid
iari
es
7 Investor information

Page 47 of 54 amadeus.com
© 2
01
7 A
mad
eus
IT G
rou
p a
nd
its
affi
liate
s an
d s
ub
sid
iari
es
7.1 Capital stock. Share ownership structure As of December 31, 2016, the capital stock of our company is €4,388,225.06 represented by 438,822,506 shares with a nominal value of €0.01 per share, all belonging to the same class, fully subscribed and paid in.
The shareholding structure as of December 31, 2016 is as described in the table below:
Shareholders Shares % Ownership Free float 436,858,714 99.55% Treasury shares1 1,521,273 0.35% Board members 442,519 0.10% Total 438,822,506 100.00%
1. Voting rights suspended for as long as the shares are held by the company. Includes treasury shares acquired to cover the exchange
ratio related to the merger of Amadeus IT Holding, S.A. and Amadeus IT Group, S.A. not yet delivered.
7.2 Share price performance in 2016
Key trading data
Number of publicly traded shares (# shares) 438,822,506 Share price at December 31, 2016 (in €) 43.17 Maximum share price in Jan - Dec 2016 (in €) (Oct 4, 2016) 44.93 Minimum share price in Jan - Dec 2016 (in €) (Feb 8, 2016) 32.96 Market capitalisation at December 31, 2016 (in € million) 18,944 Weighted average share price in Jan – Dec 2016 (in €)1 40.28 Average Daily Volume in Jan - Dec 2016 (# shares) 1,537,881
1. Excluding cross trades.
-2.0%
+5.9% +6.1%
+0.7%
+9.5%
Rebased to 100

Page 48 of 54 amadeus.com
© 2
01
7 A
mad
eus
IT G
rou
p a
nd
its
affi
liate
s an
d s
ub
sid
iari
es
7.3 Dividend payments The Shareholders’ General Meeting held on June 24, 2016 approved our annual gross dividend from the profit of the year 2015. The total value of the dividend was €340.1 million, representing a pay-out of 50% of the 2015 reported profit for the year, or €0.775 per share (gross). Regarding the payment, an interim amount of €0.34 per share (gross) was paid on January 28, 2016 and the complementary dividend of €0.435 per share (gross) was paid on July 28, 2016.
The Board of Directors of Amadeus IT Group, S.A held on December 15, 2016 proposed a 50% pay-out target ratio for the year 2016 (the maximum percentage within the 40%-50% approved pay-out range).
In June 2017, the Board of directors will submit a final gross dividend for approval to the General Shareholders Meeting of €0.94 per share, representing a 21.3% increase vs. prior year. An interim dividend of €0.40 per share (gross) was paid on February 1, 2017. Based on this, the proposed appropriation of the 2016 results included in our 2016 audited consolidated financial statements of Amadeus IT Group, S.A. and subsidiaries includes a total amount of €412.5 million corresponding to dividends pertaining to the financial year 2016.

Page 49 of 54 amadeus.com
© 2
01
7 A
mad
eus
IT G
rou
p a
nd
its
affi
liate
s an
d s
ub
sid
iari
es
8 Key terms _ “ACH”: refers to “Airlines Clearing House”
_ “CDP”: formerly “Carbon Disclosure Project”
_ “CRS”: refers to “Computerised Reservation System”
_ “DCS”: refers to “Departure Control System”
_ “DJSI”: refers to “Dow Jones Sustainability Index”
_ “D&A”: refers to “Depreciation and Amortisation”
_ “ECP”: refers to “European Commercial Paper”
_ “EIB”: refers to “European Investment Bank”
_ “EMS”: refers to “Environmental Management System”
_ “EPS”: refers to “Earnings Per Share”
_ “FM”: refers to “Flight Management”
_ “FTE”: refers to “full-time equivalent” employee
_ “GDS”: refers to a “global distribution system”, i.e. a worldwide computerised reservation system (CRS) used as a single point of access for reserving airline seats, hotel rooms and other travel-related items by travel agencies and large travel management corporations
_ “IATA”: refers to “International Air Transport Association”
_ “ICAO”: refers to “International Civil Aviation Organisation”
_ “IFRS”: refers to “International Financial Reporting Standards”
_ “IHG”: refers to “InterContinental Hotels Group”
_ “JV”: refers to “Joint Venture”
_ “KPI”: refers to “key performance indicators”
_ “LTM”: refers to “last twelve months”
_ “NDC”: refers to “New Distribution Capability”
_ “n.m.”: refers to “not meaningful”
_ “PB”: refers to “passengers boarded”, i.e. actual passengers boarded onto flights operated by airlines using at least our Amadeus Altéa Reservation and Inventory modules or Navitaire New Skies
_ “p.p.”: refers to “percentage point”
_ “PPA”: refers to “purchase price allocation”
_ “PP&E”: refers to “Property, Plant and Equipment”
_ “PSS”: refers to “Passenger Service System”
_ “PUE”: refers to “Power Usage Effectiveness”
_ “R&D”: refers to “Research and Development”
_ “RTC”: refers to “Research Tax Credit”
_ “TA”: refers to “travel agencies”
_ “TA air bookings”: air bookings processed by travel agencies using our distribution platform
_ “TA air booking industry”: defined as the total volume of travel agency air bookings processed by the global CRS. It excludes air bookings made directly through in-house

Page 50 of 54 amadeus.com
© 2
01
7 A
mad
eus
IT G
rou
p a
nd
its
affi
liate
s an
d s
ub
sid
iari
es
airline systems or single country operators, the latter primarily in China, Japan and Russia, which together combined represent an important part of the industry
_ “UNICEF”: refers to “United Nations Children’s Fund”
_ “XML”: refers to “eXtensible Markup Language”

Page 51 of 54 amadeus.com
© 2
01
7 A
mad
eus
IT G
rou
p a
nd
its
affi
liate
s an
d s
ub
sid
iari
es
9 Annexe. Amadeus social and environmental initiatives
The travel industry comprises diverse and interdependent sectors which together represent 9.8% of global GDP and 9.1% of worldwide jobs11. Connecting the travel ecosystem - travel providers, travel sellers and travellers - at every stage of the journey, Amadeus is in a privileged position to drive social and environmental responsibility initiatives, leveraging underlying technology capabilities, expertise and stakeholder relations.
Amadeus is supporting social inclusion and development, contributing to the wider effort of governments and non-profit organisations in addressing the global Sustainable Development Goals12.
Our strategy is to draw on our professionals and our position at the heart of travel to develop social responsibility projects that support education, development and welfare, among disadvantaged people in the countries where we operate. To do this, we engage the resources that make Amadeus unique: (i) advanced technologies applied to global travel, (ii) our people, their talent and time and (iii) our expertise, reach, partners and relationships in the global travel industry.
We develop our projects in three core programme areas: Amadeus Community Support, Amadeus Technology for Good, and Amadeus Knowledge & Skills Transfer in partnership with international development organisations, our customers, non-profit organisations, education institutions and local authorities.
In 2016, we supported the work of more than 200 non-profit organisations and education institutions in 63 countries. This resulted in 188 social development projects benefitting from a total of over ten thousand staff volunteer hours. We also made new progress in (i) fostering social innovation (pilot with UNICEF to explore the use of travel data analysis to help manage the spread of epidemics), (ii) facilitating digital literacy (520 computers donated worldwide to equip for example e-classes in rural primary and secondary schools in Sierra Leone) and (iii) providing skills to access employment opportunities in travel (more than 2,600 young people trained).
On the environmental front, our strategy is based on three pillars: (i) continuously improving the environmental performance of our operations, (ii) delivering solutions that contribute positively to the environmental performance of our customers and (iii) working in partnerships with other industry stakeholders towards a sustainable travel future.
11 In 2015, Travel & Tourism in total contributed US$7.2 trillion to world GDP (or 9.8% of total), and supported 284 million jobs, or 1 in 11
jobs in the world - WTTC Travel & Tourism Economic Impact 2016 (March 2016).
12 The Sustainable Development Goals, a UN initiative, is a set of seventeen aspirational Global Goals (e.g. Quality Education, No Poverty,
Decent Work and Economic Growth) and is officially known as “Transforming our world: the 2030 Agenda for Sustainable Development”

Page 52 of 54 amadeus.com
© 2
01
7 A
mad
eus
IT G
rou
p a
nd
its
affi
liate
s an
d s
ub
sid
iari
es
Internally, we look at our operations and aim to minimise our resource consumption and impact. In this respect, the energy efficiency program in our Data Centre in Erding (Germany) is particularly relevant. The Data Centre received the first certification from TÜV SÜD as an energy efficient centre in 2010. The certification was renewed in 2012 and in 2015 and is valid until 2018. The Power Usage Effectiveness (PUE)13 of the Data Centre in 2016 was 1.32. Since we started reporting PUE metrics in 2009 we have constantly improved our PUE from an initial value of 1.49 in 2009. In addition, the Amadeus Environmental Management System14 (EMS) monitors energy and resource consumption at our top 11 office sites worldwide, which include more than 80% of our total workforce and over 90% of the total estimated impact. The EMS also provides a basis for continuous improvement since best practices are identified and actions for improvement recommended.
Complementing our internal analysis by which we measure our performance in comparison to our resource consumption and efficiency of previous years, we benchmark our performance against internationally recognized sustainability indices. In this respect, Amadeus has been included in 2016 in the CDP15 A, improving our 2015 score. Additionally, Amadeus was included in the Dow Jones Sustainability Index (DJSI) for the fifth consecutive year and we received the maximum score of 100 points in two chapters within the environmental dimension of the DJSI questionnaire: reporting and policy/management system.
The second pillar of environmental initiatives analyses and fosters the environmental benefits of Amadeus’ products and services. Since Amadeus IT solutions generally improve operational efficiencies for our customers, some of these efficiencies also translate into significant environmental improvements. For example, the Amadeus Altéa Departure Control System Flight Management (DCS FM) module improves productivity and efficiency for airlines and it also reduces airlines’ fuel consumption. The sophisticated methodology that Altéa DCS FM uses to estimate the weight of the aircraft before the fuel is loaded is fundamental to optimize the amount of fuel uplift and aircraft fuel consumption. Furthermore, in 2016, our Airport Management solutions continued their successful deployment. These solutions enable, among other benefits, the reduction of aircraft taxi time at airports, reducing fuel consumption, noise, local pollution, greenhouse gases emissions and improving as well the use of airport infrastructure, particularly regarding aircraft de-icing processes. The Amadeus offering regarding the common use of IT infrastructure at airports also reduces energy consumption at airport buildings.
Finally, the third pillar of our environmental strategy consists in working together with other industry stakeholders to achieve industry environmental goals. In our partnership with the
13 Power Usage Effectiveness (PUE) is a common metric used to measure energy efficiency of data centres. The closer to 1 the PUE, the
more efficient the data centre is.
14 The parameters covered in the Amadeus Environmental Management System are energy consumption, greenhouse gas emissions, paper
consumption, water consumption and waste generation.
15 Formerly Carbon Disclosure Project.

Page 53 of 54 amadeus.com
© 2
01
7 A
mad
eus
IT G
rou
p a
nd
its
affi
liate
s an
d s
ub
sid
iari
es
International Civil Aviation Organisation (ICAO), we are developing solutions to keep travellers and other stakeholders informed about the estimated emissions per person of any flight covered by civil aviation, thanks to the use in Amadeus platforms of ICAO’s carbon calculator. In 2016, we have expanded our activities in the area of research and have entered into an agreement with Griffith University in Australia, one of the most important universities in the world regarding tourism related studies. As a result of our partnership, we provide aggregated travel related data to be used to measure and monitor travel industry sustainability. We have also jointly produced a report analysing the current status on Carbon Reporting in Travel and Tourism16. We look forward to further working with Griffith and other partners in future research work.
16 To access the full report on Carbon Reporting in Travel and Tourism, please click here.
Page 54 of 54 amadeus.com
© 2
01
7 A
mad
eus
IT G
rou
p a
nd
its
affi
liate
s an
d s
ub
sid
iari
es
Contacts For any other information please contact:
Ana de Pro Cristina Fernandez Chief Financial Officer Director, Investor Relations [email protected] [email protected] You can follow us on: AmadeusITGroup
investors.amadeus.com
Disclaimer
There may be statements in this financial report which are not purely historical facts, including statements about anticipated or expected future revenue and earnings growth. All forward looking statements in this presentation are based upon information available to Amadeus on the date of this presentation. Any forward looking statements involve risks and uncertainties that could cause actual events or results to differ materially from the events or results described in the forward looking statements. Amadeus undertakes no obligation to publicly update or revise any forward looking statements, whether as a result of new information, future events or otherwise. Readers are cautioned not to place undue reliance on forward looking statements.