Embed Size (px)
Citation preview

SugarHII
(""· 1· 'i' (..... i\ ·r·\ ·r r ·=· J... ·r I i -i"' I ! .. 'i i
\,., .,._. ,..J ,1, i t\ ,1, - J. ..J .a..,E
2016
HOUSING STUDY

Page | 1
Acknowledgements
City of Sugar Hill City Council
Steve Edwards, Mayor
Brandon Hembree, Mayor Pro Tem
Marc Cohen
Susie Gajewski
Curtis Northrup
Mike Sullivan
City of Sugar Hill Planning Commission
Rosemary Walsh
Todd Herion
Julie Adams
Jeremy White
Barry Pullen
Consultant Team
Christopher Wallace, Munilytics
Michelle Mellgren, The Mellgren Planning Group
Rebekah Brightbill-Dasari, The Mellgren Planning Group
City of Sugar Hill Staff
Paul Radford, City Manager
Kaipo Awana, Director of Planning and Development
David van de Weghe, Planner
Susan Puri, Planner

Page | 2
Contents Acknowledgements ....................................................................................................................................... 1
Executive Summary ....................................................................................................................................... 3
Introduction .................................................................................................................................................. 5
Existing Conditions ........................................................................................................................................ 6
Data Projections and Analysis ..................................................................................................................... 14
Community Input ........................................................................................................................................ 31
Resident Survey....................................................................................................................................... 31
Public Workshop ..................................................................................................................................... 40
Discussion of Trends ................................................................................................................................... 42
Opportunities and Constraints .................................................................................................................... 44
Recommendations ...................................................................................................................................... 46
Work Plan FY2016-2020 .............................................................................................................................. 49
Appendix A – Munilytics Data ..................................................................................................................... 51
Appendix B – Survey (English and Spanish) ................................................................................................ 96
Appendix C – Workshop Exercises ............................................................................................................ 100
Appendix D– Model Foreclosure Ordinance ............................................................................................. 102


Page | 3
Executive Summary
Sugar Hill has become successful due mostly to the vision and grit of our friends and neighbors who have chosen to make their home here—Sugar Hill’s principal shareholders. The Mayor and City Council recognize that the quality of our neighborhoods is critically important to the continued success of our community. With Passion for keeping Sugar Hill a great place to live and do business, Vision for making it even better, and Creative leadership to see that it remains a stable, fun, and premiere place to call home, the Mayor and City Council are committed to ensure that the City delivers the finest quality services related to Housing. This study is the result of leadership conversations focused on issues related to community development and is intended to study key elements in demographic and economic trends, as well as community preferences and values. Analysis and recommendations conducted in the pursuit of this study will be useful to inform City leaders when making policy decisions in the areas of housing, community, and economic development. Three dominant trends emerged from the synthesis of data:
• There is a need for more diversity in choices for housing. • Visual integrity of neighborhoods is a highly important issue to our residents. • Sugar Hill wants to be more connected and walkable.
Need Diverse Choices It is expected that the city will see an increase in residents in the 65+ age group and in the age group between 35 and 44, which includes affluent professionals and young families. Increasing home values may exacerbate an existing shortage of housing for moderate and very low income households, including a shortage of rental housing, particularly for the Millennial generation, as Sugar Hill proves to be a desirable place for this demographic as they begin to form new households. Encouraging a diversity of dwelling sizes and types in the City will also assist the Baby Boomers to age in place. Smaller unit sizes provided by townhomes or traditional apartment-style units with little required maintenance and upkeep by residents are preferable for many retired seniors and millennials that do not want the responsibilities associated with detached single family homes. Maintain Visually Appealing Neighborhoods Community workshops indicated that among other issues yard upkeep and exterior maintenance are widely shared community values, suggesting broad support for new or reinvented code enforcement and property maintenance assistance programs. Although a majority of the city’s neighborhoods are in excellent condition, deteriorating conditions have been noted in a few specific areas of the city. These issues are primarily cosmetic at this point; however, code enforcement of exterior maintenance and landscaping standards could help stymy any further decay or destabilization of property values in older areas of the city. Build Walkable and Connected Neighborhoods

Page | 4
Overall, the primary housing priorities for the city of Sugar Hill appear to be focused on providing sufficient housing choices for the growing population over 65 years of age, as well as meeting the needs of the affluent professionals and families that continue to migrate to the City. Promoting a greater variety of housing choices, including apartment-style units, townhouses, and smaller single family houses, as well as promoting pedestrian-oriented, mixed-use developments in the proper context would allow for residents to more easily age in place and additionally meet the needs of millennials that tend to favor renting over homeownership. Additionally, these more compact housing types can be easily incorporated into mixed-used, walkable communities with more integrated access to basic neighborhood amenities and regional medical facilities. Key Recommendations The findings detailed in this report culminate in a list of recommended action items and suggestions for areas in which more detailed study is necessary. This five-year work program is based on a synthesis of demographic, economic, and housing data with survey and workshop results to ensure that the outcomes reflect widely shared community values. What follows is a selection of the most significant elements from the work program:
• Establish regular update cycles for visual assessment of housing stock. • Increase frequency of zoning and maintenance inspections in strategic areas of the City. • Coordinate public awareness campaigning with code enforcement initiatives. • Update landscape and architectural design standards. • Consider form based coding for appropriate areas, particularly within the Downtown. • Evaluate the appropriateness of accessory dwellings, zoning incentives for senior
housing, universal design standards, and complete streets standards. • Perform suitability analysis for residential development (infill and new) and coordinate
with planning strategies related to annexation and zoning policies. • Identify, inventory, and assess the supply of personal care homes in the area.
A thorough to-do list associated with these findings is included at the end of this report as a practical guide which will be useful for budget planning and project management.

Page | 5
Introduction The City of Sugar Hill is located in Gwinnett County, Georgia, approximately 40 miles northeast of Atlanta. What is now the eastern side of the City was incorporated in 1939 and has expanded generally westward through annexations. Because the annexations have occurred parallel with residential development, the municipal boundary is irregular with multiple enclaves. The City has experienced an estimated population growth of approximately 10.5 percent between 2010 and 2015. That trend is expected to continue and increase slightly to 12.5 percent, at least until the year 2030. The City can be described as an affluent, suburban, family-oriented community largely comprised of single family detached homes, but the forecast through 2030 indicates an increasing older population. A series of new projects will be completed over the next five years that will drastically transform the downtown area. The City has sought to invest and attract walkable commercial, recreation, entertainment and residential properties in order to revitalize the core business district. Most recently upgraded is the Bowl at Sugar Hill, an outdoor amphitheater and concert venue overlooking a naturalistic storm water pond and plaza area that will eventually include a splash pad and family plaza. Construction of the EpiCenter, directly adjacent, will commence this spring with an expected December 2017 opening. This facility will include a performing arts theater with 300+ seats, a 32,000 square foot recreation center and gymnasium, and over 43,000 square feet of retail, restaurant, and office space. Additionally, the old City Hall has been converted into the Suite Spot @ Sugar Hill, a small business incubator and co-working space with leasable office suites for start-ups or home businesses. A bicycle and pedestrian greenway (the Sugar Loop Greenway) to connect downtown Sugar Hill with community parks is also in the early planning stages. Within the immediate downtown vicinity, several private sector projects should break ground in the next six to twelve months. This will include high-end senior independent living units, millennial housing and over 100,000 square feet of restaurant, office, and retail space. A hotel, conference center, and niche grocery store are also in the immediate construction plans. Outside of the downtown area, 71 acres of land was acquired by the City near the Chattahoochee River that will primarily be conserved in a natural state, but may also include a future retreat facility and low impact outdoor recreation opportunities. City leaders have recognized the opportunity to integrate a cohesive housing plan into the overall vision for the City. As a result, the City of Sugar Hill engaged Munilytics and The Mellgren Planning Group to conduct detailed research on demographics, economics, and housing issues as well as public surveys and a workshop to gain insight on current housing conditions and assist City decision makers in determining the most urgent planning priorities related to its housing policies.


Page | 6
Existing Conditions An overview of current conditions in the City of Sugar Hill is described in this section. The information is a combination of statistical data, as well as two separate physical surveys conducted in the City. The statistical data were taken from the American Community Survey (ACS) 2013, as prepared by the U.S. Bureau of Census. The ACS is an ongoing statistical survey that samples a small percentage of the population to measure trends in demographic information and overall community profile. The ACS data are used in conjunction with decennial census data to extrapolate projections of change in future years. This existing conditions section of the housing study is intended to provide a current snapshot of the demographics of Sugar Hill, and, therefore, uses 2013 ACS data, which are more current than those of the 2010 U.S. Census. Following this section is a presentation of data projections and analysis of those data. That section uses a variety of statistical tools, which may include the ACS data, but uses 2010 U.S. Census data as its baseline, and then projects on a quinquennial basis. Population - The 2013 American Community Survey data below describes the population of the Sugar Hill community. The population of Sugar Hill, according to the ACS 2013 survey, was 19,138 residents. This compares to the U.S. Census 2010 survey that showed the population as 18,522 persons- a 3.3 percent increase. Income - Residents of Sugar Hill are more affluent as a whole than residents of nearby Atlanta. Although the per capita income is higher in Atlanta, the median household income in Sugar Hill is $66,235, compared to $46,631 in Atlanta. The distribution of income per household in the City is shown in Figure 1, contained on the following page. As these data show, income tends to cluster in the upper income brackets in Sugar Hill. 24.3 percent of Sugar Hill residents earn under $35,000 per year, and 44.9 percent earn over $75,000 per year. In Atlanta, 41.2 percent earn under $35,000 per year, and 32.9 percent earn over $75,000 per year. By comparison to Atlanta, the City of Sugar Hill is affluent.

Page | 7
Figure 1. – Household Income in Sugar Hill
Source: U.S. Bureau of Census, 2013. Age - Residents of Sugar Hill tend to be younger than those of Atlanta, where 26 percent of the population is 35 to 54 years of age. In Sugar Hill, however, 33 percent of the population is within this same age range. The distribution of age across the population of the City of Sugar Hill is depicted in Figure 2. Figure 2. – Age of Sugar Hill Residents
Source: U.S. Bureau of Census, 2013.
0
200
400
600
800
1000
1200
1400
Less than$10,000
$10,000 to$14,999
$15,000 to$24,999
$25,000 to$34,999
$35,000 to$49,999
$50,000 to$74,999
$75,000 to$99,999
$100,000to
$149,999
$150,000to
$199,999
$200,000or more
0
500
1000
1500
2000
2500
3000
3500
4000
Under5 years
5 to 9years
10 to14
years
15 to19
years
20 to24
years
24 to34
years
35 to44
years
45 to54
years
55 to59
years
60 to64
years
65 to74
years
75 to84
years
85yearsandover

Page | 8
The data shown in Figure 2 indicate that the highest concentration of age groups is between the ages of 24 and 54. This unified age group also represents the child bearing and rearing years, substantiating the fact that Sugar Hill is a family-oriented community. Household Size – Figure 3 shows the distribution of household size in Sugar Hill. As the data indicate, the majority of households --- 56 percent --- are comprised of 3 or more persons. This is consistent with the conclusion reached from the data contained in Figure 2 regarding age. Specifically, the City is attractive for families. Figure 3. – Household Size in Sugar Hill
Source: U. S. Bureau of Census, 2013. Housing Tenure – Data from the U.S. Bureau of Census show that 91.9 percent of all housing units are occupied. Of the occupied units, 82 percent are owner-occupied, and less than 10 percent are rental units. Figure 4, contained on the following page, provides a graphic representation of the proportion of owner-occupied units to renter-occupied units. The distribution of owner-occupied housing is mapped on Figure 5. The darker the color, the higher is the percentage of owner occupancy. As Figure 5 indicates, the greatest level of renter-occupied properties occurs in the oldest part of Sugar Hill; on the east side of the City.
16%
28%
19%
21%
10%
4% 2%
1-person household 2-person household
3-person household 4-person household
5 person household 6-person household
7-or-more person household

Page | 9
Figure 4. – Housing Tenure in Sugar Hill
Source: U.S. Bureau of Census, 2013. Figure 5. – Distribution of Percentage of Owner Occupancy
Source: ESRITM Community Analyst.
82%
18%
Housing Tenure
Owner-occupied Renter-occupied

Page | 10
As stated above, 8.1 percent of the housing units in Sugar Hill are vacant. Figure 6 graphically displays the distribution of vacant housing units. The lightest color indicates a 1 percent or less vacancy rate, while the darkest color indicates a vacancy rate of 12 percent to 15 percent.
Figure 6. – Distribution of Vacant Housing Units
Source: ESRITM Community Analyst.
Condition of Housing Stock – Two windshield surveys have been completed. One survey was conducted on November 6, 2015, and provided a general overview of the housing stock. The neighborhoods that were evaluated included a mix of new single family subdivisions in northwest and south Sugar Hill; single family subdivisions on the east, built in the 1980s; several 1960s and 1970s subdivisions on the east side of the City; and a townhome development in

Page | 11
west central Sugar Hill. Overall, the condition of the housing stock is quite good, with a few exceptions, which are noted below in the discussion of the survey conducted by City staff. Overall, this visual survey of the City resulted in several observations. Some of the deteriorated conditions were cosmetic only in nature but, nevertheless, contributed to the apparent substandard conditions. This included, for example, lack of landscaping or landscape maintenance, unscreened storage of trash cans or personal items, and tin foil or shower curtains in windows used for privacy. Issues such as these can be addressed and are included in the recommendations section of the report. In one or more of the newer subdivisions, foundation plantings were minimal, yard trees were not consistently provided, and utility boxes were unscreened. The City could benefit from more comprehensive landscape and architectural design standards for residential development to ensure a variation in architecture and color palettes. The second survey was completed by City staff, and the report documents housing conditions in detail. Over 4,000 units in older communities were analyzed to determine the level of maintenance. A scoring worksheet was created and points assessed to homes in six categories of roof, chimney, siding, windows and doors, foundation and yard. The greater the signs of maintenance required, the more points were awarded. Scoring was weighted to assess more points to important structural features like the roof and foundation. Cosmetic elements of the home, such as the yard, were weighted to be less important. Overall, more than 97 percent of the structures surveyed were well maintained. There were four areas, however, that exhibited signs of disrepair. These are as follows:
• Level Creek Hollow subdivision, off Level Creek Rd.
• Parkview North and Parkview East subdivisions, off Level Creek Rd.

Page | 12
• Subdivisions South East of Highway 20 and Peachtree Industrial Blvd. around Railroad Ave., in the Lanier Forest subdivision and surrounding properties, many of which are so old that they are not associated with a subdivision name in City GIS records.
• The Oaks at Lanier, located between Whitehead Rd. and Highway 20.

Page | 13
In examining the location of these areas compared to the distribution of owner-occupied units, there does not appear to be any direct correlation between occupancy type and the condition of the housing stock. It is not unusual to associate poor housing condition with absentee landlords. In this instance, however, the data do not clearly indicate that that this is the case. More likely, it can be attributed to the age of structures in combination with a recovering economy. Older houses require more maintenance that may have been postponed for economic reasons.
(Continued)

Page | 14
Data Projections and Analysis A variety of data sources was utilized to derive the population estimates and forecasts of key demographic indicators, which are contained in this section. These include ESRI TM Community Analyst, long-term market data analysis, public opinion surveys, and public workshops.1 Estimates and forecasts of current and future demographic measures are based upon the City’s current municipal boundaries and do not include any annexation of unincorporated areas that may occur. Forecasting is based upon 2010 U.S. Census Bureau data, ESRI™ 2015 growth estimates (which are based on 2010 Census and 2013 American Community Survey data), and ESRI™ 2020 projections. The growth factors from 2010 to 2020 were used to estimate the key demographics for 2025 and 2030. Table 1 provides the actual, estimated, and forecasted key demographic indicators for the City of Sugar Hill. Table 1. - Actual, Estimated and Forecasted Key Demographic Information for the City of Sugar Hill 2010
Census 2015 Estimate
2020 Forecast
2025 Forecast
2030 Forecast
Population 18,522 20,492 22,674 25,529 28,743 Households 6,114 6,693 7,367 8,110 8,928
Owner Occupied Units 5,027 5,382 5,922 6,326 6,785 Renter Occupied Units 1,087 1,311 1,445 1,784 2,143 Median Income $70,106 $78,389 $88,106 $96,867 $105,867
Families 4,832 5,284 5,784 6,217 6,803 Average Household Size 3.03 3.06 3.07 3.15 3.22 Median Age 33.50 35.30 35.50 35.90 36.10 Per Capita Income $27,119 $29,934 $33,686 $36,813 $40,097
1 Community Analyst is a web-based program that applies Geographic Information Systems technology to an array of data and creates maps and graphics that illustrate the data.

Page | 15
Table 2 shows the projected growth in Sugar Hill compared to Georgia and the rest of the United States. Table 2. - Projected Growth Trends: 2015-2020
As these data show, the City will see growth in both its population and households. The number and percentage of those renting homes will increase by 1,056 units and from 18 percent of the housing stock to 24 percent. This does not necessarily indicate that there is a demand for apartments or other multi-family units, but more likely will reflect a current trend away from home ownership by Millennials.
The City is also likely to see its median age and median household income increase. Age will increase slightly to 36.1 years in 2030 from its current estimate of 35.3 years, with incomes growing from approximately $70,000 to amounts approaching $106,000. As the Atlanta area continues its high growth rate, the demand for housing in the suburban ring will grow with it. The City is likely to see a continuance of urban emigration to the community, most likely by more affluent professionals. As noted in Table 3, contained on the following page, the short-term estimate of household income indicates that growth will occur in the $100,000 to $200,000 and above income groups.

Page | 16
Table 3. - Household Income Estimates, Forecasts by Income Ranges for City of Sugar Hill
923 12.5%$200,000+ 487 6.6%$150,000 - $199,999
1,308 17.8%$100,000 - $149,999 1,752 23.8%$75,000 - $99,999
574 7.8%$50,000 - $74,999 1,209 16.4%$35,000 - $49,999
275 3.7%$25,000 - $34,999 347 4.7%$15,000 - $24,999
Number Percent<$15,000 490 6.7%
2020 Households by Income
$29,934Per Capita Income
$78,389Average Household Income $92,243Median Household Income
381 5.7%$200,000+
1,360 20.3%$150,000 - $199,999 675 10.1%$100,000 - $149,999
1,178 17.6%$75,000 - $99,999 1,135 17.0%$50,000 - $74,999
441 6.6%$35,000 - $49,999 607 9.1%$25,000 - $34,999
8.0%$15,000 - $24,999 379 5.7%
Number Percent<$15,000 538
Sugar Hill city,...2015 Households by Income
Sugar Hill C ity, GA Prepared by MunilyticsSugar Hill city, GA (1374180)
Demographic and Income Comparison Profile
Population Forecasts By Age Segments - Using the most recent national Census forecasts by age, and applying those trends to Sugar Hill’s current estimated population profile, the following forecast was developed in Table 4 below.
Table 4. – Population Forecasts by Age Segments for Sugar Hill
Population Number Percent Number Percent Number Percent Number Percent Number Percent0 - 4 1,559 8.4% 1,593 7.8% 1,744 7.7% 2,001 7.8% 1,968 6.85%5 - 9 1,750 9.4% 1,813 8.8% 1,917 8.5% 2,279 8.9% 2,359 8.21%
10 - 14 1,654 8.9% 1,786 8.7% 2,021 8.9% 2,049 8.0% 2,235 7.77%15 - 19 1,280 6.9% 1,364 6.7% 1,504 6.6% 1,640 6.4% 1,530 5.32%20 - 24 851 4.6% 1,138 5.6% 1,143 5.0% 1,281 5.0% 1,281 4.46%25 - 34 2,611 14.1% 2,459 12.0% 2,804 12.4% 2,810 11.0% 2,597 9.04%35 - 44 3,452 18.6% 3,546 17.3% 3,881 17.1% 5,215 20.4% 6,224 21.65%45 - 54 2,713 14.6% 3,056 14.9% 3,135 13.8% 2,896 11.3% 3,561 12.39%55 - 64 1,533 8.3% 2,091 10.2% 2,401 10.6% 1,701 6.7% 1,306 4.54%65 - 74 729 3.9% 1,089 5.3% 1,433 6.3% 1,949 7.6% 2,248 7.82%75 - 84 321 1.7% 431 2.1% 540 2.4% 1,509 5.9% 2,990 10.40%
85+ 69 0.4% 125 0.6% 151 0.7% 199 0.8% 444 1.54%Totals 18,522 100.0% 20,491 100.0% 22,674 100.0% 25,529 100.0% 28,743 100.00%
2015 2020 2025 20302010

Page | 17
Figure 7. – Population Forecasts by Age Segments for Sugar Hill
Of particular note, the City’s population profile will age through each band. The age groups of 65 to74 will nearly double. The 75 to 84 age group will increase by nearly 10-fold through 2030. A complete population demographic profile can be found in Appendices A.1 through A.9. Housing Profile - The demand for housing over the short-term is estimated to be about 674 units, with 540 being owner-occupied, and 134 being rented. The City will see a substantial decrease in homes of less than $149,999 and increases in homes worth over $200,000. The median value of homes will increase by $30,492 to $223,985. Table 5, which is contained on the following page, shows this short-term forecast (with full housing data available in Appendices A.10 and A.11).
0%
20%
40%
60%
80%
100%
20102015
20202025
2030
85+
75 - 84
65 - 74
55 - 64
45 - 54
35 - 44
25 - 34
20 - 24
15 - 19
10 - 14
5 - 9
0 - 4

Page | 18
Table 5. - City of Sugar Hill Changes In Housing Profile, 2015-2020
Using the American Community Survey’s 2009-2013 Detailed Housing information and projections of population previously noted, the various elements of the City’s housing stock were forecasted in five-year bands through 2030, and are contained in Table 6, which is on the following page.

Page | 19
Table 6. - Forecasts of Housing Stock Elements, 2015 – 2030, for Sugar Hill

Page | 20
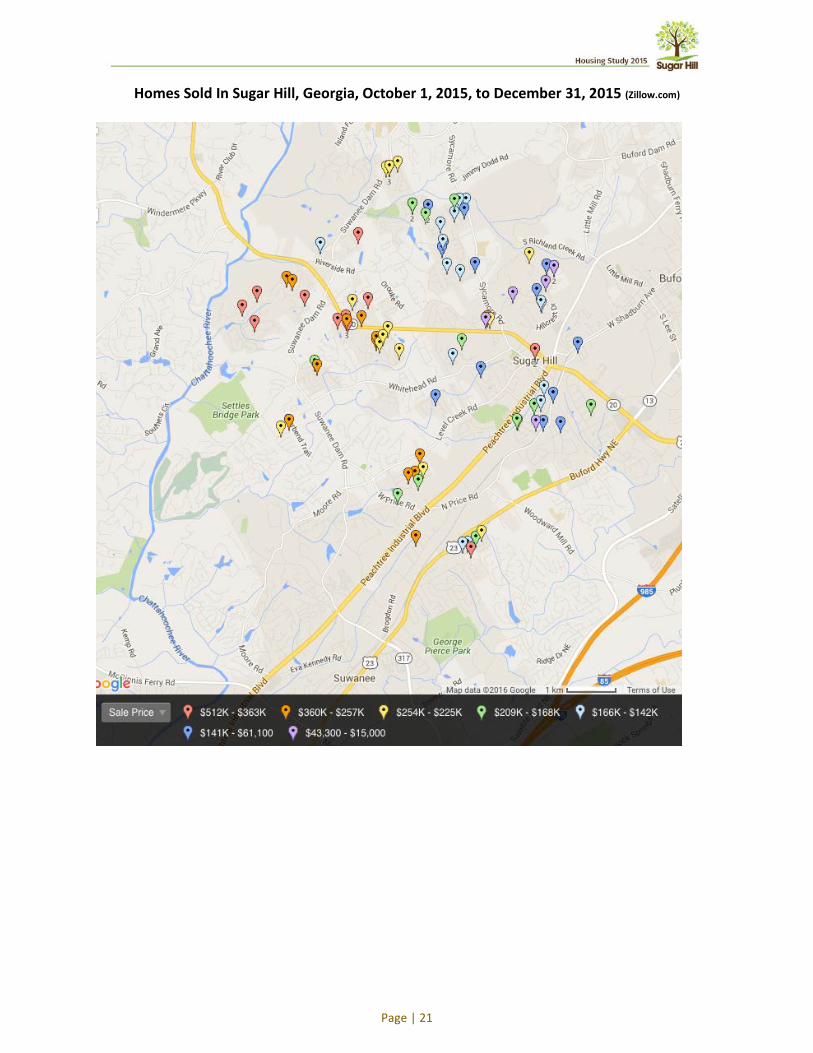
Comparing the changes in the age segments previously detailed to the forecasts of housing stock above, it appears that the demand for senior or assisted living facilities will exceed the supply. Table 4, Population Forecasts by Age Segments for Sugar Hill, noted that the age demographic for Sugar Hill will trend toward growth in the elderly population. Survey results indicate that for those elderly wishing to remain in Sugar hill, housing choices are limited. Results of our review of the assisted living facilities licensed by the State of Georgia were in short supply within the City, as were housing communities geared toward this demographic. At the same time, the percent of the population of less than 20 years of age will decrease from 34 percent to 28 percent of the total population between 2010 and 2030, while the population of those aged 65 or older will increase from 6 percent to 20 percent of the population between 2010 and 2030. Also, between 2010 and 2030, Sugar Hill will likely see a healthy demand for homes with values exceeding $200,000, with the largest increase coming from homes between $200,000-$299,000. The City is forecasted to see demand for homes priced between $200,000 and $499,999 of almost 4,300 units. The median home value will increase to $341,000 from its current estimated value of approximately $193,000. The home values will reflect the wealth or income of the buyers, which has been projected to increase during this period. Housing Market Sales Data – A review of recent Multiple Listing Service data for properties indicated that the market is fairly strong and housing is available for a wide range of incomes. Appendix A.12 details recent listing prices and types of housing available. During the period of October 1, 2015, to December 31, 2015, there were 91 homes sold with a median sale price of $192,000, which is a 13.5% increase over the 2013 estimate of $169,100. The range of homes sold went from a low of $15,000 for an 800 square foot, 2-bedroom, 1-bath home built in 1966 to a $512,500 home that is 5,659 square feet and has 5 bedrooms and 5 bathrooms. The sales indicate homes across a wide range of affordability. The following map shows the location of the homes sold :
(Continued)
Page | 21
Homes Sold In Sugar Hill, Georgia, October 1, 2015, to December 31, 2015 (Zillow.com)

Page | 22
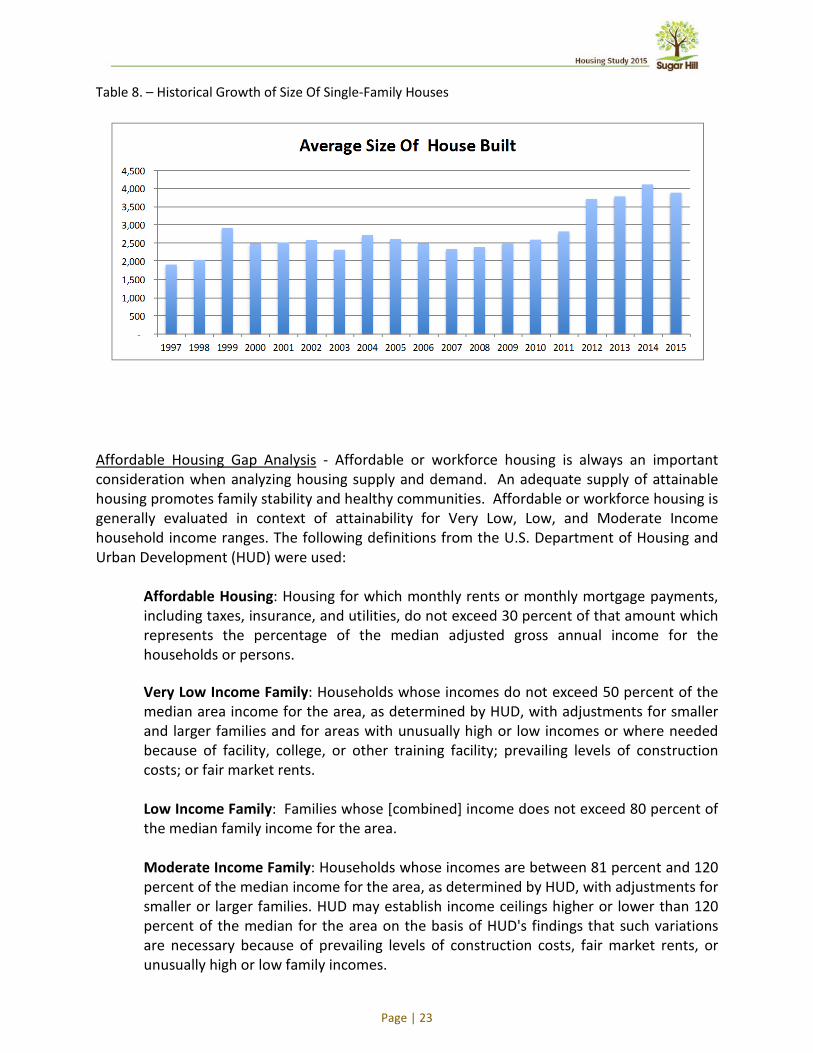
Permits Issued For New Home Construction - The City had fairly consistent growth up to and through the housing boom that ended with the Great Recession that began at the end of 2007. Table 7 shows the number of new residential single-family building permits, which have been fewer, but increased steadily since then. Table 7. – Single Family Building Permits in Sugar Hill
Recent trends indicate that the average house size built has increased since 2007. We expect the City will continue to see homes of the most recent years continue to be in demand. Table 8 illustrates the growth in house size being built since 1997, when the average was slightly under 2,000 square feet, to the most recent year, 2015, when the average house size built was slightly less than 4,000 square feet, or about twice the size built in 1997.
0
50
100
150
200
250
300
350
400
Year1997
Year1998
Year1999
Year2000
Year2001
Year2002
Year2003
Year2004
Year2005
Year2006
Year2007
Year2008
Year2009
Year2010
Year2011
Year2012
Year2013
Year2014
Page | 23
Table 8. – Historical Growth of Size Of Single-Family Houses
Affordable Housing Gap Analysis - Affordable or workforce housing is always an important consideration when analyzing housing supply and demand. An adequate supply of attainable housing promotes family stability and healthy communities. Affordable or workforce housing is generally evaluated in context of attainability for Very Low, Low, and Moderate Income household income ranges. The following definitions from the U.S. Department of Housing and Urban Development (HUD) were used:
Affordable Housing: Housing for which monthly rents or monthly mortgage payments, including taxes, insurance, and utilities, do not exceed 30 percent of that amount which represents the percentage of the median adjusted gross annual income for the households or persons. Very Low Income Family: Households whose incomes do not exceed 50 percent of the median area income for the area, as determined by HUD, with adjustments for smaller and larger families and for areas with unusually high or low incomes or where needed because of facility, college, or other training facility; prevailing levels of construction costs; or fair market rents. Low Income Family: Families whose [combined] income does not exceed 80 percent of the median family income for the area. Moderate Income Family: Households whose incomes are between 81 percent and 120 percent of the median income for the area, as determined by HUD, with adjustments for smaller or larger families. HUD may establish income ceilings higher or lower than 120 percent of the median for the area on the basis of HUD's findings that such variations are necessary because of prevailing levels of construction costs, fair market rents, or unusually high or low family incomes.

Page | 24
Using the American Community Survey’s most recent 2009-2013 5-year Detailed Housing Estimates for the City of Sugar Hill, the data were applied to the affordable housing model template using the assumptions of a 3 percent down payment and a 4.25 percent interest rate for persons of fair credit. The results of that modeling, as shown in Table 9, show that there currently exists shortages of affordable housing for home ownership in the Moderate Income bracket and shortages of rental units for Very Low Income and Moderate Income individuals.
Table 9. – Housing Affordability Gap in Sugar Hill
This analysis is dependent upon the self-reported household median income figures in the U.S. Bureau of Census questionnnaire. The Census income figures do not include government cash transfer payments or other forms of assistance provided to low income households and, therefore, understates the amount of money available to households. For instance, the federal government’s Earned Income Tax Credit (EITC) program provides direct cash assistance to households with earned incomes of up to $53,505 in payments of up to $6,269. Other forms of public assistance are likewise not included in the definition of household income. In evaluating gaps in affordable housing, the City should look to see what impact is currently being made by these programs. Including these cash transfer payments and housing assistance programs in the definition of median household income may reduce or eliminate some of the gaps that may exist. It should also be kept in mind that these residents currently have housing, but they may be paying more than 30% of their household income for it, thus making them cost burdened for their housing needs.
Lending and Impediments To Borrowers –The 2014 Federal Financial Institutions Examination Council (FFIEC) data were reviewed for Census Tracts located within the City of Sugar Hill. Not

Page | 25
all Census Tracts had loans reported for them. This does not necessarily indicate an absence of loans, but a possible coding issue by the financial institutions. 843 loans were originated and, of these, 129 or 15.3 percent were denied. The residential lending market in the community is firm and the denial rate is not out of the ordinary, given current market conditions. Borrowers with good credit or better can expect to receive favorable terms from lenders ready to finance housing in the community. The income levels reported for the loans are stated as a percent of the greater Atlanta Metropolitan Statistical Area (MSA). The Atlanta MSA had a median Income in 2014 of $58,420, which is approximately 75 percent of Sugar Hill’s median of $78,389. Table 10, which is contained on the following page, summarizes the loan information that was reported for 2014.
Table 10. – 2014 Lending Statistics For Sugar Hill Census Tracts

Page | 26
Impediments And Barriers For Low and Moderate Income Households - Sugar Hill residents with Low and Moderate incomes (defined as 80 percent and 120 percent, respectively, of the City’s median income) can expect to face several barriers due to either limited availability of financing or limited affordable housing stock. Some of these issues are associated with a lack of sufficient income, and some can be overcome through the development of homebuyer education and resource programs. While there is no data specific to Sugar Hill, the issues identified below are nearly universal throughout the country. Lending Issues - Poor credit histories are common with lower income homebuyers. This results in denial of credit to many borrowers. The calculated real denial rate for low credit profile applicants is 39 percent (Urban Institute, 2014). Many credit decisions are automated and lenders do not generally devote the resources to work with marginal borrowers. Lower income households are less likely to understand credit scoring and its impact on future financial transactions. People with lower credit scores can also expect to pay higher interest rates that, in turn, reduces the amount of housing they can afford. Homeowners’ insurance rates can also be tied to credit history, which may increase the cost of homeownership. Predatory lenders often target homebuyers seeking affordable housing and may offer harmful financial products or work with appraisers in ways that are detrimental to the borrower. Borrowers with poor credit may also be less likely to work out alternative payment options when they fall into arrears due to lack of familiarity with the banking system. Thus, they face higher foreclosure rates than persons with good or excellent credit, unless they receive homebuyer education before entering into a home purchase. Homebuyer education and financial counseling programs can identify higher risk homebuyers, prevent homebuyers from entering into predatory lending arrangements, and prepare homebuyers to make financially wise decisions. Housing Stock Issues - Particularly for low income households, quality housing stock is generally depleted for affordable rental and owner-occupied units. Land prices and development costs in urban areas may prevent new housing stock from being built for lower income renters and buyers. In suburban areas, the land development regulations that dictate lot size and density may prohibit the development of diverse housing stock. To facilitate the development of diverse housing stock, municipalities can evaluate their land development regulations to allow diverse housing development, and pursue construction, rental, and downpayment subsidies to provide developers an economic incentive for to construct new rental units at a rate attainable for low income renters and buyers. Societal and Governmental Issues - Strong opposition to the construction of new affordable housing near existing neighborhoods is not uncommon, as existing homeowners may perceive it as detrimental to community appearance, home value, and school quality. Development regulations regarding lot size, set backs, landscaping, and other new development issues discussed above can drive up the cost of building at attainable housing price points—or prohibit the development of diverse housing types. Proactive housing development regulations and incentive programs can elevate the quality of affordable housing developments to reduce possible negative community perceptions. Rental and Homeownership Issues - Racial minorities and renters with lower incomes often encounter differential treatment, even as protected classes of citizens. While not necessarily

Page | 27
specific (or applicable) to Sugar Hill, landlords may discriminate because of age (young or elderly householders), ethnicity, income, disability, or family status. Many landlords, particularly those with limited staff, do not have employees familiar with fair housing law. Dissemination of federal fair housing information to landlords can help address these potential issues. Special Needs and Assisted Housing - The 2013 U.S. Census American Community Survey (ACS) has estimated the number of persons with disabilities for people living in the Buford-Sugar Hill area. The categories of “With a self-care difficulty” and “With an independent living difficulty” may indicate the percentage of the population needing special housing. Table 11, contained on the following page, highlights the areas of the population that may need assistance with their housing needs.
Table 11. - Population With Disabilites in Buford-Sugar Hill Area
Source: U.S. Bureau of Census American Community Survey, 2013, Buford-Sugar Hill Census County Division (CCD)2.
2 A Census County Division (CCD) is a subdivision of a county used by the United States Census Bureau for the purpose of presenting statistical, decennial census data. The Buford-Sugar Hill CCD includes the majority of the population of the cities of Buford and Sugar Hill, as well as the town of Rest Haven. A small portion of Sugar Hill is included in the Suwanee-Duluth CCD.

Page | 28
Unfortunately, the data are not available for the City of Sugar Hill alone. ACS estimates indicate that 10.1 percent of the population has a disability and that 68.3 percent of that population has a disability that is either “ambulatory difficulty”, “self-care difficulty”, or “independent living difficulty”. Based on Sugar Hill’s current estimated population, it may be inferred that there are an estimated 2,070 persons with disabilities in the City and that, of those individuals, 1,414 of those have ambulatory, self-care, or independent living difficulties. Table 12, contained on the following page, details the estimated Sugar Hill population with disabilities. Table 12. - Estimated and Forecasted Population With Disabilities in Sugar Hill

Page | 29
It is important to note that the sum of each individual category may be greater that the total estimated population. This occurs because respondents may have co-occuring disabilities (e.g., someone may have both hearing and vision difficulties). For the purposes of evaluating special needs housing, it may be more useful to evaluate only those categories where the individual has an independent living difficulty, as shown in Table 13, contained on the following page.
Table 13. - Estimate and Forecasts of Sugar Hill Residents With Independent Living Difficulties
2015 2020 2025 2030
725 802 903 1,016 The State of Georgia maintains a list of special needs facilities that are located in Sugar Hill and licensed by the State of Georgia, together with the number of beds available. These data are shown in Table 14. Table 14. – Special Needs Facilities in Sugar Hill
Name Address Capacity TypeBenton House of Sugar Hill 6009 Suwanee Dam Road 72 Personal Care HomeWisdom Well 5798 Suwanee-dam Road 3 Personal Care HomeEdlyn Care Services 110 Danie Creek Lane 3 Community Living Arrangement
There are only 78 licensed beds in the City of Sugar Hill. Possible explanations between the predicted level of care and actual care available are that the remaining elderly population is cared for in place in their homes, cared for in facilities not located in the City of Sugar Hill, or not cared for at all. Elsewhere in Gwinnett County, there are 191 licensed facilities with a total of 3,479 beds plus an additional 12 facilities or communities providing some level of care, facility, or housing that are not registered with the State of Georgia.3 Additionally, the City has indicated that a conceptual development proposal which includes 175 independent living apartments, 52 independent living cottage units, 25 assisted living units, and 25 memory care units in the downtown area. Figure 7 illustrates the locations of the licensed facilities within Gwinnett County with specific addresses listed in Appendix A-13. The supply of special needs facilities, therefore, is likely to expand.
In Sugar Hill, there is one community restricted to ages 55 and above. Magnolia Village is a gated active adult development with homes starting at $300,000. This would be categorized as a retirement community and lifestyle choice, rather than a care facility. It is worth noting that 3 Georgia DHS, Office of Regulatory Services, Facility Location and Information Guide.

Page | 30
market forces seem to have identified a need and produced a product in the community for more affluent residents. As discussed earlier, the data indicate that the City population will be aging. The demand for additional facilities will continue. This has implications for employment as the aged population tends to spend much less on durable goods and noticeably more on personal services, including healthcare services. Full supporting data for this section on long -term market projections is in Appendix A.
Figure 7. – Location of Georgia Licensed Assisted Living Facilities, Gwinnett County
(Continued)


Page | 31
Community Input Resident Survey A community survey was developed to assess community perceptions on housing in Sugar Hill, housing preferences, City program priorities, and respondent demographics. The complete survey is available in Appendix B. The survey was launched September 8, 2015 and was open for responses until November 2, 2015. The survey was distributed to the City of Sugar Hill email lists through multiple email blasts; posted on the City website, City Facebook page, and City Twitter account; and made available in City Hall. 410 responses were received, which is approximately 2 percent of the 2015 estimated population. Although the survey respondents skewed toward more affluent homeowners, the answers give context to the data from other sources and validate the policy recommendations. A summary of survey responses follows in this section. A total of 57 percent of respondents have lived in Sugar Hill for 10 years or less, while 9 percent of respondents have lived in Sugar Hill for 20 years or more. The majority of survey respondents were homeowners, and 65 percent of survey respondents were female. Those in the 35 to 50 year old age bracket responded at a high rate, with 48 percent of respondents in this category. Figure 8. - Age Demographics
Diverse household sizes were represented among respondents, but the household sizes of survey respondents tended to be larger than those in the city as a whole. 12 percent of respondents had an adult family member as part of their household.
17%
48%
24%
11%
Age
18-34 35-50 51-65 Over 65

Page | 32
Figure 9. – Household Size
Respondents to the study were also wealthier than residents of the City as a whole. Just 4.5 percent of respondents earned under $35,000, and 76.5 percent earned over $75,000. Survey respondents were overall very satisfied with the quality of housing available to them in Sugar Hill. Figure 10. – Satisfaction with Available Housing in Sugar Hill
8%
33%
20%
26%
11%
2%
Household Size
1 person 2 people 3 people 4 people 5 people 6 people
21%
59%
15%
5%
Satisfaction with available housing in Sugar Hill
Very Satisfied Satisfied Not Satisfied Undecided

Page | 33
Figure 11. – Satisfaction with the Quality of your Neighborhood
Figure 12. – Satisfaction with your Current Housing Situation
27%
52%
19%
2%
Satisfaction with the quality of your neighborhood
Very Satisfied Satisfied Not Satisfied Undecided
34%
50%
13% 3%
Satisfaction with your current housing situation
Very Satisfied Satisfied Not Satisfied Undecided
Page | 34
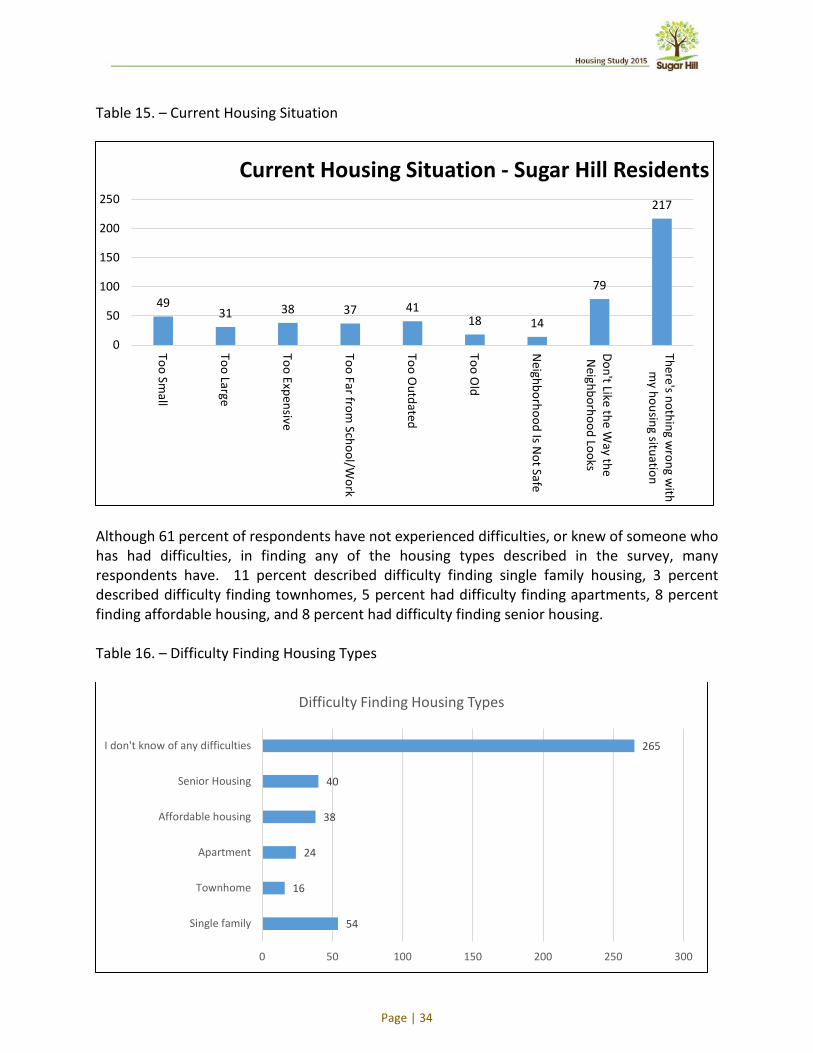
Table 15. – Current Housing Situation
Although 61 percent of respondents have not experienced difficulties, or knew of someone who has had difficulties, in finding any of the housing types described in the survey, many respondents have. 11 percent described difficulty finding single family housing, 3 percent described difficulty finding townhomes, 5 percent had difficulty finding apartments, 8 percent finding affordable housing, and 8 percent had difficulty finding senior housing. Table 16. – Difficulty Finding Housing Types
49 31 38 37 41
18 14
79
217
0
50
100
150
200
250
Too Small
Too Large
Too Expensive
Too Far from School/W
ork
Too Outdated
Too Old
Neighborhood Is N
ot Safe
Don't Like the Way the
Neighborhood Looks
There's nothing wrong w
ithm
y housing situationCurrent Housing Situation - Sugar Hill Residents
54
16
24
38
40
265
0 50 100 150 200 250 300
Single family
Townhome
Apartment
Affordable housing
Senior Housing
I don't know of any difficulties
Difficulty Finding Housing Types

Page | 35
The largest percentage of respondents (26.9 percent) pay $1,000 to $1,249 per month in rent or in mortgage payments. Table 17. – Monthly Rent or Mortgage
49 percent of respondents intend to look for new housing in the next 5 years—2 percent for new renter housing, and 46.8 percent to purchase new housing. 97.3 percent of respondents expressed a preference for homeownership over renting. Those looking to purchase will be seeking the following types of housing:
52
5
11
6
6
20
33
101
71
50
20
0 20 40 60 80 100 120
$599 or less
$600 to $649
$650 to $699
$700 to $749
$750 to $799
$800 to $899
$900 to $999
$1,000 to $1,249
$1,250 to $1,499
$1,500 to $1,999
$2,000 or more
Monthly Rent Or Mortgage

Page | 36
Figure 13. – Number of Bedrooms Families Planning to Purchase
Table 18. – Square Feet Families Planning to Purchase
1%
8%
42% 36%
13%
# of Bedrooms - Families Planning to Purchase
1 bedroom 2 bedrooms 3 bedrooms 4 bedrooms 5+ bedrooms
3
21
43
61
39
25
0 10 20 30 40 50 60 70
Less than 1,000 sq ft
1,000 to 1,499 sq ft
1,500 to 1,999 sq ft
2,000 to 2,499 sq ft
2,500 to 2,999 sq ft
3,000 or more sq ft
Sq Ft - families planning to purchase

Page | 37
Table 19. – Preferred Home Purchase Price
Figure 14. – Housing Type Families Planning to Purchase
1
2
6
16
28
30
25
44
37
3
0 5 10 15 20 25 30 35 40 45 50
Less than $51,000
$51,001 to $94,000
$94,001 to $120,000
$120,001 to $145,000
$145,001 to $171,000
$171,001 to $196,000
$196,001 to $222,000
$222,001 to $265,000
More than $265,001
I plan to rent, not purchase
Preferred Home Purchase Price
83%
6%
4% 7%
Housing Type - Familes Planning to Purchase
Single Family
Townhome
Condominium
Senior Housing

Page | 38
44 percent of respondents intend to retire in Sugar Hill. Of those that do not intend to retire in Sugar Hill, many listed lack of senior or active adult communities as a reason for not retiring in the city. Additionally, many of the respondents noted that a smaller house or house they can age with isn’t available in Sugar Hill. We surmise that these respondents would remain if sufficient housing choices were available to them. Table 20. – Reasons for not Retiring in Sugar Hill
Of those that plan on continuing to rent, “Saving for a down payment” and “My credit prevents me from qualifying for a loan” are the two most common responses listed. Of those that have recently purchased a home, the following difficulties were encountered by respondents:
32
31
47
4
199
119
0 50 100 150 200 250
I want to be closer to children/grandchildren after I retire
I want to be in a 55+ subdivision
I need a smaller house / house I can age with - there aren'tenough choices in Sugar Hill
Health
NA
Other
Reasons for not retiring in Sugar Hill

Page | 39
Table 21. – Difficulties in the Homebuying Process
Despite satisfaction with the quality of housing in Sugar Hill, survey respondents expressed that they value property maintenance and school quality highest for impact to neighborhood stability. Table 22. – Impacts on Neighborhood Stability / Safety & Home Value / Appearance
Respondents felt the four programs that should receive the highest level of attention are energy efficiency improvements, single family housing, and rental and owner-occupied rehabilitation programs.
0 50 100 150 200 250 300 350
Lack of downpayment
Did not qualify for a loan due to income
Did not qualify for a loan due to credit rating
Home buying process too complicated
The appraised value was lower than the purchase price
Could not afford the monthly payment
Housing availability
I didn't encounter any difficulties
NA
Other (please specify)
Difficulties in the Homebuying Process
86
122
13
132
215
86
151
107
67
45
0 50 100 150 200 250
Fading/Chipped Paint
Damaged/Rotting Siding
Upkeep of Accessory Buildings
Trash or Debris in the Yard
Poor Upkeep of Lawn and Landscaping
Sidewalks in Disrepair / Missing
Quality of Schools
Maintenance of Streets
Presence of Parks
Other (please specify)
Impacts on Neighborhood Stability / Safety & Home Value / Appearance

Page | 40
Table 23. – Sugar Hill Programs
Public Workshop The City of Sugar Hill hosted a public workshop on Saturday, November 7, 2015 to discuss the demographic trends in Sugar Hill, the results of the public opinion survey, and public preferences related to housing choices in Sugar Hill. Twelve (12) residents participated in the workshop, which was advertised on the City website and sent directly to survey participants who provided follow-up contact information. Workshop attendees participated in two exercises, which were designed to gauge resident preferences on the future of housing in Sugar Hill. Participants worked in groups with a table facilitator and individually ranked a selection of images which related to a particular issue on a scale from 1-5, with 5 being the most appropriate. The table facilitator presented the table consensus to the group. The first exercise focused on housing types that participants find visually appealing and contextually appropriate to the City of Sugar Hill. The housing types featured in the exercise were chosen based on survey feedback and long-term demographic trends in the City. The housing units featured were traditional suburban, zero lot line, pocket housing, row homes, and traditional downtown apartments. The second exercise focused on housing for active and aging adults. This exercise asked respondents to identify their preferences for multiple housing, transportation, neighborhood design, and health/recreation opportunities in communities with a focus on the needs of aging residents. These categories were selected based on survey feedback and best practice guidelines for aging in place and active adult lifestyle communities.
0 50 100 150 200 250 300
Rehabilitation of owner-occupied residences
Rehabilitation of rental residences
Home-ownership assistance
Rental housing for seniors
Single family housing
Affordable housing
Fair housing (efforts to reduce housing discrimination)
Residential historic preservation
Energy efficiency improvements
Sugar Hill Programs - Importance
High Medium Low

Page | 41
The consensus of these housing preference exercises is that residents prefer a variety of housing types and sizes in neighborhoods that provide opportunities for walkability, proximity to amenities, and social interaction. Even certain demographic groups of residents slightly underrepresented in both the workshop and survey, it is significant that participants expressed a desire for diverse housing choices. Nearly all participants identified accessibility and walkability as critical long term components for their neighborhood as they age. While more compact development patterns were indicated as most preferable, maintaining a sense of place with individuality and character was a priority for participants. Mixed use and townhouses were found to be less appropriate outside of Downtown. Traditional development patterns and attached housing types were more favorable when they included higher quality design details. Additionally, it was indicated that the long term maintenance and upkeep of typical low/medium density single-family residential lots is an undesirable prospect. A copy of the exercises is available in Appendix C.


Page | 42
Discussion of Trends Several trends emerged from the analysis of housing, income, and population data in combination with survey and workshop results. Diverse Housing Choices - Workshop and survey participants confirm the long-term data trend analysis, which shows an increase in affluence, a gap in the supply for affordable housing, and an aging population profile for Sugar Hill. The range of incomes, household sizes, and lifestyles in Sugar Hill makes providing for a full range of housing choices critical for keeping residents in Sugar Hill as long-term residents. This need focuses on housing types and should include not only larger and more expensive single-family detached residential homes, but also attached single family homes, and traditional downtown apartments (within the appropriate neighborhood context), as well as appropriate smaller sized homes to serve low and moderate income households. Visually Appealing Neighborhoods - Residents expressed that maintenance of housing and landscape is important to the stability of their neighborhoods. Modified code enforcement policy and increased enforcement of current policies may be used to address this widely shared community value. In addition to reinvented or updated code enforcement programs, the City could benefit from more robust design standards. While the City’s code does contain provisions regarding variation of construction materials, these regulations could be enriched with stronger anti-monotony provisions, as well as provisions to require continuity in the streetscape while encouraging variation in architectural style. Additionally, stronger landscaping requirements could enhance the appearance of single-family neighborhoods. Interconnected Walkable Neighborhoods - Survey respondents expressed a desire to have greater pedestrian and bicycle access to local destinations and amenities, particularly in the downtown area. A mix of housing options, interconnected to retail and public open spaces and plazas, would create a vibrant urban village. Incorporating housing into a walkable urban fabric may also simultaneously serve the needs of young families relocating from more urban areas and older residents that desire easier access to basic services. Demographic Trends - Based on the analysis of various data elements, several important trends related to housing issues came to light. As with most of the United States, the City will see a shift in the age of its population. The population count and share of residents over age 65 is expected to increase significantly through the year 2030. This will have huge impacts for the City’s long-term housing strategy, and topics related to aging residents and special needs housing should be a focus of the discussion on short-term policies. It will be important for the City to be ahead of this trend. A more diverse age demographic is likely to be a stabilizing factor for the City.

Page | 43
While two of the top three age groups are projected to expand, Sugar Hill will continue to attract young affluent professionals and families. As the regional population and regional housing prices both continue to rise, the City can expect to see affluent families relocate from the Atlanta city center to the suburbs. Any mass transit extensions to the area will accelerate this movement. Nationwide, millennials are trending away from homeownership; therefore, the importance for thoughtful policy which addresses the needs of these younger cohorts should also be prioritized in the discussion on short-term policies, as this will have an impact on the way developers and builders outfit their products. Incomes and home values in the City are projected to increase sharply over the long term. With this increased affluence, it will be important to keep housing affordability and diversity in view as changes are discussed to housing and land use policy. The demand for land, residential, and commercial development to support the expanded affluent population will require the City to anticipate for the growth and have development regulations in place to support it. Current workforce and affordable housing issues will be exacerbated as the demand for land increases. Older (and generally more affordable) housing stocks may give way to redevelopment and currently undeveloped land will increase in value, pushing housing and rental prices further upward. While some survey participants were wary of non-senior affordable housing and its placement within the City, it would be short-sighted for the City to not address this need.

Page | 44
Opportunities and Constraints Opportunities There are large tracts of open land in Sugar Hill, which are ripe for residential development. This provides Sugar Hill with the opportunity to develop architectural and development standards to incorporate Complete Streets standards and other regulations that will provide connectivity and continuity in the streetscape, as well as identify which areas of the City are most suitable for new residential development. In neighborhoods with aging housing stock, Sugar Hill has the opportunity to proactively use policy to positively transform the landscape. Because these houses are small, aging and in moderate to declining condition and because the parcels on which they are located are large, it is quite likely that these areas will redevelop in the future. As a result, the City has the opportunity to create a vision for these areas, and amend the comprehensive plan and land development code to prepare proactively for future redevelopment. Fair Housing issues were not identified as top priorities in the survey, which may be due to the fact that issues with lending are less visible and widely understood than other housing concerns. However, home buyer education resources should be incorporated into the overall housing plan for the City in order to promote equitable access to home ownership throughout all income levels. Home buyer education and resource programs, particularly for lower income households, will increase the wealth of those households over time and further improve the City’s tax base in the process. There is a demonstrated need to educate these households in the purchase and financings of homes. The City can likely partner with other local governments and utilize existing local programs in this endeavor. There appears to be a developing niche market for more affluent active adult communities, and the City should explore the various avenues that could attract development to retain existing residents who wish to continue living in Sugar Hill, but who desire smaller homes that are adaptable to their changing needs or communities with convenient access to medical and daily needs. Yard upkeep and landscaping, the quality of schools, and exterior home maintenance were revealed to be the three most widely shared community values related to neighborhood stability. The workshop and survey results indicated broad support for new or reinvented code enforcement and assistance programs related to property maintenance. Stronger landscape design standards, including foundation plantings, yard tree placement, and screening for utility boxes will also add value to homes and the community at large.

Page | 45
Constraints Visual surveys indicated that a majority of the City’s neighborhoods are in excellent condition, but noted some deteriorating conditions in specific areas that are mostly cosmetic in nature. Nonetheless, in the absence of a plan to address these conditions, they could lead to both short-term and long-term destabilization of those neighborhoods. Maintenance and yard upkeep of the older properties east of the railroad tracks has declined in recent years, likely due to the effects of the economic climate, and this area should be a focus for code enforcement and redevelopment activities. Some of the homes in these areas are not marketable because their condition prevents financing. These properties should be prioritized so that they do not become or remain vacant and fall into further decline. During the Great Recession, a historically large number of foreclosures arose and many of those homes remain empty or otherwise are not being maintained. The City will need to develop a registry of those foreclosure properties and closely monitor their condition, intervening when necessary. Affordable and workforce housing may become more critical issues as the City develops. As the population expands and becomes more affluent, it is likely that supporting retail and commercial development will follow, bringing with it the need for a larger workforce in those developments. Generally, service employees need workforce housing. Additionally, it is anticipated that the demand for rental housing will increase in coming years. Based on Table 9 shown previously, there is a current shortage of housing available at an appropriate rate for very low-income and moderate income households, indicating that these households are cost-burdened (paying rent or mortgage that amounts to more than 30% of the household income). In determining future projections of affordable housing needs, the City should take into account any other forms of assistance provided to these households (such as the federal government’s Earned Income Tax Credit (EITC) program) which may offset some of the gap in affordability. The city should also examine whether the primary barrier for low and moderate income households is related to limited availability of financing or a limited affordable housing stock, or both. The anticipated large increase in residents over age 65 and the trend toward larger and more expensive homes will create a gap in the supply of appropriate housing options to accommodate these residents. The City’s future land uses and development code will need to address those with special needs (in particular, those with assisted living needs), requiring the City to consider how best to incentivize developments for this demographic. The irregular shape of Sugar Hill’s boundary creates challenges for a coherent development plan. The City will need to carefully consider the suitability of future land to be annexed into the city and how it can fit into the overall plan, as well as further connectivity in the city boundaries.

Page | 46
Recommendations From the issues and opportunities, a set of recommendations have been developed to be used as a practical guide for budgeting operational and capital costs associated with furthering the City’s goals related to its housing strategy. This work program can be broken down into four broad categories based on the type of tasks associated with each recommendation.
1. Planning Program – These tasks may require further study, more public engagement, supplemental workshops, etc.
2. Land Use Policy – These are tasks associated with specific development, zoning or building codes that require updating to some extent.
3. Education / Outreach – These tasks are necessary for impacting perception of an issue related to housing or effecting positive change in social or economic conditions related to housing.
4. Administration - These are tasks related to how we administer and deploy services. To implement these polices, the project team recommends modifications to code enforcement policy and practice, changes to the landscape code, upgraded housing development standards, enhanced design guidelines for age restricted communities, and more pedestrian and bike friendly infrastructure. More specific considerations for implementation are described below. Code Enforcement—Code enforcement should work with the Planning and Development Department to identify areas in the code that need to be modified to provide legislative support for enhanced enforcement actions. Code enforcement often carries negative associations, but the City can seek to develop a proactive approach to code enforcement that works with homeowners to bring them into compliance. Code Amendments—The commercial and residential landscape code should be revised to ensure visual interest and diversity in site designs. Landscaping should enhance building design through buffering, transitions, screening, and shade. All landscaping should have a variety of texture, structure, and color to reduce visual monotony. With the expressed desire for diverse housing that can suit the needs of the entire community and adapt to changing family structure, there are a number of policy tools that can be used:
o Accessory Dwellings o Anti-Monotony Policy o Diversity of Unit Types o Universal Design o Complete Streets Design Requirements o Architectural Pattern Book o Form-based code o Foreclosure Registry

Page | 47
Foreclosure Registry—Of note is the number of dilapidated homes in relatively new subdivisions. This could be attributable to foreclosures. A city-mandated foreclosure registry could assist the city in addressing this issue in Sugar Hill. The State of Georgia adopted enabling legislation to allow these types of registries in 2012. The attached model ordinance in Appendix D was drafted by the Georgia Municipal Association. The city can also address foreclosures proactively by making homebuyer education and foreclosure prevention counseling available. Older Adult Housing and Services—To provide the richest housing and community experience for residents of 55+ communities, the City of Sugar Hill should develop housing policies that dictate location, universal design and traditional neighborhood design. Location standards will prevent residents from being isolated from recreation, groceries, community centers, healthcare, and transportation options, which is particularly important as mobility may decrease. Universal design features create buildings that are much easier for older individuals and individuals with physical limitations to navigate. Making these features standard allows individuals to age in place so that they can maintain independence and community as mobility declines. Neighborhood design standards create streets that are pleasant for navigation for users of all abilities. This includes the use of street trees, safe sidewalks, benches, connectivity, safe crossings, and proximity to basic amenities. As the population ages, other city services will be impacted and the City should consider the recreational opportunities for this population segment, as well as other City services that would be needed for a group with particular needs. Some areas of concern would be traffic engineering adaptations that recognize the special needs of the population. Transportation and transit issues will need to be considered. Advocacy and family counseling services should be explored. Community and service provider input will be very beneficial to the City when working with the various departments in planning for these future needs. Complete Streets Standards—Effective Complete Streets policies contribute to the sense of place and ease of pedestrian mobility that Sugar Hill residents have described as important – and lacking – from their neighborhood experience. The basic elements of a Complete Street are pedestrian infrastructure (such as sidewalks, median crossing islands, and crosswalks), traffic calming measures (such as street trees, center medians, shorter curb corner radii, and road diets), bicycle accommodations (protected bike lanes, neighborhood greenways, paved shoulders, and bicycle parking), and public transit accommodations. Best-practice Complete Streets design requires the design go beyond the linear plane to include the 3-dimensional environment including the street walls, landscaping, and human-scale design elements. Attention to these design features makes streets accessible to pedestrians of all ages and abilities. As Sugar Hill seeks to establish itself with a market niche for active 55+ communities, a well-executed Complete Streets program and coordinated land use policy will allow residents to age in place. The Planning and Development Department shall oversee the implementation of these policy priorities under the oversight of the City Manager and City Council. The cost and timeframe for

Page | 48
implementation can be quite variable. The City should determine which of the programs it desires to implement and the implementation methodology in order to identify a realistic estimate of cost. Affordable and Workforce Housing Issues—The study noted that current gaps in affordable housing may exist within the City. As the community grows and the population expands, it will be necessary to provide affordable housing for those segments of the community that will be cost-burdened. The City should identify the various methods that may be available to meet these needs. Special Needs Population—The City currently has a sizeable portion of its population that requires assisted living to some degree. Generally, those with independent living difficulty tend to be the aged, but the City should further study the needs that currently exist and that will trend into the future. It will need to consider any barriers to community living and access to city services that may exist and how those barriers can be removed or mitigated. Most of the licensed facilities in Gwinnett County are not located within a reasonable travel time from the City. Impediments and Barriers to Affordable Home Ownership—Though it is not a problem unique to Sugar Hill, many low and moderate income households need education in recognizing both their opportunities for home ownership and the processes used in buying and financing a home. The City should consider what efforts it can lend or facilitate by identifying those in the community that could benefit from home ownership and then assisting them in the process. Annexation Considerations—The City’s boundaries are not contiguous and enclaves exist. As the City continues to grow, it should develop a plan to provide infill and expansion to its boundaries so that it can provide consistent development requirements while accommodating the influx of population and commercial development that will follow. Consideration will need to be given to the long-term economics of annexation, but the short-term impact to the City of these unincorporated areas will likewise need to be weighed.

Page | 49
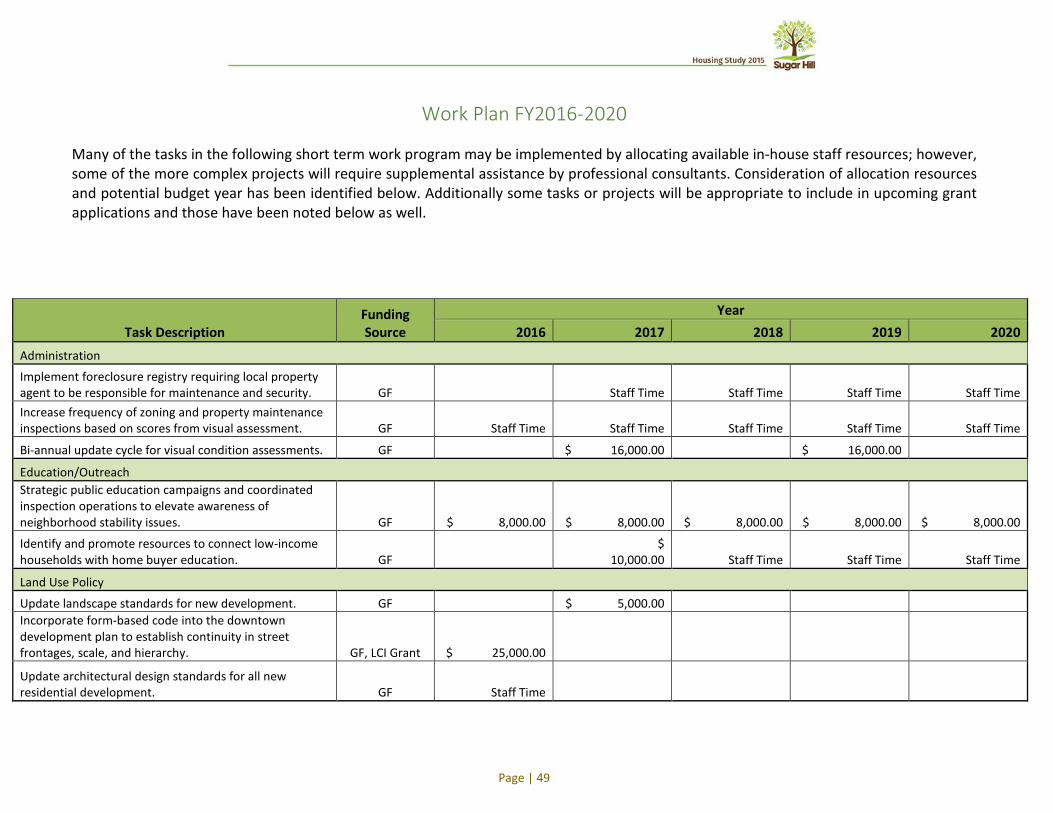
Work Plan FY2016-2020 Many of the tasks in the following short term work program may be implemented by allocating available in-house staff resources; however, some of the more complex projects will require supplemental assistance by professional consultants. Consideration of allocation resources and potential budget year has been identified below. Additionally some tasks or projects will be appropriate to include in upcoming grant applications and those have been noted below as well.
Task Description Funding Source
Year 2016 2017 2018 2019 2020
Administration
Implement foreclosure registry requiring local property agent to be responsible for maintenance and security. GF Staff Time Staff Time Staff Time Staff Time Increase frequency of zoning and property maintenance inspections based on scores from visual assessment. GF Staff Time Staff Time Staff Time Staff Time Staff Time
Bi-annual update cycle for visual condition assessments. GF $ 16,000.00 $ 16,000.00
Education/Outreach Strategic public education campaigns and coordinated inspection operations to elevate awareness of neighborhood stability issues. GF $ 8,000.00 $ 8,000.00 $ 8,000.00 $ 8,000.00 $ 8,000.00
Identify and promote resources to connect low-income households with home buyer education. GF
$ 10,000.00 Staff Time Staff Time Staff Time
Land Use Policy
Update landscape standards for new development. GF $ 5,000.00 Incorporate form-based code into the downtown development plan to establish continuity in street frontages, scale, and hierarchy. GF, LCI Grant $ 25,000.00
Update architectural design standards for all new residential development. GF Staff Time

Page | 50
Planning Program
Map suitable land for future residential development. Identify potential annexation areas, as well as areas within the city limits for infill and new development. GF $ 10,000.00 Staff Time Staff Time Staff Time Staff Time Coordinate zoning policies with comprehensive plan to ensure adequate supply of workforce housing while responding to the needs of more affluent households. GF Staff Time Study if and where accessory dwelling units might be utilized to fill gaps in senior, special needs, and affordable housing supply. GF, LCI Grant Staff Time Investigate whether mandatory universal design elements should be incorporated into age-restricted planned developments. GF, LCI Grant $ 5,000.00 Develop an inventory of personal care homes and evaluate issues related to permitting, licensing, quality of care, location to services, etc. GF $ 25,000.00
Identify appropriate incentives for new senior housing facilities (i.e., density bonuses, inclusionary zoning, set-asides in centrally located buildings, etc.) GF, LCI Grant $ 10,000.00
Study the costs and benefits of incorporating Complete Streets requirements for new development. GF, LCI Grant $ 20,000.00
2016 2017 2018 2019 2020
$ 43,000.00 $ 39,000.00 $ 38,000.00 $ 24,000.00 $ 38,000.00

Page | 51
Appendix A – Munilytics Data The full supporting data for the Munilytics long-term market projections and data analysis are in the following section as Appendices A.1 through A.13.

Page | 52
Appendix A.1 – American Community Survey Population Summary

Page | 53

Page | 54

Page | 55

Page | 56

Page | 57

Page | 58

Page | 59

Page | 60

Page | 61
Appendix A.2 - Community Profile

Page | 62

Page | 63

Page | 64

Page | 65

Page | 66

Page | 67
Appendix A.3 - Household Income Profile Detail
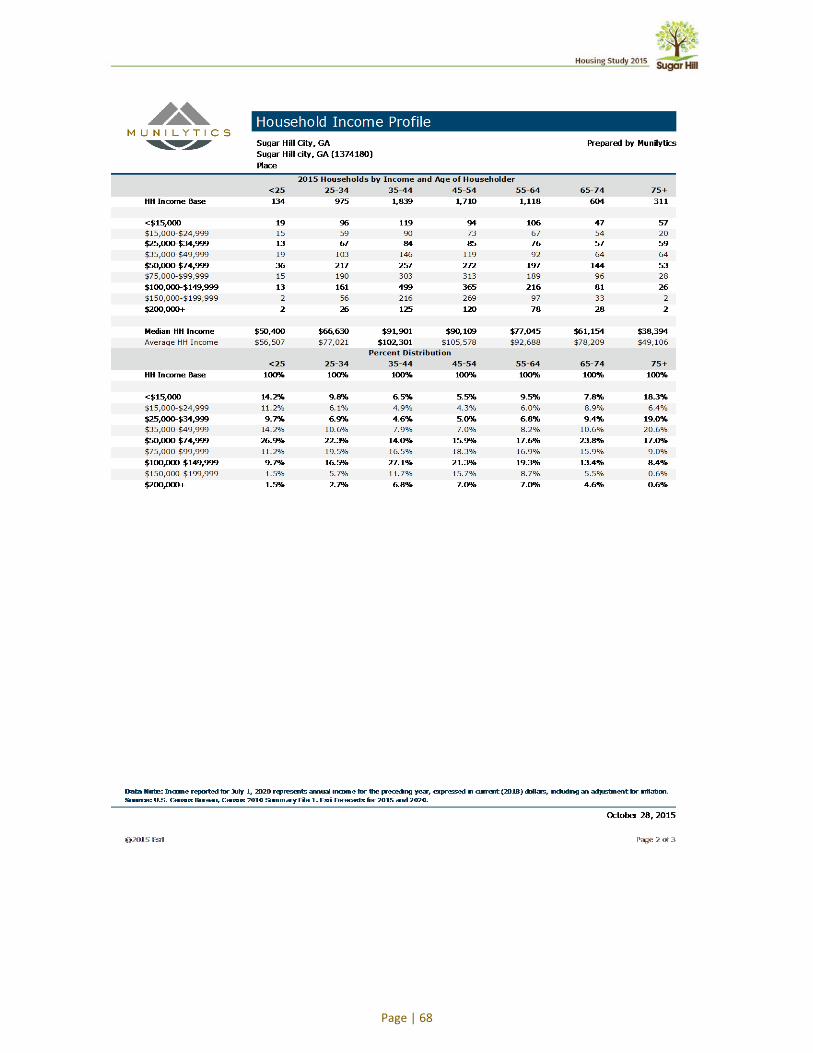
Page | 68

Page | 69
Appendix A.4 - Household Budget Expenditures

Page | 70

Page | 71
Appendix A.5 - Demographic and Income Profile

Page | 72

Page | 73

Page | 74

Page | 75

Page | 76
Appendix A.6 - Disposable Income Profile
Appendix A.7 – Financial Market Potential
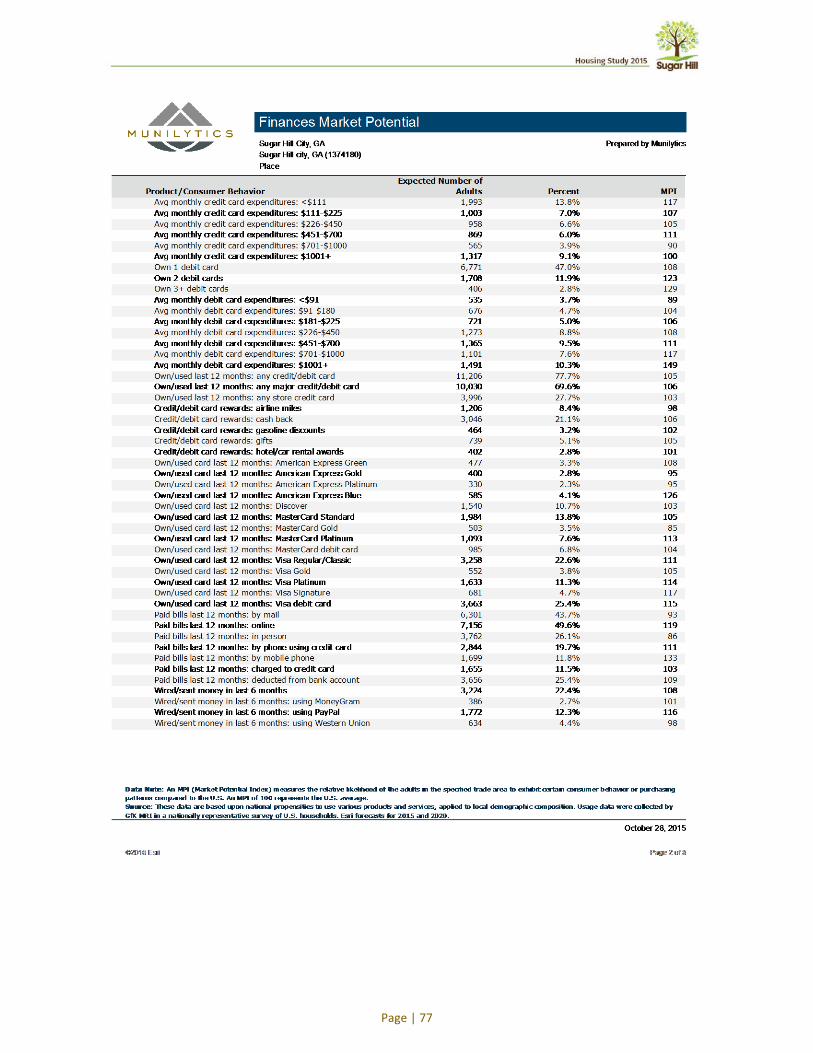
Page | 77

Page | 78

Page | 79
Appendix A.8 - House and Home Expenditures

Page | 80

Page | 81

Page | 82
Appendix A.9 – Net Worth Profile

Page | 83
Appendix A.10 - Housing Profile Detail

Page | 84

Page | 85
Appendix A.11 - American Community Survey Housing Summary
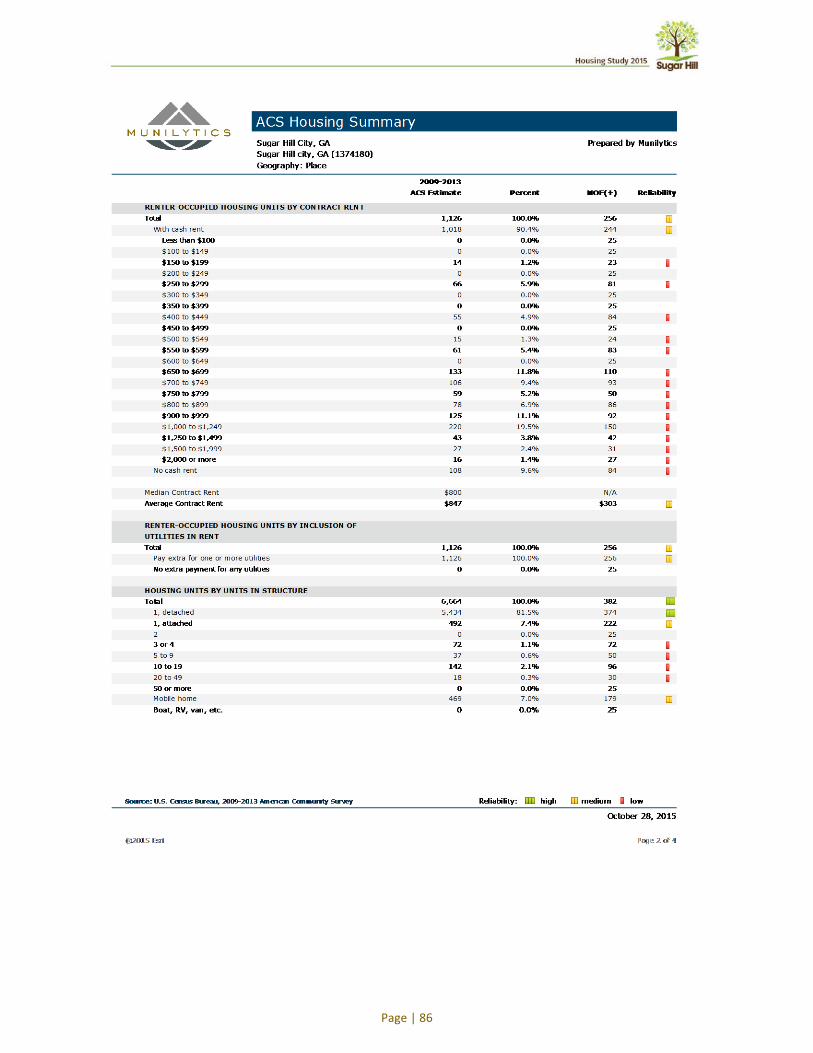
Page | 86

Page | 87

Page | 88

Page | 89
Appendix A.12 - Detailed Listing of Properties for Sale (Source: Zillow, October 2015)

Page | 90

Page | 91

Page | 92
Appendix A.12.a - Detailed Listing of Properties Sold (Source: Zillow, October – December 2015)

Page | 93
Appendix A.13 – State of Georgia Licensed Assisted Living Facilities, Gwinnett County

Page | 94

Page | 95


Page | 96
Appendix B – Survey (English and Spanish)

Page | 97

Page | 98

Page | 99

Page | 100
Appendix C – Workshop Exercises

Page | 101

Page | 102
Appendix D– Model Foreclosure Ordinance The model foreclosure ordinance, drafted by the Georgia Municipal Association, is in the following pages.

Page | 103
This model vacant and foreclosed real property ordinance is provided only for general informational purposes and to assist Georgia cities in identifying issues to address in a local vacant and foreclosed real property ordinance. The ordinance is not and should not be treated as legal advice. You should consult with your legal counsel before drafting or adopting any ordinance and before taking any action based on this model. This model ordinance has been developed to help cities protect property values within the city and to protect the health, safety and welfare of the citizens of the city. This model ordinance is specifically allowed by the provisions of O.C.G.A. § 44-14-14.
Model Foreclosure and Vacant Real Property Registry Ordinance
ORDINANCE NO. ______
AN ORDINANCE BY THE MAYOR AND CITY COUNCIL FOR THE CITY OF _____________________ RELATING TO MORTGAGES, CONVEYANCES TO SECURE DEBT, AND LIENS; TO PROVIDE FOR VACANT AND FORECLOSED PROPERTY REGISTRIES; TO PROVIDE FOR DEFINITIONS; TO PROVIDE FOR GUIDELINES FOR VACANT AND FORECLOSED PROPERTY REGISTRIES; TO PROVIDE FOR EXEMPTIONS; TO PROVIDE FOR MAXIMUM FEES AND PENALITES FOR REGISTRATION AND FAILURE TO REGISTER; TO PROVIDE FOR APPELLATE RIGHTS; TO PROVIDE FOR SEVERABILITY; TO PROVIDE AN EFFECTIVE DATE; TO REPEAL ALL ORDINANCES AND PARTS OF ORDINANCES IN CONFLICT HEREWITH; AND FOR OTHER PURPOSES.
SECTION ONE Chapter ______ of the Municipal Code of the City of ________________________ is amended by adding a new Article, to be numbered Article ________, which shall include the following language:
Article ______ Sec. _________. Short Title. This Article shall be known as the “____________________ Vacant and Foreclosed Property Ordinance.” Sec. _________. Findings and Intent. This ordinance is adopted to address the interest of public safety. (a) The governing authority finds that there is a need to establish a foreclosure and vacant real
property as a mechanism to protect property values in neighborhoods for all property owners. (b) Due to the lack of adequate maintenance and security of properties that are foreclosed or
where ownership has been transferred after foreclosure, the property values and quality of life of neighboring properties are negatively impacted.

Page | 104
(c) Improperly maintained and secured foreclosed properties can become a hazard to the health and safety of persons who may come on or near the property and can adversely affect the aesthetic and economic attributes of communities. Difficulties also often arise in locating the person responsible for the condition of foreclosed real property. The governing authority finds that there is a substantial need directly related to the public health, safety and welfare to comprehensively address these concerns through the adoption of the provisions in this article.
(d) This foreclosure and vacant real property registry will require owners and agents to provide the
city with official information for contacting a party responsible for bringing foreclosed and vacant real property into compliance with applicable provisions of municipal code of __________, Georgia.
Sec. _________. Definitions. (a) ‘Agent’ means an individual with a place of business in this state in which he or she is authorized
to accept inquiries, notices, and service of process on behalf of a vacant or foreclosed real property owner. The definition of ‘agent’ shall have the same meaning as set forth in the Official Code of Georgia Annotated, Section 44-14-14 should that definition differ from the definition in this Article.
(b) ‘Foreclosed real property’ means improved or unimproved real property for which a land
disturbance permit has been issued by a county or municipal corporation and is held pursuant to a judicial or nonjudicial foreclosure of a mortgage, deed of trust, security deed, or other security instrument securing a debt or obligation owned to a creditor or a deed in lieu of foreclosure in full or partial satisfaction of a debt or obligation owed to a creditor or shall have the same meaning as set forth in the Official Code of Georgia Annotated, Section 44-14-14, should that definition differ.
(c) ‘Street address’ means the street or route address. Such term shall not mean or include a post
office box. The definition of ‘street address’ shall have the same meaning as set forth in the Official Code of Georgia Annotated, Section 44-14-14 should that definition differ from the definition in this Article.
(d) ‘Vacant Real Property’ means real property that:
(1) Is intended for habitation, has not been lawfully inhabited for at least 60 days, and has no evidence of utility usage within the past 60 days; or
(2) Is partially constructed or incomplete, without a valid building permit. Such term shall not include a building or structure containing multiple units with common ownership that has at least one unit occupied with evidence of utility usage. The definition of ‘vacant real property’ shall have the same meaning as set forth in the Official Code of Georgia Annotated, Section 44-14-14 should that definition differ from the definition in this Article.
Sec. ________. Registration of Vacant or Foreclosed Property.

Page | 105
(a) Owner or agents of foreclosed real property or vacant real property, including foreclosed real property and vacant real property which is also residential rental property, are required to register such property with the __(name specifically identified officer or office)___ within thirty (30) days of such property becoming foreclosed or vacant real property by following the provisions of this section unless otherwise exempted by this Article or state law.
(b) Any such owner or agent of foreclosed real property or vacant real property located within the
jurisdiction of the city is required to file with the __(name specifically identified officer or office)___ a registration form in (paper/electronic format). If the Georgia Department of Community Affairs has promulgated a standard vacant or foreclosed real property registry form the owner or agent shall use such form and the city shall only require use of such form. If the Georgia Department of Community Affairs has not promulgated such form the city may create its own form, but such form shall only require submission of the following information:
(1) The real property owner’s name, street address, mailing address, phone number,
facsimile number, and e-mail address; (2) The agent’s name, street address, mailing address, phone number, facsimile number,
and e-mail address; (3) The real property’s street address and tax parcel number; (4) The transfer date of the instrument conveying the real property to the owner; and (5) At such time as it becomes available, recording information, including deed book and
page numbers, of the instrument conveying the real property to the owner.
(c) Registration is required for all vacant or foreclosed real property unless otherwise exempted, pursuant to this Article, but is not required for vacant or foreclosed real property within 90 days of such real property’s transfer:
(1) Pursuant to a deed under power of sale or deed in lieu of foreclosure; or (2) To the first subsequent transferee after the vacant real property has been acquired by
foreclosure under power of sale pursuant to the Official Code of Georgia Annotated, Section 44-14-160, or acquired pursuant to a deed in lieu of foreclosure.
(d) Any owner or agent required to register any vacant or foreclosed real property pursuant to this
Article or to Georgia law shall also be required to update the information specified in subsection (a) of this section within 30 days after any change in such required information regardless of whether the information provided to the registry was in the deed under power of sale or deed in lieu of foreclosure.
Sec. ________. Foreclosed and Vacant Real Property Exemptions. (a) Registration or payment of any administrative fees of foreclosed real property pursuant to this
Article and Georgia law is not required of transferees as described in subsection (b) of this section.

Page | 106
(b) Any transferee who acquires any real property by foreclosure under power of sale pursuant to the Official Code of Georgia Annotated, Section 44-14-160 or acquires any real property pursuant to a deed in lieu of foreclosure and:
(1) The deed under power of sale or deed in lieu of foreclosure contains the information
specified in subsection (a) of this section; (2) The deed is filed with the clerk of the superior court within 60 days of the transfer; and (3) Proof of the following is provided to the office or the officer in charge of the city
foreclosed real property registry:
(A) A filing date stamp or receipt showing payment of the applicable filing fees; and (B) The entire deed under power of sale or entire deed in lieu of foreclosure.
(c) (State law, in O.C.G.A.§ 44-14-14(l) allows the city to provide for further “exemptions from
such registration” as those required by state law in this model ordinance. Since any exemptions a city may consider will vary from municipality to municipality no sample is provided for this subsection. However, cities are reminded to take into account constitutional considerations before implementing exemptions to make sure the exemption does not illegally give one group or class an advantage that other similarly situated groups or classes are not given. Any proposed exemption should be reviewed by the city attorney.)
(d) Any owner or agent required to register any vacant or foreclosed real property pursuant to this
Article or to Georgia law shall also be required to update the information specified in subsection (a) of this section within 30 days after any change in such required information regardless of whether the information provided to the registry was in the deed under power of sale or deed in lieu of foreclosure.
Sec. ________. Removal from Registry. (a) Any owner or agent of a vacant or foreclosed real property may apply to the city to remove a
vacant or foreclosed real property from the city registry at such time as the real property no longer constitutes a vacant or foreclosed real property.
(b) Any application for removal allowed under subsection (a) of this section shall be granted or
denied by the ___(name a specifically identified officer or office)___ within 30 days, and if no such determination is made within 30 days then the application for removal from the registry shall be deemed granted.
Sec. ________. Administrative Fees. Any owner or agent of a vacant or foreclosed real property which is required to be registered with the city under this Article shall be required to make a payment for administrative fees that reasonably approximate the cost to the city of the establishment, maintenance, operation, and administration of the registry. Such fees shall not exceed ____($100.00 per registration is the maximum allowed under

Page | 107
the state law. Alternatively, the city may choose to impose such fees via resolution and state “Such fee amount shall be set via resolution of the city council.”)___. Sec. ________. Appeal Procedures. (a) Any owner or agent aggrieved of any determination or decision of the __(name specifically
identified officer or office)___ or the city in the administration of this Article may appeal to the municipal court of the city. All appeals hereunder must be taken within thirty (30) days of the decision in question by filing with the __(name specifically identified officer or office)___ a notice of appeal specifying the grounds thereof.
(b) The __(name specifically identified officer or office)___ shall forthwith transmit to the notice of
appeal and all the papers constituting the record upon which the action appealed was taken to the municipal court clerk who shall schedule an appeal hearing within sixty (60) days following the date the appealing party submits its completed written appeal with subsection (a) above.
(c) The municipal court judge may call for further information to be provided within the next thirty-
five (35) days following the hearing, and may continue the hearing for the purpose of receiving such information or for such other proceedings and reasons as the municipal court judge deems appropriate.
(d) An appeal shall stay all proceedings in furtherance of the action appealed from unless the
__(name specifically identified officer or office)___ certifies to the municipal court, after the notice of appeal has been filed with it, that by reason of the facts stated in the certificate a stay would, in his or her opinion, cause imminent peril to life or property. In such case, the proceedings shall not be stayed except by order of the municipal court judge on notice to the __(name specifically identified officer or office)___, and on due cause shown.
(e) The municipal court judge may, in conformity with the provisions of this Article, reverse or
affirm, in whole or in part, or modify the decision, requirement, or determination of the __(name specifically identified officer or office)___ appealed from by the owner or agent and may make such decision, requirement, or determination, as may be appropriate under the circumstances.
Sec. ________. Administration. (a) The foreclosure and vacant real property registry is subject to the Open Records Act of the State
of Georgia and the city may make such registry information available online. (b) Registration information shall be deemed prima facie proof of the statements contained therein
in any court proceeding or administrative enforcement proceeding in connection with the enforcement of this chapter.
Sec. ________. Nuisances.

Page | 108
Nothing in this Article shall be construed to impair, limit, or preempt in any way the power of the city to enforce any applicable codes, as defined in state law, or to define or declare nuisances and to cause their removal or abatement by summary proceedings or otherwise. Sec. ________. Penalties. Any owner or agent required to register a vacant or foreclosed real property under this Article who fails to register or fails to update the information specified in subsection (a), of Section ______, of this Article, Registration of Vacant or Foreclosed Property, may be fined up to ___(The maximum allowed under state law is $1,000.00 per occurrence)___ per occurrence. SECTION TWO All ordinances or parts of ordinances in conflict with this ordinance are hereby repealed. SECTION THREE If any section, clause, sentence or phrase of this ordinance is held to be invalid or unconstitutional by any court of competent jurisdiction, then said holding shall in no way effect the validity of the remaining portions of this ordinance. SECTION FOUR This ordinance shall become effective immediately upon its adoption by the City Council. SO ORDAINED, this ____ day of __________________, 2012 ______________________________ Mayor City of ___________________ ATTEST: _____________________________ Clerk of Council