Embed Size (px)
Citation preview

2016ANNUAL REPORT
(SUMMARY)
ANNUAL REPORT 2016 (SUMMARY)
Compagnie du Bois Sauvage S.A.
Rue du Bois Sauvage, 17
B-1000 Brussels
Tel. : +32 (0)2 227 54 50
Fax : +32 (0)2 219 25 20
www.bois-sauvage.be

Company and consolidated accounts as at 31 December 2016 submitted to the Annual Meeting of Shareholders of 26 April 2017. The full version of the report is available in French and in Dutch. In the event of divergence, the French version shall be final. This English version is a summary of the annual report. • COMPAGNIE DU BOIS SAUVAGE • Limited Company with a Capital of EUR 84,163,100 • Registered Offices: 17, Rue du Bois Sauvage, B-1000 Brussels • VAT BE 0402 964 823 - CTR Brussels • Tel.: +32 (0)2 227 54 50 • Fax: +32 (0)2 219 25 20 • www.bois-sauvage.be
SUMMARY OF THE ANNUAL REPORT OF COMPAGNIE DU BOIS SAUVAGEANNUAL MEETING OF SHAREHOLDERS ON 26 APRIL 2017
Financial Year 2016
TABLE OF CONTENTS
1. Letter to the shareholders 22. Key figures as at 31 December 43. Consolidated and statutory financial statements 7 3.1. Consolidated statement of the financial position 8 3.2. Consolidated statement of the comprehensive income 10 3.3. Consolidated statement of changes in equity 11 3.4. Consolidated cash-flow statement 12

1Annual Report of the Board of Directors
The Company aims to focus on a limited number of holdings, whether listed on the stock exchange or not, mainly in the industrial sector. Its goal is to reserve the necessary means for the development of the companies of the Group.
It aims to maintain close relations with the companies in which it invests and to be involved in the recruitment of executives and in strategic development.
In the interests of its own shareholders, the Company requires a regular income from its investments in order to provide a steadily growing dividend, if possible.
Compagnie du Bois Sauvage is an investment holding company, quoted on Euronext Brussels, with a stable ‘family’ principal
shareholder.

2 Compagnie du Bois Sauvage
While there was an economic upturn in Europe in the first quarter of 2016, the rest of the year once again saw low growth. The vote in favour of Brexit and its impact on the pound sterling, the wait-and-see attitude before the US elec-tions, and the referendum in Italy were all factors that affect-ed growth in Europe.
As regards the holdings of Compagnie du Bois Sauvage, the results are satisfying even though the above-mentioned events had varying degrees of impact.
It is in this context that operating profit before disposals and fair value adjustments of Compagnie du Bois Sauvage stands at EUR 39.2 million (versus EUR 33.6 million in 2015). The increase in this area is due principally to the following elements:
an almost 2% increase in the turnover of UBCM (the Chocolatier Group: Neuhaus, Jeff de Bruges, Corné Port-Royal and Artista Chocolates) and the consolida-tion of solid operating profitability. This profitability was, however, impacted in 2016 by the costs associated with the restructuring of the production branch of Corné Port-Royal, which was brought into Artista Chocolates,
the increase in dividends received to EUR 15.1 million in 2016 up (versus EUR 10.4 million in 2015), result-ing mainly from the earnings of Berenberg Bank, which, alongside its operating profit, realized an exceptional capital gain on the sale of almost all its shares in Univer-sal Investment GmbH,
the results of equity accounted associates at EUR 3.2 mil-lion in 2016 (versus EUR -0.2 million in 2015). The strong increase can be attributed largely to Recticel.
Net profit attributable to the Group of EUR 31.4 million takes into account profit on disposals of EUR 6.7 million, impairments of EUR -1 million (mainly in the Noël Group), and tax expenses of EUR 9.8 million.
Net comprehensive income attributable to the Group was EUR 45 million, as compared to EUR 59.2 million in 2015. This amount corresponds to the net profit or loss attributa-ble to the Group, adjusted for fair value adjustments of the investments in Umicore (EUR +31 million), Berenberg Bank (EUR -14.1 million), Gotham City (EUR -1.5 million), Bone Therapeutics (EUR -1 million) and Recticel (EUR -0.8 mil-lion), as well as for exchange rate differences on foreign operations (EUR -0.2 million).
The Company bolstered up its equity by EUR 0.5 million following the exercise of 2,300 subscription rights at a price of EUR 232.41 per share in April 2016. The Group recorded a net consolidated debt of EUR 0.9 million as at 31 December 2016.
After the 2015 dividend payment (EUR 12.5 million) and after deduction of the Group’s own shares acquired in 2016 (EUR 0.8 million), the Group’s equity amounted to EUR 405,2 million (versus EUR 372.7 million in 2015).
Given the strong operating profit and the solidity of its as-sets, the Company is proposing to continue its dividend growth policy and to take the dividend to EUR 7.52 gross per share, thereby indicating its confidence in the future.
1 . L E T T E R T O T H E S H A R E H O L D E R S

3Letter to the shareholders
During 2016, the Compagnie du Bois Sauvage Group mainly:
acquired a holding in Fidentia BeLux Investments SCA/CVA (FBLI) in the amount of EUR 25 million, half in the form of shares and half as a subordinated loan. Fidentia BeLux Investments, newly created by Fidentia Real Estate Investments, made its first investment in Hippogone SA/NV, owner of the Solaris building (www.fidentia.be),
subscribed for EUR 12 million in the new First Re-tail International 2 SA/NV (FRI²) fund, of which EUR 3 million were paid up. This fund is active in the development of retail parks in Europe,
participated in the capital increase of Artista Choco-lates SA/NV by contributing the production branch of Corné Port-Royal. The Group acquired nearly 75% of the shares in that company. The joining of production forces by the two companies and their flexibility will allow to strengthen the presence of the Group on the chocolate market and to develop a second production site to offer the market a diverse supply,
paid up USD 1.4 million in Gotham City Residential Partners II, LP,
subscribed to the capital of Nanocyl SA/NV for an amount of EUR 0.2 million,
received USD 10.4 million from the DSF III and Gotham City Residential Partners I, LP (USA) funds,
received a repayment of EUR 0.2 million from the Mat-ignon Technologies II fund,
reduced its holdings in Bone Therapeutics and Guy Degrenne,
in November 2016, issued bonds for a total amount of EUR 21.3 million to a limited number of Belgian and inter-national institutional investors; these bonds have a term of 7 years and an annually payable interest rate of 2%,
secured refinancing for its 2013-2018 debenture loan of EUR 45 million via bank loans at market rate for a period of 5 years (2018-2023).
In the context of the renewal of the authorization given by the Extraordinary General Meeting of 27 April 2016 for the buyback of own shares, Compagnie du Bois Sauvage proceeded in 2016 to buy back 2,495 own shares for a total amount of EUR 0.8 million.
Measures to improve shareholder information were contin-ued: the Corporate Governance Charter has been updated and is available on the website, contacts with analysts and investors have been continued, the intrinsic value is pub-lished semi-annually.
The average daily number of shares processed in 2016 was 475.
Taking into account the two non-recurring elements men-tioned above, the intrinsic value (in-the-money) stood at EUR 369 per share as at 31 December 2016 (EUR 335.2 as at 31 December 2015).
Compagnie du Bois Sauvage wishes to thank its sharehold-ers for their confidence and support during the financial year. Our thanks are also due to all the Group’s employees for their professionalism and sincere commitment.
6 March 2017The ChairmanFrédéric Van GansbergheRepresentative of Ecostake SA/NV

4 Compagnie du Bois Sauvage
2011(1)2011
ASSETS – HISTORICAL TRENDConsolidated accounts (in millions of euros)
2 . K E Y F I G U R E S A S A T 3 1 D E C E M B E R
LIABILITIES – HISTORICAL TRENDConsolidated accounts (in millions of euros)
900
800
700
600
500
400
300
200
100
02014 2015 20162013
Current assets Noncurrent assets
900
800
700
600
500
400
300
200
100
02014 2015 20162013
Other liabilities Financial debts Equity
100%
90%
80%
70%
60%
50%
40%
30%
20%
10%
0%
2007 2008 2009 2010
StrategicPropertyCash
2014 (3)2013 2015 (3) 2016 (3)
EVOLUTION OF THE CONSOLIDATED PORTFOLIOIntrinsic value as at 31 December (2)
Total in euros 1,060,667,920 757,680,115 758,571,487 813,968,415 571,074,038 542,063,934 558,737,076 496,405,908 600,582,302 670,565,412
(2) See the French version of the annual report for the valuation methods for the calculation of the intrinsic value.
(3) Excluding cash items of the Chocolatier Group.
2012 2012 (1)
2011 2012
(1) Equity in 2011 and 2012 takes account of the capital reductions of respectively
EUR 40.6 million and EUR 39.4 million.

5
in thousands of euros 2016 2015 2014 2013Group equity 405,194 372,723 312,832 318,109Intrinsic value ‘inthemoney’ (1) (3) 622,094 564,464 459,018 456,338Consolidated net profit (loss) (attributable to the Group) 31,437 32,884 1,073 1,403Market capitalisation at yearend 515,667 415,198 333,287 337,171
2016 2015 2014 2013Consolidated net profit (loss) per share (attributable to the Group) (EUR)Basic (2)
Diluted (2)18.6818.68
19.8919.89
0.670.67
0.890.89
Number of sharesOutstandingInthemoneyFully diluted
1,683,262(4)
1,685,767(5)
1,685,767(5)
1,680,9621,683,3121,688,312
1,625,0001,628,4001,721,746
1,575,3461,581,8961,721,746
Intrinsic value per share at year-end (EUR)Inthemoney (3)
Fully diluted (3)369.03369.03
335.22335.20
281.88279.71
288.48284.60
Gross dividend per share 7.52 7.44 7.36 7.28
2016 2015 2014 2013Average daily volume processed 475 819 731 597Average daily capital (EUR) (3) 131,115 189,324 162,421 112,488Price (EUR)YearendHighestLowest
306.35319.75232.00
247.00252.00205.50
205.10235.85190.00
214.03215.00176.12
(1) The valuation method for the calculation of the intrinsic value is described in the french version of the 2016 annual report.(2) See calculation and definitions in Note 25 on the french version of the 2016 annual report.(3) See definitions of ‘inthemoney’ and ‘fully diluted’ on the french version of the 2016 annual report.(4) Including 2,495 treasury shares held by Compagnie du Bois Sauvage at 31 December 2016. (5) Excluding treasury shares
Key figures as at 31 December

6 Compagnie du Bois Sauvage
7Consolidated and Separate Financial Statements
Consolidated and Separate Financial Statements as at 31 December 2016
Presented to the General Meeting of 26 April 2017

Compagnie du Bois Sauvage8
C O N S O L I D A T E D S T A T E M E N T O F F I N A N C I A L P O S I T I O N A S A T 3 1 D E C E M B E R
in thousands of euros 2016 2015
Non-current assets 413,719 372,870
Property, plant and equipment 39,932 39,292
Investment property 10,395 10,406
Goodwill 11,003 10,962
Intangible assets 21,445 20,678
Equityaccounted investments 113,240 103,592
Investments available for sale 194,283 179,597
Other assets 20,147 5,107
Deferred tax assets 3,274 3,236
Current assets 144,321 131,952
Inventories 18,789 18,300
Trade and other receivables 43,761 37,757
Current tax assets 4,594 3,227
Financial assets at fair value through profit or loss 13,611 11,640
Other assets 3,437 2,493
Cash and cash equivalents 60,129 58,535
Non-current assets held for sale 0 0
Total assets 558,040 504,822

9Consolidated Statement of Financial Position
in thousands of euros 2016 2015
Equity 431,138 394,256
Group equity 405,194 372,723
Share capital 152,848 152,313
Retained earnings 155,438 136,291
Reserves 96,908 84,119
Non-controlling interests 25,944 21,533
Liabilities 126,902 110,566
Non-current liabilities 76,529 53,894
Borrowings 65,956 44,671
Provisions 1,951 1,384
Deferred tax liabilities 8,448 7,734
Other noncurrent liabilities 174 105
Current liabilities 50,373 56,672
Borrowings 14,575 18,487
Provisions 1,430 1,433
Trade and other payables 26,009 27,901
Current tax liabilities 6,237 7,167
Other liabilities 2,122 1,684
Total equity and liabilities 558,040 504,822
Compagnie du Bois Sauvage10
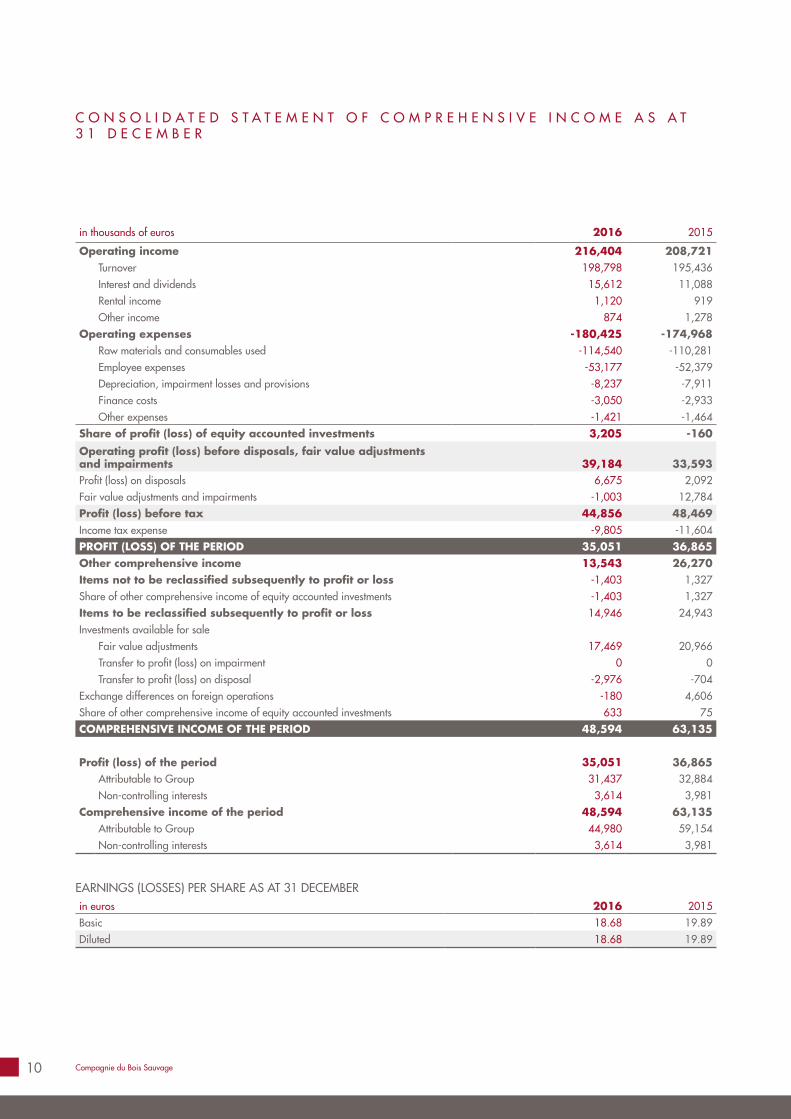
C O N S O L I D A T E D S T A T E M E N T O F C O M P R E H E N S I V E I N C O M E A S A T 3 1 D E C E M B E R
in thousands of euros 2016 2015
Operating income 216,404 208,721Turnover 198,798 195,436Interest and dividends 15,612 11,088Rental income 1,120 919Other income 874 1,278
Operating expenses -180,425 -174,968Raw materials and consumables used 114,540 110,281Employee expenses 53,177 52,379Depreciation, impairment losses and provisions 8,237 7,911Finance costs 3,050 2,933Other expenses 1,421 1,464
Share of profit (loss) of equity accounted investments 3,205 -160
Operating profit (loss) before disposals, fair value adjustments and impairments 39,184 33,593Profit (loss) on disposals 6,675 2,092Fair value adjustments and impairments 1,003 12,784Profit (loss) before tax 44,856 48,469Income tax expense 9,805 11,604PROFIT (LOSS) OF THE PERIOD 35,051 36,865Other comprehensive income 13,543 26,270Items not to be reclassified subsequently to profit or loss 1,403 1,327Share of other comprehensive income of equity accounted investments 1,403 1,327Items to be reclassified subsequently to profit or loss 14,946 24,943Investments available for sale
Fair value adjustments 17,469 20,966Transfer to profit (loss) on impairment 0 0Transfer to profit (loss) on disposal 2,976 704
Exchange differences on foreign operations 180 4,606Share of other comprehensive income of equity accounted investments 633 75COMPREHENSIVE INCOME OF THE PERIOD 48,594 63,135
Profit (loss) of the period 35,051 36,865Attributable to Group 31,437 32,884Noncontrolling interests 3,614 3,981
Comprehensive income of the period 48,594 63,135Attributable to Group 44,980 59,154Noncontrolling interests 3,614 3,981
EARNINGS (LOSSES) PER SHARE AS AT 31 DECEMBER in euros 2016 2015Basic 18.68 19.89 Diluted 18.68 19.89

11Consolidated Statement of Changes in Equity
C O N S O L I D A T E D S T A T E M E N T O F C H A N G E S I N E Q U I T Y
Share capital Reserves
Noncontrolling
interestsin thousands of eurosShare
capital
Share premium account
Revaluation /
hedging reserves
(1)
Treasury
shares
Foreign currency
translation
reserveRetained earnings
Group equity Equity
Balance as at 31 December 2014 81,250 58,021 59,786 0 -1,937 115,712 312,832 20,231 333,063
Change in accounting standard IAS 19 0 0Investments available for sale
Fair value adjustments 20,966 20,966 20,966Transfer to profit (loss) on impairment 0 0Transfer to profit (loss) on disposal 704 704 704
Share of hedging and actuarial reserves of equity accounted investments 1,402 1,402 1,402Changes in scope of consolidation 0 0Foreign exchange translation differences 4,606 4,606 4,606Other 0 0Other comprehensive income 0 0 21,664 0 4,606 0 26,270 0 26,270Net profit (loss) of the period 32,884 32,884 3,981 36,865Comprehensive income of the period 0 0 21,664 0 4,606 32,884 59,154 3,981 63,135Dividends paid 11,960 11,960 2,723 14,683Share capital and share premium account 2,798 10,244 13,042 13,042Changes in scope of consolidation 0 0Operations with treasury shares (purchase/cancellation) 0 0Other 345 345 44 301Balance as at 31 December 2015 84,048 68,265 81,450 0 2,669 136,291 372,723 21,533 394,256Investments available for sale
Fair value adjustments 17,469 17,469 17,469Transfer to profit (loss) on impairment 0 0Transfer to profit (loss) on disposal 2,976 2,976 2,976
Share of hedging and actuarial reserves of equity accounted investments 770 770 770Changes in scope of consolidation 0 0Foreign exchange translation differences 180 180 180Other 0 0Other comprehensive income 0 0 13,723 0 -180 0 13,543 0 13,543Net profit (loss) of the period 31,437 31,437 3,614 35,051Comprehensive income of the period 0 0 13,723 0 -180 31,437 44,980 3,614 48,594Dividends paid 12,506 12,506 12,506Share capital and share premium account 115 420 535 535Changes in scope of consolidation 274 274 797 1,071Operations with treasury shares (purchase/cancellation) 754 754 754Other 58 58 58
Balance as at 31 December 2016 84,163 68,685 95,173 -754 2,489 155,438 405,194 25,944 431,138
(1) availableforsale investments accounted for using the equity method.

Compagnie du Bois Sauvage12
C O N S O L I D A T E D C A S H F L O W S T A T E M E N T
in thousands of euros 2016 2015
Profit (loss) before tax 44,856 48,469
Adjustments
Profit (loss) on disposals 6,675 2,092
Fair value adjustments and impairments 1,003 12,784
Share of profit (loss) of equity accounted investments 3,205 160
Finance costs 3,050 2,933
Interest and dividend income 15,612 11,088
Depreciation, impairment losses and provisions 8,237 7,911
Other 150 991
Increase (decrease) in working capital
Current assets (1) 6,436 708
Current liabilities (2) 1,412 13
Interest paid 3,092 2,740
Interest received (incl. IRS) 514 626
Dividends received
Equityaccounted investments 2,942 2,654
Other investments 15,097 10,444
Taxes paid 11,210 9,312
Cash flows relating to operating activities 28,207 36,893
(Acquisition)/disposal of equityaccounted investments 11,730 22,758
(Acquisition)/disposal of investments available for sale 7,604 5,565
(Acquisition)/disposal of other financial instruments 17,646 260
(Acquisition)/disposal of investment property 110 15
(Acquisition)/disposal of tangible assets 7,590 7,590
(Acquisition)/disposal of intangible assets 1,563 1,376
(Acquisition)/disposal of other noncurrent assets 11 611
Cash flows relating to investment activities -31,046 -37,655
New loans 21,300 0
Repayment of loans 3,927 1,029
Capital increase/(decrease) 535 13,042
Dividends paid to the Group's shareholders 12,506 11,960
Dividends paid to minority shareholders 0 2,723
Sale (purchase) of treasury shares held 754 0
Other 215 1,917
Cash flows relating to financing activities 4,433 1,305
Net cash flows of the period 1,594 543
Cash and cash equivalents, beginning balance 58,535 57,992
Effect of exchange rate changes on cash and cash equivalents 0 0
Cash and cash equivalents, ending balance 60,129 58,535
(1) Increases and decreases in working capital relating to inventories, accounts receivable, other assets and noncurrent assets held for sale.(2) Increases and decreases in working capital relating to trade and other payables.

Company and consolidated accounts as at 31 December 2016 submitted to the Annual Meeting of Shareholders of 26 April 2017. The full version of the report is available in French and in Dutch. In the event of divergence, the French version shall be final. This English version is a summary of the annual report. • COMPAGNIE DU BOIS SAUVAGE • Limited Company with a Capital of EUR 84,163,100 • Registered Offices: 17, Rue du Bois Sauvage, B-1000 Brussels • VAT BE 0402 964 823 - CTR Brussels • Tel.: +32 (0)2 227 54 50 • Fax: +32 (0)2 219 25 20 • www.bois-sauvage.be
SUMMARY OF THE ANNUAL REPORT OF COMPAGNIE DU BOIS SAUVAGEANNUAL MEETING OF SHAREHOLDERS ON 26 APRIL 2017
Financial Year 2016
TABLE OF CONTENTS
1. Letter to the shareholders 22. Key figures as at 31 December 43. Consolidated and statutory financial statements 7 3.1. Consolidated statement of the financial position 8 3.2. Consolidated statement of the comprehensive income 10 3.3. Consolidated statement of changes in equity 11 3.4. Consolidated cash-flow statement 12

2016ANNUAL REPORT
(SUMMARY)
ANNUAL REPORT 2016 (SUMMARY)
Compagnie du Bois Sauvage S.A.
Rue du Bois Sauvage, 17
B-1000 Brussels
Tel. : +32 (0)2 227 54 50
Fax : +32 (0)2 219 25 20
www.bois-sauvage.be