Embed Size (px)
Citation preview

1 | P a g e
2016 ANNUAL REPORT
ABN 77 009 241 374
“BUILDING A SUCCESSFUL INDONESIAN GOLD COMPANY”
For
per
sona
l use
onl
y

CONTENTS
2 | P a g e
CONTENTS ........................................................................................................................... 2
CORPORATE DIRECTORY ..................................................................................................... 3
CHAIRMAN’S REVIEW .......................................................................................................... 4
REVIEW OF OPERATIONS ..................................................................................................... 5
DIRECTORS’ REPORT .......................................................................................................... 22
AUDITOR’S INDEPENDENCE DECLARATION ...................................................................... 31
CONSOLIDATED STATEMENT OF PROFIT OR LOSS AND OTHER COMPREHENSIVE INCOME ........ 33
CONSOLIDATED STATEMENT OF FINANCIAL POSITION .................................................... 34
CONSOLIDATED STATEMENT OF CASH FLOWS ................................................................. 35
CONSOLIDATED STATEMENT OF CHANGES IN EQUITY ..................................................... 36
NOTES TO THE FINANCIAL STATEMENTS ........................................................................... 37
DIRECTORS’ DECLARATION ............................................................................................... 76
INDEPENDENT AUDITOR’S REPORT TO THE MEMBERS OF SIHAYO GOLD LIMITED ......... 77
ADDITIONAL SHAREHOLDER INFORMATION .................................................................... 79
SUMMARY OF TENEMENTS HELD BY THE GROUP ............................................................. 81
For
per
sona
l use
onl
y
CORPORATE DIRECTORY
3 | P a g e
Directors Misha A Collins C.F.A (Chairman) Gavin Caudle (Non Executive Director)
Stuart Gula (Managing Director)
Daniel Nolan (Executive Director) Chief Executive Officer Stuart Gula
Company Secretary Daniel Nolan Registered Office C/-McCullough Robertson and Business Address 11/66 Eagle St, Brisbane QLD 4000 Telephone: 0427 401198 Facsimile: (07) 33993172 E-mail: [email protected] Web: www.sihayogold.com Share Registry Security Transfer Registrars Pty Ltd 770 Canning Highway Applecross WA 6153 Telephone: (08) 9315 2333 Facsimile: (08) 9315 2233 Home Exchange Australian Securities Exchange (Perth) Limited Level 40, Central Park 152-158 St George’s Terrace Perth WA 6000 Auditors Stantons International Audit and Consulting Pty Ltd Level 2 / 1 Walker Avenue West Perth WA 6005 Solicitors Steinepreis Paganin Level 2, The Read Buildings West Perth WA 6000 Bankers ANZ Banking
111 Eagle St, Brisbane, QLD. 4000
Sihayo Gold Limited is a company limited by shares, incorporated and domiciled in Australia.
For
per
sona
l use
onl
y

CHAIRMAN’S REVIEW
4 | P a g e
Dear Fellow Shareholders,
2016 has marked a dramatic and positive shift in market sentiment in the gold sector.
The gold price has risen from US$1060 per oz at the start of the calendar year to US$1325 per oz at the time of writing.
The significant improvement in the gold price has very positive implications for the Sihayo-Pungkut project, particularly
given the affirmative shift in other project fundamentals driven by factors such as reduced power prices relative to the
2014 feasibility study.
The past year has been another low period in terms of activity levels, driven mostly by slow but consistent progress in
terms of permitting. Although somewhat frustrating, permitting delays have kept expenditure levels and resulting
share dilution to a minimum during a period of particularly difficult financial conditions for the gold sector. We have
again been fortunate to have had the support of major shareholders in financing our operations through the period.
We expect to receive our final permitting approvals in the near term, at which time we hope to be able to present
financiers with a refreshed feasibility study showing attractive financial metrics at current gold prices. We are
currently discussing work plans in respect of this.
We believe there remain opportunities for optimising metallurgical recovery at the Sihayo-Pungkut project, as there is a
large volume (over 4 million tonnes) of high grade material (circa 3.5-4gt) in the JORC resource which delivered low
recoveries (low 50% range) in the feasibility study. Alternative processing of this material has never been investigated.
If recoveries could be improved on this material, there is a very substantial incremental revenue opportunity for the
project.
In terms of the broader Pungkut Contract of Work (COW), we continue to to see significant exploration potential. A
recent independent review of the COW concluded there is substantial potential for discovery of a bulk tonnage deposit
in and around the Hutabargot Julu deposit. This is a different perspective to previous exploration work which focussed
on discovery of a high grade narrow vein underground system. Most significantly, a bulk tonnage target offers reduced
exploration risk. Despite our difficulty in financing and justifying exploration spending historically, it remains clear the
Sihayo-Pungkut COW offers world class opportunities for the future.
On behalf of the directors of the Company I would again like to thank our management, employees and contractors for their efforts and commitment throughout the year and also to our shareholders for their continued support.
I look forward to our team delivering on the potential at Sihayo Gold over the next year and seeing this reflected in improved financial returns for shareholders.
Yours Sincerely,
Misha Anthony Collins For
per
sona
l use
onl
y

REVIEW OF OPERATIONS
5 | P a g e SIHAYO GOLD LIMITED
Sihayo Pungkut Gold Project (75%)
The Sihayo Pungkut Gold Project (“Sihayo Pungkut”) is held under a 7th Generation Contract of Work
(“COW”) and is located in Mandailing Natal, North Sumatra, Indonesia. The COW is the highest standing
legal tenure achievable in the Indonesian mining industry.
The COW describes in detail the rights and obligations of both the Company and the Government during the
term of the COW. Our COW is currently in the Feasibility Study Phase as we progress through statutory
permitting and approvals that will allow progress to the Construction Phase followed by a 30 year Production
Phase. At the end of the Production Phase the Company has the right to two by ten year extensions under
the prevailing Indonesian Mining Law.
Sihayo Pungkut is owned by PT Sorikmas Mining (“Sorikmas”), which is 75% owned by Sihayo Gold Limited
(“Sihayo”) and 25% by PT Aneka Tambang Tbk (“Antam”). Sihayo is responsible for 100% of the exploration
and development funding of Sorikmas until the commencement of production. The funding is by way of
loans to Sorikmas and under the terms of the Loan Agreement, Antam is required to repay its share of loans
to Sihayo or other lenders to Sorikmas, from 80% of its attributable share of available cash flow from
production, until its 25% share of the loans are repaid in full.
The current Sihayo Pungkut JORC Code (2012 Edition) Mineral Resource Estimate which was revised by
Helman & Scholfield Consultants Pty Ltd (H&SC) in June 2013 stands at 16.9 Mt at 2.6 g/t for 1.4 Moz
comprising the larger Sihayo Resource and the smaller Sambung Resource with approximately 75% of the
total resource contained within the JORC Measured & Indicated Category.1
Indicated and Measured Resources at Sihayo only have been converted to JORC Code (2012 Edition) Ore
Reserves by Entech Pty Ltd containing 7.14Mt at 2.4g/t for 554,000oz.2
1 The Sihayo and Sambung deposits Mineral Resource Estimate was previously announced June 17, 2013 and no
material changes have occurred. 2 The Sihayo Ore Reserve was previously announced January 29, 2014 and no material changes have occurred.
For
per
sona
l use
onl
y

REVIEW OF OPERATIONS
6 | P a g e
Figure 1: Significant Indonesian mineral deposits including the Sihayo Pungkut Gold Deposit
Sihayo Pungkut 1.4 Moz Au
Sihayo 75% / PT Antam Tbk 25%
Pongkor Mine
1.6 Moz Au PT Antam
Tbk
Martabe 8.1 Moz Au 73.8
Moz Ag G Resources
Way Linggo
0.49 Moz Au Kingsrose
Mining
Dairi 2.5Mt Zn 1.5Mt Pb
PT Bumi / PTAntam Tbk
Tembang 0.45 Moz Au 5.7 Moz
Ag Sumatra Copper Gold
For
per
sona
l use
onl
y

REVIEW OF OPERATIONS
7 | P a g e
Sihayo Pungkut – Geology
Sihayo Pungkut is located along the Trans Sumatra Fault Zone (“TSFZ”) and associated Neogene Magmatic
Arc (“NMA”), which is the result of an oblique collision of two tectonic plates and associated subduction. A
complex suite of Permian volcanics and sediments, intruded by Jurassic and Cretaceous intrusive plutons,
subsequently juxtaposed or overlain by Tertiary to recent volcanics, intrusives, and sediments comprises the
broader COW area (refer to Figure 2).
Figure 2: Sihayo Pungkut Gold Project – JORC Resource, key prospects and regional geology
The TSFZ has provided the plumbing and heat mechanisms to source, transport and deposit metals in favourable settings. The TSFZ is a major under explored corridor that boasts world class resources such as the Martabe Gold/Silver Deposit. Similar tectonic settings in the Philippines (Philippine’s Fault) and Chile (Atacama Fault) are analogous to the TSFZ and host major gold and copper deposits.
By any measure, Sihayo Pungkut is located in a world class geological address.
The Sihayo and Sambung deposit Mineral Resource Estimates are based upon review and work undertaken by H&S Consultants Pty Ltd1. The relevant JORC 2012 Table 1 is available on the Company website.
Resource Tonnage
(Mt)
Grade Au
(g/t)
Contained Gold
ounces JORC Classification
Au Cut-off
grade (g/t)
SIHAYO 15.3 2.7 1,322,000 Measured & Indicated &
Inferred
1.2
SAMBUNG 1.6 2.0 102,000 Measured & Indicated &
Inferred
1.2
TOTAL 16.9 2.6 1,424,000 Measured & Indicated &
Inferred
1.2
“Above figures may not sum due to rounding. Significant figures do not imply an added level of precision”
For
per
sona
l use
onl
y

REVIEW OF OPERATIONS
8 | P a g e
Table 1: JORC Code (2012 Edition) Mineral Resource Estimate revised by Helman & Scholfield Consultants
Pty Ltd (H&SC) in June 20131
In addition to the current JORC Code (2012 Edition) Mineral Resource Estimate of 1.4 Moz Au, there are over
twenty (20) identified prospects of carbonate-hosted gold, low to intermediate -sulphidation epithermal-
vein gold; gold-copper skarn, copper-gold porphyry, and lead-zinc skarn style mineralisation spread across
the highly prospective COW area and these prospects will be the subject of future exploration activities.
Figure 2 shows the location of the Sihayo - Sambung Resources and key exploration prospects across the
COW that support an opportunity for significant exploration potential for ongoing potential project
generation illustrated in Figure 3 below.
Figure 3: Sihayo Pungkut – Exploration Pipeline of Prospects
For
per
sona
l use
onl
y
REVIEW OF OPERATIONS
9 | P a g e
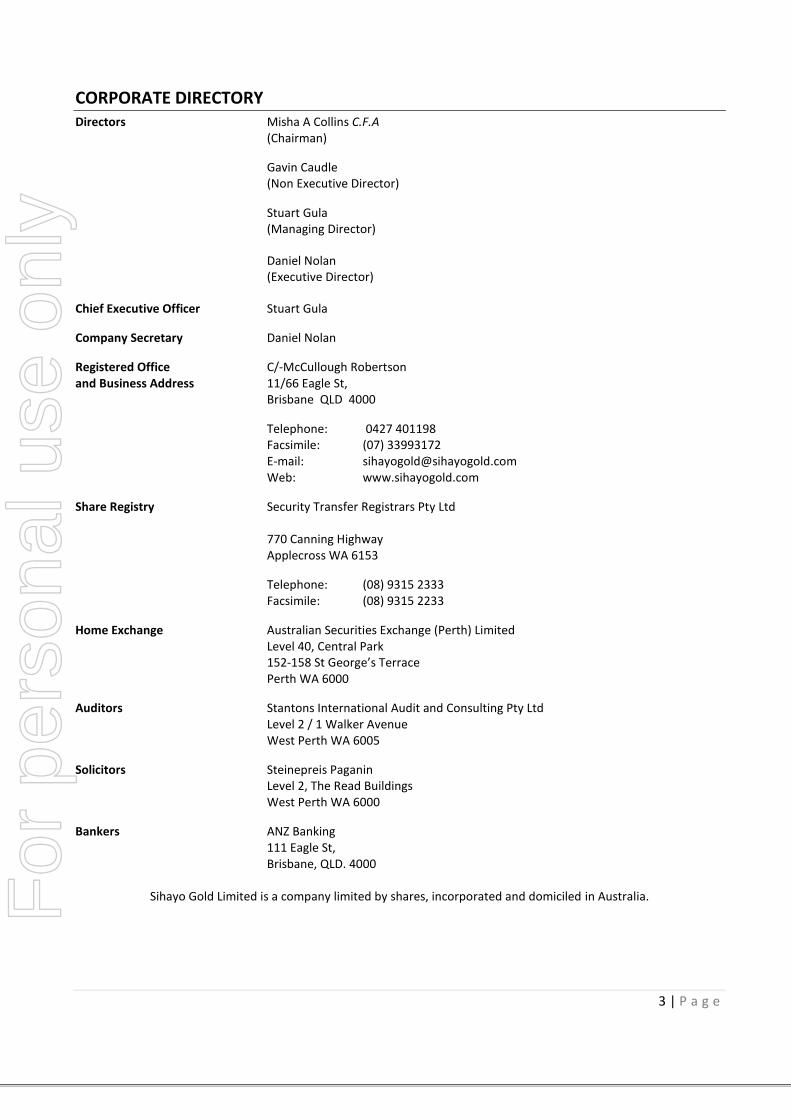
Figure 3: Sihayo-Sambung Resources Location Plan
Figure 4: Geology Cross Section 55000E of Sihayo Resource looking NW
A B
Figure 5
Figure 6
Section 55000E
Section 54500E
For
per
sona
l use
onl
y

REVIEW OF OPERATIONS
10 | P a g e
Figure 5: Enlargement of cross section 55000E shows significant gold intercepts.
For
per
sona
l use
onl
y

REVIEW OF OPERATIONS
11 | P a g e
Figure 6: Enlargement of cross section 55000E showing significant gold intercepts.
For
per
sona
l use
onl
y

REVIEW OF OPERATIONS
12 | P a g e
Figure 7: Geology Cross Section 54500E of Sihayo Resource looking NW.
Figure 8: Cross Section Enlargement 54500E shows significant gold intercepts.
C D
Figure 9
Figure 8
For
per
sona
l use
onl
y

REVIEW OF OPERATIONS
13 | P a g e
Figure 9: Enlargement of cross section 54500E showing significant gold intercepts.
For
per
sona
l use
onl
y

REVIEW OF OPERATIONS
14 | P a g e
Sihayo Feasibility Study
The Sihayo “Maiden” Ore Reserve and Feasibility Study completion was announced on January 29, 2014 and
no material changes have occurred to date.
Indicated and Measured Resources have been converted to Probable and Proved Ore Reserves by Entech Pty
Ltd. The relevant JORC 2012 Table 1 is available on the Company website.
Resource Tonnage
(Mt)
Grade Au
(g/t)
Contained Gold
ounces Resource Category
SIHAYO 2.43 2.4 190,000 Proved
4.71 2.4 363,000 Probable
TOTAL 7.14 2.4 554,000 Proved & Probable
“Calculations have been rounded to the nearest 1,000t, 0.1 g/t grade and 1,000oz metal”
Table 2: JORC Code (2012 Edition) Sihayo Ore Reserves prepared by Entech Pty Ltd (January 2014)2
Highlights of the January 2014 Feasibility Study are summarised as follows;
1.4M Oz Resource previously announced June 2013 completed by H&SC Consultants Pty Ltd
554K Oz Sihayo Ore Reserve estimate (in-situ) and Life of Mine plan prepared by Entech Pty Ltd3
Resources and Reserves prepared in accordance JORC Code (2012 edition) and guidelines for the reporting of Mineral Resource Estimates and Ore Reserves
428K Oz recovered from ‘Sihayo Life of Mine’ (LOM) gold production from proposed open pit mining, includes 35K Oz recovered from Inferred ore
7.8Mt ore mined at 2.4g/t average grade and 3.4:1 (Waste:Ore) strip ratio over 10 year LOM
Carbon in Leach (CIL) processing rate of 750ktpa at an average recovery of 71% delivers approximately 43K Oz/yr over the LOM
Average Site Cash Operating Costs US$775/oz4 (assumes diesel fuel power supply)
Construction Capital Estimate US$58.7M equates to US$137/oz recovered (assumes diesel power generation and excludes contingency)
US$57.5M LOM NPV8 estimate (Pre Tax & including Royalty) assuming gold price at $1,400/oz
Excludes further potential gold production from Sambung and future opportunities from Sihayo
3 Pit optimisation and designs assumed a gold price of US $1,300 / oz
4 LOM Average Site Cash Operating Costs do not include a total of US$27.9m to be spent over the full 10 years of Sihayo
LOM for tailings storage facility construction
For
per
sona
l use
onl
y

REVIEW OF OPERATIONS
15 | P a g e
Figure 10: Project Site Area
For
per
sona
l use
onl
y

REVIEW OF OPERATIONS
16 | P a g e
Figure 11: Typical CIL plant configuration
Permitting and Approvals
The Company continues to operate under an extension to the ‘Feasibility Study Period’ for the Company’s
Contract of Work (CoW) while it progresses through the remaining stages of the final approval of the
Government of the Republic of Indonesia Feasibility Study (“GoIFS”) and associated Forestry of ‘Borrow and
Use’ Permitting.
Key permits for the project to progress to the construction phase are being processed as follows:
1. Government of Indonesia Feasibility Study
A GoIFS was submitted during February 2014 comprising technical and financial information in support of the project. We participated in a number of meetings with Director General of Minerals & Coal within the
Ministry of Energy & Mineral Resources (“MoEMR”) related to review of the GoIFS. Initial approval of
the GoIFS was announced 24 September 2014.
Final Approval is being sought by the Company in parrallel with Forestry Permitting.
2. Environmental Impact Assessment (Analisis Mengenai Dampak Lingkungan Hidup “AMDAL”)
Acceptance of our Terms or Reference Environmental Impact Assessment (KA-ANDAL) on 17 October 2015 provided the basis for us to proceed toward submission of the Environmental and Social Impact Assessment (ANDAL), the Management Plan (RKL) and the Monitoring Plan (RPL) with the Department of Environment (KLH), collectively known as AMDAL. Our initial submission for AMDAL was provided 8 December 2014 and was followed by technical review with KLH and a plenary session that includes KLH and other stakeholders / community representatives during February 2015
For
per
sona
l use
onl
y

REVIEW OF OPERATIONS
17 | P a g e
A revised submission of these documents, incorporating feedback received from the technical and Plenary Sessions, was submitted to KLH on 14 April 2015 and further revisions provided 16 July 2015. The Company announced receipt of approval from the Department of Environment (KLH) and Minister of Environment for the Analisis mengenai Dampak Lingkungan Hidup (AMDAL) AND Enviroment Permit on 1 December 2015.
3. Forestry or ‘Borrow and Use’ (“Izin Princip” & “Pinjam Pakai”)
Permitting from the Forestry Department must be completed subject to receipt of final permits on the above.
Feasibility Study Optimisation
With the passage of time since the completion of the Feasibility Study in January 2014 and the recent
improvement in the gold price the Company believes there are a number of opportunities to optimise the
project financial returns which warrant further investigation.
The Company has also held preliminary discussions with a large EPCM company looking to expand its area of
operations to include Indonesia. Whilst discussions are still at a very embryonic stage and there is no
certainty of progression beyond this stage, this company has raised the possibility of providing a high
proportion of the financing required to construct the project. Potential availability of such project financing
is an additional incentive to re-evaluate and optimise the assumptions in the original Feasibility Study,
especially providing the opportunity to increase the throughput of the mill and plant. The re-
evaluation/optimisation work would focus on:
a) Power Supply
Our discussions with the local and regional power supply regulator indicate progress is being made
to increase the grid power generating capacity in North Sumatra. Some preliminary site investigation
work is required into the potential sizing, location and layout of infrastructure that may be required
to provide grid power to the project. If grid power were to become available, the overall power cost
of the project may be materially reduced.
b) Metallurgical Recovery
The Company is to undertaking an investigation into alternative treatment strategies associated with
near surface (regolith) ores, poor recovery metallurgical composites and geo-metallurgy to
understand opportunities to improve project economics.
c) Construction Capital and Consumables Prices
The Company has been able to study the construction costs and operating costs of two other gold
projects under construction and recently commissioned in Indonesia. The Company would like to
take the insights gained from studying these projects and apply them to the Sihayo/Sambung
project.
There has also been a material and sustained reduction in the price of diesel fuel and other
consumables since the completion of the Feasibility Study. The Company would like to perform a
detailed analysis of these lower prices to determine the overall impact on the Feasibility Study.
For
per
sona
l use
onl
y

REVIEW OF OPERATIONS
18 | P a g e
Regional Exploration
Regional exploration activity and associated costs have been reduced significantly during the year in
accordance with our priority to conclude the Sihayo Feasibility Study and progress the associated permitting
and approvals.
Hutabargot Prospect
Hutabargot Julu is our most significant prospect, located on the south eastern portion of the 11.5km long
Sihayo-Hutabargot mineralised trend (refer to Figure 12 below). This regional structure has the potential to
host high grade gold ore shoots within 10 km of the proposed Sihayo-Sambung CIL processing plant. The
potential size of the gold/silver shoots ranges from smaller satellite zones to larger standalone targets. In
the future, an access road could be constructed linking the Hutabargot Julu prospect to the Sihayo Resource.
The Hutabargot Julu prospect is underlain by a dacitic dome complex and dissected by the Trans Sumatran
Fault Zone. Dacitic stratigraphy has been hydrothermally brecciated and magnetite destructive clay-silica-
pyrite altered defining an approximate 6km x 2km intermediate epithermal gold complex footprint.
The Hutabargot Julu regional structure (dislocation along a major structural zone adjacent to a 100km long
pull apart basin); geology (Dacitic volcanics intruded by diorite over a carbonate basement); vein textures
(evolution relationships / boiling zone textures); and vein mineralogy / geochemistry (gold & silver, trace
base metals, adularia, rhodocrosite, mineral zonation) are all consistent with known major epithermal
deposits around the world, including Newcrest's Gosowong / Kencana deposit in Indonesia.
For
per
sona
l use
onl
y

REVIEW OF OPERATIONS
19 | P a g e
Figure
12: Hutabargot Julu Location
Sihayo & Sambung
1.4 Moz Au
For
per
sona
l use
onl
y

REVIEW OF OPERATIONS
20 | P a g e
Sihayo Pungkut – Corporate Social Responsibility (CSR) Programmes
Ahead of the potential project development the Company has continued to engage local Stakeholders associated with Government permitting and approvals.
As the project progress into construction and operation, the Company remains committed to the delivery of CSR programs in line with our Strategy.
Figure 13: Proposed CSR Strategy
Other Projects
Malawi – Uranium exploration (100%) All activities have been ceased and leases that may have been held have lapsed India – Diamond Exploration (9-10%) No progress was made during the year in resolving the legal status of the tenements. Mount Keith Gold Project – Western Australia (2% net smelter royalty) No mining was undertaken on the project during the year. Mulgabbie Gold Project – Western Australia (2% net smelter royalty) No mining was undertaken on the project during the year.
Competent Persons Statements Sihayo Resource Information that relates to Mineral Resource Estimates at the Sihayo project is based on information compiled by or under the supervision of Mr Robert Spiers, who is an independent consultant and Director of H&S Consultants to Sorikmas Mining Ltd. Mr Spiers has sufficient experience which is relevant to the style of mineralisation and type of deposit under consideration and to the activity which he is undertaking to qualify as an Independent
For
per
sona
l use
onl
y

REVIEW OF OPERATIONS
21 | P a g e
Competent Person as defined in the 2012 edition of the ‘Australasian Code for Reporting of Exploration Results, Mineral Resources and Ore Reserves’ and an Independent Qualified Person as defined in the Canadian National Instrument 43-101 (standards of Disclosure for Mineral Projects). Mr Spiers is a Member of the Australian Institute of Geoscientists and a full time employee of H&S Consultants. Mr Spiers consents to the inclusion in the report of the matters based on his information in the form and context in which it appears. The Sihayo deposit was estimated by H&S Consultants using Ordinary Kriging constrained by mineralisation envelopes prepared using a nominal 0.3g/t gold cut‐off grade as put forth by the Sorikmas Mining Ltd. A down-hole intercept length of 1m was adopted for modelling and the primary block dimensions used in the Sihayo model were 12.5m EW by 12.5m NS by 2.5m vertical. Bulk density was estimated as an attribute of the modelling process and was assigned to the modelling data prior to modelling via a matrix which characterised bulk density based on sample lithological attributes and oxidation state from a data set of 609 bulk density determinations. Historical bulk density sampling outcomes were not employed. Sambung Resource Information that relates to Mineral Resource Estimates at the Sambung project is based on information compiled by or under the supervision of Mr Luke A Burlet, who is an independent consultant and Director of H&S Consultants to Sorikmas Mining Ltd. Mr Burlet has sufficient experience which is relevant to the style of mineralisation and type of deposit under consideration and to the activity which he is undertaking to qualify as an Independent Competent Person as defined in the 2012 edition of the ‘Australasian Code for Reporting of Exploration Results, Mineral Resources and Ore Reserves’ and an Independent Qualified Person as defined in the Canadian National Instrument 43-101 (standards of Disclosure for Mineral Projects). Mr Burlet is a Member of the Australian Institute of Geoscientists and a full time employee of H&S Consultants. Mr Burlet consents to the inclusion in the report of the matters based on his information in the form and context in which it appears. Sihayo Reserve
Information that relates to Ore Reserves at Sihayo is based on information compiled by or under the supervision of Mr Shane McLeay, who is a
Principal Mining Engineer at Entech Pty Ltd and provided to PT Sorikmas Mining. Mr McLeay has sufficient experience which is relevant to the style of
mineralisation and type of deposit under consideration and to the activity which he is undertaking to qualify as an Independent Competent Person as
defined in the 2012 edition of the ‘Australasian Code for Reporting of Exploration Results, Mineral Resources and Ore Reserves’. Mr McLeay is a Fellow
of the Australasian Institute of Mining and Metallurgy and a full time employee of Entech Pty Ltd. Mr McLeay consents to the inclusion in the report of
the matters based on his information in the form and context in which it appears.
Note All statements in this report, other than statements of historical facts that address future timings, activities, events and developments that the Company expects, are forward looking statements. Although Sihayo Gold Limited, its subsidiaries, officers and consultants believe the expectations expressed in such forward looking statements are based on reasonable expectations, investors are cautioned that such statements are not guarantees of future performance and actual results or developments may differ materially from those in the forward looking statements. Factors that could cause actual results to differ materially from forward looking statements include, amongst other things commodity prices, continued availability of capital and financing, timing and receipt of environmental and other regulatory approvals, and general economic, market or business conditions.
For
per
sona
l use
onl
y

DIRECTORS’ REPORT
22 | P a g e SIHAYO GOLD LIMITED
Your directors present their report on the consolidated entity consisting of Sihayo Gold Limited (“Sihayo Gold”, or” the Company”) and the entities it controlled at the end of, or during the year ended 30 June 2016 (“the reporting period”). DIRECTORS The following persons were directors of Sihayo Gold during the financial year and up to the date of this report: Misha Collins - Chairman Gavin Caudle - Non Executive Director Stuart Leslie Gula – Chief Executive Officer (CEO) & Managing Director Daniel Garry Nolan – Executive Director, Chief Financial Officer, Company Secretary PRINCIPAL ACTIVITIES The principal activities of the consolidated entity during the course of the financial year were the continuing development of the Sihayo Pungkut Gold project. There were no significant changes in the nature of those activities during the financial year. DIVIDENDS No dividends have been paid or declared since the end of the previous financial year and no dividend is recommended in respect of this financial year. REVIEW OF OPERATIONS The review of operations is detailed at pages 5-21 OPERATING RESULTS During the financial year the consolidated entity incurred a consolidated operating loss after income tax of $2,542,637 (2015: $6,610,979); which includes nil provision for impairment of capitalised exploration and evaluation expenditure. (2015: nil). At 30 June 2015, the directors made a provision for impairment of VAT receivable of $3,228,165 .No VAT impairment in the current financial year. SIGNIFICANT CHANGES IN THE STATE OF AFFAIRS There have been no significant changes in the state of affairs of the consolidated entity for the 2016 financial year. EMPLOYEES The consolidated entity employed 24 employees as at 30 June 2016 (2015: 32 employees) CORPORATE STRUCTURE The Company has 1,586,424,605 ordinary shares on issue as at the date of this report. The corporate group consists of the parent entity Sihayo Gold Limited, its 100% owned subsidiaries Inland Goldmines Pty Ltd, Excelsior Resources Pty Ltd, Oropa Technologies Pty Ltd, Oropa Indian Resources Pty Ltd, Oropa Exploration Pty Ltd and Aberfoyle Pungkut Investments Pte Ltd. Aberfoyle Pungkut Investments Pte Ltd holds a 75% interest in PT Sorikmas Mining, with an Indonesian Government mining company PT Aneka Tambang Tbk holding the remaining 25%.
For
per
sona
l use
onl
y

DIRECTORS’ REPORT
23 | P a g e
LIKELY FUTURE DEVELOPMENTS Details of important developments occurring in this current financial year have been covered in the review of operations. Further information on likely developments in the operations of the consolidated entity and the expected results have not been included in this report because the directors believe it would be likely to result in unreasonable prejudice to the consolidated entity. FINANCIAL POSITION The net assets of the consolidated entity as at 30 June 2016 are $8,387,484 (2015: $14,147,712). ENVIRONMENTAL REGULATION The consolidated entity has assessed whether there are any particular or significant environmental regulations which apply. It has determined that the risk of non-compliance is low, and has not identified any compliance breaches during the year. INFORMATION ON DIRECTORS Details of the directors of the Company in office at the date of this report are:
Misha A Collins Chairman (Appointed on 29 November 2013) Experience and expertise Mr Collins has 20 years of experience in financial markets with particular emphasis on gold and mining business analysis and evaluation. Mr Collins was employed by BT Funds Management for an 11 year period as an equity analyst covering both domestic and international markets together with the formulation of capital market strategies and commodity forecasting. Mr Collins currently operates his own investment and technical consulting business and acts as Adviser to a Malaysian based Gold and Silver investment fund. Mr Collins holds a Bachelor of Engineering in Metallurgy, graduating with First Class Honours from the RMIT University, a Graduate Certificate in Banking and Finance from Monash University and a Graduate Diploma in Applied Finance and Investment from the Financial Services Institute of Australia. He also completed the CFA program with the US based CFA Institute and has been awarded the Chartered Financial Analyst designation (CFA). Directorships of Other ASX Listed Companies Ask Funding Limited Former ASX Listed Companies Directorships in last 3 years No former directorships Special responsibilities Audit Committee chairman Interests in shares and options 34,666,404 ordinary shares in Sihayo Gold Limited (held indirectly)
For
per
sona
l use
onl
y
DIRECTORS’ REPORT
24 | P a g e
Gavin Caudle (Non Executive Director) Experience and expertise Mr Caudle has over 25 years experience in the finance and investment sectors in Australia, Singapore and Indonesia. Starting his career at Arthur Andersen Australia, he eventually became a partner based in the Jakarta office. He joined Citigroup in 1998 in Indonesia and held positions as Head of Mergers and Head of Private Equity at Citigroup and Country Head of the Investment Bank at Salomon Smith Barney. Since 2003, together with his partners, Gavin has developed numerous successful businesses including Tower Bersama Group (a listed telecommunications infrastructure business), Merdeka Copper & Gold (an Indonesian listed mining Company and Provident Agro (a listed plantation business) with assets valued at more than $3 billion today. Gavin and his partners bring substantial expertise in dealing with all business aspects in Indonesia, most importantly for Sihayo being:
Track record of raising more than US$3 billion of senior, mezzanine and equity capital over the past 7 years; and
Expertise in dealing with forestry issues through the ownership of a substantial plantation business.
Expertise in dealing with mining related issues through the ownership of substantial shareholdings in Sumatra Copper and Gold Limited, Finders Resources Limited and PT Merdeka Mining Gold Tbk.
Directorships of Other ASX Listed Companies Sumatra Copper and Gold Limited Finders Resources Limited Former ASX Listed Companies Directorships in last 3 years No former directorships Special responsibilities Audit Committee member Interests in shares and options 6,613,984 ordinary shares (held directly) 511,602,996 ordinary shares (held indirectly) Stuart Leslie Gula (Chief Executive Officer (CEO)& Managing Director) Experience and expertise Mr Gula has over 25 years management experience in the mining sector in Australia, North America, Africa and Asia. Among many other achievements, his experience includes successful construction completion, commissioning and production of two gold projects in China and Africa and has successfully participated in varied levels of management on feasibility studies for many other projects. Prior to joining Sihayo Gold, he held the position of Group General Manager, Mining - North America for Nyrstar. Nyrstar is a European based integrated metals and mining company with a market capital in excess of USD 1 billion. Mr Gula holds a Bachelors degree in Engineering (mining major) and a Masters of Business Administration (Technology Management).
For
per
sona
l use
onl
y

DIRECTORS’ REPORT
25 | P a g e
Information on Directors (continued) Directorships of Other ASX Listed Companies None Former ASX Listed Companies Directorships in last 3 years No former directorships Interests in shares and options 133,269 ordinary shares (held indirectly) Daniel Garry Nolan (Executive Director, Chief Financial Officer, Company Secretary) The company secretary is Mr Daniel Garry Nolan. Mr Nolan was appointed to the position of company secretary on 1 July 2011. Mr Nolan has worked in finance and accounting for more than 30 years. He has held senior finance positions in Australia, Cambodia, Vietnam and Indonesia. Immediately before joining Sihayo he held senior management roles in the Saratoga Group in Indonesia. Prior to that, he was a senior finance executive at Telstra for 10 years in Australia, Cambodia and Indonesia. Mr Nolan holds a Bachelor of Business from Monash University and a Certificate in Governance and Risk Management from The Governance Institute of Australia Interests in shares and options 4,250,919 ordinary shares (held indirectly) MEETINGS OF DIRECTORS The following tables set out the number of meetings of the Company's directors held during the year ended 30 June 2016, and the number of meetings attended by each director. (Note that meeting attendance may have been completed via telephone conferencing). Directors’ meeting:
Number eligible to attend
Number Attended
M Collins 3 3
Gavin Caudle 3 3
S Gula 3 3
D Nolan 3 3
Audit committee meeting:
Number eligible to attend
Number Attended
M Collins 2 2
Gavin Caudle 2 2
D Nolan 2 2
For
per
sona
l use
onl
y

DIRECTORS’ REPORT
26 | P a g e
REMUNERATION REPORT (AUDITED) The full board of Sihayo Gold act as as the Remuneration Committee at the date of this report The responsibilities and functions of the Remuneration Committee are as follows:
1) review the competitiveness of the Company’s executive compensation programs to ensure: (a) the attraction and retention of corporate officers; (b) the motivation of corporate officers to achieve the Company’s business objectives; and (c) the alignment of the interests of key leadership with the long-term interests of the
Company’s shareholders. 2) review trends in management compensation, oversee the developemnt of new compensation plans
and, when necessary, approve the revision of existing plans; 3) review the performance of executive management; 4) review and approve Chairperson and Chief Executive Officer goals and objectives, evaluate
Chairperson and Chief Executive Officer performance in light of these corporate objectives, and set Chairperson and Chief Executive Officer compensation levels consistent with Company philosophy;
5) approve the salaries, bonus and other compensation for all senior executives, the committee will recommend appropriate salary, bonus and other compensation to the Board for approval;
6) review and approve compensation packages for new corporate officers and termination packages for corporate officers as requested by management;
7) review and approve the awards made under any executive officer bonus plan, and provide an appropriate report to the Board;
8) review and make recommendations concerning long-term incentive compensation plans, including the use of share options and other equity-based plans. Except as otherwise delegated by the Board, the committee will act on behalf of the Board as the “Committee” established to administer equity-based and employee benefit plans, and as such will discharge any responsibilities imposed on the committee under those plans, including making and authorising grants, in accordance with the terms of those plans; and
9) review periodic reports from management on matters relating to the Company’s personnel appointments and practices.
Principles used to determine the nature and amount of remuneration
Non-executive directors receive fees in cash. The fees are fixed and approved by shareholders.
Where non-executive directors provide services in their area of expertise they receive payment at normal commercial rates.
There are no executives (other than directors) with authority for strategic decision making and management.
The remuneration of the directors is not linked directly to the performance of the Company.
For
per
sona
l use
onl
y

DIRECTORS’ REPORT
27 | P a g e
REMUNERATION REPORT (AUDITED) (continued) Details of remuneration Details of the remuneration of key management personnel and related parties of Sihayo Gold Limited, including their personally related entities are set out below for the year ended 30 June 2016. There have been no changes to the below named key management personnel since the end of the reporting period unless noted :
(a) $ 65,000 in directors fees was paid to M Collins as at 30 June 2016. (b) $ 281,250 in directors fees was payable as at 30 June 2016 to G Caudle for fees for the year ended 30
June 2016 and in lieu of previous years directors fees. (c) $ 36,000 salary was paid to D Nolan for the year ended 30 June 2016. (d) $ 367,504 salary was paid to Stuart Gula for the year ended 30 June 2016. (e) $11,062 non monetary benefit is related to Director and Officers Liability Insurance.
(a) $ 65,000 in directors fees was paid to M Collins as at 30 June 2015. (b) $ 236,250 in directors fees was payable as at 30 June 2015 to G Caudle for fees for the year ended 30
June 2015 and in lieu of previous years directors fees. (c) $ 12,000 salary plus superannuation of $ 24,000 was paid to D Nolan for the year ended 30 June 2015. (d) $ 367,504 salary was paid to Stuart Gula for the year ended 30 June 2015.
2016 Short-term Post Employment Long Term
Equity Total
$
Total Remuneration represented by options Name
Cash Salary & Fees
Non Monetary Benefits
Super-annuation
Retirement Benefits
Incentive Plans
LSL Share based payment
M Collins 65,000 1,565 - - - - - 66,565 -
G Caudle 45,000 1,084 - - - - - 46,084 -
D Nolan 36,000 265 - - - - - 36,265 -
S Gula 367,504 8,148 - - - - - 375,652 -
513,504 11,062 - - - - - 524,566 -
2015 Short-term Post Employment Long Term
Equity Total
$
Total remuneration represented by options Name
Cash Salary & Fees
Non Monetary Benefits
Super-annuation
Retirement Benefits
Incentive Plans
LSL Share based payment
M Collins 65,000 1,420 - - - - - 66,420 -
G Caudle 45,000 983 - - - - - 45,983 -
D Nolan 12,000 262 24,000 - - - - 36,262 -
S Gula 367,504 8,030 - - - - 17,828 393,362 4.5%
489,504 10,695 24,000 - - - 17,828 542,027 3.3%
For
per
sona
l use
onl
y

DIRECTORS’ REPORT
28 | P a g e
REMUNERATION REPORT (AUDITED) (continued) No options granted as part of remuneration during the years ended 30 June 2015 & 30 June 2016. There were no shares issued on exercise of compensation options (Consolidated) for the years ended 30 June 2016 or 30 June 2015. Option holdings of key management personnel The number of options over ordinary shares in the Company held during the financial year by each director of Sihayo Gold Limited, including their personally-related entities, are set out below.
Vested at 30 June 2016
30 June 2016 Balance at
beginning of
year
1 July 15
Granted as
remuneration
Options
exercised
Net change
other
Balance at
end of year
30 June 16
Total Exercisable
M Collins - - - - - - -
S Gula 1,000,000 - - (1,000,000)* - - -
D Nolan - - - - - - -
G Caudle - - - - - - -
1,000,000 - - (1,000,000) - - -
*These options expired on 1 October 2015.
Vested at 30 June 2015
30 June 2015 Balance at
beginning
of year
1 July 14
Granted as
remuneration
Options
exercised
Net change
other
Balance at
end of year
30 June 15
Total Exercisable
M Collins - - - - - S Gula 2,000,000 - - (1,000,000) 1,000,000 1,000,000 1,000,000
D Nolan - - - - - - - G Caudle - - - - - - -
2,000,000 - - (1,000,000) 1,000,000 1,000,000 1,000,000
(1)
Shareholdings of Key Management Personnel The number of shares held in the Company during the financial year by each key management personnel of Sihayo Gold Limited, including their personally-related entities, are set out below: Balance
1 July 15
Granted as
remuneration
On exercise
of options
Net change
other
Balances as at date of
resignation/ termination
Balance
30 June 16
30 June
2016
Ord Pref Ord Pref Ord Pref Ord Pref Ord Pref Ord
M Collins 14,529,574 - - - - - - - - - - 14,529,574
G Caudle 155,435,368 - - - - - - - - - 155,435,368
S. Gula 133,269 - - - - - - - - - 133,269
D. Nolan 4,250,919 - - - - - - - - - 4,250,919
For
per
sona
l use
onl
y
DIRECTORS’ REPORT
29 | P a g e
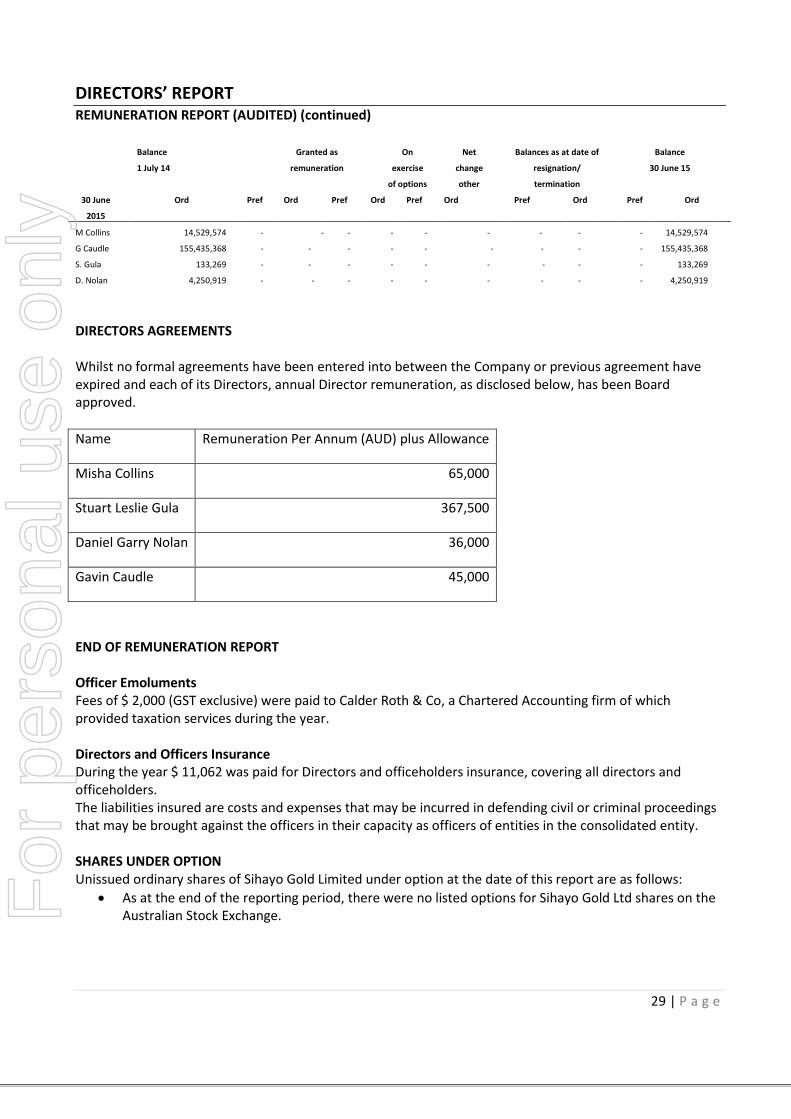
REMUNERATION REPORT (AUDITED) (continued) Balance
1 July 14
Granted as
remuneration
On
exercise
of options
Net
change
other
Balances as at date of
resignation/
termination
Balance
30 June 15
30 June
2015
Ord Pref Ord Pref Ord Pref Ord Pref Ord Pref Ord
M Collins 14,529,574 - - - - - - - - - - 14,529,574
G Caudle 155,435,368 - - - - - - - - - 155,435,368
S. Gula 133,269 - - - - - - - - - 133,269
D. Nolan 4,250,919 - - - - - - - - - 4,250,919
DIRECTORS AGREEMENTS Whilst no formal agreements have been entered into between the Company or previous agreement have expired and each of its Directors, annual Director remuneration, as disclosed below, has been Board approved.
Name Remuneration Per Annum (AUD) plus Allowance
Misha Collins 65,000
Stuart Leslie Gula 367,500
Daniel Garry Nolan 36,000
Gavin Caudle 45,000
END OF REMUNERATION REPORT Officer Emoluments Fees of $ 2,000 (GST exclusive) were paid to Calder Roth & Co, a Chartered Accounting firm of which provided taxation services during the year. Directors and Officers Insurance During the year $ 11,062 was paid for Directors and officeholders insurance, covering all directors and officeholders. The liabilities insured are costs and expenses that may be incurred in defending civil or criminal proceedings that may be brought against the officers in their capacity as officers of entities in the consolidated entity. SHARES UNDER OPTION Unissued ordinary shares of Sihayo Gold Limited under option at the date of this report are as follows:
As at the end of the reporting period, there were no listed options for Sihayo Gold Ltd shares on the Australian Stock Exchange.
For
per
sona
l use
onl
y

DIRECTORS’ REPORT
30 | P a g e
CONVERTIBLE NOTES & WORKING CAPITAL LOAN Total convertible notes issued during the year was USD 1,000,000 with 7% interest accrued daily and compounded monthly. Total working capital loan from Provident Minerals Ltd was USD 400,000 with 10% interest per annum accrued daily and compunded monthly. PROCEEDINGS ON BEHALF OF COMPANY No person entitled to exercise any of the options has any right, by virtue of the options, to participate in any share issue of any other body corporate. The names of all persons who currently hold options, granted at any time, are entered in the register kept by the Company pursuant to Section 216C of the Corporations Act 2001 and the register may be inspected free of charge. No person has applied for leave of Court to bring proceedings on behalf of the Company or intervene in any proceedings to which the Company is a party for the purpose of taking responsibility on behalf of the Company for all or part of these proceedings. The Company was not party to any such proceedings during the year. CORPORATE GOVERNANCE The Company’s Corporate Governance Statement is located at the Company’s Website: http://www.sihayogold.com/view/about-us/corporate-governance
For
per
sona
l use
onl
y

DIRECTORS’ REPORT
31 | P a g e
NON-AUDIT SERVICES There were no non-audit services undertaken by Stantons International during the financial year. A copy of the auditor’s independence declaration as required under section 307C of the Corporations Act 2001 is set out on page 32. Signed in accordance with a resolution of the Board of Directors.
Misha Collins Chairman 30 September 2016
For
per
sona
l use
onl
y

For
per
sona
l use
onl
y

CONSOLIDATED STATEMENT OF PROFIT OR LOSS AND OTHER COMPREHENSIVE INCOME
33 | P a g e SIHAYO GOLD LIMITED
FOR THE YEAR ENDED 30 JUNE 2016
Notes
2016 $
2015 $
Other revenue 3 767 1,844
Total revenue 767 1,844
Corporate secretarial expenses (57,204) (55,115)
Depreciation and amortisation 6 (145,078) (224,859)
Employee benefits expense (471,371) (1,176,128)
External consultancy expenses (318,011) (361,401)
Insurance expense (14,813) (14,446)
Rental expense 3(a)(i) (2,373) (1,537)
Finance costs 3(a)(ii) (483,085) (486,996)
Share based payments 14(a) - (17,828)
Travel and entertainment expenses (36,574) (57,974)
Provision for impairment of capitalised exploration and evaluation costs
7(a)(ii) - -
Provision for impairment of VAT receivable
-
(3,228,165)
Other expenses (1,014,895) (988,374)
Loss before income tax 3 (a) (2,542,637) (6,610,979)
Income tax expense 3(b) - -
Net loss (2,542,637) (6,610,979)
Other comprehensive income Items that will never be classified to profit or loss
- -
Items that may be classified to profit or loss
Movement in foreign currency translation reserve
(3,297,439)
6,086,944
Other comprehensive income for the year, net of tax
(3,297,439)
6,086,944
Total comprehensive (loss) for the year
(5,840,076)
(524,035)
Loss after income tax attributable to:
Members of Sihayo Gold Limited (813,033) (5,119,079)
Non controlling interest (1,729,604) (1,491,900)
(2,542,637) (6,610,979)
Comprehensive loss after income tax attributable to:
Members of Sihayo Gold Limited (4,045,049) 1,814,870
Non controlling interest (1,795,027) (2,338,905)
(5,840,076) (524,035)
Basic/diluted loss per share in cents 22 (0.07) (0.47)
The above Consolidated Statement of Profit or Loss and Other Comprehensive Income should be read in conjuction with the accompanying note
For
per
sona
l use
onl
y

CONSOLIDATED STATEMENT OF FINANCIAL POSITION
34 | P a g e SIHAYO GOLD LIMITED
AS AT 30 JUNE 2016 Notes
2016 $
2015
$
CURRENT ASSETS Cash and cash equivalents 21 27,720 41,004 Trade and other receivables 4 290,042 363,419 Other financial assets 5 - -
TOTAL CURRENT ASSETS 317,762 404,423
NON-CURRENT ASSETS Other assets 7(a) 13,295,317 16,666,152 Inventory 7(b) - 816 Property, plant and equipment 6 145,337 278,960
TOTAL NON-CURRENT ASSETS 13,440,654 16,945,928
TOTAL ASSETS
13,758,416
17,350,351
CURRENT LIABILITIES Trade and other payables 8 645,898 474,968 Borrowings 10 4,214,663 2,169,096 Provisions 9 26,900 26,900 Other liabilities 57,920 59,610
TOTAL CURRENT LIABILITIES 4,945,381 2,730,574
NON-CURRENT LIABILITIES Provisions 9 425,551 472,065
TOTAL NON-CURRENT LIABILITIES 425,551 472,065
TOTAL LIABILITIES
5,370,932
3,202,639
NET ASSETS
8,387,484
14,147,712
SHAREHOLDERS’ EQUITY Parent entity interest: Contributed equity 11 101,526,008 101,446,160 Reserves 12(a) 13,069,188 16,301,204 Accumulated losses 12(b) (98,269,306) (97,456,273)
Total parent entity interest 16,325,890 20,291,091 Minority interest in controlled entities 20(b) (7,938,406) (6,143,379)
TOTAL SHAREHOLDERS’ EQUITY
8,387,484
14,147,712
The above Consolidated Statement of Financial Position should be read in conjunction with the accompanying notes.
For
per
sona
l use
onl
y

CONSOLIDATED STATEMENT OF CASH FLOWS
35 | P a g e SIHAYO GOLD LIMITED
FOR THE YEAR ENDED 30 JUNE 2016
Notes Consolidated 2016
$ 2015
$ CASH FLOWS FROM OPERATING ACTIVITIES Payments to creditors and suppliers & employees
(1,598,698) (2,965,679)
Interest received 767 884
NET CASH FLOWS (USED) IN OPERATING ACTIVITIES 21(b)
(1,597,931)
(2,964,795)
CASH FLOWS FROM INVESTING ACTIVITIES Proceeds from sale of property, plant & equipment
- 23,974
NET CASH RECEIVED / (USED) IN INVESTING ACTIVITIES
- 23,974
CASH FLOWS RECEIVED FROM FINANCING ACTIVITIES
Proceeds from issue of shares and options - 173,505 Proceeds from borrowings 466,908 23,333 Proceeds from convertible notes 1,119,429 2,736,823 Payment of unmarketable securities (1,690) 36,005 Cost of shares to be issued - (81,719)
NET CASH FLOWS RECEIVED FROM FINANCING ACTIVITIES
1,584,647 2,887,947
Net (decrease) in cash and cash equivalents held (13,284) (52,874) Effects of exchange rate changes on cash - 6,859 Cash and cash equivalents at the beginning of the financial year
41,004
87,019
Cash and cash equivalents at the end of the financial year 21 27,720
41,004
The above Consolidated Statement of Cash Flows should be read in conjunction with the accompanying notes.
For
per
sona
l use
onl
y

CONSOLIDATED STATEMENT OF CHANGES IN EQUITY
36 | P a g e SIHAYO GOLD LIMITED
FOR THE YEAR ENDED 30 JUNE 2016
$ $ $ $ $ $ Share Capital
& shares to be issued
Options & Equity
Reserve
FX Reserve Accum Losses Non Controlling
Interest
Total
Balance as at 1.7.14
100,025,876 2,362,570 6,986,860 (92,337,194) (3,804,474) 13,233,638
Total comprehensive loss for the year
- - - (5,119,079) (1,491,900) (6,610,979)
Other comprehensive income:
Movement in foreign currency translation reserve
- - 6,933,949 - (847,005)
6,086,944
Total comprehensive loss
- - 6,933,949 (5,119,079) (2,338,905) (524,035)
Share based payment transactions
- 17,825 - - - 17,825
Issue of shares (net of transaction costs)
1,420,284 - - - - 1,420,284
Balance at 30.06.15 101,446,160 2,380,395 13,920,809 (97,456,273) (6,143,379) 14,147,712
Balance at 1.7.15
101,446,160 2,380,395 13,920,809 (97,456,273) (6,143,379) 14,147,712
Total Comprehensive loss for the year
- - - (813,033) (1,729,604) (2,542,637)
Other comprehensive loss:
Movement in foreign currency translation reserve
- - (3,232,016) - (65,423) (3,297,439)
Total comprehensive loss
- - (3,232,016) (813,033) (1,795,027) (5,840,076)
Issue of shares (net of transaction costs)
79,848 - - - - 79,848
Balance at 30.06.16 101,526,008 2,380,395 10,688,793 (98,269,306) (7,938,406) 8,387,484
The above Consolidated Statement of Changes in Equity should be read in conjunction with the accompanying notesF
or p
erso
nal u
se o
nly

NOTES TO THE FINANCIAL STATEMENTS For The Year Ended 30 June 2016
37 | P a g e SIHAYO GOLD LIMITED
1. SUMMARY OF SIGNIFICANT ACCOUNTING POLICIES The financial statements are general purpose financial statements that have been prepared in accordance with Accounting Standards of the Australian Accounting Standards Board and the Corporations Act 2001. The financial statements cover the economic entity of Sihayo Gold Limited and its controlled entities, and was authorised for issue in accordance with a resolution of the Directors on 30 September 2016. Sihayo Gold Limited is a listed public company, incorporated and domiciled in Australia. The following is a summary of the material accounting policies adopted by the economic entity in the preparation of the financial report. The accounting policies have been consistently applied, unless otherwise stated. Basis of Preparation Statement of compliance The financial report is a general purpose financial report which has been prepared in accordance with Australian Accounting Standards (AASBs) and the Corporations Act 2001. The consolidated financial report of the Group also complies with International Financial Reporting Standards and interpretations adopted by the International Accounting Standards Board.
New standards and interpretations not yet adopted
A number of new standards, amendments to standards and interpretations issued by the AASB which are not yet mandatorily applicable to Sihayo Group have not been applied in preparing these consolidated financial statements. Those which may be relevant to the Group are set out below. Sihayo Group does not plan to adopt these standards early. Certain new accounting standards and interpretations have been published that are not mandatory for 30 June 2016 reporting year. The group’s assessment of the impact of these new standards and interpretations is set out below:
AASB 9 Financial Instruments and associated Amending Standards (applicable for annual
reporting period commencing 1 January 2018)
The Standard will be applicable retrospectively (subject to the comment on hedge accounting
below) and includes revised requirements for the classification and measurement of financial
instruments, revised recognition and derecognition requirements for financial instruments and
simplified requirements for hedge accounting.
Key changes made to this standard that may affect the Group on initial application include
certain simplifications to the classification of financial assets, simplifications to the accounting of
embedded derivatives, and the irrevocable election to recognise gains and losses on investments
in equity instruments that are not held for trading in other comprehensive income.
The directors anticipate that the adoption of AASB 9 will not have a material impact on the
Group’s financial instruments).
For
per
sona
l use
onl
y

NOTES TO THE FINANCIAL STATEMENTS For The Year Ended 30 June 2016
38 | P a g e
1. SUMMARY OF SIGNIFICANT ACCOUNTING POLICIES (continued)
AASB 15: Revenue from Contracts with Customers (applicable to annual reporting periods
commencing on or after 1 January 2017)
When effective, this Standard will replace the current accounting requirements applicable to
revenue with a single, principles-based model. Except for a limited number of exceptions,
including leases, the new revenue model in AASB 15 will apply to all contracts with customers as
well as non-monetary exchanges between entities in the same line of business to facilitate sales
to customers and potential customers.
The core principle of the Standard is that an entity will recognise revenue to depict the transfer
of promised goods or services to customers in an amount that reflects the consideration to
which the entity expects to be entitled in exchange for the goods or services. To achieve this
objective, AASB 15 provides the following five-step process:
- identify the contract(s) with a customer;
- identify the performance obligations in the contract(s);
- determine the transaction price;
- allocate the transaction price to the performance obligations in the contract(s); and
- recognise revenue when (or as) the performance obligations are satisfied.
This Standard will require retrospective restatement, as well as enhanced disclosures regarding
revenue.
Although the directors anticipate that the adoption of AASB 15 may have an impact on the
Group's financial statements, it is impracticable at this stage to provide a reasonable estimate of
such impact.
Other standards not yet applicable
There are no other standards that are not yet effective and that would be expected to have a
material impact on the entity in the current or future reporting periods and on foreseeable
future transactions
For
per
sona
l use
onl
y

NOTES TO THE FINANCIAL STATEMENTS For The Year Ended 30 June 2016
39 | P a g e
1. SUMMARY OF SIGNIFICANT ACCOUNTING POLICIES (continued)
New and amended standards adopted by the Group
The group has considered the implications of new and amended Accounting Standards applicable for annual reporting periods beginning after 1 January 2015 but determined that their application to the financial statements is either not relevant or not material.
a) Going Concern
The consolidated financial statements have been prepared on a going concern basis. As at 30 June 2016, the Group has negative working capital of $4,627,619 (2015: $2,326,151), cash & cash equivalents of $27,720 (2015:$41,004) and current liabilities of $4,945,381 which includes borrowings of $4,214,663. However there was a right issue in July to September 2016 which injected $4,501,324 back to the working capital to repay all the borrowings. All borrowings from Provident and Saratoga were repaid in September 2016. At this time, the Directors are of the opinion that no asset is likely to be realised for an amount less than the amount at which it is recorded in the financial report at 30 June 2016. Accordingly, no adjustments have been made to the financial report relating to the recoverability and classification of the asset carrying amounts or the amounts and classification of liabilities that might be necessary should the Company not continue as a going concern.
b) Principles of Consolidation
The consolidated financial statements incorporate the assets, liabilities and results of entities controlled by Sihayo Gold Limited and all of the subsidiaries. Subsidiaries are entities the parent controls. The parent controls an entity when it is exposed to, or has rights to, variable returns from its involvement with the entity and has the ability to affect those returns through its power over the entity. A list of the subsidiaries is provided in Note 20. The assets, liabilities and results of all subsidiaries are fully consolidated into the financial statements of the Group from the date on which control is obtained by the Group. The consolidation of a subsidiary is discontinued from the date that control ceases. Intercompany transactions, balances and unrealised gains or losses on transactions between Group entities are fully eliminated on consolidation. Accounting policies of subsidiaries have been changed and adjustments made where necessary to ensure uniformity of the accounting policies adopted by the Group. Equity interests in a subsidiary not attributable, directly or indirectly, to the Group are presented as “non controlling interests". The Group initially recognises non-controlling interests that are present ownership interests in subsidiaries and are entitled to a proportionate share of the subsidiary's net assets on liquidation at either fair value or at the non-controlling interests' proportionate share of the subsidiary's net assets. Subsequent to initial recognition, non-controlling interests are attributed their share of profit or loss and each component of other comprehensive income. Non-controlling interests are shown separately within the equity section of the statement of financial position and statement of comprehensive income.
For
per
sona
l use
onl
y

NOTES TO THE FINANCIAL STATEMENTS For The Year Ended 30 June 2016
40 | P a g e
1. SUMMARY OF SIGNIFICANT ACCOUNTING POLICIES (continued)
c) Business Combinations
The purchase method of accounting is used to account for business combinations regardless of whether equity instruments or other assets are acquired. The cost of a business combination is measured as the fair value of the assets given, shares issued or liabilities incurred or assumed at the date of exchange and the amount of any non-controlling interest in the acquiree. For each business combination, the acquirer measures the non-controlling interest in the acquiree either at fair value or at the proportionate share of the acquiree's identifiable net assets. Acquisition-related costs are expensed as incurred. Where equity instruments are issued in a business combination, the fair value of the instruments is their published market price as at the date of exchange unless, in rare circumstances, it can be demonstrated that the published price at the date of exchange is an unreliable indicator of fair value and that other evidence and valuation methods provide a more reliable measure of fair value. Identifiable assets acquired and liabilities and contingent liabilities assumed in a business combination are measured initially at their fair values at the acquisition date, irrespective of the extent of any non-controlling interest. The excess of the cost of the business combination over the fair value of the Group’s share of the identifiable net assets acquired is recorded as goodwill. If the cost of acquisition is less than the fair value of the net assets acquired, the difference is recognised directly in the Statement of Comprehensive Income, but only after a reassessment of the identification and measurement of the net assets acquired. If the business combination is achieved in stages, the acquisition date fair value of the acquirer's previously held equity interest in the acquiree is remeasured at fair value as at the acquisition date through profit or loss. Where settlement of any part of cash consideration is deferred, the amounts payable in the future are discounted to their present value as at the date of exchange. The discount rate used is the entity’s incremental borrowing rate, being the rate at which a similar borrowing could be obtained from an independent financier under comparable terms and conditions.
d) Income Tax The charge for current income tax expenses is based on the profit for the year adjusted for any non-assessable or disallowed items. It is calculated using tax rates that have been enacted or are substantively enacted by the balance sheet date. Deferred tax is accounted for using the balance sheet liability method in respect of temporary differences arising between the tax bases of assets and liabilities and their carrying amounts in the financial statements.
No deferred income tax will be recognised from the initial recognition of an asset or liability, excluding business combination, where there is no effect on accounting or taxable profit or loss. Deferred tax is calculated at the tax rates that are expected to apply to the period when the asset is realised or liability is settled. Deferred tax is credited in the statement of comprehensive income except where it relates to items that may be credited directly to equity, in which case the deferred tax is adjusted directly against equity.
For
per
sona
l use
onl
y

NOTES TO THE FINANCIAL STATEMENTS For The Year Ended 30 June 2016
41 | P a g e
1.SUMMARY OF SIGNIFICANT ACCOUNTING POLICIES (continued)
(d) Income Tax (continued) Deferred income tax assets are recognised to the extent that it is probable that future tax profits will be available against which deductible temporary differences can be utilised. The amount of benefits brought to account or which may be realised in the future is based on the assumption that no adverse change will occur in income tax legislation and the anticipation that the economic entity will derive sufficient future assessable income to enable the benefit to be realised and comply with the conditions of deductibility imposed by the law.
e) Property, Plant & Equipment Each class of property, plant and equipment is carried at cost or fair value less, where applicable, any accumulated depreciation and impairment losses. Plant and equipment Property, plant and equipment are measured on the cost basis less depreciation and impairment losses. The carrying amount of plant and equipment is reviewed annually by directors to ensure it is not in excess of the recoverable amount from these assets. The recoverable amount is assessed on the basis of the expected net cash flows that will be received from the assets employment and subsequent disposal. The expected net cash flows have been discounted to their present values in determining recoverable amounts Depreciation The depreciable amount of all Property, Plant and Equipment (other than Leasehold Improvements and certain plant and equipment which are based on the prime cost method) is based on the diminishing value method over their useful lives to the Company commencing from the time the assets are held ready for use. The depreciation rates used for plant and equipment vary between 2.5% and 40%. The assets’ residual values and useful lives are reviewed, and adjusted if appropriate, at each balance sheet date. An asset’s carrying amount is written down immediately to its recoverable amount if the asset’s carrying value is greater than its estimated recoverable amount. Gains and losses on disposals are determined by comparing proceeds with the carrying amount. These gains and losses are included in the statement of comprehensive income.
f) Acquistion of Assets The purchase method of accounting is used for all acquisitions of assets regardless of whether shares or other assets are acquired. Cost is determined as the fair value of the assets given up, shares issued or liabilities undertaken at the date of acquisition plus costs incidental to the acquisition. Where shares are issued in an acquisition, the value of the shares is determined having reference to the fair value of the assets or net assets acquired, including goodwill or discount on acquisition where applicable. Where settlement of any part of cash consideration is deferred, the amounts payable in the future are discounted to their present value as at the date of the acquisition. The discount rate used is the rate at which a similar borrowing could be obtained under comparable terms and conditions.
For
per
sona
l use
onl
y

NOTES TO THE FINANCIAL STATEMENTS For The Year Ended 30 June 2016
42 | P a g e
1.SUMMARY OF SIGNIFICANT ACCOUNTING POLICIES (continued)
g) Exploration and Evaluation Expenditure Exploration, evaluation and development expenditure incurred is accumulated in respect of each identifiable area of interest. These costs are only carried forward to the extent that they are expected to be recouped through the successful development of the area or where activities in the areas have not yet reached a stage that permits reasonable assessment of the existence of economically recoverable reserves. Accumulated costs in relation to an abandoned area are written off in full against profit in the year in which the decision to abandon the area is made. When production commences, the accumulated costs for the relevant area of interest are amortised over the life of the area according to the rate of depletion of the economically recoverable reserves. A regular review is undertaken of each area of interest to determine the appropriateness of continuing to carry forward costs in relation to that area of interest.
h) Financial Instruments Recognition Financial instruments are initially measured at cost on trade date, which includes transaction costs, when the related contractual rights or obligations exist. Subsequent to initial recognition these instruments are measured as set out below. Loans and receivables Loans and receivables are non-derivative financial assets with fixed or determinable payments that are not quoted in an active market and are stated at amortised cost using the effective interest rate method. Financial liabilities Non-derivative financial liabilities are recognised at amortised cost, comprising original debt less principal payments and amortisation. Fair value Fair value is determined based on current bid prices for all quoted investments. Valuation techniques are applied to determine the fair value for all unlisted securities, including recent arm’s length transactions, reference to similar instruments and option pricing models. Impairment At each reporting date, the group assesses whether there is objective evidence that a financial instrument has been impaired. Impairment losses are recognised in the statement of comprehensive income.
i) Impairment of Assets At each reporting date, the group reviews the carrying values of its tangible and intangible assets to determine whether there is any indication that those assets have been impaired. If such an indication exists, the recoverable amount of the asset, being the higher of the asset’s fair value less costs to sell and value in use, is compared to the asset’s carrying value. Any excess of the asset’s carrying value over its recoverable amount is expensed to the statement of comprehensive income.
For
per
sona
l use
onl
y

NOTES TO THE FINANCIAL STATEMENTS For The Year Ended 30 June 2016
43 | P a g e
1.SUMMARY OF SIGNIFICANT ACCOUNTING POLICIES (continued)
j) Interests in Joint Arrangements Joint arrangements represent the contractual sharing of control between parties in a business venture where unanimous decisions about relevant activities are required. Separate joint venture entities providing joint venturers with an interest to net assets are classified as a "joint venture" and accounted for using the equity method. Joint venture operations represent arrangements whereby joint operators maintain direct interests in each asset and exposure to each liability of the arrangement. The Group's interests in the assets, liabilities, revenue and expenses of joint operations are included in the respective line items of the consolidated financial statements. Gains and losses resulting from sales to a joint operation are recognised to the extent of the other parties' interests. When the Group makes purchases from a joint operation, it does not recognise its share of the gains and losses from the joint arrangement until it resells those goods/assets to a third party.
k) Functional and Presentation Currency The functional currency of each of the group’s entities is measured using the currency of the primary economic environment in which that entity operates. The consolidated financial statements are presented in Australian dollars which is the parent entity’s functional and presentation currency.
l) Foreign Currency Transactions and Balances Foreign currency transactions are translated into functional currency using the exchange rates prevailing at the date of the transaction. Foreign currency monetary items are translated at the year end exchange rate. Non-monetary items measured at historical costs continue to be carried at the exchange rate at the date of the transaction. Non-monetary items measured at fair value are reported at the exchange rate at the date when fair values were determined. Exchange differences arising on the translation of monetary items are recognised in the statement of comprehensive income, except where deferred in equity as a qualifying cashflow or net investment hedge. Exchange differences arising on the translation of non-monetary items are recognised directly in equity to the extent that the gain or loss is directly recognised in equity, otherwise the exchange difference is recognised in the statement of comprehensive income.
For
per
sona
l use
onl
y
NOTES TO THE FINANCIAL STATEMENTS For The Year Ended 30 June 2016
44 | P a g e
1.SUMMARY OF SIGNIFICANT ACCOUNTING POLICIES (continued)
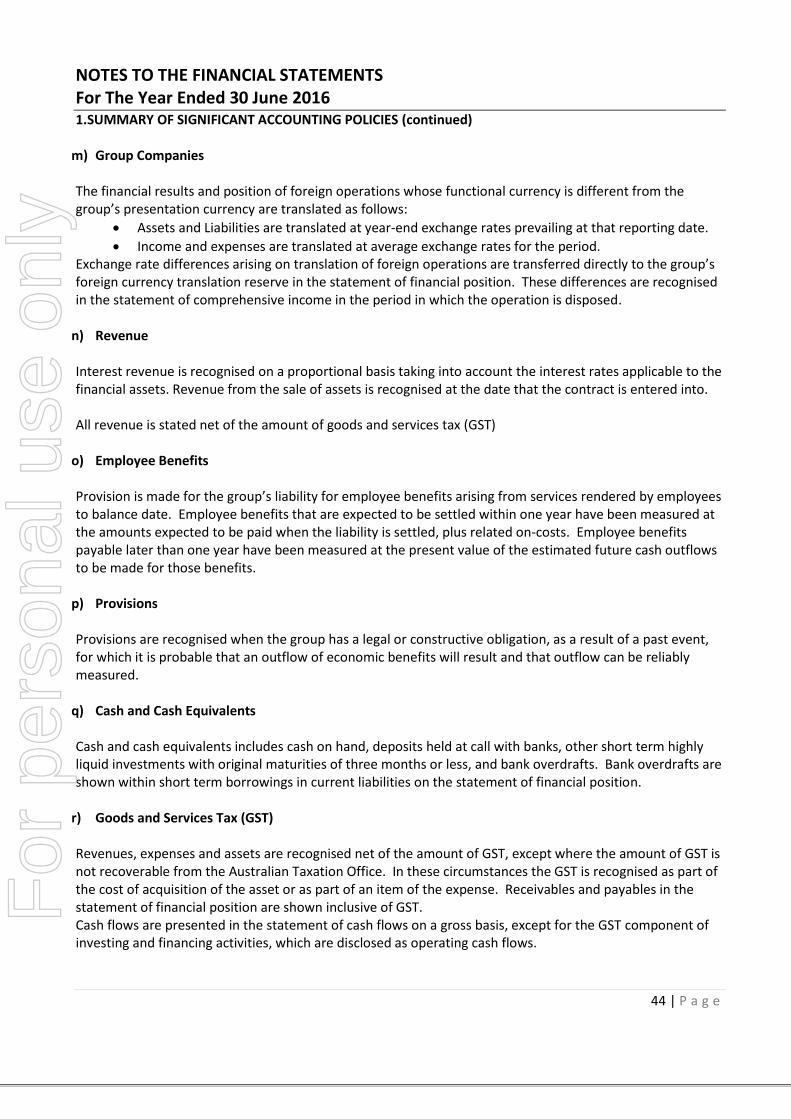
m) Group Companies The financial results and position of foreign operations whose functional currency is different from the group’s presentation currency are translated as follows:
Assets and Liabilities are translated at year-end exchange rates prevailing at that reporting date.
Income and expenses are translated at average exchange rates for the period. Exchange rate differences arising on translation of foreign operations are transferred directly to the group’s foreign currency translation reserve in the statement of financial position. These differences are recognised in the statement of comprehensive income in the period in which the operation is disposed.
n) Revenue Interest revenue is recognised on a proportional basis taking into account the interest rates applicable to the financial assets. Revenue from the sale of assets is recognised at the date that the contract is entered into. All revenue is stated net of the amount of goods and services tax (GST)
o) Employee Benefits Provision is made for the group’s liability for employee benefits arising from services rendered by employees to balance date. Employee benefits that are expected to be settled within one year have been measured at the amounts expected to be paid when the liability is settled, plus related on-costs. Employee benefits payable later than one year have been measured at the present value of the estimated future cash outflows to be made for those benefits.
p) Provisions Provisions are recognised when the group has a legal or constructive obligation, as a result of a past event, for which it is probable that an outflow of economic benefits will result and that outflow can be reliably measured.
q) Cash and Cash Equivalents Cash and cash equivalents includes cash on hand, deposits held at call with banks, other short term highly liquid investments with original maturities of three months or less, and bank overdrafts. Bank overdrafts are shown within short term borrowings in current liabilities on the statement of financial position.
r) Goods and Services Tax (GST) Revenues, expenses and assets are recognised net of the amount of GST, except where the amount of GST is not recoverable from the Australian Taxation Office. In these circumstances the GST is recognised as part of the cost of acquisition of the asset or as part of an item of the expense. Receivables and payables in the statement of financial position are shown inclusive of GST. Cash flows are presented in the statement of cash flows on a gross basis, except for the GST component of investing and financing activities, which are disclosed as operating cash flows.
For
per
sona
l use
onl
y

NOTES TO THE FINANCIAL STATEMENTS For The Year Ended 30 June 2016
45 | P a g e
1.SUMMARY OF SIGNIFICANT ACCOUNTING POLICIES (continued)
s) Share Based Payment Transactions The group provides benefits to the directors and senior executives in the form of share-based payment transactions, whereby services are rendered in exchange for shares or rights over shares (‘equity settled transactions’). The cost of these equity settled transactions with directors is measured by reference to the fair value at the date at which they are granted. The fair value is determined by an external valuer using the Black- Scholes model. In valuing equity-settled transactions, no account is taken of any performance conditions, other than conditions linked to the price of the shares of Sihayo Gold Limited. The cost of equity-settled transactions is recognised, together with a corresponding increase in equity, over the period in which the market conditions are fulfilled. The cumulative expense recognised for equity-settled transactions at each reporting date until vesting date reflects (i) the extent to which the vesting period has expired and (ii) the number of awards that in the opinion of the directors will ultimately vest. The opinion is formed on the best available information at balance date. No adjustment is made for the likelihood of market performance conditions being met as the effect of these conditions is included in the determination of fair value at grant date. No expense is recognised for awards that do not ultimately vest, except for awards where vesting is conditional upon market condition. Where the terms of an equity-settled award are modified, as a minimum an expense is recognised as if the terms had not been modified. In addition, an expense is recognised for any increase in the value of the transaction as a result of the modification, as measured at the date of modification. Where an equity-settled award is cancelled, it is treated as if it had vested on the date of cancellation, and any expense not yet recognised for the award is recognised immediately. However, if a new award is substituted for the cancelled award, and designated as a replacement award on the date that it is granted, the cancelled and new award are treated as if they were a modification of the original award, as described in the previous paragraph. The dilutive effect, if any, of outstanding options is reflected as additional share dilution in the computation of earnings per share.
For
per
sona
l use
onl
y

NOTES TO THE FINANCIAL STATEMENTS For The Year Ended 30 June 2016
46 | P a g e
1.SUMMARY OF SIGNIFICANT ACCOUNTING POLICIES (continued)
t) Trade and Other Receivables CURRENT All trade debtors are recognised at the amounts receivable as they are due for settlement no more than 30 days from the date of recognition. Collectability of trade debtors is reviewed on an ongoing basis. Debts which are known to be uncollectible are written off. A provision for doubtful debts is raised when some doubt as to collection exists and in any event when the debt is more than 60 days overdue.
u) Trade and Other Receivables NON-CURRENT All debtors that are not expected to be received within 12 months of reporting date are included in non-current receivables. Collectability of non-current receivables is reviewed on an ongoing basis. Debts which are known to be uncollectible are written off. A provision for doubtful debts is raised when some doubt as to collection exists.
v) Trade and Other Creditors These amounts represent liabilities for goods and services provided to the consolidated entity prior to the end of the financial year and which are unpaid. The amounts are unsecured and are usually paid within 30 days of recognition
w) Operating Leases Operating lease payments are charged to the Statement of comprehensive income in the periods in which they are incurred, as this represents the pattern of benefits derived from the leased assets.
x) Significant Accounting Judgements, Estimates and Assumptions Significant accounting judgements In the process of applying the Group’s accounting policies, management has made the following judgements, apart from those involving estimations, which have the most significant effect on the amounts recognised in the financial statements: Exploration and evaluation assets The Group’s accounting policy for exploration and evaluation expenditure is set out above. The application of this policy necessarily requires management to make certain estimates and assumptions as to future events and circumstances, in particular, the assessment of whether economic quantities of reserves are found. Any such estimates and assumptions may change as new information becomes available. Significant accounting estimates and assumptions The carrying amounts of certain assets and liabilities are often determined based on estimates and assumptions of future events. The key estimates and assumptions that have a significant risk of causing a material adjustment to the carrying amounts of certain assets and liabilities within the next annual reporting period are:
For
per
sona
l use
onl
y

NOTES TO THE FINANCIAL STATEMENTS For The Year Ended 30 June 2016
47 | P a g e
1.SUMMARY OF SIGNIFICANT ACCOUNTING POLICIES (continued) x) Significant Accounting Judgements, Estimates and Assumptions (continued)
Recovery of deferred assets Deferred tax assets are recognised for deductible temporary differences when management considers that it is probable that future taxable profits will be available to utilise those temporary differences. Share-based payment transactions The Group measures the cost of equity-settled transactions with employees by reference to the fair value of the equity instruments at the date at which they are granted. The Group measures the cost of cash-settled share-based payments at fair value at the grant date using the Black-Scholes model taking into account the terms and conditions upon which the instruments were granted. y) Segment Reporting
The Group determines and presents operating segments based on the information that internally is provided to the Managing Director, who is the Group’s chief operating decision maker. An operating segment is a component of the Group that engages in business activities from which it may earn revenues and incur expenses, including revenues and expenses that relate to transactions with any of the Group’s other components. All operating segments’ operating results are regularly reviewed by the Managing Director to make decisions about resources to be allocated to the segment and assess its performance. Unless stated otherwise, all amounts reported to the Board of Directors as the chief decision maker with respect to operating segments are determined in accordance with accounting policies that are consistent to those adopted in the annual financial statements of the Group. Intersegment loans payable and receivable are initially recognised at the consideration received net of transaction costs. If intersegment loans receivable and payable are not on commercial terms, these are not adjusted to fair value on market interest rates.
For
per
sona
l use
onl
y
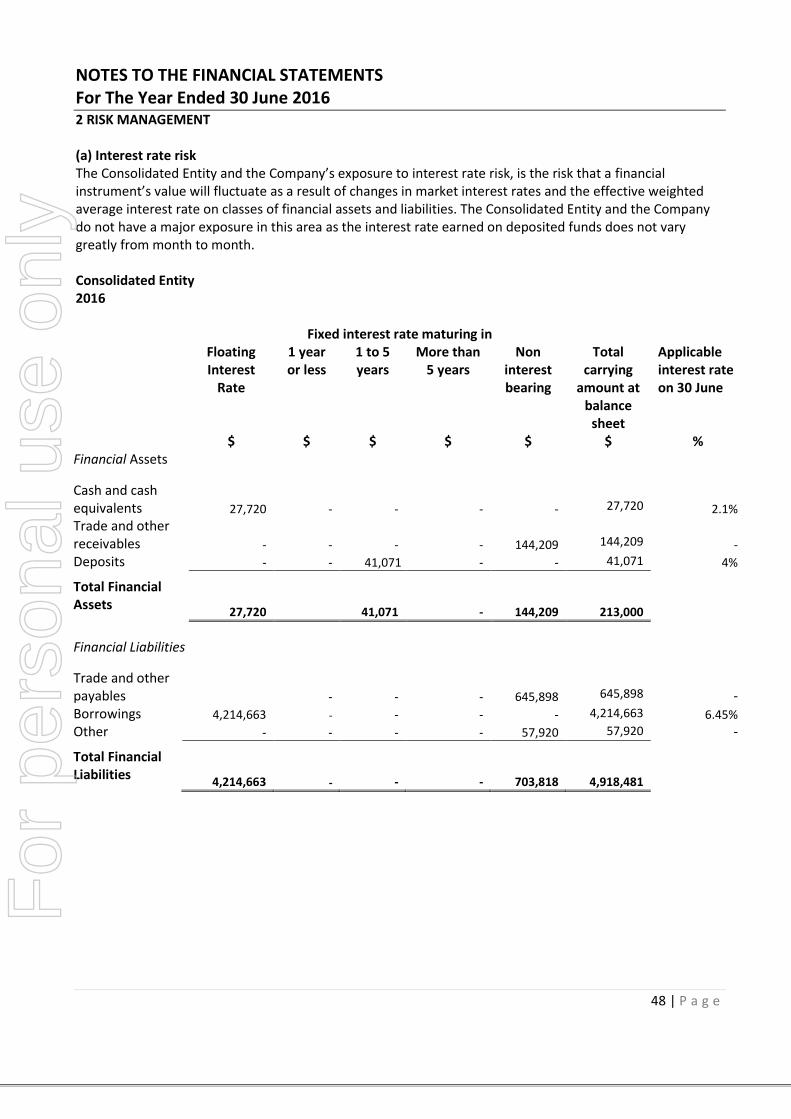
NOTES TO THE FINANCIAL STATEMENTS For The Year Ended 30 June 2016
48 | P a g e
2 RISK MANAGEMENT (a) Interest rate risk The Consolidated Entity and the Company’s exposure to interest rate risk, is the risk that a financial instrument’s value will fluctuate as a result of changes in market interest rates and the effective weighted average interest rate on classes of financial assets and liabilities. The Consolidated Entity and the Company do not have a major exposure in this area as the interest rate earned on deposited funds does not vary greatly from month to month. Consolidated Entity 2016
Fixed interest rate maturing in
Floating Interest
Rate
$
1 year or less
$
1 to 5 years
$
More than 5 years
$
Non interest bearing
$
Total carrying
amount at balance
sheet $
Applicable interest rate on 30 June
% Financial Assets
Cash and cash equivalents 27,720 - - - -
27,720 2.1%
Trade and other receivables - - - - 144,209
144,209 -
Deposits - - 41,071 - - 41,071 4%
Total Financial Assets
27,720 41,071 - 144,209
213,000
Financial Liabilities
Trade and other payables - - - 645,898
645,898 -
Borrowings 4,214,663 - - - - 4,214,663 6.45% Other - - - - 57,920 57,920 -
Total Financial Liabilities
4,214,663 - - - 703,818
4,918,481
For
per
sona
l use
onl
y

NOTES TO THE FINANCIAL STATEMENTS For The Year Ended 30 June 2016
49 | P a g e
2 RISK MANAGEMENT (continued) Consolidated Entity 2015
Fixed interest maturing in
Floating Interest
Rate
$
1 year or less
$
1 to 5 years
$
More than 5 years
$
Non interest bearing
$
Total carrying
amount at balance
sheet $
Applicable interest rate on 30 June
% Financial Assets Cash and cash equivalents 41,004 - - - -
41,004 3.50% Trade and other receivables - - - - 363,419
363,419 -
Other financial assets - - - - -
- -
Deposits - - 39,865 - - 39,865 5.00%
Total Financial Assets
41,004 - 39,865 - 363,419
444,288
Trade and other payables - - - - 474,968
474,968 -
Loan Payable - 2,169,096 - - - 2,169,096 7.00%
Other - - - - 59,610 59,610 -
Total Financial Liabilities
- 2,169,096 - - 534,578
2,703,674
(b) Credit risk exposures The consolidated entity and the Company has no significant concentrations of credit risk. The maximum exposure to credit risk at balance date is the carrying amount (net of provision of doubtful debts) of those assets as disclosed in the statement of financial position and note 23. As the consolidated entity and Company does not presently have any debtors arising from sales, lending, significant stock levels or any other credit risk, a formal credit risk management policy is not maintained. (c) Foreign currency risk management The Consolidated Entity and the Company is exposed to fluctuations in foreign currencies arising from costs incurred at overseas mineral exploration tenements. To mitigate this risk the Company holds cash in the currency in which it forecasts the costs will be incurred.
For
per
sona
l use
onl
y

NOTES TO THE FINANCIAL STATEMENTS For The Year Ended 30 June 2016
50 | P a g e
2 RISK MANAGEMENT (continued) (d) Liquidity risk Liquidity risk is the risk that the Consolidated Entity and the Company will not be able to meet its financial obligations as they fall due. Financial obligations of the Consolidated Entity and the Company consist of trade creditors and other payables. The Company has not conducted a sensitivity analysis on credit or interest rate risk as the amounts are not considered significant. (e) Financial risk management
2016 Level 1 $
Level 2 $
Level 3 $
Total $
Shares in listed
companies
- - - -
- - - -
2015
Shares in listed
companies
- - - -
-
-
-
-
Included within Level 1 of the hierarchy are listed investments. The fair values of these financial assets and liabilities have been based on the closing quoted prices at reporting date, excluding transaction costs. In valuing unlisted investments – included in Level 2 of the hierarchy – valuation techniques such as those using comparisons to similar investments for which market observable prices are available have been adopted to determine the fair values of these investments. Derivative instruments are included in Level 2 of the hierarchy with the fair values determined using valuation techniques incorporating observable market data relevant to the hedged position.
For
per
sona
l use
onl
y

NOTES TO THE FINANCIAL STATEMENTS For The Year Ended 30 June 2016
51 | P a g e
Consolidated 2016 2015 $ $ 3.REVENUE Revenue from the operating activities Interest 767 1,844
767 1,844
3(a)LOSS BEFORE INCOME TAX Net Expenses Consolidated The loss before income tax includes the following expenses: 2016 2015 (i) Expenses:
$ $
Share based payment - 17,828
Depreciation 145,078 224,859
Rental expenses 2,373 1,537
147,451 244,224
(ii)Finance costs consists of interest expenses and movements in derivative liability
Finance costs 483,085 486,996
(iii) Numerical reconciliation of income tax expense to prima facie tax payable:
3(b) INCOME TAX EXPENSE
Consolidated
2016 2015
$ $
Loss from ordinary activities before income tax expense
(2,542,637) (6,610,979)
(i) Prima facie tax benefit on loss from ordinary activities (762,791) (1,983,294)
For
per
sona
l use
onl
y

NOTES TO THE FINANCIAL STATEMENTS For The Year Ended 30 June 2016
52 | P a g e
3(b) INCOME TAX EXPENSE (continued)
Tax effects of amounts which are not deductible (taxable)
In calculating taxable income:
Provisions - 6,000
Share based payment - 5,348
Provision for impairment of VAT receivable - 968,450
(762,791) (1,003,496)
Movement in unrecognised temporary Difference
34,462 916,202
Tax effect of current year tax losses for which no deferred tax asset has been recognised
728,329
87,294
Income tax expense - -
(ii) Unrecognised temporary differences
Deferred Tax Assets (at 30%)
Carried forward revenue tax losses 8,463,995 6,072,375 Carried forward capital tax losses 1,042,655 854,111 Provisions - 6,000 Black hole expenditure 45,178 79,640
9,551,828 7,012,126
This benefit for tax losses will only be obtained if: (i) the consolidated entity derives future assessable income of a nature and of an amount sufficient to
enable the benefit from the deductions for the losses to be realised, or (ii) the losses are transferred to an eligible entity in the consolidated entity, and (iii) the consolidated entity continues to comply with the conditions for deductibility imposed by tax
legislation; and (iv) no changes in tax legislation adversely affect the consolidated entity in realising the benefit from the
deductions for the losses.
For
per
sona
l use
onl
y

NOTES TO THE FINANCIAL STATEMENTS For The Year Ended 30 June 2016
53 | P a g e
Consolidated 2016 2015 4.TRADE AND OTHER RECEIVABLES $ $
CURRENT Other debtors 290,042 363,419
290,042 363,419
NON CURRENT VAT receiveable 3,228,165 3,228,165 Provision for impairment (3,228,165) (3,228,165)
- -
VAT receiveables will be recoverable from the Indonesian goverment once production commences. At 30 June 2016. VAT receiveables has been fully provided for. As the reporting date, none of the other debtors were past due or impaired. Other debtors These amounts generally arise from transactions outside the usual operating activities of the consolidated entity and are non-interest bearing. The other debtors do not contain any impaired receivables. Consolidated 2016 2015 5.OTHER FINANCIAL ASSETS $ $
CURRENT Investments listed on a prescribed stock exchange and unlisted public companies
-
-
NON CURRENT Investments in other entities at cost 697,537 697,537 Less Provision for Diminution (697,537) (697,537)
- -
For
per
sona
l use
onl
y

NOTES TO THE FINANCIAL STATEMENTS For The Year Ended 30 June 2016
54 | P a g e
5. OTHER FINANCIAL ASSETS (continued) Shares in controlled entities The carrying value of the investments in controlled entities is dependent upon the successful development and exploitation of the controlled entities’ tenements, or alternatively the sale of those tenements for at least carrying value. Investments in other entities Investments in other entities include the following:
10% interest in B Vijaykumar Technical Services Pvt Limited, a company involved in diamond exploration in India, with an option to purchase a further 10% interest. As Oropa Indian Resources Pty Ltd, Sihayo Gold Limited’s wholly owned subsidiary, no longer has significant influence over B Vijaykumar Technical Services Pvt Limited, the investment has been transferred to other investments from investment in associates. This investment has been fully provided for.
Consolidated 6.PROPERTY, PLANT AND EQUIPMENT 2016 2015 $ $
NON-CURRENT Land at Cost 70,781 68,702
Lease improvements at cost 14,279 14,279 Less: accumulated depreciation (14,279) (14,279)
- -
Plant and equipment, at cost
253,395
253,395
Less: accumulated depreciation (241,206) (208,556)
12,189 44,839
Motor vehicles, at cost 57,151 57,151 Less: accumulated depreciation (41,001) (28,809)
16,150 28,342 Office equipment, at cost
462,401
462,401
Less: accumulated depreciation (416,184) (325,324)
46,217 137,077
Total property, plant and equipment 145,337 278,960
For
per
sona
l use
onl
y

NOTES TO THE FINANCIAL STATEMENTS For The Year Ended 30 June 2016
55 | P a g e
6.PROPERTY, PLANT AND EQUIPMENT (continued) Reconciliations Reconciliations of the carrying amounts of each class of property, plant and equipment at the beginning and end of the current financial year are set out below: 2016 Consolidated
Land at Cost
$
Leasehold Improve.
$
Plant & Equipment
$
Motor Vehicles
$
Office Equipment
$
Total
$ Carrying amount at 1 July 2015
68,702 - 44,839 28,342 137,077 278,960
Effect of foreign currency translation
2,079 - 10,529 1,139 (2,292) 11,455
Additions - - - - - - Disposal - - - - - - Depreciation expense - - (43,179) (13,331) (88,568) (145,078)
Carrying amount at 30 June 2016
70,781
-
12,189
16,150
46,217
145,337
2015 Consolidated
Land at Cost
$
Leasehold Improve.
$
Plant & Equipment
$
Motor Vehicles
$
Office Equipment
$
Total
$ Carrying amount at 1 July 2014
57,299 - 93,518 85,056 207,836 443,709
Effect of foreign currency translation
11,403 - 18,612 12,619 38,440 81,074
Additions - - - - - - Write-offs & reclassification - - - (20,964) - (20,964) Depreciation expense - - (67,291) (48,369) (109,199) (224,859)
Carrying amount at 30 June 2015
68,702
-
44,839
28,342
137,077
278,960
Consolidated 2016 2015 $ $ 7a.OTHER ASSETS NON CURRENT Deposits 41,071 39,865 Capitalised mineral exploration costs 13,254,246 16,626,287
13,295,317 16,666,152
7a .(i) Deposits Deposits of $41,071 include a security deposit for office of USD $10,471 (2015: USD $ 10,471)
For
per
sona
l use
onl
y

NOTES TO THE FINANCIAL STATEMENTS For The Year Ended 30 June 2016
56 | P a g e
7a. OTHER ASSETS (continued) 7.a.(ii) Mining Exploration and Evaluation Expenditure Consolidated 2016 2015 $ $
Opening Balance 16,626,287 10,992,124 Additions during the year - - Change arising from foreign currency movement (3,372,041) 5,634,163 Provision for Impairment - - Write Offs - -
Closing Balance 13,254,246 16,626,287
The Management believe that the carrying amount of the Group’s capitalised expenditure and evaluation costs exceed its recoverable amount and therefore no further impairment charge is required as at 30 June 2016. The estimated impairment will be reviewed and revised in future periods in alignment with movements in the gold price and any changes in the projected cost profile of the Sihayo Pungkut project. Consolidated 7b. Inventory 2016 2015 $ $
Diesel, at cost - 816
Consolidated 8.TRADE AND OTHER PAYABLES 2016 2015 $ $
645,898 474,968
There are no trade payables past due. The normal credit terms from suppliers is 30-60 days.
For
per
sona
l use
onl
y

NOTES TO THE FINANCIAL STATEMENTS For The Year Ended 30 June 2016
57 | P a g e
Consolidated
9.PROVISIONS 2016 2015 $ $
CURRENT Employee Entitlements
26,900
26,900
26,900 26,900
NON CURRENT Employee Entitlements and Other Provisions 425,551 472,065
425,551 472,065
Employee Numbers Average number of employees during the financial year
24
32
Consolidated 10. BORROWINGS 2016 2015 $ $
Loan Payable (i)
-
274,325
Working capital (i)(a) 536,985 -
Convertible note liabilities (iii) 2,735,677 1,181,165
Embedded derivatives (iv) 942,001 713,606
4,214,663
2,169,096
(i) The funds are borrowed from Provident Minerals Pte Ltd. Interest of 7% is charged on the loan.
(i) (a) The funds are borrowed from Provident Minerals Pte Ltd. Interest of 10% is charged on the
loan. Gavin Caudle is a director of Sihayo Gold and Provident Minerals and the loan is therefore
it is a related party transaction. Final maturity date is 31 December 2016 or any other date
mutually agreed between the parties.
(ii) During the year, Sihayo Gold issued two series of convertible notes as follows:
a. Provident Note:
The terms of the convertible notes are as follows:
i. Issue date: 03 July 2015
ii. Maturity date: 5.00 pm Australian Eastern Standard Time (‘AEST’) on the first
anniversary of the initial drawdown date or such other date agreed by the parties
iii. Principal amount: USD $500,000
iv. Share price: $0.009
v. Loan facility fee: USD 15,000 (representing 3% of the pricipal amount and is
capitalised on initial drawdown and will form part of the principal amount)
For
per
sona
l use
onl
y

NOTES TO THE FINANCIAL STATEMENTS For The Year Ended 30 June 2016
58 | P a g e
(iii) 10. BORROWINGS (continued)
vi. Availability of Loan facility: Draw down available during the period of 3 July 2015 to
30 June 2016
vii. Conversion price: AUD /USD conversion provided by the RBA for the preceeding day
the conversion note is given @70% of the 10 day volume weight average price
(VWAP) price also taken from the preceeding date from when the conversion note is
given.
viii. Interest: Coupon payment of 7% payable annually
ix. The Lender may elect to have the Outstanding Sum repaid to the Lender (In whole
or part) by the issue to the Lender of Conversion Shares
b.Saratoga note:
The terms of the convertible notes are as follows:
i. Issue date: 04 November 2015
ii. Maturity date: 5.00pm Australian Eastern Standard Time (‘AEST’) on the
first anniversary of the initial drawdown date or such other date agreed
by the parties
iii. Principal amount: USD $500,000
iv. Share price: $0.011
v. Loan facility fee: USD 15,000 (representing 3% of the pricipal amount
and is capitalised on initial drawdown and will form part of the principal
amount)
vi. Availability of Loan facility: Draw down available during the period of 26
October 2015 to 30 June 2016
vii. Conversion price: AUD /USD conversion provided by the RBA for the
preceeding day the conversion note is given @70% of the 10 day volume
weight average price (VWAP) price also taken from the preceeding date
from when the conversion note is given.
viii. Interest: Coupon payment of 7% payable annually
ix. The Lender may elect to have the Outstanding Sum repaid to the Lender
(in whole or in part) by the issue to the Lender of Conversion Shares
For
per
sona
l use
onl
y

NOTES TO THE FINANCIAL STATEMENTS For The Year Ended 30 June 2016
59 | P a g e
10. BORROWINGS (continued) The embedded derivatives liability at the reporting date arising from the above Convertible Notes are as
follows:
Provident
Note
Saratoga
Note
Series Two
(Saratoga)
Series Three
(Provident)
Total
Value of note
in AUD
(at 30 June
2016)
691,182 691,182 691,182 691,182
Underlying
security spot
price
$0.010 $0.010 $0.010 $0.010
Risk free rate 1.59% 1.59% 1.59% 1.59%
Volatility 100% 100% 100% 100%
Conversion
price (70% of
average
VWAP)
$0.0073
$0.0115
$0.0093
$0.0104
Number of
shares
94,651,438
59,889,571
74,320,645
66,356,700
Value per
Note (Intrisic
Value)
$0.0031
$0.0049
$0.0007
$0.0045
Total value of
the derivative
Liability
$296,255
$293,874
$54,430
$297,442
$942,001
The convertible note Liabilities at the reporting date arising from the above
Provident
Note
Saratoga
Note
Series Two
(Saratoga)
Series Three
(Provident)
Total
Total value of
debt liability
$729,465 $676,145 $675,321 $654,746 $2,735,677
For
per
sona
l use
onl
y

NOTES TO THE FINANCIAL STATEMENTS For The Year Ended 30 June 2016
60 | P a g e
10. BORROWINGS (continued)
The embedded derivatives liability at the reporting date arising from the above Convertible Notes are as
follows:
Series 1 Series 2 Series 3 Total
Value of note in
AUD (at 30 June
2015)
64,876 668,224 668,224
Underlying security
spot price
$0.011 $0.011 $0.011
Risk free rate 2.01% 2.01% 2.01%
Volatility 110% 110% 110%
Conversion price
(70% - 90% of
average VWAP)
$0.0136 $0.0162 $0.0112
Number of shares 4,786,515 41,342,611 59,539,012
Value per Note
(Intrisic Value)
$0.0095 $0.0051 $0.0077
Total value of the
derivative Liability
$45,415 $208,789 $459,402 $713,606
The convertible note Liabilities at the reporting date arising from the above
Series 1 Series 2 Series 3 Total
Total value of debt
liability
$42,712 $603,069 $535,384 $1,181,165
For
per
sona
l use
onl
y

NOTES TO THE FINANCIAL STATEMENTS For The Year Ended 30 June 2016
61 | P a g e
11. CONTRIBUTED EQUITY Consolidated
Issued Capital
2016 $
2015 $
Fully paid – ordinary shares
1,136,037,339 (2015: 1,125,968,164) 101,526,008 101,446,160
101,526,008
101,446,160
Movements in ordinary share capital of the Company during the past 2 years were as follows:
Number of Shares $
01/07/2014 Opening Balance 1,000,801,331 100,025,876
06/11/2014
Shares issued
125,166,833
1,502,002
30/06/2015 Shares issue costs -
(81,718)
Balance at 30 June 2015 1,125,968,164
101,446,160
14/06/2016
Shares issued for loan
conversion
10,069,175
79,848
30/06/2016 Shares issue costs - -
Balance at 30 June 2016 1,136,037,339 101,526,008
Ordinary shares Ordinary shares entitle the holder to participate in dividends and the proceeds on winding up of the Company in proportion to the number of and amounts paid on the shares held. On a show of hands every holder of ordinary shares present at a meeting in person or by proxy, is entitled to one vote, and upon a poll each share is entitled to one vote.
Options over ordinary shares There is no option as at 30 June 2016 (2015: 2,000,000). Refer to note 12 for further information.
For
per
sona
l use
onl
y

NOTES TO THE FINANCIAL STATEMENTS For The Year Ended 30 June 2016
62 | P a g e
Consolidated 2016 2015 Note $ $
12. RESERVES AND ACCUMULATED LOSSES (a) Reserves
Share based payment reserve (i) 2,380,395 2,380,395 Foreign currency translation reserve (ii) 10,688,793 13,920,809
13,069,188 16,301,204
(i) Option Premium Reserve Balance at the beginning of the financial year 2,380,395 2,362,570 Options issued during the year - 17,825
Balance at the end of the financial year 2,380,395 2,380,395
Options There is no outstanding balance of options as at 30 June 2016.
.
Consolidated 2016 2015 $ $
(ii) Foreign Currency Reserve Balance at the beginning of the financial year 13,920,809 6,986,860 Movement for the year (3,232,016) 6,933,949
Balance at the end of the financial year 10,688,793 13,920,809
(b) Accumulated Losses Balance at the beginning of the financial year
(97,456,273)
(92,337,194)
Net losses attributable to members of Sihayo Gold Limited
(813,033)
(5,119,079)
Balance at the end of the financial year (98,269,306) (97,456,273)
For
per
sona
l use
onl
y

NOTES TO THE FINANCIAL STATEMENTS For The Year Ended 30 June 2016
63 | P a g e
13. PARENT ENTITY DISCLOSURE NOTE
Parent 2016 2015 FINANCIAL POSITION $ $
Assets Current assets 28,275 40,584 Non-current assets 122,814 122,814
Total assets 151,089 163,398
Liabilities Current liabilities 4,647,631 2,495,884 Non-current liabilities - -
Total liabilities
4,647,631 2,495,884
Net Assets Deficiency (4,496,542) (2,332,486)
Equity
Issued capital 101,526,010 101,446,160 Accumulated losses (108,499,650) (106,255,744) Reserves Option reserve 2,477,098 2,477,098
Total Equity (4,496,542) (2,332,486)
FINANCIAL PERFORMANCE
Loss for the year (2,243,907) (3,409,770) Other comprehensive income - -
Total comprehensive Loss (2,243,907) (3,409,770)
The parent entity did not enter into any guarantees in relation to the debts of its subsidiaries for 2015 or 2016. The parent entity did not have any contingent liabilities for 2015 or 2016.
For
per
sona
l use
onl
y

NOTES TO THE FINANCIAL STATEMENTS For The Year Ended 30 June 2016
64 | P a g e
14. SHARE BASED PAYMENT PLAN (a) Recognised Share-Based Payment Expense
Consolidated
2016 $
2015 $
Expense arising from equity-settled share-based payment
transactions to :
Employee - (17,828)
Total expense arising from share-based payment transactions - (17,828)
(b) Summary of Options Granted
The following share-based payment arrangements were granted during the last two years:
In 2016 & 2015, no options were granted by the Consolidated Entity
Summary of Options and Performance Rights Granted
The following table illustrates the number and weighted average exercise prices (WAEP) of share options and performance rights issued as share-based payments at the beginning and end of the financial year :
2016 Number 2016WAEP (Cents)
2015 Number
2014WAEP
(Cents)
Outstanding at beginning of
year
2,000,000 12.75 4,000,000 12.75
Granted by the Company
during the year
- - - -
Exercised during the year - - - -
Expired during the year (2,000,000) (12.75) (2,000,000) (12.75)
Forfeited during the year - - -
Outstanding at end of year - - 2,000,000 12.75
There is no outstanding balance of options and performance rights.
For
per
sona
l use
onl
y

NOTES TO THE FINANCIAL STATEMENTS For The Year Ended 30 June 2016
65 | P a g e
14. SHARE BASED PAYMENT PLAN (continued) (c) Weighted Average Remaining Contractual Life The weighted average remaining contractual life for share options issued as share based payments outstanding as at 30 June 2016 is nil years , since no options is outstanding as at 30/6/16 (2015 : 0.25 years). (d) Range of Exercise Prices The range of exercise prices for share options issued as share-based payments outstanding as at 30 June 2016 was nil, since no options is outstanding as at 30/6/16 (2015 : $0.125 to $0.13). (e) Weighted Average Fair Value The weighted average fair value of options granted by the Group as equity-settled share-based payments during the year ended 30 June 2016 was nil, since no options is outstanding as at 30/6/16 (2015 : $0.1275). 15. KEY MANAGEMENT PERSONNEL DISCLOSURE Names and Positions held of parent entity key management personnel in office at any time during the financial year are: Key Management Personnel Misha Collins Chairman Gavin Caudle Non Executive Director Stuart Gula Managing Director Daniel Nolan Company Secretary, Chief Financial Officer & Executive Director There are no executives (other than those listed above) with authority for strategic decision and management. (a) Compensation for Key Management Personnel
Consolidated 2016 2015
$ $
Short-term employee benefits 513,504 489,504
Non monetary benefit 11,062 10,695
Post employment benefits - 24,000
Share based payments - 17,828
524,566 542,027
For
per
sona
l use
onl
y

NOTES TO THE FINANCIAL STATEMENTS For The Year Ended 30 June 2016
66 | P a g e
Consolidated
2016 2015 $ $
16. REMUNERATION OF AUDITORS Remuneration for audit or review of the financial reports of the parent entity or any entity in the consolidated entity
Stantons International 36,028 34,061 Subsidiary Auditor 32,971 29,657
98,174 63,718
17. CONTINGENT ASSETS AND LIABILITIES There are no other contingent liabilities and contingent assets as at 30 June 2016. The only contingent asset the parent and consolidated entity have is 1,000,000 options exercisable at 20 cents in the company Southern Cross Goldfields Limited. These options only vest upon the company discovering a minimum of 250,000 ounces of gold or 5,000 tonnes of nickel in the situ in the Golden Valley Tenements. 18. RELATED PARTIES Directors and specified executives Disclosures relating to directors and specified executives are set out in the director’s report and as detailed in note 15. Wholly-owned Group The wholly-owned group consists of Sihayo Gold Limited and its wholly-owned subsidiaries Inland Goldmines Pty Limited, Excelsior Resources Pty Limited, Oropa Technologies Pty Limited, Oropa Indian Resources Pty Limited and Oropa Exploration Pty Limited. Sihayo Gold Limited owns 100% of the shares in Aberfoyle Pungkut Investments Pte Ltd (API). API holds a 75% interest in PT Sorikmas Mining, with the Indonesian Government mining company, P.T. Aneka Tambang holding the remaining 25%. Transactions between Sihayo Gold Limited and related parties in the wholly-owned group during the year ended 30 June 2016 consisted of loans on an interest free basis with no fixed term and no specific repayment arrangements. Sihayo Gold Limited made an additional provision for doubtful debts of $3,543,355 in its accounts for the year ended 30 June 2016 (2015: $ 16,482,283) in relation to the loans made to its subsidiaries. No other amounts were included in the determination of operating loss before tax of the parent entity that resulted from transactions with related parties in the group.
For
per
sona
l use
onl
y

NOTES TO THE FINANCIAL STATEMENTS For The Year Ended 30 June 2016
67 | P a g e
18. RELATED PARTIES (continued) Other related parties Aggregate amounts receivable from related parties in the wholly owned group at balance date were as follows:
Parent Entity 2016 2015 $ $ Non-current receivables 93,880,437 90,337,082 Provision for doubtful debts (93,880,437) (90,337,082)
- -
An amount of $247,880 (2015 : $ 247,880) is still outstanding from an advance to B Vijaykumar Chhattisgarh Exploration Private Ltd, being a subsidiary of a company that the consolidated entity has an investment in. This amount was used to fund diamond exploration activities in India. The loan is interest free. The loan has been fully provided for in the accounts. 19. EXPENDITURE COMMITMENTS Exploration Commitments In order to maintain current rights of tenure to exploration tenements, the Company and consolidated entity were previously required to outlay lease rentals and to meet the minimum expenditure requirements of the Mines Departments. PT Sorikmas Mining Commitments Under the Contract of Work (CoW), the Company was required to spend certain minimum expenditures in respect of the contract area for the General Survey Period and Exploration Period as follows: US$ / km2 General survey period 100 Exploration period 1,100 As at 30 June 2016, PT Sorikmas Mining had fulfilled its expenditure commitments in respect of the General Survey Period and Exploration Period. Operating Leases – Rent The company currently has no operating leases as at 30 June 2016 Other Commitments The Company currently has no other commitments as at 30 June 2016 Capital Commitments There were no outstanding capital commitments not provided for in the financial statements of the Company as at 30 June 2016 or 30 June 2015.
For
per
sona
l use
onl
y

NOTES TO THE FINANCIAL STATEMENTS For The Year Ended 30 June 2016
68 | P a g e
19. EXPENDITURE COMMITMENTS (continued) Other Commitments Parent Entity Sihayo Gold Limited
Project Principal Activities
Interest 2016
Interest 2015
Mt Keith Mineral
exploration 2% Royalty 2% Royalty
Controlled Entities: Excelsior Resources Pty Limited
Project Principal Activities
Interest 2016
Interest 2015
Mulgabbie Mineral
exploration 2% Royalty 2% Royalty
20. INVESTMENTS IN CONTROLLED ENTITIES Controlled Entities: Class of
Shares Cost of Parent Entity’s
Investment Equity Holding
2016 2015 2016 2015
$ $
Inland Goldmines Pty Limited (incorporated in Australia)
Ordinary 583,942 583,942 100% 100%
Excelsior Resources Pty Limited (incorporated in Australia)
Ordinary 1,062,900 1,062,900 100% 100%
Oropa Technologies Pty Ltd (incorporated in Australia)
Ordinary 1 1 100% 100%
Oropa Indian Resources Pty Limited (incorporated in Australia)
Ordinary 1 1 100% 100%
Oropa Exploration Pty Limited (incorporated in Australia)
Ordinary 1 1 100% 100%
Aberfoyle Pungkut Investments Pte Ltd(a) (incorporated in Singapore)
Ordinary 697,537 697,537 100% 100%
PT Sorikmas Mining (b)
(incorporated in Indonesia) - - 75% 75%
2,344,382 2,344,382
For
per
sona
l use
onl
y

NOTES TO THE FINANCIAL STATEMENTS For The Year Ended 30 June 2016
69 | P a g e
20. INVESTMENT IN CONTROLLED ENTITIES (continued)
(a) When Sihayo Gold Limited issued 9,259,259 shares as consideration for exercising the option to acquire 100% of the shares in Aberfoyle Pungkut Indonesia Pte Ltd, it was assigned the vendors receivables from Aberfoyle Pungkut Investments Pte Ltd and PT Sorikmas Mining. This reduced the cost of the investment in Aberfoyle Pungkut Investments Pte Ltd.
(b) Aberfoyle Pungkut Investments Pte Ltd holds a 75% interest in PT Sorikmas Mining, with an
Indonesian Government mining company PT Aneka Tambang holding the remaining 25%. The outside equity interest in PT Sorikmas Mining equates to 25% of the nets assets of PT Sorikmas Mining of USD $23,611,311 being AUD $7,938,406 as at 30 June 2016 (2015: AUD $6,143,379).
21. NOTES TO THE STATEMENT OF CASH FLOWS
Consolidated 2016 2015 $ $
Cash at Bank 27,720 41,004
(a) Reconciliation of Cash and Cash Equivalents For the purposes of the Statement of Cash Flows cash includes cash and cash equivalents on hand and at call deposits with banks, and investments in money market instruments net of outstanding bank overdrafts. It includes $25,365 held in trust. (b) Reconciliation of operating loss after income tax
to net cash flow from operating activities Consolidated
2016
2015 $ $
Operating (loss) after income tax (2,542,637)
(6,610,979)
Non Cash Items Depreciation 145,078 224,859 Share based payments - 17,828 Diminution in investments - 8,550 Loss on Derivative Valuation - 292,784 Convertible note finance charge 483,085 194,212 Provision of impairment for VAT receivables - 3,228,165
For
per
sona
l use
onl
y

NOTES TO THE FINANCIAL STATEMENTS For The Year Ended 30 June 2016
70 | P a g e
21. NOTES TO THE STATEMENT OF CASH FLOWS (continued) Consolidated 2016 2015 $ $ Change in operating assets and liabilities:
(Increase) / decrease in trade and other receivables 103,377 (85,438) Increase in payables 258,864 1,841,970 Increase / (decrease) in provisions (46,514) 83,888 Increase in inventory 816 1,777 Movement allocated to non-controlling interest - (2,338,905) Increase / (decrease) in FX - 176,494
Net cash (outflow) from operating activities (1,597,931) (2,964795)
22. EARNINGS PER SHARE
Consolidated Entity 2016 2015
(a) Basic and diluted loss per share (in cents) (0.07) (0.47) (b) Weighted average number of shares outstanding during the year used in the calculation of basic earnings per share
1,126,408,347
1,082,074,042
As the company made a loss for the year, diluted earnings per share is the same as basic earnings per share.
23. FINANCIAL INSTRUMENTS Net Fair Value of Financial Assets and Liabilities The net fair value of financial assets and financial liabilities of the Company approximates their carrying value. The Group and the parent hold the following financial instruments:
Consolidated 2016 2015 $ $
Financial Assets Cash and cash equivalents 27,720 41,004 Trade and other receivables 290,042 363,419 Other financial assets - - Security deposits 41,071 39,865
Total Financial Assets
358,833
444,288
For
per
sona
l use
onl
y
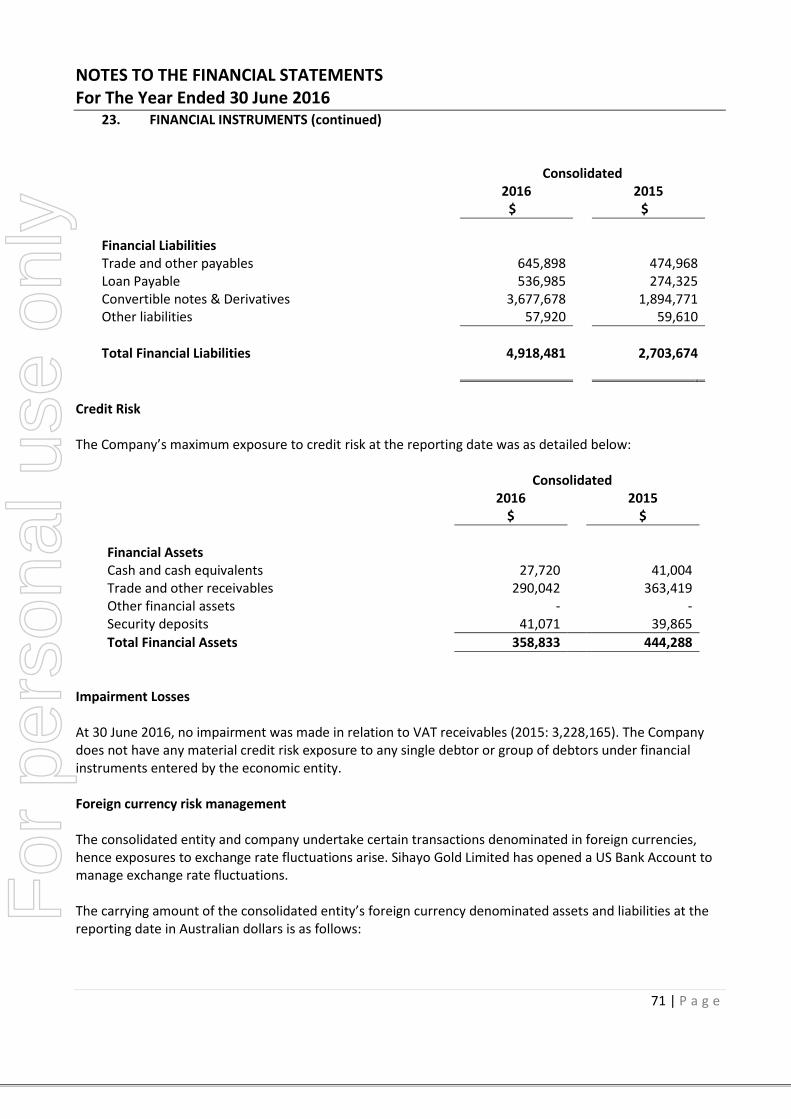
NOTES TO THE FINANCIAL STATEMENTS For The Year Ended 30 June 2016
71 | P a g e
23. FINANCIAL INSTRUMENTS (continued)
Consolidated 2016 2015 $ $
Financial Liabilities Trade and other payables 645,898 474,968 Loan Payable 536,985 274,325 Convertible notes & Derivatives 3,677,678 1,894,771 Other liabilities 57,920 59,610
Total Financial Liabilities
4,918,481
2,703,674
Credit Risk The Company’s maximum exposure to credit risk at the reporting date was as detailed below:
Consolidated 2016 2015 $ $
Financial Assets Cash and cash equivalents 27,720 41,004 Trade and other receivables 290,042 363,419 Other financial assets - - Security deposits 41,071 39,865
Total Financial Assets 358,833 444,288
Impairment Losses At 30 June 2016, no impairment was made in relation to VAT receivables (2015: 3,228,165). The Company does not have any material credit risk exposure to any single debtor or group of debtors under financial instruments entered by the economic entity. Foreign currency risk management The consolidated entity and company undertake certain transactions denominated in foreign currencies, hence exposures to exchange rate fluctuations arise. Sihayo Gold Limited has opened a US Bank Account to manage exchange rate fluctuations. The carrying amount of the consolidated entity’s foreign currency denominated assets and liabilities at the reporting date in Australian dollars is as follows:
For
per
sona
l use
onl
y
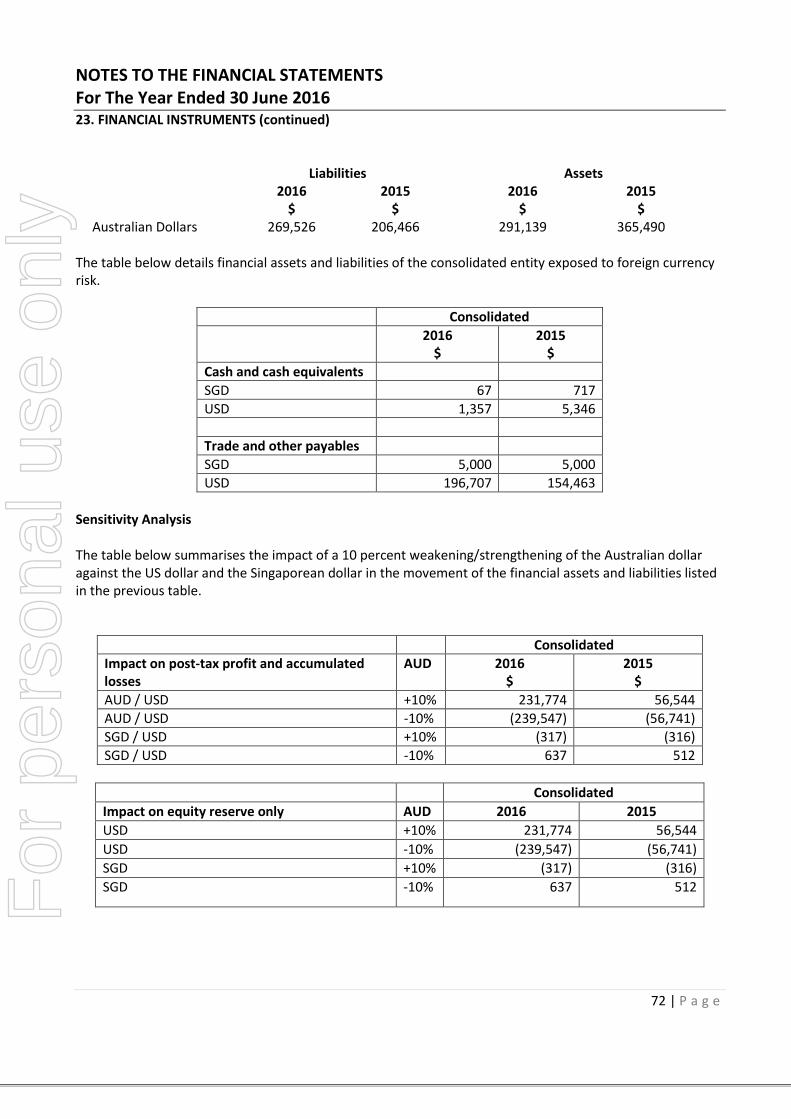
NOTES TO THE FINANCIAL STATEMENTS For The Year Ended 30 June 2016
72 | P a g e
23. FINANCIAL INSTRUMENTS (continued)
Liabilities Assets 2016
$ 2015
$ 2016
$ 2015
$ Australian Dollars 269,526 206,466 291,139 365,490
The table below details financial assets and liabilities of the consolidated entity exposed to foreign currency risk.
Consolidated
2016 $
2015 $
Cash and cash equivalents
SGD 67 717
USD 1,357 5,346
Trade and other payables
SGD 5,000 5,000
USD 196,707 154,463
Sensitivity Analysis The table below summarises the impact of a 10 percent weakening/strengthening of the Australian dollar against the US dollar and the Singaporean dollar in the movement of the financial assets and liabilities listed in the previous table.
Consolidated
Impact on post-tax profit and accumulated losses
AUD 2016 $
2015 $
AUD / USD +10% 231,774 56,544
AUD / USD -10% (239,547) (56,741)
SGD / USD +10% (317) (316)
SGD / USD -10% 637 512
Consolidated
Impact on equity reserve only AUD 2016 2015
USD +10% 231,774 56,544
USD -10% (239,547) (56,741)
SGD +10% (317) (316)
SGD -10% 637 512
For
per
sona
l use
onl
y
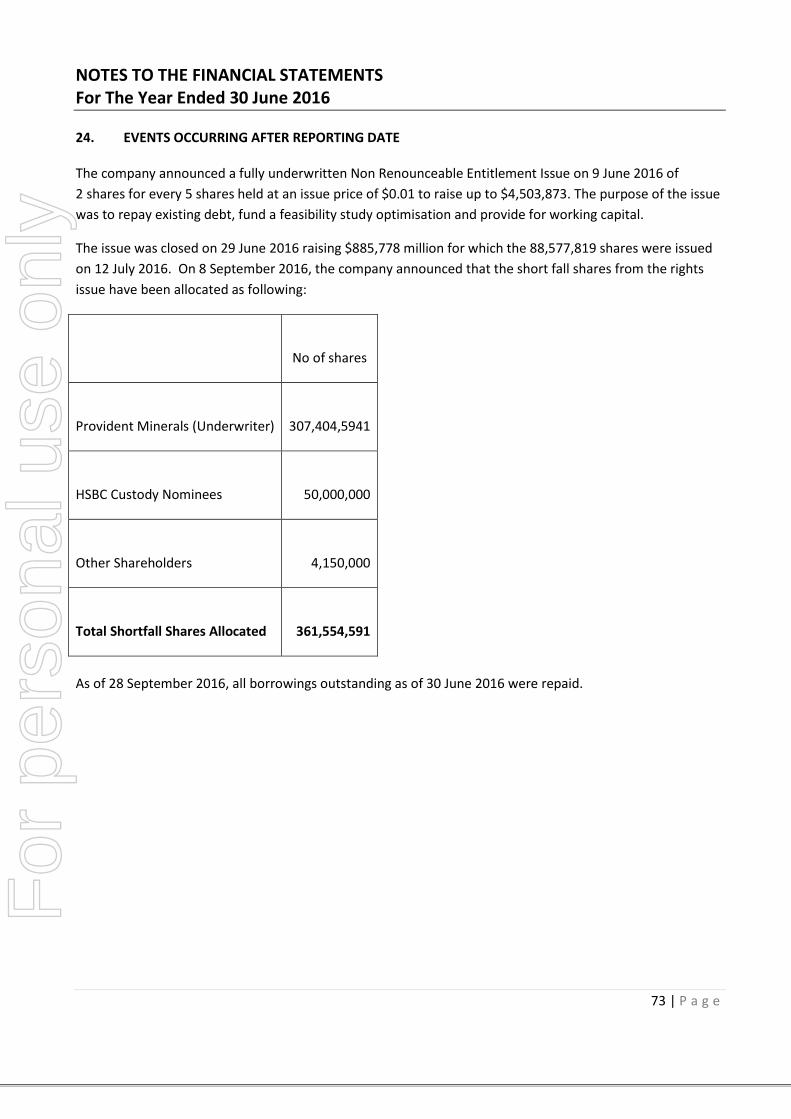
NOTES TO THE FINANCIAL STATEMENTS For The Year Ended 30 June 2016
73 | P a g e
24. EVENTS OCCURRING AFTER REPORTING DATE The company announced a fully underwritten Non Renounceable Entitlement Issue on 9 June 2016 of
2 shares for every 5 shares held at an issue price of $0.01 to raise up to $4,503,873. The purpose of the issue
was to repay existing debt, fund a feasibility study optimisation and provide for working capital.
The issue was closed on 29 June 2016 raising $885,778 million for which the 88,577,819 shares were issued
on 12 July 2016. On 8 September 2016, the company announced that the short fall shares from the rights
issue have been allocated as following:
No of shares
Provident Minerals (Underwriter)
307,404,5941
HSBC Custody Nominees
50,000,000
Other Shareholders
4,150,000
Total Shortfall Shares Allocated
361,554,591
As of 28 September 2016, all borrowings outstanding as of 30 June 2016 were repaid.
For
per
sona
l use
onl
y

NOTES TO THE FINANCIAL STATEMENTS For The Year Ended 30 June 2016
74 | P a g e
25. SEGMENT INFORMATION Primary reporting – geographical segments The geographical segments of the consolidated entity are as follows: Revenue by geographical region Revenue attributable to the Group disclosed below, based on where the revenue is generated from:
30 June 2016 30 June 2015
$ $
Australia 767 1,844 Africa - - South East Asia - - India - - Other foreign countries - -
Total revenue 767 1,844
Segment result by geographical region
30 June 2016 30 June 2015
$ $
Australia (811,632) (782,698) Africa (742) (767) South East Asia (1,730,709) (5,829,041) India (321) (317)
Total Expenses (2,543,404) (6,612,823)
Segment Result (2,542,637) (6,610,979)
Assets by geographical region
The location of segment assets by geographical location of the assets is disclosed below:
30 June 2016 30 June 2015
$ $
Australia 149,433 163,410 Africa 21,650 21,832 South East Asia 13,587,331 17,165,107 India 2 2
Total Assets 13,758,416 17,350,351
For
per
sona
l use
onl
y

NOTES TO THE FINANCIAL STATEMENTS For The Year Ended 30 June 2016
75 | P a g e
25. SEGMENT INFORMATION (continued) Liabilities by geographical region
The location of segment assets by geographical location of the assets is disclosed below:
30 June 2016 30 June 2015
$ $
Australia 4,647,634 2,497,205 Africa - - South East Asia 723,298 705,434 India - -
Total Liabilities 5,370,932 3,202,639
For
per
sona
l use
onl
y

DIRECTORS’ DECLARATION
76 | P a g e SIHAYO GOLD LIMITED
DIRECTORS’ DECLARATION In accordance with a resolution of the directors of Sihayo Gold Limited, I state that: 1. In the opinion of the directors: (a) The financial statements, notes and the additional disclosures included in the directors’ report
designated as audited, of the Company and of the consolidated entity are in accordance with the Corporations Act 2001, including:
(i) giving a true and fair view of the Company’s and consolidated entity’s financial position as at 30
June 2016 and of their performance for the year ended on that date; and
(ii) complying with Accounting Standards and Corporations Regulations 2001; and (b) There are reasonable grounds to believe that the Company will be able to pay its debts as and when they
become due and payable. (c) The financial report also complies with International Financial Reporting Standards as disclosed in Note
1. 2. This declaration has been made after receiving the declarations required to be made to the directors in accordance with section 295A of the Corporations Act 2001 for the financial year ended 30 June 2016. On behalf of the Board
Misha Collins Chairman 30 September 2016
For
per
sona
l use
onl
y
For
per
sona
l use
onl
y

For
per
sona
l use
onl
y

ADDITIONAL SHAREHOLDER INFORMATION
79 | P a g e SIHAYO GOLD LIMITED
The following additional information dated 14 September 2016 is provided in compliance with the requirements of the Australian Securities Exchange Limited. 1 DISTRIBUTION OF LISTED ORDINARY SHARES AND OPTIONS (a) Analysis of numbers of shareholders by size of holding.
Distribution No. of shareholders
Units % off issued Capital
1-1000 113 28,803 0.00%
1,001-5,000 77 197,195 0.01%
5,001-10,000 46 365,699 0.02%
10,001-100,000 249 12,211,756 0.77%
100,001 and above 212 1,573,621,152 99.19%
Total 697 1,586,424,605 100.00%
(b) There were 190 shareholders holding less than a marketable parcel. (c) The percentage of the total of the twenty largest holders of ordinary shares was 2 TWENTY LARGEST SHAREHOLDERS AND OPTION HOLDERS
Names No. Of shares %
PROVIDENT MINERALS PTE
511,602,996 32.25% PT SARATOGA INVESTAMA 175,778,027 11.08% HSBC CUSTODY NOM AUST 157,396,520 9.92% NATIONAL NOM LTD 116,060,838 7.32% LION SELECTION GRP LTD 46,616,412 2.94% CITICORP NOM PL 45,019,695 2.84% GOLDSTAR ASIA MINING 41,030,239 2.59% INSIGHT CAP MGNT PL 32,336,655 2.04% DBS VICKERS SEC SINGAPORE 32,029,716 2.02% FATS PL 31,875,000 2.01% YAW CHEE SIEW 31,515,151 1.99% NATIONAL NOM LTD 31,465,983 1.98% ASIA LION LTD 30,122,242 1.90% SEDAYA PT SARATOGA I 28,420,378 1.79% JP MORGAN NOM AUST LTD 24,422,321 1.54% LEONG CAROLINE 15,096,845 0.95% PETTERSSON BRADLEY JOHN 15,000,000 0.95% PT TEKNOLOGI RISET GLOBAL 14,545,455 0.92% BUTLER DAVID ROBERT 13,339,499 0.84%
BJARNASON JON NICOLAI H 9,800,000 0.62%
Total 1,403,473,972 88.49% For
per
sona
l use
onl
y
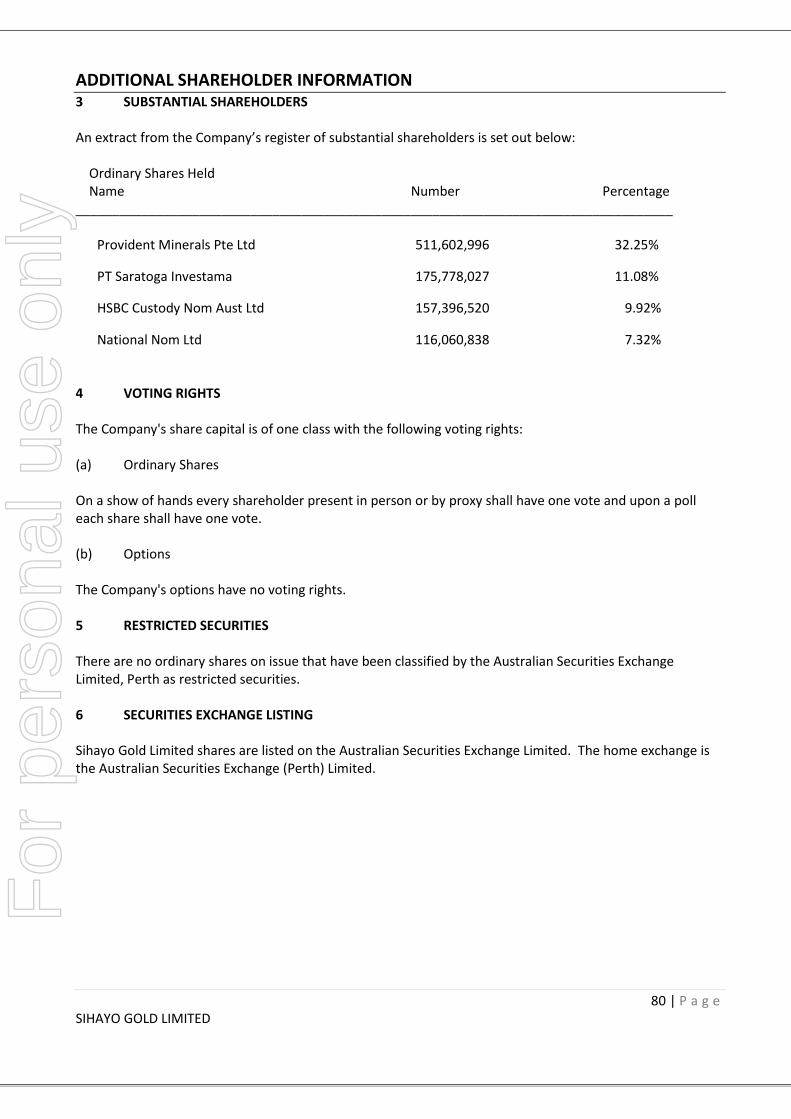
ADDITIONAL SHAREHOLDER INFORMATION
80 | P a g e SIHAYO GOLD LIMITED
3 SUBSTANTIAL SHAREHOLDERS An extract from the Company’s register of substantial shareholders is set out below: Ordinary Shares Held Name Number Percentage __________________________________________________________________________________
Provident Minerals Pte Ltd 511,602,996 32.25%
PT Saratoga Investama 175,778,027 11.08%
HSBC Custody Nom Aust Ltd 157,396,520 9.92%
National Nom Ltd 116,060,838 7.32% 4 VOTING RIGHTS The Company's share capital is of one class with the following voting rights: (a) Ordinary Shares On a show of hands every shareholder present in person or by proxy shall have one vote and upon a poll each share shall have one vote. (b) Options The Company's options have no voting rights. 5 RESTRICTED SECURITIES There are no ordinary shares on issue that have been classified by the Australian Securities Exchange Limited, Perth as restricted securities. 6 SECURITIES EXCHANGE LISTING Sihayo Gold Limited shares are listed on the Australian Securities Exchange Limited. The home exchange is the Australian Securities Exchange (Perth) Limited.
For
per
sona
l use
onl
y

SUMMARY OF TENEMENTS HELD BY THE GROUP
81 | P a g e
FOR THE YEAR ENDED 30 JUNE 2016 Project Name Tenement Approval Expiry Area Equity Date Date % OROPA INDIAN RESOURCES INDIA Block D-7 22.01.00 N/A 4,600km2 9(1)
PT SORIKMAS MINING INDONESIA Pungkut 96PK0042 31.05.96 N/A 66,200ha 75
SIHAYO GOLD LIMITED WESTERN AUSTRALIA Mt. Keith M53/490 11.06.04 10.06.25 582ha 0(2) M53/491 11.06.04 10.06.25 621ha 0(2) EXCELSIOR RESOURCES PTY LTD Mulgabbie ML28/364 25.03.09 24.03.30 54.3ha 0(2) PL28/1078 22.09.08 21.09.12 98.0ha 0(2) PL28/1079 22.09.08 21.09.12 143.7ha 0(2) PL28/1080 22.09.08 21.09.12 140.7ha 0(2) PL28/1081 22.09.08 21.09.12 191.4ha 0(2) PL28/1082 22.09.08 21.09.12 120.0ha 0(2) Gullewa M59/394 200.0 0 (3) NOTES (1) Option to increase interest to 18% (2) 2% net smelter royalty
For
per
sona
l use
onl
y