Embed Size (px)
Citation preview
Alcohol and drugs 2016
Disclaimer
All reasonable endeavours are made to ensure the accuracy of the information in this report.
However, the information is provided without warranties of any kind including accuracy,
completeness, timeliness or fitness for any particular purpose.
The Ministry of Transport excludes liability for any loss, damage or expense, direct or indirect, and
however caused, whether through negligence or otherwise, resulting from any person or
organisation's use of, or reliance on, the information provided in this report.
Under the terms of the New Zealand Creative Commons Attribution 3.0 (BY) licence, this document,
and the information contained within it, can be copied, distributed, adapted and otherwise used
provided that –
the Ministry of Transport is attributed as the source of the material
the material is not misrepresented or distorted through selective use of the material
images contained in the material are not copied
The terms of the Ministry’s Copyright and disclaimer apply.
Additional information
Enquires relating to crash statistics may be directed to the Ministry of Transport, PO Box 3175,
Wellington, or by email on [email protected]. For more information about road safety, visit the
Ministry of Transport website at www.transport.govt.nz.
A selection of fact sheets is available via the research section of the Ministry of Transport website.
These include:
Crash fact sheets
Alcohol and drugs
Cyclists
Diverted attention
Fatigue
Motorcyclists
Overseas drivers
Pedestrians
Speed
Trucks
Young drivers
Travel survey fact sheets
Comparing travel modes
Cycling
Driver travel
Motorcycling
Public transport
Risk on the road
Introduction and mode comparison
Drivers and their passengers
Pedestrians, cyclists and motorcyclists
Walking
2

Contents
Contents .............................................................................................................................................. 3
Key facts .............................................................................................................................................. 4
Overview .............................................................................................................................................. 4
Contribution of alcohol/drugs ............................................................................................................... 5
Who dies? ............................................................................................................................................ 7
Safety belts .......................................................................................................................................... 7
Time series .......................................................................................................................................... 8
Drivers involved in fatal crashes ........................................................................................................ 10
Largely a male issue .......................................................................................................................... 12
When do alcohol/drug crashes occur? .............................................................................................. 13
Types of crash ................................................................................................................................... 14
Drivers who die in road crashes ........................................................................................................ 14
The recent history of drink-driving legislation .................................................................................... 16
Terminology ....................................................................................................................................... 18
References: ....................................................................................................................................... 18
3

Key facts
In 2015 driver alcohol/drugs were a contributing factor1 in 88 fatal traffic crashes, 324 serious injury
crashes and 850 minor injury crashes. These crashes resulted in 90 deaths, 409 serious injuries and
1,214 minor injuries. The total social cost of crashes involving alcohol/drugs was about $790 million;
21 percent of the social cost associated with all injury crashes.
Overview
Many studies show that the risk of being involved in a crash increases as a driver’s blood alcohol
concentration (BAC) increases. At high blood alcohol levels the risk rapidly increases.
Figure 1: Relative risk of fatal crash by blood alcohol level
The graph above shows the results of a New Zealand study of drivers involved in fatal crashes2.
There is a clear increase in risk as blood alcohol levels increase. As shown in the graph above and
the table below, crash risk is higher for young drivers. The calculation of risk is made in relation to that
of a sober driver aged 30+ years.
1 Alcohol/drugs as a contributing factor: Alcohol/drugs is listed as a factor when a driver’s blood or breath alcohol level is
above the legal limit, if drugs are proved to be in the driver’s blood, or when the attending officer suspects that alcohol/drug
consumption contributed to the crash. Additional definitions including those for casualties, fatal, serious and minor injuries and
social cost are included in Terminology at the end of the fact sheet.
2 Keall, Frith and Patterson (2004).
0
20
40
60
80
100
120
140
160
180
200
0 10 20 30 40 50 60 70 80 90 100 110 120 130 140 150
Incr
ease
in ri
sk
BAC (mg/100ml)
30+ years 20–29 years 15–19 years
New BAC limit of 50 mg/100ml applies from
1 December 2014 for 20+ year olds
4

Table 1: Relative risk of fatal crash by blood alcohol level by age
BAC 30+ years
20–29 years
15–19 years
0 1.0 3.0 5.3
30 2.9 8.7 15.0
50 5.8 17.5 30.3
80 16.5 50.2 86.6
The table above shows that at 80mg of alcohol per 100ml of blood a driver is about sixteen times as
likely to be involved in a fatal crash as the same driver with a zero blood alcohol level.
People with a high blood alcohol level are more likely to be injured or die in a crash than those who
are sober3.
Contribution of alcohol/drugs to crashes
As crash severity increases, so does the contribution of alcohol/drugs. Over the years 2013–2015,
alcohol/drugs were a factor in 29 percent of fatal crashes, 19 percent of serious injury crashes and 11
percent of minor injury crashes.
Figure 2: Percentage of crashes with alcohol/drugs as a contributing factor (2013–2015)
3 Evans (2004)
0% 5% 10% 15% 20% 25% 30% 35%
Fatal
Serious
Minor
Percentage of crashes
5

Figure 3: Alcohol/drugs and speed in fatal crashes 2013–2015
The combination of alcohol/drugs and speed contributes to 16 percent of fatal crashes. Alcohol/drugs
alone contribute to 12 percent, and speed alone to 14 percent, of fatal crashes.
Figure 4: Alcohol/drugs in fatal crashes by road type (2013–2015)
Of all fatal crashes, 20 percent are open road crashes with alcohol/drugs as a contributing factor. A
further 9 percent are urban crashes with alcohol/drugs as a contributing factor.
Overall, alcohol/drugs were a contributing factor in 33 percent of urban fatal crashes and 27 percent
of open road fatal crashes.
Other57%
Alcohol/drugs only12%
Alcohol/drugs and speed
16%
Speed only14%
Urban road no alcohol/drugs
18%
Open road no alcohol/drugs
53%
Open road with alcohol/drugs
20%
Urban road with alcohol/drugs
9%
6

Who dies in crashes involving alcohol/drugs?
For every 100 alcohol or drug-impaired drivers or riders who died in road crashes, 47 of their
passengers and 24 sober road users died with them.
Table 2: Deaths in crashes where alcohol/drugs was a contributing factor (2013–2015)
Casualty age Drunk/drugged drivers
Passengers with drunk/drugged
drivers Other road
users Percentage of all deaths in age group
0-14 - 2 1 11%
15-19 15 25 4 47%
20-24 36 18 5 52%
25-29 19 6 3 34%
30-39 32 5 3 42%
40-49 18 4 4 28%
50-59 16 5 6 22%
60+ 8 - 8 7%
Unknown - 2 - 14%
Total 144 67 34 28%
This table shows the deaths resulting from crashes with alcohol/drug-affected drivers. In addition,
between 2013 and 2015 there were 18 alcohol/drug affected pedestrians who died on New Zealand
roads. In some of these cases an alcohol affected driver was also involved.
Safety belts
Drivers affected by alcohol are less likely to wear safety belts than sober drivers. For the car and van
drivers who died between 2013 and 2015, 50 percent of drivers affected by alcohol/drugs were not
restrained at the time of the crash. This compares to 16 percent for other drivers. Restraint use was
not recorded for about 23 percent of the drivers who die, so the level of restraint use may be even
lower than indicated.
7
Time series
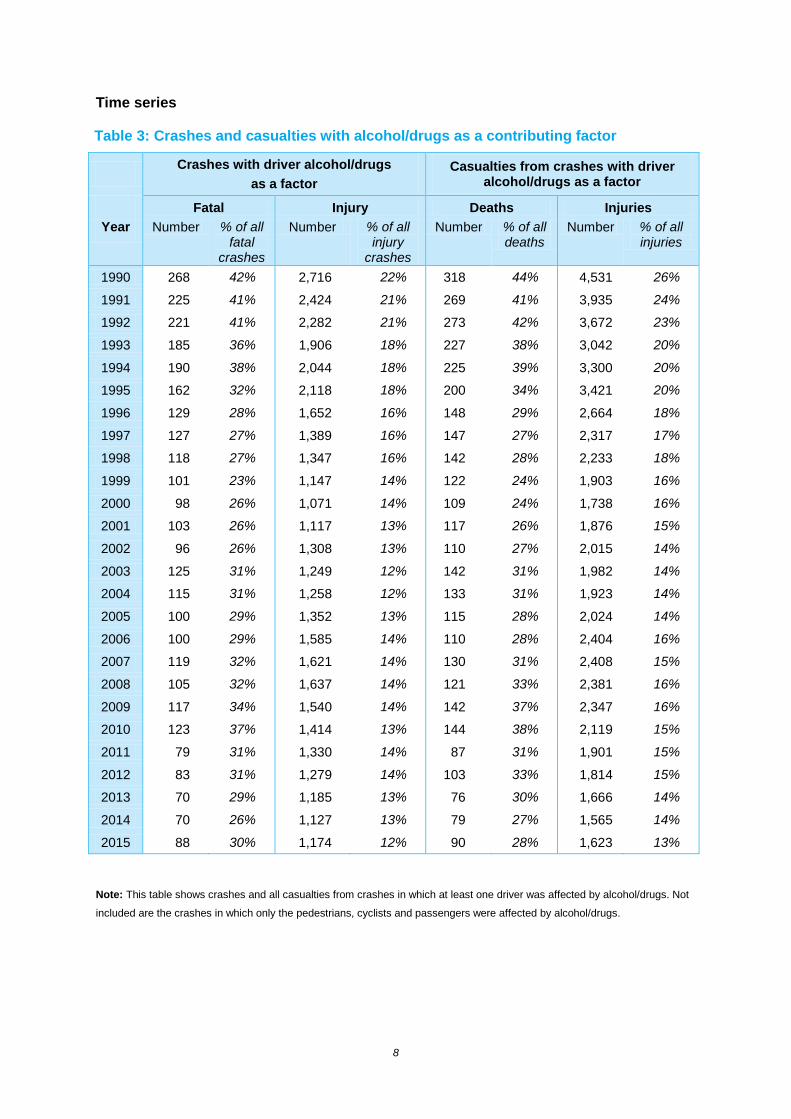
Table 3: Crashes and casualties with alcohol/drugs as a contributing factor
Crashes with driver alcohol/drugs
as a factor Casualties from crashes with driver
alcohol/drugs as a factor Fatal Injury Deaths Injuries
Year Number % of all fatal
crashes
Number % of all injury
crashes
Number % of all deaths
Number % of all injuries
1990 268 42% 2,716 22% 318 44% 4,531 26%
1991 225 41% 2,424 21% 269 41% 3,935 24%
1992 221 41% 2,282 21% 273 42% 3,672 23%
1993 185 36% 1,906 18% 227 38% 3,042 20%
1994 190 38% 2,044 18% 225 39% 3,300 20%
1995 162 32% 2,118 18% 200 34% 3,421 20%
1996 129 28% 1,652 16% 148 29% 2,664 18%
1997 127 27% 1,389 16% 147 27% 2,317 17%
1998 118 27% 1,347 16% 142 28% 2,233 18%
1999 101 23% 1,147 14% 122 24% 1,903 16%
2000 98 26% 1,071 14% 109 24% 1,738 16%
2001 103 26% 1,117 13% 117 26% 1,876 15%
2002 96 26% 1,308 13% 110 27% 2,015 14%
2003 125 31% 1,249 12% 142 31% 1,982 14%
2004 115 31% 1,258 12% 133 31% 1,923 14%
2005 100 29% 1,352 13% 115 28% 2,024 14%
2006 100 29% 1,585 14% 110 28% 2,404 16%
2007 119 32% 1,621 14% 130 31% 2,408 15%
2008 105 32% 1,637 14% 121 33% 2,381 16%
2009 117 34% 1,540 14% 142 37% 2,347 16%
2010 123 37% 1,414 13% 144 38% 2,119 15%
2011 79 31% 1,330 14% 87 31% 1,901 15%
2012 83 31% 1,279 14% 103 33% 1,814 15%
2013 70 29% 1,185 13% 76 30% 1,666 14%
2014 70 26% 1,127 13% 79 27% 1,565 14%
2015 88 30% 1,174 12% 90 28% 1,623 13%
Note: This table shows crashes and all casualties from crashes in which at least one driver was affected by alcohol/drugs. Not
included are the crashes in which only the pedestrians, cyclists and passengers were affected by alcohol/drugs.
8

Table 4: Alcohol/drug affected drivers involved in fatal crashes
Drivers affected by alcohol/drugs, for selected groups
Note: This table includes
drivers of all types of
motorised vehicles,
including motorcycles.
Columns do not
necessarily add to the
total as sex is not
recorded for some
drivers.
15–19 years 20–24 years All males All females Total
Year Number % of drivers in age group Number % of drivers in
age group Number % of male drivers Number % of female
drivers Number % of drivers
1995 28 33% 43 33% 141 23% 24 14% 166 21%
1996 26 28% 35 35% 117 22% 14 10% 132 20% 1997 15 19% 31 33% 113 21% 21 13% 135 19% 1998 16 21% 23 22% 103 20% 17 11% 122 18% 1999 14 19% 21 21% 82 15% 21 14% 103 15%
2000 18 30% 24 33% 85 19% 13 9% 99 17% 2001 22 32% 20 27% 94 20% 13 10% 107 18% 2002 14 28% 23 36% 88 22% 11 8% 99 18% 2003 25 32% 24 32% 117 25% 9 6% 126 20%
2004 20 25% 21 30% 95 21% 22 16% 118 20% 2005 18 21% 22 31% 85 20% 16 16% 101 19% 2006 19 30% 20 31% 85 21% 17 13% 102 19% 2007 19 29% 29 39% 99 23% 21 16% 120 21%
2008 17 25% 30 43% 94 26% 18 16% 112 24% 2009 23 39% 25 38% 94 25% 25 20% 121 24% 2010 22 36% 32 47% 105 27% 18 16% 124 25% 2011 13 41% 21 39% 72 24% 8 10% 80 21%
2012 9 39% 24 45% 75 24% 12 13% 87 22% 2013 14 48% 20 43% 55 20% 15 17% 70 19% 2014 6 26% 12 29% 56 19% 12 12% 70 18%
2015 9 25% 22 38% 82 24% 8 8% 90 20%
9

Drivers involved in fatal crashes
Figure 5: Drivers involved in fatal crashes by vehicle type (2013–2015)
From 2013–2015, 21
percent of car and van
drivers and 27 percent of
motorcyclists involved in
fatal crashes were
affected by alcohol/drugs.
Four percent of truck
drivers involved in fatal
crashes were affected by
alcohol/drugs. There were
no crashes involving bus
or taxi drivers affected by
alcohol or drugs.
Figure 6: Alcohol/drug affected drivers involved in fatal crashes by age-group (annual average 2013–2015)
0 50 100 150 200 250 300 350
Car/van
Truck
Motorcycle
Other
Number of drivers (annual average)
No alcohol/drugs
Alcohol/drug affected
0
5
10
15
20
25
30
0%
5%
10%
15%
20%
25%
30%
35%
40%
15-19 20-24 25-29 30-34 35-39 40-44 45-49 50-54 55-59 60+
Num
ber o
f driv
ers
Perc
enta
ge o
f driv
ers
in a
ge g
roup
Age groups (years)
Number of alcohol/drug af fected drivers
Percentage of age group
10

Table 5: Drivers affected by alcohol/drugs (2013–2015)
Drivers in fatal crashes affected by alcohol/drugs
(2013–2015) Drivers in fatal
and serious injury crashes
Males Females Total Total Age Number % Number % Number % Number %
15-19 27 38% 2 13% 29 33% 161 22%
20-24 45 39% 9 28% 54 37% 303 26%
25-29 27 28% 4 14% 31 25% 202 22%
30-34 20 31% 2 15% 22 29% 124 18%
35-39 25 33% 7 41% 32 35% 106 17%
40-44 14 19% 2 8% 16 16% 88 12%
45-49 7 9% 1 5% 8 8% 79 11%
50-54 11 12% 3 10% 14 12% 65 9%
55-59 7 9% 1 5% 8 8% 36 6%
60+ 10 6% 4 5% 14 5% 58 4% Total 193 21% 35 13% 230 19% 1242 14% Note: Rows and columns do not add up to the totals because the age or sex of some drivers was not recorded.
Of all drivers involved in fatal crashes, the 20-24 age group are the most likely to be affected by
alcohol/drugs. For older drivers, alcohol/drugs generally decrease as a contributing factor in fatal
crashes. For fatal and serious injury crashes combined, this pattern is much clearer with a smooth
decrease in the contribution of alcohol/drugs for those older than the 20-24 age group.
Figure 7: Drivers in fatal crashes – percentage of each licence status affected by alcohol/drugs (2013–2015)
0% 10% 20% 30% 40% 50% 60% 70%
Never licensed
Disqualified
Learner
Restricted
Unknown/other
Full
Percentage affected by alcohol/drugs
Lice
nce
stat
us
11
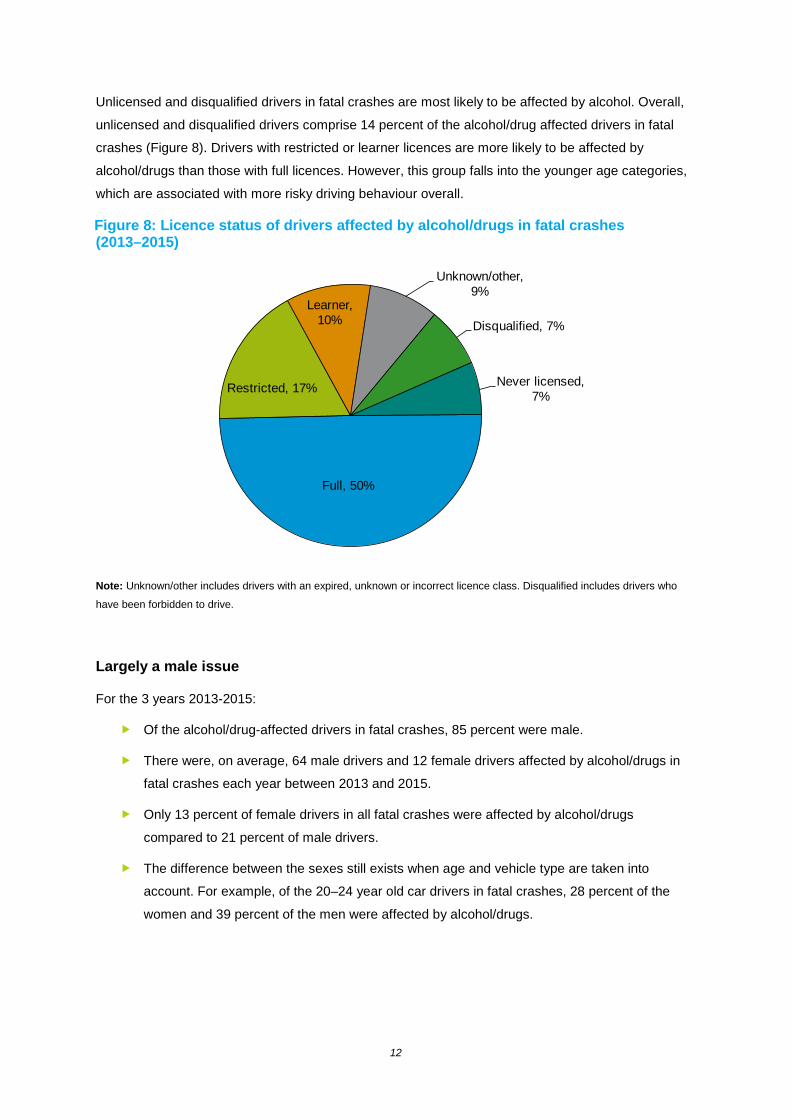
Unlicensed and disqualified drivers in fatal crashes are most likely to be affected by alcohol. Overall,
unlicensed and disqualified drivers comprise 14 percent of the alcohol/drug affected drivers in fatal
crashes (Figure 8). Drivers with restricted or learner licences are more likely to be affected by
alcohol/drugs than those with full licences. However, this group falls into the younger age categories,
which are associated with more risky driving behaviour overall.
Figure 8: Licence status of drivers affected by alcohol/drugs in fatal crashes (2013–2015)
Note: Unknown/other includes drivers with an expired, unknown or incorrect licence class. Disqualified includes drivers who
have been forbidden to drive.
Largely a male issue
For the 3 years 2013-2015:
Of the alcohol/drug-affected drivers in fatal crashes, 85 percent were male.
There were, on average, 64 male drivers and 12 female drivers affected by alcohol/drugs in
fatal crashes each year between 2013 and 2015.
Only 13 percent of female drivers in all fatal crashes were affected by alcohol/drugs
compared to 21 percent of male drivers.
The difference between the sexes still exists when age and vehicle type are taken into
account. For example, of the 20–24 year old car drivers in fatal crashes, 28 percent of the
women and 39 percent of the men were affected by alcohol/drugs.
Full, 50%
Restricted, 17%
Learner, 10%
Unknown/other, 9%
Disqualified, 7%
Never licensed, 7%
12
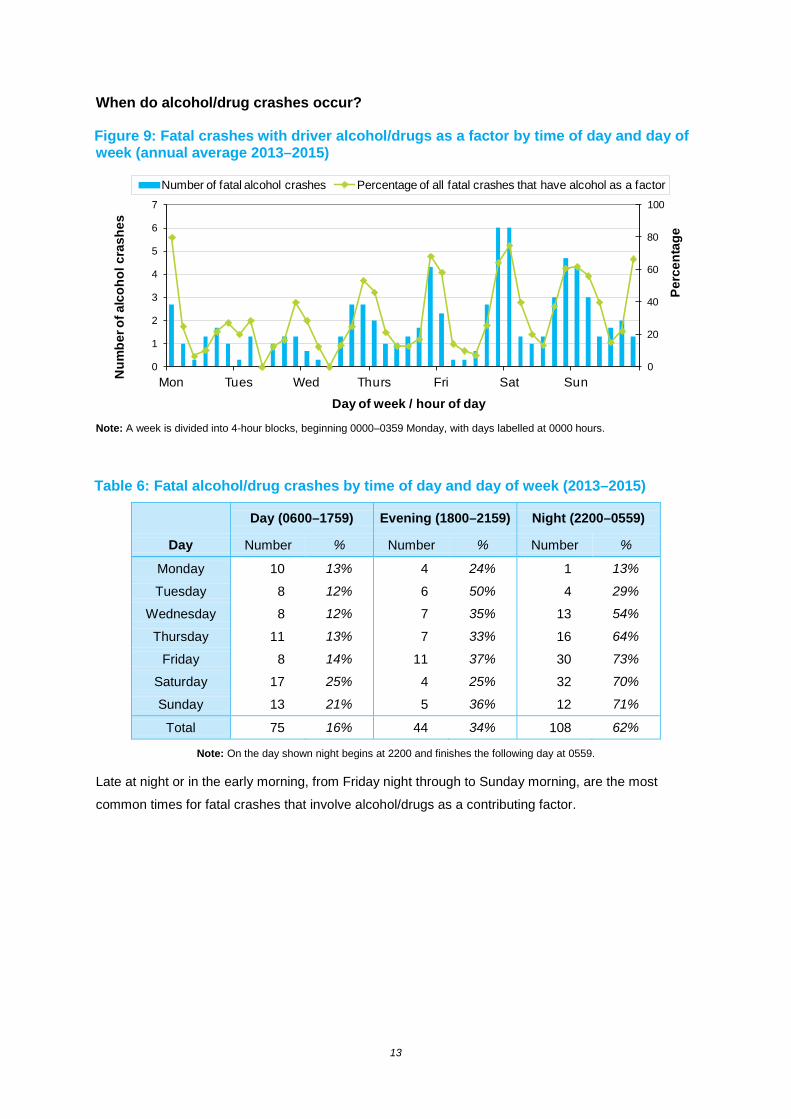
When do alcohol/drug crashes occur?
Figure 9: Fatal crashes with driver alcohol/drugs as a factor by time of day and day of week (annual average 2013–2015)
Note: A week is divided into 4-hour blocks, beginning 0000–0359 Monday, with days labelled at 0000 hours.
Table 6: Fatal alcohol/drug crashes by time of day and day of week (2013–2015) Day (0600–1759) Evening (1800–2159) Night (2200–0559)
Day Number % Number % Number %
Monday 10 13% 4 24% 1 13%
Tuesday 8 12% 6 50% 4 29%
Wednesday 8 12% 7 35% 13 54%
Thursday 11 13% 7 33% 16 64%
Friday 8 14% 11 37% 30 73%
Saturday 17 25% 4 25% 32 70%
Sunday 13 21% 5 36% 12 71%
Total 75 16% 44 34% 108 62%
Note: On the day shown night begins at 2200 and finishes the following day at 0559.
Late at night or in the early morning, from Friday night through to Sunday morning, are the most
common times for fatal crashes that involve alcohol/drugs as a contributing factor.
0
20
40
60
80
100
0
1
2
3
4
5
6
7
Mon Tues Wed Thurs Fri Sat Sun
Perc
enta
ge
Num
ber o
f alc
ohol
cra
shes
Day of week / hour of day
Number of fatal alcohol crashes Percentage of all fatal crashes that have alcohol as a factor
13
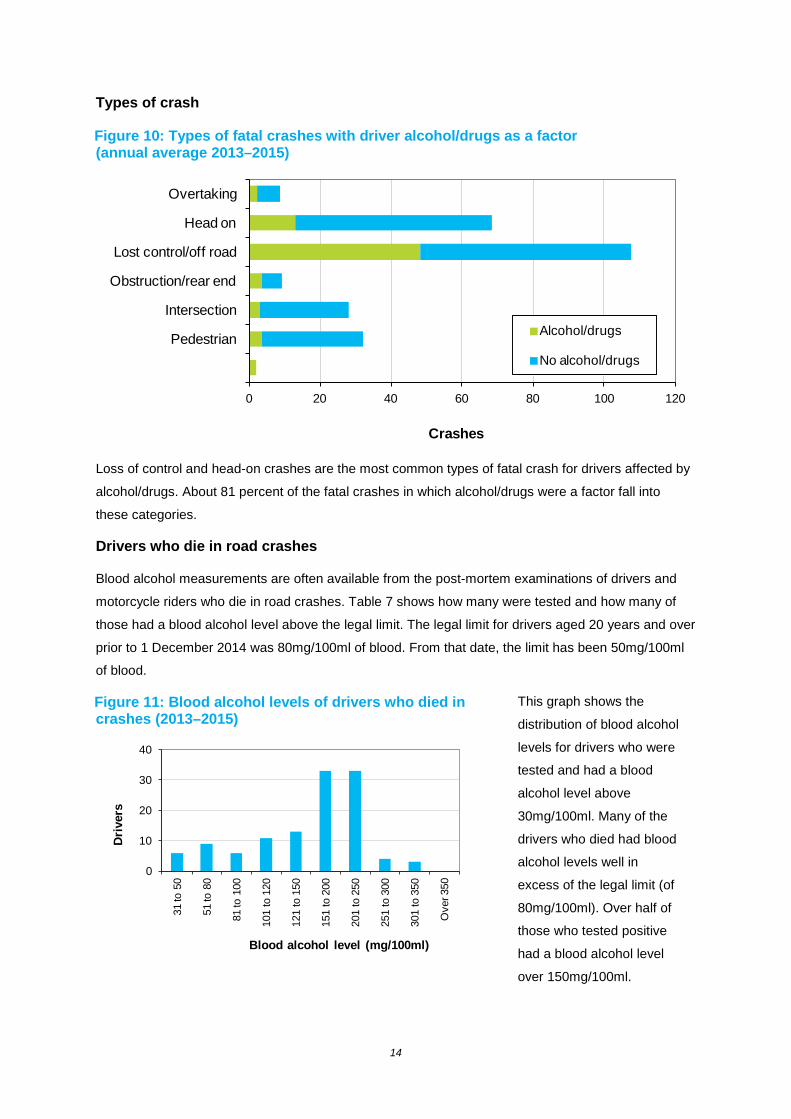
Types of crash
Figure 10: Types of fatal crashes with driver alcohol/drugs as a factor (annual average 2013–2015)
Loss of control and head-on crashes are the most common types of fatal crash for drivers affected by
alcohol/drugs. About 81 percent of the fatal crashes in which alcohol/drugs were a factor fall into
these categories.
Drivers who die in road crashes
Blood alcohol measurements are often available from the post-mortem examinations of drivers and
motorcycle riders who die in road crashes. Table 7 shows how many were tested and how many of
those had a blood alcohol level above the legal limit. The legal limit for drivers aged 20 years and over
prior to 1 December 2014 was 80mg/100ml of blood. From that date, the limit has been 50mg/100ml
of blood.
Figure 11: Blood alcohol levels of drivers who died in crashes (2013–2015)
This graph shows the
distribution of blood alcohol
levels for drivers who were
tested and had a blood
alcohol level above
30mg/100ml. Many of the
drivers who died had blood
alcohol levels well in
excess of the legal limit (of
80mg/100ml). Over half of
those who tested positive
had a blood alcohol level
over 150mg/100ml.
0 20 40 60 80 100 120
Overtaking
Head on
Lost control/off road
Obstruction/rear end
Intersection
Pedestrian
Crashes
Alcohol/drugs
No alcohol/drugs
0
10
20
30
40
31 to
50
51 to
80
81 to
100
101
to 1
20
121
to 1
50
151
to 2
00
201
to 2
50
251
to 3
00
301
to 3
50
Ove
r 350
Dri
vers
Blood alcohol level (mg/100ml)
14
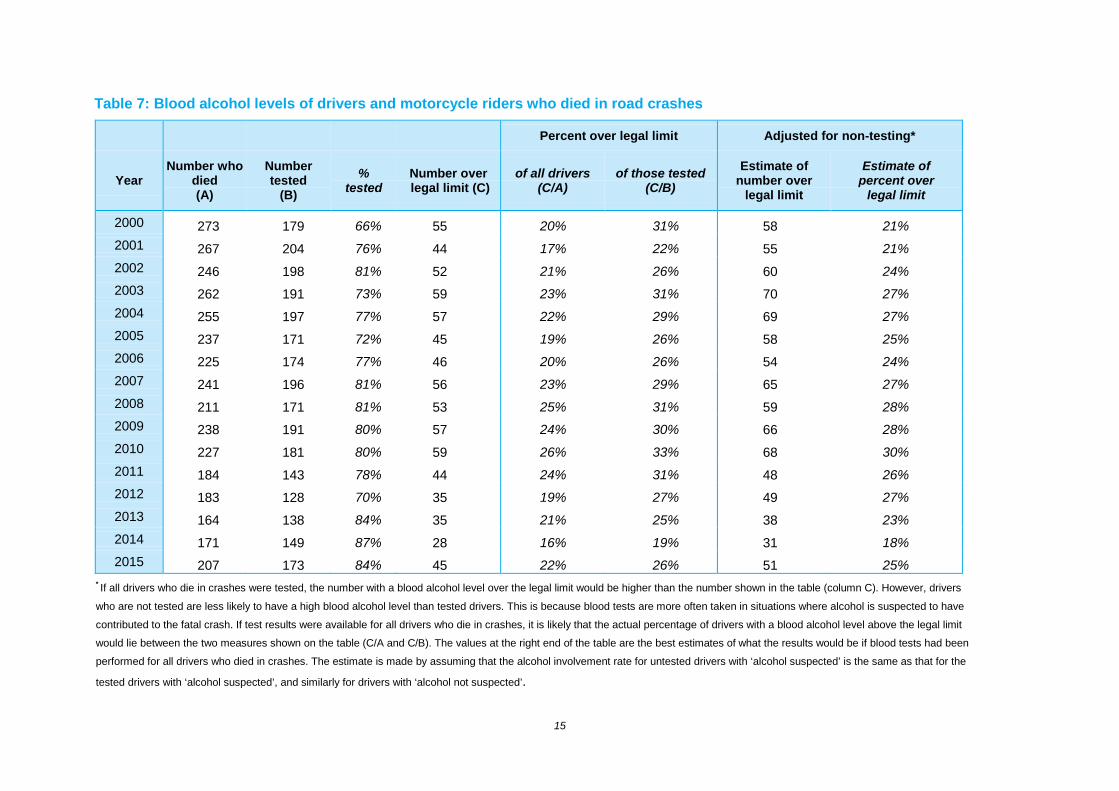
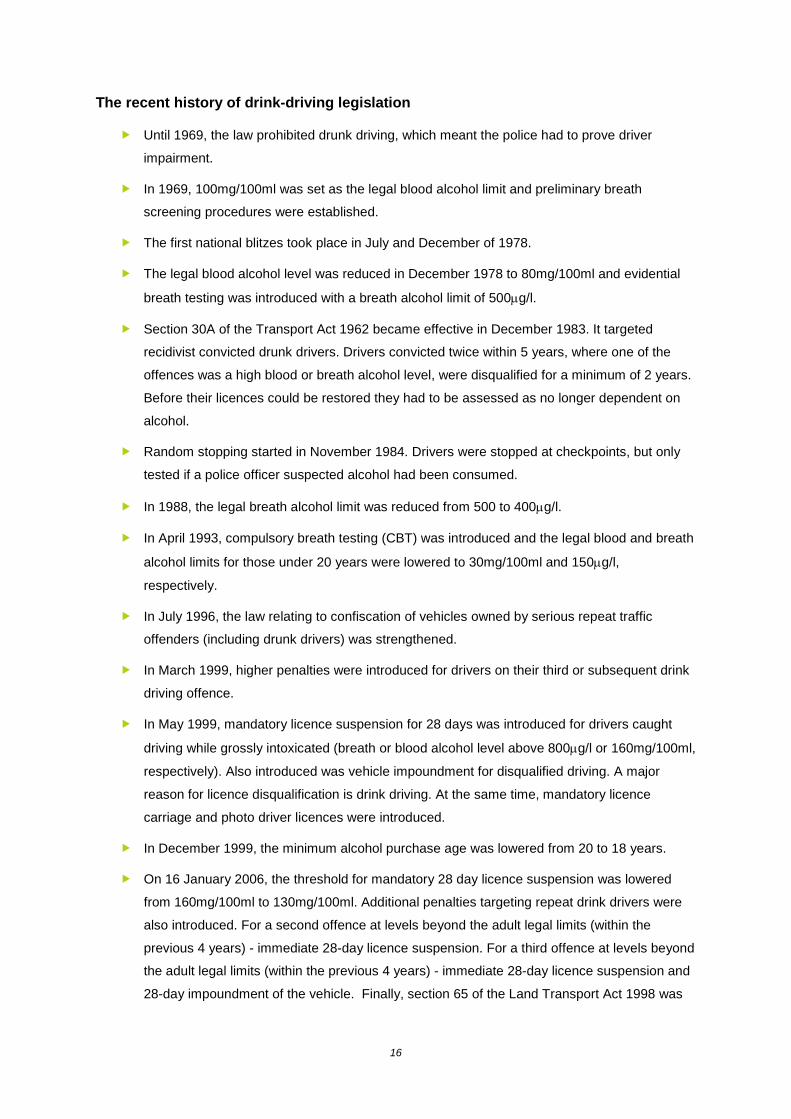
Table 7: Blood alcohol levels of drivers and motorcycle riders who died in road crashes
Percent over legal limit Adjusted for non-testing*
Year Number who
died (A)
Number tested
(B) %
tested Number over legal limit (C)
of all drivers (C/A)
of those tested (C/B)
Estimate of number over
legal limit
Estimate of percent over
legal limit
2000 273 179 66% 55 20% 31% 58 21% 2001 267 204 76% 44 17% 22% 55 21% 2002 246 198 81% 52 21% 26% 60 24% 2003 262 191 73% 59 23% 31% 70 27% 2004 255 197 77% 57 22% 29% 69 27% 2005 237 171 72% 45 19% 26% 58 25% 2006 225 174 77% 46 20% 26% 54 24% 2007 241 196 81% 56 23% 29% 65 27% 2008 211 171 81% 53 25% 31% 59 28% 2009 238 191 80% 57 24% 30% 66 28% 2010 227 181 80% 59 26% 33% 68 30% 2011 184 143 78% 44 24% 31% 48 26% 2012 183 128 70% 35 19% 27% 49 27% 2013 164 138 84% 35 21% 25% 38 23% 2014 171 149 87% 28 16% 19% 31 18% 2015 207 173 84% 45 22% 26% 51 25%
* If all drivers who die in crashes were tested, the number with a blood alcohol level over the legal limit would be higher than the number shown in the table (column C). However, drivers
who are not tested are less likely to have a high blood alcohol level than tested drivers. This is because blood tests are more often taken in situations where alcohol is suspected to have
contributed to the fatal crash. If test results were available for all drivers who die in crashes, it is likely that the actual percentage of drivers with a blood alcohol level above the legal limit
would lie between the two measures shown on the table (C/A and C/B). The values at the right end of the table are the best estimates of what the results would be if blood tests had been
performed for all drivers who died in crashes. The estimate is made by assuming that the alcohol involvement rate for untested drivers with ‘alcohol suspected’ is the same as that for the
tested drivers with ‘alcohol suspected’, and similarly for drivers with ‘alcohol not suspected’.
15
The recent history of drink-driving legislation
Until 1969, the law prohibited drunk driving, which meant the police had to prove driver
impairment.
In 1969, 100mg/100ml was set as the legal blood alcohol limit and preliminary breath
screening procedures were established.
The first national blitzes took place in July and December of 1978.
The legal blood alcohol level was reduced in December 1978 to 80mg/100ml and evidential
breath testing was introduced with a breath alcohol limit of 500µg/l.
Section 30A of the Transport Act 1962 became effective in December 1983. It targeted
recidivist convicted drunk drivers. Drivers convicted twice within 5 years, where one of the
offences was a high blood or breath alcohol level, were disqualified for a minimum of 2 years.
Before their licences could be restored they had to be assessed as no longer dependent on
alcohol.
Random stopping started in November 1984. Drivers were stopped at checkpoints, but only
tested if a police officer suspected alcohol had been consumed.
In 1988, the legal breath alcohol limit was reduced from 500 to 400µg/l.
In April 1993, compulsory breath testing (CBT) was introduced and the legal blood and breath
alcohol limits for those under 20 years were lowered to 30mg/100ml and 150µg/l,
respectively.
In July 1996, the law relating to confiscation of vehicles owned by serious repeat traffic
offenders (including drunk drivers) was strengthened.
In March 1999, higher penalties were introduced for drivers on their third or subsequent drink
driving offence.
In May 1999, mandatory licence suspension for 28 days was introduced for drivers caught
driving while grossly intoxicated (breath or blood alcohol level above 800µg/l or 160mg/100ml,
respectively). Also introduced was vehicle impoundment for disqualified driving. A major
reason for licence disqualification is drink driving. At the same time, mandatory licence
carriage and photo driver licences were introduced.
In December 1999, the minimum alcohol purchase age was lowered from 20 to 18 years.
On 16 January 2006, the threshold for mandatory 28 day licence suspension was lowered
from 160mg/100ml to 130mg/100ml. Additional penalties targeting repeat drink drivers were
also introduced. For a second offence at levels beyond the adult legal limits (within the
previous 4 years) - immediate 28-day licence suspension. For a third offence at levels beyond
the adult legal limits (within the previous 4 years) - immediate 28-day licence suspension and
28-day impoundment of the vehicle. Finally, section 65 of the Land Transport Act 1998 was
16
strengthened by widening the criteria to include drink drivers who had three or more drink
driving-related convictions (of any level) within a 5 year period. Also the mandatory minimum
licence disqualification period was changed to 1 year and 1 day (previously 2 years).
On 1 November 2009 a new offence was created of “driving while impaired and with evidence
in the bloodstream of a qualifying drug” (Land Transport Amendment Act 2009). Under the
new law, police are empowered, where there is good cause to suspect that a driver has
consumed a drug, to require the driver to undertake a compulsory impairment test. If the
driver cannot successfully complete the test, the police officer may require the driver to
provide a blood sample for testing. Drugs targeted include opiates, amphetamines, cannabis,
sedatives, antidepressants and methadone. The list will be reviewed from time to time in the
light of research, and changes in New Zealanders’ drug taking habits. The penalties generally
reflect the penalties for drink driving.
On 7 August 2011 the legal breath and blood limit for those under 20 years was lowered to
zero. The collection of research information on the number of drivers, involved in fatal or
serious injury crashes, whose alcohol levels were between BAC 0.05 and 0.08 also began.
On 10 September 2012, section 65A of the Land Transport Act 1998 came into force. New
provisions available to the courts where repeat drink drive offenders and first time offenders
convicted of driving with blood alcohol levels double the current adult limit could be given an
alcohol interlock disqualification. In addition, the zero alcohol licence sanction is available to
the courts, which requires drivers to maintain a zero alcohol limit for a fixed period of three
years.
On 1 December 2014, the legal breath alcohol limit for adult drivers (aged 20 and over)
reduced from 400 to 250 micrograms of alcohol per litre of breath, and the blood alcohol limit
from 80 to 50 milligrams of alcohol per 100 millilitres of blood. Offences for adult drivers with
alcohol levels between the new and old limits (251 to 400 micrograms of alcohol per litre of
breath and 51 to 80 milligrams of alcohol per 100 millilitres of blood) are infringement
offences. Adult drivers whose breath alcohol levels are in the infringement range, do not have
the right to elect a blood test for the infringement offence.
17

Terminology
Fatal injuries: injuries that result in death within 30 days of the crash.
Serious injuries: fractures, concussions, internal injuries, crushings, severe cuts and lacerations,
severe general shock necessitating medical treatment and any other injury involving removal to and
detention in hospital.
Minor injuries: injuries of a minor nature such as sprains and bruises.
Social cost: a measure of the total cost of road crashes to the nation. It includes: loss of life and life
quality; loss of productivity; and medical, legal, court, and property damage costs.
Casualty: person who sustained fatal, serious or minor injuries.
References:
Evans, L. (2004) Traffic Safety, p141.
Keall, M. D., Frith, W. J & Patterson, T. L. (2004) The influence of alcohol, age and the number of
passengers on the night-time risk of driver injury in New Zealand. Accident Analysis and Prevention,
36(1), 49–61.
18